Article

Comparative Investigation of Three Diagnostic Methods Applied to Direct-Drive Permanent Magnet Machines Suffering from Demagnetization

by
Syidy Ab Rasid
1,
Konstantinos N. Gyftakis
2,* and
Markus Mueller
1
1
School of Engineering, University of Edinburgh, Edinburgh EH9 3JL, UK
2
School of Electrical and Electronic Engineering, Technical University of Crete, 73100 Chania, Greece
*
Author to whom correspondence should be addressed.
Energies 2023, 16(6), 2767; https://doi.org/10.3390/en16062767
Submission received: 15 December 2022 / Revised: 9 March 2023 / Accepted: 14 March 2023 / Published: 16 March 2023
(This article belongs to the Special Issue Advances in the Field of Electrical Machines and Drives 2022)

Abstract

:
Direct-drive permanent magnet machines are ideal candidates for remote renewable applications, due to their independence from gearboxes and minimization of maintenance needs. However, faults may still appear in the generator of such a machine and affect its operation and production. Not only can demagnetization cause a catastrophic breakdown if left unchecked, but it also directly impacts the output quality of generators. As such, demagnetization is a topic of great interest. This paper investigated the sensitivity of three diagnostic methods—current signature analysis (CSA), Park’s vector approach (PVA), and extended Park’s vector approach (EPVA)—for demagnetization fault detection on a coreless permanent magnet generator.

1. Introduction

In response to concerns about sustainability and climate change, the world has witnessed a tremendous acceleration in efforts to switch to clean, sustainable energy over the past ten years. Energy-related emissions account for two-thirds of global greenhouse gas emissions [1]. This suggests that the vital element of any solution must be clean electric energy. With the public and private sectors for green energy research showing patterns of increased overall funding [2], a wide variety of energy harvesting systems have been proposed and put into practice. The use of renewable technology has increased to the point that it is now widely available and dependable—for example, wind turbines. As permanent magnet (PM) technology applications increase, the technology itself grows in popularity. Due to ease of construction and cheaper maintenance, direct-drive turbines have also grown popularity and replaced gearbox-driven turbines.
Despite how well-designed a machine may be, it is nevertheless susceptible to failure, due to the acting stresses known as TEAM (thermal, electric, ambient, and mechanical). In conjunction with inherent machine asymmetries and tolerances originating from manufacturing, operating stresses may lead to faults. One critical rotor fault type is demagnetization, because a PM machine needs a higher current to sustain the rated load under demagnetization conditions. This leads to increased losses and increased operating temperature, further demagnetizing the rotor until final breakdown occurs [3,4].
Some researchers have proposed design methods to delay demagnetization faults [5,6]. However, a great deal of research has focused on the development of reliable prognostic and diagnostic approaches to forecast machines’ health status and discover faults at the earliest occurrence [7,8,9,10,11,12]. This is essential for ensuring the machines’ durability and dependability, especially mission-critical equipment. Predicting and preventing machine failure, in an industrial environment, requires understanding of the nature and causes of failure. During a demagnetization fault, a machine’s flux distribution is asymmetrical, reducing the induced voltage and necessitating greater torque, in the case of a PM generator, to serve the rated load. In their early stages, demagnetization problems do not affect the operation or performance of the generator. Higher temperatures, on the other hand, might accelerate insulation weakening and deterioration, resulting in shorted turns that generate more heat. Consequently, these factors amplify the severity of demagnetization [3,13,14]. These faults are progressive; if they go undiscovered, they will lead to catastrophic failure [15].
Detecting demagnetization is essential, as is differentiating it from other faults. That includes those with similar signatures, such as rotor eccentricity and shaft or load misalignments, all of which—like demagnetization—affect air-gap flux and flux linkages as a function of mechanical speed [16,17]. As the stator current exerts a defining influence during demagnetization faults, several techniques have been developed to monitor the health of electrical machines.
Fault detection in an electric machine can be broadly classified into three categories: model-based methods, signal-processing methods, and data-driven intelligent diagnosis algorithm-based methods [18]. Signal processing methods, such as current signature analysis (CSA), have been extensively applied in induction motors and adapted to permanent magnet machines [19]. These techniques benefit from reduced intrusiveness, technological and economic viability, and reliance exclusively on the machine’s electrical signals. The operation only requires steady-state stator current—which can easily be collected from the output terminal without the need for any particular sensor—and conversion of the signal from the time domain to the frequency domain using the fast Fourier transform (FFT) of the time series data. CSA, however, has the disadvantage of requiring specialized equipment, such as a current probe and analysis software, which can be expensive and complex to operate. Additionally, the interpretation of the results may require a high level of expertise and experience, which can be challenging for some operators.
Several works in the literature referred to the following equation to determine the current sideband components due to demagnetization [15,20]:
f d m = ( 1 ± k p ) f s   where   k = 1 , 2 , 3
In (1), p represents the number of poles and f s denotes the fundamental frequency at the nominal speed of 100 rpm; in this case, the fundamental frequency was 26.67 Hz. However, the issue with this formula is that it does not consider the geometry of the machine and the winding configuration, which can conceal some fault signatures. In addition, findings have demonstrated that specific fault harmonics can cancel each other out, depending on the coil configuration, perhaps even leading to a false negative diagnostic alarm [21].
Another setback is fault discrimination, as some faults carry the same harmonic signature as others. It is well known that eccentricity faults will give rise to identical harmonic spectra. The challenge is to discriminate between these two faults to avoid misdiagnosis [22]. Consideration also needs to be given to the machine configuration since it affects the performance of CSA. Iron core saturation can affect the diagnosis, as well, although this issue was not applicable to this machine due to the lack of iron in the design.
The Park’s vector approach (PVA) requires measurement of the 3-phase current components: ia, ib, and ic to calculate the Park’s vector components, id and iq. The calculation is described in (2) and (3). The method is completed when the locus of the vector is plotted. If the d and q components contain just the fundamental harmonic, as per (4) and (5), and assuming balanced conditions, the locus of the PVA is a circle. Any distortions caused by faults affecting the machine’s magnetic field will be expressed by harmonics in the currents, and will eventually lead to a noncircular locus that can provide information for fault identification.
i d = 2 3 i a 1 6 ( i b i c )
i q = 1 2 ( i b i c )  
The main drawback of the PVA is that it does not easily distinguish fault severity, especially in early fault conditions. An extension of the traditional PVA is the extended Park’s vector approach (EPVA), which relies on monitoring the Park’s vector modulus. The 3-current components are determined with the following equations:
i A = I 1 c o s ( ω 1 t ) + n = k p I n c o s ( ω 1 t )
where n   =   k / p , k   = 1, 2, 3… with k not taking values equal to p , 3 × p , 5 × p ...;
i b = I 1 c o s ( ω 1 t 120 ° ) + n = k p I n c o s ( n ω 1 t n 120 ° )
where n =   k / p , k = 1, 2, 3… with k not taking values equal to p , 3 × p , 5 × p ...;
i b = I 1 c o s ( ω 1 t 240 ° ) + n = k p I n c o s ( n ω 1 t n 240 ° )
where n   =   k / p , k   = 1, 2, 3… with k not taking values equal to p , 3 × p , 5 × p ...
In addition to detecting distortion in the shapes of Park’s vector patterns, FFT is applied to generate modulus spectra. The advantage of this method is that it takes all three currents of the stator into account simultaneously; therefore, the harmonic index is richer and may be more reliable.
This paper compared the SCA, PVA, and EPVA techniques for their detection capabilities, specifically as those related to demagnetization faults. The local demagnetization of a 20 kW coreless synchronous generator was analyzed and compared to a healthy machine using both simulation and experimental setups. The paper was structured as follows: the modeling and analysis of the machine, under healthy and demagnetization fault conditions, as well as the details of the experimental setup, were presented in Section 2. The obtained numerical results were analyzed in Section 3. Finally, analyses of experimental results are presented in Section 4, followed by discussion and conclusions.

2. Materials and Methods

The Institute of Energy Systems at the University of Edinburgh created a radial flux synchronous generator known as C-GEN [23,24,25], which was the basis of this comparative study. It featured a double rotor and a stator without a core, resulting in a lightweight, modular, and economic generator for various renewable energy applications. This generator’s specifications are shown in Table 1.
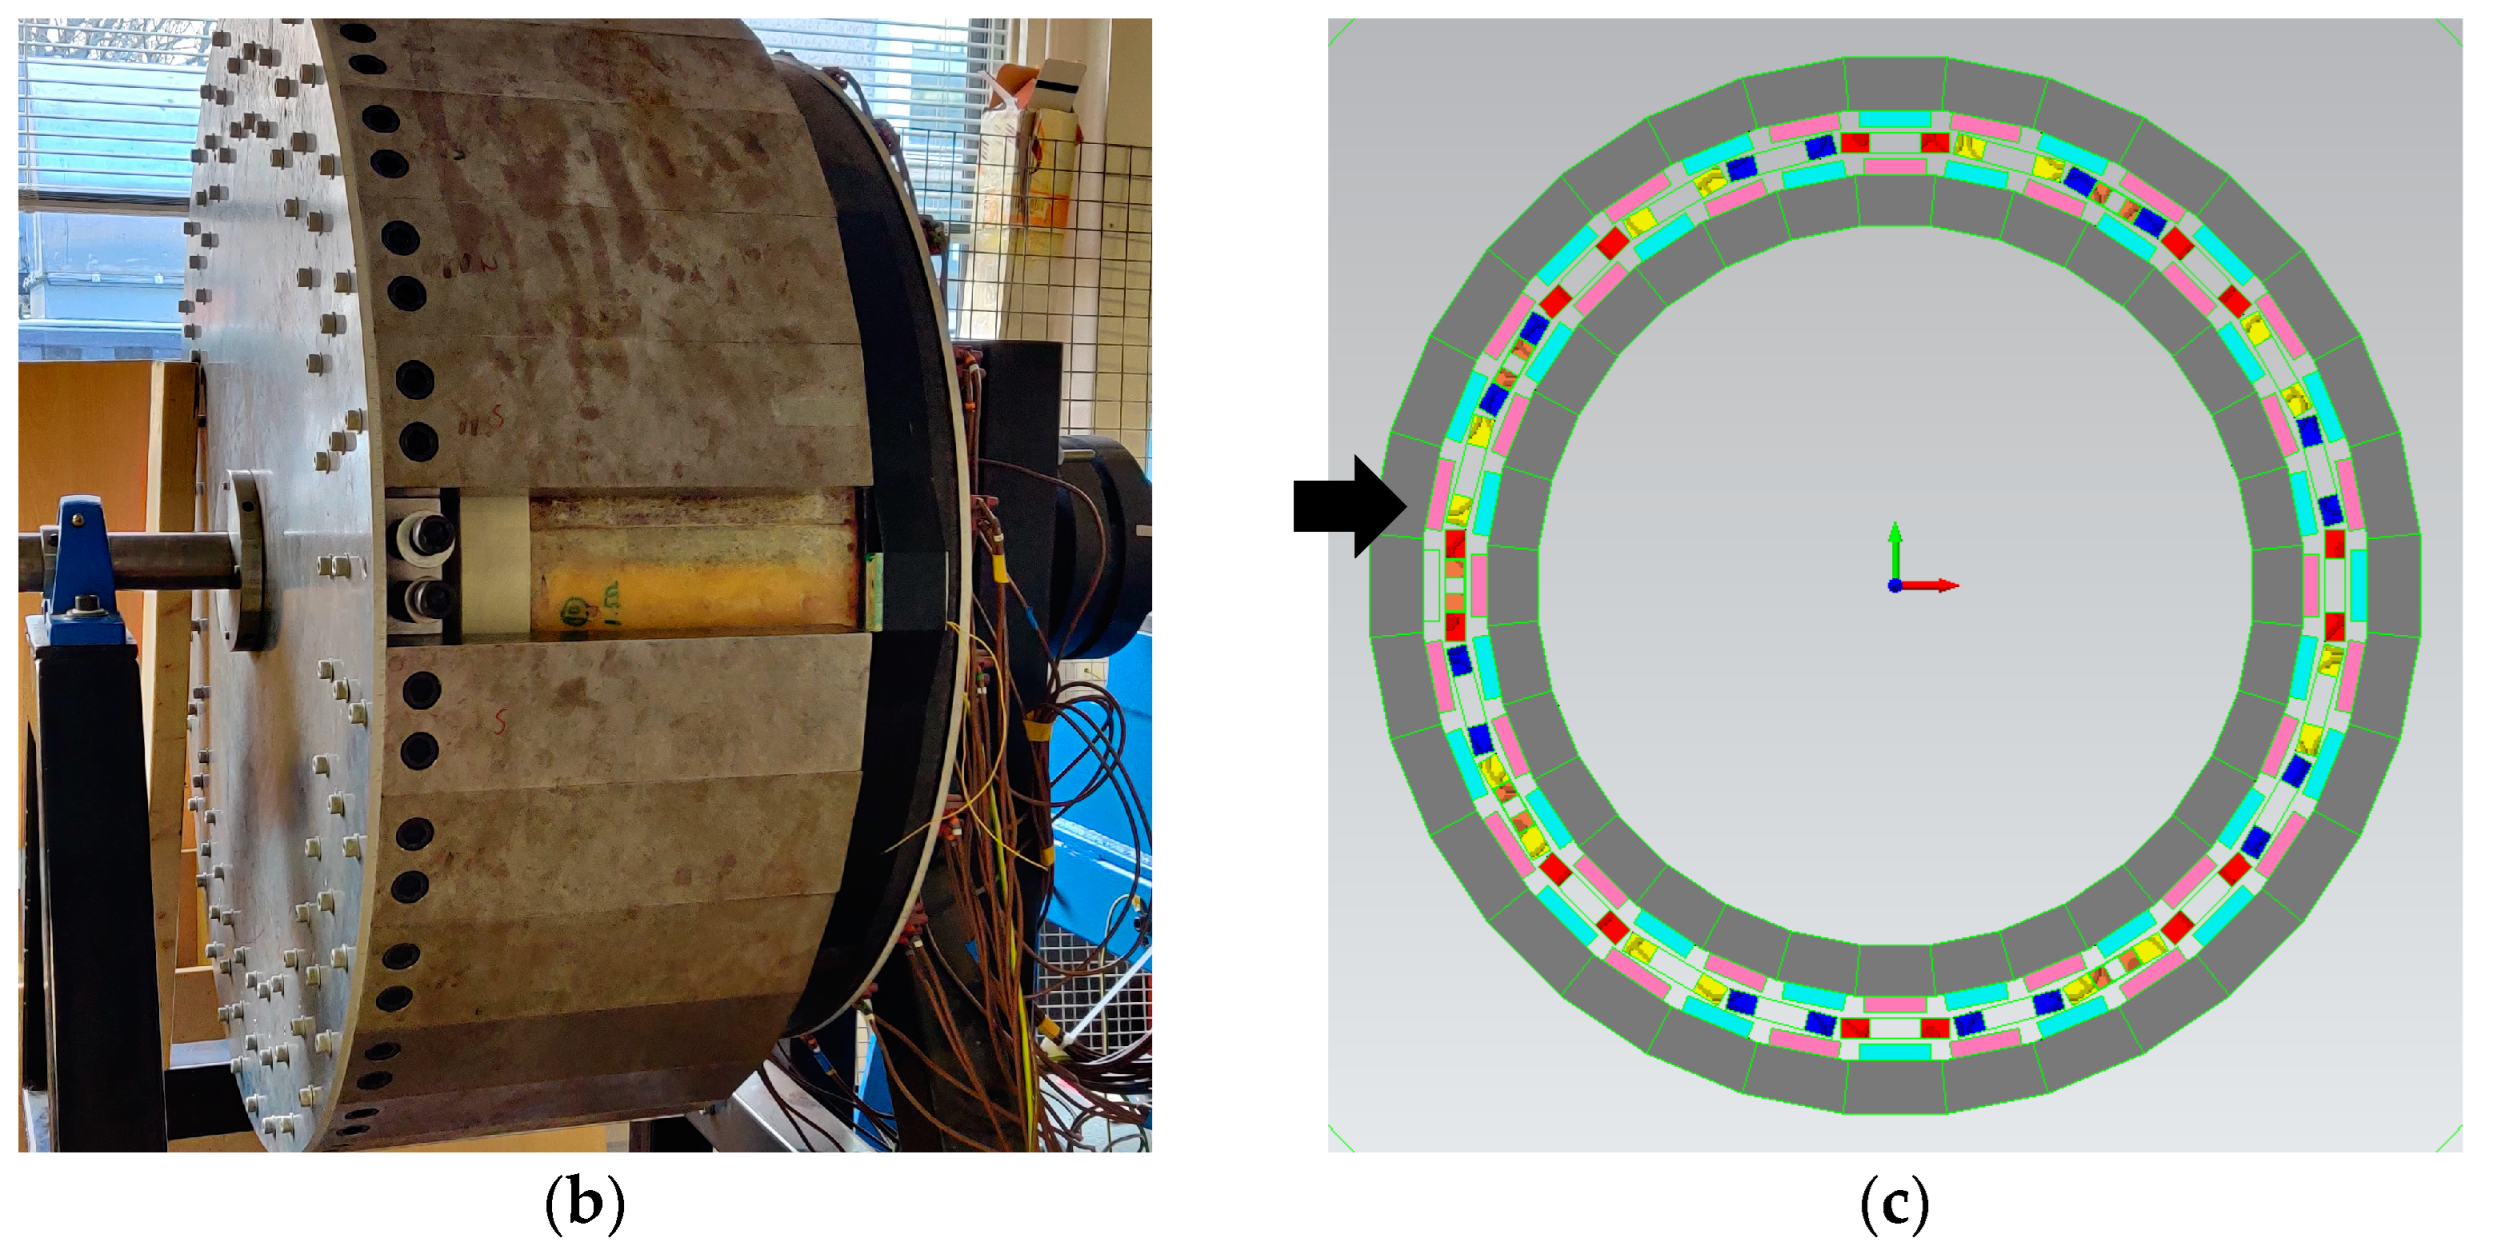
Figure 1a illustrates the C-Gen generator, a direct-drive, coreless, radial flux generator featuring a double rotor. It was developed specifically for wind energy harvesting applications. The absence of iron in the stator contributed to the machine’s overall low level of weight and lack of cogging torque at low speeds. The winding on the generator was constructed out of two series of connections, each of which was made up of four parallel branches from the same phase. These branches were connected to a 10-kW load, and the neutral line was left unconnected. For comparison, the machine was operated at the nominal speed of 100 revolutions per minute under healthy and faulty conditions. All coils were arranged in a non-overlapping, star-connected configuration. Figure 1b depicts a cross-section of the machine. Again, the comparison was carried out with the nominal speed set at 100 revolutions per minute, under various load conditions ranging from 1 kW to 10 kW. This machine was chosen because it demonstrated the harmonic cancellation mechanism discussed in [21].
A generator model was constructed for finite element analysis (FEA) using Siemens’ Magnet software. In this model, the geometrical and material properties of the C-Gen generator were taken into account, but the winding overhang was ignored, as the winding overhang was relatively small compared to the effective magnet sweep length. It was set to run at 100 rpm for the duration of 3000 ms, with 0.1 ms timesteps for all conditions. The actual machine, in healthy condition, and the FEA model are shown in Figure 1a,b. Demagnetization was achieved by removing one module from the rotor, as depicted in Figure 1c, with the cross-section shown in Figure 1d. Again, the simulation parameters were set to match the healthy condition simulation, for fair comparison. The arrow in the Figure pointed to the location where one of the magnets was removed. The individual coil resistance and the coil connection configuration were set up to be as close to the actual machine as possible. This ultimately resulted in a realistic depiction of the machine’s behavior during FEA modeling and experimental testing, both of which were conducted under identical operating conditions during the healthy and faulty cases. A flux sensor, in the form of a 1000-turn coil, was positioned outside of the outer rotor to measure the stray flux.
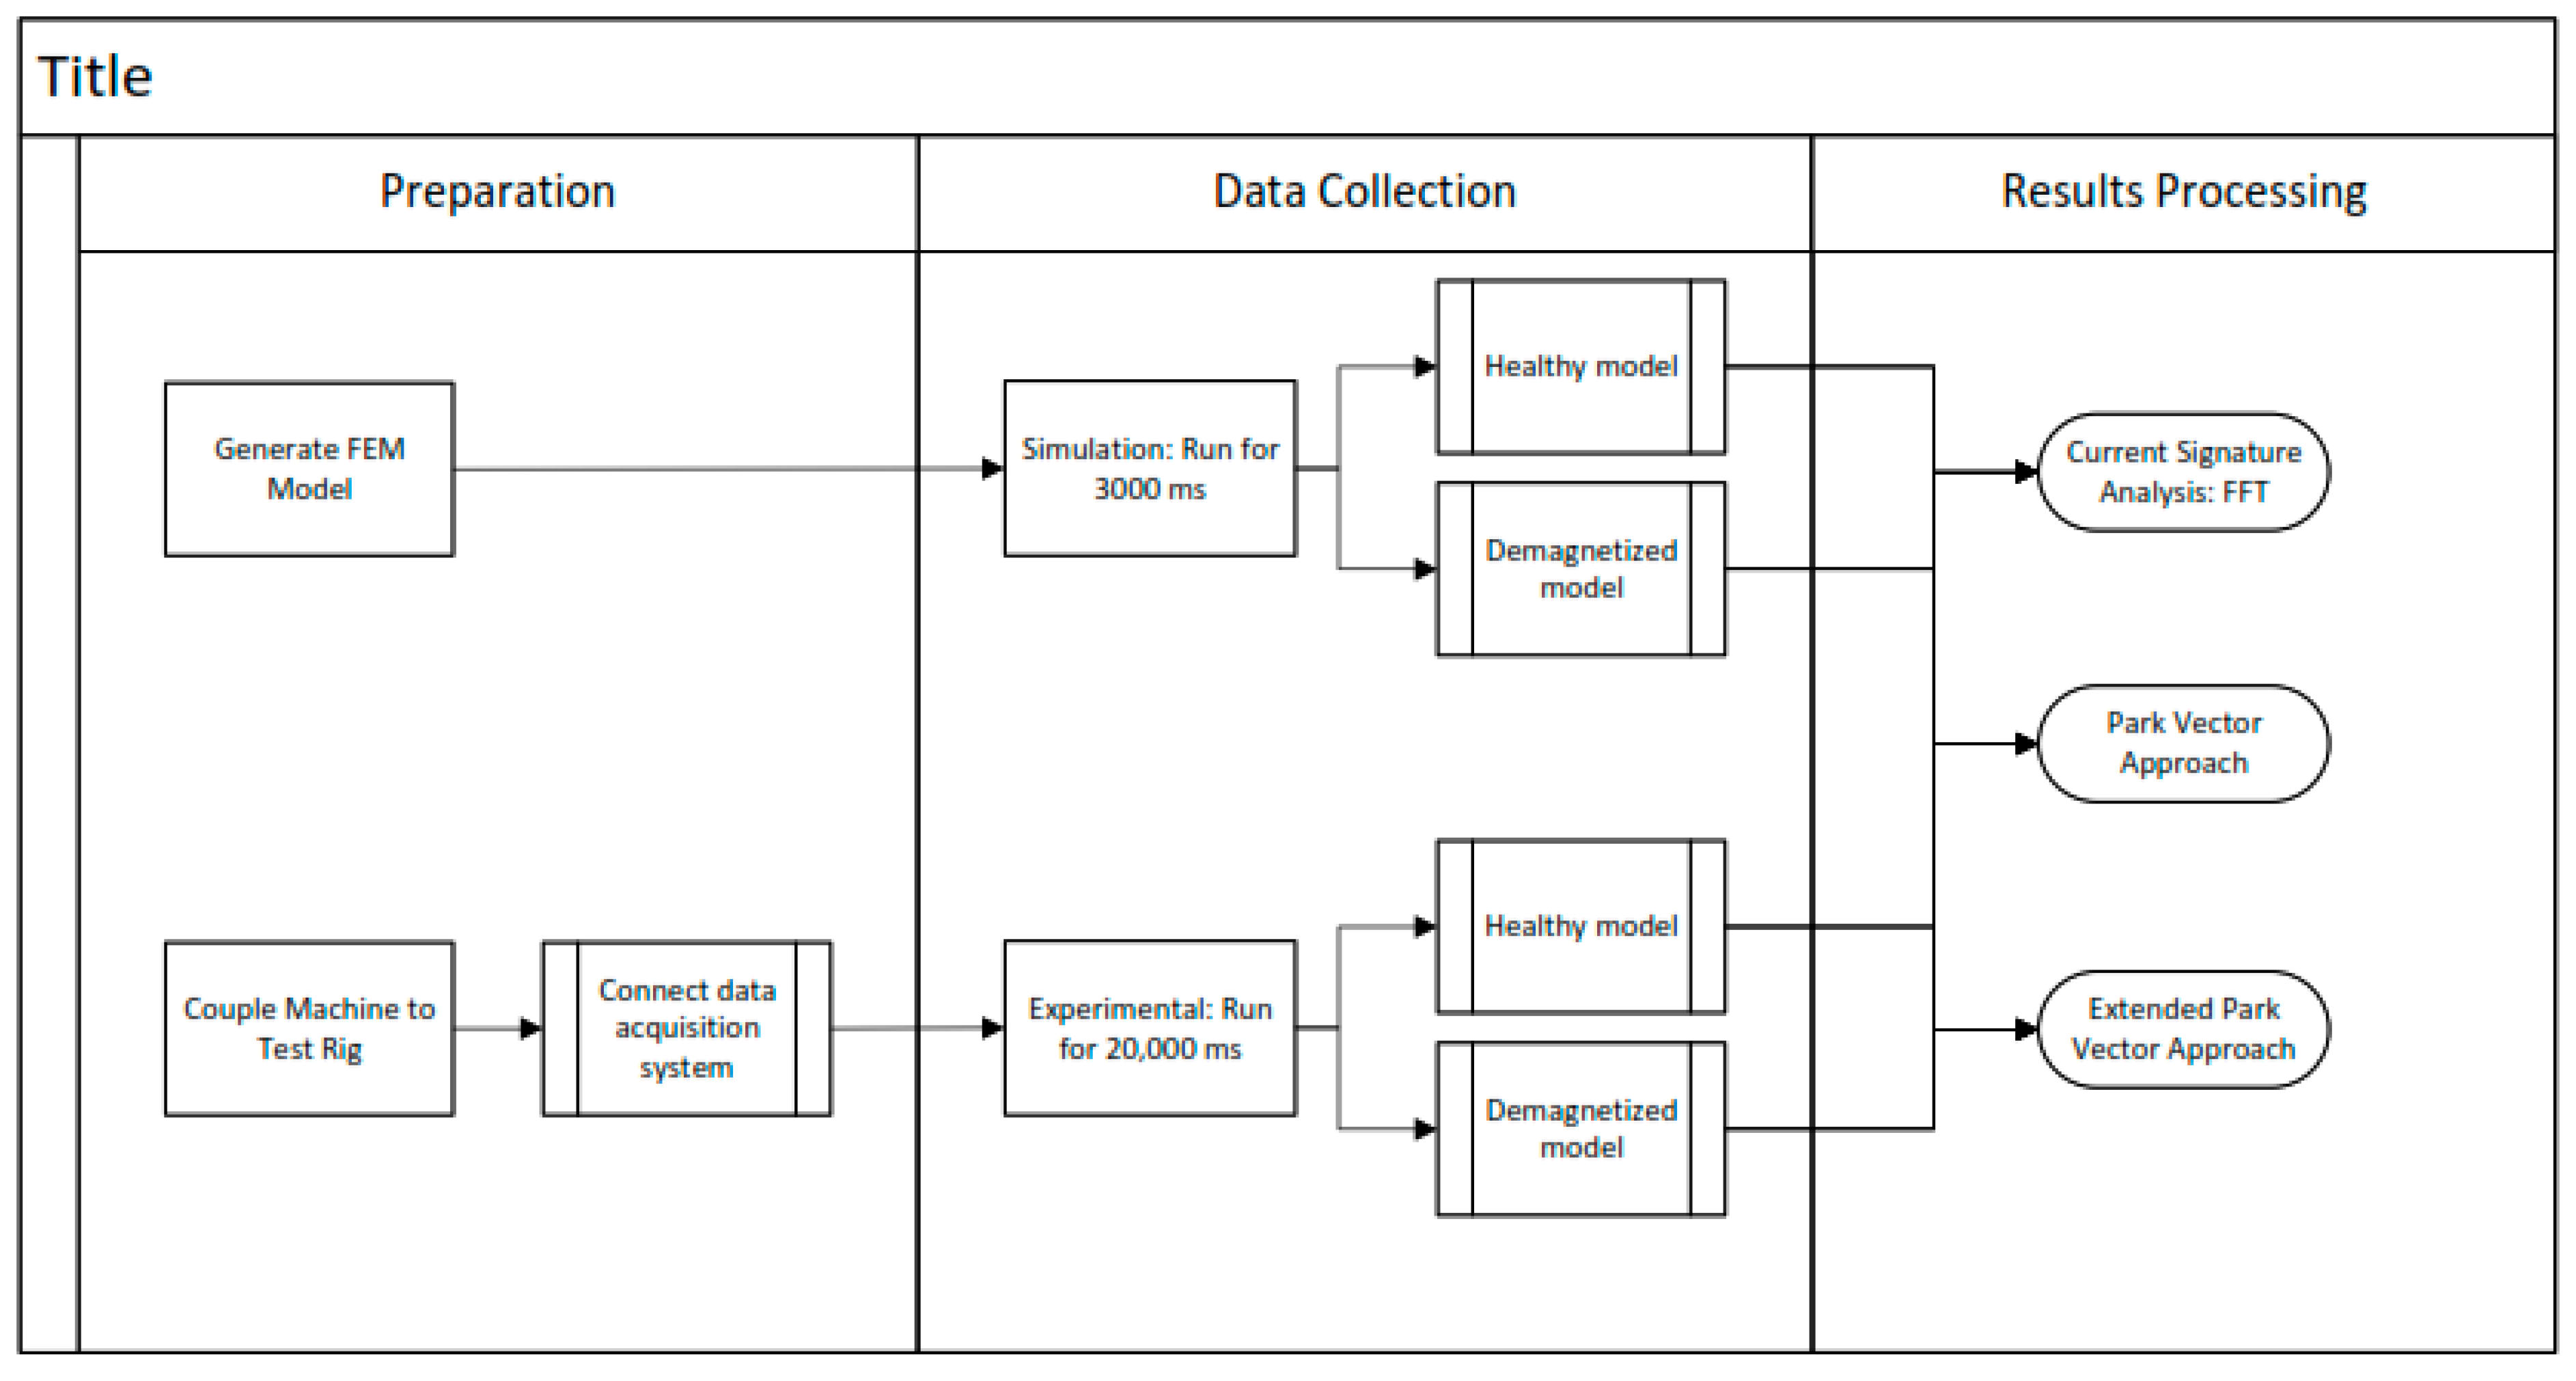
Step-by-step instructions for obtaining the results are shown in Figure 2, which illustrates the flow of simulation and experimentation. The model was simulated for five cycles, with 6000 steps per cycle, under different loads and speeds, in order to replicate various operating situations. The voltage, current, torque, and flux sensor voltage were tabulated, and it was established that, at rated speed, the simulation results largely matched the actual machine-measured values, as shown in Table 2. The FEA model of the healthy machine satisfactorily reflected the actual machine, within 10% deviation, respectively, as confirmed by comparative readings.
The experimental setup was comprised of a generator connected to a test rig. An induction motor powered the test rig, and the variable frequency drive controlled the speed of the induction motor. In addition, a torque transducer was positioned between the two machines. Voltage and current readings were obtained via the output terminal wired to a data acquisition system. The sampling rate was set to 50,000 samples per second with 20-ms intervals for 20 s.
One of the exterior magnets was removed to reproduce the faulty condition, resulting in a 50% demagnetization level (total per stator coil), as depicted in Figure 1c. Unfortunately, as a matter of practicality, the entire module, which consisted of both magnets and back iron, had to be removed, since the magnets were quite powerful, and bonded to the iron, causing an imbalance in the experimental machine. However, this did not influence demagnetization behavior, since experimental results corresponded with FEM results.
The efficiency results for both simulation and experiment were tabulated for comparison. The waveform data were then processed through the different diagnostic techniques (CSA, PVA, and EPVA) presented in the simulation and experimental sections, respectively.

3. Results

The generator was set to supply 3-phase symmetrical resistive loads with five different levels. More specifically, Load 5 was set to supply a load of 15 kW, which corresponded to a phase resistance of 17.3 Ω. The simulation results in Table 3 showed that the efficiency of the healthy generator decreased as the load requirements increased. This was expected because the increase in load caused more current to flow, which increased the joule losses of the stator. On the other hand, the trend of efficiency behavior, as a function of load during faulty conditions, was exactly the opposite. The torque demand increased while the output voltage decreased. Thus, the faulty machine was likely to be less efficient than the healthy one, regardless of the load.
During the experiment, the generator’s output was connected to a three-phase resistive load bank, and measurements were taken at five different load levels, comparable to the load levels from the simulation. Load 5 corresponded to 15 kW, to ensure comparability with FEM. Table 4 presents the experimental results, showing a very high degree of consistency between experimental and simulation results, with comparable patterns of efficiency drop for healthy generators as load demand increased and the exact opposite trends after demagnetization. A similar pattern was observed in the simulation results for the increased torque required. The voltage decreased upon demagnetization because there was less magnetizing flux; as there was one less magnet, there was a consequent decrease in voltage.

3.1. Current Signature Analysis (CSA)

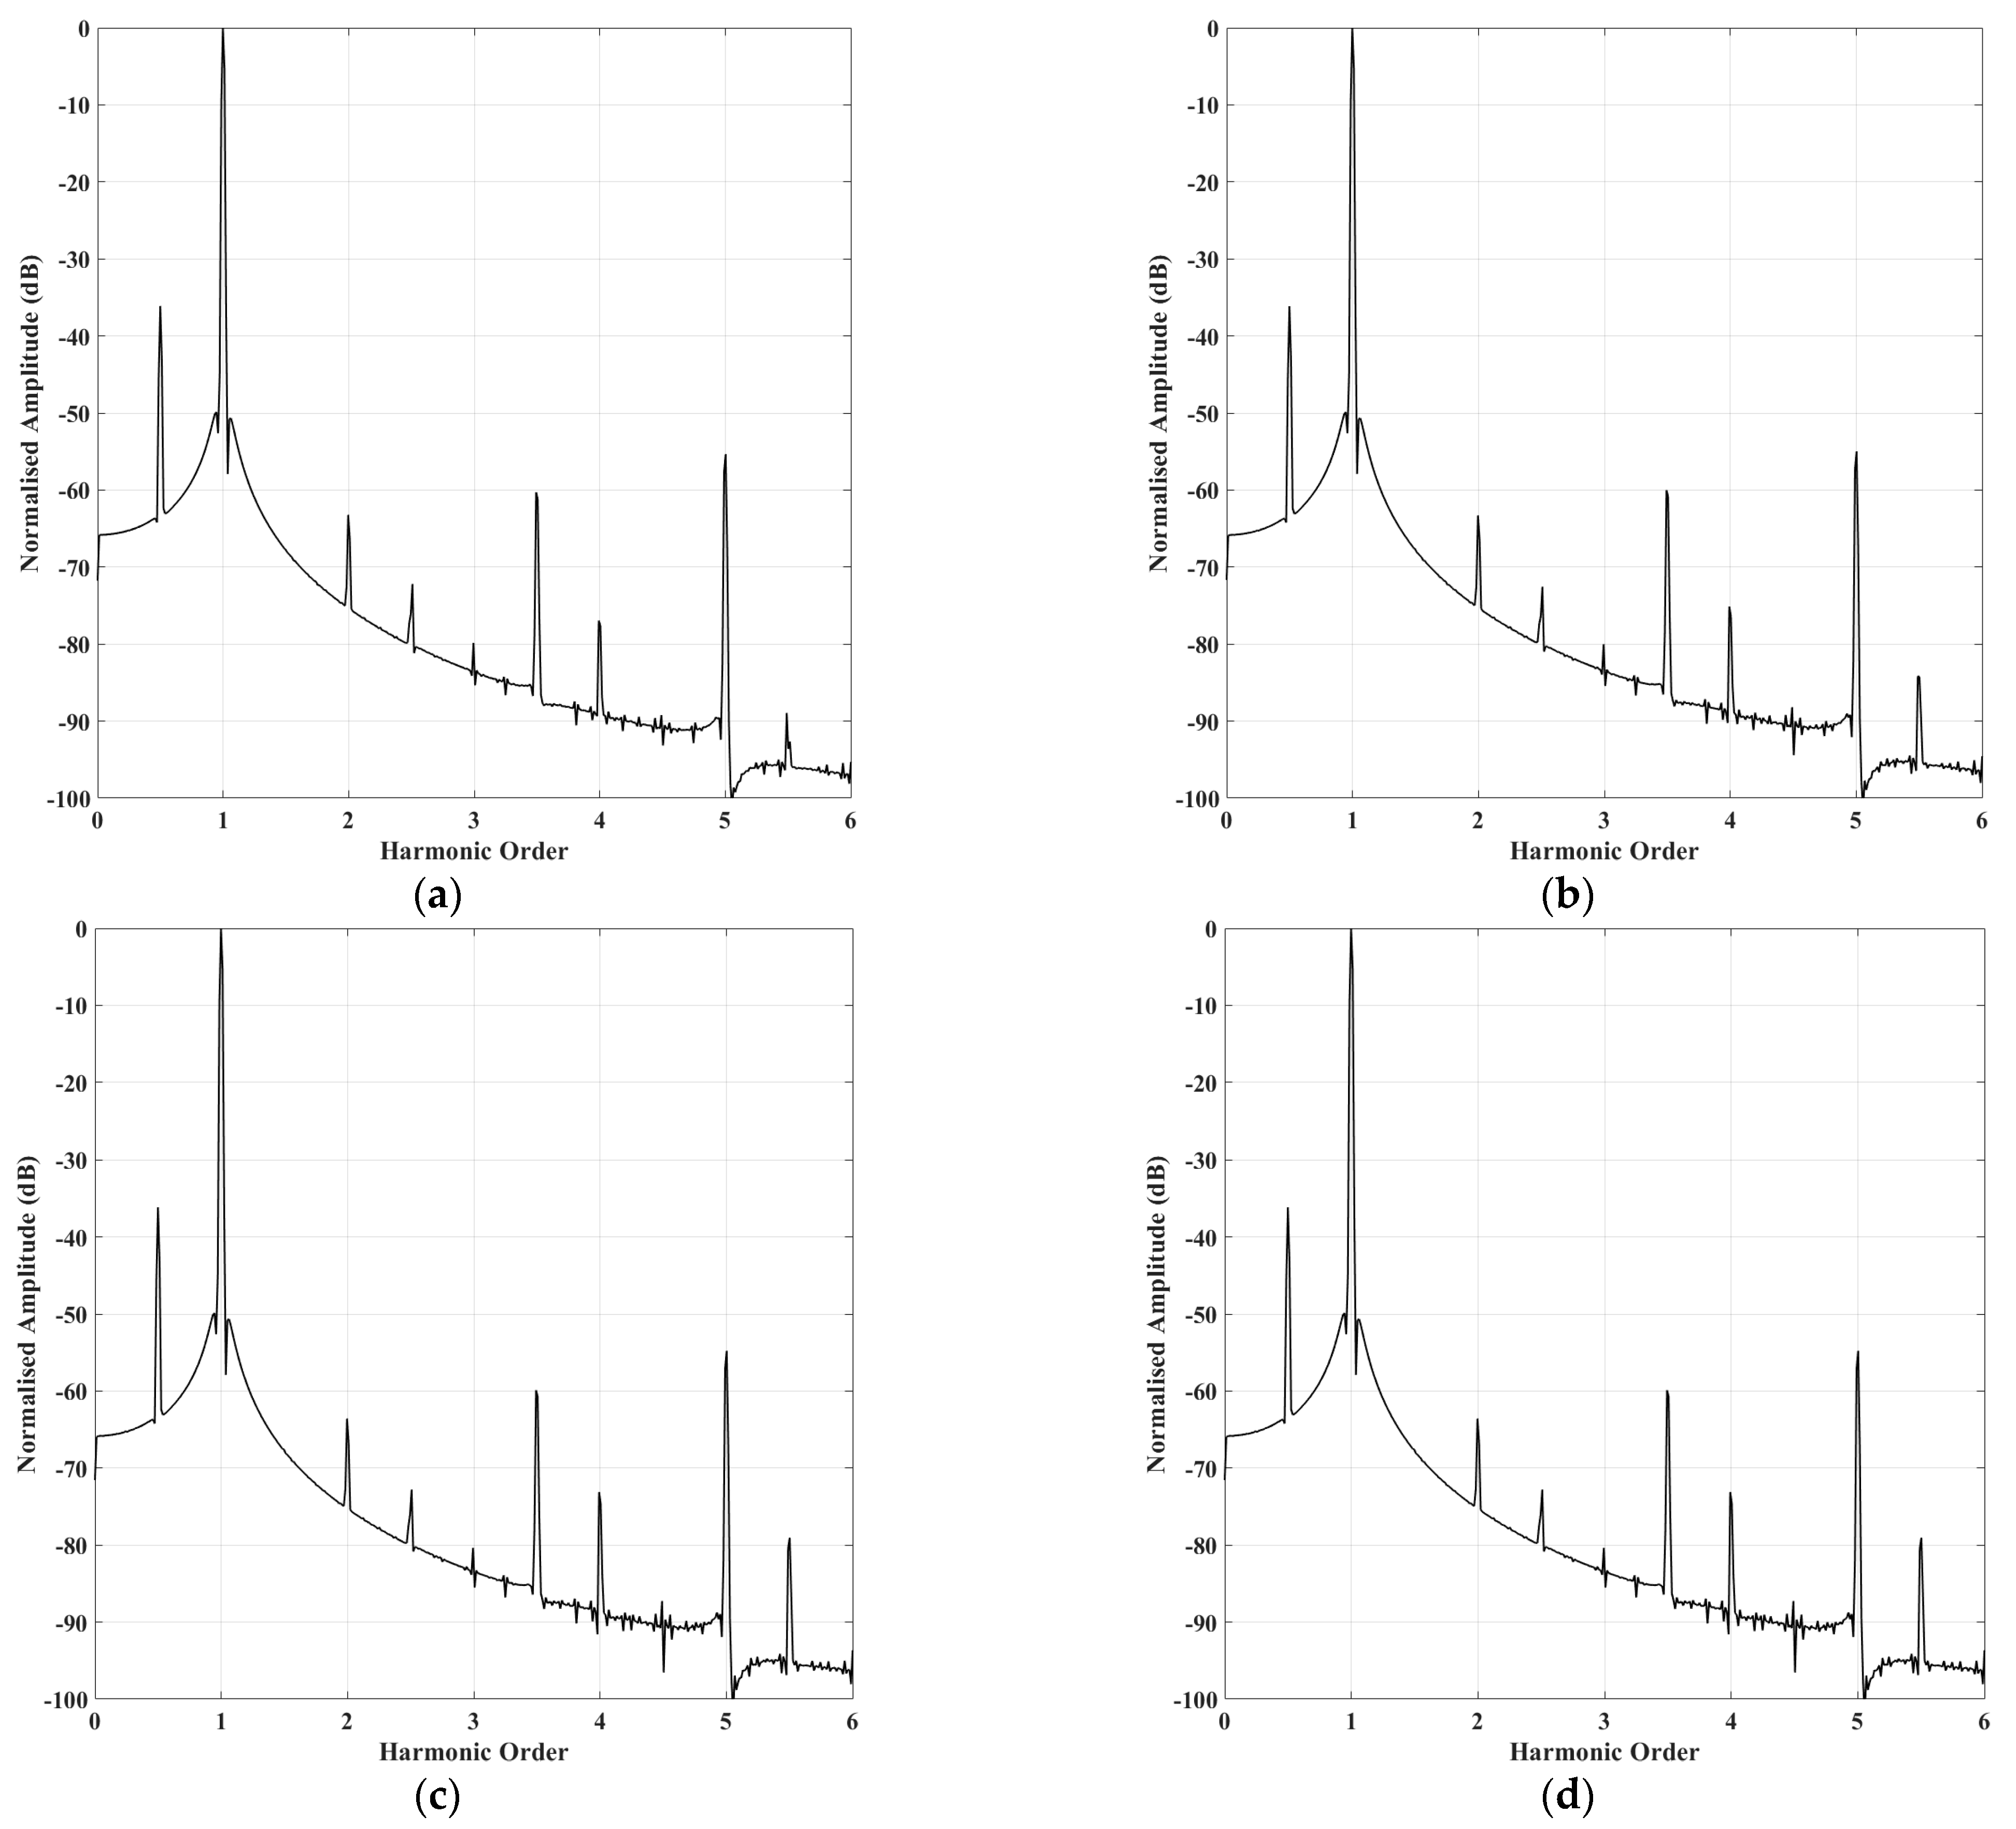
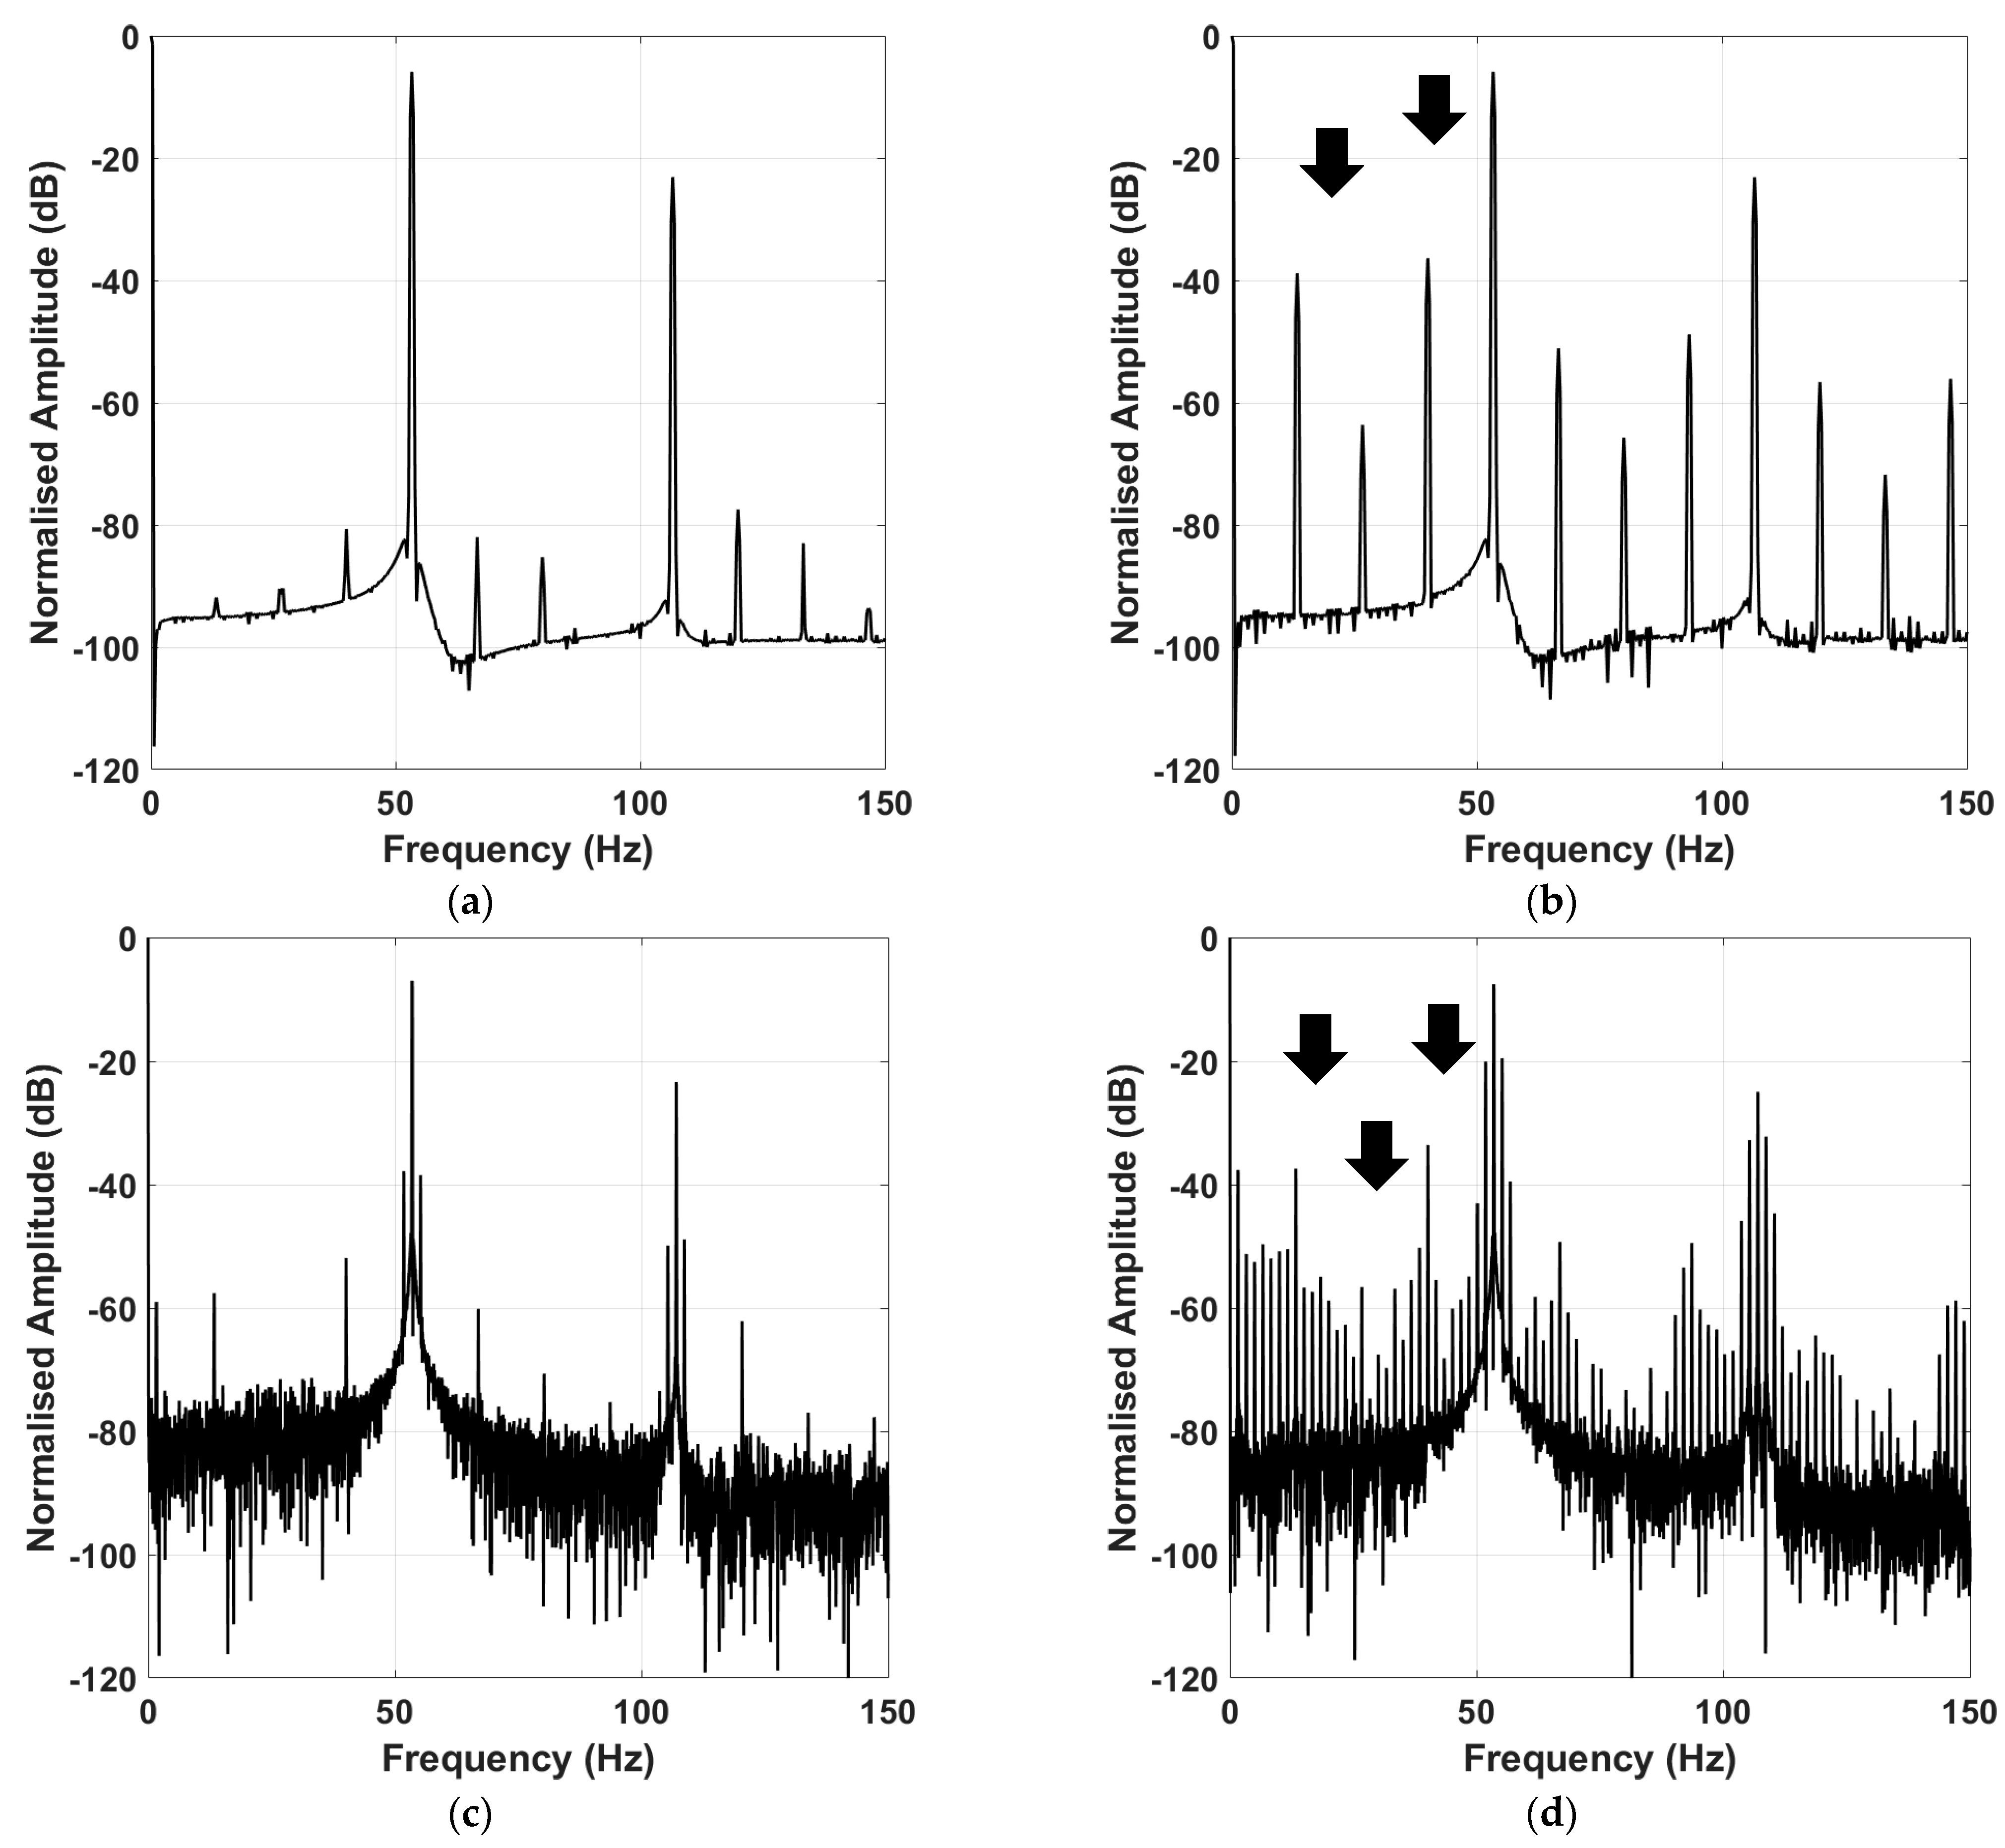
A fast Fourier transform was applied to the current in phase A from simulation and experimental data to perform current signature analysis. Figure 2 presents the results of the CSA under nominal load, comparing the results between FEM and experiment under healthy and faulty conditions. The spectra for other load cases are presented in Appendix A and B, respectively. The simulation results are shown in Figure 3a,b. The results agreed with the harmonic cancellation mechanism from reference [19]. Under faulty conditions, only the amplitudes of 0.5 fs, 2 fs, and 3.5 fs increased, which revealed the fault.
As the experimental results revealed (shown in Figure 3c,d and Appendix B), as the load decreased, the noise level increased, rendering the fault signature unreliable for diagnosis, with just 0.5 fs appearing to be a reliable indicator (Figure 3d). The noise observed in the experimental spectra derived from the vibration of the machine; however, when compared to the simulation’s results, the noise could not be observed because the simulation did not account for rotor imbalance. Due to the mechanical imbalance caused by the fault implementation, the first sidebands of the fundamental significantly increased in amplitude. However, they were not demagnetization related, as shown by the simulation results earlier.

3.2. Park’s Vector Approach (PVA)

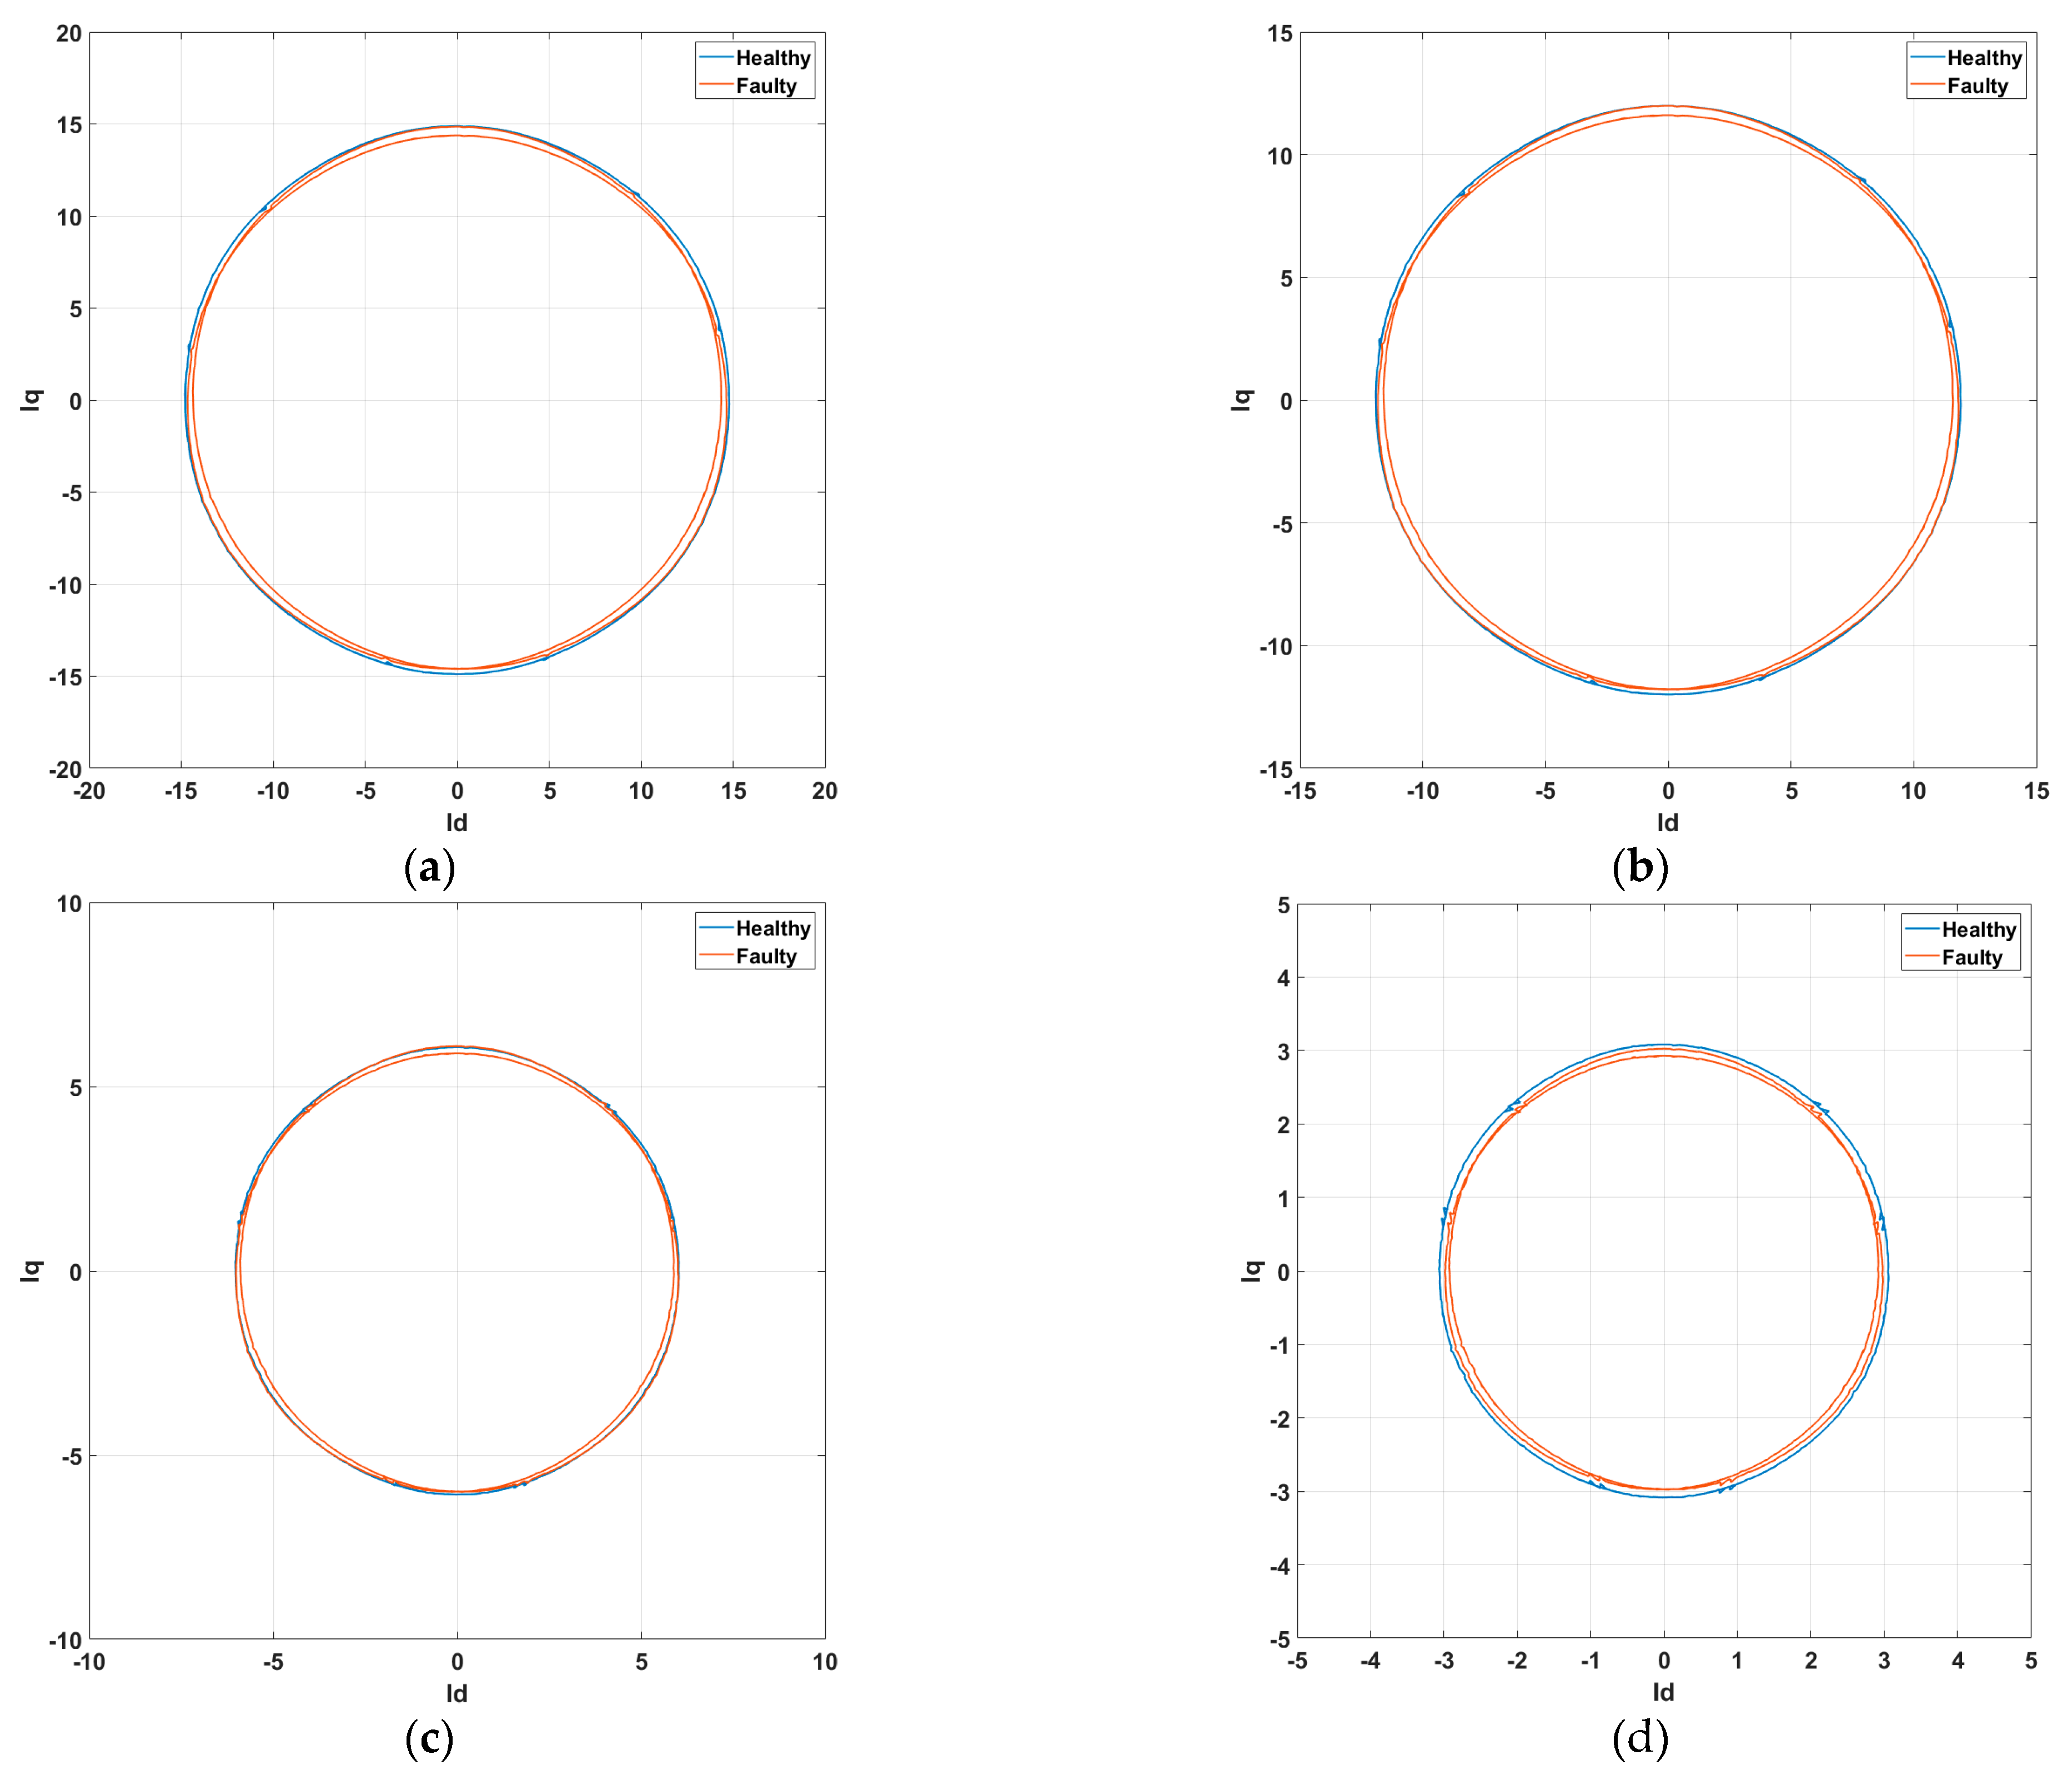
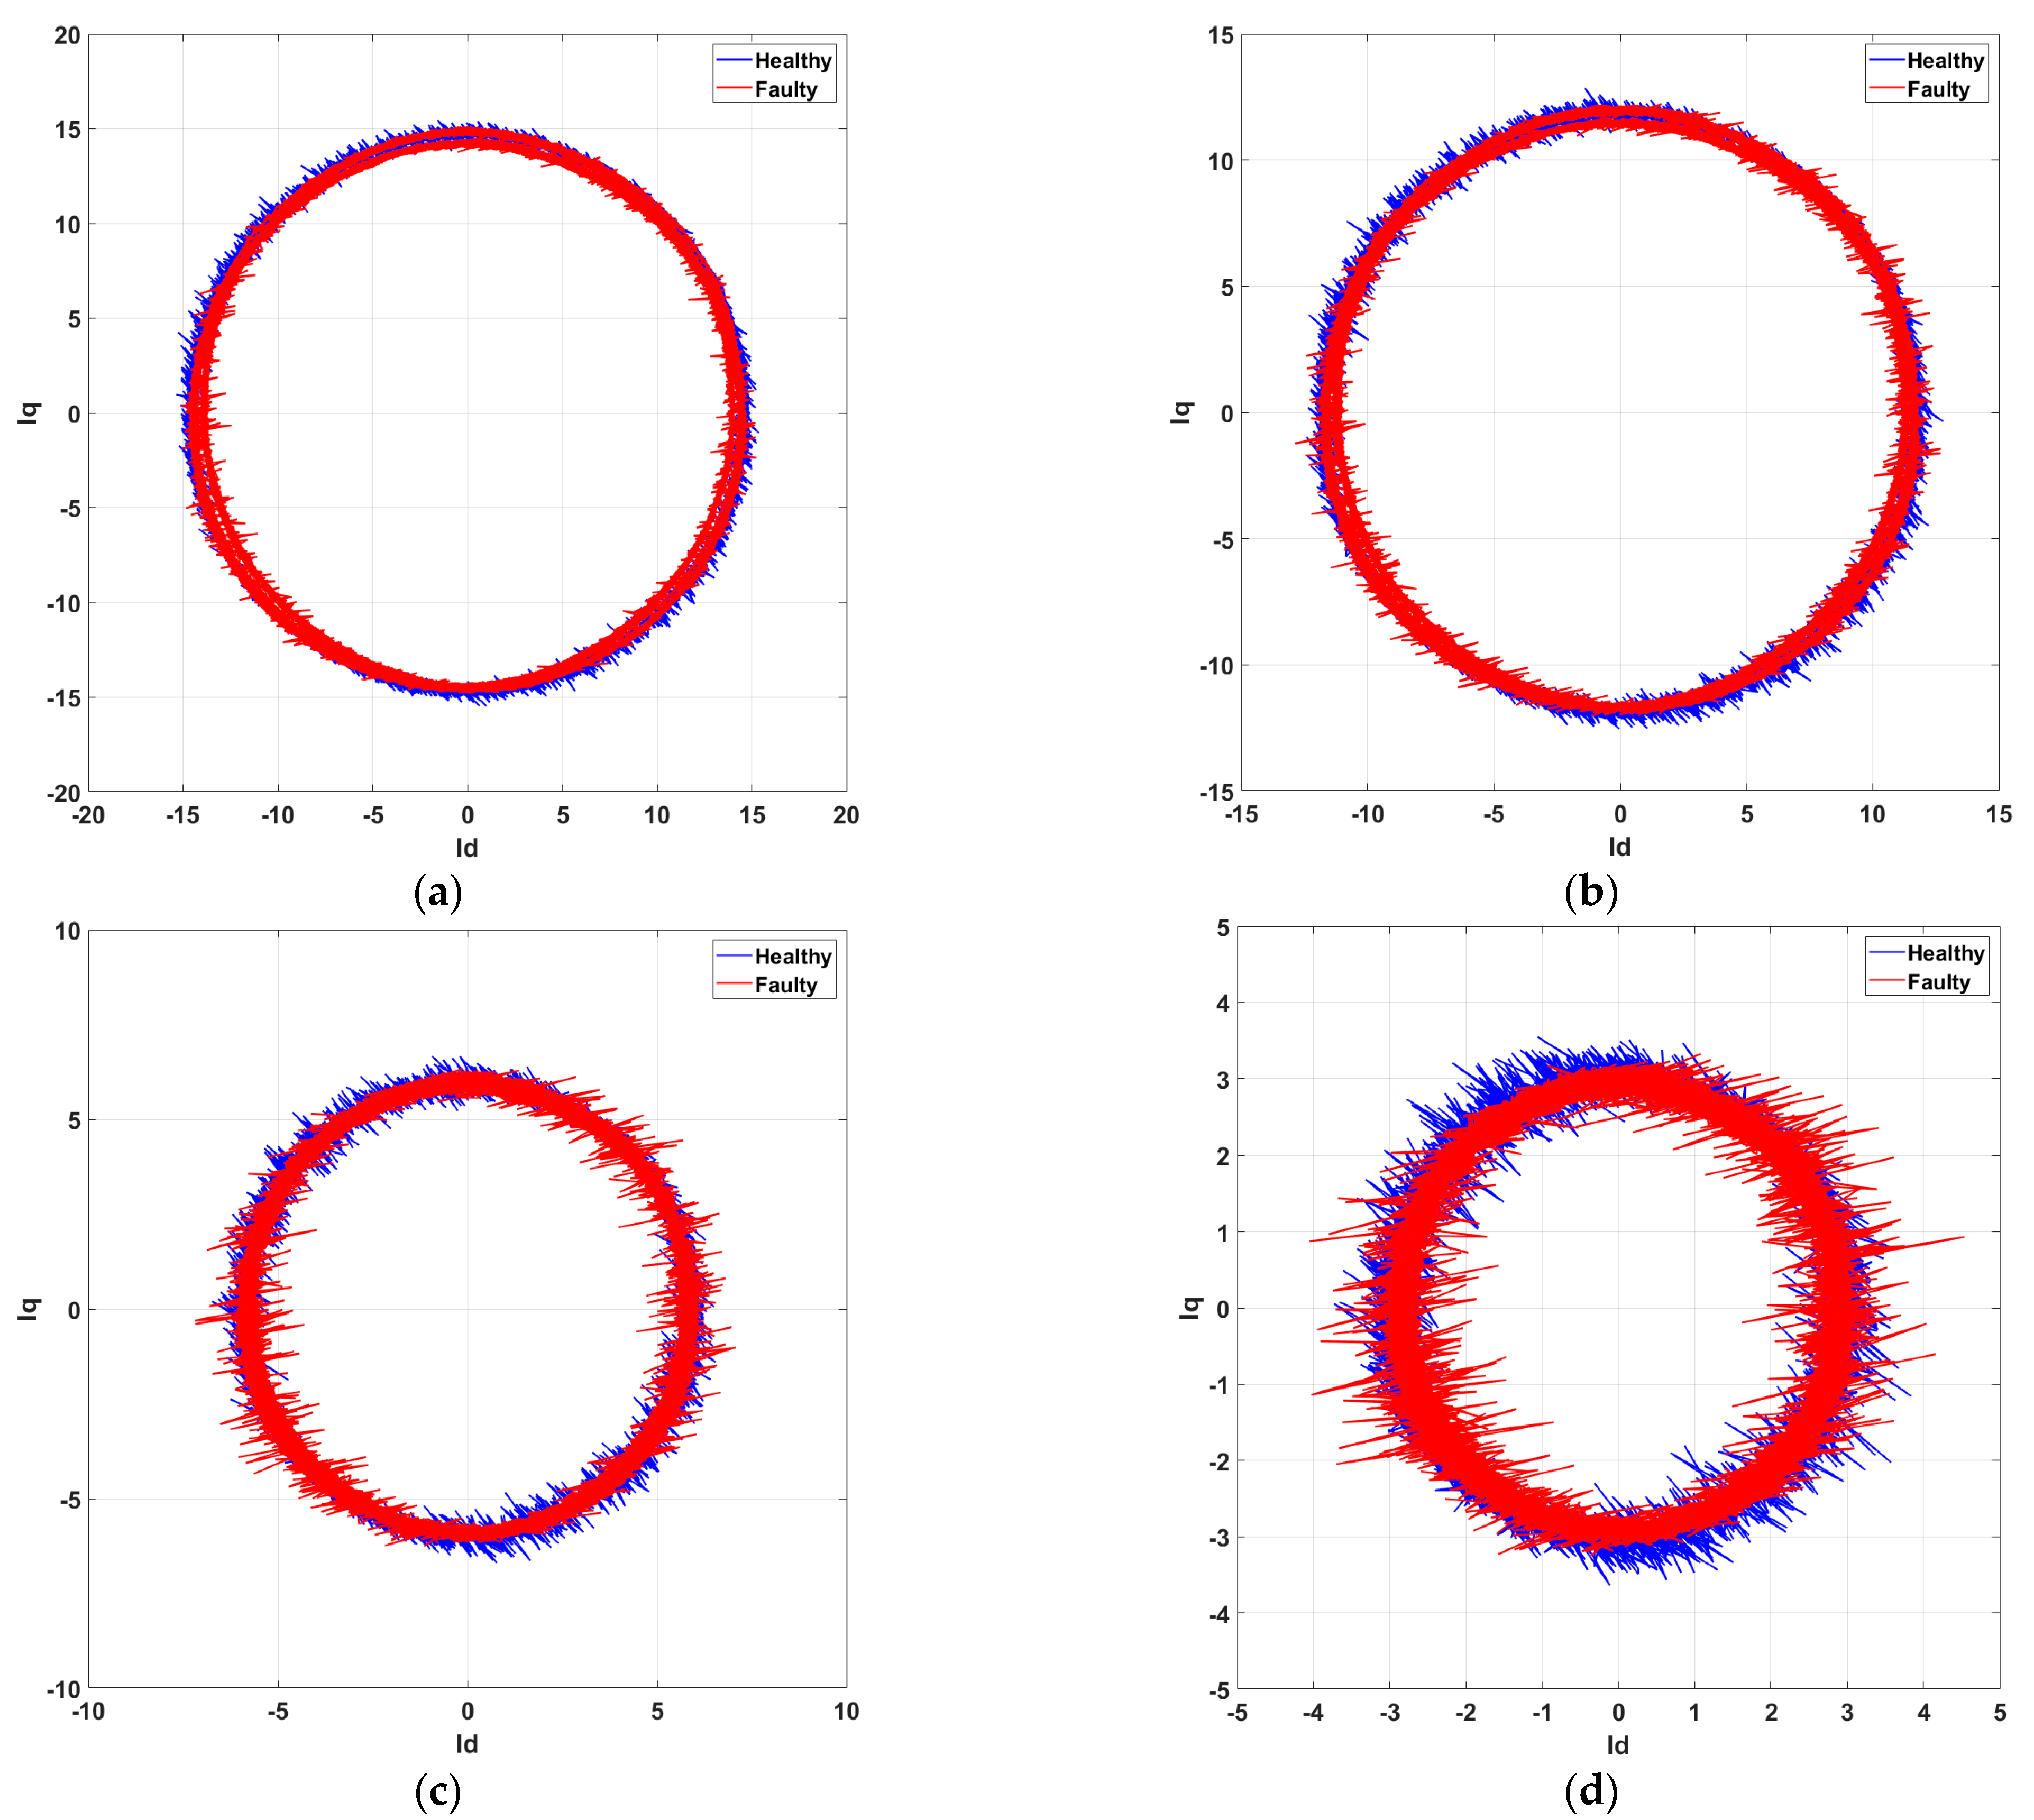
Park’s vector approach results were plotted in MATLAB using Equations (2) and (3). As shown in Figure 4, there were only minor differences in the loci of healthy and faulty cases. During a demagnetization fault, the loci radii grew smaller. Specifically, it was separated into three arc segments, with two arcs of varying radii separating each section. Figure 4 illustrates how loci could be utilized for fault identification. When the load level changed, the radii of the loci changed as well, but the asymmetrical distribution remained the same in the faulty generator, as illustrated in Appendix C and Appendix D. The main issue with this method was that it had low sensitivity to early faults and could have been influenced by other machine asymmetries. Therefore, an improved alternative should be examined.
Experimental validation, as shown in Figure 4c,d, revealed a similar pattern with FEM, where the locus radius decreased and separated into three arc segments as the load decreased, albeit with an increase in noise. Considering load variation, the distribution of the loci also remained unchanged. Different load levels were compared, as shown in Appendix D. The thickness of the circle increased as the load level decreased. We also noted a reduction in noise as the load increased.

3.3. Extended Park’s Vector Approach

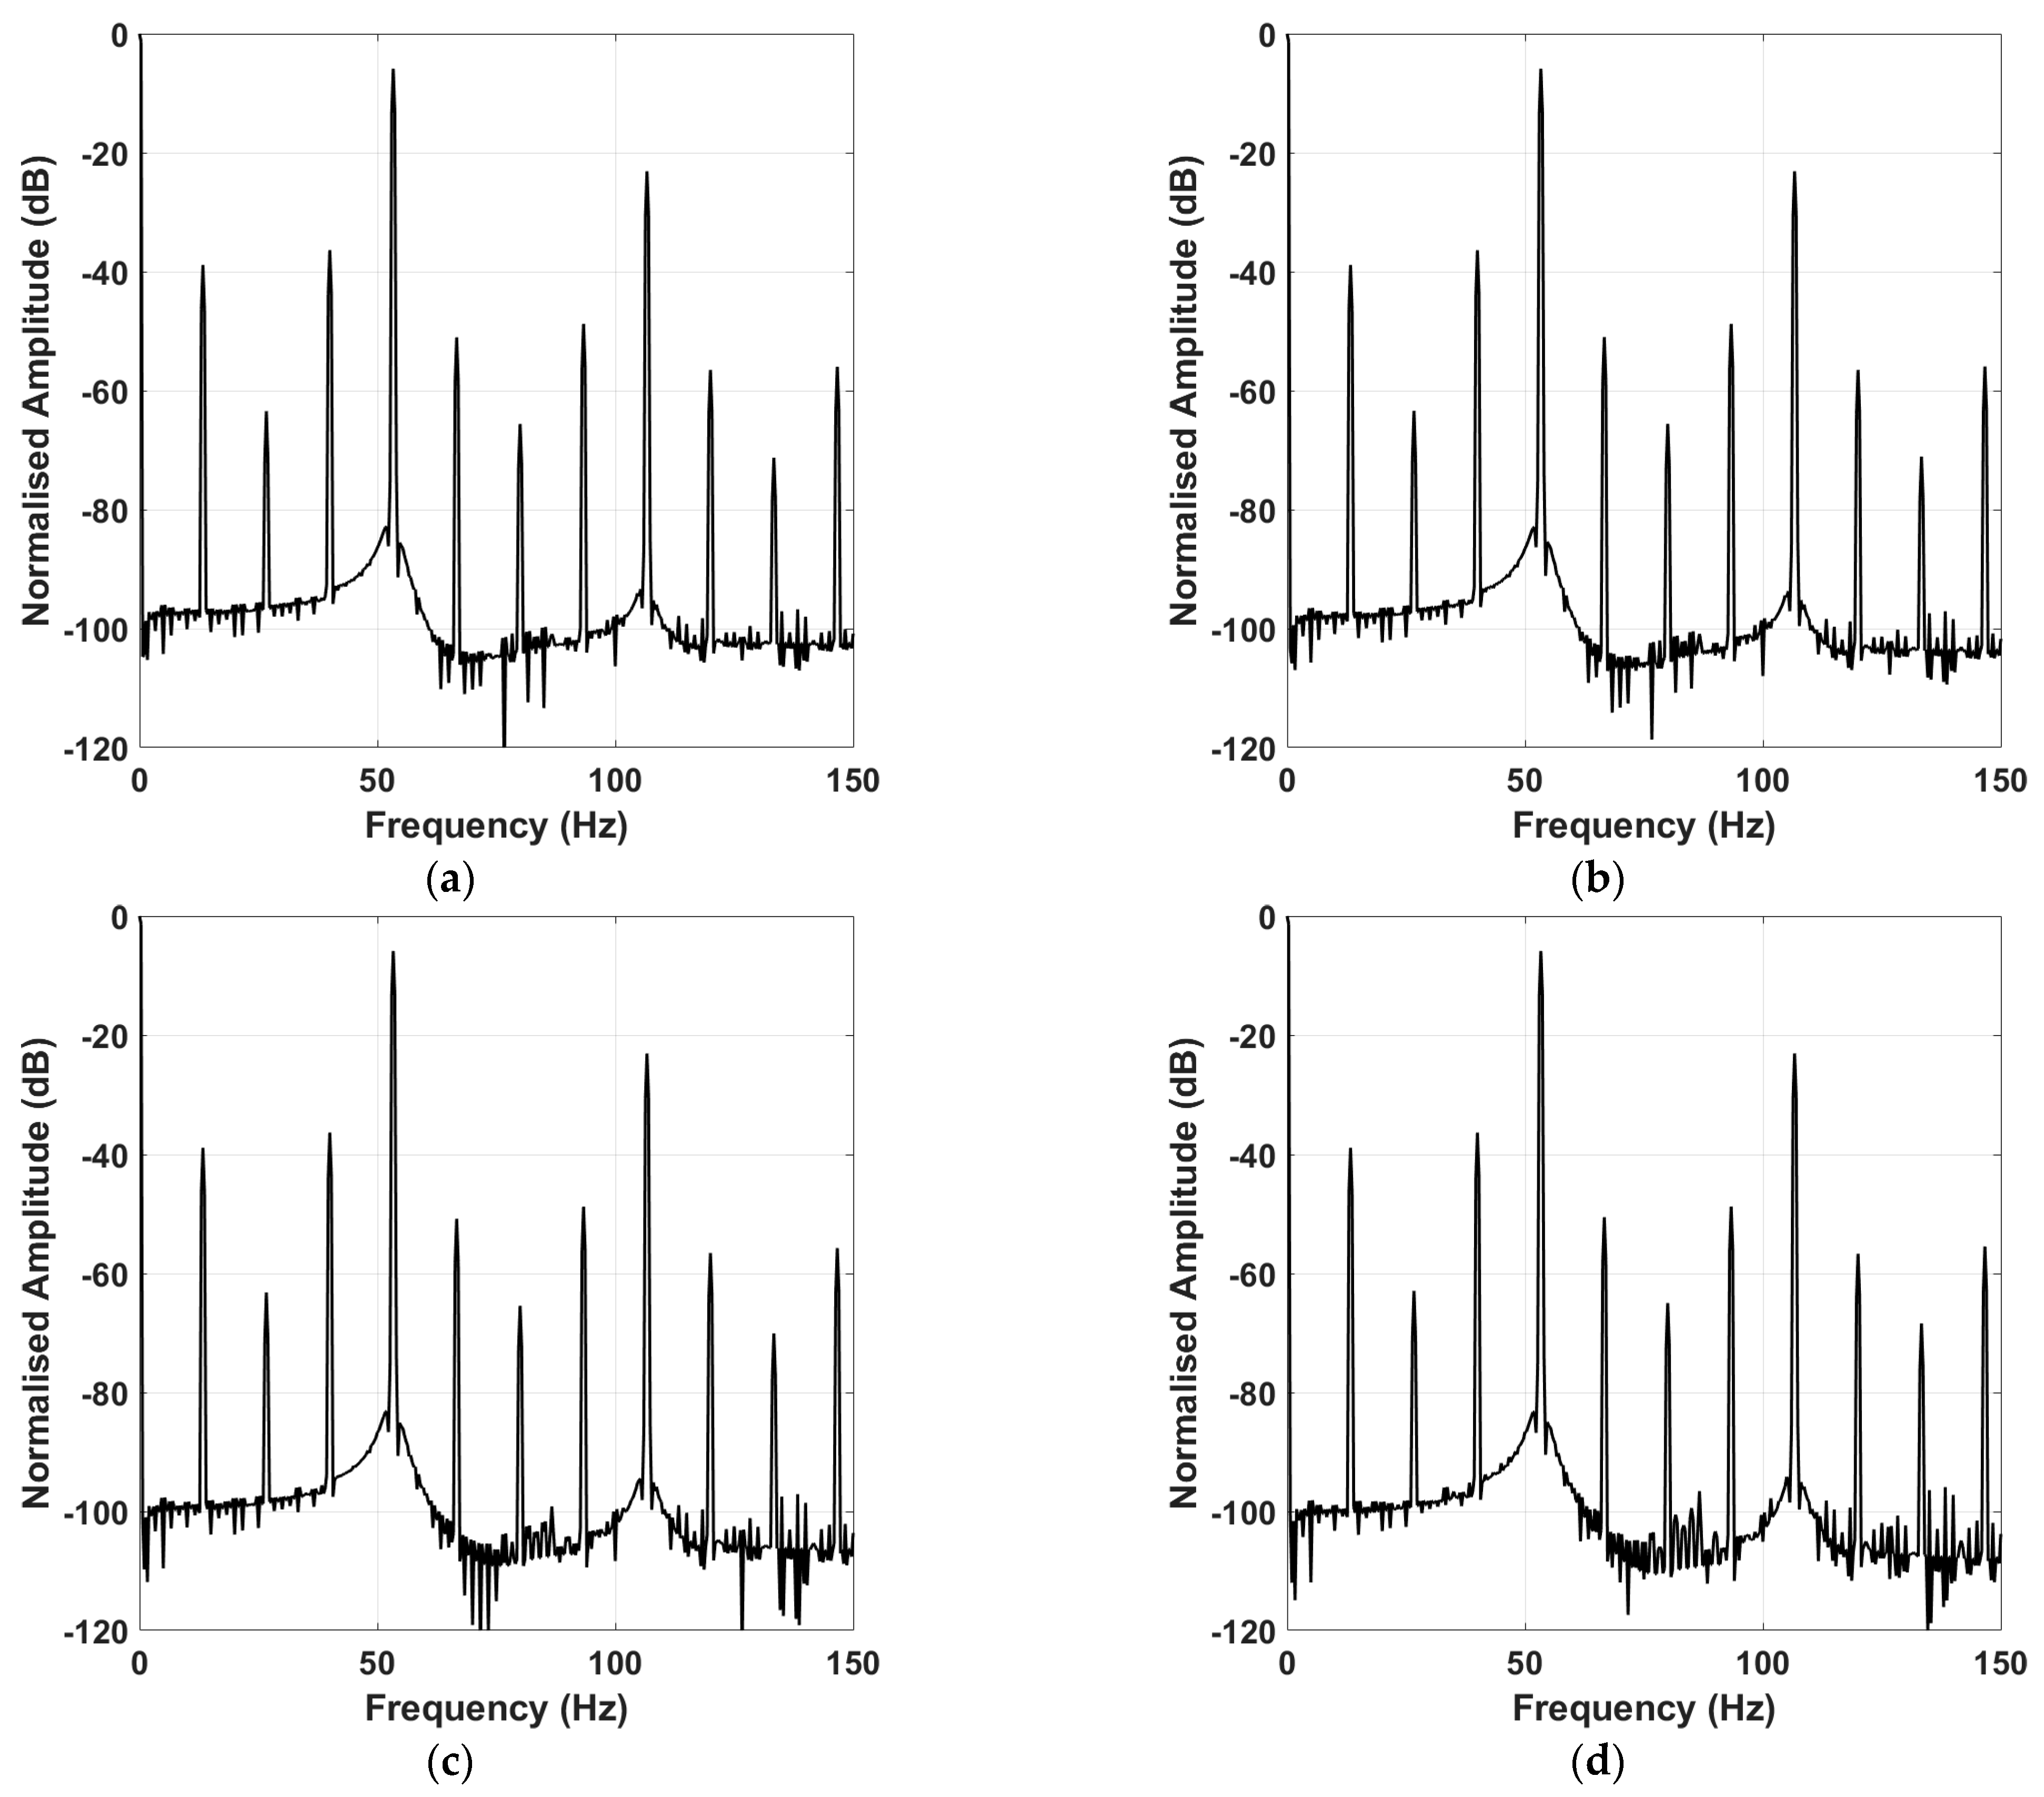
The extended Park’s vector approach (EPVA) provided a variety of signatures and more information as the harmonic amplitude and additional harmonics were captured in faulty conditions. The spectra were normalized to the PVM signal’s maximum value (DC component). When the demagnetization fault occurred, multiple signatures of the fault were present. Specifically, the k f s ± n f s 4 , were generated, with important amplitudes. The amplitude differences between healthy and faulty conditions exceeded 50 dB, thus providing a very reliable diagnostic outcome. It appeared that EPVA was more sensitive to faults than the other two methods because of the DC component and harmonics with twice the frequency of current. These resulted in a higher amplitude of the signal when i a , i b , and i c substituted for i d and i q , as indicated in (7) and (8). The spectra for the additional load cases are shown in Appendix C.
i d = I 1 ( 2 3 1 6 ) c o s ( ω 1 t ) n = k p ( 2 3 1 6 ) c o s ( n ω 1 t )
where n = k / p , k = 1, 2, 3… with k not taking values equal to p , 3 × p , 5 × p ...
i q = 2 I 1 s i n ( 60 ° ) s i n ( ω 1 t 180 ° ) 2 n = k p I n s i n ( 60 ° n ) s i n ( n ω 1 t 180 ° n )
where n   =   k / p , k   = 1, 2, 3… with k not taking values equal to p , 3 × p , 5 × p ...
Applying the extended Park’s vector approach (EPVA), as shown in (9), to the experimental model yielded harmonic components and signatures that matched simulation results for both healthy and faulty conditions, to a great extent.
e P V A = ( I 1 2 ( 2 3 1 6 ) 2 1 + c o s ( 2 ω 1 t ) 2 + n = k p I n 2 ( 2 3 1 6 ) 2 1 + c o s ( 2 n ω 1 t ) 2 2 I 1 ( 2 3 1 6 ) c o s ( ω n t ) n = k p I n c o s ( n ω n t )   I 1 2 3 2 1 c o s ( 2 ω 1 t ) 2 2 6 I 1 s i n ( ω 1 t ) n = k p I n s i n ( 60 ° n ) s i n ( n ω 1 t 180 ° n ) + 4 n = k p I n s i n ( 60 ° n ) 1 c o s ( 2 ω n t ) 2 ) 1 2
where n   =   k / p , k   = 1, 2, 3… with k not taking values equal to p , 3 × p , 5 × p ...
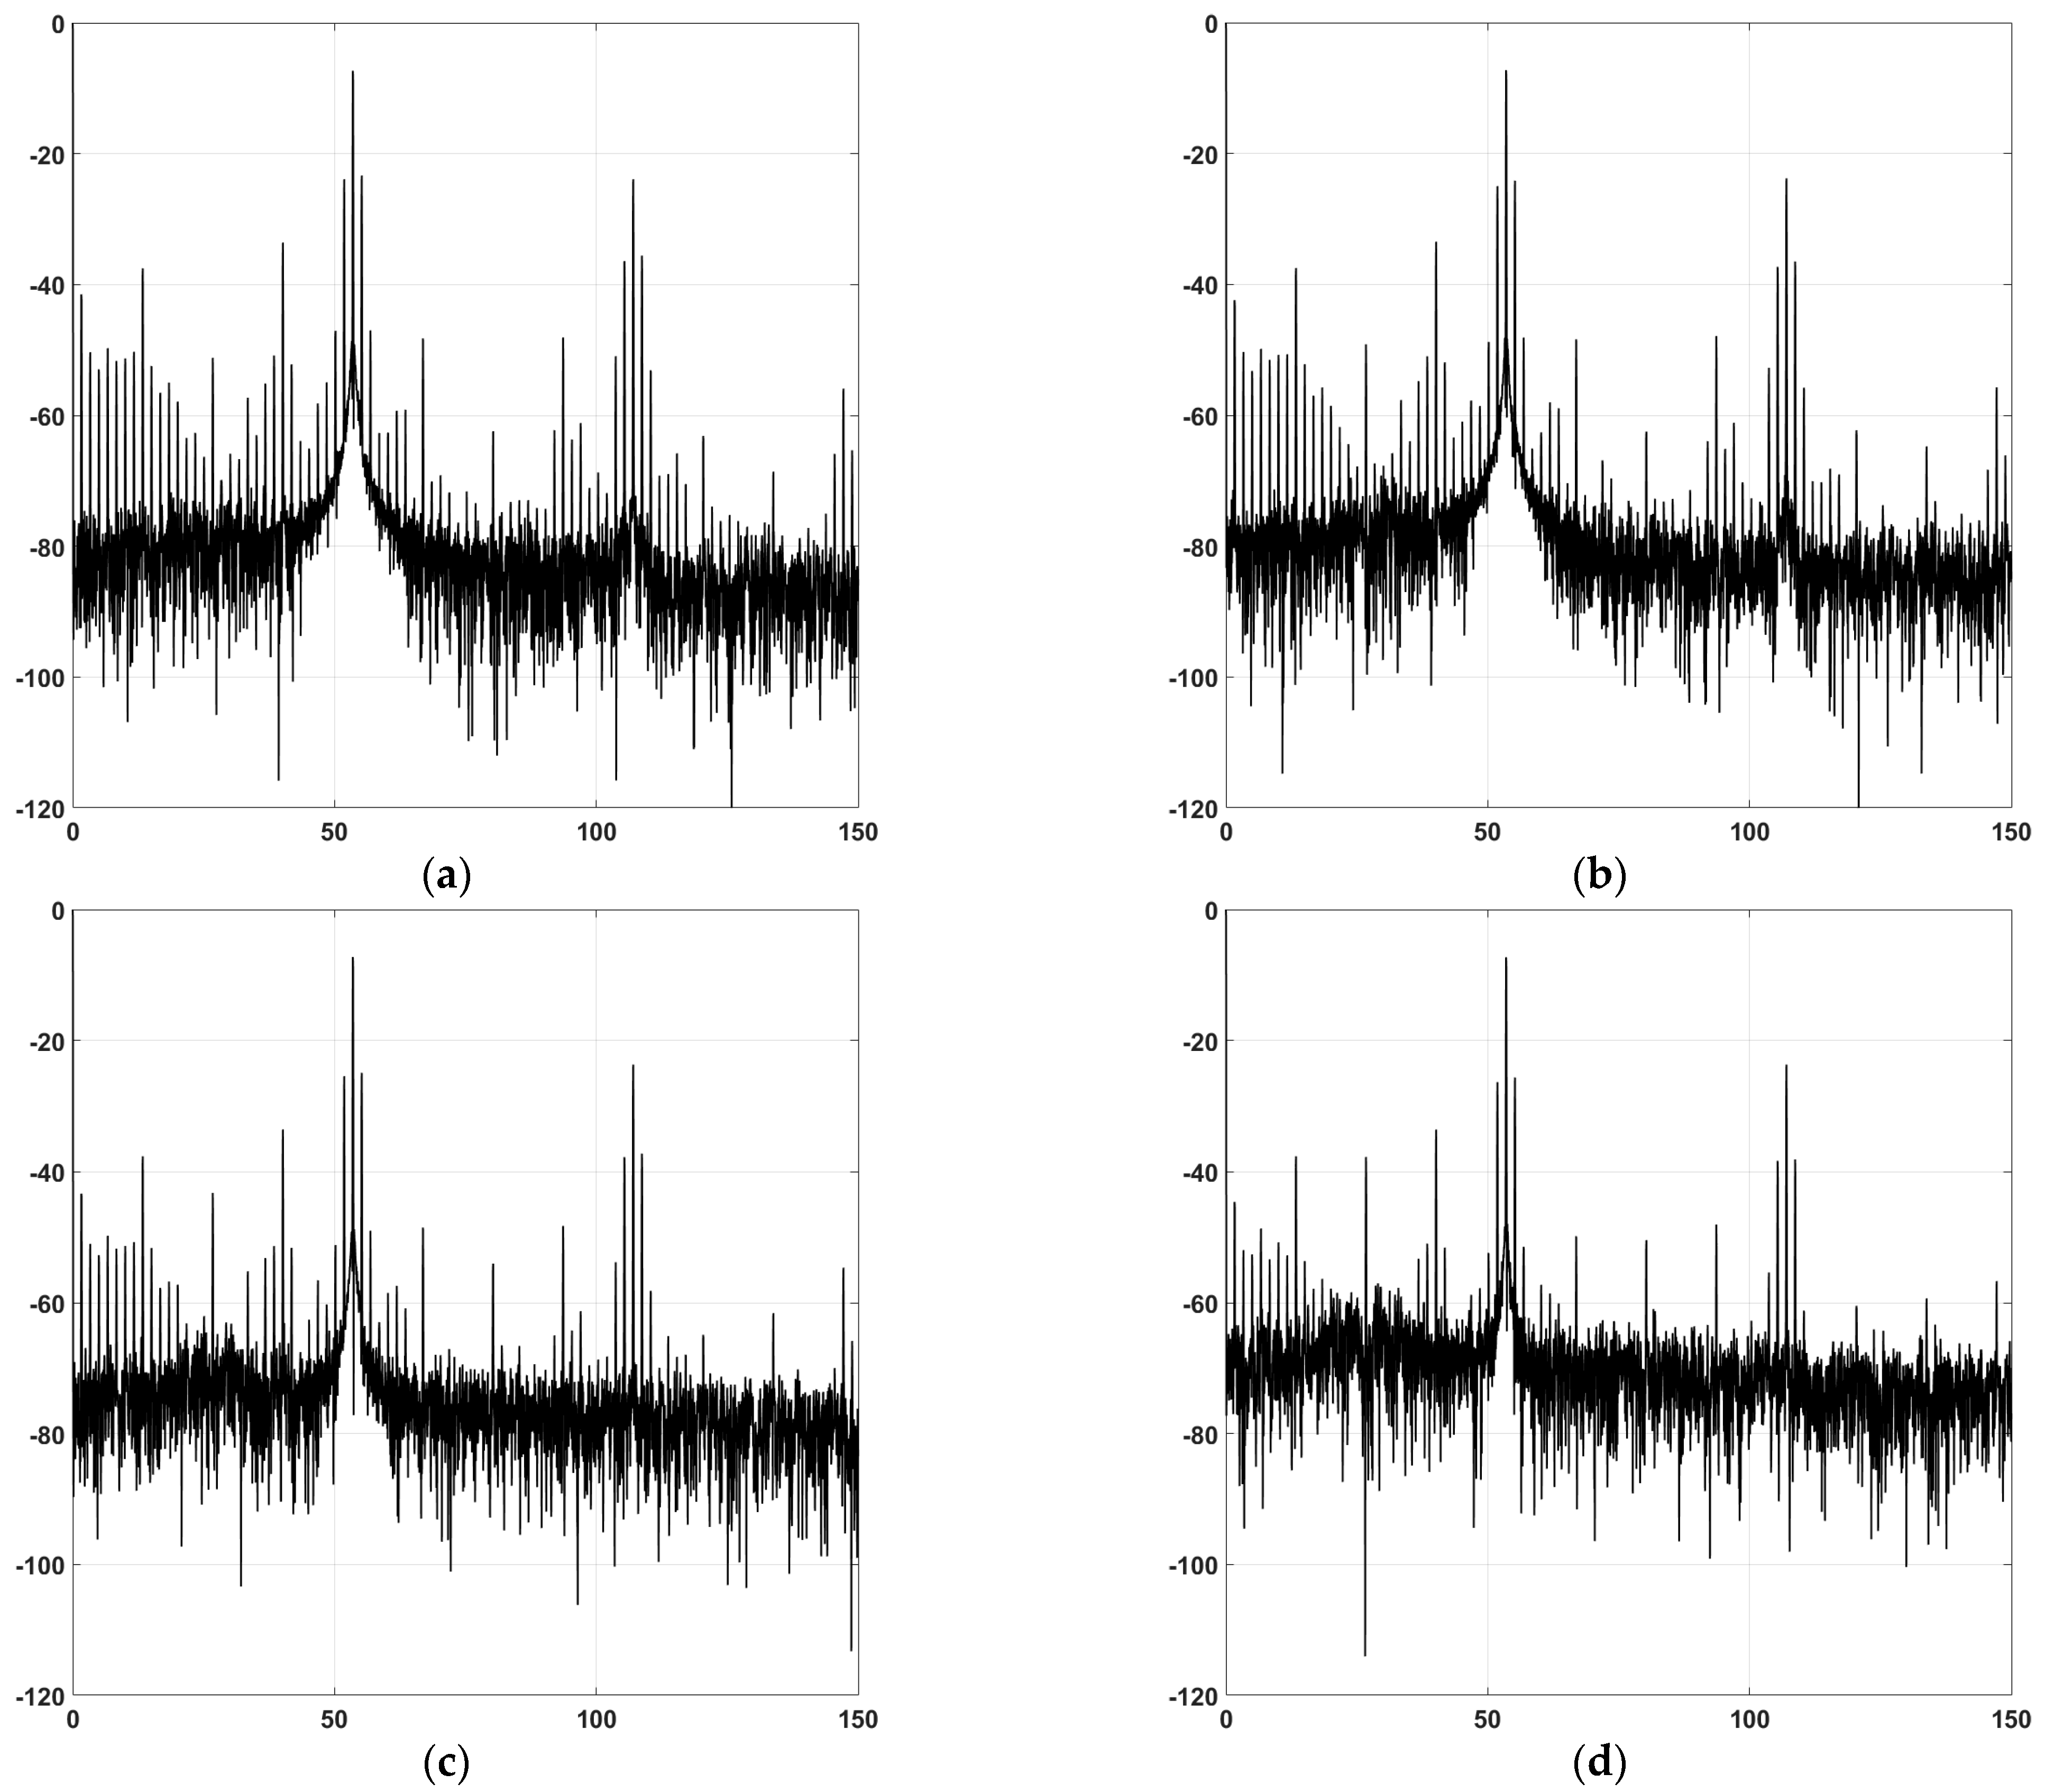
Figure 5a,b, respectively, depict the spectra of healthy and faulty loads at a nominal load. It was evident that, when demagnetization faults occurred, the amplitude difference could be as high as 20 dB—specifically with the ¾* fs, ½* fs, and ¼* fs harmonics components. Comparing experimental results, as in Figure 5c,d, to the simulation results, the other component visible in the spectra was deemed complementary because of the mechanical imbalance resulting from the removal of one single magnet module. The spectra for the different load instances are provided in Appendix F. Demagnetization had the same effect on those harmonics components as it did on the other.

4. Discussion

The simulated and experimental results of the three condition monitoring methods all demonstrated their ability to detect demagnetization faults. The evaluation metrics used in this study were the sensitivity levels of each detection technique when identifying demagnetization faults. These were determined by comparing the results of the simulated and experimental data of three techniques: CSA, PVA, and EPVA. CSA was found to be less sensitive, as fewer harmonics were affected by the fault, and other harmonics easily masked the fault signature. PVA, although it did not provide any obvious signs of fault apart from the three arc segments, could have potential for further development as a detection method. In contrast, EPVA was found to be the most sensitive to faults, as it increased the amplitude of the harmonics of the fault, for a given fault severity, by squaring the two currents, summing them, and then taking the root of the signal.
Comparing the efficiency of a healthy generator to that of a faulty one revealed that, due to the magnetic asymmetry in the machine and the parallel connection of the coils in each phase, the back EMF of each coil could differ. This led to different coil currents in each parallel path and resulted in divergent trends in efficiency. These decreased with increasing loads in healthy conditions, but exhibited the opposite trend in demagnetization conditions. To maintain the voltage balance across a parallel group of coils, a circulating current was generated wherein one coil supplied current to the next coil, resulting in an increase in current due to Joule losses.
The experimental runs revealed that noise levels increased with decreasing load for all methods, indicating that these methods were more sensitive when the load was low. Under high load conditions, it was difficult to detect the fault; the loci grew much thicker due to the noise generated by the low load scenario. Comparing all three diagnostic methods, EPVA was better suited for a wider variety of load conditions, both at high and low loads. It appeared that the extended Park’s vector approach (EPVA) was more sensitive to faults, compared to the other two methods, i.e., current signature analysis (CSA) and Park’s vector approach (PVA). This was attributed to its ability to identify the DC component and harmonics with twice the frequency of current. This resulted in higher signal amplitude of the signal, making EVPA more sensitive to faults.
The DC component, which was a constant voltage or current, was not present in the other two methods, making fault detection less sensitive. The harmonics, with twice the frequency of current, were caused by the nonlinearity of the system and exhibited a higher amplitude than other harmonics. By squaring the two currents, summing them, and then taking the root of the signal, EPVA amplified the amplitude of the harmonics of the fault for a given fault severity. This rendered it more effective at detecting faults, even in situations where the noise level was high or the load was low. In summary, EPVA’s ability to identify the DC component and harmonics with twice the frequency of current, along with its method of amplifying the amplitude of the harmonics, made it more sensitive to fault detection than the other two methods.

5. Conclusions

This paper examined and compared three different techniques for detecting demagnetization in a coreless synchronous generator. This was undertaken because, if demagnetization goes undetected, generators can lose efficiency and may even suffer from a catastrophic failure due to increased heat generation. The three techniques evaluated in the paper were: current signature analysis (CSA), Park’s vector approach (PVA), and extended Park’s vector approach (EPVA).
To evaluate the sensitivity of each detection technique, a healthy FEM model of a coreless permanent magnet generator was used as a benchmark. This model was used to predict the likely diagnostic content in the current spectra before testing the predictions against experimental data. To simulate different levels of demagnetization, five different loads were modeled using FEM and then introduced into the model with a load profile similar to that of a healthy case.
The results of the comparison showed that EPVA was the superior method for detecting demagnetization due to its ability to unambiguously identify faults and its high sensitivity to faults.

Author Contributions

Methodology, K.N.G.; Software, S.A.R.; Validation, S.A.R.; Writing—review & editing, K.N.G.; Supervision, M.M. All authors have read and agreed to the published version of the manuscript.

Funding

This research received no external funding.

Conflicts of Interest

The authors declare no conflict of interest.

Appendix A

Figure A1. Simulation results. The current spectrum of the generator at 100 rpm: (a) Local demagnetization 5 kW; (b) Local demagnetization 4 kW; (c) Local demagnetization 2 kW; (d) Local demagnetization 1 kW.
Energies 16 02767 g0a1

Appendix B

Figure A2. Experimental results. The current spectrum of the generator at 100 rpm: (a) Local demagnetization 5 kW; (b) Local demagnetization 4 kW; (c) Local demagnetization 2 kW; (d) Local demagnetization 1 kW.
Energies 16 02767 g0a2

Appendix C

Figure A3. Simulation results. Park’s Vector of the generator at 100 rpm: (a) Local demagnetization 5 kW; (b) Local demagnetization 4 kW; (c) Local demagnetization 2 kW; (d) Local demagnetization 1 kW.
Energies 16 02767 g0a3

Appendix D

Figure A4. Experimental results. Park’s Vector of the generator at 100 rpm: (a) Local demagnetization 5 kW; (b) Local demagnetization 4 kW; (c) Local demagnetization 2 kW; (d) Local demagnetization 1 kW.
Energies 16 02767 g0a4

Appendix E

Figure A5. Simulation results. EPVA spectrum of the generator at 100 rpm: (a) Local demagnetization 5 kW; (b) Local demagnetization 4 kW; (c) Local demagnetization 2 kW; (d) Local demagnetization 1 kW.
Energies 16 02767 g0a5

Appendix F

Figure A6. Experimental results. EPVA spectrum of the generator at 100 rpm: (a) Local demagnetization 5 kW; (b) Local demagnetization 4 kW; (c) Local demagnetization 2 kW; (d) Local demagnetization 1 kW.
Energies 16 02767 g0a6

References

  1. Clarke, L.; Wei, Y.-M.; Navarro, A.D.L.V.; Garg, A.; Hahmann, A.N.; Khennas, S.; Azevedo, I.M.L.; Löschel, A.; Singh, A.K.; Steg, L.; et al. Climate Change 2022: Mitigation of Climate Change. Contribution of Working Group III to the Sixth Assessment Report of the Intergovernmental Panel on Climate Change; Essandoh-Yeddu, J.K., Lee, A., Eds.; Cambridge University Press: Cambridge, UK, 2022; Volume 23. [Google Scholar]
  2. Xu, X.; Wei, Z.; Ji, Q.; Wang, C.; Gao, G. Global Renewable Energy Development: Influencing Factors, Trend Predictions and Countermeasures. Resour. Policy 2019, 63, 101470. [Google Scholar] [CrossRef]
  3. Ruoho, S.; Kolehmainen, J.; Ikäheimo, J.; Arkkio, A. Interdependence of Demagnetization, Loading, and Temperature Rise in a Permanent-Magnet Synchronous Motor. IEEE Trans. Magn. 2010, 46, 949–953. [Google Scholar] [CrossRef]
  4. McFarland, J.D.; Jahns, T.M. Investigation of the Rotor Demagnetization Characteristics of Interior PM Synchronous Machines during Fault Conditions. IEEE Trans. Ind. Appl. 2014, 50, 2768–2775. [Google Scholar] [CrossRef]
  5. Almandoz, G.; Gomez, I.; Ugalde, G.; Poza, J.; Escalada, A.J. Study of Demagnetization Risk in PM Machines. IEEE Trans. Ind. Appl. 2019, 55, 3490–3500. [Google Scholar] [CrossRef]
  6. Bianchini, C.; Torreggiani, A.; Davoli, M.; Bellini, A. Design of Low-Cost Synchronous Machine to Prevent Demagnetization. Energies 2020, 13, 3566. [Google Scholar] [CrossRef]
  7. Ullah, Z.; Hur, J. Irreversible Demagnetization Fault Prognosis in a Permanent Magnet Type Machines. In Proceedings of the ECCE 2020—IEEE Energy Conversion Congress and Exposition, Detroit, MI, USA, 11–15 October 2020; pp. 742–747. [Google Scholar]
  8. Faiz, J.; Mazaheri-Tehrani, E. Demagnetization Modeling and Fault Diagnosing Techniques in Permanent Magnet Machines under Stationary and Nonstationary Conditions: An Overview. IEEE Trans. Ind. Appl. 2017, 53, 2772–2785. [Google Scholar] [CrossRef]
  9. Mohammed, A.; Melecio, J.I.; Durovic, S. Electrical Machine Permanent Magnets Health Monitoring and Diagnosis Using an Air-Gap Magnetic Sensor. IEEE Sens. J. 2020, 20, 5251–5259. [Google Scholar] [CrossRef]
  10. Urresty, J.C.; Riba, J.R.; Delgado, M.; Romeral, L. Detection of Demagnetization Faults in Surface-Mounted Permanent Magnet Synchronous Motors by Means of the Zero-Sequence Voltage Component. IEEE Trans. Energy Convers. 2012, 27, 42–51. [Google Scholar] [CrossRef]
  11. Ebrahimi, B.M.; Faiz, J. Demagnetization Fault Diagnosis in Surface Mounted Permanent Magnet Synchronous Motors. IEEE Trans. Magn. 2013, 49, 1185–1192. [Google Scholar] [CrossRef]
  12. Bossio, J.; Ruschetti, C.; Bossio, G.; Verucchi, C.; de Angelo, C. Rotor Fault Diagnosis in Permanent Magnet Synchronous Machine Using the Midpoint Voltage of Windings. IET Electr. Power Appl. 2020, 14, 256–261. [Google Scholar] [CrossRef]
  13. Zhu, Y.; Xiao, M.; Lu, K.; Wu, Z.; Tao, B. A Simplified Thermal Model and Online Temperature Estimation Method of Permanent Magnet Synchronous Motors. Appl. Sci. 2019, 9, 3158. [Google Scholar] [CrossRef] [Green Version]
  14. Kim, K.T.; Kim, B.W.; Kang, G.H. Irreversible Magnet Demagnetization Analysis of IPM Type BLDC Motor by Stator Turn Fault. In Proceedings of the 2012 7th International Forum on Strategic Technology, IFOST 2012, Tomsk, Russia, 18–21 September 2012; IEEE: Piscataway, NJ, USA, 2012; Volume 45, p. 7062. [Google Scholar]
  15. Faiz, J.; Nejadi-Koti, H. Demagnetization Fault Indexes in Permanent Magnet Synchronous Motors—An Overview. IEEE Trans. Magn. 2016, 52, 8201511. [Google Scholar] [CrossRef]
  16. Liu, Z.; Huang, J.; Li, B. Diagnosing and Distinguishing Rotor Eccentricity from Partial Demagnetisation of Interior PMSM Based on Fluctuation of High-Frequency d-Axis Inductance and Rotor Flux. IET Electr. Power Appl. 2017, 11, 1265–1275. [Google Scholar] [CrossRef]
  17. Goktas, T.; Zafarani, M.; Akin, B. Discernment of Broken Magnet and Static Eccentricity Faults in Permanent Magnet Synchronous Motors. IEEE Trans. Energy Convers. 2016, 31, 578–587. [Google Scholar] [CrossRef]
  18. Chen, Y.; Liang, S.; Li, W.; Liang, H.; Wang, C. Faults and Diagnosis Methods of Permanent Magnet Synchronous Motors: A Review. Appl. Sci. 2019, 9, 2116. [Google Scholar] [CrossRef] [Green Version]
  19. Krichen, M.; Elbouchikhi, E.; Benhadj, N.; Chaieb, M.; Benbouzid, M.; Neji, R. Motor Current Signature Analysis-Based Permanent Magnet Synchronous Motor Demagnetization Characterization and Detection. Machines 2020, 8, 35. [Google Scholar] [CrossRef]
  20. Ullah, Z.; Hur, J. A Comprehensive Review of Winding Short Circuit Fault and Irreversible Demagnetization Fault Detection in PM Type Machines. Energies 2018, 11, 3309. [Google Scholar] [CrossRef] [Green Version]
  21. Gyftakis, K.N.; Rasid, S.; Skarmoutsos, G.; Mueller, M.A. The Demagnetization Harmonics Generation Mechanism in Permanent Magnet Machines with Concentrated Windings. IEEE Trans. Energy Convers. 2021, 36, 2934–2944. [Google Scholar] [CrossRef]
  22. Lamprokostopoulos, A.; Mitronikas, E.; Barmpatza, A. Detection of Demagnetization Faults in Axial Flux Permanent-Magnet Synchronous Wind Generators. Energies 2022, 15, 3220. [Google Scholar] [CrossRef]
  23. Keysan, O.; McDonald, A.S.; Mueller, M.A.; Doherty, R.; Hamilton, M. C-GEN, a Lightweight Direct Drive Generator for Marine Energy Converters. In Proceedings of the IET Conference Publications, Brighton, UK, 19–21 April 2010; Volume 2010. [Google Scholar]
  24. Mueller, M.A.; McDonald, A.S.; Ochije, K.; Jeffrey, J. A Novel Lightweight Permanent Magnet Generator for Direct Drive Power Take Off in Marine Renewable Energy Converters. In Proceedings of the 7th EWTEC European Wave and Tidal Energy Conference, Porto, Portugal, 11–13 September 2007. [Google Scholar]
  25. Mueller, M.A.; McDonald, A.S. C-GEN—A Lightweight Permanent Magnet Generator for Direct Drive Power Take Off Systems C-GEN. In Proceedings of the 2nd International Conference on Ocean Energy (ICOE 2008), Brest, France, 15–17 October 2008; Volume 1, pp. 1–7. [Google Scholar]
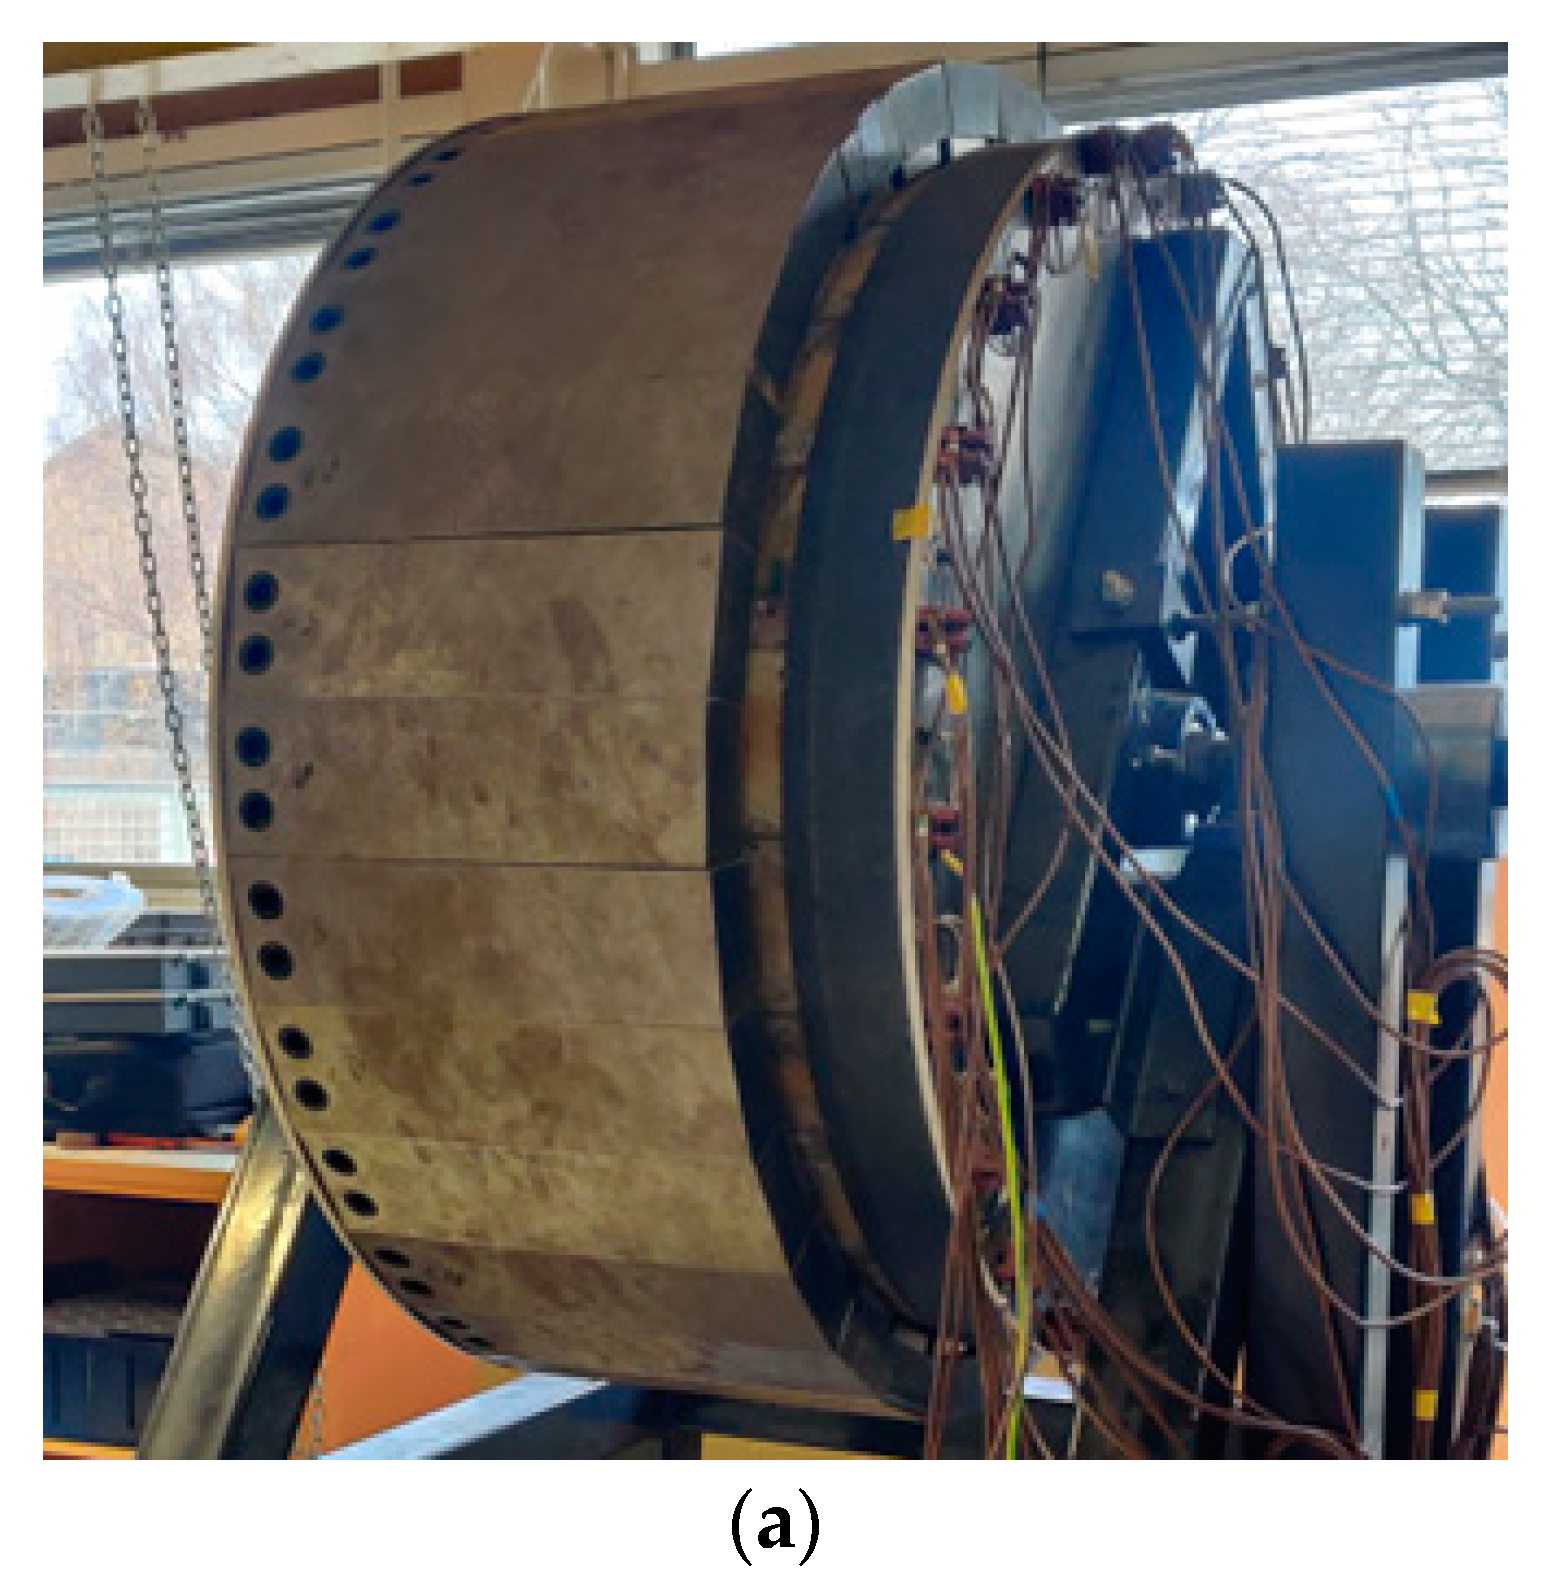
Figure 1. The tested C-Gen PM generator: (a) the real generator, (b) the generator with one magnet module removed, and (c) the FEA model of the machine with an arrow pointing at the faulty magnet.
Energies 16 02767 g001aEnergies 16 02767 g001b
Figure 2. The process flow of obtaining the results.
Energies 16 02767 g002
Figure 3. Simulation results. The current spectra of the generator at 100 rpm: (a) Simulation healthy; (b) Simulation local demagnetization; (c) Experiment healthy; (d) Experiment local demagnetization.
Energies 16 02767 g003
Figure 4. Simulation results. PVA of the generator at 100 rpm: (a) healthy simulation; (b) local demagnetization simulation; (c) healthy experiment; (d) local demagnetization experiment.
Energies 16 02767 g004
Figure 5. Simulation results. EPVA spectrum of the generator at 100 rpm: (a) healthy simulation; (b) local demagnetization simulation; (c) healthy experiment; (d) local demagnetization experiment.
Energies 16 02767 g005
Table 1. Parameters of the C-Gen generator under study.
ParameterValue
Rated power21.5 kW
Rated speed100 rpm
Magnet materialN42 NdFeB
Frequency26.67 Hz
No of phases3-phase
No of poles16 pole pairs
No of coil per phase8 × concentrated coils
No of turns205 turns
Table 2. Comparison of machine output parameters between healthy and faulty.
ParameterSimulationExperiment
Voltage292.41291.37
Current17.2016.89
Torque1540.771518.33
Efficiency93.52%92.85%
Table 3. Simulation measurement results.
ConditionV1
(V)
V2
(V)
V3
(V)
I1
(A)
I2
(A)
I3
(A)
Torque (Nm) P o u t
(kW)
P i n
(kW)
Efficiency
Healthy load 1309.96309.96309.951.821.821.82163.391.701.7199.09%
Healthy load 2307.94307.92307.933.623.623.62324.383.353.4098.52%
Healthy load 3306.94306.91306.924.514.514.51404.114.164.2398.21%
Healthy load 4302.01301.93301.988.888.888.88795.278.058.3396.61%
Healthy load 5292.47292.33292.4217.2017.2017.201540.7715.0916.1393.52%
Demagnetized load 1304.73304.74304.721.791.791.79221.811.642.3270.55%
Demagnetized load 2302.74302.75302.733.563.563.56377.423.233.9581.85%
Demagnetized load 3301.75301.76301.754.444.444.44454.494.024.7684.41%
Demagnetized load 4296.89296.90296.898.738.738.73832.617.788.7289.20%
Demagnetized load 5287.50287.51287.5016.9116.9116.911553.3214.5916.2789.68%
Table 4. Experimental measurement results.
ConditionV1V2V3I1I2I3Torque P o u t P i n Efficiency
Healthy load 1309.06309.70296.041.741.731.76159.501.601.6795.53%
Healthy load 2307.45308.34294.713.443.433.45314.513.133.2995.06%
Healthy load 3304.63305.34291.626.826.796.83622.436.146.5294.27%
Healthy load 4303.07303.84290.268.488.458.49773.457.607.9993.84%
Healthy load 5295.51304.80291.1216.9116.8616.911518.3314.7615.9092.85%
Demagnetized load 1303.79304.79291.101.661.701.69223.711.512.3464.65%
Demagnetized load 2302.05303.04289.523.363.413.42373.863.043.9177.59%
Demagnetized load 3298.60299.86286.596.616.726.74661.255.926.9285.51%
Demagnetized load 4296.95298.04285.068.198.338.37803.887.308.4286.70%
Demagnetized load 5288.23289.43277.7416.2716.5516.691517.0814.1215.8988.84%
Disclaimer/Publisher’s Note: The statements, opinions and data contained in all publications are solely those of the individual author(s) and contributor(s) and not of MDPI and/or the editor(s). MDPI and/or the editor(s) disclaim responsibility for any injury to people or property resulting from any ideas, methods, instructions or products referred to in the content.