Article

Evaluating the Chances of Implementing the “Fit for 55” Green Transition Package in the V4 Countries

1
Department of Quantitative Methods, The Faculty of Management, Rzeszow University of Technology, Aleja Powstańców Warszawy 10/S, 35-959 Rzeszow, Poland
2
Department of Trade and Finance, Faculty of Economics and Management, Czech University of Life Sciences Prague, Kamýcká 129, 165 00 Prague, Czech Republic
3
Department of Private Law Disciplines, Police Academy of the Czech Republic in Prague, Lhotecká 559/7, 143 01 Prague, Czech Republic
*
Authors to whom correspondence should be addressed.
Energies 2023, 16(6), 2764; https://doi.org/10.3390/en16062764
Submission received: 13 February 2023 / Revised: 9 March 2023 / Accepted: 13 March 2023 / Published: 16 March 2023

Abstract

:
The European Union (EU) is a global leader in renewable energy, and it is working to maintain this position through setting high standards for itself as well as for its member states in this field. Among the goals set for 2030 in Directive (EU) 2018/2001 and changes published on 14 July 2021 is a 55% reduction in greenhouse gas (GHG) emissions (compared to 20% in 2020). The targets for individual countries vary and depend on the current level of development of renewable energy. This article focuses on evaluation of these targets in the Visegrad Group (V4) countries (Czech Republic, Hungary, Poland, and Slovakia). These are post-Communist countries that have undergone systemic transformations but still face challenges related to sustainable development in renewable energy. This article analyzes the 2030 goals and the prospects of their implementation. Evaluated criteria include greenhouse gas emissions, the share of renewable energy in energy consumption, energy consumption, energy efficiency, and energy intensity. The analyses in this article are based on a literature review, the current energy situation in each country, European climate and energy targets, comparative analyses, and our own forecasts. Our results show that V4 countries would need to revise their policies and funds allocated for green transformation, which, in turn, might change their projections of the EU climate package targets for 2030. These findings might be useful for the EU stakeholders and policymakers responsible for climate policies and implementing renewable energy targets.

1. Introduction

There are four specific countries among the member states of the European Union (EU)—the Czech Republic, Hungary, Poland, and Slovakia—that are located in Central and Eastern Europe (CEE). Prior to 1989, these countries belonged to the Socialist Bloc led by the Union of Soviet Socialist Republics (USSR) [1,2]. In 1991, they gained independence, embarked on a path of economic transition toward a market economy and democracy, and formed the so-called “Visegrad Group” (also known as “V4”). The V4 was created because these four countries had similar goals, the most important of which were successful social transformation and joining the process of European integration. These countries decided that it would be easier for them to negotiate terms with their Western counterparts acting together. However, in recent years, there have been growing differences of opinion among the Visegrad countries, including on such issues as energy policies and strategies [3,4,5,6,7]. These differences are due to different structures of the energy sector as well as some political issues [8,9,10,11,12,13,14,15].
Nowadays, in the year 2023, the previous energy policy, called the “Europe 2020 Strategy” (3 × 20 climate and energy package) [16], is well in the past, as the EU has set new goals for itself for 2030 [17]. At the end of the realization of the previous strategy, the COVID-19 pandemic occurred. This pandemic impacted the economy and the energy sector [18,19,20,21,22,23,24] and disrupted implementation of climate plans [25,26,27]. In our previous article on a similar topic [28], we concluded that some of the goals for 2020 would not be achieved, and this was confirmed, e.g., when assessing the final energy consumption in Slovakia. During the pandemic, the EU countries had other problems to solve, which caused the European economy to decline [29,30,31,32]. As shown in Figure 1, which follows, the V4 countries also experienced economic problems, and their GDP rate was negative in 2020. An economic rebound was observed in 2021, but 2023 could again be a crisis year because of the high inflation and unstable energy situation in Europe after the Russian invasion of Ukraine and the EU and U.S. sanctions imposed on Russia [33,34,35,36,37].
Despite the post-pandemic, economic, and energy-related problems, the EU wants to remain the world’s leader in reducing greenhouse gases, promoting renewable energy, and increasing energy efficiency. In setting the new goals for itself, the EU negotiated national goals with the member states in order to reach the desired average [17,38,39,40].
The use of fossil fuels has been a primary source of energy for many decades, but it has resulted in adverse environmental impacts such as greenhouse gas emissions, air pollution, and resource depletion. Renewable energy sources (RESs) offer a promising solution to this challenge, as they are clean, abundant, and sustainable. However, the transition to renewable energy sources needs to be carefully managed to ensure economic growth and development are not hampered. Bhattacharya et al. [41] investigated the effect of renewable energy consumption on economic growth in 38 countries and found a positive relationship between the two variables. They argued that renewable energy consumption can drive economic growth through reducing energy imports, creating new jobs, and stimulating innovation. Similar conclusions can be found in other articles [42,43,44], where authors concluded that adoption of renewable energy sources could contribute to sustainable economic growth via reducing greenhouse gas emissions and increasing energy security. All these studies suggest that there is a strong connection between economic development, RESs, and GHG emissions. Research tends to lead endless discussions about the future of energy [45,46,47,48], but the most common conclusion is that due to climate change, energy security, and lower costs in the long term, RESs must supply our energy needs.
It can be assumed that the levels of development in the V4 countries are similar; their energy mixes are highly differentiated, and therefore, their national goals are very different [38]. Since the V4 countries joined the EU in 2004, their economic growth was quicker than in the “old” EU member states. An effect of this rapid economic development was an increase in pollution caused by developing industry [49]. After years of intense development and enrichment of society without any special attention to the environment, the time has come for setting environmentally friendly behavior. The V4 countries have more to catch up on in innovative and green energy than do the countries of Western Europe [3,4,50,51,52,53,54,55,56,57,58,59,60]. The last energy-related problem of these countries is energy efficiency, which is expressed in energy consumption and intensity [10,61].
The analyses undertaken in this article are based on a literature review, the current energy situation in every country, European climate and energy targets, comparative analysis, and our own forecasts.

2. European Nations’ Decade-Long National Energy and Climate Strategies for 2021–2030

For simplicity, EU climate and energy goals are communicated to the world as the single values valid for the entire EU, but in fact, each country has its own national goals. It should be noted that these goals are negotiated and, as will be presented in this article, could often be more ambitious. This statement especially applies to the V4 countries, whose energy mixes are different (worse) from the that of countries of Western Europe [62,63].
In our previous article [28], the following EU targets for 2020 were described:
  • Decreasing greenhouse gas (GHG) emissions by at least 20% relative to the 1990 levels;
  • Raising the proportion of renewable energy sources (RESs) in final energy consumption to 20%;
  • Progress toward a 20% enhancement in energy efficiency (from 2005 levels).
These targets were updated for 2030 in the Europe climate and energy framework [38] and called “Fit for 55”:
  • Decreasing greenhouse gas (GHG) emissions by at least 55% relative to 1990 levels;
  • Raising the proportion of renewable energy sources (RESs) in final energy consumption to 32%;
  • Progress toward a 32.5% enhancement in energy efficiency (from 2005 levels).
In the next two tables (Table 1 and Table 2), we present national targets of V4 countries for 2020 and 2030 in order to show the differences between them.
New national energy efficiency targets for 2030 were presented [38,39,40,65] and updated [17] by all the EU member states. For better clarity, targets for the V4 countries are presented in Table 2 (similar to Table 1).
To enhance the clarity of the empirical model and its main outcomes and implications, it is necessary to provide some clarification here: in contrast to final energy consumption, primary energy consumption refers to energy that has not undergone any conversion or transformation process. Energy intensity denotes the quantity of primary energy consumption per unit of GDP. It is worth noting that the energy intensity measure relies on the industrial structure of the economy and therefore is not an entirely accurate representation of energy efficiency in EU member states.
In addition, it is important to clarify various methodological aspects related to energy intensity (EI), gross inland energy consumption (GIEC), the gross domestic product (GDP), and their interrelationship. All of these variables can be expressed using the following formula:
EI = GIEC/GDP
where EI represents energy intensity, GIEC represents gross inland energy consumption, and GDP represents the gross domestic product.

3. Materials and Methods

The empirical models relied on data obtained from Eurostat, a European statistical office, that were accessed in February 2022. It should be noted that while certain data, such as the GDP, were the most recent available as of 2021, others (e.g., GHG) were based on 2020 data due to limitations in data availability and accessibility.
All data used in these analyses are annual data for the following periods:
  • GHGs—from 1990 to 2020 [66];
  • RESs—from 2004 to 2021 [67];
  • PEC—from 1990 to 2020 [68];
  • FEC—from 1990 to 2020 [69];
  • GIEC—from 1995 to 2021 [70];
  • GDP—from 1995 to 2021 [71].
To analyze time series data, the ARIMA method [72,73,74,75], which stands for autoregressive integrated moving average, was utilized. In this approach, the variable of interest is regressed on its own lagged values, with the AR representing a class of linear models and the MA representing another class of linear models that model the variable of interest with its imperfectly predicted current and previous time values. The I denotes integration and specifies the number of times the differencing operation is applied to the series to make it stationary.
The AR process can be expressed as
yt = ϕ1yt−1 + ϕ2yt−2 + ⋯ + ϕpyt−p + ϵt
where ϕt−1 is parameters, yt−i is regressors, and ϵ is the error term.
The MA process can be written in regard to error terms as
yt = θ1ϵt−1 + θ2ϵt−2 + ⋯ + θqϵt−q + ϵt
where θt−1 represents parameters, ϵt−i is the regressors or imperfections in predicting the previous terms, and ϵ is the error term.
The ARMA process has a mathematical form of
y t = i = 1 p ϕ i y t i + j = 1 q θ i ϵ t j + ϵ t
Differencing is the result of the ARMA process. The predictors on the right-hand side include lagged yt values and lagged errors, and this is known as the ARIMA (p, d, q) model. The parameters (p, d, q) describe the lag period (p), the degree of differencing (d), and the lag of the error component (q).
The empirical models used in this study are based on previous, similar studies conducted on EU countries and focusing on the same issues (see, e.g., [76]). Figures used for comparison purposes in this paper were separately prepared for each of the four V4 countries due to the differences in the scale of the data.
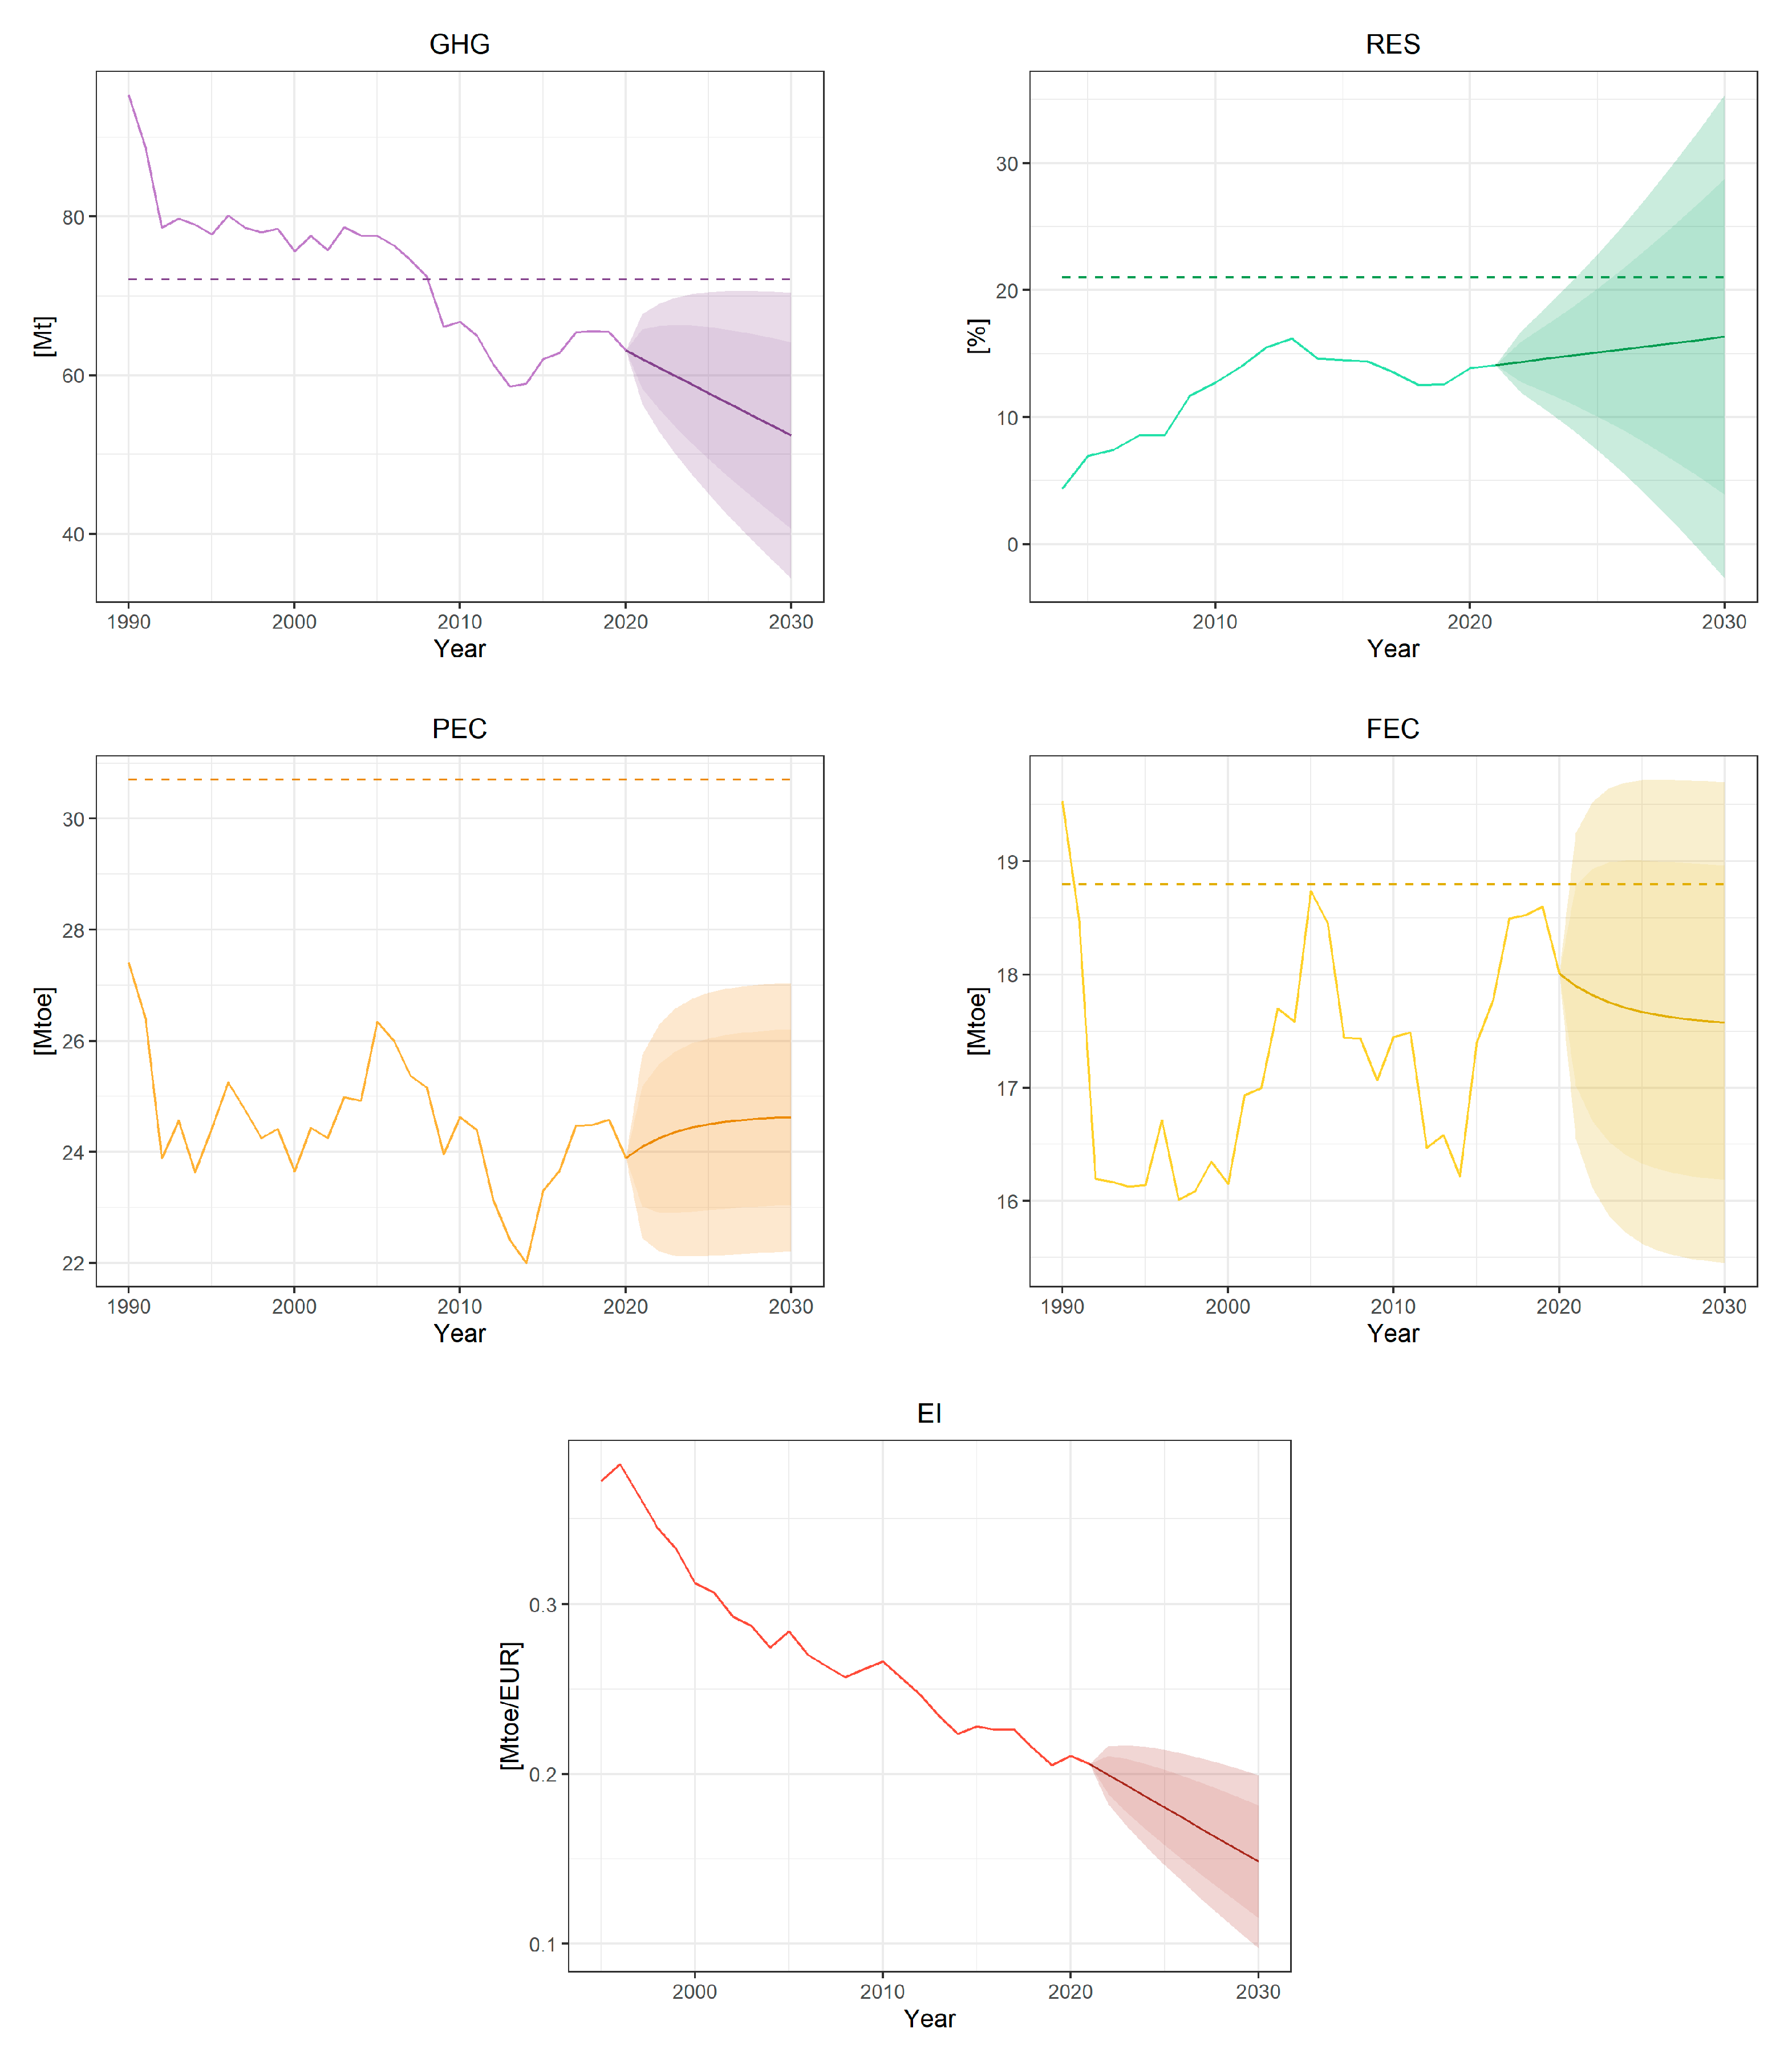
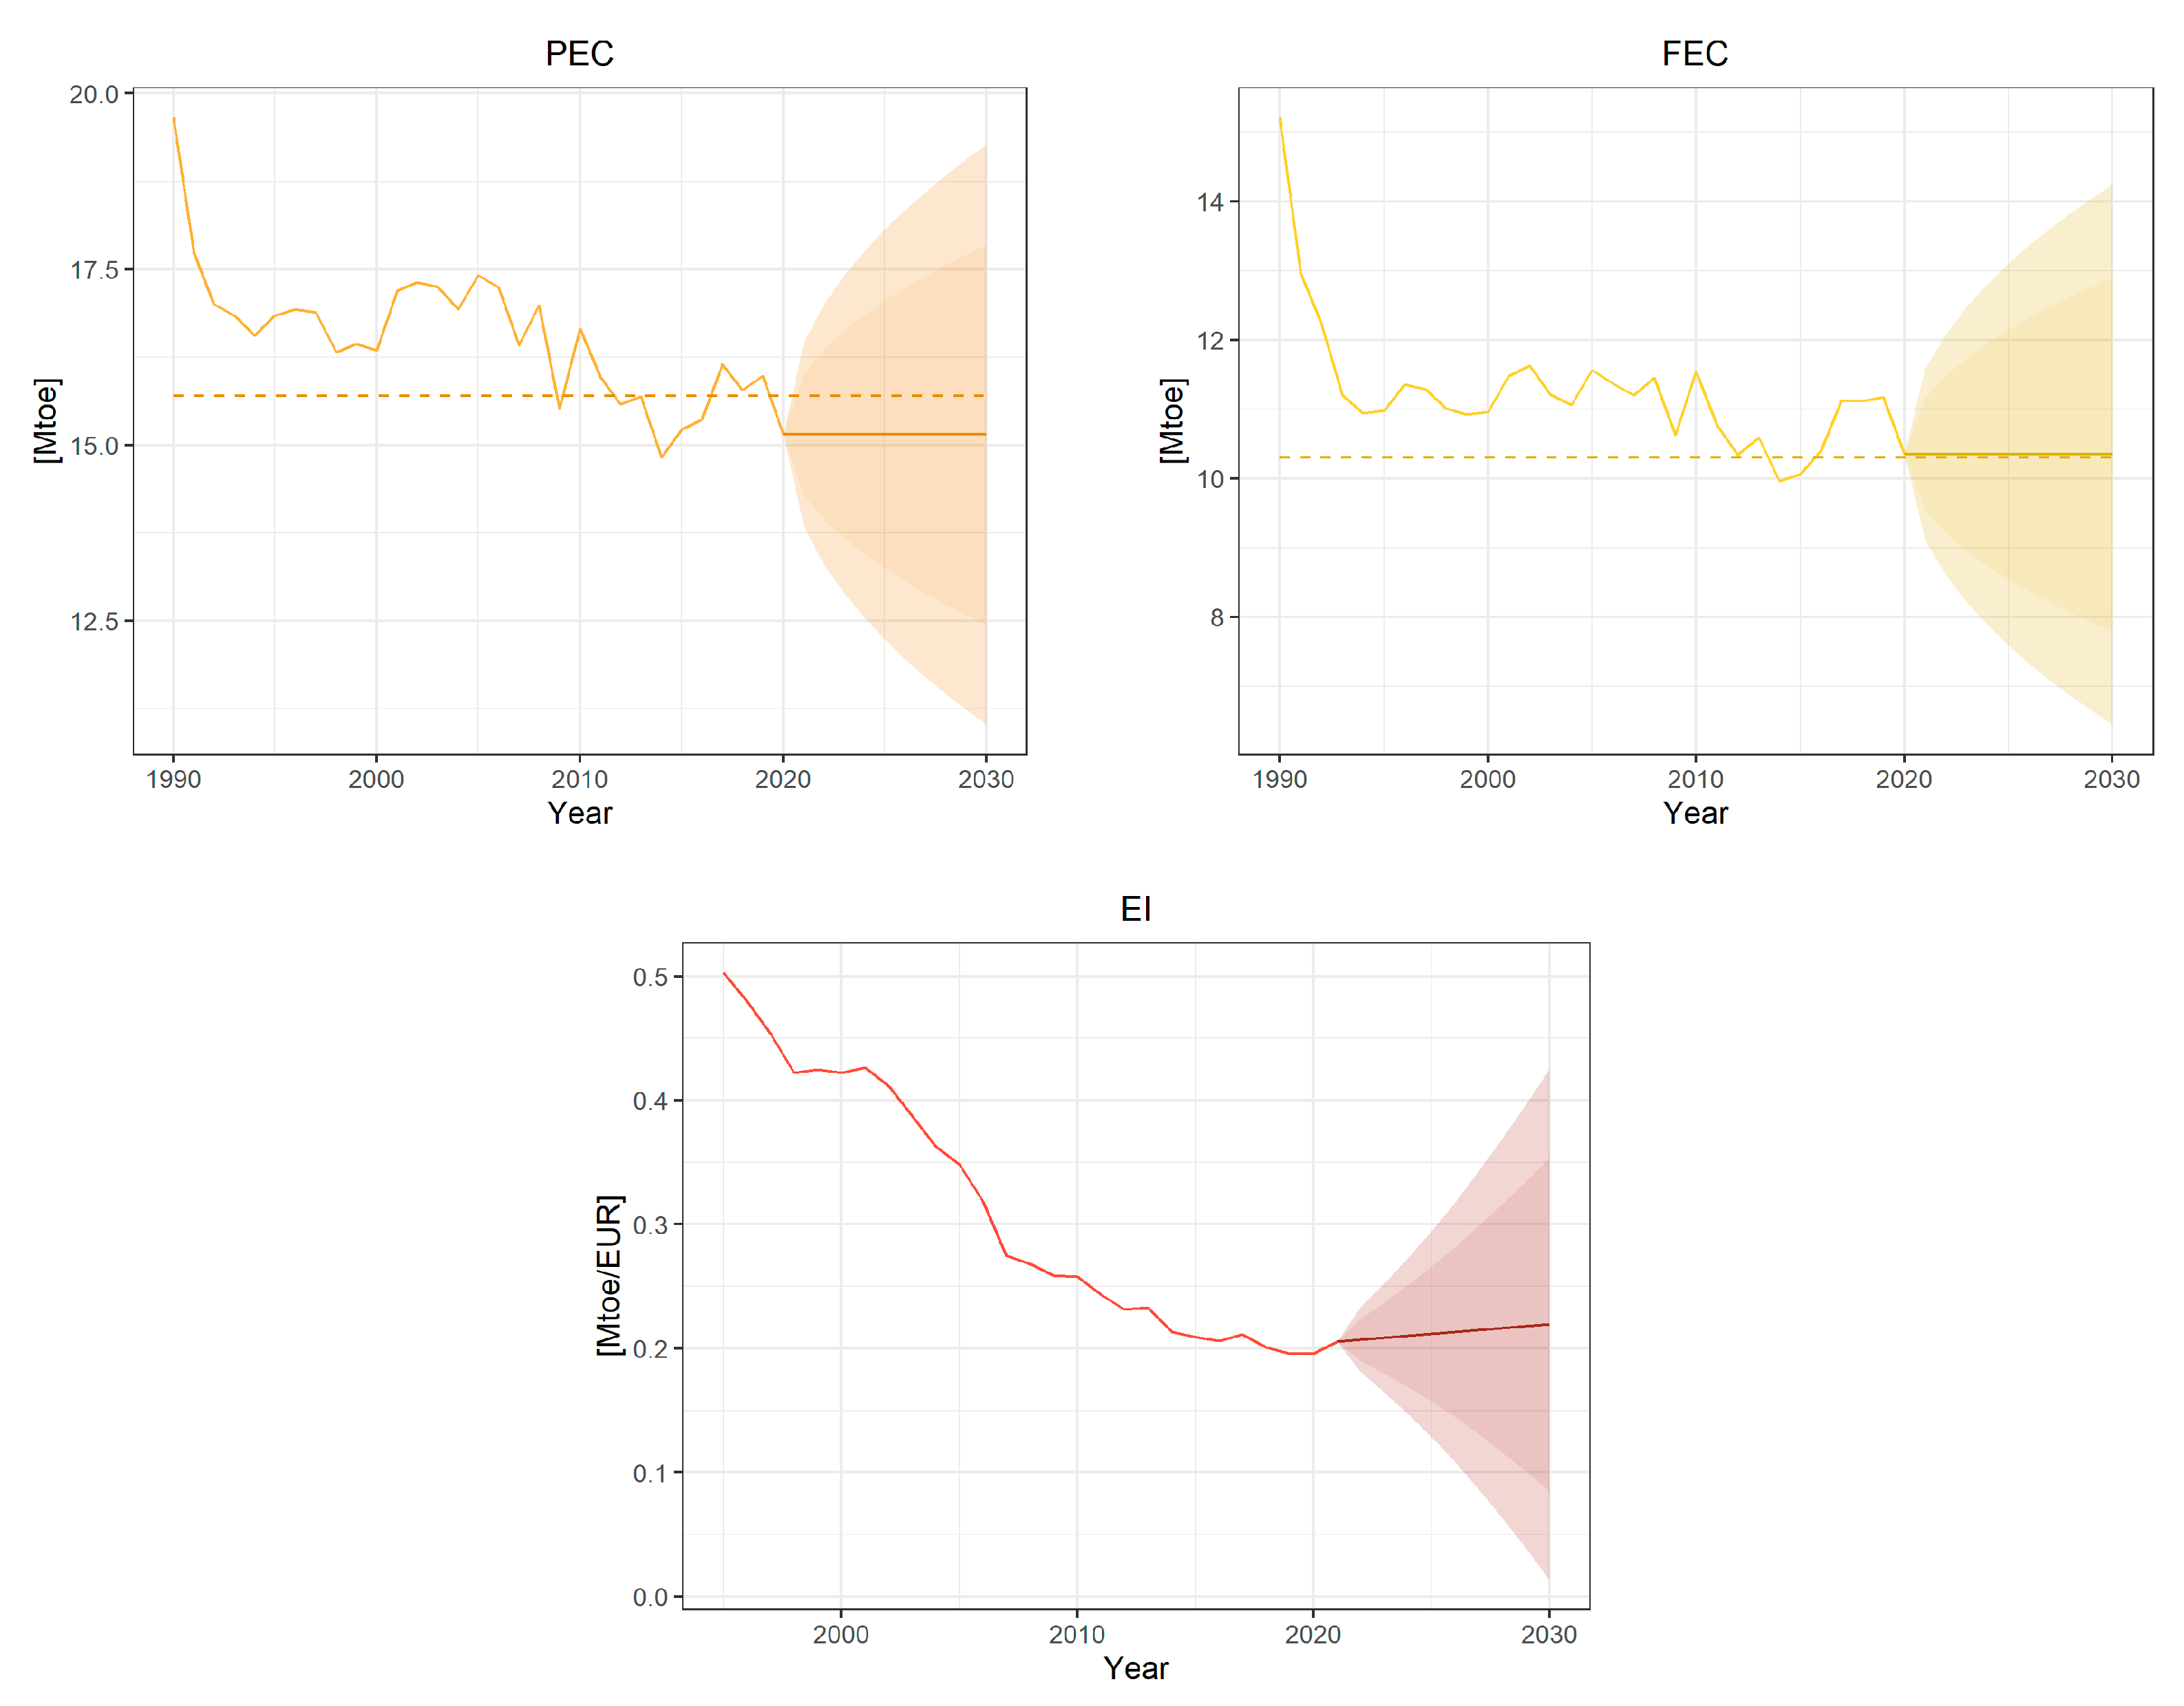
The figures depict shaded areas above and below forecast lines, which are confidence intervals (Lo-Hi) representing the range within the forecast value will lie with a certain probability. For example, if the forecast confidence interval for the FEC (final energy consumption) in Hungary in 2030 has a Lo.95-Hi.95 percent between 15.45 and 19.70, then there is a 95% probability that the FEC will be at least 15.45 Mtoe and at most 19.70 Mtoe.

4. Results and Discussion

According to a report from [77], in 2021, the EU generated only 42% of the total energy available within its borders, while the remaining 58% was imported from other countries. The available energy mix within the EU is composed of five main sources, which include petroleum products (including crude oil) accounting for 35% of the mix, natural gas at 24%, renewable energy at 17%, nuclear energy at 13%, and solid fossil fuels at 12%. This is different from the primary energy production (PEP) in the EU, as shown in Table 3.
The energy production was made up of four sources: renewables and biofuels (40.9%), nuclear energy (31.3%), solid fossil fuels (15.3%), and natural gas (6.4%). In comparison of these data, it can be seen that the energy produced in the EU is greener and more neutral for the environment.
Every country in the EU has different sources of energy production; e.g., nuclear power dominates in France (75.3%) and Slovakia (58.3%), renewable energy dominates in Malta (100%), solid fuels dominate in Poland (69.9%), natural gas dominates in the Netherlands (62.9%), and crude oil dominates in Denmark (37.9%) [79]. This different energy mix means that EU climate and energy targets are averages of different national targets. In Figure 2, one of the most important problems to solve on the way to green energy in the EU—coal phase-out commitments—is presented.
It is apparent that each of the V4 countries has different energy policies about coal. Poland does not plan to phase out of coal; the Czech Republic is working on it, but has not specified the date of completion; Hungary wants to phase out in 2030; and Slovakia is planning to carry out the same in 2023. These problems arise from political issues and the dependence of some countries on coal.
Analysis and discussions were conducted for each Visegrad member country separately due to their national targets, energy specifications, levels of gas emissions, etc. All of the goals of the 2030 EU strategy were analyzed, along with energy intensity, which describes levels of economic development.
It is important to know the time series accessible for analyzed topics based on yearly data. The length and variability of the time series can significantly impact the accuracy of long-term forecasting. This concern has been echoed by several scientific articles. As noted in one study [80], even short-term forecasts can be affected by unpredictable events such as natural disasters or political instability. In another study [81], the authors showed that unexpected events and changes in economic and social policies can significantly affect energy demand and supply patterns. Petropoulos et al. [82] argued that forecasting methods that rely on historical trends may not accurately predict future values. Similarly, a study by Fortes et al. [83] suggested that long-term energy scenarios should incorporate uncertainties and risks associated with socioeconomic and policy changes.
Therefore, while the forecasts presented in this article offer insight into the most probable scenarios, it is crucial to recognize their inherent limitations. As discussed in the relevant research literature [84,85,86,87], forecasting models can only provide a range of possible outcomes, and their accuracy may decrease as the forecasting horizon lengthens. To address this limitation, confidence intervals are presented in order to indicate the range within which the forecast value would likely fall with a certain probability.
In summary, while the forecasts presented in this article provide valuable insight into potential future energy trends, it is important to acknowledge their limitations and potential sources of error. Confidence intervals can offer a useful tool for understanding the potential range of outcomes and should be utilized in conjunction with any long-term forecasting analysis.

4.1. Czech Republic

As mentioned above, the Czech Republic does not have a plan to phase out energy based on coal in the near future. The reason for this is dependence on coal, as shown in Table 3. More than half of the PEP is made up of solid fossil fuels. At the same time, the second part of the primary energy production is based on clean energy (nuclear and renewables), which should be positively evaluated.
The Czech Republic has a national target to reduce greenhouse gas (GHG) emissions by −14% by 2030, but in the national long-term strategy, the goal of reducing GHGs is by −80% in 2050. To achieve these goals, the country has a plan to promote electromobility and sustainable transport [88] as well as to subsidize renovation of buildings [38].
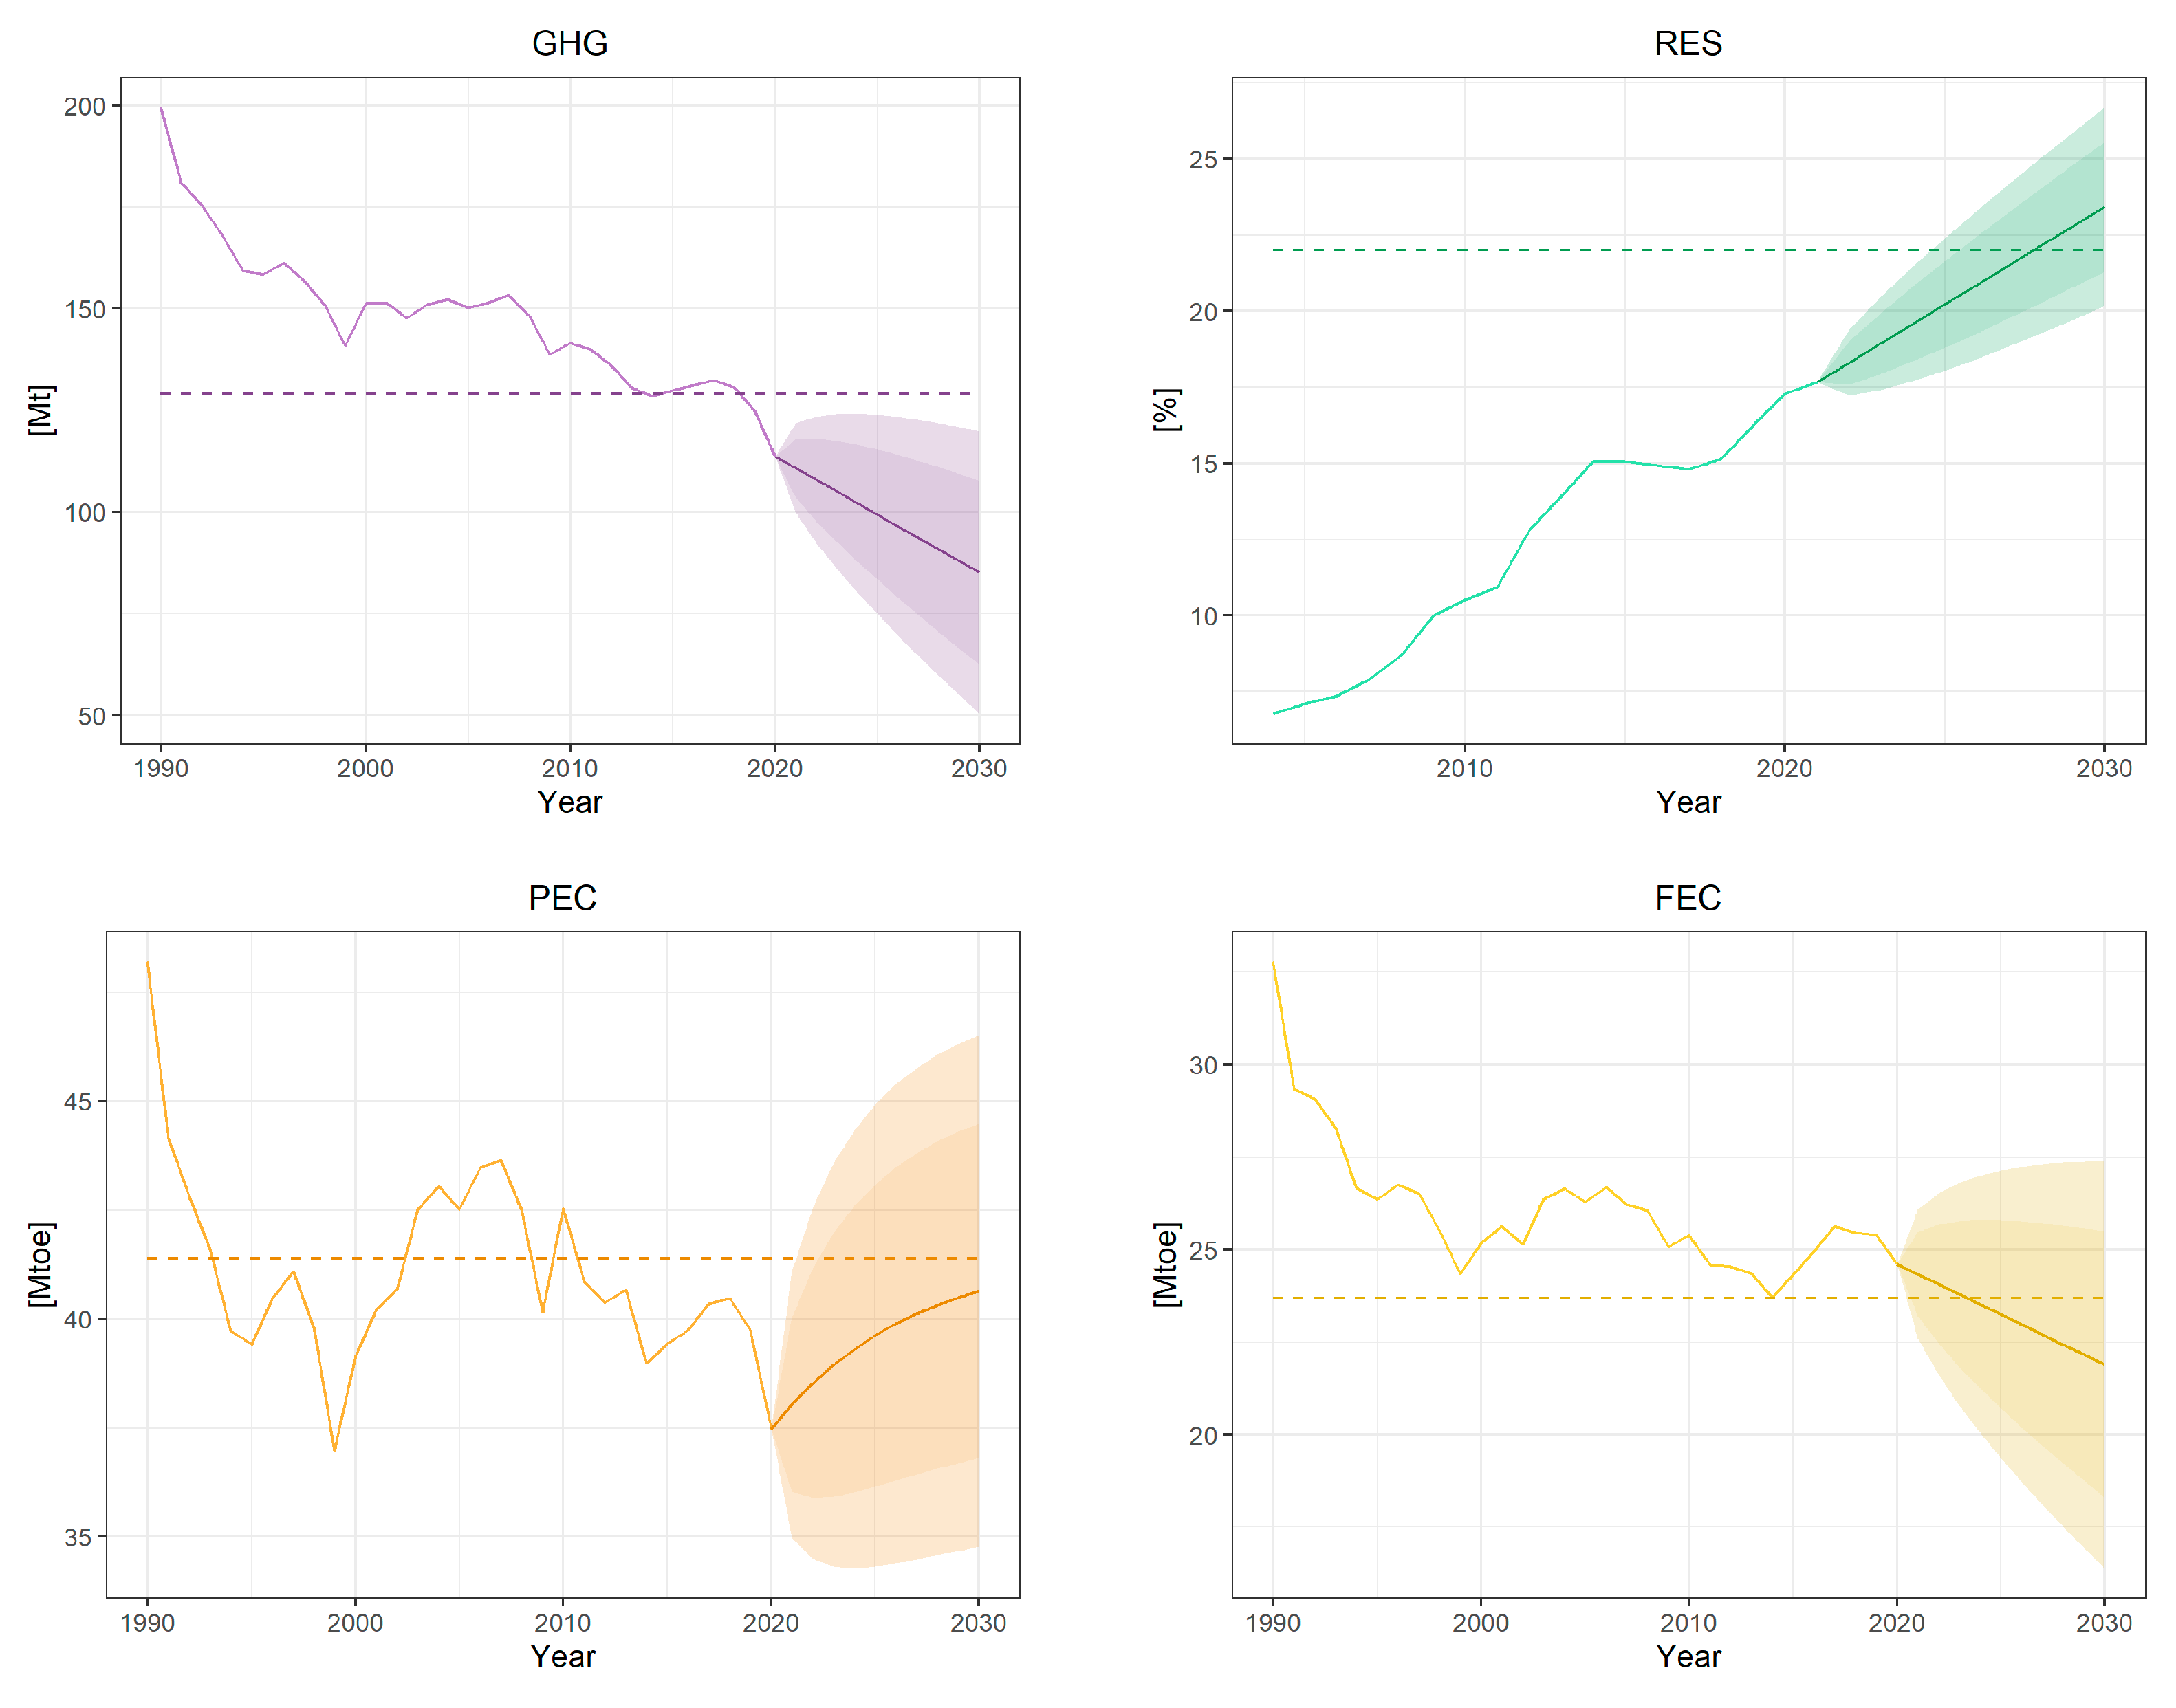
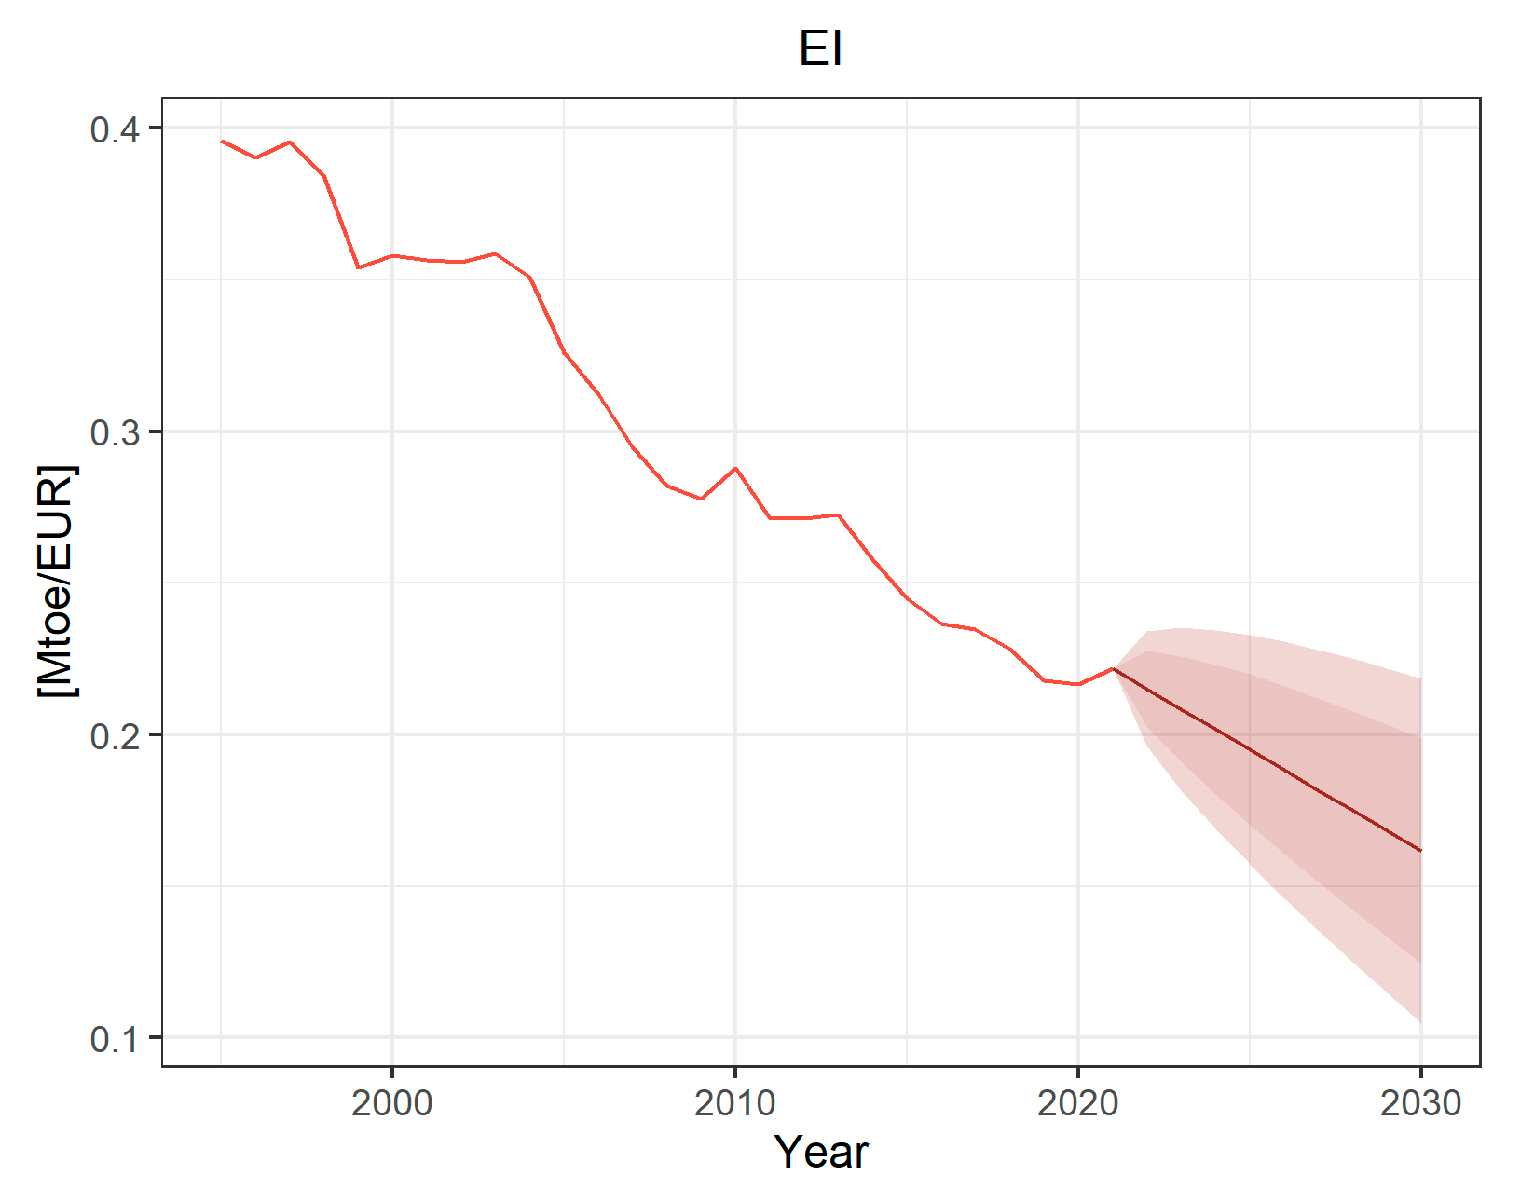
Based on the current forecasts (Figure 3), one can evaluate that the country is on track to meet these goals because the limits set to 2030 were already met in 2019 and a downward trend can be observed. Our previous paper on that matter [28] stated that the Czech Republic had achieved its renewable energy goals for 2020 by 2013 and predicted further increases in 2020. It can now be confirmed that our previous research conclusions were accurate and that the energy policy can be positively evaluated, with very probable targets expected to be achieved by 2030, as shown in Figure 3.
For the Czech Republic, achieving the goals for reducing the FEC (final energy consumption) and the PEC (primary energy consumption) appears to be difficult. Using recent data and new targets for 2030, one can see that the targets for the Czech Republic are below (for the PEC) or close to (for the FEC) the targets (Figure 3), but the variability of PEC and FEC causes difficulty in a definitive answer in the long term. Additionally, one might suspect that the decline in the PEC is the result of the COVID pandemic, not of government action. The forecast is on the borderline, and we think that it should be revised in the nearest future.
The last parameter, which was not mentioned in the 2030 strategy, is energy intensity (EI). It is important because it describes economic development. For the Czech Republic, the EI is gradually decreasing, which is a positive effect. The EI in 2030 will be much closer to the European average, which was 0.11 in 2021.
The energy policy and national targets of the Czech Republic are ambitious. Some risks to the PEC and the FEC are visible, but the government’s overall attitude to changes in the energy sector suggests these goals could be achieved by 2030.

4.2. Hungary

Hungary’s primary energy production is based mainly on nuclear and renewable sources (Table 3). It should be noted that nuclear energy is a zero-emission clean energy source, but it is usually considered to be another nonrenewable energy source because the material used in nuclear-power plants is not renewable. On 26 August 2022, the country granted a construction license for two new Russian-made VVER reactors at the Paks nuclear-power plant [89,90,91] so the small share of solid fossil fuels (7.3%) in the PEP could be easily reduced and Hungary’s plan to phase out coal in the next ten years would appear to be feasible.
The Hungary GHG target for 2030 is by −7% compared to 2005. This is the same as Poland’s target (in percentage) and the lowest among the V4 countries. The GHG goal for 2030 is fulfilled right now, and the forecast (Figure 4) confirms a decrease in GHGs in the future (still below limits). Renewable energy sources already account for 32.2% of the total energy output in Hungary, which has the second place among the V4 countries. However, as mentioned above, Hungary is not inclined toward development of renewable energy [92] but rather is focused on nuclear energy. This is also shown in Figure 4. In the last few years, there have been very small changes in RESs, so based on our analysis, it would be difficult to achieve RES goals set to 21%.
Hungary’s goals for energy efficiency (18.8 Mtoe for the final energy consumption and 30.7 Mtoe for the primary energy consumption) in 2023 are below the pre-set limits. This means Hungary just needs to keep its current position to achieve its goals. The forecasts presented in Figure 4 only confirm that.
The energy intensity (EI) for Hungary is very similar to that of the Czech Republic: that is, around 0.21 in 2021, with a forecast of around 0.13 for 2030. Hungary does not have strong ambitions for any of the EU climate and energy targets. The goals for 2030 are worse than those for 2020 (see Table 1 and Table 2). The Hungarian government claims that more ambitious targets would be difficult to achieve under the economic and budgetary conditions that had prevailed at the time it submitted the plan. However, Hungary’s energy mix can be considered environmentally neutral and safe for the country, as nuclear-power generation is more predictable than renewables.

4.3. Poland

About 70% of primary energy production and approximately 75% of electricity generation in Poland is based on solid fossil fuels (Table 3). It has not only the highest value among the V4 countries but also the highest share in the entire EU. The numbers of coal and lignite mines, coal-fired power plants, and people employed in the related sectors mean that transformation of the energy sector cannot be easy or fast [93,94,95]. Poland does not have a plan to reduce the country’s dependence on coal and lignite.
The target of reducing GHGs for Poland in 2030 is by −7% compared to 2005. In percentage value, it is the same as in the case of Hungary, and it is the lowest among the V4 countries. In Figure 5, one can see a sideways trend in the GHGs, with a great reduction in 2020, but this could be an effect of the reduction in the PEC and the FEC (Figure 5) caused by the COVID-19 pandemic. The data for the following years would allow more precise forecasts to be made. Much depends on the Polish government, which does not want to phase out the coal part of the energy mix. If this does not change, it could be difficult to achieve the GHG goals by 2030.
In Poland, the target for the reaching share of renewable energy is set at 21–23%, subject to additional EU funding being granted to Poland, including for a just transition. Poland has ambitious plans to double its share of energy from renewable sources, but forecasts (Figure 5) and the country’s dependence on coal and lignite hamper these plans. In Poland, investments in renewable energy sources are developing rapidly despite regulatory barriers [3], so there is a place for the Polish government to change the energy policy and make some real effort to achieve its goals.
In terms of energy efficiency, Poland is similar to Hungary and does not have ambitious plans (91.3 Mtoe for the primary energy consumption and 67.1 Mtoe for the final energy consumption). In recent years, energy consumption in Poland has mainly grown (Figure 5), and it only decreased in 2020. It could be difficult to go below the PEC and FEC limits for 2030.
The energy intensity in Poland is declining, mainly due to an increase in the GDP rather than a decrease in gross inland energy consumption (GIEC). The forecast value for 2030 is similar to those for the Czech Republic and Hungary.
Poland is the EU’s most heavily fossil-fuel-dependent country. The effect of many years of neglect and lack of reforms in the Polish energy sector is high fees for CO2 emissions (ETS) [96], which resulted in one of the highest energy prices in Europe [97]. Due to its high dependence on coal, Poland did not agree to set ambitious goals. Despite the goals for 2030 being low, it will be difficult to achieve them.

4.4. Slovakia

Among the four V4 countries, Slovakia can boast the least problematic energy mix [98]. More than 58% of its primary energy is produced in nuclear-power plants. The level of renewable energy sources in the PEP is about 34%. In total, more than 90% of the primary energy produced in Slovakia is represented by clean energy (Table 3). This is not only the best result in the V4 countries but also in Europe. This puts the country in a comfortable position when it comes to the climate policy of the EU.
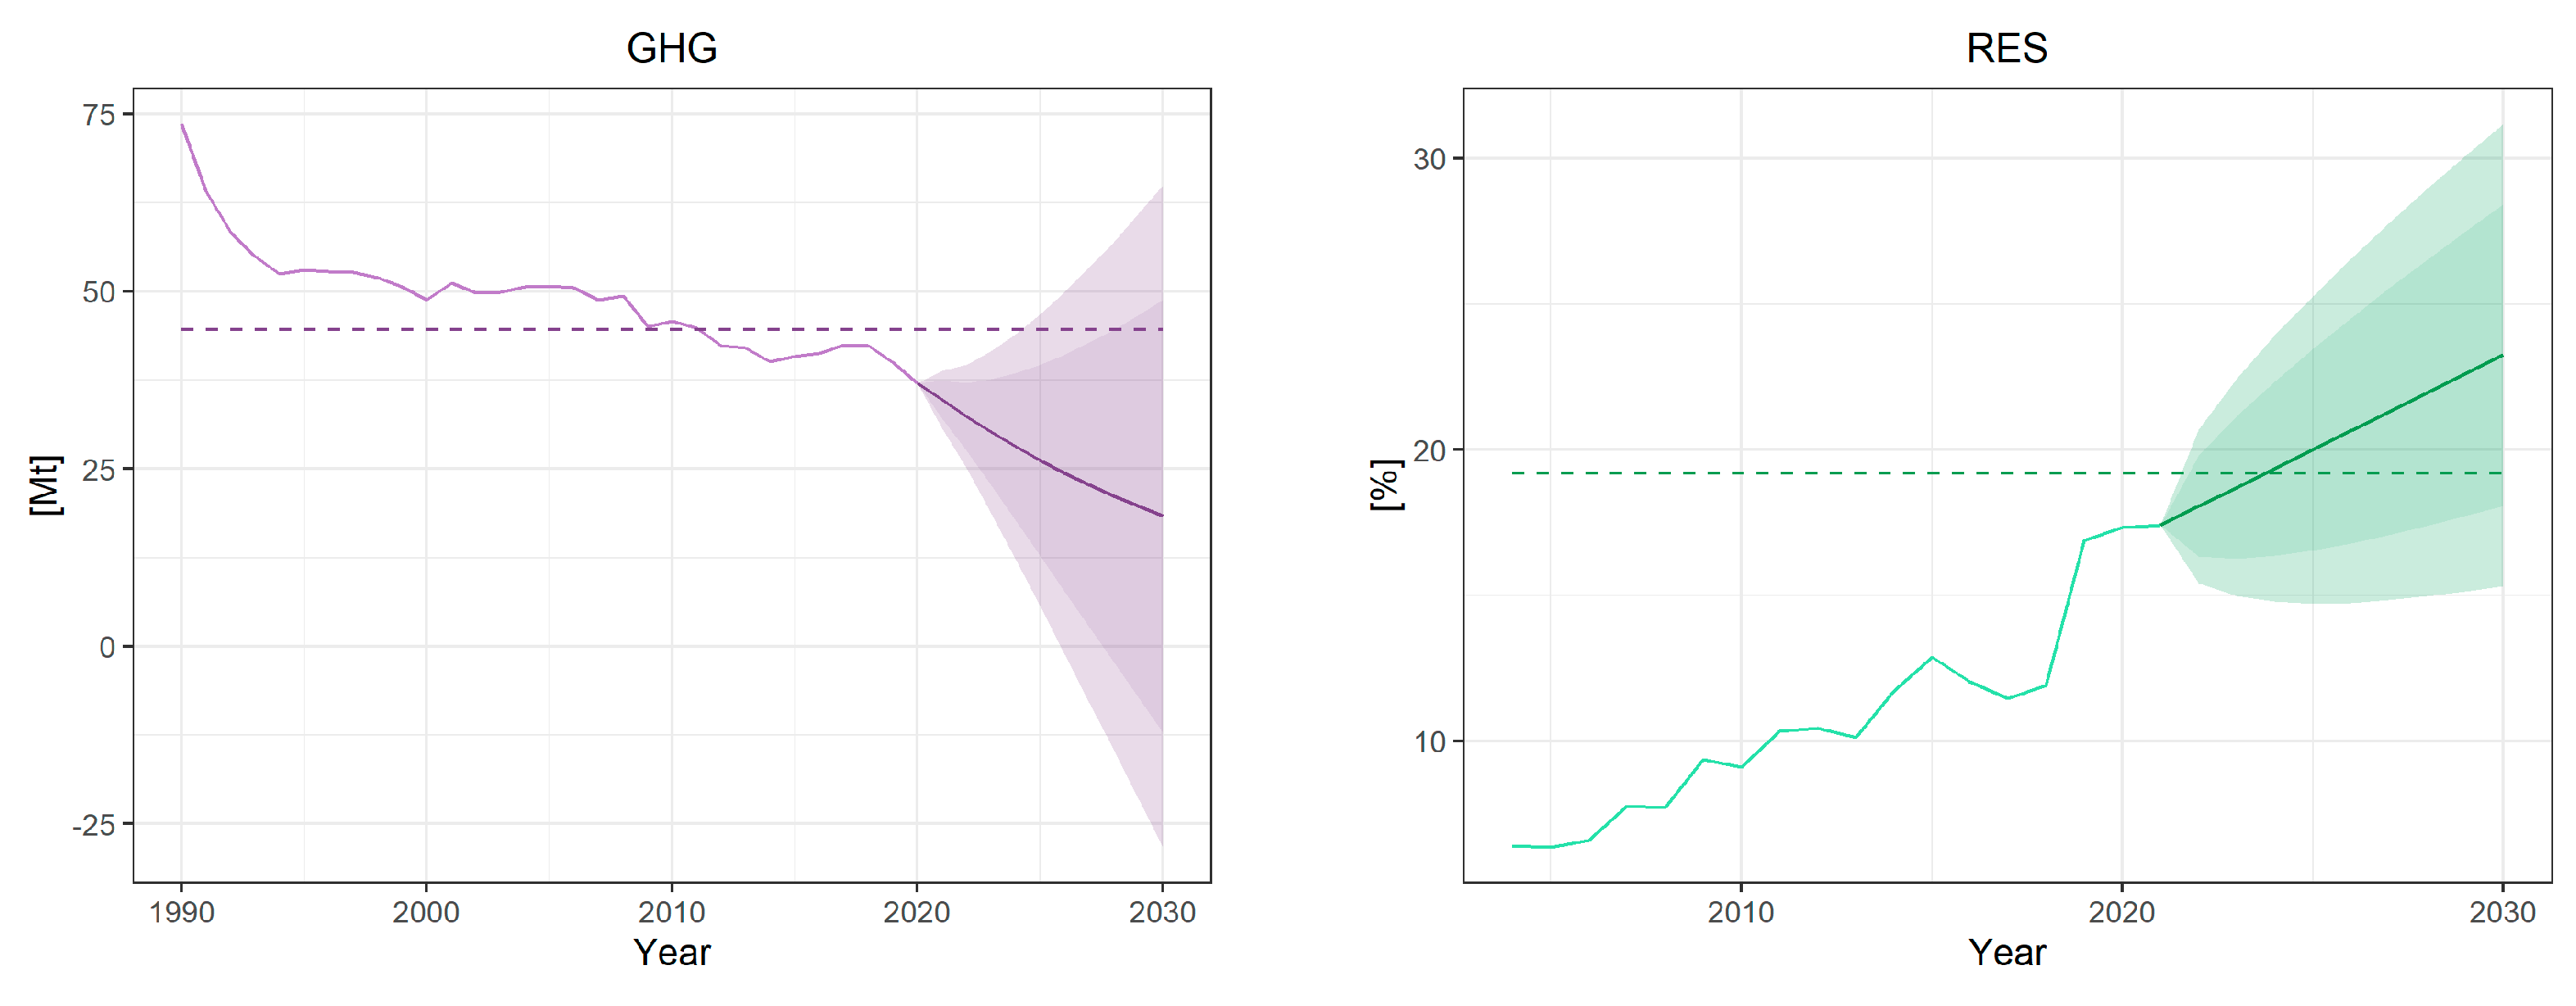
Slovakia’s national 2030 target for greenhouse gas emissions in sectors not covered by the EU Emissions Trading System (non-ETS) is by −20% compared to 2005, while the reduction target set in the Effort Sharing Regulation (ESR) is by −12% [38]. This was not ambitious, as the 2030 goals were achieved in 2011. Looking at the trend of the forecast for GHGs, it can be evaluated as very likely that the downward trend will continue, and therefore, the targets set for 2030 will be met. A similar forecast trend for Slovakia is presented in another article based on fossil-fuel consumption (correlated with GHGs) [99].
The European Commission assessed the Slovak goal to reach 19.2% of the renewables share in 2030 as unambitious, but accepted it nevertheless. The share of renewable energy sources (RESs) is growing (Figure 6), and the target for 2030 is low, so it will not be difficult for Slovakia to achieve this target.
Slovak energy efficiency targets for 2030 (15.7 Mtoe for the primary energy consumption and 10.3 Mtoe for the final energy consumption) are also low when it comes to ambition. The targets for the PEC and the FEC were set at safe levels for Slovakia and the probability of achieving these goals is about fifty/fifty (Figure 6).
The energy intensity in Slovakia has slowed down significantly in recent years, and forecasts indicate that it will stop at its current levels. Whether it would be possible to further reduce it depends not only on the GIEC but also on the GDP.
Slovakia is in the best situation among the V4 countries. In the energy mix, more than 90% of its energy is produced via clean energy sources. Its investment efforts for green transition are linked with phasing out coal mining and coal-fired electricity generation by 2023. This is the most ambitious plan among the V4 countries. It could be relatively easy because only about 4% of the PEP is dependent on solid fossil fuels. Despite this, Slovakia has negotiated very cautious climate targets, which were evaluated as unambitious, for 2030. The high probability of meeting these targets was also confirmed in the projections carried out.

5. Conclusions

Our study provided novel insights into the energy mix of the Visegrad Group countries and their progress toward meeting the EU’s climate targets. It becomes clear that the V4 countries which joined the European Union nineteen years ago were granted the easy access to the common market and subsidies. Nevertheless, this was also associated with certain obligations. In terms of energy, these obligations are commitments to reduce greenhouse gas emissions, increase shares of renewable energy, and improve energy efficiency. The latest agreements in the EU climate plan provide for improvement of these factors in the years 2021–2030. Due to the different energy mixes of the V4 countries, each of them had different goals.
Within the V4 group, Poland has the most problematic and polluting energy mix (red color in Table 4), while Slovakia has the best one, dominated by nuclear power (58.3%). Slovakia is also distinguished by the fact that 33.8% of its primary energy is produced from renewable sources: the highest value in the V4 countries (green color in Table 4).
Based on our results and empirical analyses, the following key conclusions can be drawn for each of the V4 countries:
  • The Czech Republic generates too much energy from fossil fuels, and its plans to increase the share of renewable energy are small (but still the largest among the V4 countries). Since these goals are low-set, they should be easy to achieve. The only problem may be reduction in the FEC by 2030.
  • Hungary’s energy mix is not bad, but the country has not set ambitious targets in its climate strategy for 2030; e.g., the targets for the PEC and the FEC for 2030 are worse than those for 2020. As far as Hungary wants to develop its nuclear energy, it may have a problem with achievement of an appropriate share of renewable energy.
  • Poland is heavily dependent on fossil fuels, which puts it in the worst situation among the V4 countries. The PEC and the FEC in Poland are growing instead of decreasing, and the share of renewable energy in the energy mix seems impossible to achieve by 2030. Huge amounts of greenhouse gases emitted by Poland could hamper the EU’s 55% greenhouse-gas reduction target in 2030.
  • Slovakia has 92% of its primary energy produced via nuclear and renewable sources, and it is in the best situation among the V4 countries. The country has a plan to phase out coal mining and coal-fired electricity generation by 2023. The 2030 climate targets negotiated by Slovakia are very cautious and are considered unambitious. Projections confirm that all targets should be achieved by 2030.
In the perspective of the next several years, each of the V4 countries (especially Poland) might need to change a lot in order to achieve the objectives they set for themselves. However, much depends on policies and the funds allocated for green transformation. Therefore, the projections presented of the EU climate package targets for 2030 may change. The implementation of the targets needs to be monitored and the prospects of achieving them periodically updated in order to take appropriate action.
Our findings are consistent with those of other studies that have analyzed the energy mixes and climate targets of the V4 countries. We can find different models and analyses of the same subject, but the common conclusions for the V4 countries would be to prioritize renewable energy and energy efficiency in order to reduce their carbon footprint [53,100,101,102].
Countries that would not be able to achieve the “Fit for 55” targets could face significant consequences, such as financial penalties for noncompliance, which could be substantial. Furthermore, failure to address climate change could have serious environmental and social impacts, including increased frequency and severity of natural disasters, food and water shortages, and public health crises. This could lead to social unrest and political instability, as citizens may hold their governments accountable for inaction or insufficient action on climate change [103,104,105].
Overall, our study highlighted the importance of setting ambitious targets for renewable energy and reducing greenhouse gas emissions. The transition to a more sustainable energy mix would require significant investment and effort, but it is essential for meeting the climate goals of the EU and creating a more sustainable future.

Author Contributions

Conceptualization, J.B.; methodology, J.B.; software, J.B., W.S. and A.Z.; validation, J.B., W.S. and A.Z.; formal analysis, J.B.; investigation, J.B.; resources, W.S. and A.Z.; data curation, J.B.; writing—original draft preparation, J.B., W.S. and A.Z.; writing—review and editing, J.B., W.S. and A.Z.; visualization, J.B.; supervision, J.B.; project administration, J.B. and W.S.; funding acquisition, W.S. All authors have read and agreed to the published version of the manuscript.

Funding

This research received no external funding.

Data Availability Statement

The analyzes were prepared by the authors using their own R scripts and based on datasets [66,67,68,69,70,71].

Conflicts of Interest

The authors declare no conflict of interest.

References

  1. Marusiak, J.; Gyarfasova, O.; Krno, C.; Mészáros, A.; Štiblar, P.; Suska, P.; Veselý, C.; Wołek, D. Internal Cohesion of the Visegrad Group; Institute of Political Science, Slovak Academy of Sciences - VEDA, Publishing House of the Slovak Academy of Sciences: Bratislava, Slovakia, 2013; ISBN 978-80-224-1329-9. [Google Scholar]
  2. Kořan, M. The Visegrad Group on the Threshold of Its Third Decade: A Central European Hub? In Regional and International Relations of Central Europe; Palgrave Macmillan: London, UK, 2012; pp. 201–218. ISBN 978-1-349-34805-3. [Google Scholar]
  3. Sulich, A.; Sołoducho-Pelc, L. Renewable Energy Producers’ Strategies in the Visegrád Group Countries. Energies 2021, 14, 3048. [Google Scholar] [CrossRef]
  4. Wach, K.; Głodowska, A.; Maciejewski, M.; Sieja, M. Europeanization Processes of the EU Energy Policy in Visegrad Countries in the Years 2005–2018. Energies 2021, 14, 1802. [Google Scholar] [CrossRef]
  5. Schmidt, A. Friends Forever? The Role of the Visegrad Group and European Integration. Politics Cent. Eur. 2016, 12, 113–140. [Google Scholar] [CrossRef] [Green Version]
  6. Kazharski, A. The End of ‘Central Europe’? The Rise of the Radical Right and the Contestation of Identities in Slovakia and the Visegrad Four. Geopolitics 2018, 23, 754–780. [Google Scholar] [CrossRef]
  7. Strážay, T. Towards a Sustainable Visegrad: Some Reflections on the Future Role of Central Europe in the EU. In Understanding Central Europe; Routledge: New York, NY, USA, 2017; pp. 115–118. ISBN 1-315-15773-X. [Google Scholar]
  8. Deák, A.; Weiner, C. Hungary: Leveraging Political Influence. In The Russian Economic Grip on Central and Eastern Europe; Routledge Contemporary Russia and Eastern Europe Series; Routledge: Abingdon, NY, USA, 2019; pp. 136–150. [Google Scholar]
  9. Ruszel, M. The Significance of the Baltic Sea Region for Natural Gas Supplies to the V4 Countries. Energy Policy 2020, 146, 111786. [Google Scholar] [CrossRef]
  10. Rokicki, T.; Perkowska, A. Changes in Energy Supplies in the Countries of the Visegrad Group. Sustainability 2020, 12, 7916. [Google Scholar] [CrossRef]
  11. Haitas, D. Aspects of Hungary-Russia Energy Relations in the Context of European Union Law. Jura A Pecsi Tudegy. All.-Es Jogtud. Karanak Tud. Lapja 2018, 2, 368. [Google Scholar]
  12. Szabo, J.; Fabok, M. Infrastructures and State-Building: Comparing the Energy Politics of the European Commission with the Governments of Hungary and Poland. Energy Policy 2020, 138, 111253. [Google Scholar] [CrossRef]
  13. Siddi, M. Theorising Conflict and Cooperation in EU-Russia Energy Relations: Ideas, Identities and Material Factors in the Nord Stream 2 Debate. East Eur. Politics 2020, 36, 544–563. [Google Scholar] [CrossRef]
  14. Tichý, L.; Dubský, Z. Russian Energy Discourse on the V4 Countries. Energy Policy 2020, 137, 111128. [Google Scholar] [CrossRef]
  15. Walsch, C. Visegrad Four in the European Union. An Efficient Regional Cooperation Scheme? Int. Issues Slovak Foreign Policy Aff. 2014, 23, 25–41. [Google Scholar]
  16. European Commission 2020 Climate & Energy Package. Available online: https://ec.europa.eu/clima/policies/strategies/2020_en (accessed on 17 January 2023).
  17. European Commission 2030 Climate Target Plan. Available online: https://ec.europa.eu/clima/policies/eu-climate-action/2030_ctp_en (accessed on 17 January 2023).
  18. Ghiani, E.; Galici, M.; Mureddu, M.; Pilo, F. Impact on Electricity Consumption and Market Pricing of Energy and Ancillary Services during Pandemic of COVID-19 in Italy. Energies 2020, 13, 3357. [Google Scholar] [CrossRef]
  19. Nagaj, R.; Korpysa, J. Impact of COVID-19 on the Level of Energy Poverty in Poland. Energies 2020, 13, 4977. [Google Scholar] [CrossRef]
  20. Chapman, A.; Tsuji, T. Impacts of COVID-19 on a Transitioning Energy System, Society, and International Cooperation. Sustainability 2020, 12, 8232. [Google Scholar] [CrossRef]
  21. Polemis, M.; Soursou, S. Assessing the Impact of the COVID-19 Pandemic on the Greek Energy Firms: An Event Study Analysis. Energy Res. Lett. 2020, 1, 17238. [Google Scholar] [CrossRef]
  22. Bahmanyar, A.; Estebsari, A.; Ernst, D. The Impact of Different COVID-19 Containment Measures on Electricity Consumption in Europe. Energy Res. Soc. Sci. 2020, 68, 101683. [Google Scholar] [CrossRef] [PubMed]
  23. Siksnelyte-Butkiene, I. Combating Energy Poverty in the Face of the COVID-19 Pandemic and the Global Economic Uncertainty. Energies 2022, 15, 3649. [Google Scholar] [CrossRef]
  24. Kristóf, T. Sovereign Default Forecasting in the Era of the COVID-19 Crisis. JRFM 2021, 14, 494. [Google Scholar] [CrossRef]
  25. Klenert, D.; Funke, F.; Mattauch, L.; O’Callaghan, B. Five Lessons from COVID-19 for Advancing Climate Change Mitigation. Environ. Resour. Econ. 2020, 76, 751–778. [Google Scholar] [CrossRef]
  26. Chernysh, Y.; Roubík, H. International Collaboration in the Field of Environmental Protection: Trend Analysis and COVID-19 Implications. Sustainability 2020, 12, 10384. [Google Scholar] [CrossRef]
  27. Siksnelyte-Butkiene, I.; Karpavicius, T.; Streimikiene, D.; Balezentis, T. The Achievements of Climate Change and Energy Policy in the European Union. Energies 2022, 15, 5128. [Google Scholar] [CrossRef]
  28. Brożyna, J.; Strielkowski, W.; Fomina, A.; Nikitina, N. Renewable Energy and EU 2020 Target for Energy Efficiency in the Czech Republic and Slovakia. Energies 2020, 13, 965. [Google Scholar] [CrossRef] [Green Version]
  29. Conte, A.; Lecca, P.; Sakkas, S.; Salotti, S. The Territorial Economic Impact of COVID-19 in the EU. A RHOMOLO Analysis; Joint Research Centre (Seville site): Sevilla, Spain, 2020. [Google Scholar]
  30. Oncioiu, I.; Duca, I.; Postole, M.A.; Georgescu (Crețan), G.C.; Gherghina, R.; Grecu, R.-A. Transforming the COVID-19 Threat into an Opportunity: The Pandemic as a Stage to the Sustainable Economy. Sustainability 2021, 13, 2088. [Google Scholar] [CrossRef]
  31. Pinilla, J.; Barber, P.; Vallejo-Torres, L.; Rodríguez-Mireles, S.; López-Valcárcel, B.G.; Serra-Majem, L. The Economic Impact of the SARS-CoV-2 (COVID-19) Pandemic in Spain. Int. J. Environ. Res. Public Health 2021, 18, 4708. [Google Scholar] [CrossRef]
  32. Lahcen, B.; Brusselaers, J.; Vrancken, K.; Dams, Y.; Da Silva Paes, C.; Eyckmans, J.; Rousseau, S. Green Recovery Policies for the COVID-19 Crisis: Modelling the Impact on the Economy and Greenhouse Gas Emissions. Environ. Resour. Econ. 2020, 76, 731–750. [Google Scholar] [CrossRef] [PubMed]
  33. Hercegova, K. European Energy Crisis and the War in Ukraine. 10 October 2022. Available online: https://www.researchgate.net/publication/364339717_European_energy_crisis_and_the_war_in_Ukraine (accessed on 6 February 2023).
  34. Liao, S. The Russia-Ukraine Outbreak and the Value of Renewable Energy. Econ. Lett. 2023, 225, 111045. [Google Scholar] [CrossRef]
  35. Nerlinger, M.; Utz, S. The Impact of the Russia-Ukraine Conflict on Energy Firms: A Capital Market Perspective. Financ. Res. Lett. 2022, 50, 103243. [Google Scholar] [CrossRef]
  36. Zhou, X.-Y.; Lu, G.; Xu, Z.; Yan, X.; Khu, S.-T.; Yang, J.; Zhao, J. Influence of Russia-Ukraine War on the Global Energy and Food Security. Resour. Conserv. Recycl. 2023, 188, 106657. [Google Scholar] [CrossRef]
  37. Chen, Y.; Jiang, J.; Wang, L.; Wang, R. Impact Assessment of Energy Sanctions in Geo-Conflict: Russian–Ukrainian War. Energy Rep. 2023, 9, 3082–3095. [Google Scholar] [CrossRef]
  38. European Commission National Energy and Climate Plans. EU Countries’ 10-Year National Energy and Climate Plans for 2021–2030. Available online: https://ec.europa.eu/info/energy-climate-change-environment/implementation-eu-countries/energy-and-climate-governance-and-reporting/national-energy-and-climate-plans_en (accessed on 18 January 2023).
  39. European Commission Effort Sharing 2021–2030: Targets and Flexibilities. Available online: https://ec.europa.eu/clima/policies/effort/regulation_en (accessed on 22 January 2023).
  40. European Commission REGULATION (EU) 2018/842 of the European Parliament and of the Council. Available online: https://eur-lex.europa.eu/legal-content/EN/TXT/HTML/?uri=CELEX:32018R0842&from=EN (accessed on 10 January 2023).
  41. Bhattacharya, M.; Paramati, S.R.; Ozturk, I.; Bhattacharya, S. The Effect of Renewable Energy Consumption on Economic Growth: Evidence from Top 38 Countries. Appl. Energy 2016, 162, 733–741. [Google Scholar] [CrossRef]
  42. Li, Y.; Nan, F.; Nan, F. Relationship between Energy Consumption and Economic Growth: Empirical Study Based on Data on Hebei Province from 1980 to 2008. Syst. Eng. Procedia 2011, 1, 117–123. [Google Scholar] [CrossRef] [Green Version]
  43. Ntanos, S.; Skordoulis, M.; Kyriakopoulos, G.; Arabatzis, G.; Chalikias, M.; Galatsidas, S.; Batzios, A.; Katsarou, A. Renewable Energy and Economic Growth: Evidence from European Countries. Sustainability 2018, 10, 2626. [Google Scholar] [CrossRef] [Green Version]
  44. Acaravcı, A.; Ozturk, I. On the Relationship between Energy Consumption, CO2 Emissions and Economic Growth in Europe. Energy 2010, 35, 5412–5420. [Google Scholar] [CrossRef]
  45. Trainer, T. Can Europe Run on Renewable Energy? A Negative Case. Energy Policy 2013, 63, 845–850. [Google Scholar] [CrossRef]
  46. Moriarty, P.; Honnery, D. Can Renewable Energy Power the Future? Energy Policy 2016, 93, 3–7. [Google Scholar] [CrossRef]
  47. Moriarty, P.; Honnery, D. Feasibility of a 100% Global Renewable Energy System. Energies 2020, 13, 5543. [Google Scholar] [CrossRef]
  48. Nieto, J.; Carpintero, Ó.; Miguel, L.J.; de Blas, I. Macroeconomic Modelling under Energy Constraints: Global Low Carbon Transition Scenarios. Energy Policy 2020, 137, 111090. [Google Scholar] [CrossRef] [Green Version]
  49. Simionescu, M. The Nexus between Economic Developmentand Pollution in the European Union New Member States. The Role of Renewable Energy Consumption. Renew. Energy 2021, 179, 1767–1780. [Google Scholar] [CrossRef]
  50. Brożyna, J.; Mentel, G.; Ivanová, E.; Sorokin, G. Classification of Renewable Sources of Electricity in the Context of Sustainable Development of the New EU Member States. Energies 2019, 12, 2271. [Google Scholar] [CrossRef] [Green Version]
  51. Brożyna, J.; Mentel, G.; Szetela, B. Renewable Energy and Economic Development in the European Union. Acta Polytech. Hung. 2017, 14, 11–34. [Google Scholar] [CrossRef]
  52. Strielkowski, W.; Volkova, E.; Pushkareva, L.; Streimikiene, D. Innovative Policies for Energy Efficiency and the Use of Renewables in Households. Energies 2019, 12, 1392. [Google Scholar] [CrossRef] [Green Version]
  53. Kochanek, E. The Energy Transition in the Visegrad Group Countries. Energies 2021, 14, 2212. [Google Scholar] [CrossRef]
  54. Štreimikienė, D. Externalities of Power Generation in Visegrad Countries and Their Integration through Support of Renewables. Econ. Sociol. 2021, 14, 89–102. [Google Scholar] [CrossRef]
  55. Stefko, R.; Gavurova, B.; Kelemen, M.; Rigelsky, M.; Ivankova, V. Relationships between Renewable Energy and the Prevalence of Morbidity in the Countries of the European Union: A Panel Regression Approach. Int. J. Environ. Res. Public Health 2021, 18, 6548. [Google Scholar] [CrossRef] [PubMed]
  56. Streimikiene, D. Ranking of Baltic States on Progress towards the Main Energy Security Goals of European Energy Union Strategy. J. Int. Stud. 2020, 13, 24–37. [Google Scholar] [CrossRef]
  57. Stavytskyy, A.; Kharlamova, G.; Giedraitis, V.; Sumskis, V. Estimating the Interrelation between Energy Security and Macroeconomic Factors in European Countries. J. Int. Stud. 2018, 11, 217–238. [Google Scholar] [CrossRef]
  58. Dzikuć, M.; Wyrobek, J.; Popławski, Ł. Economic Determinants of Low-Carbon Development in the Visegrad Group Countries. Energies 2021, 14, 3823. [Google Scholar] [CrossRef]
  59. Kasperowicz, R.; Štreimikienė, D. Economic Growth and Energy Consumption: Comparative Analysis of V4 and the “Old” EU Countries. J. Int. Stud. 2016, 9, 181–194. [Google Scholar] [CrossRef]
  60. Simionescu, M.; Strielkowski, W.; Tvaronavičienė, M. Renewable Energy in Final Energy Consumption and Income in the EU-28 Countries. Energies 2020, 13, 2280. [Google Scholar] [CrossRef]
  61. Tvaronavičienė, M.; Prakapienė, D.; Garškaitė-Milvydienė, K.; Prakapas, R.; Nawrot, Ł. Energy Efficiency in the Long-Run in the Selected European Countries. Econ. Sociol. 2018, 11, 245–254. [Google Scholar] [CrossRef] [Green Version]
  62. Kacperska, E.; Łukasiewicz, K.; Pietrzak, P. Use of Renewable Energy Sources in the European Union and the Visegrad Group Countries—Results of Cluster Analysis. Energies 2021, 14, 5680. [Google Scholar] [CrossRef]
  63. Księżopolski, K.; Maśloch, G. Time Delay Approach to Renewable Energy in the Visegrad Group. Energies 2021, 14, 1928. [Google Scholar] [CrossRef]
  64. European Commission Communication from the Commission to the European Parliament, the Council, the European Economic and Social Committee and the Committee of the Regions Taking Stock of the Europe 2020 Strategy for Smart, Sustainable and Inclusive Growth. Available online: https://eur-lex.europa.eu/legal-content/EN/ALL/?uri=CELEX%3A52014DC0130 (accessed on 29 January 2023).
  65. 2030 Climate & Energy Framework. Available online: https://ec.europa.eu/clima/policies/strategies/2030_en (accessed on 31 January 2023).
  66. Greenhouse Gas Emissions by Source Sector (Source: EEA) (Env_air_gge). Available online: https://ec.europa.eu/eurostat/cache/metadata/en/env_air_gge_esms.htm (accessed on 2 February 2023).
  67. Share of Energy from Renewable Sources (Nrg_ind_share). Available online: https://ec.europa.eu/eurostat/cache/metadata/en/nrg_ind_share_esmsip2.htm (accessed on 2 February 2023).
  68. Primary Energy Consumption (T2020_33)—European Environment Agency. Available online: https://www.eea.europa.eu/data-and-maps/data/external/primary-energy-consumption-t2020_33 (accessed on 4 February 2023).
  69. Final Energy Consumption (T2020_34)—European Environment Agency. Available online: https://www.eea.europa.eu/data-and-maps/data/external/final-energy-consumption-t2020_34 (accessed on 4 February 2023).
  70. Energy Balances (Nrg_bal). Available online: https://ec.europa.eu/eurostat/cache/metadata/en/nrg_bal_esms.htm (accessed on 3 February 2023).
  71. Annual National Accounts (Nama10). Available online: https://ec.europa.eu/eurostat/cache/metadata/en/nama10_esms.htm (accessed on 3 February 2023).
  72. Box, G.E.P.; Jenkins, G.M.; Reinsel, G.C.; Ljung, G.M. Time Series Analysis: Forecasting and Control, 5th ed.; Wiley: Hoboken, NJ, USA, 2015; ISBN 978-1-118-67502-1. [Google Scholar]
  73. Asteriou, D.; Hall, S. ARIMA Models and the Box-Jenkins Methodology. In Applied Econometrics; Red Globe Press: London, UK, 2016; pp. 275–296. ISBN 978-1-137-41546-2. [Google Scholar]
  74. Lee, C.-M.; Ko, C.-N. Short-Term Load Forecasting Using Lifting Scheme and ARIMA Models. Expert Syst. Appl. 2011, 38, 5902–5911. [Google Scholar] [CrossRef]
  75. Moreira de Andrade, L.C.; Nunes da Silva, I. Very Short-Term Load Forecasting Based on ARIMA Model and Intelligent Systems. In Proceedings of the 2009 15th International Conference on Intelligent System Applications to Power Systems, Curitiba, Brazil, 8–12 November 2009; pp. 1–6. [Google Scholar]
  76. Brożyna, J. Energy Consumption and Greenhouse Gas Emissions against the Background of Polish Economic Growth. In Energy Transformation Towards Sustainability; Tvaronavičienė, M., Ślusarczyk, B., Eds.; Elsevier: Amsterdam, The Netherlands, 2020; pp. 51–70. ISBN 978-0-12-817688-7. [Google Scholar]
  77. Eurostat Shedding Light on Energy on the EU: Where Does Our Energy Come From? Available online: https://ec.europa.eu/eurostat/cache/infographs/energy/bloc-2a.html (accessed on 6 February 2023).
  78. Eurostat Energy Balances. Available online: https://ec.europa.eu/eurostat/web/energy/data/energy-balances (accessed on 6 February 2023).
  79. Eurostat Shedding Light on Energy on the EU: What Do We Produce in the EU? Available online: https://ec.europa.eu/eurostat/cache/infographs/energy/bloc-2b.html (accessed on 6 February 2023).
  80. Merz, B.; Kuhlicke, C.; Kunz, M.; Pittore, M.; Babeyko, A.; Bresch, D.N.; Domeisen, D.I.V.; Feser, F.; Koszalka, I.; Kreibich, H.; et al. Impact Forecasting to Support Emergency Management of Natural Hazards. Rev. Geophys. 2020, 58, e2020RG000704. [Google Scholar] [CrossRef]
  81. Zakeri, B.; Paulavets, K.; Barreto-Gomez, L.; Echeverri, L.G.; Pachauri, S.; Boza-Kiss, B.; Zimm, C.; Rogelj, J.; Creutzig, F.; Ürge-Vorsatz, D.; et al. Pandemic, War, and Global Energy Transitions. Energies 2022, 15, 6114. [Google Scholar] [CrossRef]
  82. Petropoulos, F.; Apiletti, D.; Assimakopoulos, V.; Babai, M.Z.; Barrow, D.K.; Ben Taieb, S.; Bergmeir, C.; Bessa, R.J.; Bijak, J.; Boylan, J.E.; et al. Forecasting: Theory and Practice. Int. J. Forecast. 2022, 38, 705–871. [Google Scholar] [CrossRef]
  83. Fortes, P.; Seixas, J.; Simões, S.; Cleto, J. Long Term Energy Scenarios under Uncertainty. In Proceedings of the 2008 5th International Conference on the European Electricity Market, Lisboa, Portugal, 28–30 May 2008; pp. 1–6. [Google Scholar]
  84. Armstrong, J.S. , Principles of Forecasting: A Handbook for Researchers and Practitioners; Armstrong, J.S., Ed.; International Series in Operations Research & Management Science; Springer: Boston, MA, USA, 2001; Volume 30, ISBN 978-0-7923-7401-5. [Google Scholar]
  85. Makridakis, S.; Spiliotis, E.; Assimakopoulos, V. Statistical and Machine Learning Forecasting Methods: Concerns and Ways Forward. PLoS ONE 2018, 13, e0194889. [Google Scholar] [CrossRef] [Green Version]
  86. Nti, I.K.; Teimeh, M.; Nyarko-Boateng, O.; Adekoya, A.F. Electricity Load Forecasting: A Systematic Review. J. Electr. Syst. Inf. Technol. 2020, 7, 13. [Google Scholar] [CrossRef]
  87. Paltsev, S. Energy Scenarios: The Value and Limits of Scenario Analysis. WIREs Energy Environ. 2017, 6, e242. [Google Scholar] [CrossRef] [Green Version]
  88. Połom, M. Diversification of policies for the development of electric public transport in the Czech Republic, Poland and Slovakia. Pr. Kom. Geogr. Komun. PTG 2022, 2022, 59–73. [Google Scholar] [CrossRef]
  89. Gärtner, I. Energy Supply Only with Renewables? Why Does Hungary Need to Extend Its Nuclear Power Capacity? J. Phys. Conf. Ser. 2021, 1929, 012078. [Google Scholar] [CrossRef]
  90. Bart, I.; Csernus, D.; Sáfián, F. Analysis of Climate-Energy Policies & Implementation in Hungary; National Society of Conservationists—Friends of the Earth Hungary: Budapest, Hungary, 2018. [Google Scholar]
  91. Than, K. Reuters Hungary Licenses Two New Reactors at Paks Nuclear Plant; Reuters: London, England, 2022. [Google Scholar]
  92. Antal, M. How the Regime Hampered a Transition to Renewable Electricity in Hungary. Environ. Innov. Soc. Transit. 2019, 33, 162–182. [Google Scholar] [CrossRef]
  93. Brauers, H.; Oei, P.-Y. The Political Economy of Coal in Poland: Drivers and Barriers for a Shift Away from Fossil Fuels. Energy Policy 2020, 144, 111621. [Google Scholar] [CrossRef]
  94. Pietrzak, M.B.; Igliński, B.; Kujawski, W.; Iwański, P. Energy Transition in Poland—Assessment of the Renewable Energy Sector. Energies 2021, 14, 2046. [Google Scholar] [CrossRef]
  95. Zimon, G.; Sobolewski, M.; Lew, G. An Influence of Group Purchasing Organizations on Financial Security of SMEs Operating in the Renewable Energy Sector—Case for Poland. Energies 2020, 13, 2926. [Google Scholar] [CrossRef]
  96. Zimakov, A. The EU ETS Top Ten Polluters List as a Policy Tool of Climate Action Organisations. Eur. J. Sustain. Dev. 2021, 10, 201. [Google Scholar] [CrossRef]
  97. Kasprzak, M. Poland’s Wholesale Electricity Prices Rise to the Highest in Europe; Ember: Westlake Village, CA, USA, 2020. [Google Scholar]
  98. Beer, M.; Rybár, R. Development Process of Energy Mix towards Neutral Carbon Future of the Slovak Republic: A Review. Processes 2021, 9, 1263. [Google Scholar] [CrossRef]
  99. Michalková, M.; Pobočíková, I. Time Series Analysis of Fossil Fuels Consumption in Slovakia by Arima Model. Acta Mech. Et Autom. 2023, 17, 35–43. [Google Scholar] [CrossRef]
  100. Riepl, T.; Zavarská, Z. Towards a Greener Visegrád Group: Progress and Challenges in the Context of the European Green Deal. Available online: https://wiiw.ac.at/towards-a-greener-visegrad-group-progress-and-challenges-in-the-context-of-the-european-green-deal-dlp-6430.pdf (accessed on 5 March 2023).
  101. Tucki, K.; Krzywonos, M.; Orynycz, O.; Kupczyk, A.; Bączyk, A.; Wielewska, I. Analysis of the Possibility of Fulfilling the Paris Agreement by the Visegrad Group Countries. Sustainability 2021, 13, 8826. [Google Scholar] [CrossRef]
  102. Firlej, K.A.; Stanuch, M. Forecasting the Development of Renewable Energy Sources in the Visegrad Group Countries against the Background of the European Union. Int. Entrep. Rev. 2022, 8, 37–52. [Google Scholar] [CrossRef]
  103. Rietig, K.; Laing, T. Policy Stability in Climate Governance: The Case of the United Kingdom: Policy Stability in Climate Governance. Environ. Pol. Gov. 2017, 27, 575–587. [Google Scholar] [CrossRef]
  104. Khan, S.A.R.; Sharif, A.; Golpîra, H.; Kumar, A. A Green Ideology in Asian Emerging Economies: From Environmental Policy and Sustainable Development. Sustain. Dev. 2019, 27, 1063–1075. [Google Scholar] [CrossRef]
  105. Battiston, S.; Dafermos, Y.; Monasterolo, I. Climate Risks and Financial Stability. J. Financ. Stab. 2021, 54, 100867. [Google Scholar] [CrossRef]
Figure 1. The real GDP growth rate in the V4 countries and the European Union. Source: our own results.
Energies 16 02764 g001
Figure 2. Coal phase-out commitments according to National Energy and Climate Plans (NECPs). Source: [64].
Energies 16 02764 g002
Figure 3. Forecasts for the Czech Republic (source: our own results).
Energies 16 02764 g003aEnergies 16 02764 g003b
Figure 4. Forecasts for Hungary (source: our own results).
Energies 16 02764 g004
Figure 5. Forecasts for Poland (source: our own results).
Energies 16 02764 g005
Figure 6. Forecasts for Slovakia (source: our own results).
Energies 16 02764 g006aEnergies 16 02764 g006b
Table 1. National energy efficiency targets for the V4 countries and the EU27 for 2020.
EU Member StateGreenhouse Gas Emissions
[Mt]
Share of Renewable Energy *1
[%]
Primary Energy Consumption
[Mtoe]
Final Energy Consumption
[Mtoe]
Czech Republic163.71339.625.3
Hungary85.31324.114.4
Poland463.01596.471.6
Slovakia57.31416.49.0
EU3706201483.01086.0
Source: Our own study, based on [28,64]. Note: Mtoe—million tons of oil equivalent; *1—As part of the final energy consumption.
Table 2. National energy efficiency targets for the V4 countries and the EU27 for 2030.
EU Member StateGreenhouse Gas Emissions
[Mt]
Share of Renewable Energy *1
[%]
Primary Energy Consumption
[Mtoe]
Final Energy Consumption
[Mtoe]
Czech Republic129.22241.423.7
Hungary72.12130.718.8
Poland378.021 *291.367.1
Slovakia44.6 *319.215.710.3
EU2084.8321176.0885.0
Source: Our own study, based on [17,38,39,40,65]. Note: Mtoe—million tons of oil equivalent; *1 —As part of the final energy consumption; *2—With a 23% renewable energy target possible, subject to additional EU funding being granted to Poland, including for a just transition; *3—Slovakia’s national 2030 target for greenhouse gas emissions in sectors not covered by the EU Emissions Trading System (non-ETS) is −40.5 Mt, while the target set in the Effort Sharing Regulation (ESR) is −44.6 Mt.
Table 3. Primary energy production in the V4 countries and the EU27 in 2021 (source: our own results, based on [78]).
FuelCzech Republic
[%]
Hungary
[%]
Poland
[%]
Slovakia
[%]
EU27
[%]
Heat0.00.00.10.00.0
Natural Gas0.711.15.60.70.7
Nonrenewable Waste1.51.31.63.21.5
Nuclear Heat31.437.90.058.331.4
Oil and Petroleum Products0.410.21.50.10.4
Oil Shale and Oil Sands0.00.00.00.00.0
Peat and Peat Products0.00.00.00.00.0
Renewables and Biofuels23.132.221.333.823.1
Solid Fossil Fuels43.07.369.93.943.0
Table 4. The most important rates of the energy mixes of the V4 countries and the EU.
EU Member StateSolid Fossil Fuels, Oil, and Petroleum Products in Primary Energy Production [%]Renewables and Biofuels in Primary Energy Production [%]
Czech Republic43.423.1
Hungary17.532.2
Poland71.421.3
Slovakia4.033.8
EU18.440.9
Source: our own study.
Disclaimer/Publisher’s Note: The statements, opinions and data contained in all publications are solely those of the individual author(s) and contributor(s) and not of MDPI and/or the editor(s). MDPI and/or the editor(s) disclaim responsibility for any injury to people or property resulting from any ideas, methods, instructions or products referred to in the content.