Article

Workbench Study Concerning the Highest Reliability Outcome for PoL Converters with Different Output Capacitor Technologies

Basics of Electronics, Telecommunications and Information Technology Faculty, Technical University “Ghe. Asachi” of Iasi, 700050 Iasi, Romania
*
Author to whom correspondence should be addressed.
Energies 2023, 16(6), 2768; https://doi.org/10.3390/en16062768
Submission received: 6 February 2023 / Revised: 6 March 2023 / Accepted: 12 March 2023 / Published: 16 March 2023
(This article belongs to the Section F: Electrical Engineering)

Abstract

:
The last decade’s studies show that the PoL (point-of-load) converter’s output capacitor is an important component for reliability, implying that its careful selection may determine the overall converter’s failure rate and lifetime. PoL converters are commonly found in many electronic systems, usually as part of the Intermediate Bus Architecture (IBA). Their important requirements are a stable output voltage at load current variation, good temperature stability, a low output ripple voltage, high efficiency, and reliability. If the electronic system is portable, a small footprint and low volume are also important considerations. These were recently well accomplished with eGaN (enhancement gallium nitride) transistor technology, whose VUFoM (vertical unipolar figure of merit) is 1.48 compared to 1.00 for silicon. This ensures a higher converter power density (watts/area). This paper reviews the most-used capacitor technologies, highlighting the reliability of these components as part of the converter’s output filter by presenting original data related to their best performance. The test was set up with EPC’s eGaN FET transistor, which was enclosed within a 9059/30 V evaluation board with a 12 V input and 1.2 V output. Different output capacitor technologies were evaluated, and reliability was calculated based on measurements of the ripple of the output voltage and thermal scanning.

1. Introduction

Due to their rapid advancement in the last decades, processor device technologies have imposed considerable challenges on power supply designers related to their low voltage and high current buck converters [1,2]. As an example, a device with a 7 nm process and 4 GHz for the clock requires 1 V and about 140 W peak power to supply the core [1].
Due to the specifics of the digital load (CPUs, FPGAs, SoC, ASICs), the PoL converter must match the load requirements as closely as possible to ensure excellent efficiency, high reliability, and a small form factor. With its dual role as an energy reservoir at the output of the power converter while simultaneously smoothing the output voltage, the output capacitor bank in the PoL DC–DC converter is increasing in importance. Consequently, the selection of an output capacitor bank became a very important step in the design of switching converters [1].
The PoL synchronous buck converter was herein selected for experimental measurements because it is the most commonly used topology nowadays in the supply of microprocessors, FPGAs, ASICs, memory banks, and alike digital circuits within notebooks, laptops, telecom equipment, servers, and data storage systems. PoL converters are typically used with high output current demands, associated with low internal voltage buses.
There has lately been a solid trend of progressively replacing silicon components within power converters with GaN devices [3]. The applications range from industrial motor drives, automotive and transportation systems (including hybrid and electric vehicles), photovoltaic inverters, railways, and wind turbines, to digital power equipment.
Gallium nitride-WBG (wide band gap) devices are semiconductors that have bandgaps that are considerably wider than silicon: 3.4 eV versus 1.1 eV. These new power transistors are able to switch at higher frequencies with lower losses, and they are characterized [4] by a high thermal conductivity, low ON resistance, low parasitic capacitance, a very small footprint, a lack of a body diode (so no reverse-recovery loss), robustness in harsh environments, and high breakdown voltages.
The most frequently highlighted feature of eGaN-based PoL converters relates to their impressive reliability [3]. This pushes an accompanying research effort on output capacitor technologies featuring better reliability and smaller form factors. The association of eGaN transistors with modern capacitors enables more efficient and compact power converter designs while improving reliability [5,6].
This paper presents the comparative results of tests on six different capacitor technologies used in the output filter of DC–DC converters and is an extended version of a conference paper [7]. The comparison is carried out with respect to the reliability of the entire power supply and its association with eGaN-type transistors. After the problem is stated and explained in Section 1, Section 2 presents the current stage of capacitor technology, Section 3 introduces the calculation of reliability for PoL power converters and outlines the effect of capacitor technology, Section 4 presents the experimental setup used for tests, and Section 5 describes the experimental measurement results that are able to illustrate the thermal effects and the reliability implications. Finally, the conclusions are stated in Section 6.

2. General Aspects of Capacitor Technologies and Reliability

2.1. Capacitor Technologies

This paper investigates various capacitor technologies suitable for the output capacitor bank within eGaN-based PoL converters [8,9,10,11,12,13,14]. This comprehensive comparison addresses the following types of capacitors:
  • Aluminum electrolytic capacitors with non-solid electrolyte, can-type through hole mounting (radial).
  • Aluminum polymer can-type V-type SMD capacitors.
  • Polymer electrolytic multilayered capacitor in an SMD case.
  • Multi-layer ceramic (MLCC) in an SMD case.
  • Tantalum MnO2 in an SMD case.
  • Tantalum polymer capacitor in an SMD case.

2.2. Brief on the Reliability of Electronic Components

The reliability prediction for electronic components is commonly based on the Failure Rate λ which is assumed to have a quasi-constant value during the Lifetime (useful life) of the system. The Lifetime (useful life) [15] is defined with a bathtub curve, as seen in Figure 1.
The reliability of a component or system is defined in the following form:
R(t) = e−λt
Herein, λ signifies the intrinsic failure rate and is measured in F/106 h or FIT, excluding early failures and wear-out failures. The mean time between failures (MTBF, measured in hours) is the reversed value of the failure rate.
MTBF = λ−1
For any system, the failure rate is the sum of the failure rates of all components.
λsystem = λMOSFET + λcontrol + λdiode + λinductor + λoutput capacitor + λPCB+connectors
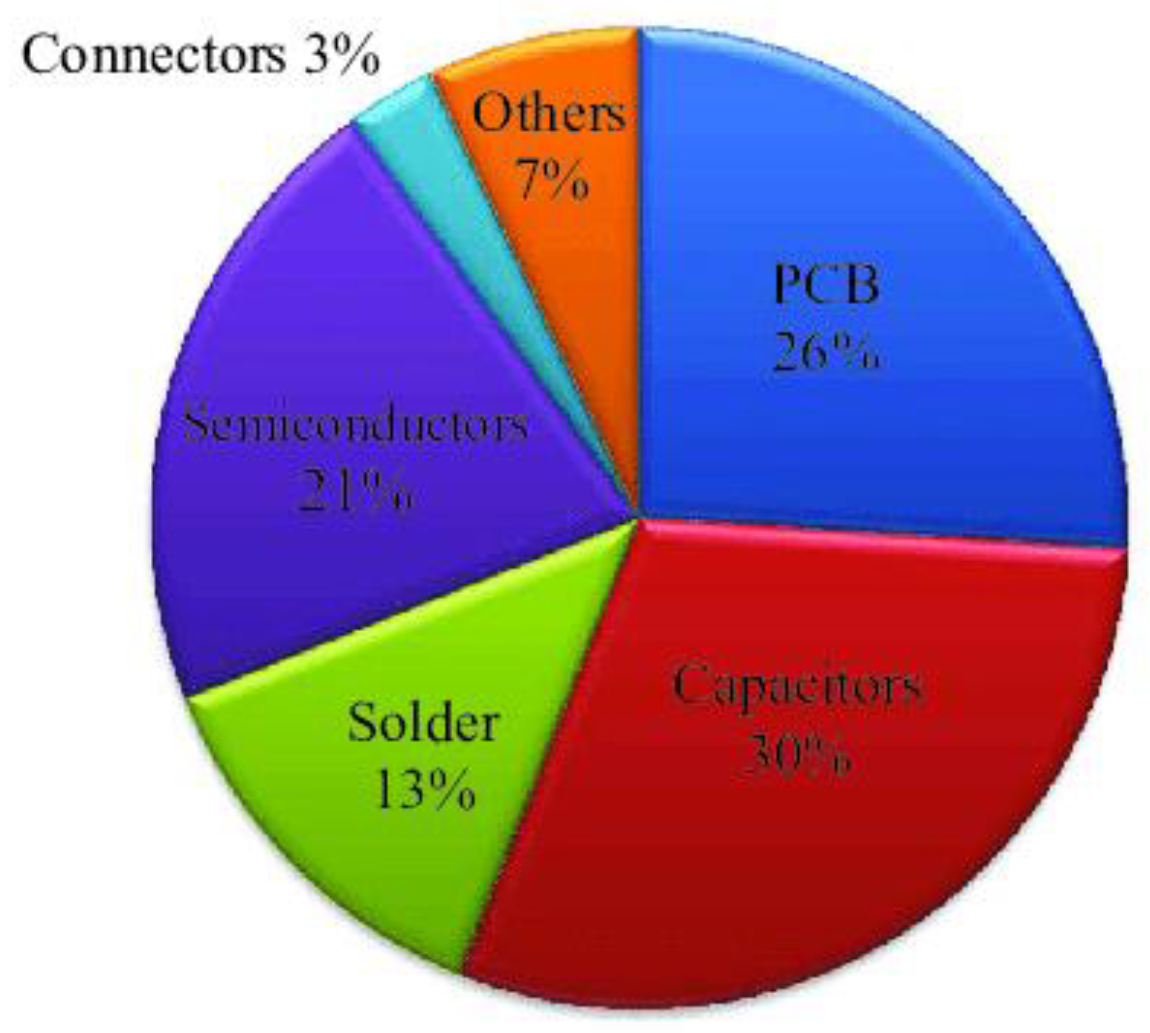
In the case of a point-of-load converter, as solely used in telecom and computer applications, the most important failure rate component comes from the output capacitor bank [16], as exemplified in Figure 2. Hence, it is very important to reduce the failure rate of the output capacitor bank with the introduction of new technologies.

3. The Reliability Standard Used in Paper and the Specifications for Capacitors

In 2004, the International Electrotechnical Commission released the IEC-TR-62380 standard [17]. This standard includes features of newer components such as polymer capacitors that do not appear in older standards such as MIL-HDBK-217 [18]. This section outlines the calculation of the failure rate λ and the MTBF (mean time between failures) based on the mathematical model for the capacitors provided in the IEC-TR-62380 standard. The other parameters used in the calculation correspond to the use of the capacitor as the output capacitor for a PoL buck converter.
Both the IEC-TR-62380 and MIL-HDBK-217 standards use reliability data derived mainly from the field data of electronic equipment operating in an environment defined as ground, stationary, and weather-protected. This means equipment for stationary use, on the ground, in weather-protected locations, operating permanently or otherwise with controlled temperature and humidity, and under the benefit of good maintenance. This category also applies to telecom equipment and computer hardware, which is the topic of eGaN-based PoL converters.
In addition to the environmental conditions, experience has shown that component reliability is similarly influenced by mechanical conditions. In this paper, reliability calculations have to be performed according to a mission profile [17,18,19,20,21,22].
A mission profile defines a table that includes all the details on the ambient temperature cycles during the lifetime of the device, on/off state durations, device loading, numbers of operation cycles, and so on [18,19,20,21,22].

3.1. The Mathematical Model Used by the IEC-TR-62380 Reliability Standard

Reliability is evaluated by the calculation of the failure rate of the capacitor. The mathematical model for the failure rate stated by the IEC-TR-62380 standard is defined as:
λ = α × i = 1 y π T i × τ i τ o n + τ o f f × π A + β × 10 3 × i = 1 j π n i × Δ T i 0.68 × 10 9 h
where the parameter πT has the following expression:
π T = e γ 1 δ 1 273 + T A
and in the case of aluminum electrolytic non-solid electrolyte capacitors, this becomes:
π T = e γ 1 δ 1 273 + T R
where TA is ambient temperature and TR is capacitor temperature.
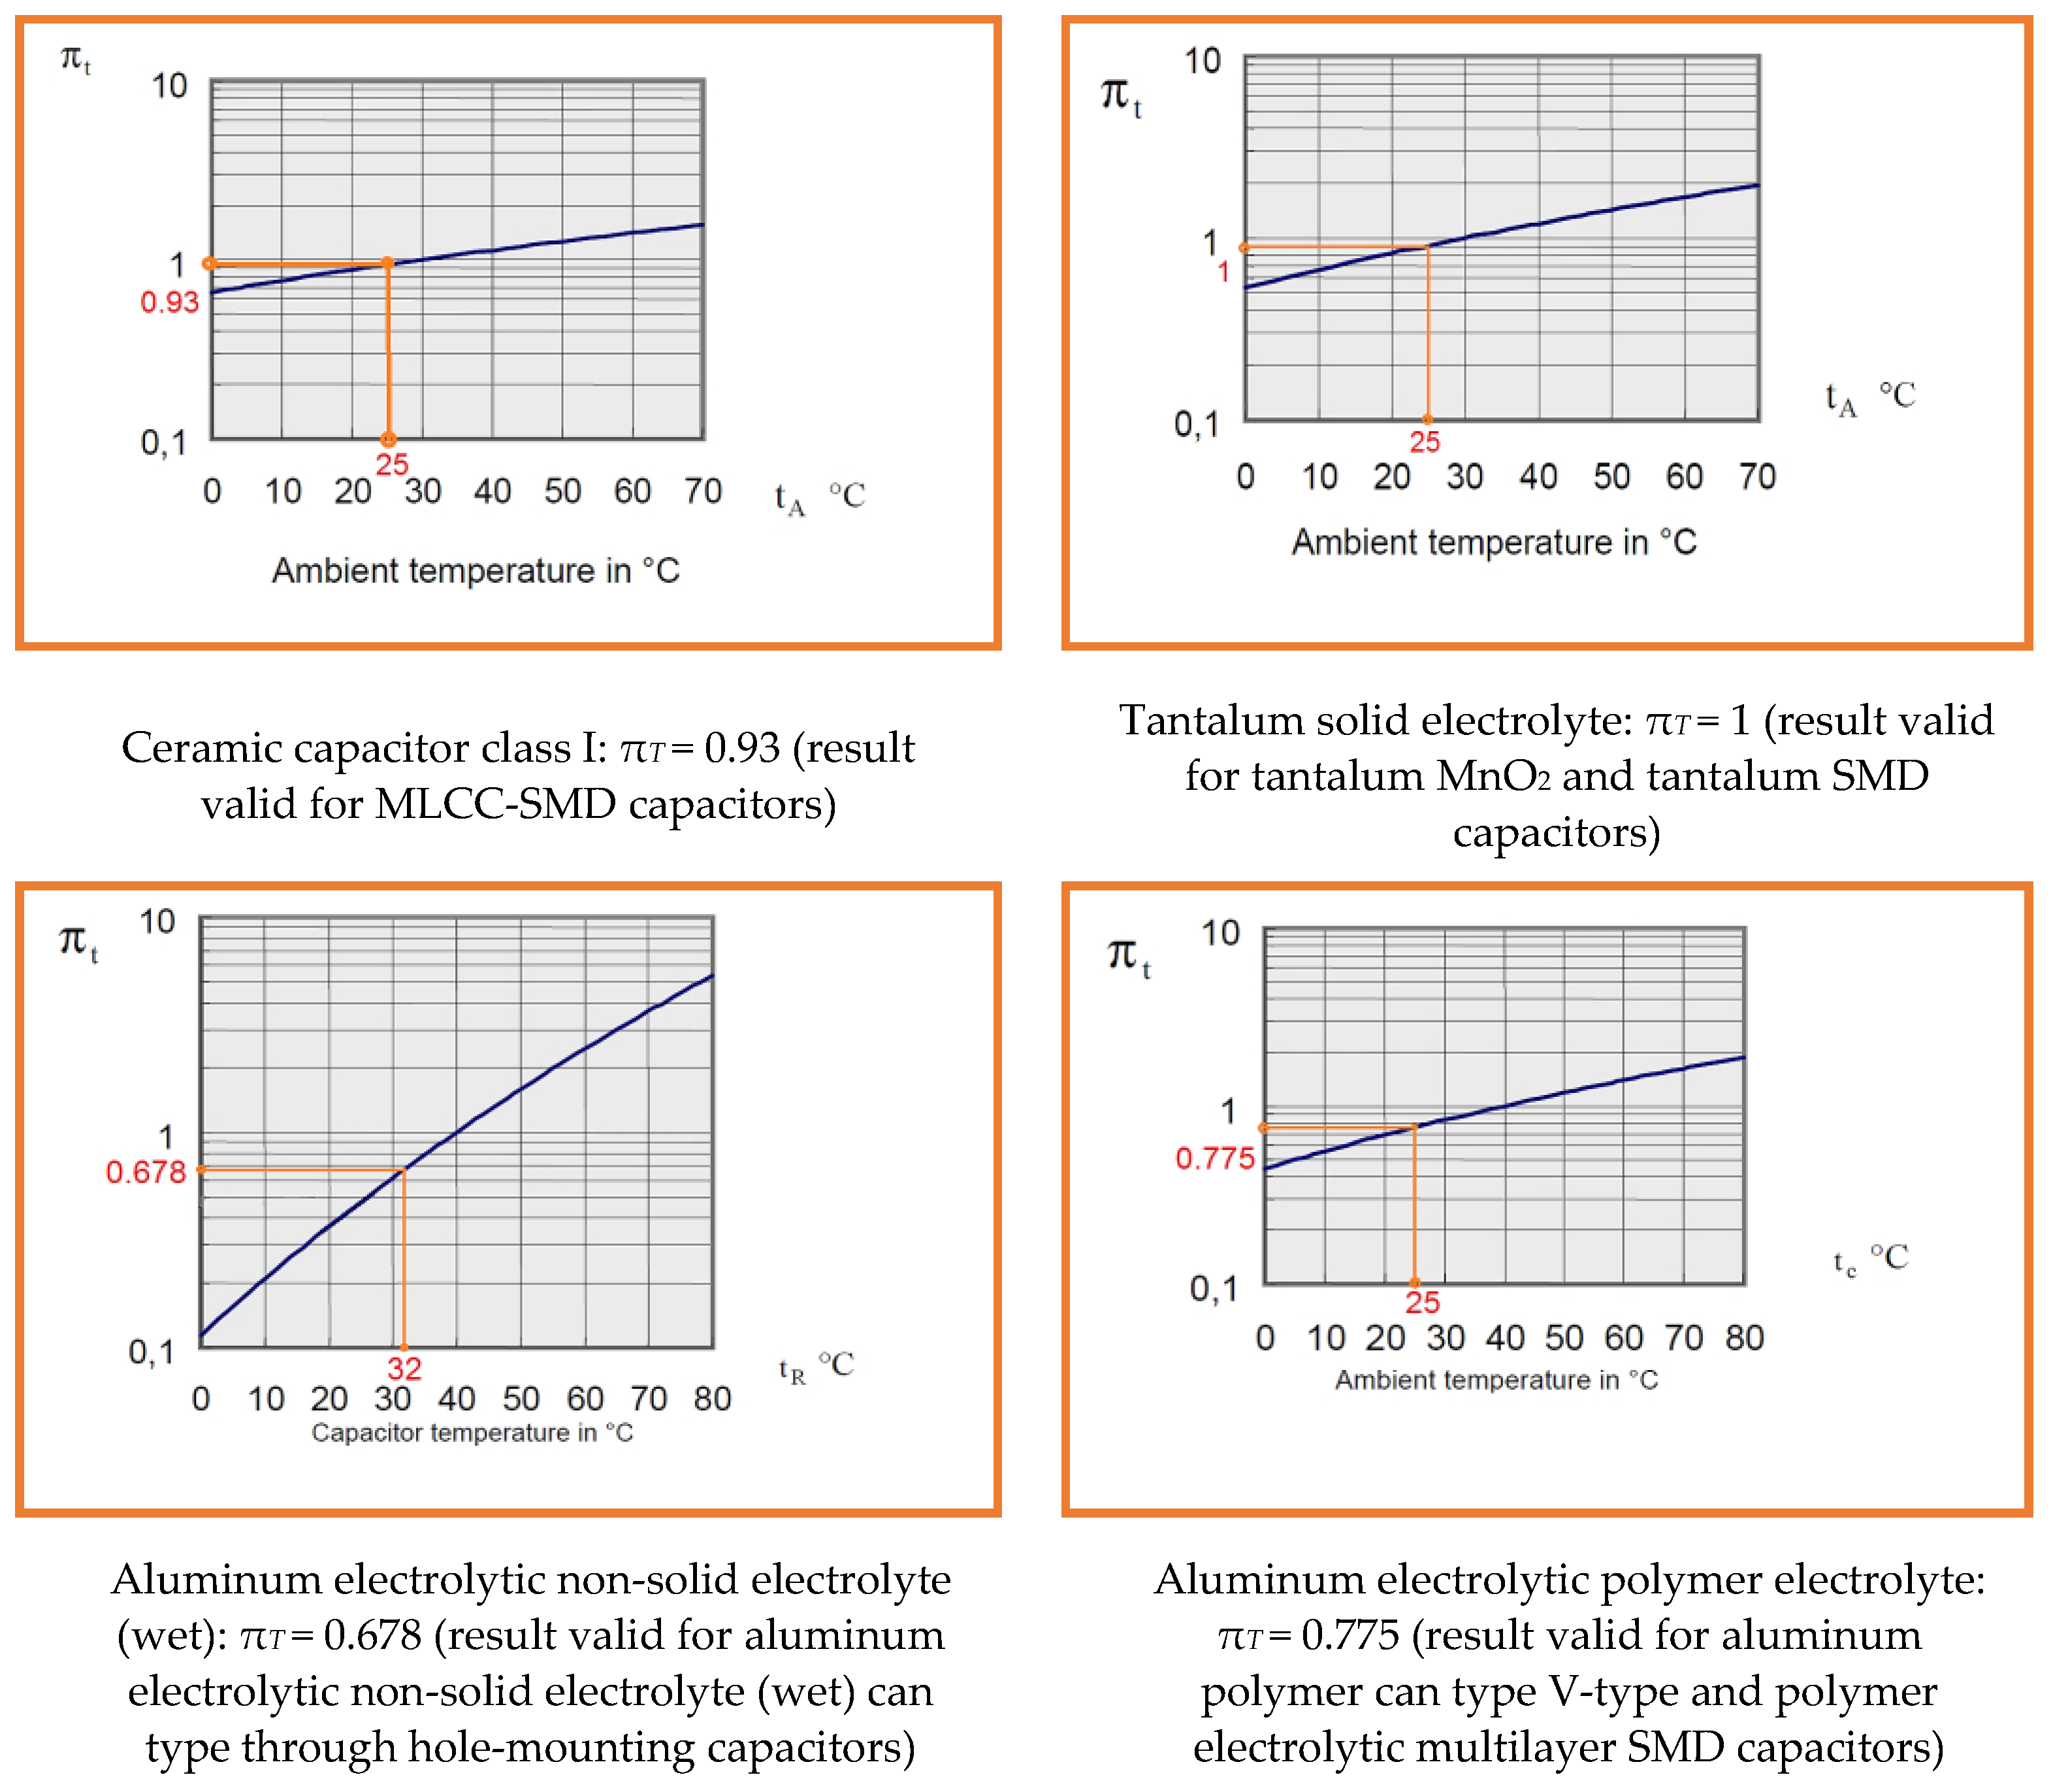
The terms within the model are meticulously explained in the IEC-TR-62380 standard. The temperature factor πT was derived for each capacitor type and is shown in Figure 3, where an ambient temperature of ~25 °C was considered for experimental measurements using the nomograms provided by the IEC-TR-62380 standard. The resulting values for πT are shown in the first row of Table 1. The measured temperatures of the capacitor’s capsule are in the second row. For a better view and understanding of calculation particularities, Appendix A is provided at the end of the paper, in addition to notes and data from reliability standards.

3.2. Calculation of the Failure Rate

The calculation is next performed for six possible capacitor technologies (Table 1). In each case, FIT stands for failure in time (1 FIT = one failure in 109 h) and F/106 h is failures in one million hours (the last variant is used in the MIL-HDBK-217 standard).
The calculation of the failure rate considers the following assumptions:
  • τi = 365 days × duty cycle = 365 × 0.15 = 54.75.
  • πA parameter exists only for electrolytic wet capacitors.
  • πT = is derived with the nomograms shown in Figure 3.
  • ni = 365, (πn)i = (ni0.60) × 1.
  • τon= 1 and τoff = 0.
  • Σ(πn)i = ni, Σ(πT)i = πT.
  • ΔTi = according to Table 1.
The temperature of the capacitor capsule TR within Table 1 is provided by thermal scanning with an infrared photography device (no air cooling, natural convection). These values and their corresponding photo are shown in Figures 8–13, Section 5. More details concerning these assumptions are provided in Subchapter 8: mission profiles from TR-62380 standard.
  • Failure rate for MLCC-SMD case capacitors:
λMLCC = 0.05 × {[(0.930291912 × 365 × 54.75)/(1 + 0)] + 3.3 × (10−3) × [(1.7 ×
3650.6) × 320.68]} × (10−9)/h = 929.53605 FIT = 0.92953605 F/106 h
MTBFMLCC = 1,076,020 h or 122.80 years
2.
Failure rate for tantalum MnO2 SMD case capacitors:
λtantalum MnO2 = 0.4 × {[(0.99 × 365 × 54.75)/(1 + 0)] + 3.8 × (10−3) × [(1.7 × 3650.6) × 320.68]}
× (10−9)/h = 6050.018 FIT = 6.050018 F/106 h
MTBFtantalum MnO2 = 165,288.8 h or 18.86 years
3.
Failure rate for tantalum polymer capacitors SMD case:
λtantalum polymer = 0.4 × {[(0.99 × 365 × 54.75)/(1 + 0)] + 3.8 ×
(10−3) × [(1.7 × 3650.6) × 310.68]} × (10−9)/h = 6049.966 FIT = 6.049966 F/106 h
MTBFtantalum_polimer = 165,290.2 h or 18.86 years
4.
Failure rate for polymer electrolytic multilayer capacitors SMD case capacitors:
λpolymer electrolytic multilayer = 0.6 × {[(0.756565 × 365 × 54.75)/(1 + 0)] + 1.4 × (10−3) × [(1.7 ×
3650.6) × 300.68]} × (10−9)/h = 6049.966 FIT = 6.049966 F/106 h
MTBFpolymer multilayer = 165,290.2 h or 18.86874 years
5.
Failure rate for aluminum polymer can-type V-type SMD capacitors:
λpolimer can type = 0.6 × {[(0.756565 × 365 × 54.75)/(1 + 0)] + 1.4 × (10−3) × [(1.7 × 3650.6) ×
310.68]} × (10−9)/h = 9072.71 FIT = 9.072 F/106 h
MTBFAl-polimer can type = 110,000 h or 12.6 years
6.
Failure rate for aluminum electrolytic non-solid electrolyte (wet) can-type through hole mounting (radial) capacitors:
λAl-electrolytic wet = 1.3 × {[(0.678 × 365 ×54.75)/(1 + 0)] × 1 + 1.4 × (10−3) × [(1.7 ×
3650.6) × 320.68]} × (10−9)/h = 17633.44 FIT = 17.63344 F/106 h
MTBFAl-electrolytic wet = 56,710.43 h or 6.4 years
It is necessary to proceed with extreme caution when dealing with the MTBF number and its definition because confusion frequently occurs between the MTBF and the lifetime [15]. For better clarification of this issue, the life expectancy for the aluminum electrolytic non-solid electrolyte capacitor is calculated as an example in the next subparagraph, according to TR62380.

3.3. Life Expectancy of Aluminum Electrolytic Non-Solid Electrolyte Capacitors

Because, in the literature, the aluminum electrolytic non-solid electrolyte capacitor is often subject to critical issues due to its proneness to early failure, a lifetime calculation was performed for this capacitor only [23]. The main factor that affects the lifetime of a capacitor is well-known as being the increased operating temperature. The rule of thumb would be that, for each increase of 10 °C in operating temperature, the lifetime will be reduced by half (m). The failure rate of non-solid electrolyte (wet) aluminum capacitors is assumed to be constant, but only within the life expectancy limits.
In order to calculate life expectancy, the IEC-TR-62380 standard provides a nomogram, as in Figure 4, which is based on qualification tests, as explained in Table 2. Therein, TC represents the temperature of the capacitor with a default value, i.e.,
TC = TA + 5 °C
The IEC-TR-62380 standard also states that it is necessary to take account of two facts:
(1)
Life expectancy depends on the operating temperature, qualification, and test conditions (i.e., technology type);
(2)
Ambient temperature for a non-solid electrolyte aluminum capacitor is taken at its immediate vicinity, meaning that overheating of the other components has to be considered. The mathematical formula for the life expectancy is:
Life   expectancy   [ hours ]   =   qualification   test   duration   ×   2 T M + 5 T C   10 .
When this was applied to the example considered herein, the TM represents the maximum temperature of the climatic category (here 85 °C). Hence, the life expectancy was 55,715 h or about 10 years.

4. Experimental Setup for Measurements

The calculation of the failure rate requires certain data collected from the experiment. In this respect, an EPC9059/30V development board [24] containing a buck converter with cutting-edge discrete transistor eGaN technology inside (parameters and characteristics in Table 3) was used. The two EPC2100 enhancement-mode gallium nitride FET transistors (eGaN) [6,24] have the following high-performance features (which have a particular impact on switching behavior):
  • Rds(ON) = 8.2 mΩ, Qg = 3.6 nC and 10 A for Q1.
  • Rds(ON) = 2.1 mΩ, Qg = 0.6 nC and 40 A for Q2.
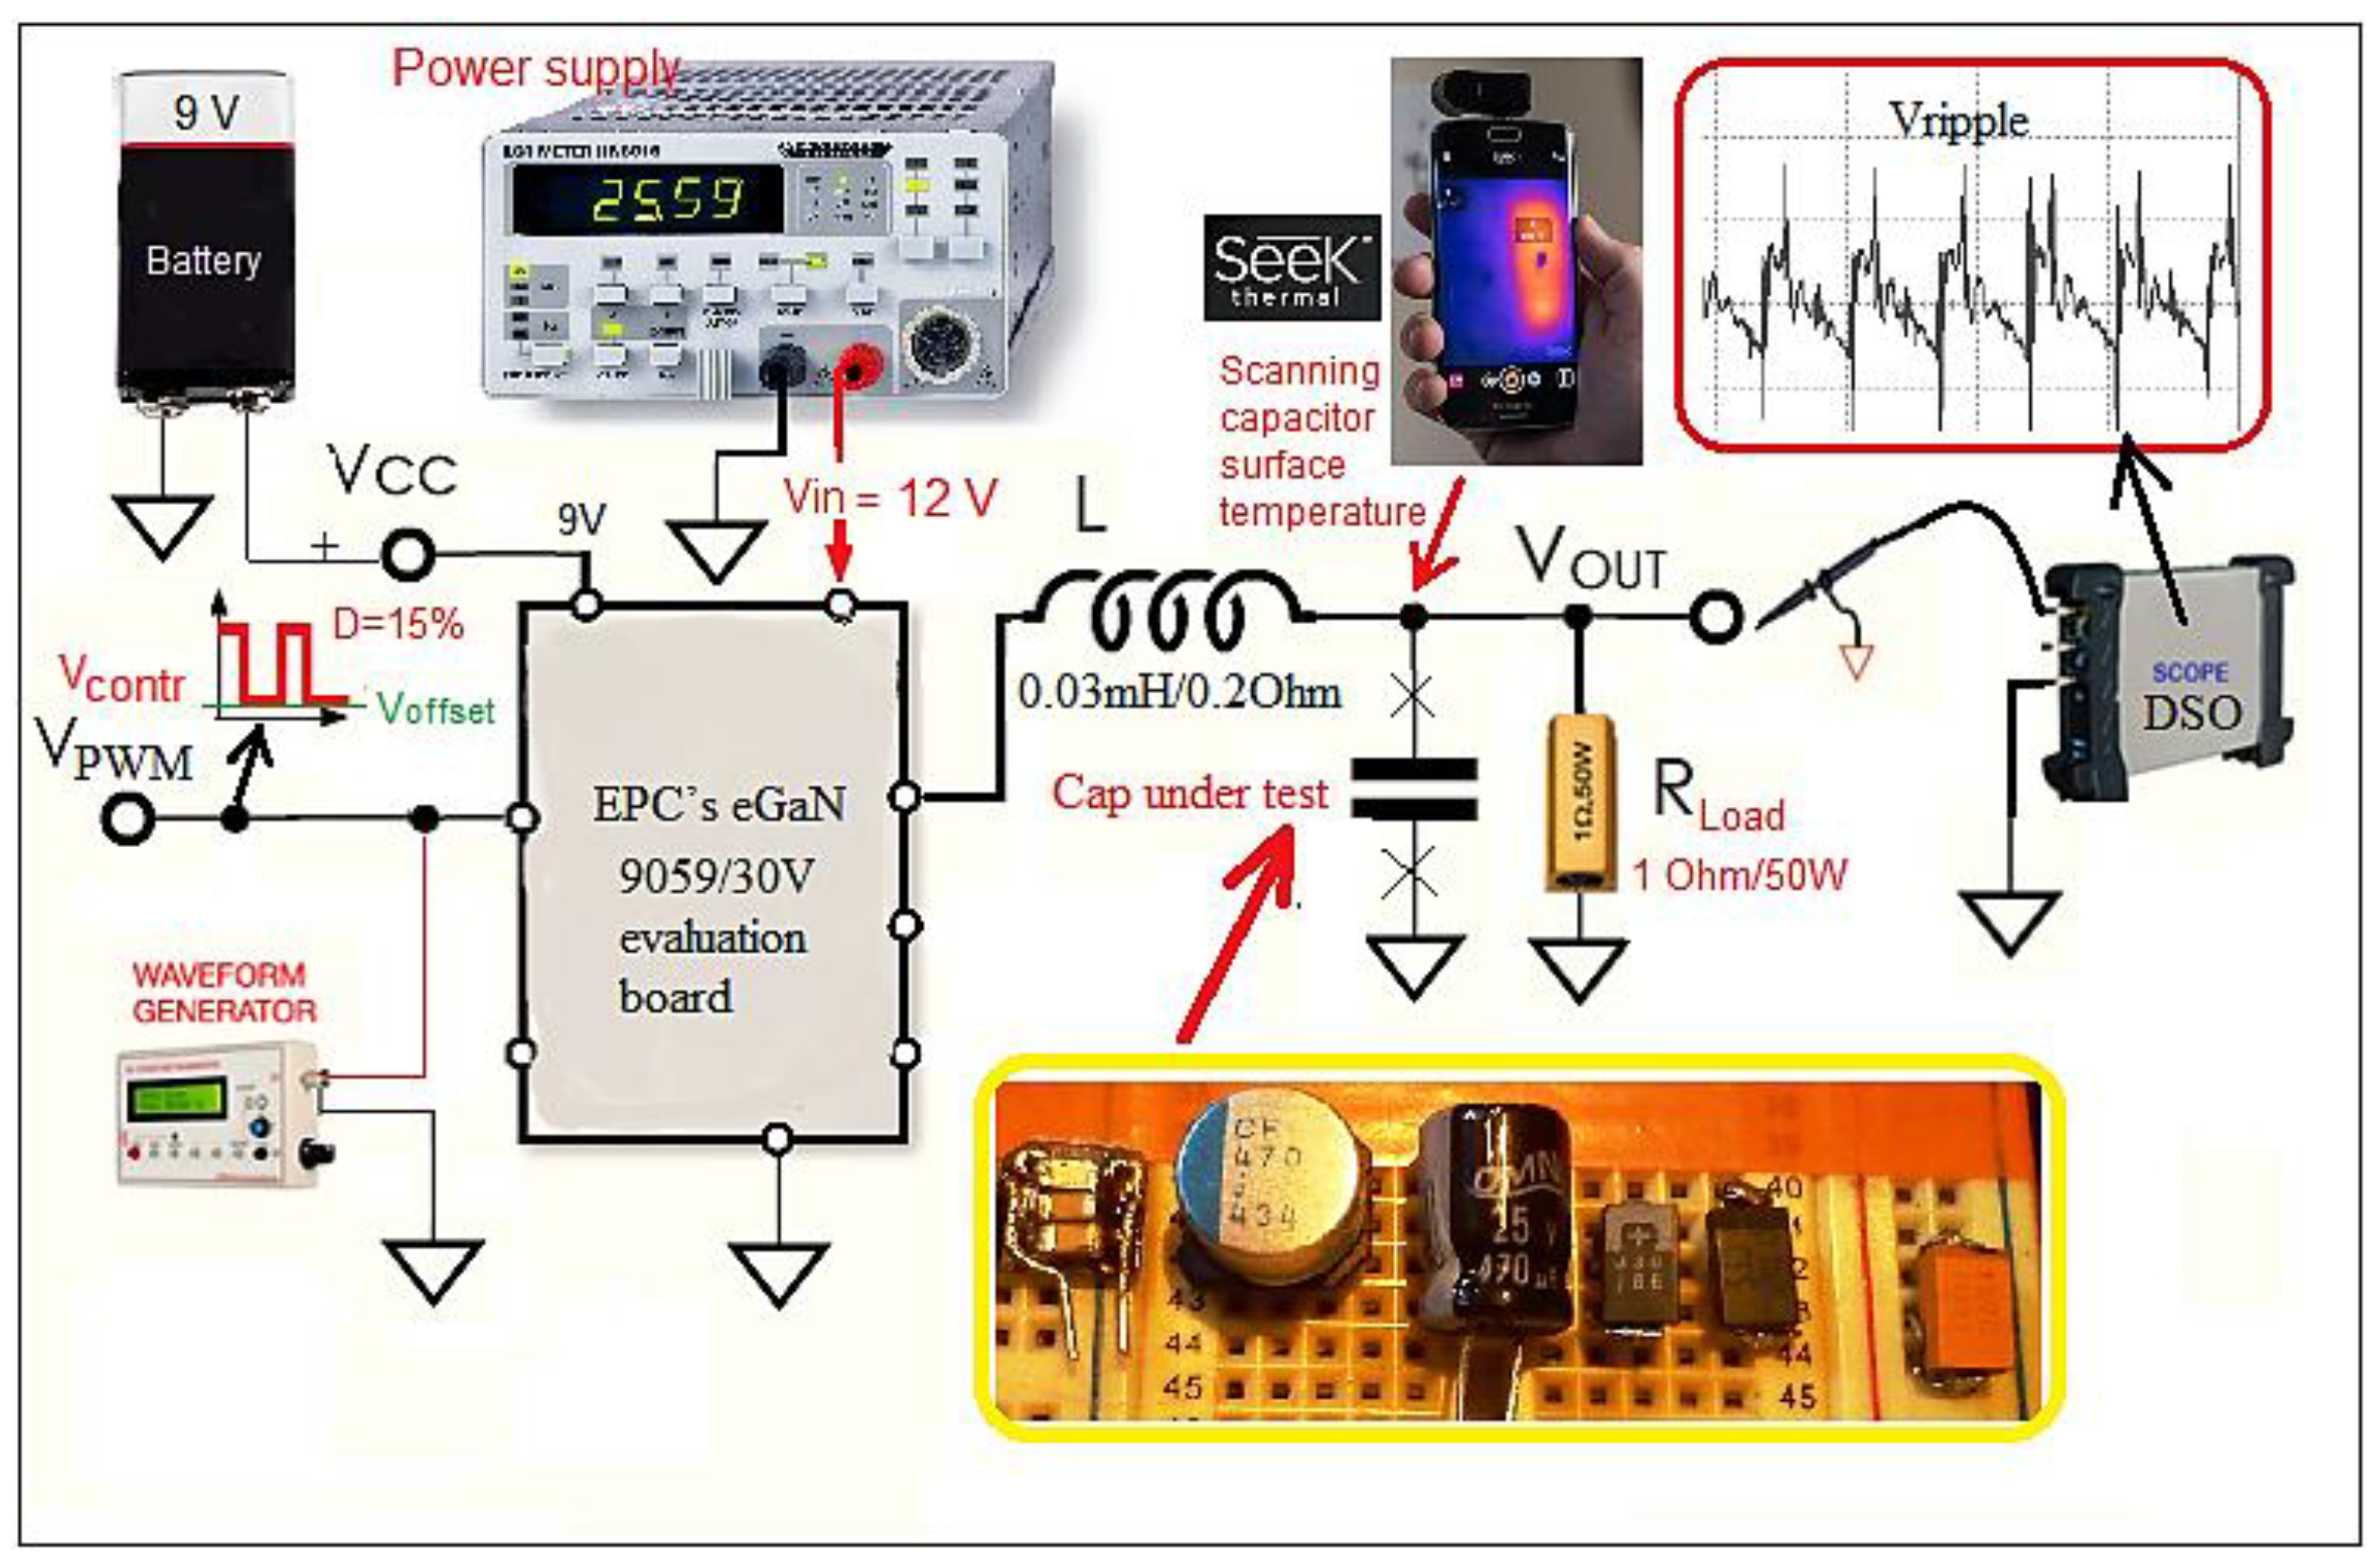
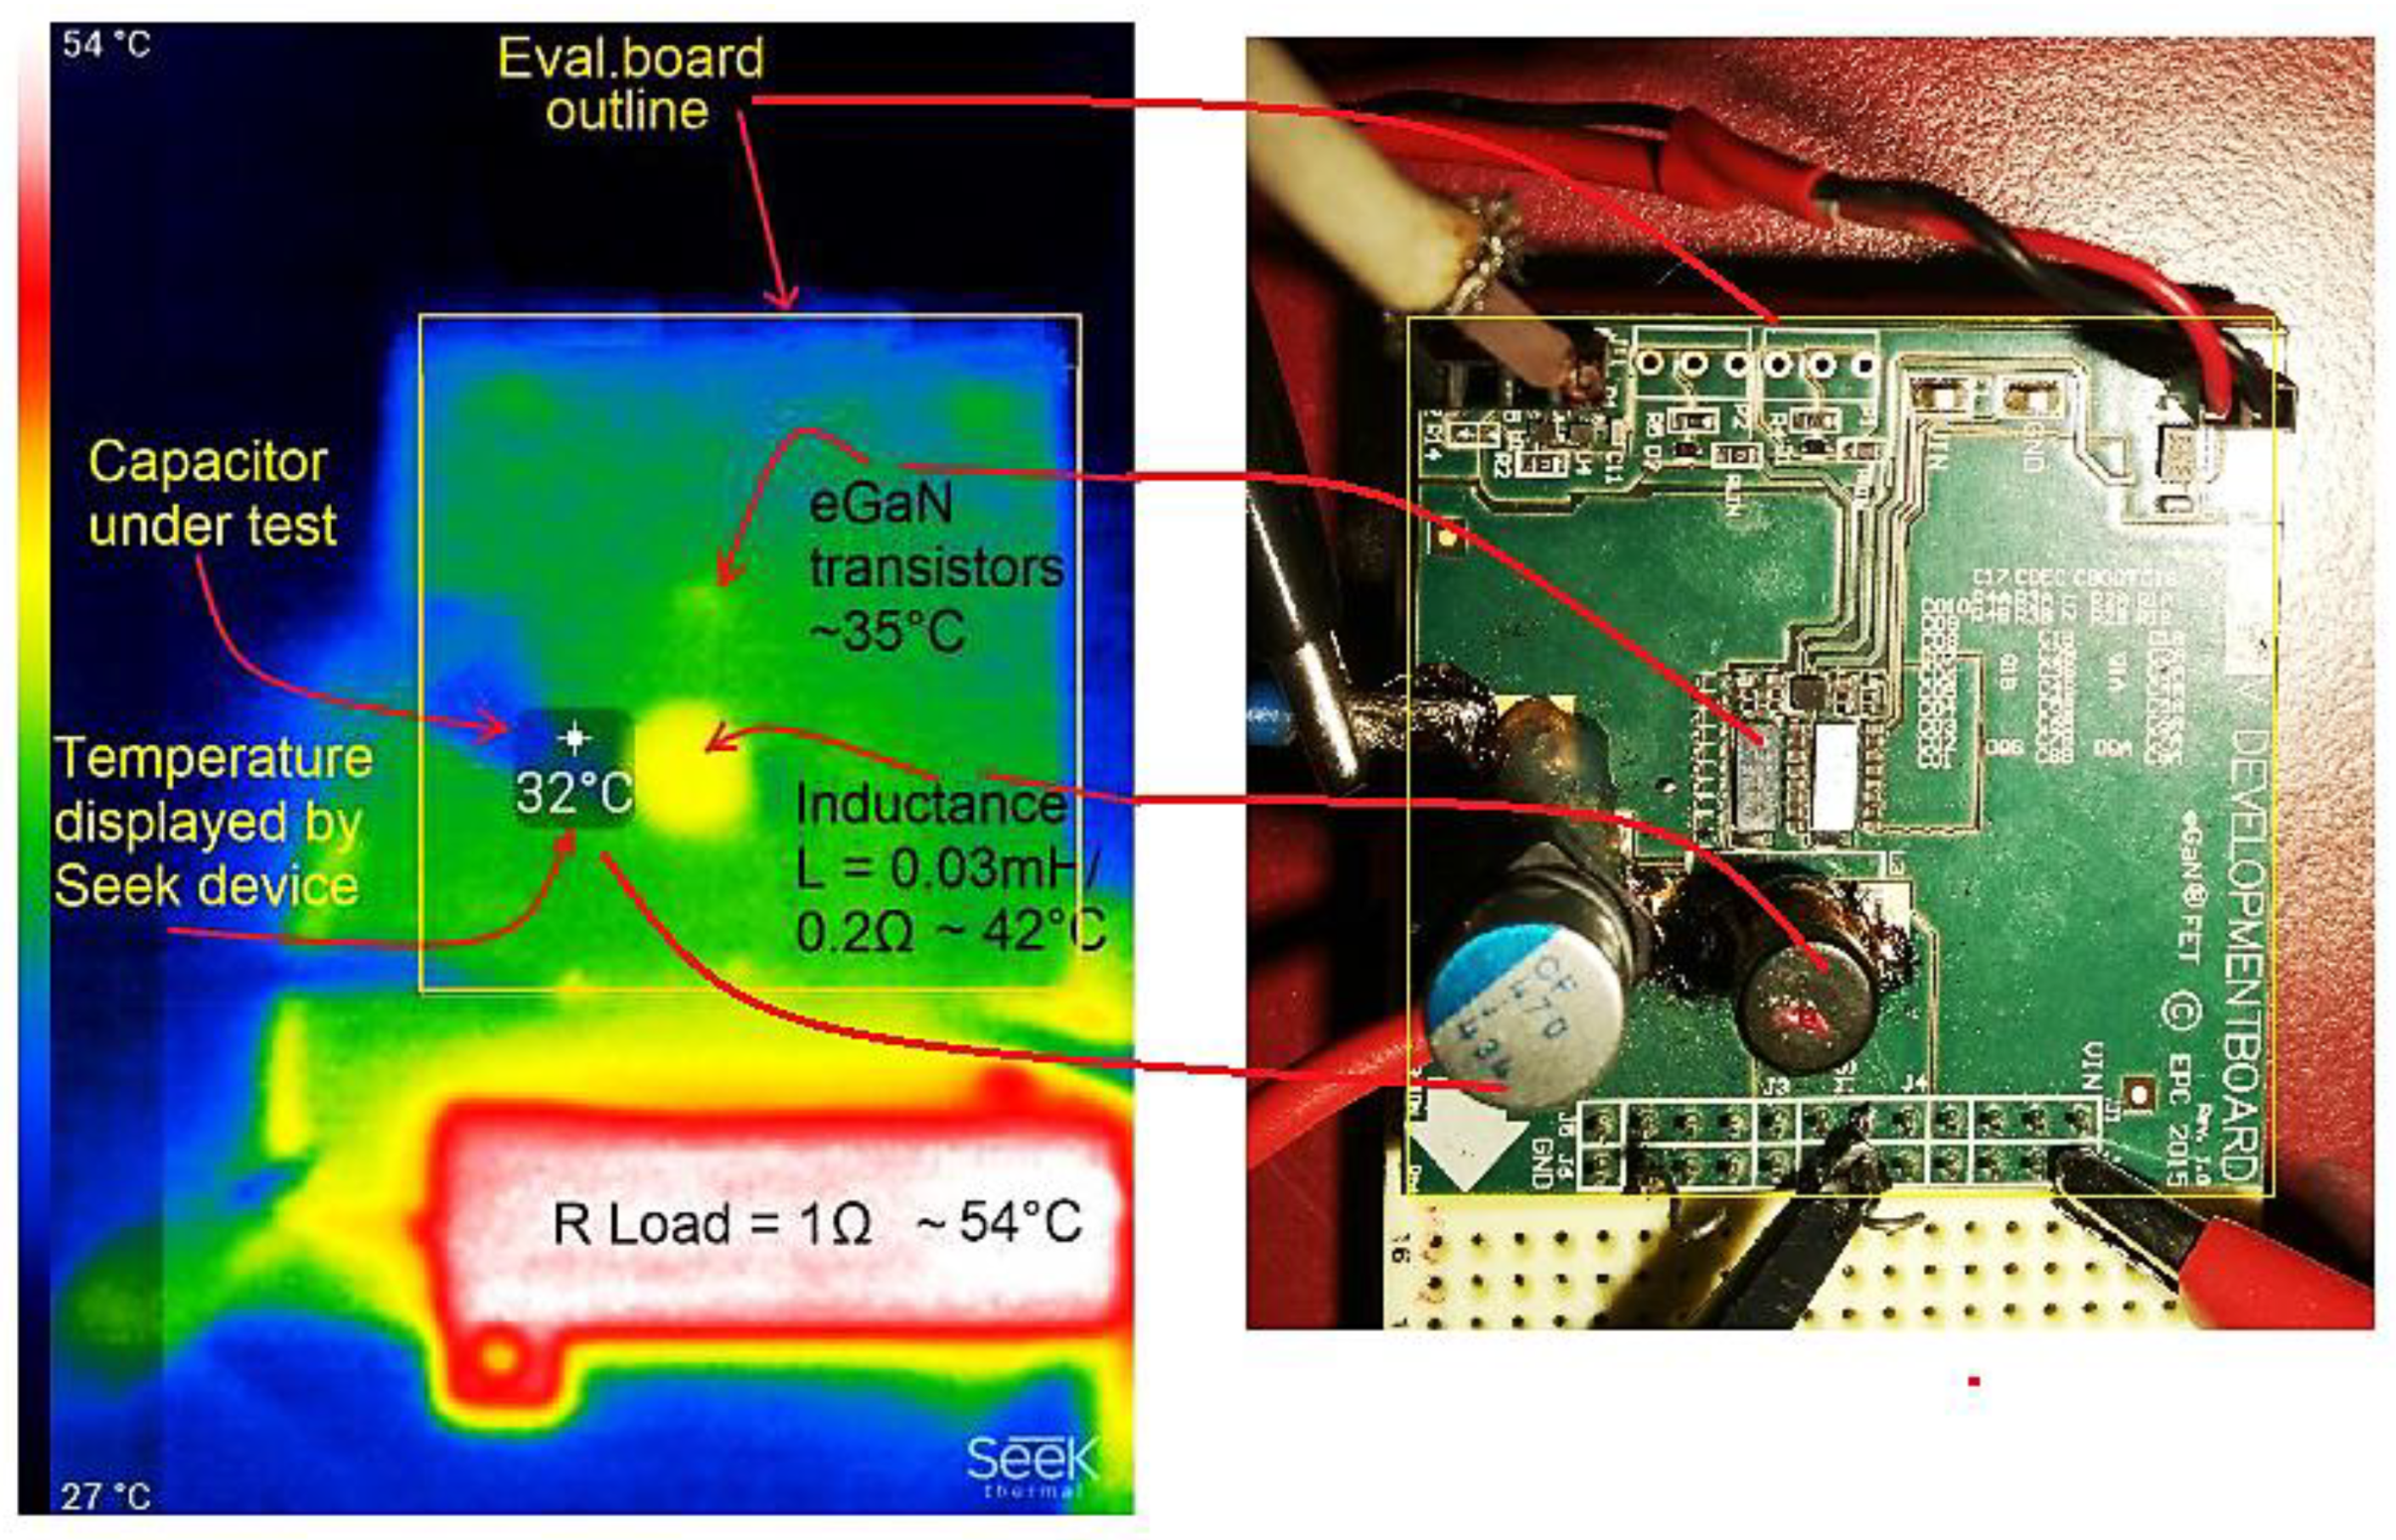
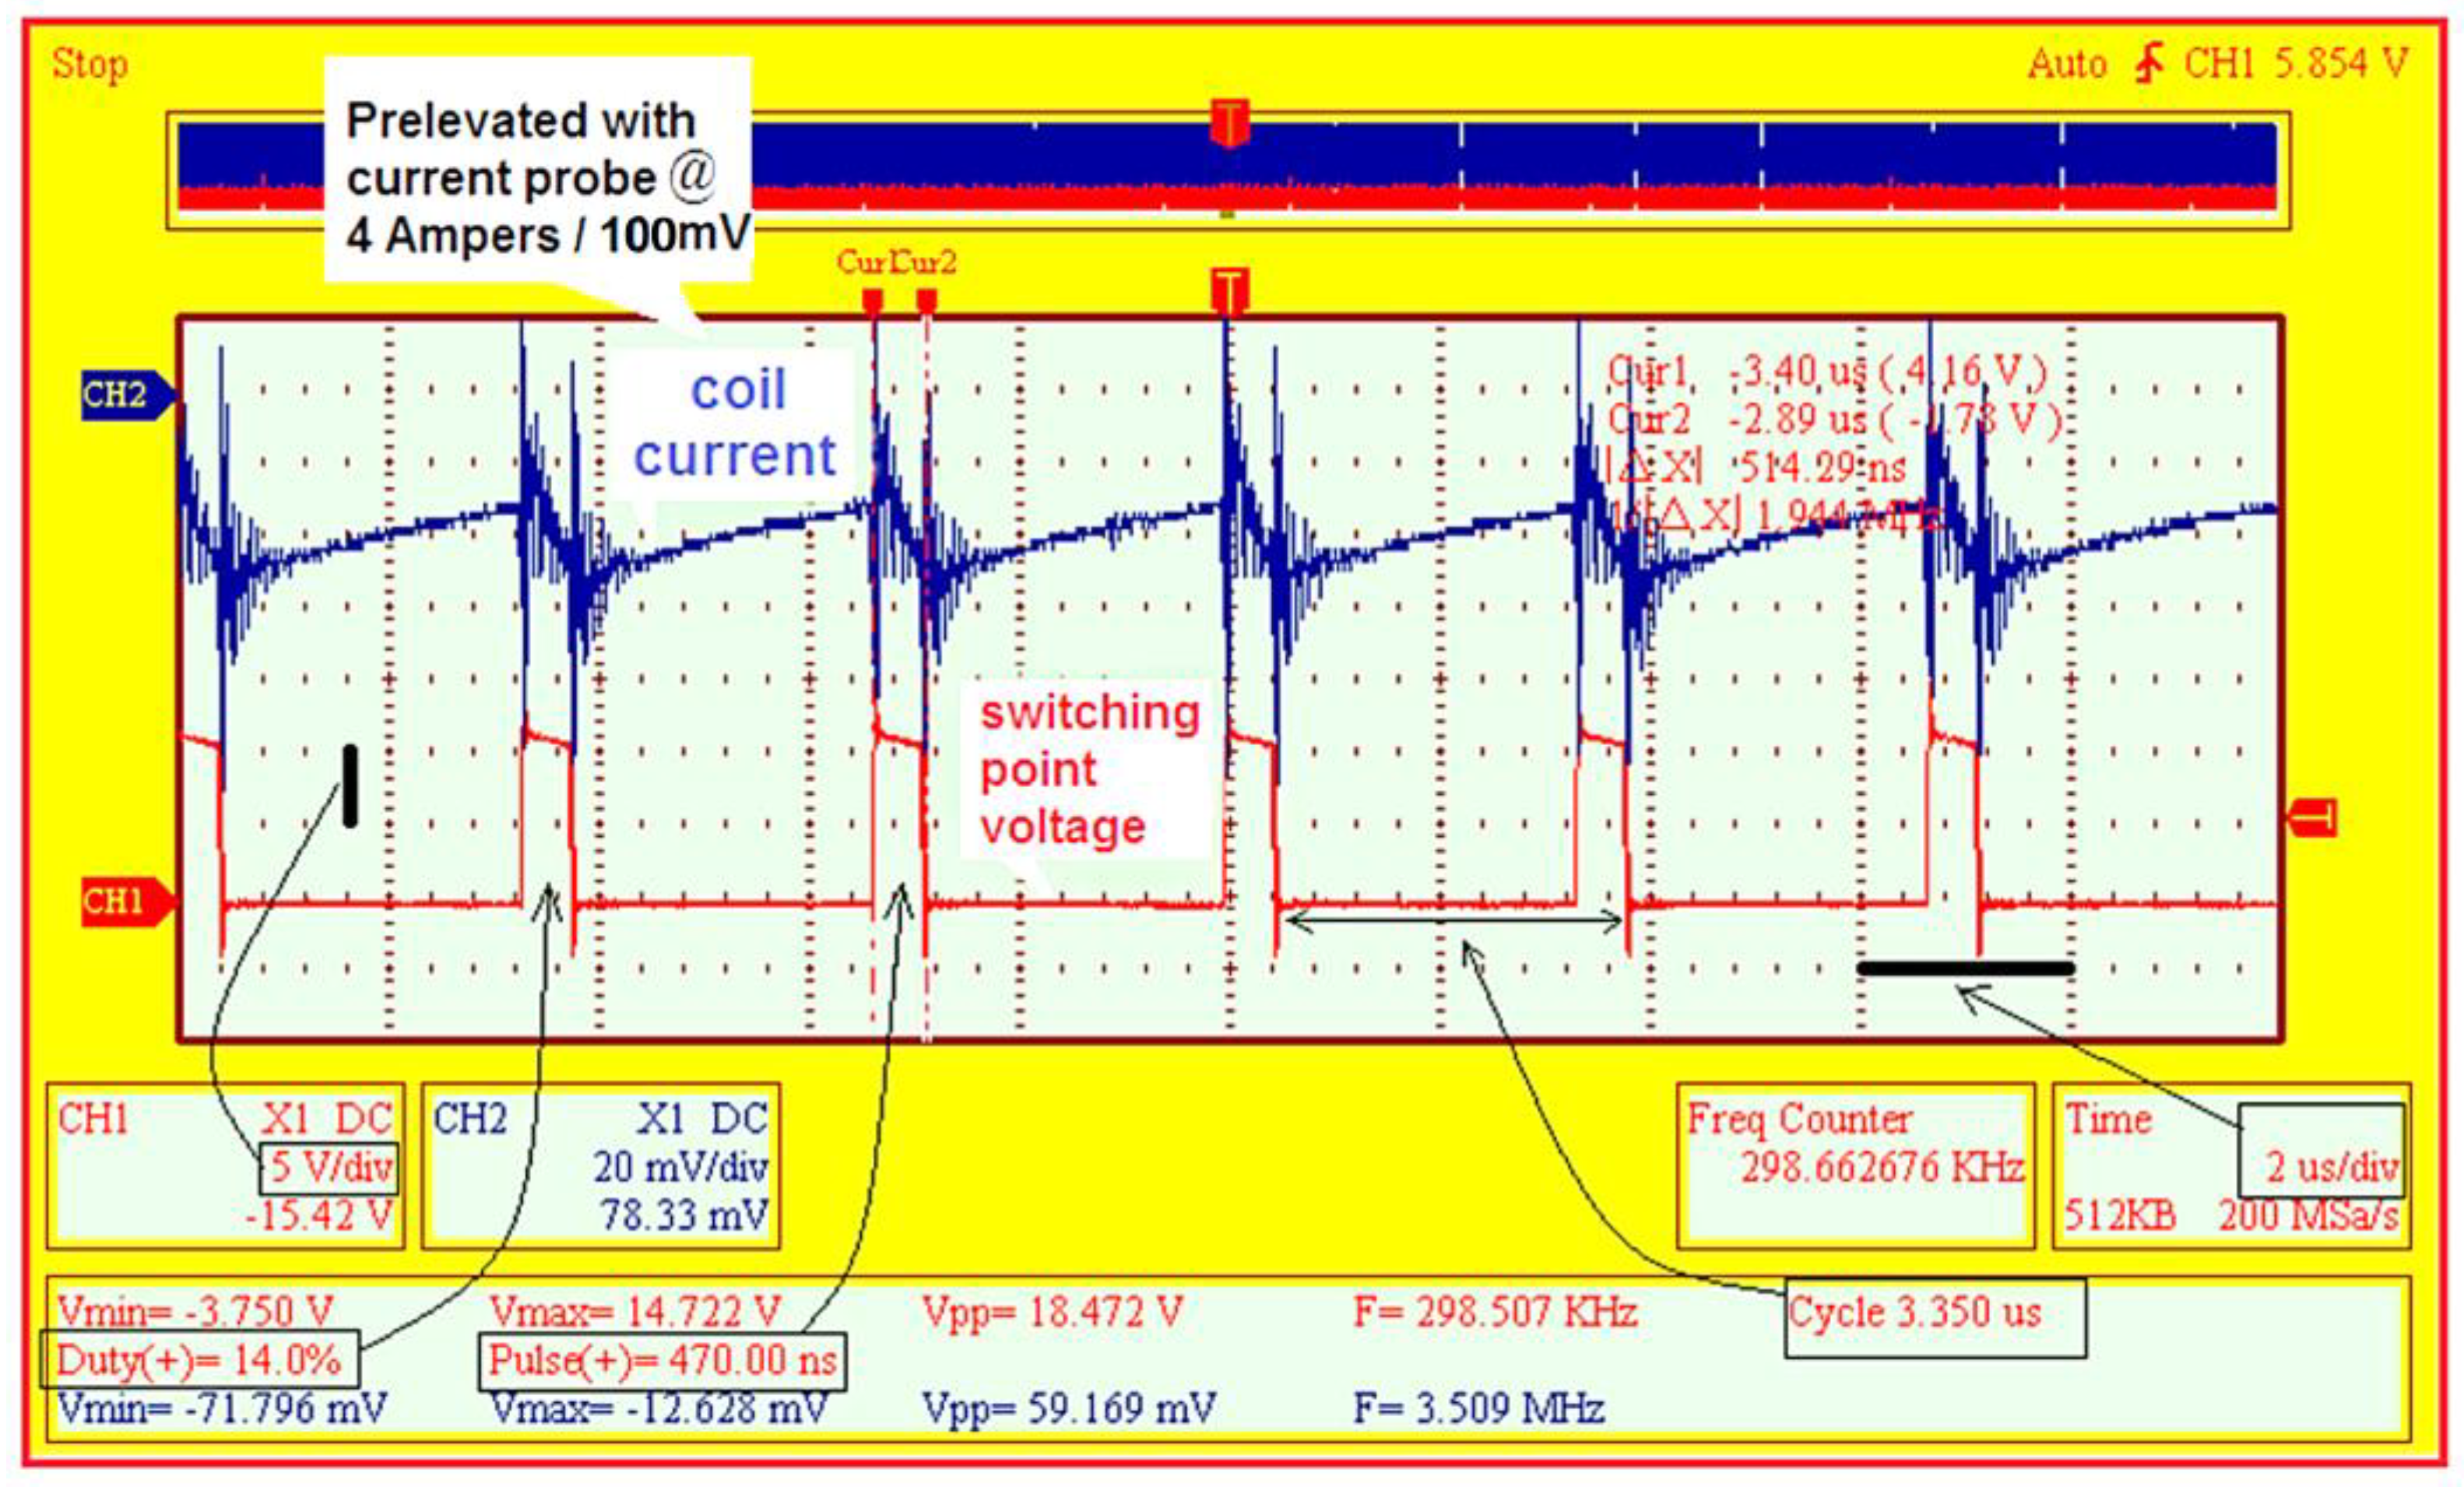
The gate control was ensured with a Texas Instruments LM5113 gate driver [24,25]. This experimental setup uses the measurement connection diagram depicted in Figure 5. The six different types of capacitor technology were successively connected as output capacitor banks. An infrared thermal camera was used to scan the actual temperature of the capacitor’s surface. This value of the temperature was required by the temperature factor πT in the reliability calculation with the IEC TR 62380 standard. Figure 6 shows the appearance of the detected temperatures for Murata’s SMD polymer electrolytic can type. The equivalent series resistance (ESR) is a very important parameter for both the great impact on I2R losses [4] and the ripple capability. The theoretical ESR was extracted from the catalog datasheet of each capacitor. A switching frequency of 250 kHz was adopted in this experiment. For the validation of the CCM, the operation of the converter is depicted in Figure 7, along with the waveforms for the tested converter (switching point voltage and coil current).

5. Results

After the reliability calculation, the equivalent series resistance (ESR) measurement is done. This is a very important parameter for both I2R losses and ripple capability. The theoretical ESR was extracted from the catalog datasheet of each capacitor.

5.1. Experimental Results

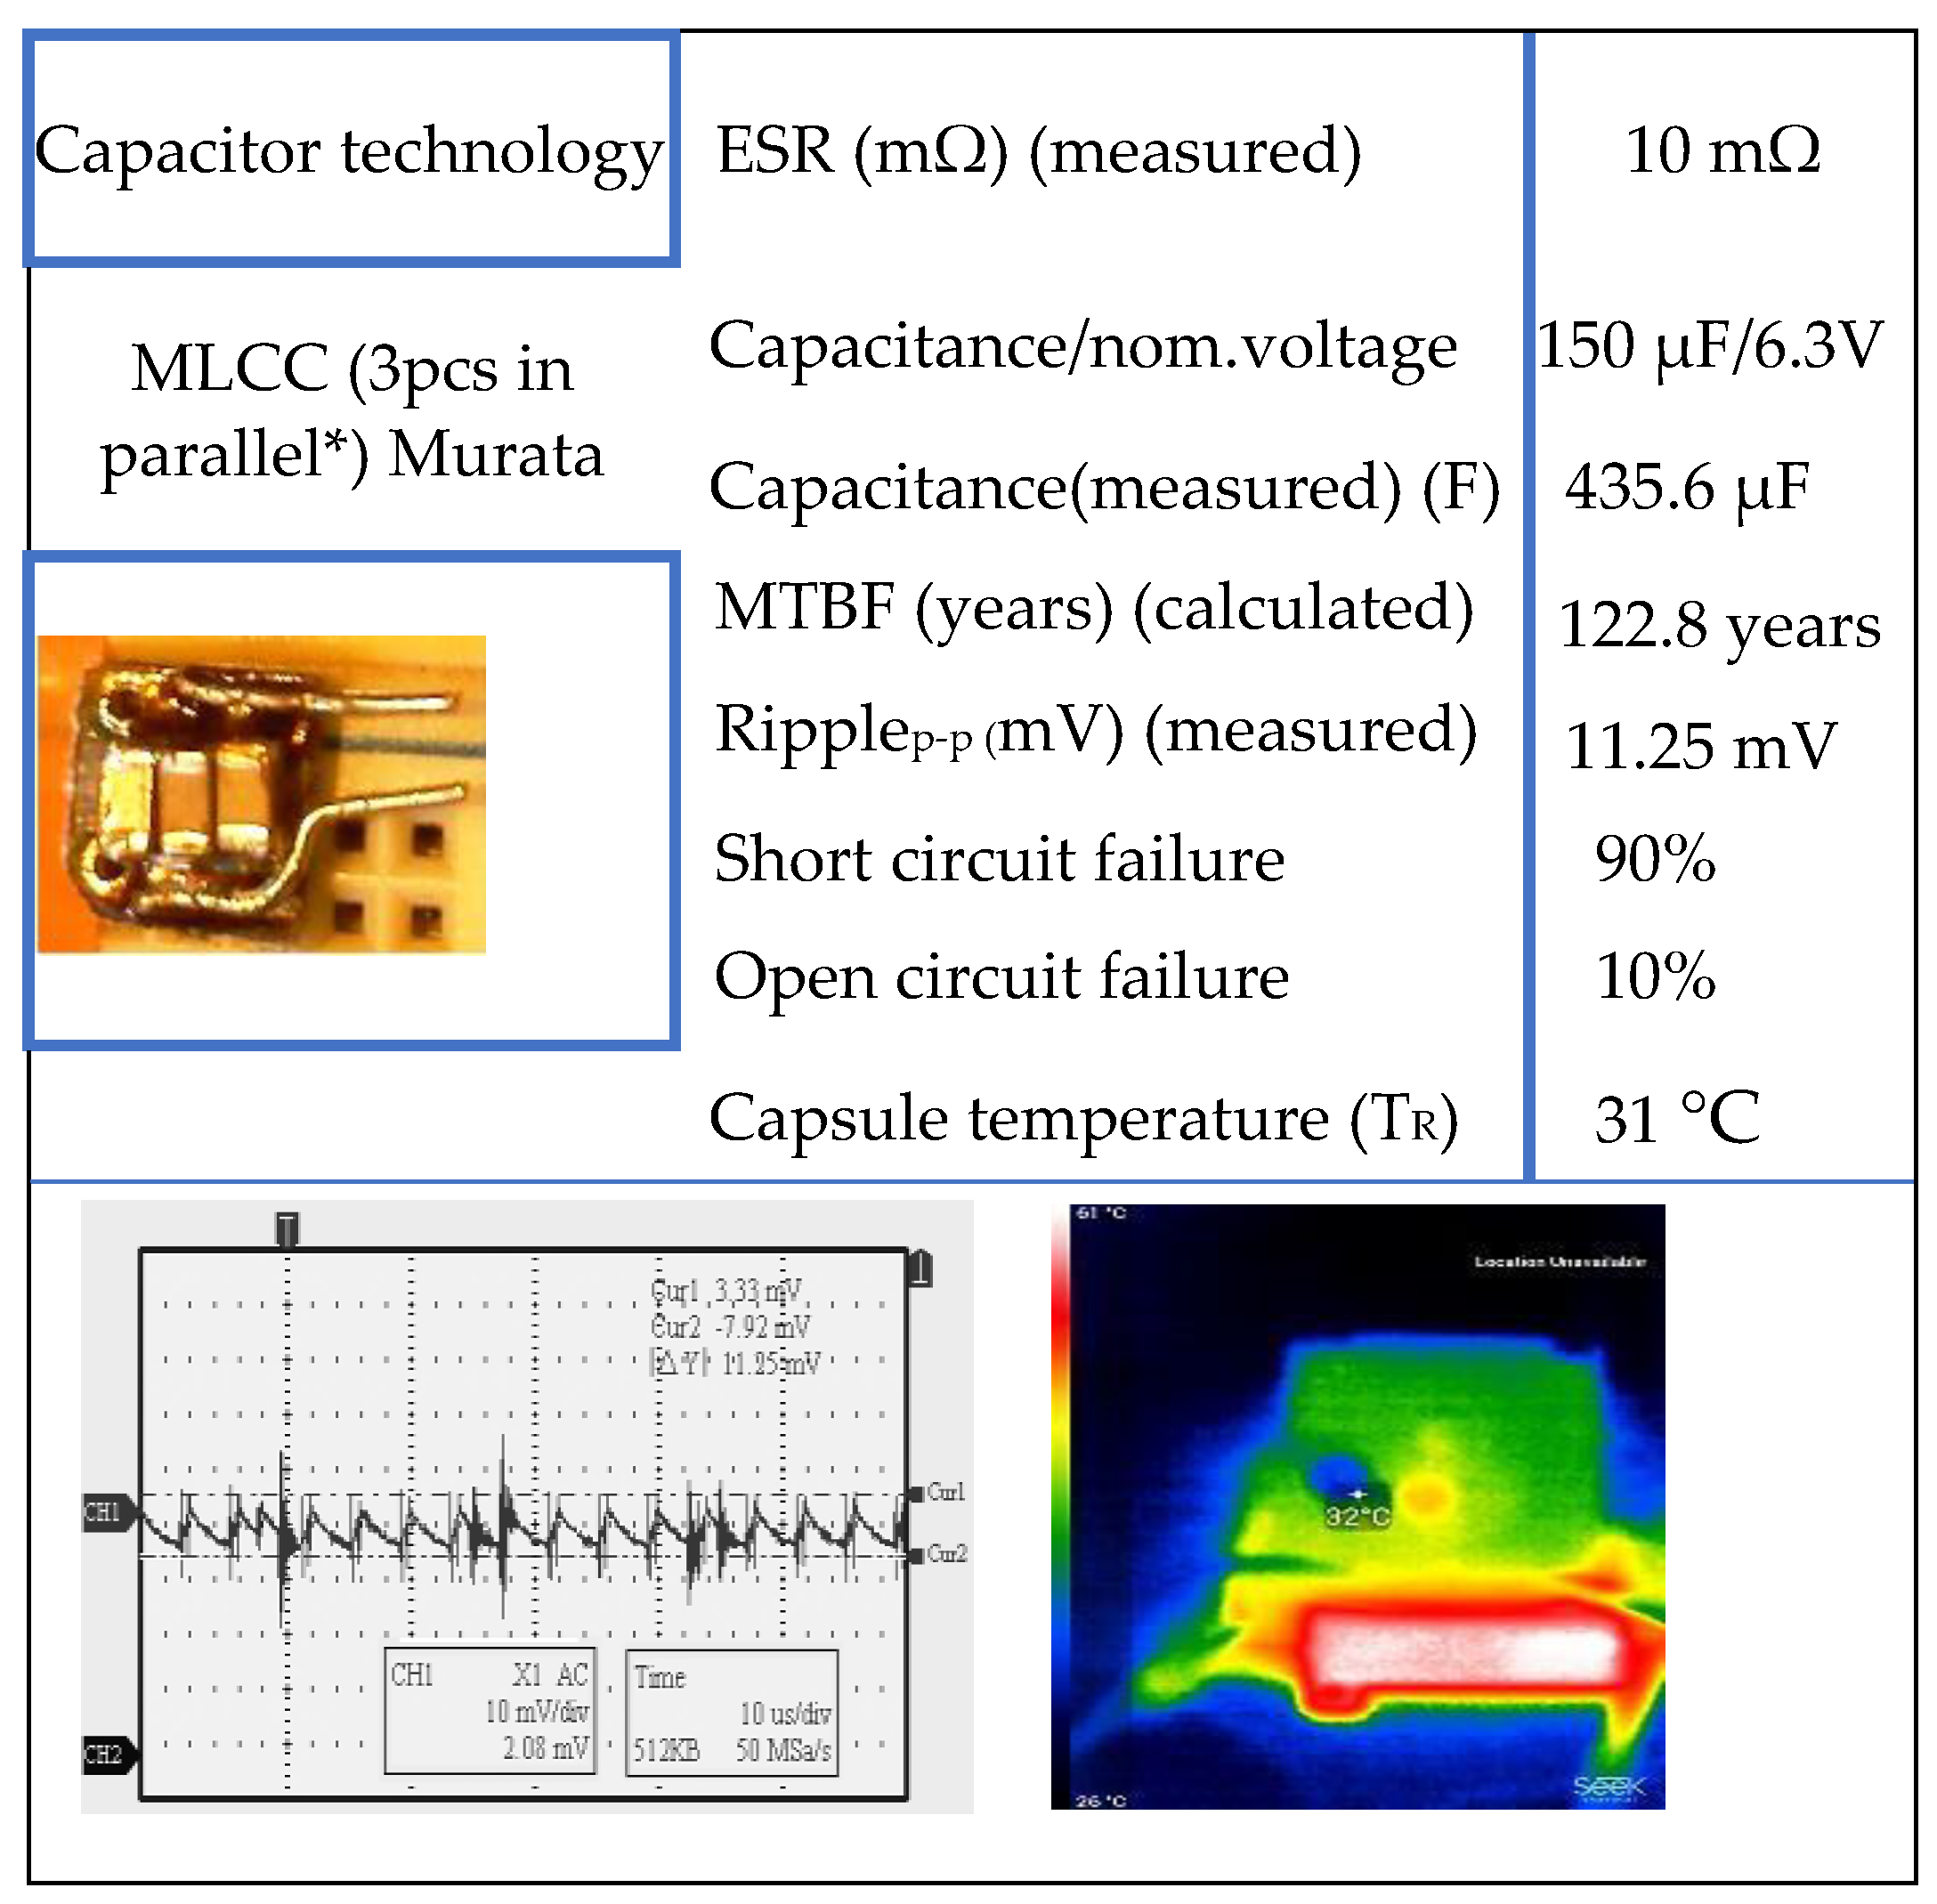
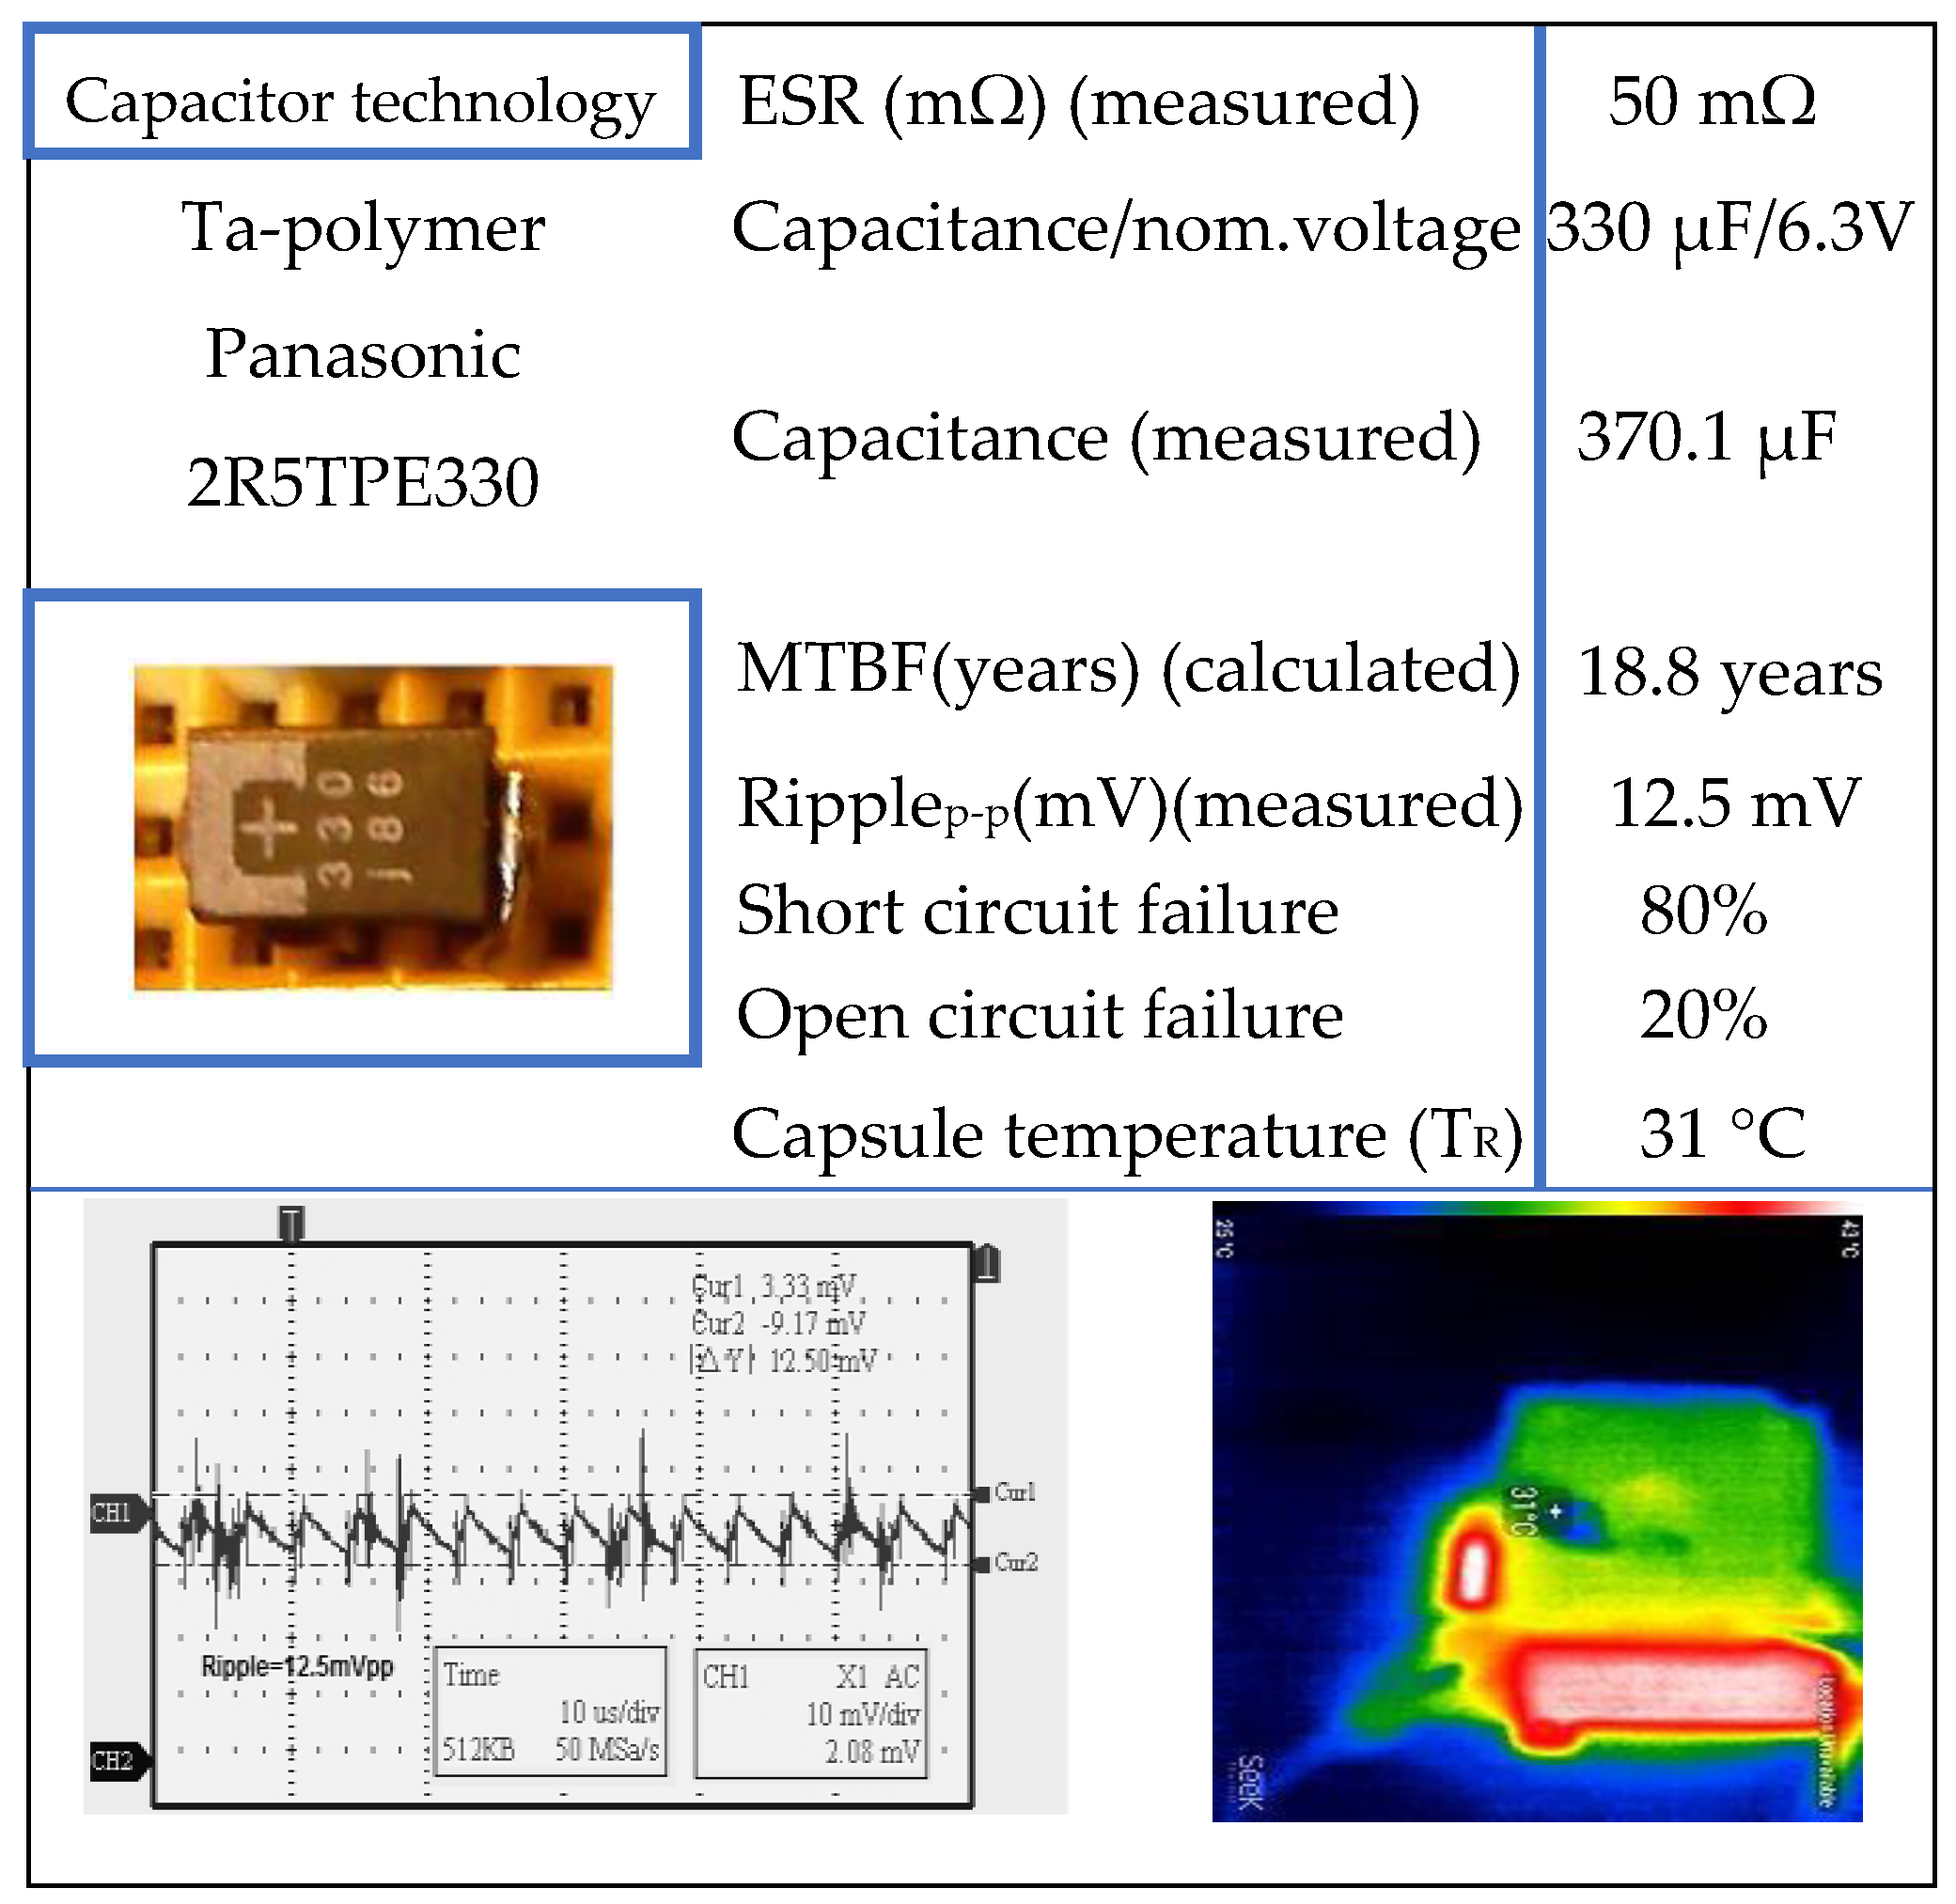
Considering the reliability calculation performed in Section 3.2, ESR measurements (using an electronic RLC bridge), and the collection of the ripple for the output voltage using the oscilloscope, the experimental results are grouped in Figure 8, Figure 9, Figure 10, Figure 11, Figure 12 and Figure 13, reporting:
  • The temperature at the surface of the capacitor;
  • The component ID from the manufacturer’s catalog;
  • The nominal capacitance value and rated voltage;
  • The measured actual capacitance value;
  • A photo of each capacitor tested;
  • The capsule’s temperature TR for each capacitor;
  • MTBF number in years;
  • The peak-to-peak ripple voltage;
  • The failure mode (%) taken from the standard.
Obviously, the results indicate that the ESR, ripple voltage, and thermal behavior are different for each type of capacitor [26]. Nevertheless, the MTBF number tends to increase with the newest capacitor technologies. With the information contained in Figure 8, Figure 9, Figure 10, Figure 11, Figure 12 and Figure 13, a synthesis of the behavior of the six types of capacitors is shown in Table 4. In the last column, an attempt was made to decide on their use within the converter. This table could serve as a benchmark for designing reliable buck converters with a low output voltage and high current.

5.2. Experimental: First Extension

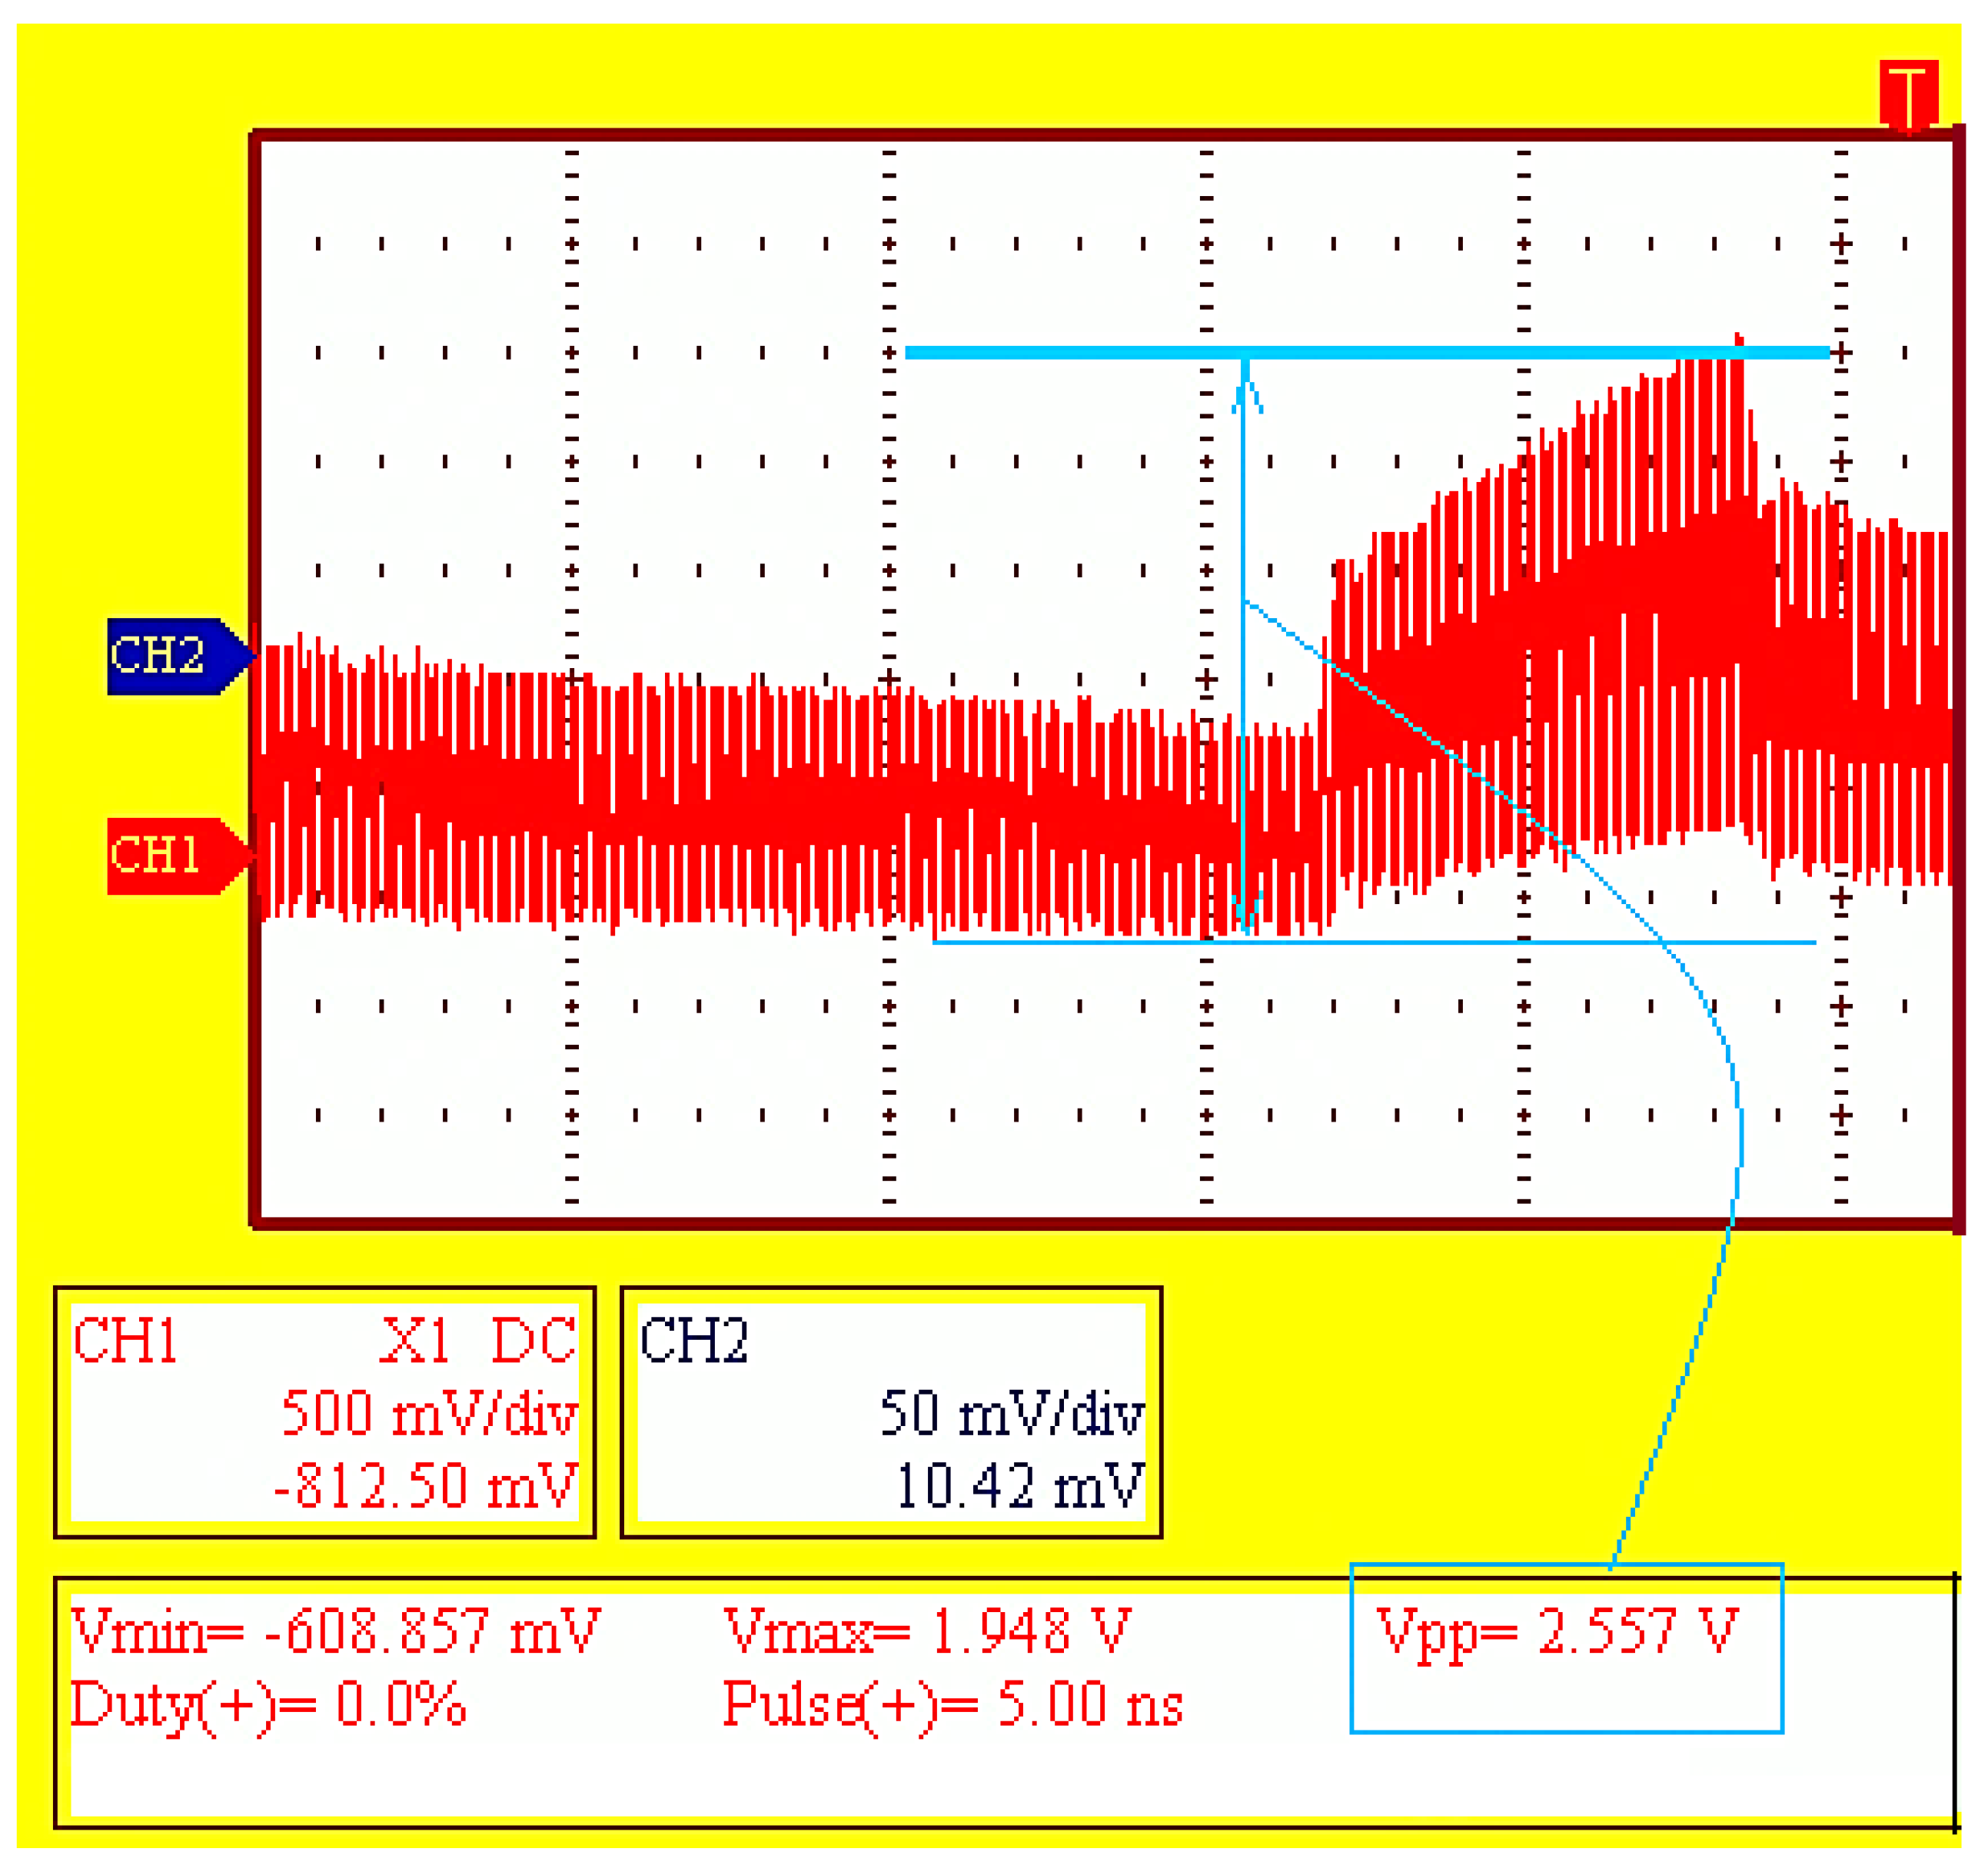
Although they are not known to be often used as output capacitors for DC–DC converters, capacitors with a dielectric film (polyester) were also considered in this experiment, as a point of curiosity. Thus, a 25 μF/250 V capacitor film of 10% type PMP0305-β IPRS-Baneasa was tested under the same conditions as the other six typologies. A temperature of 29 °C was found on the package (case), which resulted in a failure rate of 1.59878 × 10⁻⁶ (and a factor πT = 0.8), leading to an MTBF of 71.4013 years. A fairly high ripple value of 2.55 Vpp) was measured (details are shown in Figure 14), which disqualified it from use within the converter’s output filter.

5.3. Experimental: Second Extension

To further highlight the role of capacitor reliability in the overall reliability of the converter and because the results obtained are adequate for conventional mode operation, a new test at a much harsher stress level was conducted. Thus, the parameters of the converter were modified. A suggested comparison of the two stress situations for the tested capacitors is presented in Figure 15. Compared to the parameters in Table 3, the load current differed in particular, being increased 10 times in this new stress situation, and the values obtained (including package temperature) are summarized in Table 5.
The failure rate and MTBF were calculated for this new stress situation, and the values obtained (including package temperature) are summarized in Table 6.

5.4. Experimental: Third Extension

Because ESR has a very complicated relationship with temperature and frequency variation, especially for tantalum and polymer capacitors, a discussion about ESR must be addressed. Catalogs and datasheets provide scarce data about the maximum ripple characteristics without detailing the frequency and temperature variation. The fact is that the ESR of tantalum and polymer capacitors varies with the changes in these two variables [26,27,28,29].
In the case of tantalum capacitors containing MnO2 (manganese dioxide) electrodes, there is a very strong dependence on temperature due to the dominance of the cathodes on ESR. A relationship that approximates this behavior [18] is:
E S R a c t u a l   = E S R @ 25 ° C × 4 25 ° C T a c t u a l 100 ° C
where “actual” means the actual package temperature for the capacitor in the working environment within the mission profile. This equation shows that a value four times lower than that of the ESR at 25 °C is obtained when the working temperature increases by 100 °C above ambient temperature. The calculation provides the values for ESR that are shown in Table 5. A histogram of the percentage decrease in actual ESR determined at the working temperature seen by the capacitor is illustrated in Figure 16.

6. Conclusions

The output capacitor bank from a low-voltage, high-current PoL converter is more important for the converter’s reliability than the semiconductor devices. The performance required from the output capacitor bank makes selection difficult.
This paper proposes an investigation of several capacitor technologies in order to find the best match for the eGaN FET transistor-based PoL converters. This includes the kinds of parameters that are less prominent in a quick specification overview, such as reliability, modes of failure, and behavior with time or voltage. The selection of the right capacitor technology has afforded more consideration in the case of low-voltage, high-current applications.
Taking into account the results derived within this paper, it is suggested that a low output ripple voltage and high reliability for the eGaN transistor-based DC–DC converter can be achieved using capacitors with a lower ESR at the switching frequency. In this study, polymer electrolytic can-type SMD, tantalum polymer SMD, and polymer multilayered SMD technologies have been found to provide good ripple absorption and optimal reliability performance, with the downside of a higher cost. MLCCs can be used as an addition in order to form a parallel bank along with the technologies mentioned above, with an intended role at high frequencies. However, MLCCs suffer from an actual capacitance change with a DC voltage component, a risk of cracking when voltage exceeds ratings, and the generation of acoustic noise. Tantalum capacitors have good company-specific design guidelines and a capacity for self-healing but are prone to starting fires on the printed circuit board.
Due to their higher ESR values, the aluminum electrolytic wet capacitors result in high output ripple voltage and poor filtering. In addition, they are much larger in volume and require a bigger footprint on the printed circuit board. Despite many articles that indicate that this type of capacitor is the most prone to failures within a printed circuit board, their low cost and high capacitance density make aluminum electrolytic wet capacitors the first choice for many designers. Replacing them with polymer capacitors offers a better but more expensive solution.
The major and unique contributions of the paper include:
  • It provides a comprehensive review of capacitor technology options for low-voltage, high-current PoL converters;
  • It provides a guideline for the selection of the proper reliability standard for the calculation of the failure rate for modern capacitor technologies;
  • It performs calculations for failure rates and MTBFs for various capacitor technologies when used in PoL converters equipped with eGaN transistors;
  • It performs a calculation of the life expectancy for electrolytic-type capacitors based on component qualifications;
  • It uses a thermal infrared camera for capacitors’ temperature measurements (used in πT factor calculation) and uses a precise in-circuit measurement of the actual ESR of the capacitors, which helps thermal modeling;
  • It uses a precise in-circuit ripple measurement for various capacitor technologies;
  • It provides a comparative investigation of the possible failures.

Author Contributions

Conceptualization, D.B.; methodology, D.B.; formal analysis, D.B. and A.L.; resources, D.B.; writing, D.B.; writing—review and editing, A.L.; project administration, D.B. All authors have read and agreed to the published version of the manuscript.

Funding

This paper was financially supported by the Project “The advanced research postdoctoral program within IOSUD-TUIASI-Performance and excellence in postdoctoral research-2022” and “Network of excellence in applied research and innovation for doctoral and postdoctoral programs/InoHubDoc”(project co-funded by the European Social Fund financing agreement no. POCU/993/6/13/153437). These take place at Technical University “Ghe. Asachi” of Iasi, Iasi 700050, Romania.

Data Availability Statement

Not applicable.

Acknowledgments

The authors would like to thank Dorin O. Neacsu (Technical University of Iasi, Romania) for the valuable advice and review and Andrei Alistar (Continental Automotive) for his support.

Conflicts of Interest

The authors declare no conflict of interest.

Appendix A

The explanation of the terms within the mathematical model and other information for the failure rate of the calculation according to the IEC-TR-62380 reliability standard follow.
Notes:
(a)
The data within the handbook covers intrinsic failures.
(b)
The component failure rate depends on a number of operational and environmental factors.
(c)
The models adopted are those which give the effect of temperature on the predominating failure mechanisms (which are not normally the “wear-out” mechanism).
(d)
For passive components (which is our case), an Arrhenius equation is applied with an activation energy of 0.15 to 0.4 electron volts.
(e)
The failure rates given for components include the effects of the mounting on a printed circuit board.
Definition of variables used in calculation (and necessary to define the mission profile of equipment).
  • (tae)i: average outside ambient temperature surrounding the equipment during the ith phase of the mission profile.
  • (tac)i: average ambient temperature of the printed circuit board near the components, where the temperature gradient is canceled. (πt)i: ith temperature factor related to the ith junction temperature of the capacitor mission profile.
  • t)i: ith temperature factor related to the ith junction temperature of the capacitor mission profile.
  • τi: ith working time ratio of the capacitor for the ith junction temperature of the mission profile.
  • τoff: time ratio for the capacitor being in storage (or dormant) mode.
  • τon: total working time ratio of the capacitor with: τon = i = 1 y τ i
  • n)i: ith influence factor related to the annual cycle’s number of thermal variations seen by the package, with the amplitude ΔTi.
  • ΔTi: ith thermal amplitude variation of the mission profile.
The following specifications for each capacitor technology are investigated in this paper and were taken from the IEC-TR-62380 reliability standard.
  • Aluminum electrolytic polymer electrolyte (IEC 60384): πA = 1, α = 0.6, β = 1.4, γ = 1740 , δ = 313 .
  • Tantalum caps solid electrolyte IEC 60384: πA = 1, α = 0.4, β = 3.8, γ = 1740 ,   δ = 303 .
  • Aluminum electrolytic non-solid electrolyte:   α = 1.3, β = 1.4, πA = according to Table A1, γ = 4640 ,   δ = 313 .
  • Ceramic caps class I: defined temperature coefficient: α = 0.05, β = 3.3, πA = 1, γ = 1160 ,   δ = 303 .
For the electrolytic non-solid dielectric capacitor, the πA parameter calculation was performed related to Table A1.
The following condition must be respected, to obtain field values in conformance with those calculated with the above formulas:
the   ratio = p e a k   v o l t a g e r a t e d   v o l t a g e     0.5
where peak voltage = continuous voltage + peak value of the alternative voltage. This needs to take into account the temperature rise ΔT of the capacitor caused by the current itself (the self-heating process)
Δ T = 20 A p p l i e d   r i p p l e   c u r r e n t M a x i m u m   a d m i s s i b l e   c u r r e n t 2
Mission profile example (for telecom applications):
  • There is only one annual working phase to consider for permanent working. Table A2 is given for a permanent working phase.
  • Values for “ground; stationary; non-weather protected” (equivalent: ground and fixed for Mil-HDBK217F [17]) are given for the French climate, but for other climates they can also be calculated taking the data within the standard’s tables.
Table A1. Standard’s recommendation for parameter πA.
Peak Value of the Pulsed CurrentπA
Ratio = p e a k   v a l u e   o f   p u l s e   c u r r e n t m a x i m u m   a d m i s s i b l e   r i p p l e   c u r r e n t ≤1.51
1.5–23
2–310
Table A2. Mission profile for a permanent working phase.
Environment TypesEquipment Types(tae)i(tac)iτiτonτoffni
(Cycles/
Year)
ΔTi
(°C/
Cycle)
Ground: benign (GB)Switching20301103650
Ground; fixed (GF)Trans
mitting and
access
11311103658

References

  1. Neacsu, D.O. Telecom Power Systems; CRC Press: Boca Raton, FL, USA, 2017; ISBN 9781138099302. [Google Scholar]
  2. Huang, W.; Clavette, D.; Zhou, S.; Rodrigues, M. A 32-phase 1200-Ampere DC/DC Converter for Data Center and Artificial Intelligence Systems. In Proceedings of the 2021 IEEE Applied Power Electronics Conference and Exposition (APEC), Phoenix, AZ, USA, 14–17 June 2021; pp. 2017–2023. [Google Scholar] [CrossRef]
  3. Butnicu, D. A Reliability Comparison between Disrupting eGaN-FET and Cutting Edge Silicon MOSFET Devices in POL Buck Converters. In Proceedings of the International Symposium on Signals, Circuits and Systems (ISSCS), Iasi, Romania, 11–12 July 2019. [Google Scholar] [CrossRef]
  4. Reusch, D.; Strydom, J. Evaluation of Gallium Nitride Transistors in High-Frequency Resonant and Soft-Switching DC-DC Converters. IEEE Trans. Power Electron. 2014, 30, 5151–5158. [Google Scholar] [CrossRef]
  5. Anon. Available online: https://epc-co.com/epc/GaNTalk/Post/15421/Design-Efficient-High-Density-Power-Solutions-with-GaN (accessed on 11 March 2023).
  6. Lidow, A.; De Rooij, M.; Strydom, J.; Reusch, D.; Glaser, J. GaN Transistors for Efficient Power Conversion, 3rd ed.; Wiley: Hoboken, NJ, USA, 2019. [Google Scholar]
  7. Butnicu, D.; Lazar, A. Why Choose Polymer Electrolytic Output Capacitors for Maximum Ripple Capability and Reliability Performance within eGaN based POL Converters. In Proceedings of the International Conference and Exposition on Electrical and Power Engineering (EPE), Iasi, Romania, 22–23 October 2020; IEEE: New York, NY, USA, 2020. [Google Scholar] [CrossRef]
  8. Anon. Available online: https://www.marketwatch.com/press-release/polymer-capacitor-market2020-top-leading-countries-companies-consumption-drivers-trends-forces-analysis-revenue-challenges-and-forecast-2026-2020-04-15 (accessed on 11 March 2023).
  9. Young, J. Polymer Tantalum Capacitors for Automotive Applications; CARTS International: Santa Clara, CA, USA, 2014; pp. 297–311. [Google Scholar]
  10. Lewis, J. Introduction to Polymer Capacitors. Available online: http://www.electronicproducts.com/Passive_Components/Capacitors/Introduction_to_polymer_capacitors.aspx (accessed on 11 March 2023).
  11. Weaver, M. Attributes and Challenges of Polymer Electrolytic Capacitors in High Reliability Applications. In Components for Military and Space Electronics; CMSE’18: Los Angeles, CA, USA, 2018. [Google Scholar]
  12. Zednicek, T. New Tantalum Capacitor Technologies Polymer and NbO. AVX Technical. 2007. Available online: https://www.avx.com/docs/techinfo/newtant.pdf (accessed on 11 March 2023).
  13. Freeman, Y.; Lessner, P. Evolution of Polymer Tantalum Capacitors. Appl. Sci. 2021, 11, 5514. [Google Scholar] [CrossRef]
  14. Freeman, Y. Tantalum and Niobium-Based Capacitors, 1st ed.; Springer: Berlin/Heidelberg, Germany, 2017. [Google Scholar]
  15. Pecht, M.G.; Nash, F.R. Predicting the Reliability of Electronic Equipment. Proc. IEEE 1994, 82, 992–1004. [Google Scholar] [CrossRef]
  16. Gadalla BS, A.; Schaltz, E.; Siwakoti, Y.P.; Blaabjerg, F. Analysis of loss distribution of Conventional Boost, Z-source and Y-source Converters for wide power and voltage range. Trans. Environ. Electr. Eng. 2017, 2, 9. [Google Scholar] [CrossRef]
  17. IEC. TR 62380: Reliability Data Handbook; IEC: Geneva, Switzerland, 2006. [Google Scholar]
  18. Available online: https://www.dsiintl.com/wp-content/uploads/2017/04/MIL_HDBK_217F_N2.pdf (accessed on 11 March 2023).
  19. Zhou, D.; Wang, H.; Blaabjerg, F. Mission Profile Based System-Level Reliability Analysis of DC/DC Converters for a Backup Power Application. IEEE Trans. Power Electron. 2017, 33, 8030–8039. [Google Scholar] [CrossRef] [Green Version]
  20. Zhou, D.; Wang, H.; Blaabjerg, F. Lifetime estimation of electrolytic capacitors in a fuel cell power converter at various confidence levels. In Proceedings of the 2016 IEEE 2nd Annual Southern Power Electronics Conference (SPEC), Auckland, New Zealand, 5–8 December 2016; pp. 1–6. [Google Scholar] [CrossRef] [Green Version]
  21. Zhou, D.; Song, Y.; Liu, Y.; Blaabjerg, F. Mission Profile Based Reliability Evaluation of Capacitor Banks in Wind Power Converters. IEEE Trans. Power Electron. 2018, 34, 4665–4677. [Google Scholar] [CrossRef]
  22. Sangwongwanich, A.; Shen, Y.; Chub, A.; Liivik, E.; Vinnikov, D.; Wang, H.; Blaabjerg, F. Mission Profile-based Accelerated Testing of DC-link Capacitors in Photovoltaic Inverters. In Proceedings of the 2019 IEEE Applied Power Electronics Conference and Exposition (APEC), Anaheim, CA, USA, 17–21 March 2019; pp. 2833–2840. [Google Scholar] [CrossRef]
  23. Matsumori, H.; Urata, K.; Shimizu, T.; Takano, K.; Ishii, H. Capacitor loss analysis method for power electronics converters. Microelectron. Reliab. 2018, 88–90, 443–446. [Google Scholar] [CrossRef]
  24. Anon. Available online: https://epc-co.com/epc/Portals/0/epc/documents/guides/EPC9059_qg.pdf (accessed on 11 March 2023).
  25. Anon. Available online: https://epc-co.com/epc/Products/eGaNFETsandICs/EPC2100.as-px (accessed on 11 March 2023).
  26. Prymak, J. Ripple Current Capabilities. 2004 in KEMET Technical Update. Available online: https://www.newark.com/pdfs/techarticles/kemet/Ripple-Current-Capabilities-Technical-Update.pdf (accessed on 11 March 2023).
  27. Yang, S.; Bryant, A.; Mawby, P.; Xiang, D.; Ran, L.; Tavner, P. An industry-based survey of reliability in power electronic converters. IEEE Trans. Ind. Appl. 2011, 47, 1441–1451. [Google Scholar] [CrossRef]
  28. Falck, J.; Felgemacher, C.; Rojko, A.; Liserre, M.; Zacharias, P. Reliability of power electronic systems: An industry perspective. IEEE Ind. Electron. Mag. 2018, 12, 24–35. [Google Scholar] [CrossRef] [Green Version]
  29. Butnicu, D. A Derating-Sensitive Tantalum Polymer Capacitor’s Failure Rate within a DC-DC eGaN-FET-Based PoL Converter Workbench Study. Micromachines 2023, 14, 221. [Google Scholar] [CrossRef] [PubMed]
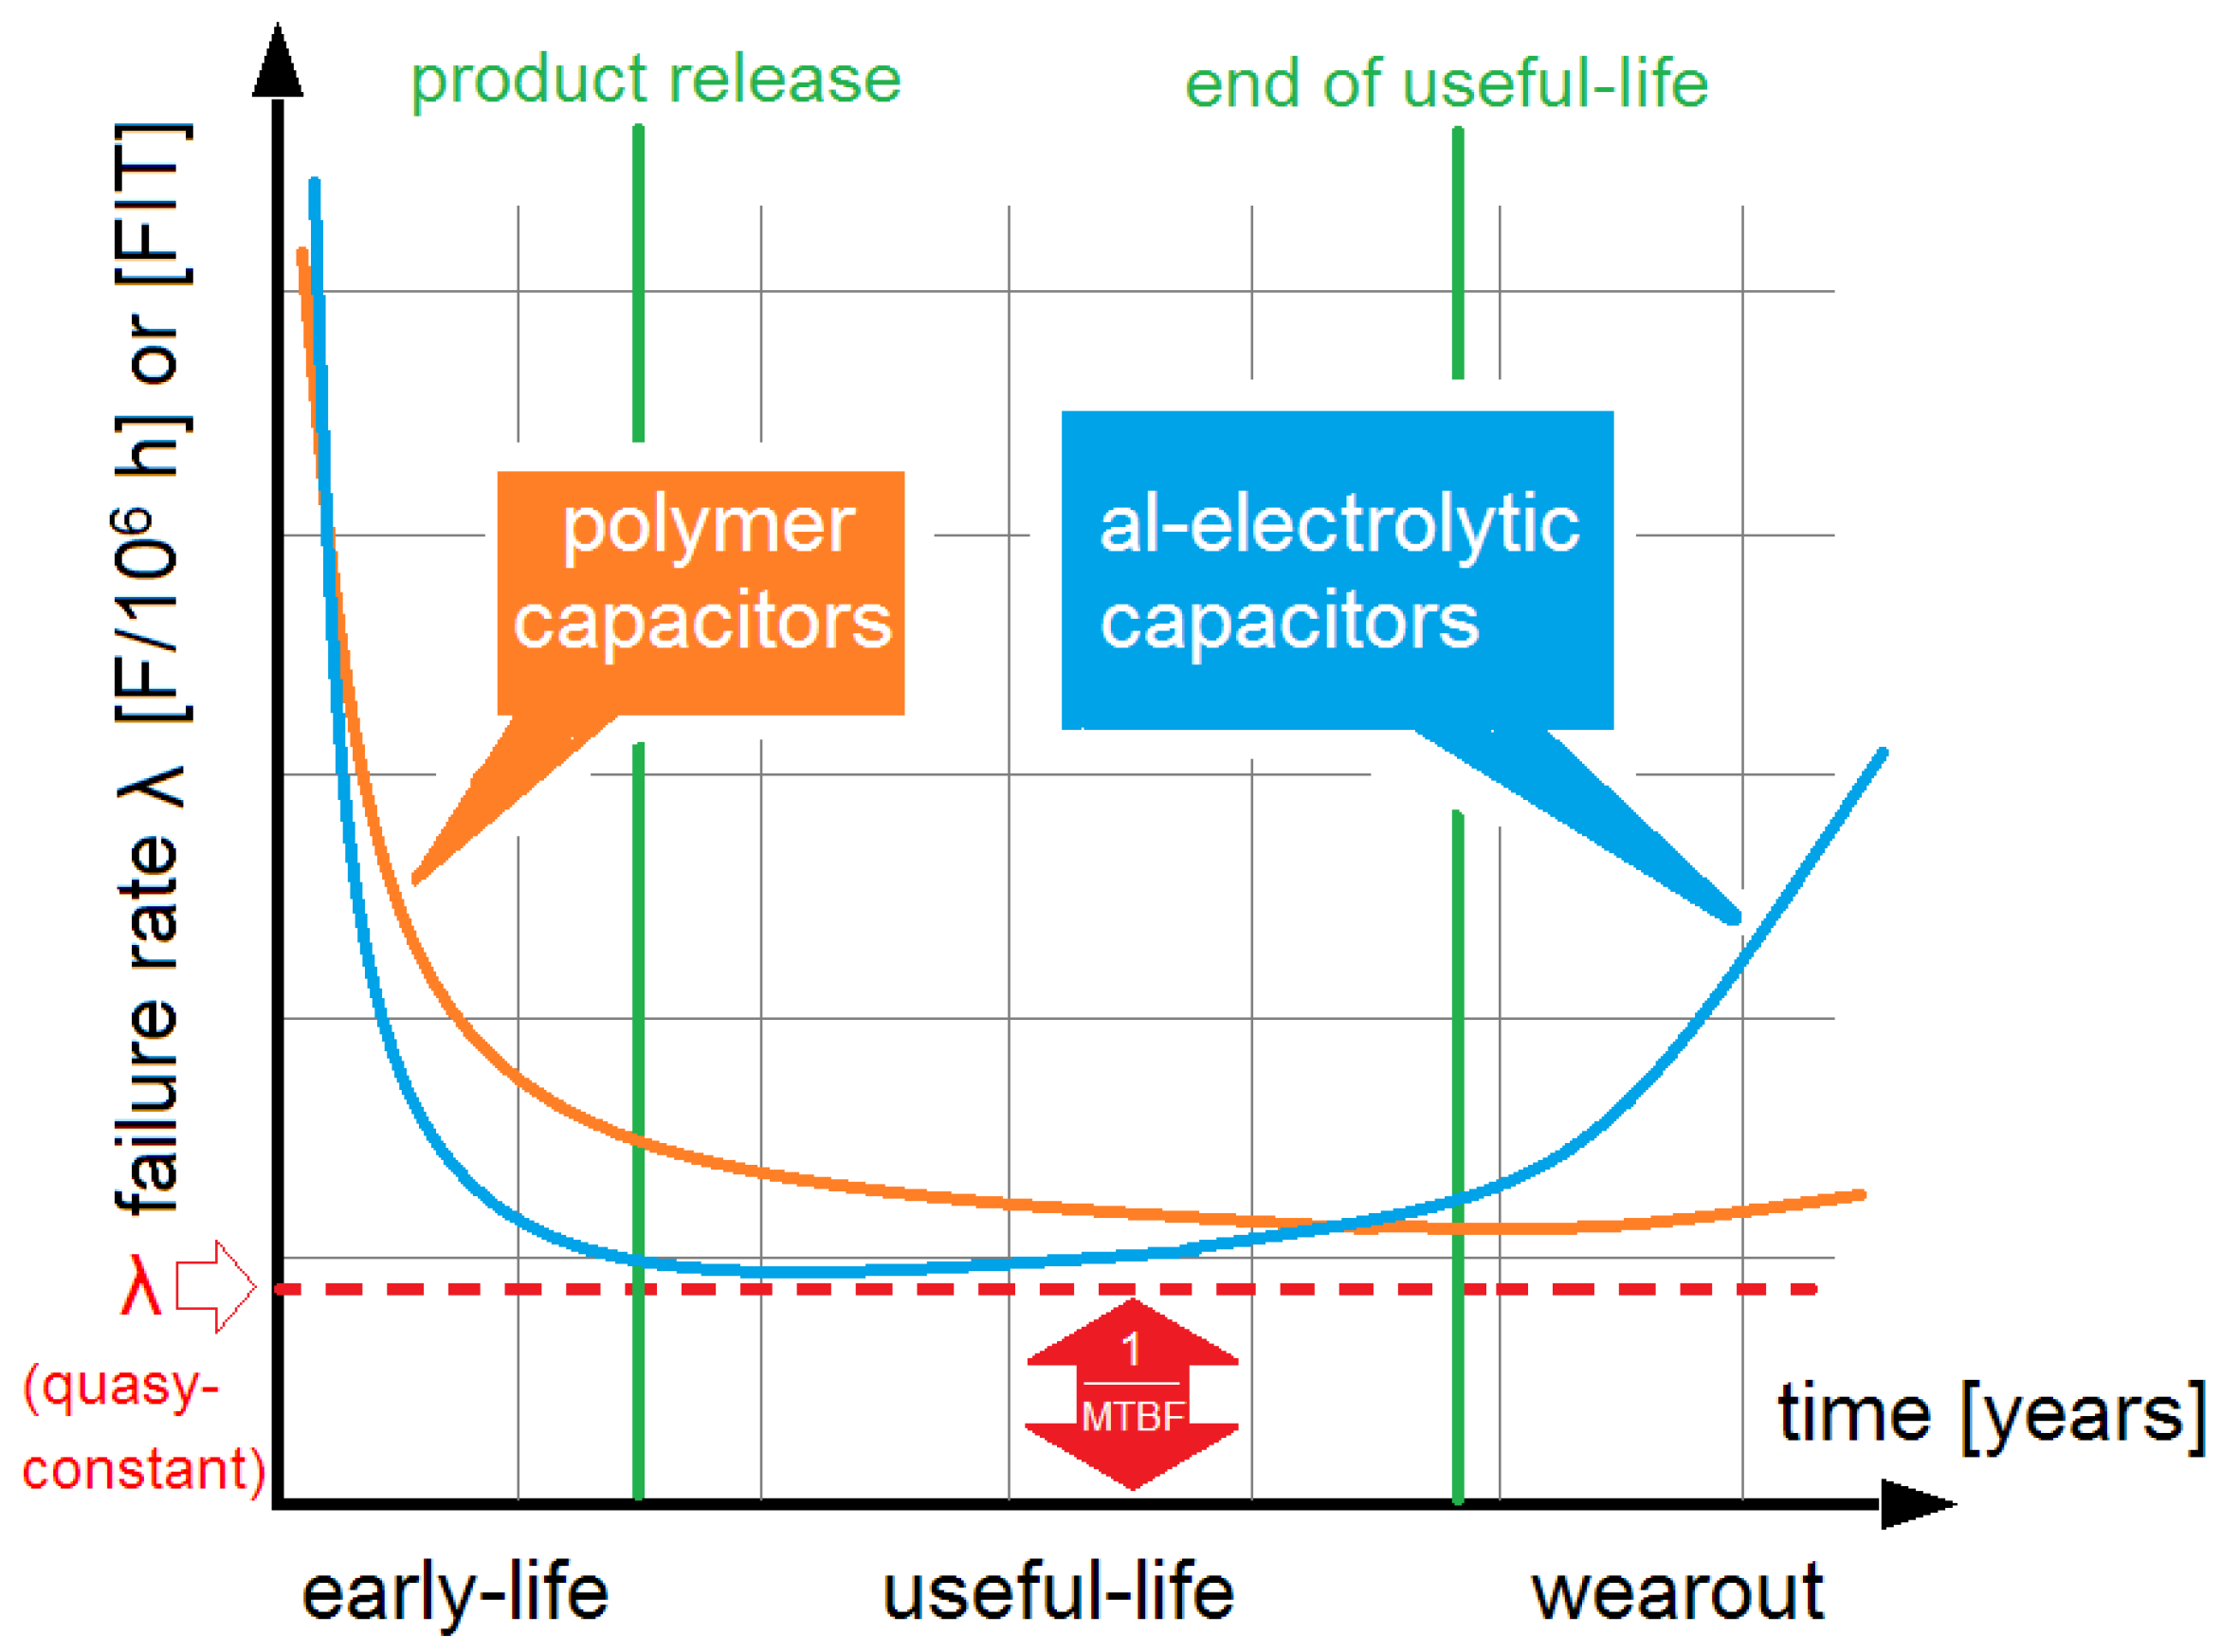
Figure 1. The bathtub curve: failure rate λ is assumed to be a quasi-constant value during the useful life only.
Energies 16 02768 g001
Figure 2. Contribution to converter’s failure rate from various components of a PoL converter (percentual).
Energies 16 02768 g002
Figure 3. Temperature factor πT versus ambient temperature for ceramic class I, tantalum MnO2, tantalum polymer, aluminum electrolytic non-solid electrolyte (with TR = capacitor temperature, which is different from the ambient temperature if a current flows through the capacitor or if it is heated by a radiative environment such as a dissipating component; therefore, it is necessary to measure the case temperature), fixed plastic, polymer capacitor can-type, polymer electrolytic multilayer SMD (redrawn from IEC TR 62380 standard at 25 °C [17]).
Energies 16 02768 g003
Figure 4. Life expectancy calculation based on excerpt from TR62380 standard for aluminum electrolytic non-solid electrolyte capacitor. A capsule temperature of 32 °C results in a lifetime of 60,000 h (55,715 from formula by calculation) or about 10 years (redrawn from IEC TR 62380 standard [17]).
Energies 16 02768 g004
Figure 5. Diagram of connections used to obtain the voltage ripple waveforms and capacitor’s temperature. The actual tested capacitors shown are: MLCC, polymer electrolytic, aluminum electrolytic, Ta-polymer, multilayer polymer, MnO2-tantalum technologies.
Energies 16 02768 g005
Figure 6. EPC9059/30V development board [24] containing two EPC2100 eGaN transistors [25] (right) and thermal photo of it showing capacitor’s temperature (left).
Energies 16 02768 g006
Figure 7. Coil current and switching point voltage waveforms on the DSO (digital storage oscilloscope) that validate the functioning of the converter in CCM (continuous conduction mode).
Energies 16 02768 g007
Figure 8. Data taken from measurement, photo of capacitor Ta-MnO2 type AVX 330G T2601 as DUT (left–center), the actual ripple’s waveform (left) and surface capacitor’s temperature which is required in reliability calculations (right).
Energies 16 02768 g008
Figure 9. Data taken from measurement, photo of MLCC capacitor Murata, GRM32ER60J107ME20-type as DUT (left–center), the actual the ripple’s waveform (left) and surface capacitor’s temperature. (* Given that there is a variation in the capacity with DC-bias, i.e., its decrease, the parallel connection of three units leads to a better behavior compared to this aspect).
Energies 16 02768 g009
Figure 10. Data taken from measurement, photo of aluminum electrolytic capacitor type OMNI 470/25V (−40 °C + 105 °C) as DUT (left–center), the actual the ripple’s waveform (left) and surface capacitor’s temperature which is required in reliability calculation (right).
Energies 16 02768 g010
Figure 11. Data taken from measurement, photo of capacitor polymer electrolytic-can type SMD Nichicon, PCF0J471MCL6GS as DUT (left–center), the actual the ripple’s waveform (left) and surface capacitor’s temperature which is required in reliability calculation (right).
Energies 16 02768 g011
Figure 12. Data taken from measurement, photo of capacitor Ta-polymer 2R5TPE330M7 as DUT (left–center), the actual the ripple’s waveform (left) and surface capacitor’s temperature which is required in reliability calculation (right).
Energies 16 02768 g012
Figure 13. Data taken from measurement, photo of capacitor polymer electrolytic multilayered SMD330/8732d EEFCX0E33R as DUT (left–center), the actual the ripple’s waveform (left) and surface capacitor’s temperature which is required in reliability calculation (right).
Energies 16 02768 g013
Figure 14. Converter output voltage measurement of peak-to-peak ripple and the capsule’s temperature detected for the film capacitor.
Energies 16 02768 g014
Figure 15. MTBF for seven types of capacitor technologies. Blue shows a common level of stress, and red shows a ten-fold more stressful situation.
Energies 16 02768 g015
Figure 16. ESR percentage decrease at working temperature of the capacitor within mission profile, depending on capacitor’s technology.
Energies 16 02768 g016
Table 1. Calculated parameters πT and ΔTi function of capacitor’s technology.
ParameterMLCCTantalum
MnO2
Tantalum
Polymer
Polymer Multi-LayeredAl-Polymer
Can-Type
Al Electro
Lytic Wet
πT0.930.990.990.75650.75650.48
TR (ΔTi)32 °C32 °C31 °C30 °C31 °C32 °C
Table 2. Qualification test condition according to capacitor types.
Qualification TestDuration (Hours)Temperature (°C)
1100085
2200085
3500085
42000105
510,00085
62000125
Table 3. Parameters of the tested PoL buck converter.
ParameterValue
Load resistorRload = 1 Ω/50 W
Load currentIout = 1.2 A and 12 A
Input currentIin = 1.2 A
Input voltageVin = 12 V
Output voltageVout = 1.2 V
(Duty cycle = 7.65%)
Switching frequencyfsw = 250 khz
InductorL = 0.03 mH
Ambient temperature~25 °C
Duty cycle15%
Table 4. Capacitors’ comprehensive characterization by their technology after measurements and calculation.
Capacitor TechnologyESRReliabilityFootprintRipplePriceFailure ModeStable over TimeStable over VoltageOptimal Solution
Ta-MnO2
H-chip
very high••••°↑ (relatively
high)
mostly shortto avoid
MLCC SMDvery low•••••••••↓ (low)mostly short° (aging !)°very good
Aluminum electrolytic non-solid electrolyteultrahigh° °°°↕ (evenly)short↔open°°to avoid
Polymer electrolytic can-type, V-chiplow••••↑↑ (high)mostly open°very good
Ta-polymer H-chip(flat)low•••••↑↑ (high)mostly shortvery good
Polymer multilayered H-chip(flat)very low•••••↑↑↑ (costly)mostly openthe best
• is a plus, ° is a minus.
Table 5. Actual ESR in working environment within mission profile.
Capacitor TechnologyESR at 25 °C (mΩ)Tactual (°C)ESRactual (mΩ)
MnO2-tantalum1003290.751916
Ta-polymer503146.009383
Polymer multilayer263024.258858
Table 6. Indices of reliability yield at load current of 1.2 A and 12 A.
Capacitor
Technology
TR (°C) at 1.2 ATR (°C)
at 12 A
πTMTBF
at 1.2 A
(yr)
MTBF
at 12 A
(yr)
Ta-MnO232401.0218.8613.99
MLCC32351.02122.80122.83
Al-lytic wet32450.806.405.49
Polymer can-type31400.9812.604.48
Ta-polymer31351.0318.8613.86
Polymer multilayered31350.9018.8610.57
Film29310.8371.3971.40
Disclaimer/Publisher’s Note: The statements, opinions and data contained in all publications are solely those of the individual author(s) and contributor(s) and not of MDPI and/or the editor(s). MDPI and/or the editor(s) disclaim responsibility for any injury to people or property resulting from any ideas, methods, instructions or products referred to in the content.