Abstract
Health status assessment is the key link of transformer-condition-based maintenance. The health status assessment method of power transformers mostly adopts the method based on the health index, which has the problems of multiple parameters of each component and strong subjectivity in the selection of weight value, which is easily causes misjudgment. However, the existing online monitoring system for dissolved gas in transformer oil (DGA) can judge the normal or abnormal state of the transformer according to the gas concentration in a monitoring cycle. Still, there are problems, such as fuzzy evaluation results and inaccurate judgment. This paper proposes a dynamic state evaluation method for power transformers based on the Mahalanobis–Taguchi system. First, the oil chromatography online monitoring time series is used to screen key features using the Mahalanobis–Taguchi system to reduce the problem of excessive parameters of each component. Then, a Mahalanobis distance (MD) calculation is introduced to avoid subjectivity in weight selection. The health index (HI) model of a single transformer is built using the MD calculated from all DGA data of a single transformer. Box–Cox transformation and 3 σ criteria determine the alert value and threshold value of all transformer His. Finally, taking two transformers as examples, we verify that the proposed method can reflect the dynamic changes of transformer operation status and give early warning on time, avoiding the subjectivity of parameter and weight selection in the health index, which easily causes misjudgment and other problems and can provide a decision-making basis for transformer condition-based maintenance strategies.
1. Introduction
Accurately and timely mastering the changes in the health status of power transformers is an important link in the life-cycle management of transformers and is the premise and basis for carrying out the digital operation and maintenance of power transformers [1]. The health status of power transformers is a typical multi-attribute decision-making problem. Generally, the health index represents the degree of performance degradation or deviation compared with the normal performance status. Its value is a single value between zero and one. The higher the value is, the better the operating status of the equipment is. In practical engineering applications, health status is often divided into several levels by qualitative methods, such as health, attention, and abnormality.
Due to the complex structure of the power transformers, there are a wide variety of indicators related to the running state of the transformer [2,3,4], such as electrical tests, oil and gas tests, oil quality tests, etc. However, there are intricate relationships between the indicators and the health state, and the test period needs to be inconsistent, which cannot reflect the dynamic change of the health state of the power transformer. With the widespread application of oil chromatography online monitoring systems (DGA), how to use oil chromatography online monitoring data to accurately and timely evaluate and predict power transformer operation status is an urgent problem to be solved in the digital operation and maintenance of equipment.
There are many methods for evaluating the health status of power transformers, mainly focusing on three directions: the health-index-based method, the machine-learning-based method, and the uncertainty-reasoning-based method. The health-index-based method [5,6,7,8,9] constructs a health index model according to the aging formula of the power transformer. Still, the model’s design of parameters and weights is complicated and subjective, which may result in miscalculations. The machine-learning-based methods require a large amount of sample data, such as support vector machines [10,11,12], adaptive fuzzy neural networks [13], adaptive probabilistic neural networks [14,15,16], fuzzy C-means clustering [17], etc. There are certain limitations when facing small sample data, such as the transformer’s abnormal state. Based on the evaluation method of uncertainty reasoning, uncertain knowledge reasoning is used to draw a reasonable or approximately reasonable conclusion with a certain uncertainty, such as fuzzy reasoning [18], cloud matter element theory [19], evidence theory [20], multi-layer architecture [21], etc. There is a problem in that the limitation of distance space is ignored, and the relationship between each feature cannot be accurately reflected. To sum up, although these methods solve the problem of power transformer health assessment, there are still some problems, such as strong subjectivity in parameter and weight selection, large sample data demand, and inability to eliminate the impact of feature correlation.
This paper proposes a dynamic assessment method of the transformer health state based on the Mahalanobis–Taguchi system. By constructing a Mahalanobis–Taguchi system to screen key features, a single health index model is constructed using the spatially optimized Mahalanobis distance, Box–Cox transformation, and 3 σ. The criterion determines the alert value and threshold value of all transformers. The example verifies that the proposed method can reflect the dynamic changes of the power transformer operation state and effectively solve the problems of too many selected parameters in the health index and subjectivity and misjudgment of weight selection.
2. Selection of Research Objects
The data of the DGA online monitoring system of transformers used in this paper are all the data of power transformers of the same voltage level in a certain area, as shown in Figure 1. The external conditions are basically the same, and the influence of the external climate can be ignored. All the selected DGA online monitoring data are used to screen the key features according to the characteristics of the Mahalanobis–Taguchi system. Calculate the corresponding MD of the filtered features and calculate the overall alert value and the threshold value of all transformers. Finally, the HI curve of a single transformer is solved for the dynamic health assessment of the transformer.
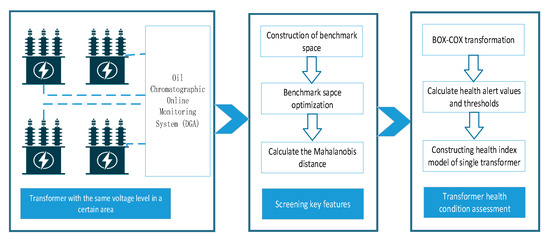
Figure 1.
Research ideas.
3. Construction and Optimization of Mahalanobis–Taguchi System
The Mahalanobis–Taguchi System (MTS) method is a classification method that combines Mahalanobis distance, orthogonal arrays (OAs), and signal-to-noise ratio (SNR) to achieve multi-dimensional data [22,23]. Compared with other classification algorithms, it has the advantages of simple principles and fast running speed. Compared with Euclidean distance, MD is not affected by dimensions. Considering the relationship between features, MD eliminates the interference of correlation between features and can be used as a measure of multi-dimensional features to quantify the system’s health status.
3.1. Construction of the Benchmark Space
The datum space is the benchmark for judging whether an event occurs. Because of determining the characteristic variable, we calculate the Mahalanobis distance to extract normal data samples and form the benchmark space data matrix.
(1) Build the initial feature set.
DGA monitors the content of eight gases in transformer oil, as shown in Table 1.

Table 1.
Gas contents.
The content fluctuation range of carbon monoxide (CO) and carbon dioxide (CO2) in the DGA monitoring data is too large, which harms the subsequent evaluation. So the remaining six gas contents are selected as the initial characteristics. It is assumed that the transformer has p data characteristics monitored by DGA, and n data are collected in a certain period, so there is an evaluation matrix,
(2) Calculate the correlation-type Mahalanobis distance.
Standardize the data of each sample as follows,
In the formula, yij is the standardized result of the jth variable of the ith sample; xij is the observed value of the jth variable of the ith sample; and mj and sj are the mean and standard deviation of the jth variable, respectively.
The formula for calculating the correlation Mahalanobis distance is,
In the formula, Yi = (yi1, yi2, yi3, …, yi6) T is the standardized data of the ith sample; and is the covariance matrix (or correlation coefficient matrix) of the p features of the normal sample.
(3) Build a benchmark space.
Since all DGA data are calculated when MD is calculated and its status cannot be distinguished by the whole data, the existing judgment results (normal (MDn), abnormal (MDa)) in DGA sample data are used to determine its threshold value. The maximum MD value corresponding to the normal state and the minimum MD value corresponding to the abnormal state in the DGA are used to calculate the screening threshold of the reference space, preliminarily screen the sample dataset, and form the reference space. The formula is as follows:
In the formula, MDa(min) represents the minimum value of the Mahalanobis distance corresponding to the abnormal state of the DGA, and MDn(max) represents the maximum value of the Mahalanobis distance corresponding to the normal state of the DGA. The MD defined in Equation (5) is the standardized MD, which can distribute the MD value of normal samples around one and not exceed the critical value T. The MD value of abnormal samples should be greater than the critical value T, and the Mahalanobis distance increases with the spatial difference between samples.
3.2. Validation of Benchmark Space
Before optimizing the benchmark space, we confirm the validity of the basic space constructed in Section 3.1:
(1) The data samples are divided into normal and abnormal samples sets according to Formula (6). When M > T, it is an abnormal sample. A normal sample is M < T.
(2) The mean value and standard deviation of normal samples are used to standardize abnormal samples, and the Mahalanobis distance (M1) of normal samples and the Mahalanobis distance (M2) of abnormal samples are calculated, respectively.
(3) If M1 < T < M2, it is considered that the datum space constructed is effective. Otherwise, it is necessary to re-select feature variables before constructing the datum space.
3.3. Baseline Space Optimization
The initial feature set is screened, the features that may generate redundant information are eliminated, and the remaining important features are used to classify normal and abnormal samples to reduce the computational cost and complexity.
In MTS, OAs are used to minimize feature combinations to identify important features, and SNR “gain” filters effective features. The details are as follows:
(1) Design a two-level orthogonal table, assign the initial feature variables to different columns of the orthogonal table, and use “1” or “2” to indicate whether the feature variable participates in the construction of the benchmark space. Each row of the orthogonal table corresponds to a Mahalanobis space, as shown in Table 2.

Table 2.
Orthogonal table.
(2) Calculate the signal-to-noise ratio of samples.
Calculate the Mahalanobis distance of samples MDk, k = 1, 2, …, t. Then, the sample’s expected large characteristic signal-to-noise ratio is,
(3) Calculate the SNR increment of the feature quantity xj
In the formula, and represent the mean SNR of xj that participates in the construction of the benchmark space and the mean SNR that does not participate in the construction of the benchmark space. When , the selected feature variable has a positive effect; otherwise, it represents a negative effect.
(4) Verify the optimized benchmark space.
The Mahalanobis distances of normal and abnormal samples are calculated using the optimized features to verify the validity of the optimized benchmark space, which can be used for the classification and prediction of transformer health status. Currently, the recalculated Mahalanobis distances of normal and abnormal samples are MDH and MDU, respectively.
4. Health Index Model Construction
The MD value at a certain time can only describe the distance distribution with each transformer. It cannot reflect the performance degradation or deviation degree compared with the expected normal performance state. Therefore, applying the Mahalanobis distance of each state to the health index model is necessary to intuitively and dynamically evaluate the transformer health state change.
The traditional evaluation method can only obtain the evaluation results of the transformer in a period and cannot obtain the state time series curve in time. However, the health index curve can be obtained by introducing the health index curve and using the time series. It can not only know the status of the transformer at this time but also predict the operation trend of the transformer in the future through the new detection data and realize the continuous dynamic evaluation of the transformer.
4.1. Transformer Health Index
Using the normal sample MD value calculated in Section 2 and drawing on the characteristics of the function exp(x), the transformer health index function is constructed, namely:
In the formula, MDH is the MD value of all DGA data of the selected sample transformer, and α is the adjustment index that makes the severe fault HI approach 0, which can be determined by the MD mean value of the healthy state and the confidence level HIR of the transformer when it is healthy, namely:
The confidence level when the transformer is healthy is obtained from the statistics of transformer operation data. If the detection accuracy is 95% during the normal operation of the transformer, then HIR = 0.95.
It can be seen from Equation (9) that when the transformer is healthy, its MD value is around one, and the corresponding HI value is slightly lower than one. When the transformer is in the attention state, if the MD exceeds a certain threshold value, the corresponding HI value will deviate from one, and the larger the MD is, the smaller the HI value will be. When the transformer is abnormal, the MD value is much larger than one, and the HI value becomes very small, close to zero. The MD value fluctuates at (0, +∞), while the HI value always stays at (0, 1). The above analysis shows that the HI function constructed by Equation (9) is consistent with its definition and can be used to reflect the health status of transformer operation.
4.2. Determination of HI Alert Values and Thresholds
The status of the transformer will be divided into three categories: health, attention, and abnormal. Through the HI warning value and the threshold value, the status of the transformer during operation can be found in time. It belongs to the healthy state if it is greater than the warning value. It is an attention state if it is between the warning value and the threshold value. If it is less than the threshold value, it is an abnormal state, which provides a decision basis for digital operation [24].
The MD value of the normal sample calculated by MTS generally does not obey the normal distribution [25]. It can be converted into a normal distribution (or approximate normal distribution) using the Box–Cox transformation. The conversion formula is,
In the formula, MDf is the MD value of the f (f = 1, 2, …, n) sample, MDf(λ) is the transformed value, and λ is the maximum likelihood function obtained from the maximum likelihood,
where is the MD means of normal samples after Box–Cox transformation.
After the Box–Cox transformation, MDf(λ) obeys the normal distribution, and the 3 σ criteria are used to calculate the warning value T2σ and the threshold T3σ corresponding to the transformed normal sample MD, namely,
where uMD(λ) and sMD(λ) are the MD mean and standard deviation of normal samples after Box–Cox transformation.
According to the T2σ, T3σ values, and the optimal transformation parameters, We can obtain the MD warning value and the threshold value of the normal sample before transformation, and we can obtain the HI warning value and threshold value by using Formula (9), namely,
In the formula, HIw and HIf are the HI warning value and the threshold value. The MTS flowchart is shown in Figure 2.
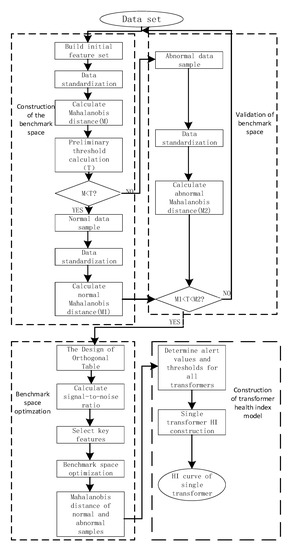
Figure 2.
Process of MTS.
5. Case Analysis
We selected 6220 kV oil-immersed transformers installed with DGA in a power grid. DGA collects data on the transformers every 24 h. A total of 1963 data from 2019 to 2021 were collected as data samples.
(1) Constructing the benchmark space of the Mahalanobis–Taguchi system.
The correlation coefficient matrix obtained from all the collected transformer oil chromatographic online monitoring data is shown in Table 3. Since the correlation coefficient between C2H4 and total hydrocarbons is 0.953, the correlation type is too strong. It is proved that these two characteristics play a similar role in the subsequent state evaluation, so H2, CH4, C2H2, C2H6, and total hydrocarbons are selected. A total of five features are used as the initial feature set.

Table 3.
Correlation coefficient matrix.
The selected five features are used as standard variables to construct the benchmark space, and the Mahalanobis distances of all samples are calculated after standardizing the data, as shown in Figure 3. The red dots in the figure represent samples judged as normal by the DGA device, and the blue dots represent samples judged as abnormal by the DGA device. The judgment results of the DGA device are partially normal, and the abnormal boundary is blurred, which is prone to misjudgment.
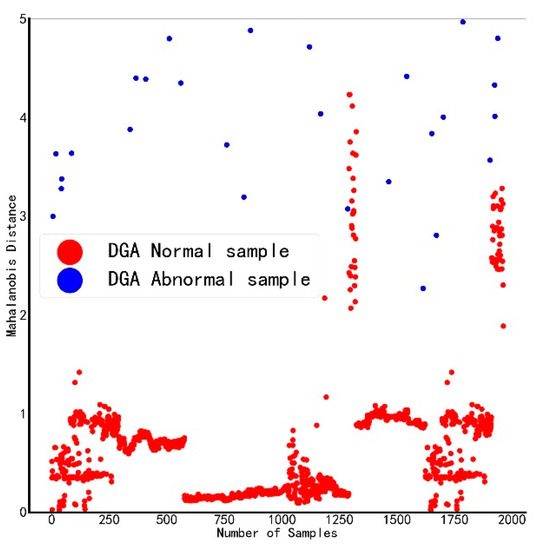
Figure 3.
Mahalanobis distance distribution of DGA data.
Use Formula (6) to calculate the preliminary screening threshold T = 2, and take samples with MD ≥ 2 as abnormal and MD < 2 as normal samples to construct the benchmark space. The Mahalanobis distance distribution in the benchmark space is as follows:
(2) Benchmark space validity confirmation.
As we can see from Figure 4, when a sample with a Mahalanobis distance greater than two is taken as an abnormal sample, the calculated Mahalanobis distance can well distinguish normal and abnormal samples. At this time, the reference space constructed by DGA data is effective and can be used to evaluate the status of transformers.
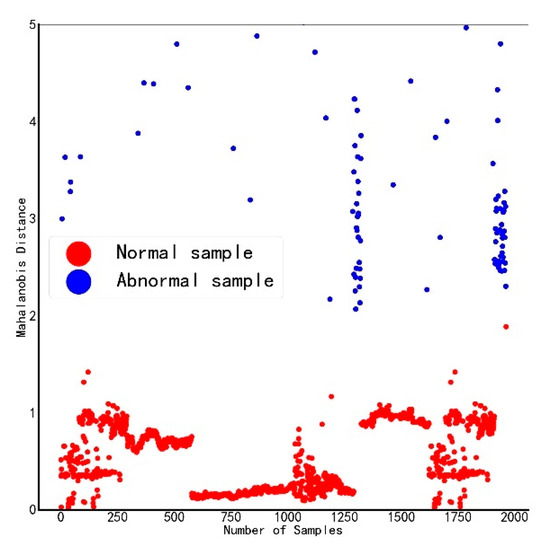
Figure 4.
Optimized Mahalanobis distance distribution.
(3) Baseline space optimization.
Use Formulas (7) and (8) to design the orthogonal table and calculate the signal-to-noise ratio of the reconstructed data. The orthogonal table and the signal-to-noise ratio are shown in Table 4. Among them, one means using the variable, two means not using this variable, and Table 5 shows the mean signal-to-noise ratio. For constructing the orthogonal table of 3 and 4 variables, the number of variables selected must be at least 3 and 4, so it is divided into 11 groups and 6 groups for calculation.

Table 4.
Signal-to-noise ratio calculation.

Table 5.
Mean signal-to-noise ratio.
The Mahalanobis distance is only effective when the number of characteristic variables is greater than or equal to three. Therefore, we can learn from Table 4 that three or four variables can be selected as key variables to construct a new Mahalanobis space. When calculating SNR, a negative number represents a negative impact on the accuracy of the evaluation. If the result is a regular representation, it positively affects the evaluation. Still, the CH4 is a negative value, which has the largest absolute value among negative values, so the variable is deleted.
There are two schemes: ① select H2, C2H2, C2H6, and total hydrocarbon content as the key features; ② H2, C2H2, and total hydrocarbon content are selected as key characteristics. By calculating the Mahalanobis distance under normal and abnormal conditions, as shown in Table 6, we can know that ① combined conditions can more accurately distinguish abnormal and normal samples, and its Mahalanobis distance distribution diagram is shown in Figure 5 and Figure 6. Figure 7 is a local enlargement of Mahalanobis distance with four variables selected from five. It can be clearly seen that there are obvious differences between the MD values of normal and abnormal samples, which can be effectively distinguished. However, it can be seen from Figure 8 that for the Mahalanobis distance distribution constructed with three variables selected from five, the MD values of some normal samples have exceeded the MD values of abnormal samples, which cannot accurately distinguish normal and abnormal samples. Figure 8 proves that the Mahalanobis space constructed by three out of five variables is currently invalid. Therefore, combination ① is selected to optimize the Mahalanobis space, and the features in combination ① are selected as the key features.

Table 6.
Mahalanobis distance distribution.
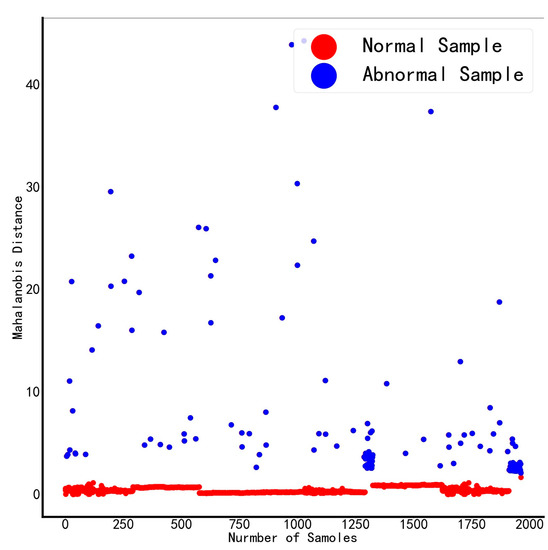
Figure 5.
Five choose four Mahalanobis distance distribution.
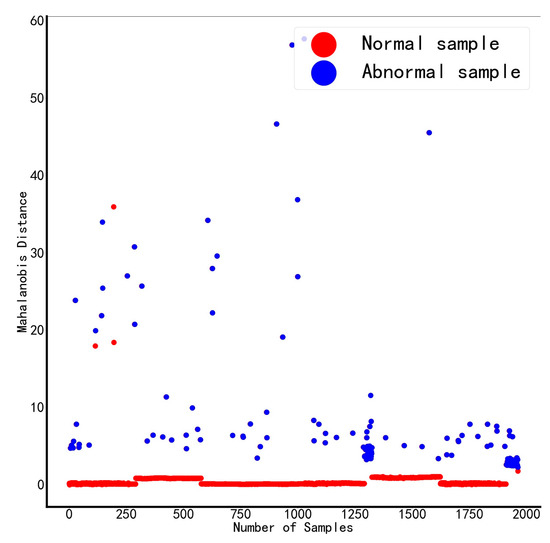
Figure 6.
Five choose three Mahalanobis distance distribution.
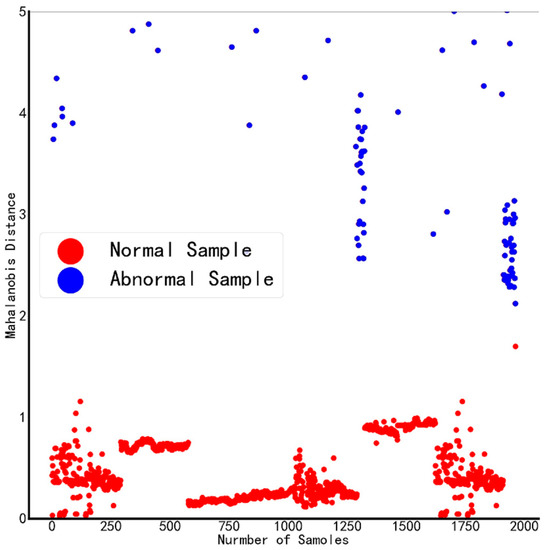
Figure 7.
Five choose four Mahalanobis distance distribution (local graph).
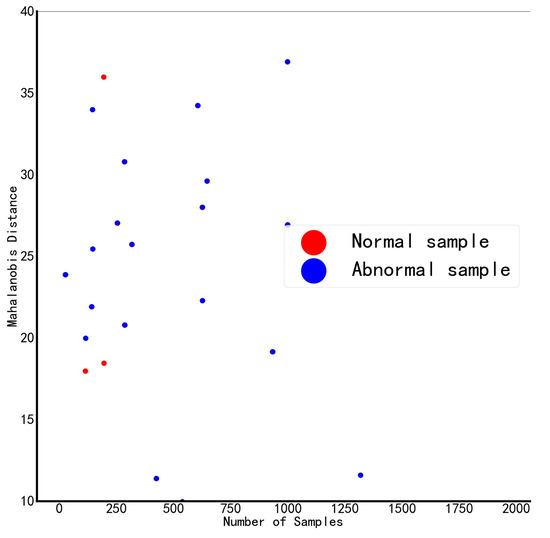
Figure 8.
Five choose three Mahalanobis distance distribution (local graph).
(4) Calculate HI, HI warning value, and HI threshold.
Two 220 kV power transformers are selected, and the transformer’s HI model is constructed using the normal sample MD. Take one of the transformers as an example to illustrate the solution process.
Example 1: The basic information about the transformer is as follows.
The transformer is 220 kV, the model is SFPS9-150000/220, the date of manufacture was April 5, 1997, and it has been in operation for nearly 25 years. The transformer analysis is as follows:
(1) According to Formula (11), use Box–Cox transformation to convert the MD value of normal samples into normal distribution or approximate normal distribution. Calculate the optimal transformation parameter λ = 0.013. The probability distribution before and after MD transformation is shown in Figure 9.
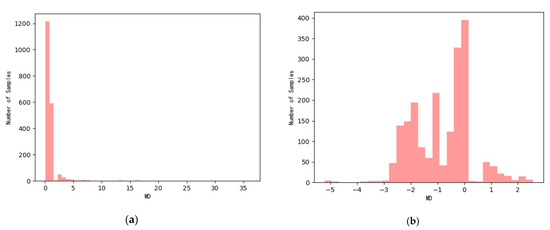
Figure 9.
Probability plots before and after MD transformation. (a) Before the change. (b) After the transformation.
It can be seen from Figure 9 that the MD value after the Box–Cox transformation obeys an approximately normal distribution, and the 3 σ criterion can be used to determine the HI warning value and threshold.
The warning value and threshold value of MD can be obtained from Formula (13), which are respectively T2σ = 0.9956 and T3σ = 1.5843. Then, the warning and threshold value can be calculated as HIw = 0.9502 and HIf = 0.9208, respectively, by Formula (14).
(2) Calculate the HI curve according to Formula (9), as shown in Figure 10.
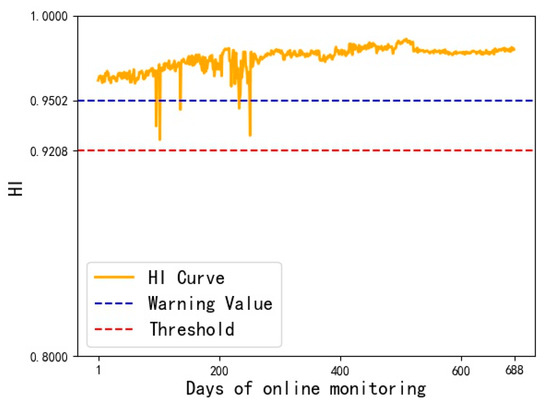
Figure 10.
Example 1: health index curve.
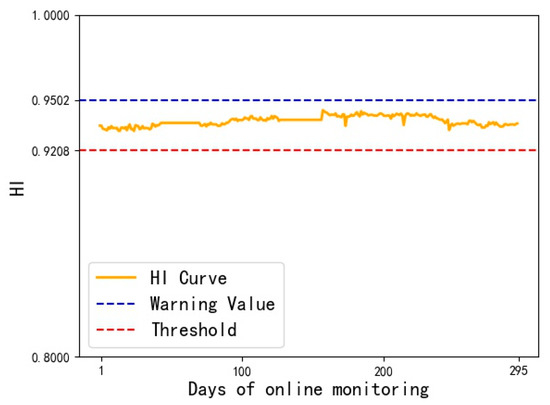
Figure 11.
Example 2: health index curve.
It can be seen from Figure 6 that most of the HI values of this transformer are within the warning value, but the HI values of the 97th, 103rd, 137th, 235th, and 252nd times are less than HIw, and they are in a state of attention. Defects include the silica gel discoloration exceeding 2/3, the fan cannot rotate, the contactor is damaged, and the cooling fan does not reach the set value and starts.
Table 7 shows that the judgment results of the method in the literature [26] for the 137th day are different from that in this paper because this document only uses the attention value of DGA data to calculate and ignores the ambiguity of the boundary, resulting in misjudgment. Still, the actual situation is that the transformer has defects on the 137th day, so this method can more accurately evaluate the status of the transformer.

Table 7.
Example 1: method comparison.
According to the above calculation process, we calculate the health index curve for the second transformer (Example 2), as shown in Figure 11.
It can be seen from Figure 11 that the health index HI value of Example 2 is between the warning value and the threshold value, and it has been in a state of attention. The actual situation is that the fan of this transformer cannot rotate and is in a defective operation state without repair. Hence, the health index curve fluctuates between greater than the threshold value and less than the alert value.
It can be seen from Table 8 that the calculation results of the evaluation method in the literature [26] are consistent with those in this paper, proving the method’s accuracy.

Table 8.
Example 2: method comparison.
It can be seen from the above two examples that the HI curve of the transformer can accurately describe the change in the health state during the operation of the transformer. Health management provides a basis for decision making.
6. Conclusions
The dynamic health status assessment method for a power transformer based on the Mahalanobis distance proposed in this paper uses the online monitoring data of transformer oil chromatogram to build a Mahalanobis space, calculate the Mahalanobis distance of normal samples and abnormal samples, and carry out spatial optimization to screen the key features used in building the transformer health index model. After the Mahalanobis distance distribution is converted into a normal distribution through Box–Cox transformation. The alert and threshold values of all transformer health indexes are calculated. At the same time, all DGA data of a single transformer are used to calculate the health index of a single transformer to achieve timely early warning of transformer health status. The problems, such as fuzzy boundary definition, strong subjectivity in the selection of parameters and weights, and elimination of the influence of feature correlation in the DGA online monitoring system, are eliminated.
The system has certain disadvantages: ① Only online monitoring data of oil chromatography are considered for the selected features; ② Only the total alert value and threshold value corresponding to the health index of all transformers have been calculated, but the alert value and threshold value corresponding to each transformer under different operating conditions have not been calculated. More features will be introduced to evaluate the transformers in future research, further improving the accuracy and applicability of this method.
Author Contributions
Conceptualization, Y.L., W.X. and X.Z.; methodology, Y.L. and W.X.; software, Y.L. and W.X.; validation, Y.L., W.X. and X.Z.; formal analysis, X.Y. and W.X.; investigation, K.X. and X.Z.; resources, X.Y.; data curation, Y.L., Y.X. and R.Z.; writing—original draft preparation, Y.L.; writing—review and editing, W.X.; visualization, Y.L.; supervision, X.Z.; project administration, X.Y. and W.X.; funding acquisition, X.Y. and W.X. All authors have read and agreed to the published version of the manuscript.
Funding
This work was supported by the National Natural Science Foundation of China (NSFC) (No. 52067004), Guizhou Provincial Science and Technology Projects ([2019]1058, [2019]1128, [2022] general 012).
Data Availability Statement
Not applicable.
Acknowledgments
This work was supported by the Distribution Network Energy Conservation and Loss Reduction Research Group of the School of Electrical Engineering of Guizhou University and the Electric Power Research Institute of Guizhou Power Grid Co., Ltd.
Conflicts of Interest
The authors declare no conflict of interest.
References
- Prasojo, R.A.; Gumilang, H.; Suwarno; Maulidevi, N.U.; Soedjarno, B.A. A Fuzzy Logic Model for Power Transformer Faults’ Severity Determination Based on Gas Level, Gas Rate, and Dissolved Gas Analysis Interpretation. Energies 2020, 13, 1009. [Google Scholar] [CrossRef]
- Wang, L.; Littler, T.; Liu, X. Gaussian Process Multi-Class Classification for Transformer Fault Diagnosis Using Dissolved Gas Analysis. IEEE Trans. Dielectr. Electr. Insul. 2021, 28, 1703–1712. [Google Scholar] [CrossRef]
- Tran, Q.T.; Davies, K.; Roose, L.; Wiriyakitikun, P.; Janjampop, J.; Sanseverino, E.R.; Zizzo, G. A Review of Health Assessment Techniques for Distribution Transformers in Smart Distribution Grids. Appl. Sci. 2020, 10, 8115. [Google Scholar] [CrossRef]
- Gonzales, J.; Mombello, E. Power Transformer Condition Assessment Using DGA and FRA. IEEE Lat. Am. Trans. 2016, 14, 4527–4533. [Google Scholar] [CrossRef]
- Badawi, M.; Ibrahim, S.A.; Mansour, D.-E.A.; El-Faraskoury, A.A.; Ward, S.A.; Mahmoud, K.; Lehtonen, M.; Darwish, M.M.F. Reliable Estimation for Health Index of Transformer Oil Based on Novel Combined Predictive Maintenance Techniques. IEEE Access 2022, 10, 25954–25972. [Google Scholar] [CrossRef]
- Cui, Y.; Ma, H.; Saha, T. Improvement of power transformer insulation diagnosis using oil characteristics data preprocessed by SMOTEBoost technique. IEEE Trans. Dielectr. Electr. Insul. 2014, 21, 2363–2373. [Google Scholar] [CrossRef]
- Tamma, W.R.; Prasojo, R.A.; Suwarno. High voltage power transformer condition assessment considering the health index value and its decreasing rate. High Volt. 2021, 6, 314–327. [Google Scholar] [CrossRef]
- Guo, H.; Guo, L. Health index for power transformer condition assessment based on operation history and test data. Energy Rep. 2022, 8, 9038–9045. [Google Scholar] [CrossRef]
- Núñez-Mata, O.; Acuña-Rojas, F.; González-Solís, C.; Gómez-Ramírez, G. Assessment of Power Transformers using a Methodology Based on Health Indices. In Proceedings of the IEEE International Conference on Automation/XXIV Congress of the Chilean Association of Automatic Control (ICA-ACCA), Valparaíso, Chile, 22–26 March 2021; pp. 1–6. [Google Scholar] [CrossRef]
- Ashkezari, A.D.; Ma, H.; Saha, T.K.; Cui, Y. Investigation of feature selection techniques for improving efficiency of power transformer condition assessment. IEEE Trans. Dielectr. Electr. Insul. 2014, 21, 836–844. [Google Scholar] [CrossRef]
- Ma, H.; Saha, T.K.; Ekanayake, C. Statistical learning techniques and their applications for condition assessment of power transformer. IEEE Trans. Dielectr. Electr. Insul. 2012, 19, 481–489. [Google Scholar] [CrossRef]
- Singh, J.; Kumari, P.; Kaur, K.; Swami, A.K. Condition assessment of power transformer using SVM based on DGA. In Proceedings of the 2016 Al-Sadeq International Conference on Multidisciplinary in IT and Communication Science and Applications (AIC-MITCSA), Baghdad, Iraq, 9–10 May 2016; pp. 1–5. [Google Scholar] [CrossRef]
- Zeinoddini-Meymand, H.; Vahidi, B. Health index calculation for power transformers using technical and economical parameters. IET Sci. Meas. Technol. 2016, 10, 823–830. [Google Scholar] [CrossRef]
- Tahir, M.; Tenbohlen, S. Transformer Winding Condition Assessment Using Feedforward Artificial Neural Network and Frequency Response Measurements. Energies 2021, 14, 3227. [Google Scholar] [CrossRef]
- Ahmadi, S.-A.; Sanaye-Pasand, M. A Robust Multi-Layer Framework for Online Condition Assessment of Power Transformers. IEEE Trans. Power Deliv. 2022, 37, 947–954. [Google Scholar] [CrossRef]
- Li, W.-G.; Yu, Q.; Luo, R.-C. Application of fuzzy analytic hierarchy process and neural network in power transformer risk assessment. J. Central South Univ. 2012, 19, 982–987. [Google Scholar] [CrossRef]
- Yu, H.; Yuan, W.; Wang, M.; Zhang, H.; Xiong, W.; Yuan, X.; Zou, X. Comprehensive state assessment method of power transformer based on cloud-matter-element model of asymmetric closeness evidence. Power Grid Technol. 2021, 45, 3706–3713. [Google Scholar] [CrossRef]
- Zeinoddini-Meymand, H.; Kamel, S.; Khan, B. An Efficient Approach with Application of Linear and Nonlinear Models for Evaluation of Power Transformer Health Index. IEEE Access 2021, 9, 150172–150186. [Google Scholar] [CrossRef]
- Eke, S.; Clerc, G.; Aka-Ngnui, T.; Fofana, I. Transformer condition assessment using fuzzy C-means clustering techniques. IEEE Electr. Insul. Mag. 2019, 35, 47–55. [Google Scholar] [CrossRef]
- Zou, Y.; He, J.; Jin, T. Evaluation Model of Transformer Oil-Paper Insulation State Based on NRS and D-S Evidence Theory. J. Electr. Mach. Control. 2021, 25, 89–96. [Google Scholar] [CrossRef]
- Tan, G.; Liu, D.; Shi, Y.; Yang, Z. Condition Assessment Method for Power Transformers Based on Variable Weight Principle and Fuzzy Comprehensive Evaluation. In Proceedings of the 2020 7th International Forum on Electrical Engineering and Automation (IFEEA), Hefei, China, 25–27 September 2020; pp. 883–888. [Google Scholar] [CrossRef]
- Gao, S.; Hong, G.; Gao, G.; Gao, B. Application of Federal Kalman Filtering Based on Mahalanobis Distance in SINS/SRS/CNS Navigation. Chin. J. Inert. Technol. 2021, 29, 141–146. [Google Scholar]
- Huang, J.; Li, S.; Gao, C.; Liu, J. Hardware Trojan detection based on weighted parameter Mahalanobis distance. Comput. Appl. Res. 2021, 38, 2149–2152, 2157. [Google Scholar] [CrossRef]
- Zhou, X.; Liu, W.; Tian, T.; Luo, Y.; Li, X.; He, N.; Ma, B.; Yun, M. A model for evaluating the health status of power transformers considering historical conditions. High Volt. Electr. Appl. 2021, 57, 70–76. [Google Scholar] [CrossRef]
- Wang, Z.; Liu, C. Condition monitoring of wind turbine gearbox based on Box-Cox transformation and relative entropy residual analysis. Chin. J. Electr. Eng. 2020, 40, 4210–4219. [Google Scholar] [CrossRef]
- Zhao, Y.; Zhang, Y.; Nie, D.; Song, Y.; Cai, W. Evaluation method of transformer insulation status based on fuzzy and evidence theory. Power Syst. Prot. Control. 2014, 42, 57–62. [Google Scholar]
Disclaimer/Publisher’s Note: The statements, opinions and data contained in all publications are solely those of the individual author(s) and contributor(s) and not of MDPI and/or the editor(s). MDPI and/or the editor(s) disclaim responsibility for any injury to people or property resulting from any ideas, methods, instructions or products referred to in the content. |
© 2023 by the authors. Licensee MDPI, Basel, Switzerland. This article is an open access article distributed under the terms and conditions of the Creative Commons Attribution (CC BY) license (https://creativecommons.org/licenses/by/4.0/).