Abstract
The ambitious targets for the reduction of Greenhouse Gas (GHG) emissions force the enhanced integration and installation of Renewable Energy Sources (RESs). Furthermore, the increased reliance of multiple sectors on electrical energy additionally challenges the electricity grid with high volatility from the demand side. In order to keep the transmission system operation stable and secure, the present approach adds local flexibility into the distribution system using the modular Energy Hub Gas (EHG) concept. For this concept, two different test cases are configured and evaluated. The two configured EHGs demonstrate the ability to provide flexibility and adaptability by reducing the difference between maximal and minimal load in the surrounding grid infrastructure by in certain time periods. Furthermore, the average energy exchange is reduced by . Therefore, by relieving the grid infrastructure in the local surroundings, the additional potential of RES is enabled and the curtailment of existing ones can be reduced.
1. Introduction
More ambitious targets to cut carbon emissions—e.g., by at least by 2030 in Germany—drastically increase the need for the integration and installation of Renewable Energy Sources (RESs). Given current geopolitics regarding European energy supply, a fully renewable electricity supply is assumed to be required by 2030. The ongoing transition from conventional generator plants towards renewable, decentralized generation by Distributed Energy Resources (DERs) with volatile feed-in raises the challenge of a secure and stable power supply. Furthermore, the fuel-shift in different sectors, such as mobility and space heating, from liquid and gaseous energy carriers to electrical energy, increases the volatility on the demand side. Thus, supply and demand both challenge the existing electricity grid and its established structure. As a result, the traditional downstream power flow from feed-in on the grid level to consumption on a low voltage level is no longer a one-way grid. In this context, system operators on all voltage levels need to ensure a reliable and continuous power supply for customers, which is even more difficult with the transition from a uni-directional to a bi-directional grid. To this end, the Energy Hub Gas (EHG) concept depicted in Figure 1 combining different energy generation, storage and conversion technologies into one integrated plant network provides a promising approach to cope with several of these upcoming challenges. A wide range of technologies can be integrated into this system approach. This effective and smart interconnection between energy supply and demand infrastructures allows increasing local flexibility for electricity grid operation and the provision of renewable energy carriers. The decentralized approach can help accelerate the energy transition by reducing the required electricity grid extension by lowering the interconnection power flow between different voltage levels. Furthermore, local balancing ensures damping of power fluctuation in the immediate network environment and therefore acts as preventive congestion management. The attenuating effect an EHG can provide to the local surrounding grid infrastructure by way of its flexibility leads to the opportunity for further installation of RES. Hence, the established grid infrastructure can be relieved from additional integrated renewable generation. Different time constants between electricity and gas supply infrastructures are becoming useful by interconnecting these sectors through conversion and storage units. Gas infrastructure, storage units, and energy carriers are used to (a) reduce the operation cost for congestion management and re-dispatch, while (b) gradually defossilizing non-electricity demand sectors. To evaluate the approach, a flexible system simulation framework, as discussed in this paper, is necessary, which allows for the evaluation of a wide range of specific EHG configurations and their corresponding use cases.
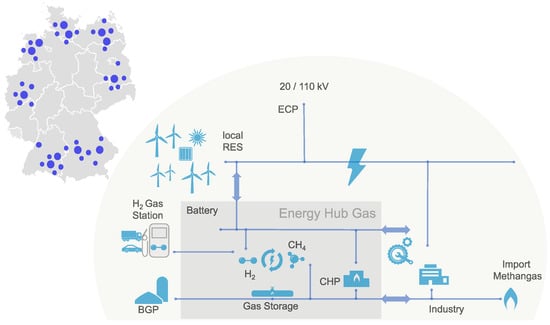
Figure 1.
Energy Hub Gas system overview.
The usefulness of the modular EHG concept is evaluated for different scenarios and different periods of time. The investigated scenarios reflect a representative region with high solar power penetration as dominating renewable electricity feed-in (“German South-West”), and a coastal region with typical high wind power penetration (“German North-West”). These renewable production scenarios are then combined with different demand characteristics. The overall objective is a significant and cost-effective integration of renewable generated power and provision of renewable energy carriers for hard-to-abate and hard-to-electrify demand sectors by optimized operational strategies for the EHG instance. The unique feature of the approach is the combination of these two objectives with an aggregation of today available technologies. Furthermore, the modular fashion of this novel system approach enables the investigation of a wide range of possible applications of the EHG, such as sudden interruption of gas supplies, with little effort. The present paper is organized as follows: Section 2 provides an overview of existing work in the context of Energy Hubs (EHs) and their applications. Furthermore, a distinction between the work presented here is given. In Section 3, the mathematical basis of the EH concept is summarized. Next, the simulation setup with its framework character is presented in Section 4. A detailed look into the component models used and the test cases investigated is given. Following Section 5, exemplary simulation results of two different test cases are evaluated and discussed. Finally, the paper concludes with Section 6 and provides an outlook for future research.
2. Related Work
As further development of the approach in [1], the Energy Hub Gas (EHG) concept utilizes a distributed system simulation model of a controllable modular set of technical plants. This system model interconnects electricity and gas supply with different final energy demand sectors (electricity, heat, fuel for mobility, chemical intermediate or commodity for industry) in a smart and flexible way, providing, e.g., utilities flexibility for grid operation. In contrast to [2], Renewable Energy Source (RES) are considered but not included inside the EHG. The present paper focuses on the modular design of the energy hub concept inspired by [3,4,5,6], which allows adapting (the model of) the plant ecosystem to different settings of existing infrastructure and specific operational requirements. In addition to the physical interconnections of facilities presented in [1], this novel setup especially revises renewable gas components by deepening the level of detail for the conversion from electricity to both hydrogen and methane. As requested in [7,8], besides the main functionalities, the presented work considers local, sustainable mobility as fuel station hydrogen demand and connects to new hydrogen pipeline infrastructure, resulting in a more diverse and realistic scenario. In contrast to [9,10,11,12,13], for both gaseous energy carriers, feed-in pathways are also considered and made economically feasible by introducing a compulsory green gas quota for gas suppliers [14]. The EHG participates in fulfilling this quota together with large-central upstream renewable gas feed-in and existing distributed biomethane feed-in. The controversial topics of green gas certification and “colors” for different hydrogen origins are thereby not considered and discussed as constraints. For the present work, climate-neutral gas shall be considered of non-fossil origin. Thereby, methane from the three-phase Methanation (3PM) can be considered climate-neutral, concerning the negative emissions during the conversion process from hydrogen to methane. The positive correlation between low electricity prices, high renewable electricity feed-in and high need for congestion management leads to hydrogen production with decreasing carbon footprint. Local heat demand is modelled to provide a more complete analysis of simulation data, especially regarding the level of integration and economic cost for flexibility. The semantic description of the system and component behavior and its extrinsic controllable interface is based on the hierarchical concept of Distributed Energy Resource (DER) modelling according to the IEC61850 standardization, especially part 7–420 with a focus on Managed Distributed Energy Resources (MDERs) [15]. The central control logic for steering the internal plant network and allowing control, e.g., by utilities is provided by an Energy Management System (EMS) utilizing this semantic model internally. It provides a lightweight communication interface where external control can be provided by implementing grid code behavior in a modular fashion. The EMS covers the possible complexity of the investigated EHG instance by defining a modular plugin interface for integrating the control interfaces of, e.g., technical plants or components. It aggregates their abilities in a black-box fashion to a composed mixed DER, which is externally controllable. The provided control functionality for either Transmission System Operators (TSOs) or Distribution System Operators (DSOs) especially allows executing unit commitment schedules on a DER that can address re-dispatch 2.0 requirements for balancing generation and load or retrieving individual forecasting schedules of plants over 100 for planning. Internally, the EMS uses, in contrast to [16] a multi-objective optimization method [17], which converts the overall plant network schedule into an optimized set of schedules for each plant of the hub ecosystem. Thereby, the present approach opens the opportunity to fulfill a wide range of configurable objectives to either focus the EHG operation to the local needs.
3. The Energy Hub Approach
The energy hub concept is a promising approach as a resource to increase flexibility for the electric grid to balance local generation and demand. In particular, Renewable Energy Sources (RESs) can be integrated by converting and storing different forms and carriers of energy in decentralized plant networks, as outlined in [7]. Furthermore, in [18], an application of the Energy Hub (EH) concept on a scale of a city district is proposed, which is suitable as one possible use case for the present concept. However, the present modular approach of the Energy Hub Gas (EHG) is designed to be used in a wide range of applications, from city districts to interconnection stations for the transmission grid. Within the concept of an EH, first introduced by [4,5], multiple energy conversion and storage units are grouped to condition, convert, and store various forms of energy and energy carriers. From a more abstract perspective, they build a black box with inputs and outputs of different energy types, which are internally converted between the different types or carriers. In addition, the input energy forms can be stored. Mathematically, the conversion process can be described as a coefficient matrix that connects multiple energy inputs to a number of energy outputs . A general conversion formulation with multiple inputs and outputs for a single unit consists of three parts: the power output vector L, the conversion coupling matrix C, and the power input vector P. Both P and L include all considered energy carriers or energy forms e.g., [hydrogen, natural gas, …, heat] into one vector. The coupling matrix C consists of all instrumented energy conversions , where the component converts to , e.g., hydrogen to natural gas. These relationships can be generically formulated as:
The components of the coupling matrix C are defined as coupling coefficients and map input to output power. can either convert between different energy carriers in the case of , or pass through an energy carrier if . In both cases, can be between 0 and 1, or equal to 1. If is equal to 0, it represents no coupling between given energy carriers. The different kinds of conversion are summarized in Table 1.

Table 1.
Conversion types [5].
C may depend on the power input or other parameters, e.g., a target value as a control signal received from an Energy Management System (EMS) on a conversion unit; therefore, , which leads in general to non-linearity for C. Another important property of Equation (1) is that it represents an under-determined system of equations if more than two energy carriers are considered. This leads to the fact that C is not invertible. Thus, there is no unambiguous solution, and it is possible to optimize the coupling matrix. Two important characteristics of the converter coupling matrix are stated in [5] and can be summarized as
The sum over any subset of must be larger than or equal to 0 but less than or equal to 1, meaning that no energy conversion can violate the principle of energy conservation by increasing the overall amount of energy available from the inputs. The desired EH concept includes also storing of energy over a certain time, which needs special consideration in comparison to the conversion process and leads to a time dependency of all modeling variables. In [5], the influence of storage on the total power output is summarized in the storage flow vector,
In this representation, Q is the storage power output before, and M is the power output after an energy carrier is converted. Each component of can be restated as
with and the charging and discharging efficiencies for the respective energy carriers. represents the change in stored energy. Combining the formulation for energy storage with the general formulation for an energy hub results in the dynamic system equation in matrix notation
The complete EHs output power is represented as:
4. Simulation Setup
As a generic setup, the concept and corresponding system simulation model separate control and communication logic from the physical models of the technical plants in a modular fashion in contrast to [19]. With this, different components of the Energy Hub Gas (EHG) system are represented either by Functional Mock-up Units (FMUs) or simulation models implemented in Python for generic control and communication behavior. The presented implementation of revised models illustrates the advantages of this modular approach. The co-simulation framework enables the integration of different levels of details from various domains and different modeling languages. Furthermore, added features pose new sets of boundary conditions to the system and provide an opportunity to display advantages of the modular approach in both simulation setup and Energy Management System (EMS). Finally, the modules are combined into a system model to set up a specific application environment using a distributed simulation runtime environment, which allows executing the model to perform different test cases for evaluation. To use component models from various domains and different modelling languages, a co-simulation framework needs to wrap the execution environment of the component model into a software layer which allows it to execute the model, and exchange input and output data with the model implementation. For example, for executing the physical models, which were exported from Dymola according to the Functional Mock-up Interface (FMI) standard [20], the co-simulation framework needs to implement a wrapper, which executes the FMU model as so called secondary models, and care for the data exchange between the co-simulation environment and the FMU secondary model. To connect the local co-simulation to a distributed co-simulation a message server is used. Since the simulation purpose is in the scheduling and operation time horizon, there is no need for real time communication. The latency in the communication via a message server is neglected. In contrast, the advantage of this architecture is the big amount of possible participants. Furthermore, asynchronous communication enables the distributed co-simulation to be executed independently. The general data flow of the simulation system follows the concept depicted in Figure 2. Blue arrows indicate direct data transmission within the same time step, whereas red arrows indicate an asynchronous connection, where data is transmitted in the following time step. The EMS calculates schedules for all six facilities in this example and sends them to the respective controller instances. Each controller processes these schedules to a time series of single setpoint commands forwarded to the facility. A facility tries to follow these setpoints in compliance with its physical boundaries, resulting in a realistic behavioral trace of each facility. Outputs of the facilities are routed into the Data Collector, where they are finally processed and stored. Both scenario data and biogas plant produce behavioral traces without controllers as they only react to the current simulation time. Finally, the behavior of the hydrogen pipeline, which is added to the system and bidirectionally coupled with methanation, electrolysis and H2 gas station, has to be taken into account. The pipelines ensure energy conservation in the simulation system as methanation and gas station cannot consume hydrogen when the pressure of the pipeline falls under a threshold, respectively, the electrolysis stops production when a pressure limit is surpassed.
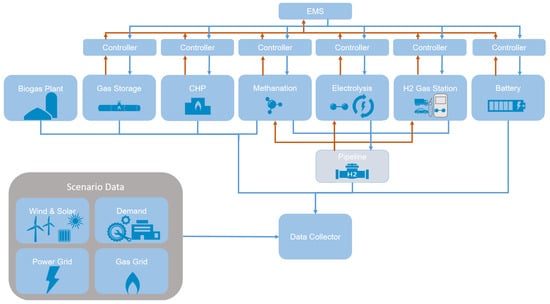
Figure 2.
Energy Hub Gas simulation setup.
The modular, scalable, and extendable setup allows us to re-use, add and parameterize individual component models within a system model and, therefore, to easily create dedicated instances of the EHG for different application settings. This facilitates the configuration, evaluation, and usage of a specific EHG instance in different application environments and use cases.
4.1. Component Models
The simulation setup contains component models for a Polymer Electrolyte Membrane electrolysis (PEM), a three-phase Methanation (3PM), a Combined Heat and Power Plant (CHP), a lithium-ion battery and a hydrogen supply unit for a hydrogen fuel station based on FMUs. The FMUs are created in Dymola using Modelica. Furthermore, a methane storage implemented in Python is included. The models are based on technical parameters, e.g., nominal power. These parameters are provided in Table 2 and are used for the internal optimization within the EMS. Detailed electrochemical and thermodynamic processes are not part of the component models, but could be implemented due to the co-simulation framework. Specific communication interfaces allow for communication in order to receive schedules from the EMS and to send relevant operating status to the Data Collector. The sector coupling models CHP, PEM, and 3PM instrument key parameters for modeling conversion efficiency, systems dynamics, as well as minimum and maximum power. The conversion efficiency of the electrolysis is the ratio between specific power demand and corresponding hydrogen production [21]. The 3PM is assumed to convert hydrogen and carbon dioxide at the stoichiometric ratio of the methanation reaction [22]. The electrical efficiency of the CHP is taken from [23]. The system dynamics of CHP, PEM, and 3PM are modeled using characteristic start-up times from stand-by to full load. Information about the load status of the assets are sent to the Data Collector. The lithium-ion battery and the methane gas storage are modeled using parameters for capacity and maximum rate of charging and discharging [24]. Information about the current State-Of-Charge (SOC) is sent to the EMS as model output. The hydrogen supply unit is a gas buffer tank, which has to be completely loaded at certain times in order to be delivered to a gas fuel station. Charging times of the supply unit are scheduled by the EMS.
Table 2.
Technical parameters of the component models.
4.2. Test Case Description
In order to use the framework described in the previous section to answer research questions, a methodical preparation of test and evaluation data for driving the simulation through use case scenarios related to research questions is required. In [25], a systematical assessment methodology is proposed that is suitable for the presented EHG approach due to its holistic scope of the used energy carriers. A test environment emerges as an instance of the framework by combining the specification of individual models, the scenario data, and previously determined evaluation criteria. Within this test environment, raw data are generated as results to which the evaluation criteria are applied. This results in the answers to the previously posed research question and goal settings. The separation of the individual data, models, and the framework has the advantage of flexible adaptation to a wide variety of use cases while at the same time allowing comparability. Thus, the results of one test environment can be compared with those of another. In [25], the test case description is divided into goal settings, operational strategy, system configuration, and scenario data. As shown in Figure 3, the data needed for a complete simulation and evaluation circle can be matched to the basic idea of an EHG presented in the previous section. With the extracted information from the input data, for example, global radiation from weather data, the simulation system converts it within the coupling matrix C to information about the power generation by Renewable Energy Source (RES). The information delivered by the grid data is, for example, the actual load without the EHG interacting. The control signal is the interface for external authority, e.g., Distribution System Operator (DSO) or Transmission System Operator (TSO), to make use of the offered flexibility from the EHG. In our example, setting the control value is an active power signal for 15 min intervals according to the re-dispatch and day-ahead unit commitment measures. Furthermore, the scenario data include price information for the relevant energy carriers, for example, hydrogen, electricity, and natural gas. By extracting and directing the relevant information to the inputs of the EHG simulation model, respectively, the coupling matrix C from Equation (1), the raw data are calculated by the co-simulation system described in the previous section. Each component model calculates independent results that need to be collected and analyzed. These results are mapped onto the output vector L used to evaluate the results further.
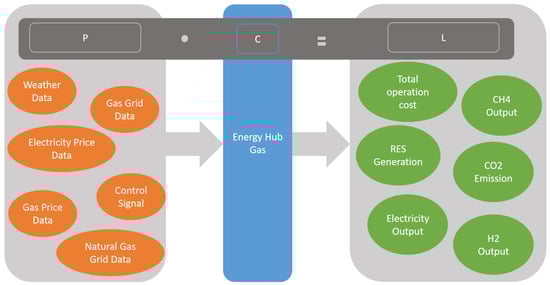
Figure 3.
Test case data within the Energy Hub Gas system.
4.3. Industrial Area Karlsruhe (Germany)
The first test case to investigate the presented system approach targets an industrial area in the south-west region of Germany which is a characteristic region for high Photovoltaic (PV) penetration. The considered time horizon reaches from January 2021 to September 2021. Furthermore, the installed power of Wind Power Plants (WPPs) is relatively low compared to the northern part of Germany, which is considered in the second test case. In industrial areas, the load curve is dominated by a workday pattern, and the dependence on the outside air temperature is smaller. This leads to the following comprehensive test case description:
Goal setting: Investigate how and to what extent the EHG system approach can help to reduce Renewable Energy (RE) curtailment because of feed-in management or congestion management. Thus, providing flexibility to attenuate grid variability is synonymous with integrating RES. Furthermore, the ability to provide and the amount of flexibility provided by the instantiated system model is of high interest. Thus, a direct connection can be drawn to the possible substitution of fossil chemical basic molecules, e.g., methane.
Operational strategy: The operating strategy of the presented experimental setup aims to implement grid-serving control of the EHG with the simultaneous cost-optimized use of its internal plants. The internal system structure is represented in a more abstract way and is thus hidden by the EMS. Therefore, a schedule for the following 24 h can be transmitted to the entire energy hub, which is used to control the internal systems in an optimized way. In this way, the local curtailment of renewable energy feed-in will be reduced. The optimization target is, on the one hand, the operating costs of the EHG including expenses for CO2 emissions and, on the other hand, the fulfillment of the external power demand by adjusting the component setpoints for their power output.
System configuration: The system configuration schema introduced in Figure 1 consists of the EHG system model including the presented component models. Furthermore, for modeling the surrounding system into which the EHG model configuration is integrated, local surrounding RES and their generation, local demand by industry and regional mobility demand are respected by the scenario data. For Test Case one (TC1) the considered RES possess the following peak power: local PV plants with 10 peak and a single WPP with peak.
Scenario data: To complete the set of information for a simulation and evaluation run, scenario data are needed. Weather data regarding solar irradiance and wind speed are used to determine renewable generated energy. These are available for TC1 as real-world data from measurements at the Campus North of the Karlsruhe Institute of Technology (KIT). The price information for the period under consideration in 2021 has been prepared from publicly available sources, e.g., Bundesnetzagentur SMARD.de (accessed on 25 October 2022). The electricity prices are data from the EPEX SPOT day-ahead market. The prices for the other energy sources are average prices from 2021 and relate to the entire period under consideration, as these are not traded on an intra-day market. The control signal, which is taken into account in a real application through communication with a network operator and based on its forecast, is based on a measured load series. A perfect forecast of the grid situation for the next 24 h is assumed in each case.
4.4. Industrial Area in Northern Germany
The second test case is located in the northern part of Germany close to the coast. This area shows a high share of WPP generated RE in connection with low consumption. The amount of curtailed RE from WPP is of high interest for the operation of an EHG from an economic point of view, as well as for the society from an ecological point of view. Absolute reduction of electricity from RES under feed-in management in 2020 were , which is about of the total generated RE [26]. The considered time horizon is the same as in TC1. This leads to the following test case description:
Goal setting: The avoidance of curtailment of RE is the primary goal since, on a coastal level, there is significantly more generation by WPP than consumption and thus the large transmission lines are to be relieved by transferring the RE to other sectors. At the same time, the provision of renewable chemical energy sources offers an opportunity to reduce greenhouse gas emissions in different application areas.
Operational strategy: The operating strategy of the experimental setup presented aims to implement grid-serving control as described in TC1. With adapting to external requests of utilities, internally generated and optimized schedules for the following 24 h the EMS offer flexibility to the DSO or TSO to integrate the fluctuating generation by RES rather than curtailing them. The economic benefit of this operating strategy consists of two parts: first, selling the long-term storable energy carriers converted from RE is the main part. Second, the compensation payment the DSO or TSO must pay for curtailment under feed-in management to the RES operator leads to additional income. The internal optimization target again consists of two objectives: first, the operational costs are taken into account. Second, the fulfillment of the external power demand is considered.
System configuration: The system configuration for Test Case two (TC2) differs only in the considered RES to integrate. The EHG system model including the same component models with the same rated power as in TC1 are located next to a RES farm with a PV plant with peak and WPPs summarized to 10 peak. Furthermore, the local demand of industry and the regional mobility demands are identical to TC1.
Scenario data: Weather data are taken from measurements of the Deutscher Wetterdienst (DWD) in a 10 min resolution. The control signal is adapted by calculating the possible renewable generation for the considered area. Furthermore, the same data are used as price information as in TC1. In addition, the same load curve of local industry is used.
5. Evaluation
The usefulness of the modular Energy Hub Gas (EHG) concept is exemplarily evaluated for the two different test cases described in the previous section. Two sets of evaluation criteria are used for the evaluation of the EHG operation: (a) In order to assess the EHG’s ability to deliver flexibility in different time scales, a power spectral density analysis is applied. Short-term (minutes to a few hours) and mid-term (hours to a few days) flexibility provisions can be individually weighted and attribute different economic values to different time scales. (b) Ecological (e.g., CO2 reduction of provided final energy), economic (e.g., operational cost), and efficiency (e.g., conversion and storage energy losses) properties are assessed by either a Sankey-diagram or the analysis of exemplary load profiles. Furthermore, the attenuating effect of the EHG is evaluated by the reduction of the difference between the minimum and maximum active power load according to Equation (7) over one day. The reduction of exchanged energy in the considered grid segment is calculated to emphasize the potential nominal power for additional Renewable Energy Sources (RESs) that again would increase the volatility.
For the evaluation of the simulation results, exemplary days are considered, upon which the described operation of the EHG becomes particularly clear. In addition, the entire period is evaluated in order to illustrate the grid-serving operation of the decentralized plant network. With Test Case one (TC1), the ability of the EHG to provide renewable chemical energy carriers to sectors where the processes are difficult or expensive to electrify is evaluated. The industrial area in TC1 described in the previous section with its demand for chemical energy carriers can be provided with the energy flows shown in Figure 4. Depicted are the energy flows, including the conversion paths of the individual energy sources as of 3 March 2021 including the total losses () due to conversion efficiencies. It is depicted that around of electrical energy is converted to around hydrogen that is further processed to around methane and hydrogen for the gas station. About are either used as heat energy or summed up within the total losses. By replacing about of natural gas with renewable methane, approximately of CO2 emissions can be avoided. Most of the energy is already sourced from the natural gas grid and converted to electrical power and heat by the Combined Heat and Power Plant (CHP). However, the fluctuation in the electrical grid can be used to contribute other chemical energy carriers from renewable energy, for example, hydrogen. A total amount of of hydrogen is produced under the grid-supporting operation conditions over the entire simulation period of nine months. By selling this product as green hydrogen, ignoring possible uncertainties or costs related to certification, a revenue of around EUR 107,000 can be achieved.
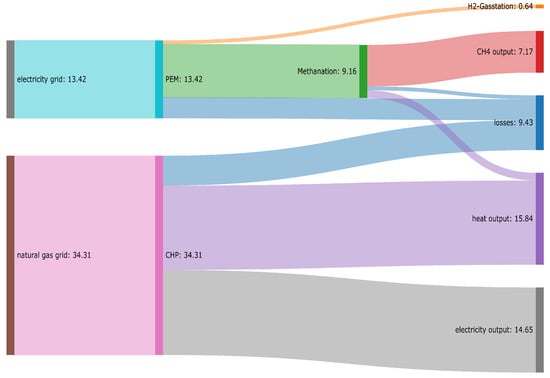
Figure 4.
Energy flow chart for 3 March 2021.
A more detailed look into the electrical energy amount depicted in Figure 4 is given in Figure 5. Here, the electrical load profile with and without the EHG interacting is shown. Negative values mean backfeeding into the transmission grid level. The attenuating potential of the EHG can be quantified for the considered date by a reduction of concerning the maximum power deviation over one day according to Equation (7). This relieves the existing grid infrastructure and opens the possibility for additional RESs. If the entire simulation period (1 January until 30 September 2021) is considered, the average attenuation through the EHG is . To evaluate the quality of the provided flexibility and hence the electricity grid supporting effort the EHG can achieve, a Power Spectral Density (PSD) analysis is conducted and shown in Figure 6. The relative power variation c with and without the EHG interacting is depicted over the frequency f for 3 March 2021. The solid line depicts the power variation with the EHG interacting. For a frequency of 2 h or lower, the EHG can reduce the fluctuation. Around frequencies of 15 min the power variation is even increased which in combination indicates that the flexibility provision by the presented EHG instance is only useful for longer time periods.
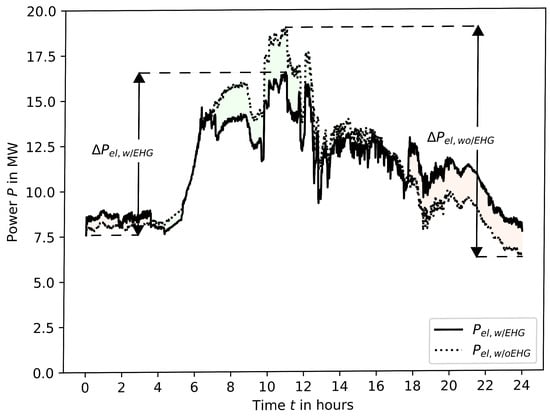
Figure 5.
Resulting power w/ and w/o EHG interacting at 3 March 2021.
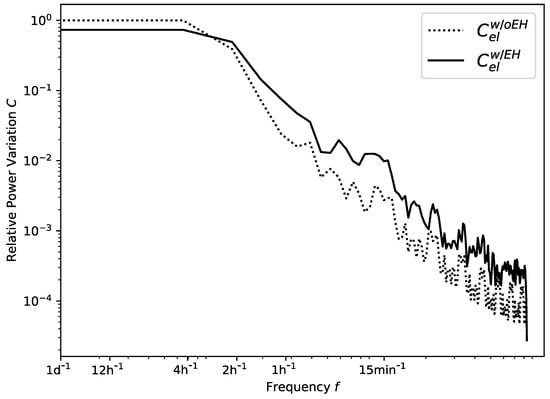
Figure 6.
Power Spectral Density of the EHG on 3 March 2021.
Test Case Two
In Test Case two (TC2), the evaluation is focused on the possibility of relieving the grid infrastructure for increasing renewable feed-in. Therefore, an exemplary load curve from 25 February 2021, is evaluated and shown in Figure 7. The power flow within the considered grid segment is depicted with and without the EHG interacting. A reduction by is achieved concerning the difference between maximum load and maximum feed-in according to Equation (7).
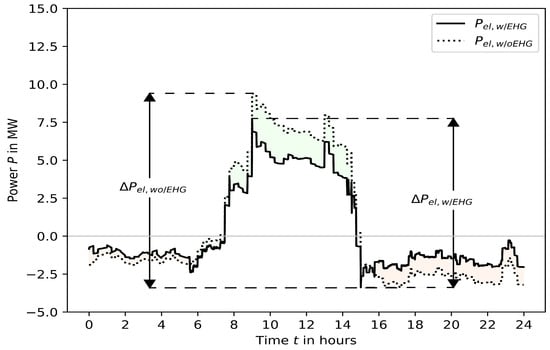
Figure 7.
Resulting power w/ and w/o EHG interacting at 25 February 2021.
Furthermore, the energy exchanged within the evaluated day at the Electrical Connection Point (ECP) is abated by . The colored areas in Figure 7 mark the positive (green) and negative (red) power adjustments achieved by the EHG interacting and resulting in a total reduction of within one day. The red area in Figure 7 describes the additional load caused by the EHG to convert electrical power to hydrogen for either direct use or further processing within the methanation. The total additional load summarized over the evaluated day is . This reduction, in combination with the attenuated load curve, offers the opportunity to install additional RESs or integrate existing but curtailed RESs on the same scale without extending the grid infrastructure. Using the curtailed energy, there is a potential reduction in CO2 emission of around according to the emission coefficients () given by [27]. Furthermore, the average compensation paid by utilities to RES operators for curtailment is according to [26], which results in additional revenues of around . At the same time, the amount of green hydrogen or methane provided by the EHG by using this energy results in additional income. The evaluation of the entire simulation period of nine months results in an average reduction of power fluctuation by . Furthermore, the average energy exchanged at the ECP is reduced by per day with a total production of hydrogen.
The energy marked as colored areas in Figure 7 is converted and conditioned as shown in more details in Figure 8. Depicted are the energy flows, including the conversion paths of the individual energy sources as of 25 February 2021 including the total losses of around due to conversion efficiencies. It is depicted that around of electrical energy is converted to around hydrogen that is further processed to around methane and hydrogen for the gas station. As in TC1, most of the energy is sourced from the natural gas grid () and converted to electrical power () and heat () by the CHP. To assess the quality of the flexibility provision and hence the electricity grid supporting service the EHG can deliver, a PSD analysis is conducted. Figure 9 shows the relative power variation c with and without the EHG interacting over the frequency f for the evaluated day. The solid line depicts the power variation with the EHG trying to follow the schedule provided by the grid operator. For a frequency of 1 h or lower, the EHG can reduce the fluctuation, but within higher frequencies, there is no effect on the power variation. Although the EHG is equipped with components that can adjust their power in the frequency range of seconds, it is not possible to implement this to reduce the power variation.
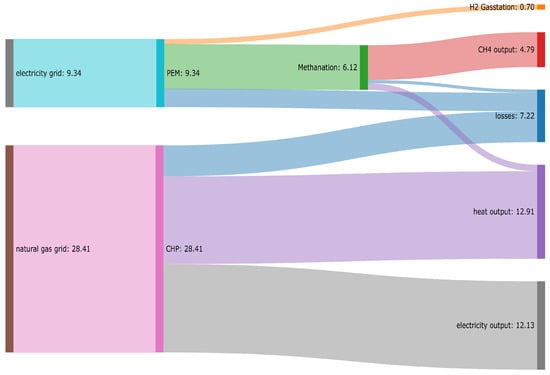
Figure 8.
Energy flow chart for 25 February 2021.
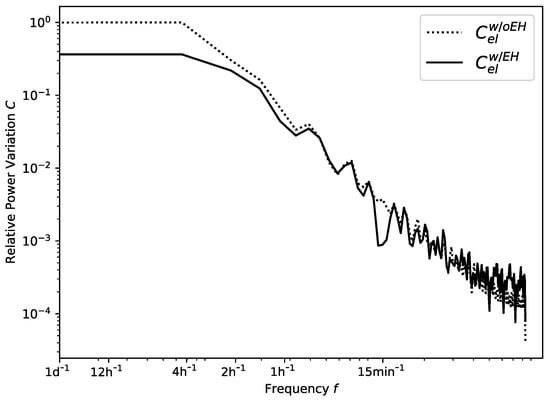
Figure 9.
Power Spectral Density of the EHG on 25 February 2021.
6. Conclusions and Outlook
In the present work, a multi-energy carrier co-simulation system is introduced as Energy Hub Gas (EHG), and the used modular component models are described. Based on the Energy Hub (EH) concept by [5], the modular and highly flexible system was built as an EHG. The usefulness of the approach was investigated in two test cases. Results show that the bidirectional sector coupling of gas and electricity grid can provide flexibility to the power grid so that volatility is reduced. By reducing the volatility, the EHG helps grid operators integrate higher shares of renewable generated power into their network with fewer infrastructure measures. This leads to a total reduction in CO2 emissions and possibly fewer grid extensions on a high voltage level. The modular concept evaluated in the presented work can deliver grid supporting services via local flexibility adjusted to the individual requirements of different use cases. By adapting parts of the system network of the EHG, a significant cost and time efficient increase in integrating Renewable Energy Sources (RESs) can be observed for the investigated scenarios and infrastructure. Further research is necessary to investigate the dependencies between presented scenarios, test cases, and EHG instances. The contribution an EHG can make to securing gas supply in consideration of significantly rising prices is of further interest. The presented possible adaption of the system configuration can be used for a planning optimization to find an optimal component mixture within the EHG. Thereby, different further applications of EHGs in various scenarios can be investigated and compared to the presented results. Future work should also investigate different time scales and horizons for the optimization method to find schedules that better approximate the received control signal. To further improve the scheduling method by the Energy Management System (EMS), different optimization objectives should be included in future work to investigate the complete benefit an EHG can provide.
Author Contributions
Conceptualization, R.P., J.R. and C.D.; methodology, R.P., M.C. and C.H.; software, M.C., C.H. and R.P.; validation, M.C. and C.H.; formal analysis, R.P.; investigation, R.P.; resources, C.D., T.K. and V.H.; data curation, R.P.; writing—original draft preparation, R.P., J.R. and M.C.; writing—review and editing, R.P., C.D., T.K. and V.H.; visualization, R.P.; supervision, C.D., T.K. and V.H.; project administration, C.D., T.K. and V.H.; funding acquisition, C.D., T.K. and V.H. All authors have read and agreed to the published version of the manuscript.
Funding
This research was funded by the German Federal Ministry of Education and Research (BMBF) within the Kopernikus Project ENSURE ‘New ENergy grid StructURes for the German Energiewende’.
Data Availability Statement
The data presented in this study are available on request from the corresponding author.
Acknowledgments
The authors gratefully acknowledge funding by the German Federal Ministry of Education and Research (BMBF) within the Kopernikus Project ENSURE ‘New ENergy grid StructURes for the German Energiewende’.
Conflicts of Interest
The authors declare no conflict of interest.
Abbreviations
The following abbreviations are used in this manuscript:
| GHG | Greenhouse Gas |
| RES | Renewable Energy Source |
| EHG | Energy Hub Gas |
| DER | Distributed Energy Resource |
| EH | Energy Hub |
| MDER | Managed Distributed Energy Resource |
| EMS | Energy Management System |
| TSO | Transmission System Operator |
| DSO | Distribution System Operator |
| FMU | Functional Mock-up Unit |
| FMI | Functional Mock-up Interface |
| PEM | Polymer Electrolyte Membrane electrolysis |
| 3PM | three-phase Methanation |
| CHP | Combined Heat and Power Plant |
| SOC | State-Of-Charge |
| PV | Photovoltaic |
| WPP | Wind Power Plant |
| RE | Renewable Energy |
| TC1 | Test Case one |
| KIT | Karlsruhe Institute of Technology |
| TC2 | Test Case two |
| DWD | Deutscher Wetterdienst |
| ECP | Electrical Connection Point |
| PSD | Power Spectral Density |
References
- Poppenborg, R.; Ruf, J.; Chlosta, M.; Liu, J.; Hotz, C.; Düpmeier, C.; Kolb, T.; Hagenmeyer, V. Energy Hub Gas: A Multi-Domain System Modelling and Co-Simulation Approach. In Proceedings of the 2021 9th Workshop on Modelling and Simulation of Cyber-Physical Energy Systems (MSCPES), Virtual Event, 19–21 May 2021; pp. 67–72. [Google Scholar] [CrossRef]
- Sharif, A.; Almansoori, A.; Fowler, M.; Elkamel, A.; Alrafea, K. Design of an energy hub based on natural gas and renewable energy sources. Int. J. Energy Res. 2014, 38, 363–373. [Google Scholar] [CrossRef]
- Geidl, M.; Andersson, G. Optimal Power Flow of Multiple Energy Carriers. IEEE Trans. Power Syst. 2007, 22, 145–155. [Google Scholar] [CrossRef]
- Geidl, M.; Koeppel, G.; Favre-Perrod, P.; Klockl, B.; Andersson, G.; Frohlich, K. Energy hubs for the future. IEEE Power Energy Mag. 2007, 5, 24–30. [Google Scholar] [CrossRef]
- Geidel, M. Integrated Modeling and Optimization of Multi-Carrier Energy Systems. Ph.D. Thesis, ETH Zürich, Zurich, Switzerland, 2007. [Google Scholar] [CrossRef]
- Hajimiragha, A.; Canizares, C.; Fowler, M.; Geidl, M.; Andersson, G. Optimal Energy Flow of integrated energy systems with hydrogen economy considerations. In Proceedings of the 2007 iREP Symposium—Bulk Power System Dynamics and Control—VII. Revitalizing Operational Reliability, Charleston, SC, USA, 19–24 August 2007; pp. 1–11. [Google Scholar] [CrossRef]
- Mohammadi, M.; Noorollahi, Y.; Mohammadi-ivatloo, B.; Yousefi, H. Energy hub: From a model to a concept—A review. Renew. Sustain. Energy Rev. 2017, 80, 1512–1527. [Google Scholar] [CrossRef]
- Mohammadi, M.; Noorolahi, Y.; Mohammadi-ivatloo, B.; Hosseinzadeh, M.; Yousefi, H.; Torabzadeh Khorasani, S. Optimal management of energy hubs and smart energy hubs—A review. Renew. Sustain. Energy Rev. 2018, 89, 33–50. [Google Scholar] [CrossRef]
- Sheikhi, A.; Ranjbar, A.M.; Oraee, H. Financial analysis and optimal size and operation for a multicarrier energy system. Energy Build. 2012, 48, 71–78. [Google Scholar] [CrossRef]
- Nemati, M.; Braun, M.; Tenbohlen, S. Optimization of unit commitment and economic dispatch in microgrids based on genetic algorithm and mixed integer linear programming. Appl. Energy 2018, 210, 944–963. [Google Scholar] [CrossRef]
- Davatgaran, V.; Saniei, M.; Mortazavi, S.S. Optimal bidding strategy for an energy hub in energy market. Energy 2018, 148, 482–493. [Google Scholar] [CrossRef]
- AlRafea, K.; Fowler, M.; Elkamel, A.; Hajimiragha, A. Integration of renewable energy sources into combined cycle power plants through electrolysis generated hydrogen in a new designed energy hub. Int. J. Hydrogen Energy 2016, 41, 16718–16728. [Google Scholar] [CrossRef]
- Peng, D.D.; Fowler, M.; Elkamel, A.; Almansoori, A.; Walker, S.B. Enabling utility-scale electrical energy storage by a power-to-gas energy hub and underground storage of hydrogen and natural gas. J. Nat. Gas Sci. Eng. 2016, 35, 1180–1199. [Google Scholar] [CrossRef]
- Ahrens, E.; Wehling, A.; Köppel, W.; Sterner, M.; Lucke, N. Technisch-Ökonomische Modellierung eines sektorengekoppelten Gesamtenergiesystems aus Gas und Strom unter Fortschreibung des regulatorischen Rahmens—SMARAGD DVGW-Förderkennzeichen G201708. 2018. Available online: https://www.dvgw.de/themen/forschung-und-innovation/forschungsprojekte/dvgw-forschungsbericht-g-201708 (accessed on 25 October 2022).
- IEC 61850:2021; Communication Networks and Systems for Power Utility Automation. International Electrotechnical Comission: Geneva, Switzerland, 2021.
- Beigvand, S.D.; Abdi, H.; La Scala, M. A general model for energy hub economic dispatch. Appl. Energy 2017, 190, 1090–1111. [Google Scholar] [CrossRef]
- Khalloof, H.; Jakob, W.; Shahoud, S.; Duepmeier, C.; Hagenmeyer, V. A Generic Scalable Method for Scheduling Distributed Energy Resources Using Parallelized Population-Based Metaheuristics. In Advances in Intelligent Systems and Computing (AISC), Volume 2, Proceedings of the Future Technologies Conference (FTC), Vancouver, BC, Canada, 5–6 November 2020; Arai, K., Ed.; Springer Nature: Berlin/Heidelberg, Germany, 2021; Volume 1289, pp. 1–21. [Google Scholar] [CrossRef]
- Walker, S.; Labeodan, T.; Maassen, W.; Zeiler, W. A review study of the current research on energy hub for energy positive neighborhoods. Energy Procedia 2017, 122, 727–732. [Google Scholar] [CrossRef]
- Mostafavi Sani, M.; Mostafavi Sani, H.; Fowler, M.; Elkamel, A.; Noorpoor, A.; Ghasemi, A. Optimal energy hub development to supply heating, cooling, electricity and freshwater for a coastal urban area taking into account economic and environmental factors. Energy 2022, 238, 121743. [Google Scholar] [CrossRef]
- Blochwitz, T.; Otter, M.; Arnold, M.; Bausch, C.; Clauß, C.; Elmqvist, H.; Junghanns, A.; Mauss, J.; Monteiro, M.; Neidhold, T.; et al. The Functional Mockup Interface for Tool independent Exchange of Simulation Models. In Proceedings of the 8th International Modelica Conference, Dresden, Germany, 20–22 March 2011; pp. 105–114. [Google Scholar] [CrossRef]
- Smolinka, T.; Wiebe, N.; Sterchele, P.; Palzer, A.; Lehner, F.; Jansen, M.; Kiemel, S.; Miehe, R.; Wahren, S.; Zimmermann, F. Studie IndWEDe: Industrialisierung der Wasserelektrolyse in Deutschland: Chancen und Herausforderungen für nachhaltigen Wasserstoff für Verkehr, Strom und Wärme. Available online: https://publica.fraunhofer.de/entities/publication/94452b8e-4221-4e33-a7e5-a11a14279f8d/details (accessed on 25 October 2022).
- Götz, M.; Lefebvre, J.; Mörs, F.; McDaniel Koch, A.; Graf, F.; Bajohr, S.; Reimert, R.; Kolb, T. Renewable Power-to-Gas: A technological and economic review. Renew. Energy 2016, 85, 1371–1390. [Google Scholar] [CrossRef]
- MTU Solutions. Power Generation: Series 4000 Gas Generator Set. Available online: https://www.mtu-solutions.com/eu/en/applications/power-generation/power-generation-products/gas-generator-sets/natural-gas-generator-sets/gas-powered-series-4000.html (accessed on 25 October 2022).
- Sterner, M.; Stadler, I. Energiespeicher—Bedarf, Technologien, Integration Energiespeicher—Bedarf, Technologien, Integration; Springer Vieweg: Berlin/Heidelberg, Germany, 2017. [Google Scholar] [CrossRef]
- Widl, E.; Jacobs, T.; Schwabeneder, D.; Nicolas, S.; Basciotti, D.; Henein, S.; Noh, T.; Terreros, O.; Schuelke, A. Studying the potential of multi-carrier energy distribution grids: A holistic approach. Energy 2018, 153, 519–529. [Google Scholar] [CrossRef]
- Bundesnetzagentur. Bericht zum Redispatch nach Artikel 13 Verordnung (EU) 2019/943. Technical Report, Bundesnetzagentur für Elektrizität, Gas, Telekommunikation, Post und Eisenbahnen. 2022. Available online: https://www.bundesnetzagentur.de/DE/Fachthemen/ElektrizitaetundGas/Versorgungssicherheit/Netzengpassmanagement/start.html (accessed on 25 October 2022).
- Icha, P.; Lauf, T.; Kuhs, G. Entwicklung der spezifischen Kohlendioxid-Emissionen des deutschen Strommix in den Jahren 1990–2020. Technical Report, Umweltbundesamt. 2021. Available online: https://www.umweltbundesamt.de/publikationen/entwicklung-der-spezifischen-kohlendioxid-7 (accessed on 25 October 2022).
Disclaimer/Publisher’s Note: The statements, opinions and data contained in all publications are solely those of the individual author(s) and contributor(s) and not of MDPI and/or the editor(s). MDPI and/or the editor(s) disclaim responsibility for any injury to people or property resulting from any ideas, methods, instructions or products referred to in the content. |
© 2023 by the authors. Licensee MDPI, Basel, Switzerland. This article is an open access article distributed under the terms and conditions of the Creative Commons Attribution (CC BY) license (https://creativecommons.org/licenses/by/4.0/).