Article

Techno-Economic Analysis of the Modernization Options of a Gas Turbine Power Plant Using Aspen HYSYS

by
Dias Raybekovich Umyshev
1,*,
Eduard Vladislavovich Osipov
2,
Andrey Anatolievich Kibarin
1,
Maxim Sergeyevich Korobkov
1,
Tatyana Viktorovna Khodanova
1 and
Zhansaya Serikkyzy Duisenbek
1
1
Department of Thermal Power Plants, Institute of Heat Power Engineering and Control Systems, Almaty University of Power Engineering and Telecommunications, Almaty 050013, Kazakhstan
2
Mechanical Engineering for Chemical Industry, Institute of Mechanical Engineering for Chemical and Petrochemical Industry, Kazan National Research Technological University, 420015 Kazan, Russia
*
Author to whom correspondence should be addressed.
Energies 2023, 16(6), 2704; https://doi.org/10.3390/en16062704
Submission received: 30 January 2023 / Revised: 3 March 2023 / Accepted: 7 March 2023 / Published: 14 March 2023
(This article belongs to the Special Issue Energy Saving Optimization of Combined Heat and Power Systems)

Abstract

:
Currently, 90% of Kazakhstan’s oil is situated in 15 oil and gas fields where simple cycle gas turbines are utilized for electricity generation. The need for developing techniques to enhance the efficiency and eco-friendliness of fuel consumption in Kazakhstan’s oil fields is imperative. In this article, methods for improving the energy efficiency of a simple gas turbine power plant functioning in an oil field are discussed, with consideration given to the impact of ambient temperature and specific environmental constraints, such as water scarcity and high temperatures. Two schemes to increase efficiency are evaluated: the first involves the utilization of a waste heat boiler for steam production intended for technological purposes, while the second involves electricity generation through a combination of a waste heat boiler and a steam turbine. Models based on Aspen HYSYS were formulated, with actual gas turbine power plant operation taken into account. Analysis indicated that a waste heat boiler scheme could generate up to 350 t/h of steam, completely replacing power boilers. Im plementation of the combined cycle power plant (CCPP) system resulted in the production of up to 262.42 MW of electricity. Environmental analyses demonstrated that both schemes exhibit comparable specific emissions in terms of power generation, with 0.56 kgCO2/kWh for HRSG and 0.53 kgCO2/kWh for CCPP. Technological, environmental, and economic analyses were conducted to determine the most promising technology, considering the specifics of the oil fields in Kazakhstan. Based on the payback period for HRSG (4 years) and CCPP (7 years) options, it was deduced that the former is the most favorable for implementation

1. Introduction

Review and Analysis

Today, in Kazakhstan, as in most countries of the world, the issue of reducing greenhouse gas emissions into the environment is acute [1,2]. The Kyoto Protocol signed in 1997 clearly shows us that there is a need to reduce greenhouse gases, but there are a number of problems. One of the problems is the complexity of the transition from traditional fuels to clean fuels, since green technologies are currently quite expensive [3]. Therefore, it is important to switch to traditional technologies, taking into account the relatively low cost of electricity, and as a result, the long payback period for renewable energy sources. Currently, intensive developments are underway in the field of combined cycles that allow the use of secondary heat from the main processes. For example, the work [4] provides an analysis of the operation of the exhaust gas utilization plant using the organic Rankine cycle. The paper presents two schemes, in the first, the exhaust gases of the gas turbine cylinder heat the coolant of the ORC, i.e., generate heat, in the second they generate heat, and then electricity in the ORC. The study showed that the maximum exergetic efficiency is achieved by increasing the production of thermal energy. In [5], an analysis of two schemes for using the combustion products of a gas turbine was carried out, in the first option, the gas was partially fed into the recuperator to heat the air in front of the combustion chamber, in the second, the gas was completely supplied to the boiler utilizer. The first option showed an increase of 1.7% from the base option. In [6], a thermodynamic analysis of the operation of a combined cycle based on ultrahigh pressure carbon dioxide was carried out. In this scheme, the exhaust gases of the GTU in the utilizer are heated with CO2, which is used to produce electrical energy. The use of CO2 at supercritical parameters allows for the increase in the efficiency of the cycle by 1.4%. The paper [7] analyzes the influence of ambient temperature on the efficiency of the combined cycle with a carbon capture system. The analysis showed a significant decrease in cycle efficiency with an increase in ambient temperature by 7–8% of the baseline value for all analyzed cycles. The paper [8] analyzes the transformation of a steam turbine cycle into a cogeneration plant. Two options are given, the first uses absorption heat pumps, the second uses a heat exchanger. A study of the use of gaseous products for the organic Rankine cycle [9] showed that such cycles have high efficiency. The paper [10] presents an analysis of the use of solar collectors in a microturbine combined cycle. In [11], an analysis of the energy analysis of the combined cycle for ORC and CO2 utilization using Aspen Plus was carried out. The use of a modified Viburnum cycle with liquefied gas in a combined cycle allows for the achieving of an efficiency equal to 59.47% [12]. In [13], an analysis of the combined cycle with plasma treatment of municipal garbage for incineration was carried out. The analysis of combined cycles and combined cycle technologies shows that there is a sufficiently large potential for using the heat of the exhaust gases of gas turbine cycles.
Currently, it is important to predict the economic and environmental efficiency of the analyzed technologies [14]. To do this, it is necessary to create a sufficiently accurate model that considers a wide range of factors affecting the operation of such an installation. In [15], an analysis of the model of a gas turbine installation was carried out, in which the influence of the number of revolutions on the efficiency of the installation in the network was analyzed. The paper [16] presents a model for the study of NOx emissions based on ANFIS. The paper [17] presents a model based on artificial intelligence for the analysis of a combined cycle gas plant based on the supercritical cycle of Brighton and Rankin. This model showed a high level of accuracy. The paper [18] presents a model for modeling combined cycles with the introduction of solar technologies. It is revealed that the off-design conditions, particularly the direct normal irradiance and the wind speed, affect the integrated solar combined cycle performance significantly.
Since the GTU installations operated at oil production and refining enterprises are operated year-round and continuously for most of the year, their improvement becomes an urgent task that allows reduction in not only the company’s costs for technological processes, but also the damage that it can cause to nature. There are various ways to improve the hardware and technological design of GTU, one of which is computer modeling of processes occurring at the main stages of the GTU cycle. For example, in [19], the characteristics of the main GTU units (compressor and gas turbine) were generalized from production data in the form of polynomial dependencies, which were used to calculate the main indicators of the cycle and its efficiency. In [20], a gas turbine was divided into a number of parts, each of which corresponded to a turbine stage. In [21,22], heat balance equations were written for each stage, on the basis of which the efficiency of the installation as a whole was calculated. In the work [
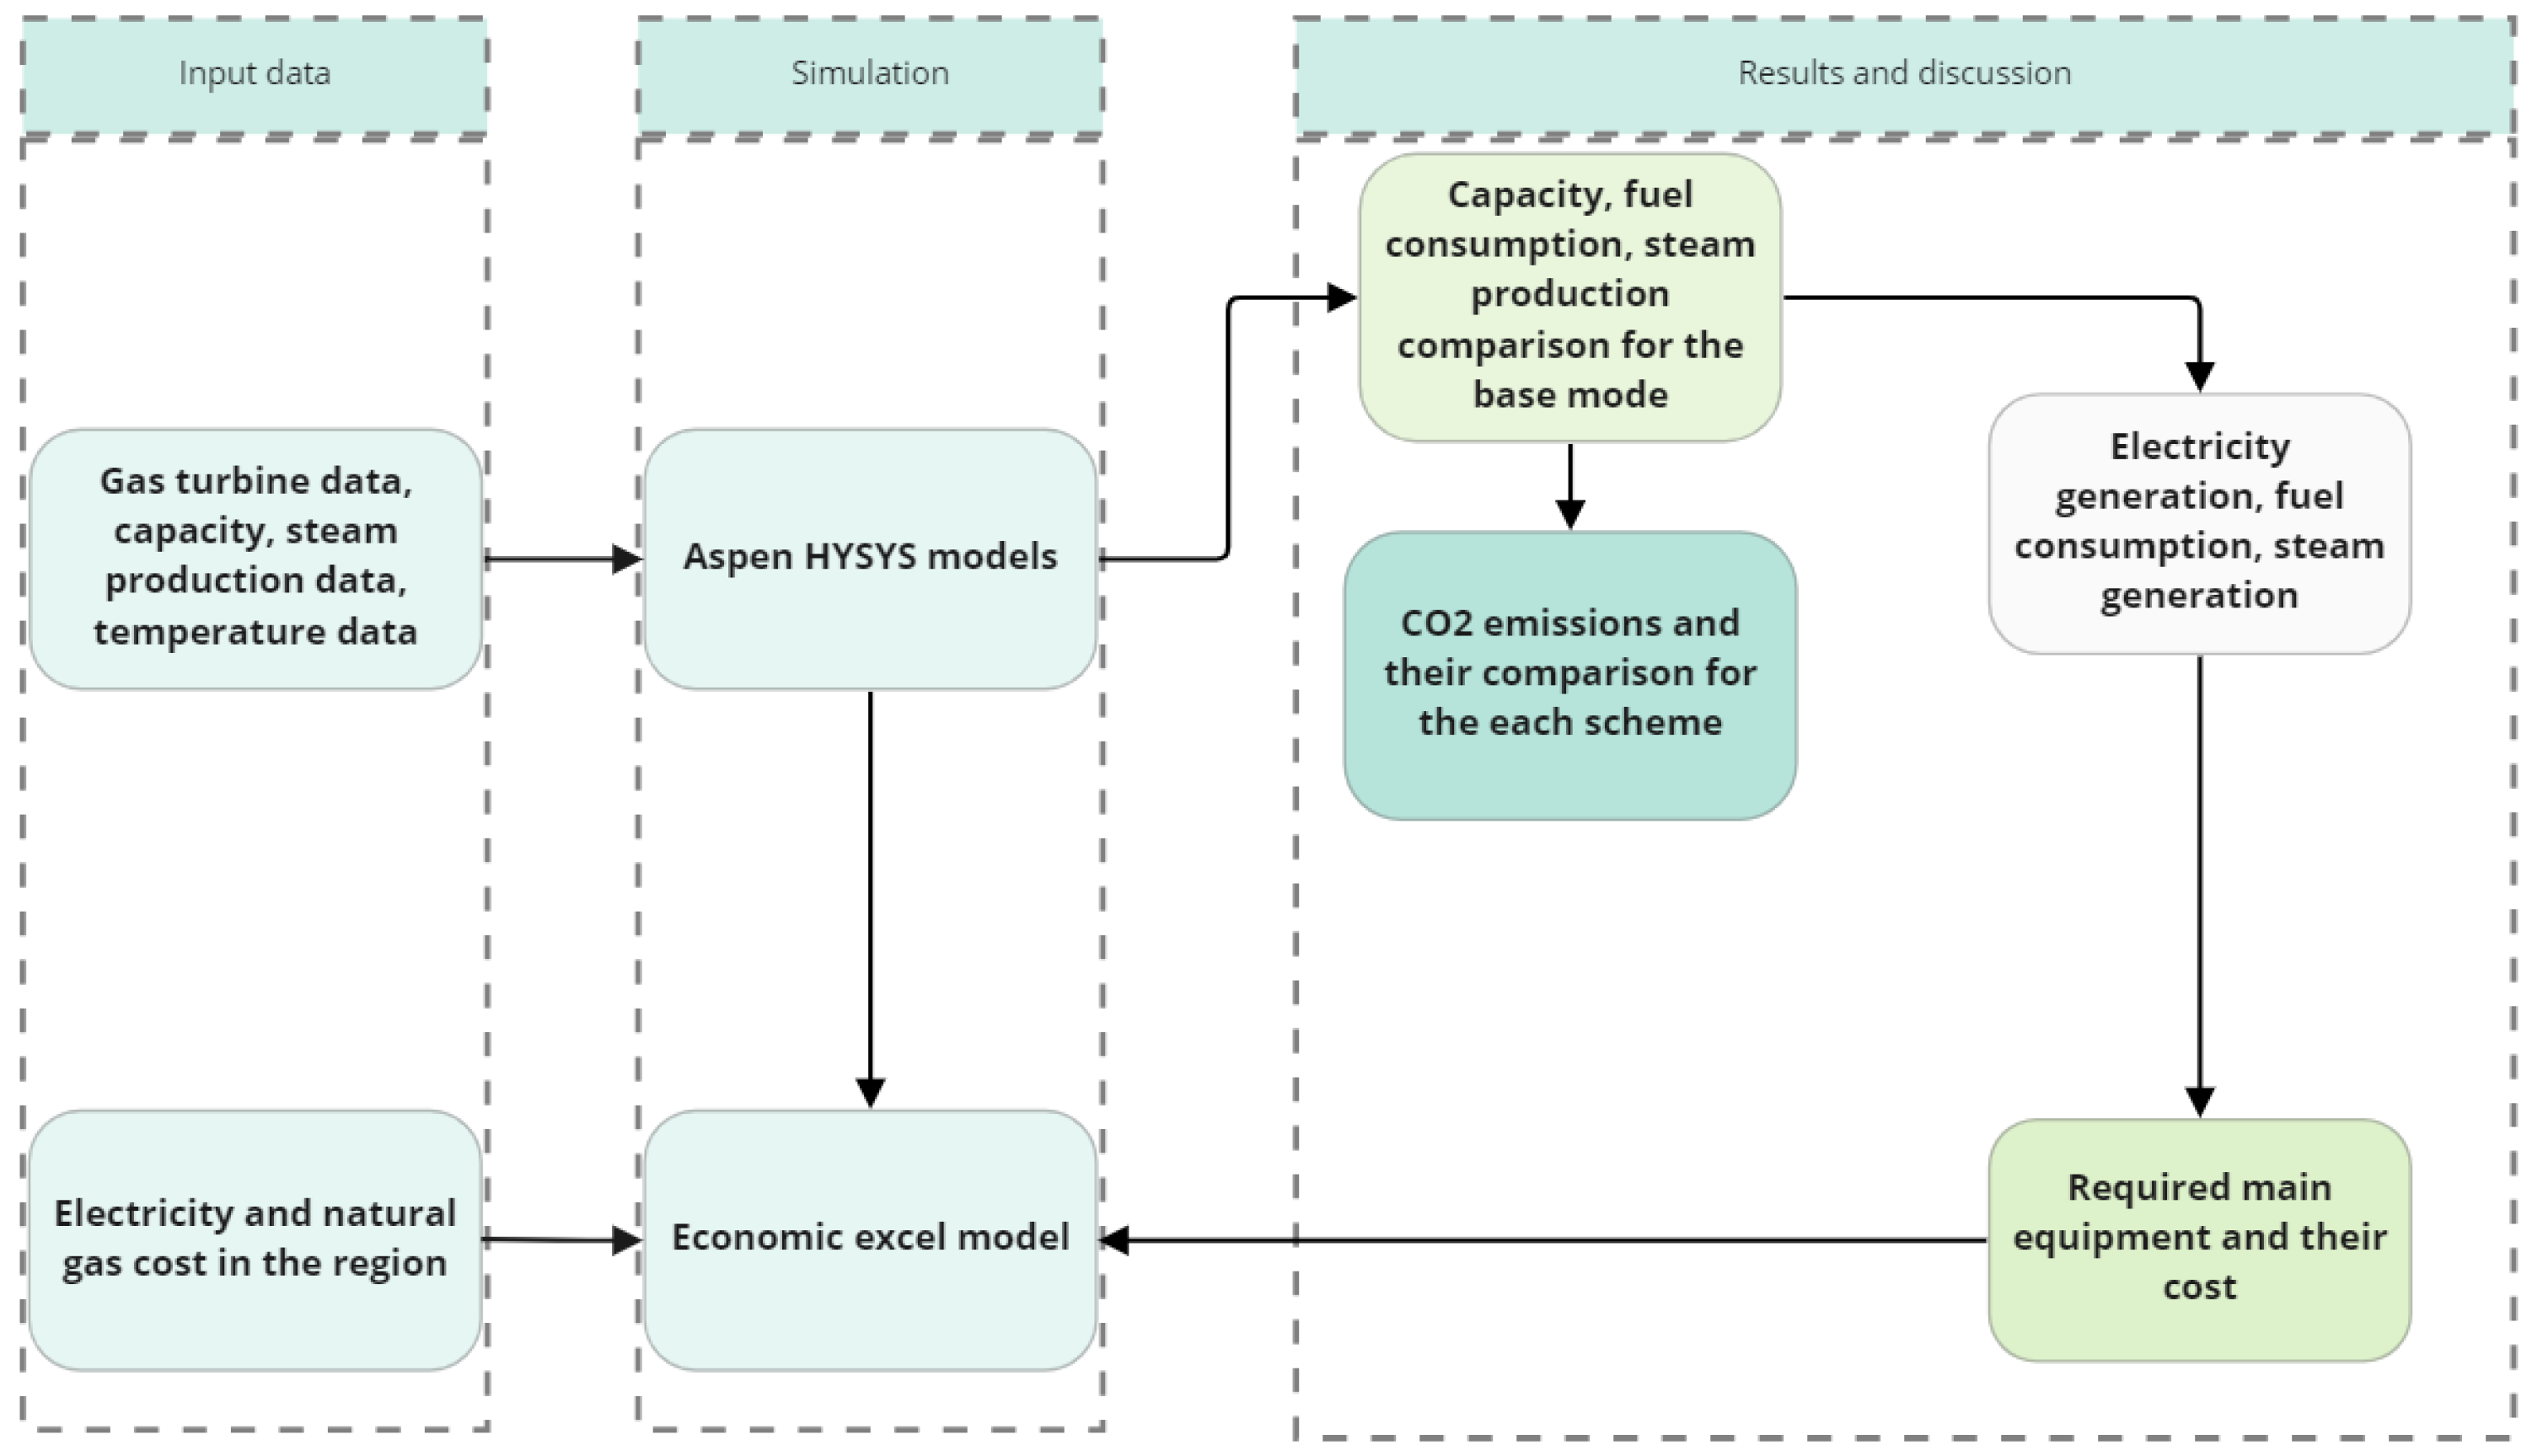
23] modeling of the GTU, the functionality of the Aspen HYSYS computer-aided design system was used, while the adequacy of the developed mathematical models was checked by comparison with the calculated values obtained in another program or data from an industrial survey of an operating installation.
In a previous study [24], the implementation of an intermediate cooling system was analyzed as a means of enhancing the efficiency of gas turbines, resulting in a production increase of 20%. However, this technology is not fully viable under the high ambient temperatures of Kazakhstan, as additional cooling would entail substantial costs for cold production. Another study [25] evaluated the use of a combined cycle gas turbine with a compressed air storage system, leading to improved plant reliability and maneuverability. Moreover, the application of solar panels to CCPP was investigated in [26] using the Aspen HYSYS program.
The literature review conducted herein highlights the optimization potential, taking into account gas turbine units operating for more than 20,000 h in Kazakhstan’s specific field conditions, characterized by the absence of water sources and low electricity costs. The lack of sources for large volumes of water should be considered in any such optimization effort.
According to the Environmental Code of the Republic of Kazakhstan [27], the State policy is based on the principles of sustainable development and energy efficiency improvement, as well as the maximum possible disposal of industrial waste. Additionally, according to the new Environmental Code adopted in January 2021, oil and natural gas production belong to the list of areas of application of the best available techniques. The typical list of environmental protection measures includes the introduction of measures aimed at reducing greenhouse gas emissions, as well as measures for the installation of equipment that allows for an increase in energy efficiency. According to the strategy for the transition to a green economy [28], it is necessary to switch everywhere to gas for the production of electric energy, taking into account the finite renewable energy sources. According to [29] the concept of development of the fuel and energy complex of the Republic of Kazakhstan, the oil industry is one of the most important sectors of the economy, the basic exporting industry, which allows the country to capitalize its own mineral resources and receive sufficient capital inflows for the accelerated development of the industrial complex. The Republic of Kazakhstan is one of the key sources of hydrocarbon raw materials for the world economy. As of 2013, Kazakhstan ranks 12th in the world in terms of proven oil reserves; 7% of all oil produced in the Republic is produced in the West Kazakhstan region. This article discusses the oil field located in the West Kazakhstan region of the Republic of Kazakhstan. The Karachaganak field, discovered in 1979, is one of the world’s largest gas and condensate fields. Located in north-west Kazakhstan and covering an area of over 280 square kilometres, it holds estimated hydrocarbons initially in place (HIIP) of 9 billion barrels of condensate and 48 trillion cubic feet (tcf) of gas, with estimated gross reserves of over 2.4 billion barrels of condensate and 16 tcf of gas. In 2021, the volume of hydrocarbon production at the enterprise reached 134.05 million barrels of oil equivalent [
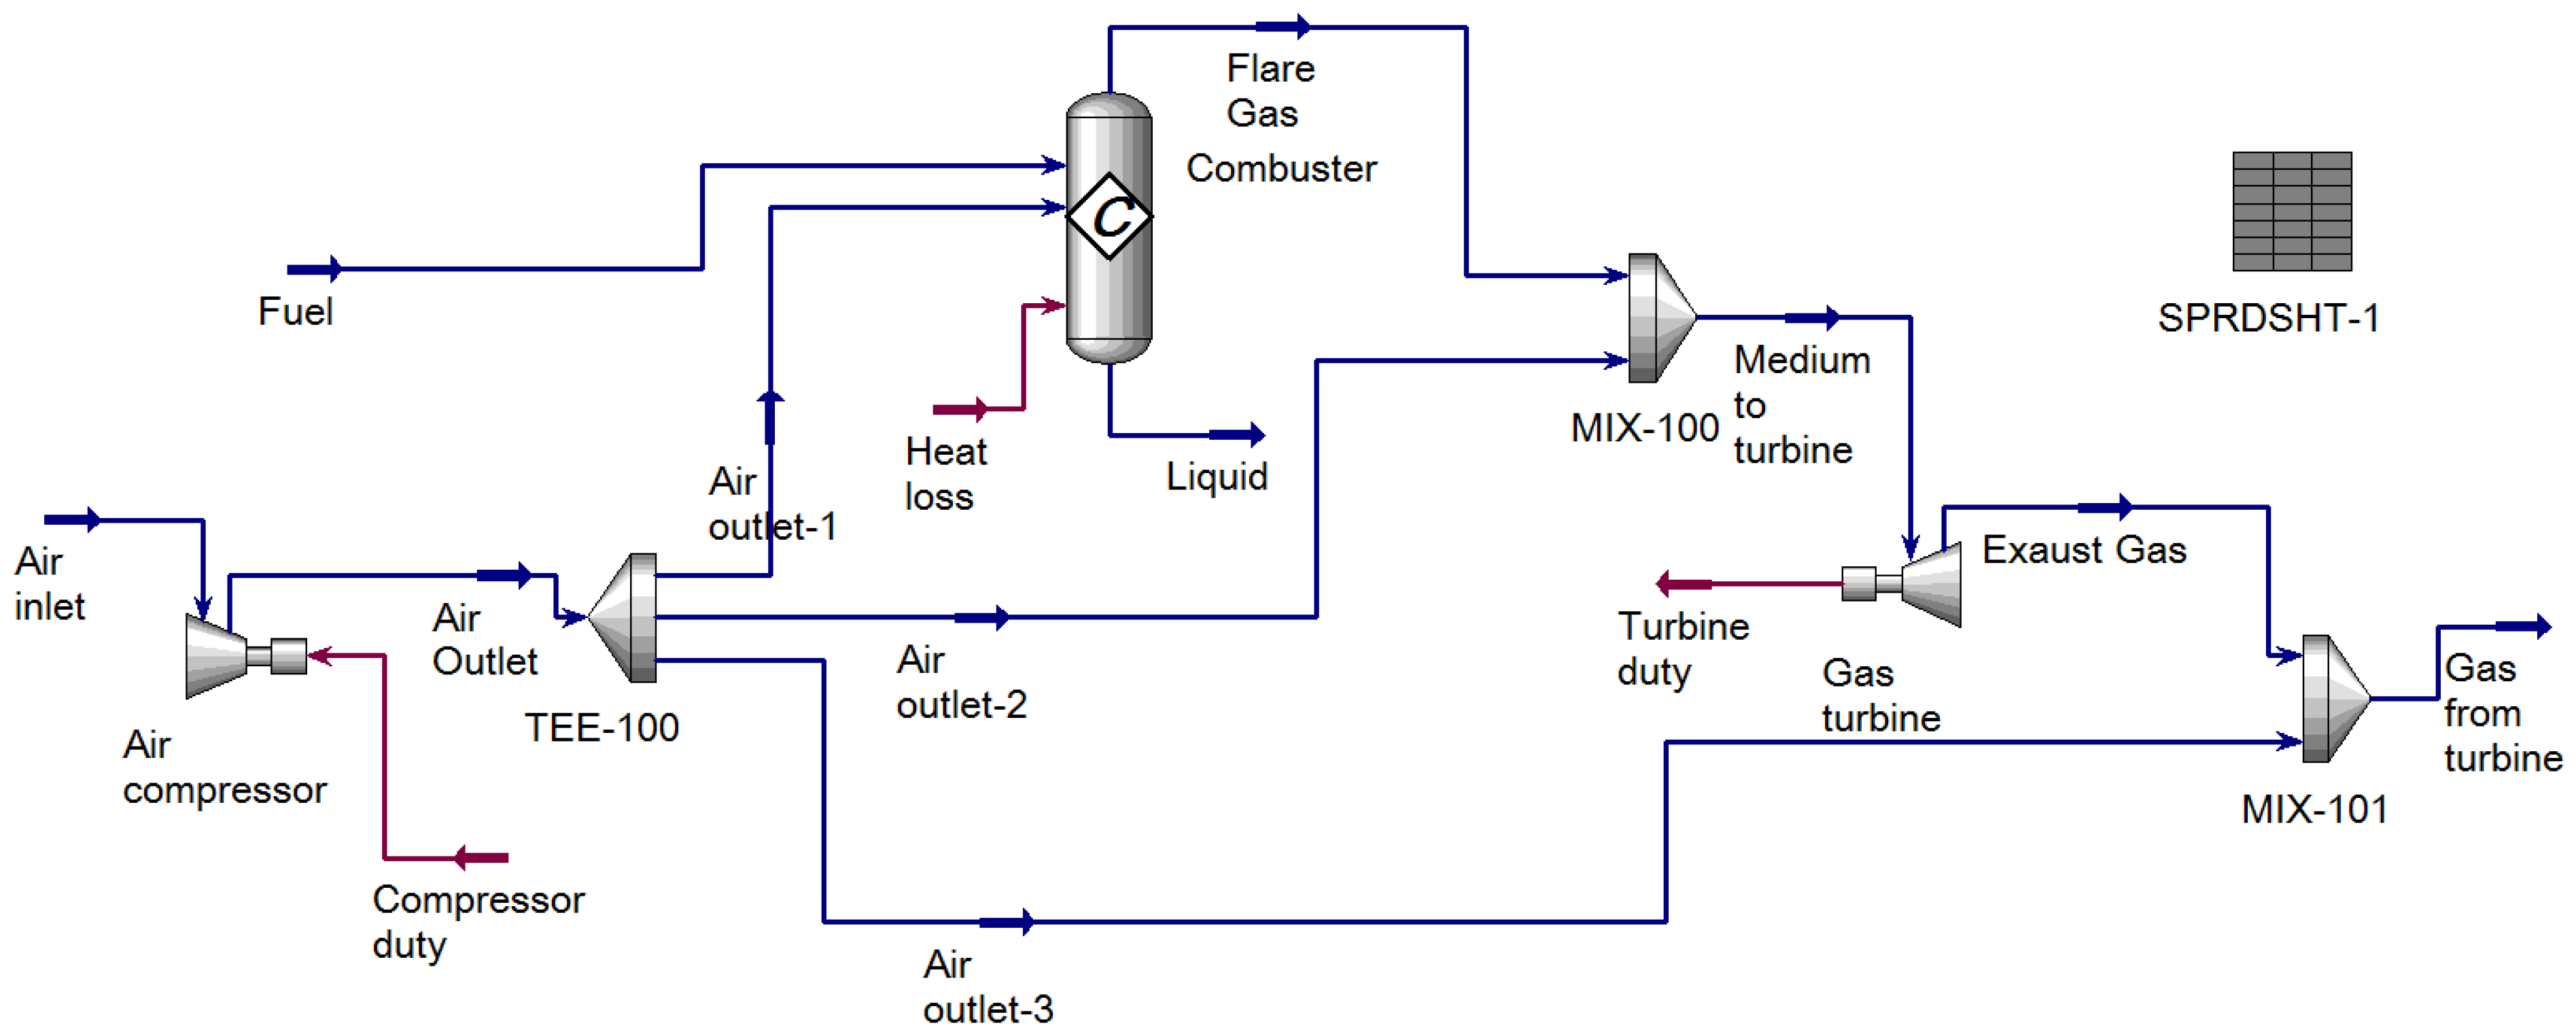
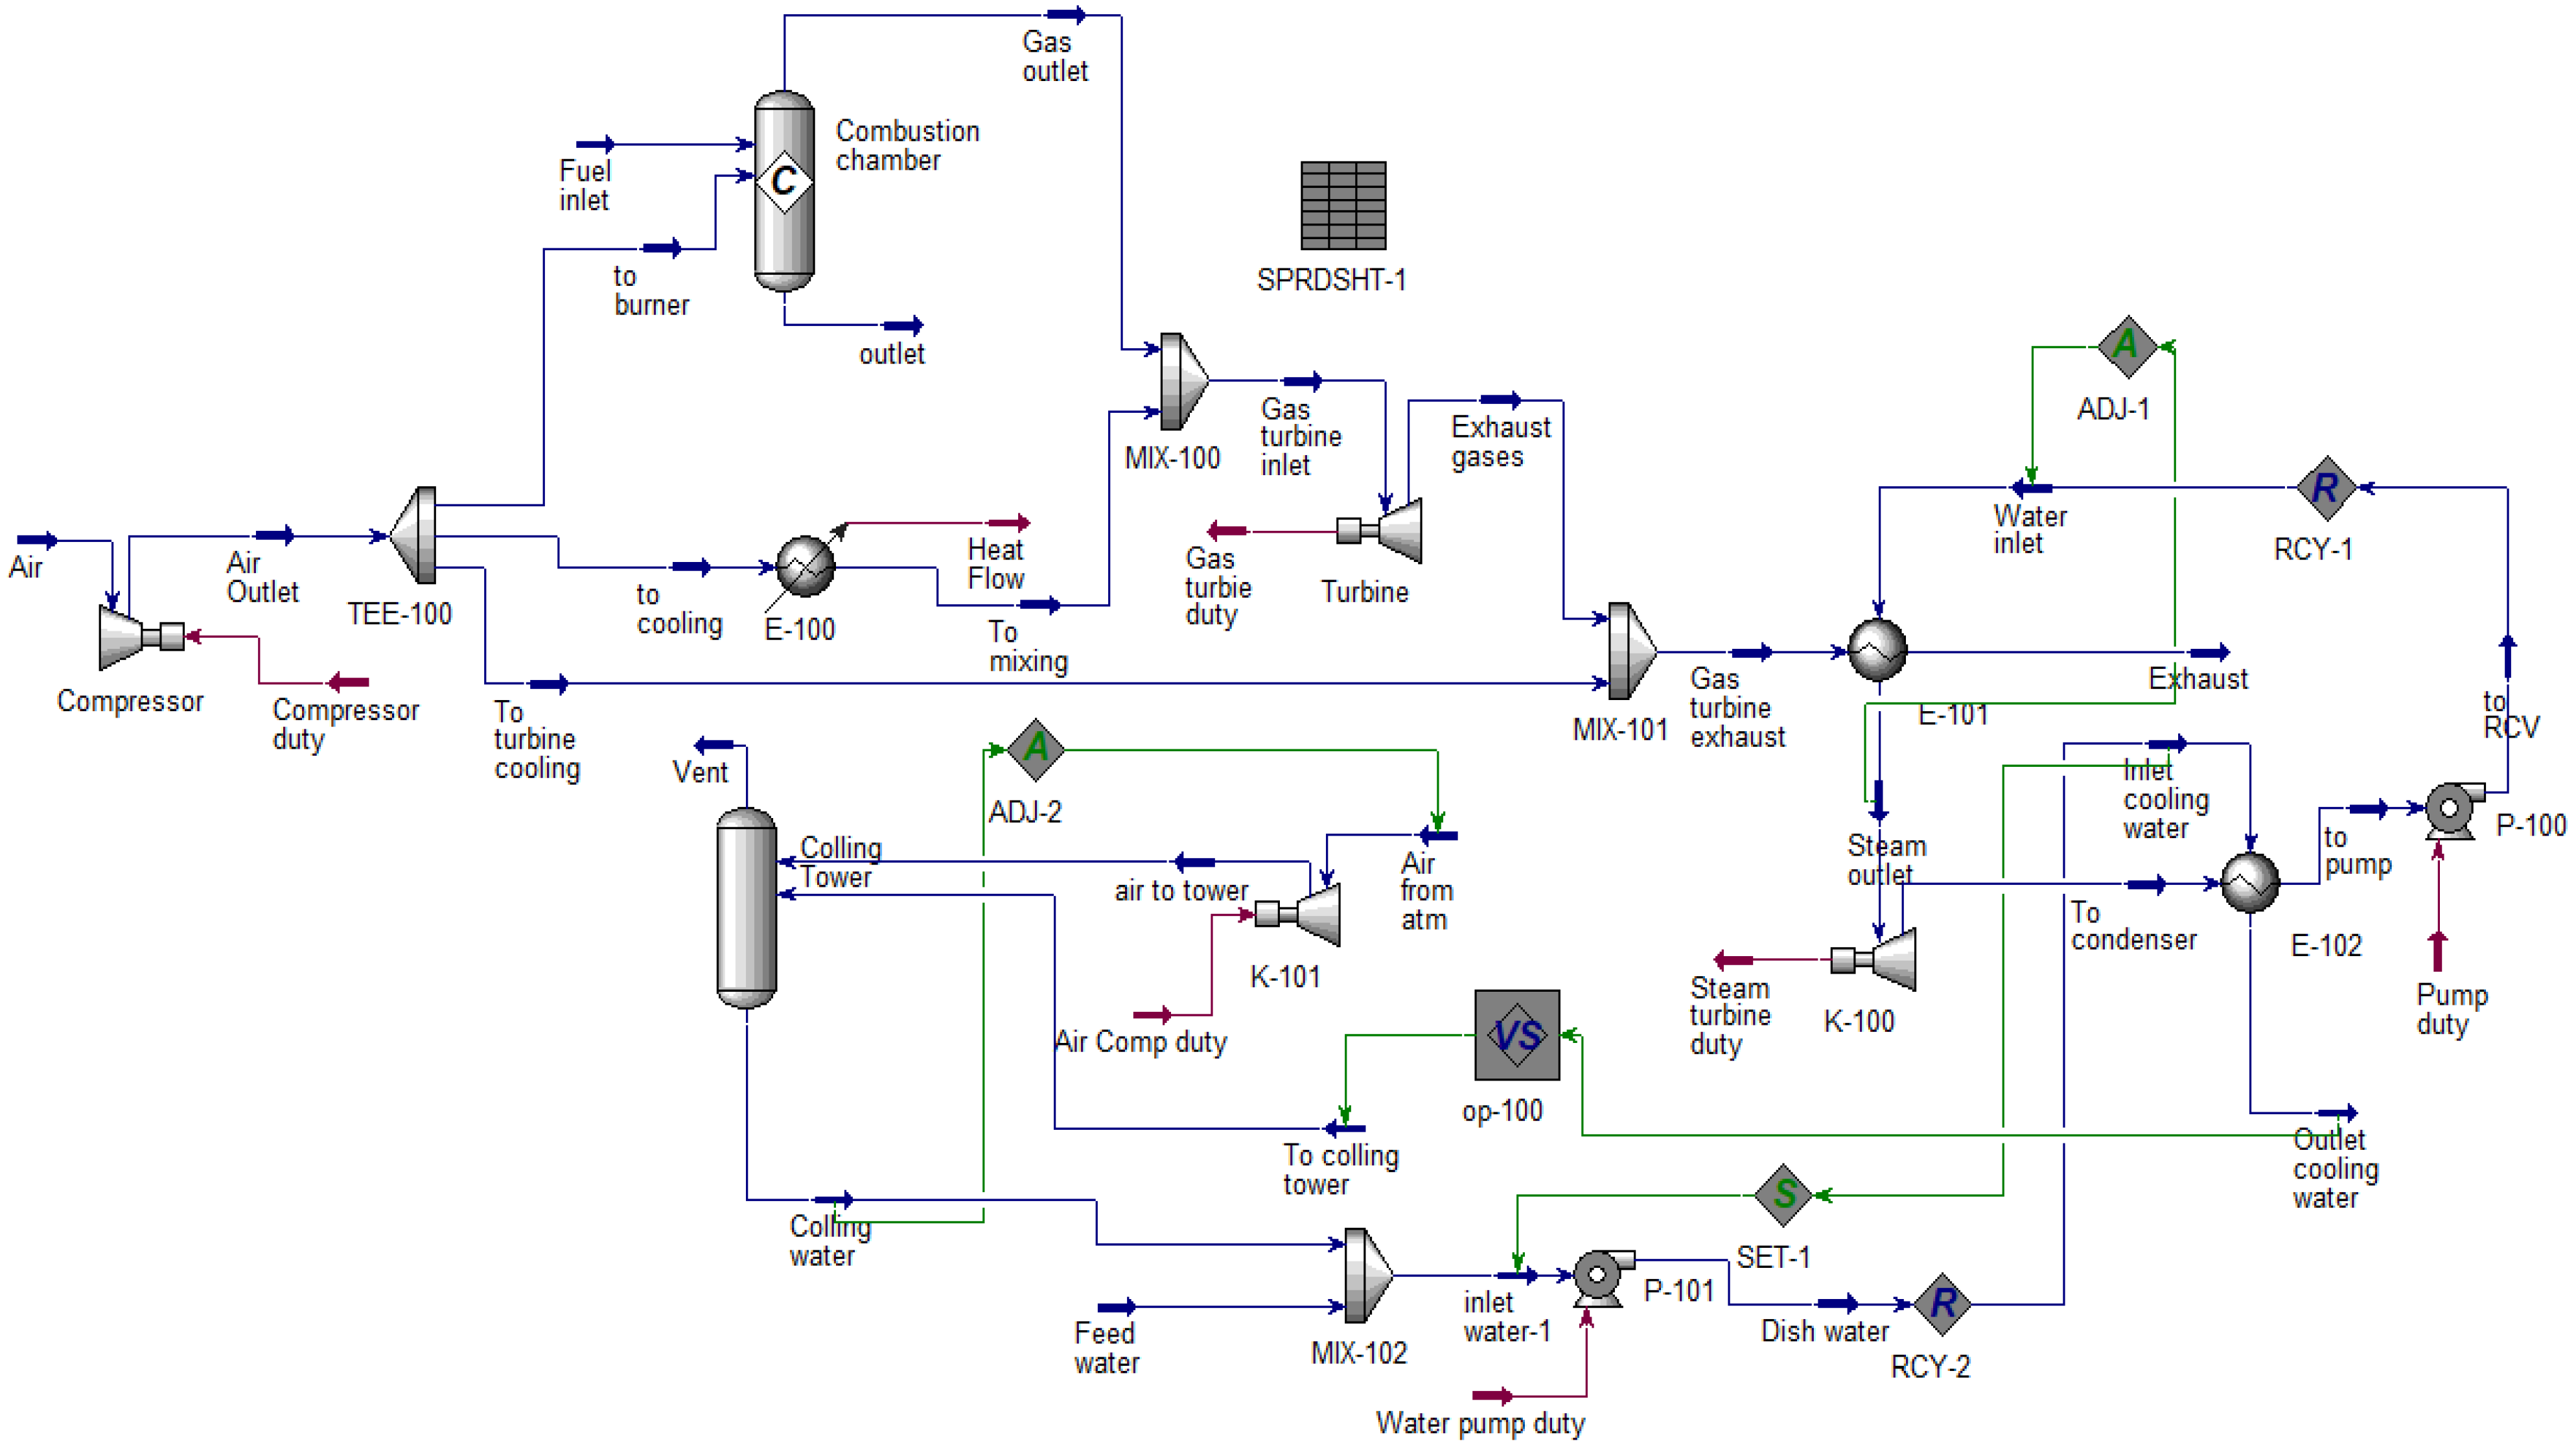
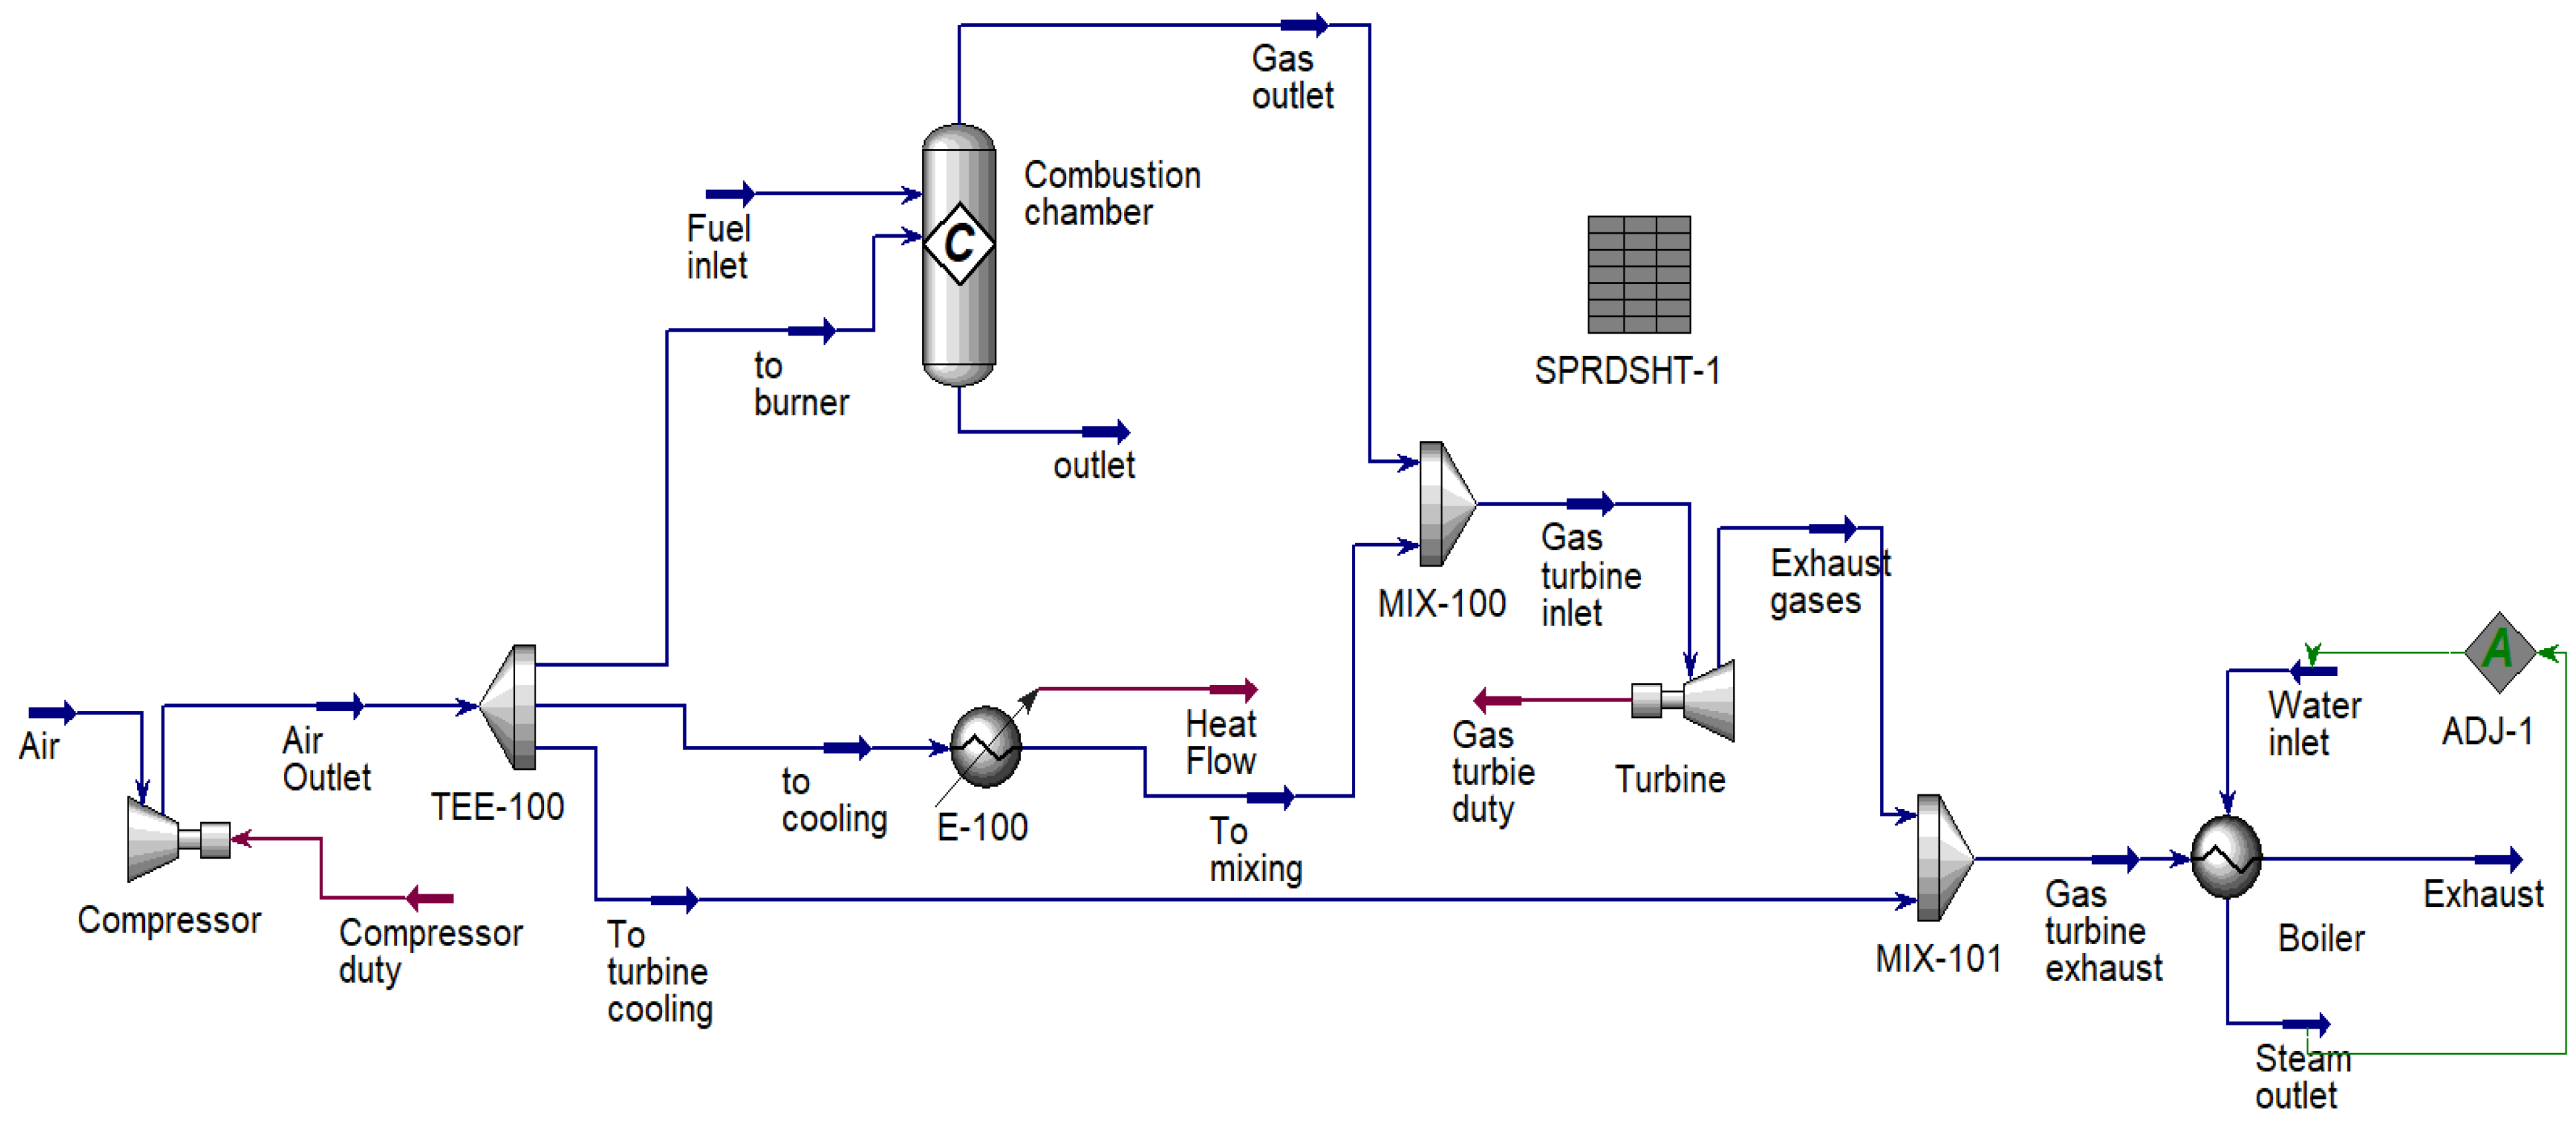
30]. Therefore, two schemes are considered as recommendations in this work: a combined cycle gas installation and the use of exhaust gases to produce high-pressure steam for the needs of the plant.
The development of solutions aimed at reducing operating costs for an oil company is certainly an urgent task aimed not only at reducing monetary costs, but also at the rational use of available energy resources. The use of extracted associated gas as fuel for generating steam and electricity can be a rational solution that allows not only for reducing the unit costs for oil production, but also to significantly reduce the environmental damage caused. Determining the design layout of equipment for generating steam and electricity for the needs of the plant is one of the main factors affecting the profitability. The choice of one or another scheme depends on the forecast calculations of the expected oil production. With low oil production, the cost of steam generators and diesel generators for electricity production is not so significant in the cost items for oil production and preparation. However, everything changes with a large volume of oil produced; in this case, it is most expedient to consider thermal power plants, CCPTs (combined cycle power plants), or combined-type gas turbine power plants that produce high-efficiency electricity and high-pressure steam.
In addition, it is necessary to consider the feasibility study of the project, which cannot be carried out without high-precision calculations with extensive use of modeling programs. The purpose of this work was to develop a mathematical model of the operating GTU of an oil-producing company located in the Republic of Kazakhstan, to check the adequacy of the model according to the technological survey of the installation and to develop recommendations for its improvement, to analyze the proposed schemes from the point of view of technical, environmental, and economic indicators. In addition, it is necessary to consider the feasibility study of the project, which cannot be carried out without high-precision calculations with extensive use of modeling programs.
The studied GTPP is in the oil field of the Republic of Kazakhstan and is designed to generate electrical energy necessary for the operation of technological equipment. The power output of the power plant is provided at a voltage of 110, 35, and 6 kV. At a voltage of 35 and 6 kV, it is planned to provide power to consumers of the PDA and the surrounding residential area. A general analysis of energy consumption in 2017 showed that the GTPP within the company consumes:
Fuel gas—37.95%;
Diesel fuel—0.29%;
Electric energy—2.40%.
GTPP is one of the major consumers of fuel gas and has a significant impact on the energy intensity of the company. Diesel fuel consumption within the company is high; however, within the GTPP, consumption is low at 0.29%. The main energy resource is fuel gas, which is needed as fuel to produce electric energy. Diesel fuel is used in small quantities during repairs and as a backup fuel. Since the amount of diesel fuel used is very small, it is not considered as an energy resource in further analysis. The consumption of electricity for the own needs of the GTPP does not exceed 0.44% of the total consumption of energy resources.
Four power units with gas turbine drives of electric generators are installed at the gas turbine power plant (GTPP); General Electric gas turbines, four PG6561 turbines with a nominal capacity of 36.31 MW, respectively. The first three GTU were put into operation in 2001, and the fourth GTU in 2005. For single-shaft three-stage jet-type turbines, the number of compressor stages is 17. The parameters of the GTU are presented in Table 1. There are no waste gas heat recovery systems after the GTU.
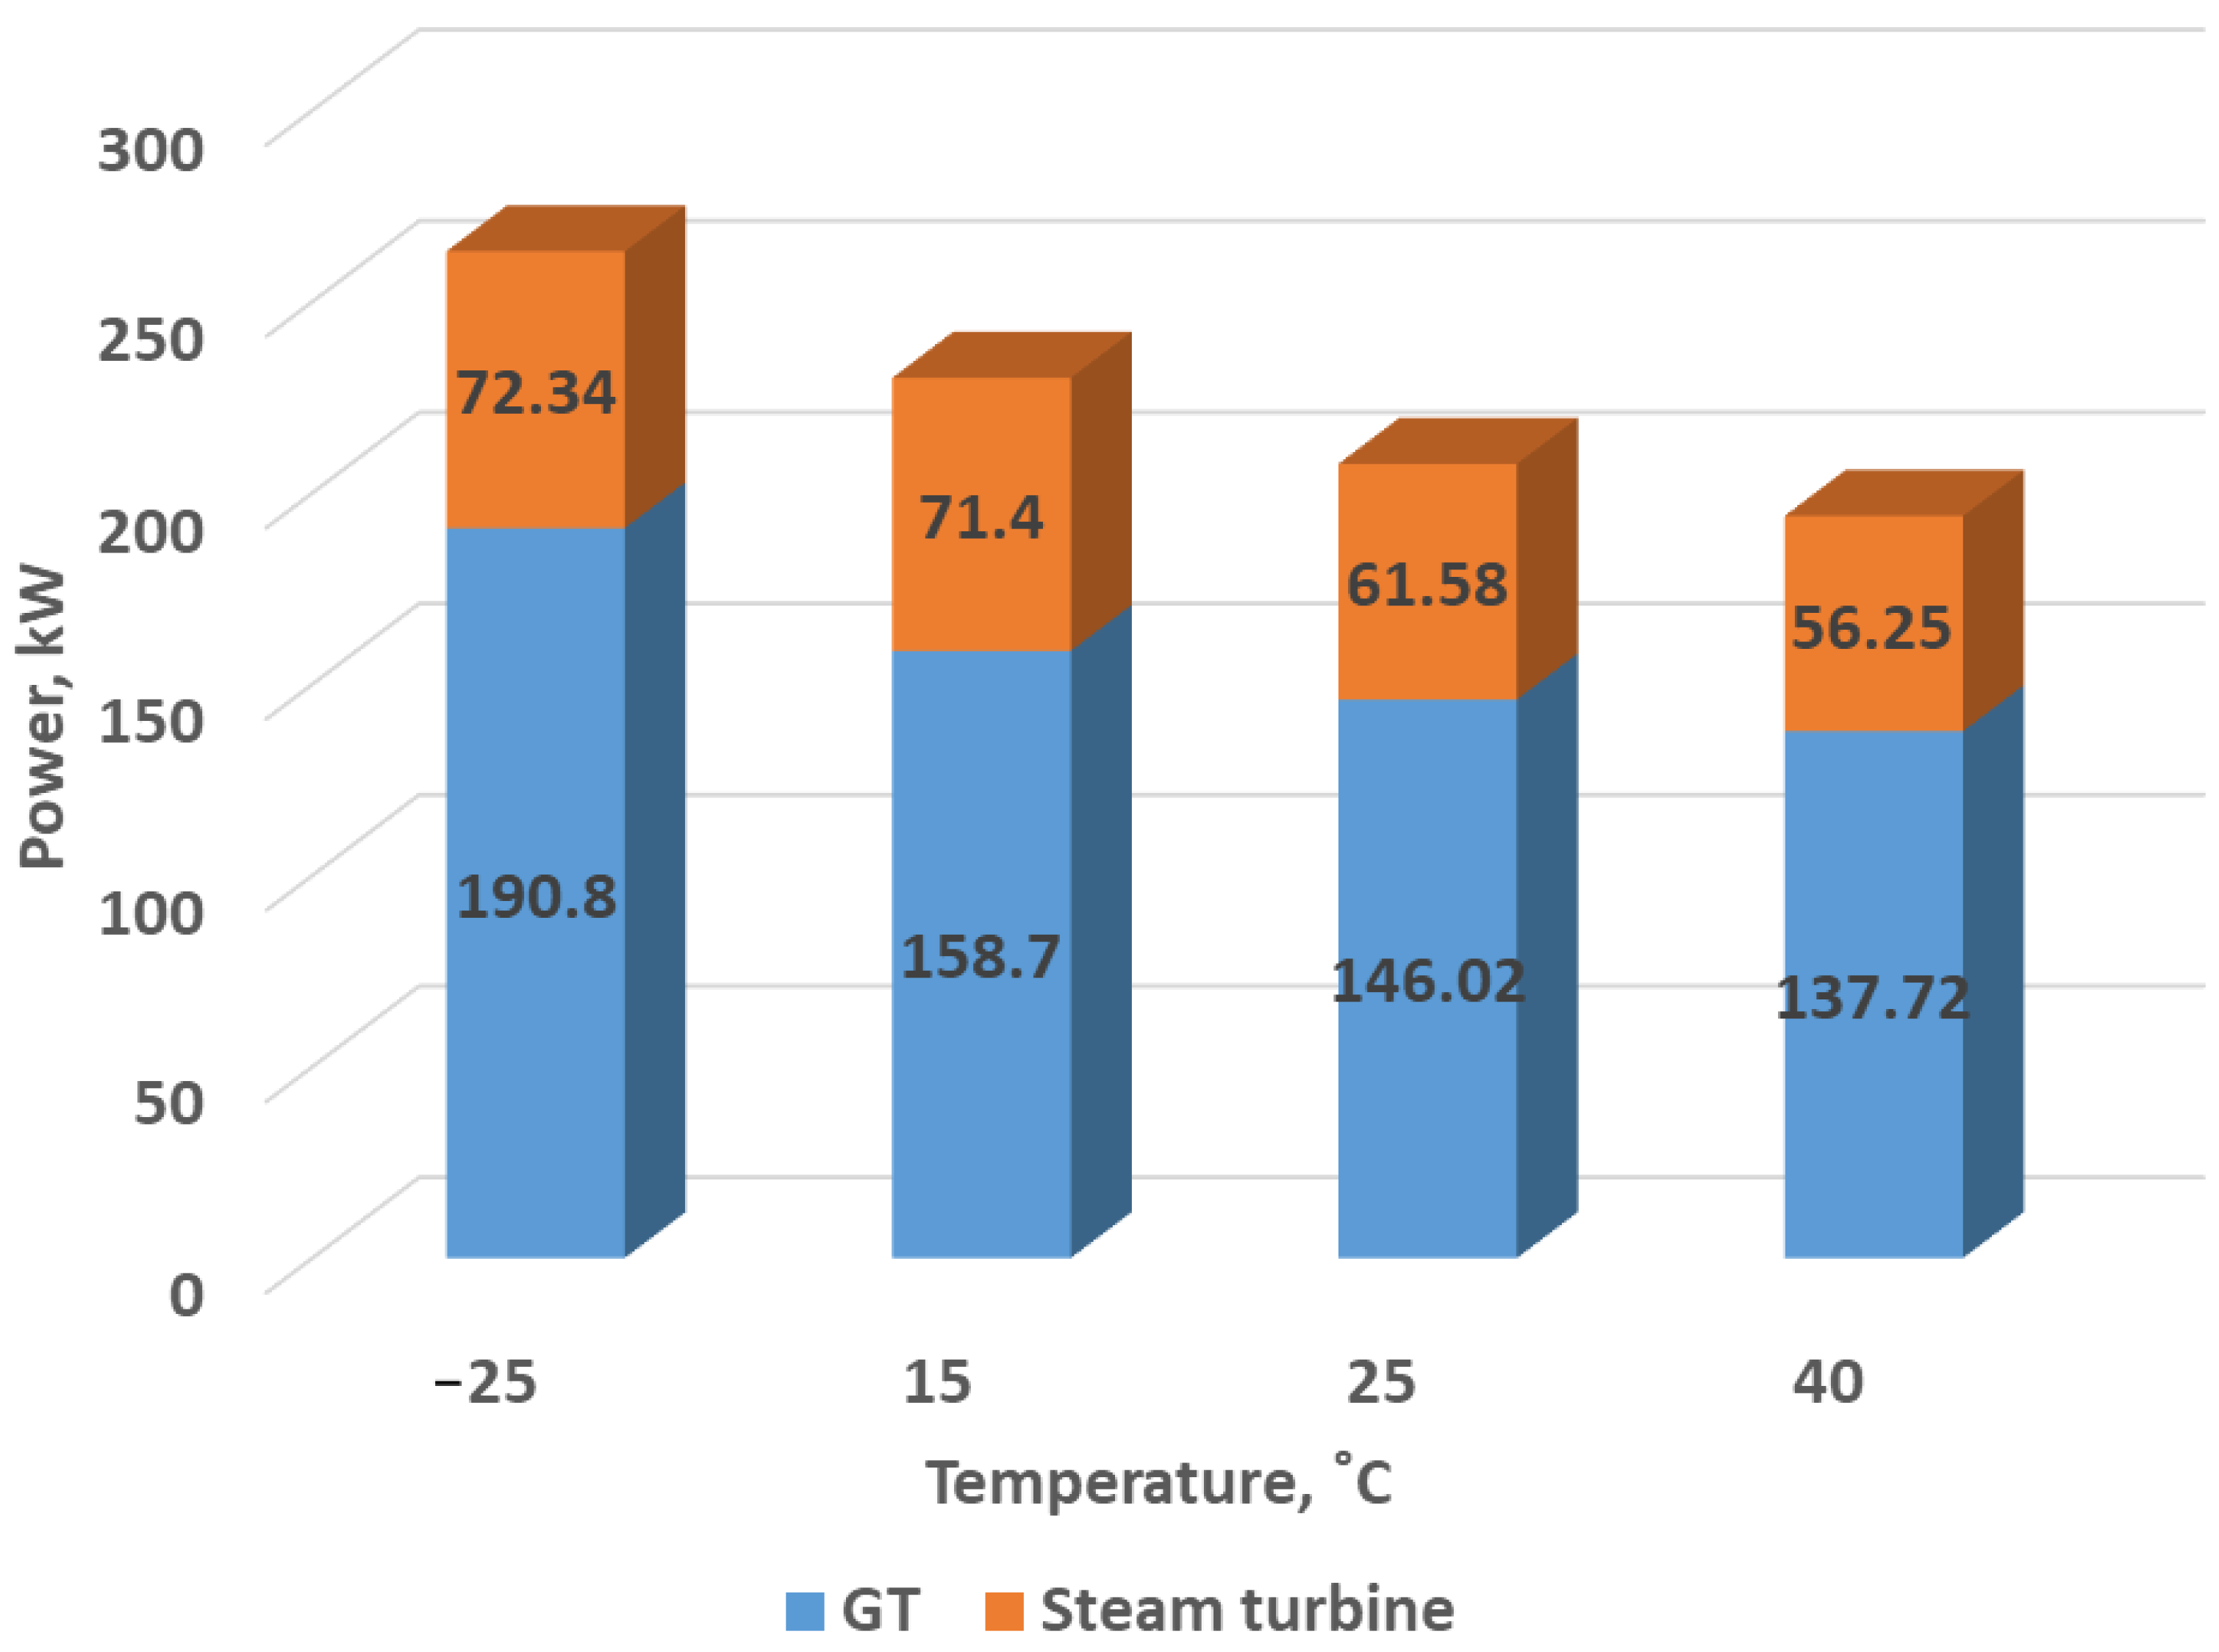
The design documentation of the power plant stipulates that in the future, a system for using the heat of exhaust gases after turbines should be introduced. One of the factors affecting the output power of turbines is the intake air temperature. When the air temperature rises, the turbine power decreases. Due to the lack of separate instrumentation on each turbine, accounting is conducted on a common gas supply line with a diameter of 200 mm. As can be seen from the data presented in Figure 1, the average monthly capacity and average monthly output in the summer months decreases. All 4 turbines are operating during the year. The maximum efficiency of one machine is achieved in the cold months and in April–May. With an increase in ambient temperature, the average efficiency and power generation decreases; for example, if in January–March the average power of four turbines is 121.2 MW, then in April–June the average power of the station is 100.8 MW. The power reduction is 16%. This is due to an increase in air temperature, which leads to an increase in the specific work of compression in the compressor. From the graph, you can see that all four turbines operate at full load all year round, taking into account that in the summer, the turbines operate at maximum load, and electricity generation is reduced. During the summer period, electricity reserves are significantly reduced. The utilization rate of GTU is 75%, and the lowest indicators obviously fall on a period with a high temperature.

2. Materials and Methods

The strategy of system analysis of oil production and refining installations is actively used to improve the hardware and technological design of production facilities. As a scientific method, it differs in that it uses a multidisciplinary approach to solve complex problems. Since the problem indicated in the article lies at the junction of petroleum engineering and thermal power engineering, the use of system analysis tools allows not only for setting the task more accurately, but also for outlining more correct ways to solve it.
Figure 2 shows the methodology of the study. In particular, in order to create models in Aspen HYSYS, actual data on fuel consumption, exhaust gas temperatures, ambient temperatures, average capacities of gas turbine installations, as well as boiler production were obtained. Next, the models presented in Figure 3, Figure 4, Figure 5 and Figure 6 were created. After comparing the data, the annual production of electric energy and steam, as well as fuel gas consumption, were calculated. Based on the consumption and the level of steam and electricity generation, CO2 emissions were calculated for each case. Based on the calculations carried out, equipment was selected that meets the energy capabilities of the new systems. Based on this, an economic model was created and the payback period of the equipment was calculated.
To develop recommendations for improving the system, it is necessary to determine its current state, and in this case, to calculate the material and energy balance of its component blocks. The basic block diagram of the GTU presented in Figure 3 generally corresponds to those generally accepted provisions that describe the processes that occur in the main stages of the process. However, it was decided to supplement the description with a heating unit for the air entering the annular channel of the combustion chamber, for which an energy flow QI was introduced, which corresponds to the heat transferred from the combustion zone to the cooling air.
Based on the developed block diagram in the Aspen HYSYS software package, the design scheme of the GTU under study was synthesized, as well as options for upgrading the gas turbine power plant. The basic version is shown in Figure 3, the option with a CCPP is shown in Figure 4, and the option with a heat recovery boiler is shown in Figure 5. A general description of the schemes is presented in Table 2. In the schemes under consideration, losses on low-power equipment were not taken into account, and electricity consumption was taken into account only by the main pumps that ensure the operation of the cycle, as well as the fan of the dry cooling tower.
Figure 3. Calculation scheme of a simple GTU cycle synthesized in Aspen HYSYS.
Energies 16 02704 g003
The presented design scheme in Figure 4 generally corresponds to the models described in [30,31], except that an additional heat exchanger module was added, which is designed to heat secondary air, and the heat load of the heat exchanger corresponds to the heat flow QI specified in the block diagram. The calculation scheme presented in Figure 3 was modified in accordance with the recommendations set out in [27] and is presented in Figure 4 and Figure 5.
To build a model of the steam part of the combined cycle, the following set of modules was used: heat exchanger (E-102 and E-103), expander (K-100), and pump (P-100).
The combustion products are fed into the E-102, where cooling takes place, and the circulating hot water condensate is heated, turning it into steam. The condensate flow rate is determined from the conditions that the combustion products are cooled at a temperature of 130 °C [30], and the value itself is calculated by the ADJ-3 operator. In ADJ-3, the variable is the molar condensate flow rate, the target temperature of the combustion gases at the outlet of E-102, and the value of the target variable itself is 130 °C.
The steam formed in E-102 is directed to K-100, which corresponds to a steam turbine. The steam spent in the turbine is discharged into E-103 (corresponds to the condenser), while the pressure is selected in such a way as to ensure complete condensation of water in E-103. The hot condensate formed in E-103 is fed into P-100 (corresponds to the feed water pump) and is again directed to E-102. The power output of a steam turbine significantly depends on the pressure in the condenser, which in turn depends on the temperature of the circulating water supplied to the condenser. However, the temperature of the recycled water also depends on the efficiency of the cooling unit, so to take this factor into account, additional modules must be introduced into the model.
To account for changes in the temperature of the feed water entering the steam cycle condenser, a circulating water cooling unit was added, which was modeled by a set of modules: comp (K-101), separator (M-100), mixer (MIX-100), and pump (P-101) [30]. The air flow is compressed in the K-101 module and fed into the V-100, where the recycled water heated in the E-103 is also fed. In the V-100, gas and liquid phase flows are formed, which correspond to the flow of blow-offs (gas part) and cooled liquid (liquid part). Thus, the combination of modules K-10 and V-100 correspond to a cooling tower.
Since part of the liquid (recycled water) evaporates when the recycled water and air come into contact, then the liquid flow is directed to MIX-102, where it is mixed with make-up water. Next, the water flow is fed into the P-101, compressed, and fed into the condenser. The presence of this unit will allow not only to take into account the influence of atmospheric air temperature on the temperature of direct circulating water, but also to take into account its losses in contact with air.
Figure 4. CCPP diagram.
Energies 16 02704 g004
Figure 5 depicts a schematic diagram of a gas turbine installation coupled with a heat recovery boiler, which is intended to produce steam for use in oil fields. The production of steam in the oil industry is an energy-intensive and laborious process, and the quality of steam produced directly affects the efficiency of oil extraction. According to reference [32], it is feasible to utilize the hot combustion gases discharged from a gas turbine for generating steam in the field. Thus, the original scheme illustrated in Figure 3 was modified and is presented in Figure 5.
The main feature of this scheme is that gases from the gas turbine enter the heat exchanger boiler, which is modeled by the heat exchanger module [31,32] (E-102 in the diagram), while the ADJ-1 controller selected a water flow rate at which the temperature of the cooled gases did not fall below 130 °C.
Figure 5. Diagram with a HRSG.
Energies 16 02704 g005
When calculating the GTU, it is necessary to correctly set the costs of primary and secondary air, the proportion of heat removed by secondary air, and heat losses. In the mathematical model, the primary and secondary air flow rates were set as the ratio of the flow rate of the corresponding flow to the total air flow:
ε 1 = G a i r 1 G a i r
ε 2 = G a i r 2 G a i r .
QI and QL were introduced by separate heat flows, while QL was introduced with a negative sign. At the same time, the numerical value of these parameters depends on the amount of heat released during the combustion of fuel:
ε 1 0.38
0.38 < ε 2 0.6
ε 3 0.4
ε 4 0.2 .
The adiabatic efficiency of a simple GTU cycle was calculated by the formula [33]:
η = W a c t m f ˙ L H V .
The adiabatic efficiency of the combined GTU scheme was calculated according to the formula [34]:
η = W g t + W s t W c W p W f m f ˙ L H V .
The adiabatic efficiency of the circuit with a heat recovery boiler was calculated by the formula:
η = W g t + 0.86     Q b o i l W p m f ˙ L H V .
The calculation of hourly CO2 emissions during the generation of electric energy by gas turbines was carried out according to the formula [34]:
C O 2 g t = W 0.912 k g k W h .
The calculation of hourly CO2 emissions from the combustion of associated petroleum gas by steam boilers was carried out according to the formula:
C O 2 s b = m f ˙ 0.202 k g k g f u e l .
The following formula was used to calculate the useful energy spent on steam production:
Q b o i l = [ D s t e a m ( h s t e a m h s . w ) D s a t . ( h s a t h s . w ) ] η b o i l .
The efficiency of boilers was taken from the mode maps of boilers.
The simple payback period is calculated using the formula:
P B = I 0 B .
The NPV of the project is calculated by the formula:
N V P = B 1 ( 1 + r ) n r I 0 .
The calculation of the model was carried out according to the following algorithm:
Input flow state parameters (temperature, pressure, composition, and flow rate) were entered. The efficiency of the compressor and turbine were set.
The values of ε, QI and QL were set.
The scheme was calculated in Aspen HYSYS [35].
The calculated temperature of the exhaust gases from the combustion chamber is compared with the actual values. If the deviations between them exceeded the permissible error, then the adjustment of the secondary air flow was carried out. If the condition of Equation (4) was not fulfilled, the calculation was terminated.
If the calculated output of the work exceeded the actual one, then the adjustment of the secondary air flow was carried out. If the condition of Equation (5) was not fulfilled, the calculation was terminated.
Next, the calculated temperature of the combustion gases at the turbine outlet is compared with the actual value. If the discrepancy exceeded the specified value, the values of QI and QL were corrected. If the conditions of Equations (7) and (8) were not met, the calculation was terminated. Table 3 presents the main input parameters.

3. Results

3.1. Technical Comparison between Proposed Schemes

When studying the GTU, design data on the operation of the installation at different ambient temperatures were obtained. In accordance with this, when checking the adequacy of the model, the calculated data were compared with the design data for four different operating modes of the installation. The results are presented in Table 4. As can be seen from the table, the error between the actual data and the base model does not exceed 8% for individual categories. The error in fuel consumption is 2–4%. The greatest deviation from the actual data is observed for the temperatures of the exhaust gases from the combustion chamber of a gas turbine installation. This is due to the fact that the model did not take into account the design features of the combustion chambers and methods of fuel supply. Since the efficiency of the compressor and gas turbine is not reliably known, these values were set.
The analysis of the data presented in Table 3 shows that the developed mathematical model both qualitatively and quantitatively corresponds to the technological object under study.
Figure 6 shows the dependence of the power of the analyzed circuits at different ambient temperatures, as well as taking into account the needs of the new equipment. As can be seen from the figure, the steam–gas cycle has the highest power at all temperatures due to the presence of a steam power cycle. The cycle with the utilizer boiler, since all the power is generated by the gas turbine unit, has a slightly lower power than the gas turbine cycle due to the operation of the feed pump of the utilizer boiler. As can be seen from the figure, with an increase in ambient temperature, power decreases in all the considered options, due to an increase in the specific energy consumption of the compressor. Moreover, the fall is the same for everyone, since the gas turbine cycle is the basic one.
Figure 7 shows the dependence of combined cycle power generation. As can be seen from the figure, the main electrical power is generated by four gas turbines. For a temperature of −25 °C, the power of four turbines is 190.08 MW due to an increase in the efficiency of the compression process in the turbine compressor. The power of a steam turbine at this temperature is 72.34 MW, which is equal to 27.5% of the total capacity of the installation. When the temperature rises to 15 °C, the capacity of gas turbines falls by 16.5% and is equal to 158.7 MW. However, for steam turbines, the power is slightly reduced by 1.29%. The share of steam power generation is 31%.
With a further increase in temperature to 25 °C, the power of the gas turbine is reduced by 7.98% and is equal to 146.02. The power of the steam turbine is reduced by 13.7%. This is due to the fact that in order to maintain the necessary vacuum in a dry cooling tower, a large amount of heat is spent compared to temperatures below 15 °C. The power of a steam turbine is 30%, and a gas turbine is 70%, respectively. An increase in temperature to 40 °C leads to a significant decrease in output, if at 15 °C the installation capacity was 230.1 MW; then at 40 °C, it is equal to 193.97 MW. The power of a gas turbine compared to the previous mode is reduced by 5.68%, and steam by 8.65%. The share of steam power generation is 28%. As can be seen from the analysis, with an increase in temperature, the share of electricity generated by the steam turbine decreases. This is due to an increase in electricity consumption, as well as a decrease in temperature in the dry cooling tower and a decrease in steam production in the heat recovery boiler.
Figure 7. Dependence of power generation on ambient temperature of CCPP.
Energies 16 02704 g007
Figure 8 shows a comparison of the consumption of auxiliary equipment of the circuit with a heat recovery boiler and a combined cycle. As can be seen from the figure, at a temperature of −25 °C, the feed pump consumes the least amount of electricity. It is also noticeable that when the ambient temperature rises, the consumption of the condensate pump decreases to a small extent. The most energy-consuming element of the combined cycle is the fan of the so-called dry cooling tower. As can be seen from the graphs, in winter conditions, the fan consumes 6347 kW of electricity. When the temperature rises to 15 °C, the fan consumes 7375 kW, which is 13.4% higher than at −25 °C. With an increase in temperature from 15 to 25 °C, the increase is insignificant due to a slight difference in temperatures. At a temperature of 40 °C, the maximum level of electricity consumption by fans is observed due to a decrease in air density and an increase in its amount to ensure the necessary level of cooling. As can be seen from the figure, the circuit with the heat recovery boiler has significantly lower consumption due to the absence of a “dry” cooling tower fan.
Figure 9 shows the dependences of steam generation on ambient air temperature for schemes with a heat recovery boiler and a steam turbine. As can be seen from the figure, the dependence is linear, but the maximum output corresponds to a temperature of 15 °C. In general, an increase in temperature leads to a decrease in steam production in both schemes. This is explained by the fact that the gas consumption decreases with increasing temperature; however, due to the high temperature of the exhaust gases and a sufficiently high flow rate, the maximum amount of steam corresponds to a temperature of 15 °C. It should be borne in mind that steam production is also affected by steam parameters. In the combined cycle, the steam has the following characteristics of 500 °C: A pressure of 8 MPa was chosen according to known sources [36]. The temperature of 500 °C was chosen based on the possibility of maximum heat recovery, since the temperature range of the exhaust gases is 504–545 °C. The pressure in the heat recovery boiler for steam generation for technological needs is equal to 14 MPa with a temperature of 400 °C according to the technological scheme for the preparation of petroleum products. The average steam output for technological needs is 338,686 kg/h or 338 t/h. The analysis also shows that, regardless of the ambient temperature, the combustion products of a gas turbine installation provide a sufficient level of steam generation for technological needs that allow steam boilers to be turned off.
The efficiency of the systems considered is presented in Figure 10. The thermal energy utilized for technological needs is included in the total useful output for the circuit with a heat recovery boiler, making its efficiency significant at all temperatures. At −25 °C, the efficiency of a simple cycle is 34%, a cycle with a heat recovery boiler is 49.1%, and a combined cycle exhibits an efficiency of 48%. Notably, an increase in ambient temperature results in a significant decrease in the efficiency of the simple and combined cycles by 2–3%. Conversely, the efficiency of a cycle with a heat recovery boiler increases owing to higher exhaust gas temperatures, leading to more steam production under the same conditions. Eliminating the thermal energy spent on steam reduces the efficiency of the cycle with the heat recovery boiler slightly lower than the base cycle due to the operation of the boiler feed pump.
Figure 11 shows the dependence of the consumption of specific fuel consumption on the production of electrical energy at different ambient temperatures. As can be seen from the figure, the maximum fuel consumption per kWh of generated energy corresponds to the scheme with a heat recovery boiler for steam generation. At ambient temperature for this scheme, the fuel consumption per kW of electricity generated is 297.48 g/kWh, in the case of a simple GTU scheme it is 294.6 g/kWh, and in the case of a combined cycle, the value is 213.4 g/kWh. An increase in ambient air temperature obviously leads to an increase in the level of fuel consumption for electricity generation due to an increase in electricity consumption in the gas turbine compressor and auxiliary equipment. In the case of a simple cycle and a cycle with a heat recovery boiler, the increase is 9.7%, in the case of using a steam power cycle, 3.48% is due to a significant level of electricity generation. The maximum fuel consumption corresponds to 40 °C. Moreover, the increase in fuel consumption with an increase in temperature is 2–6%. In the case of a combined cycle, the temperature increase from 25 °C to 40 °C leads to an increase in consumption by 7% due to an increase in the consumption of the electric fan of the dry cooling tower.
Figure 12 shows the schedule of steam production by four boilers installed in the boiler room. As can be seen from the graph, in general, the boilers operate at a constant load and each boiler produces 53–58 tons of steam per hour. In general, the average annual output of four boilers is 233.62 tons of steam per hour, which is a good indicator. The calculation of the efficiency of steam boilers shows that the average value varies from 91 to 93%. To analyze the possibility of switching off boilers, the average monthly productivity values and the average annual value were calculated. The drop in efficiency in the month of May was noticed due to repairs on the boiler D. In general, the boilers operate in nominal mode, and the working time of the boilers is year-round, except for scheduled repairs. An important factor in the operation of boilers is their continuity, because to ensure the processing of petroleum products, a constant supply of high-pressure steam into the technological scheme of oil treatment is necessary.
The analysis revealed that a single steam boiler produces an average of 58,405 tons of steam per hour, whereas a combined cycle with a gas turbine and a recovery boiler can generate up to 338,686 tons of steam per hour. Thus, by employing a circuit with a heat recovery boiler, it is possible to switch off all boilers and utilize steam exclusively from the heat recovery boiler. In CO2 emission and economic calculations, it is assumed that all boilers are shut down.
Figure 13 exhibits the total CO2 emissions for the considered schemes, incorporating the emissions emanating from fuel combustion in boilers for steam production. As evident from the figure, the highest emissions are associated with schemes not utilizing steam in technological operations and the base version. At a temperature of −25 °C, the base scheme and the combined cycle have similar emission levels, amounting to 141.78 tons/h. The heat recovery boiler scheme emits 108.34 tons/h, signifying a 23.5% reduction compared to the other schemes. The consumption of fuel and power generation decrease with increasing ambient temperature, leading to reduced harmful emissions. Compared to the prior temperature, the reduction in emissions is 12.6% for the base scheme and the combined cycle, and 16.5% for the heat recovery boiler scheme due to decreased fuel consumption by gas turbines. The lowest emission values are observed at the highest temperatures, amounting to 111.93 t/h for a simple cycle and a combined cycle and 78.5 t/h for a cycle with a heat recovery boiler.
Figure 14 shows a graph of the dependence of specific CO2 emissions per unit of power produced. As can be seen from the figures, the maximum emissions correspond to a simple GTU scheme and are equal to 0.75–0.81 kgCO2/kWh. Moreover, an increase in temperature leads to an increase in the specific level of emissions due to a decrease in electricity generation. Moreover, it is noticeable that a decrease in fuel consumption affects less than a decrease in the power generated. For a circuit with a heat recovery boiler, it is noticeable that CO2 emissions are approximately equal to those of a circuit with a steam power cycle. This is due to the fact that with this scheme, all boilers are switched off and the main emissions are equal to the emissions of only a gas turbine. Moreover, it is noticeable that the level of specific emissions is constant, since CO2 emissions in this case depend only on the operation of a gas turbine and the burning of fossil fuels in it.
For the combined cycle, the CO2 level also varies slightly, since CO2 emissions come from the gas turbine and from boilers. Moreover, it is noteworthy that the emission level corresponds to the emission level for a circuit with disconnected boilers. From this graph, it can be concluded that if you choose from the point of view of ecology, then the cycle with a heat recovery boiler and the cycle with a steam power plant have the same efficiency and the main factor for choosing will be economic. As the main economic factors, it is necessary to consider the benefits from the sale of additionally generated electricity and payback periods.

3.2. Economic Calculation

The economic analysis of the project involved the computation of costs incurred in equipment procurement, labour wages, and piping installation for steam supply. Table 5 presents the relevant economic parameters considered in the evaluation, including the costs of new main and auxiliary equipment, and wages of builders. However, several factors were not accounted for in the analysis, such as changes in the electricity tariff, exchange rate fluctuations of Tenge to the dollar and euro, bank rate variations, and changes in the load on the equipment. The calculation was based on average annual values of electrical and thermal energy generation in the form of steam. It is worth noting that the energy system of Kazakhstan is divided into three major zones, namely, Northern, Southern, and Western. While the first two zones work together, the Western Zone is isolated and experiences electricity shortages, which are often covered by importing electricity from Russia, the nearest source [36].
In this study, economic calculations were based on average annual temperatures. Capital investments were computed using the costs of the steam room and waste heat boiler, as presented in Table 5. Additionally, the main pipelines at the gas turbine site were factored into the calculations. The cost of gas was derived from the average gas prices in the Western region of Kazakhstan. Construction costs were assumed to be 10% of the total costs of pipelines and capital equipment. The technical calculations determined that the waste heat boiler’s capacity was 247 MW, while that of the waste heat boiler in the CPPP cycle was 222 MW. The average power of the steam turbine was estimated at 65.4 MW. The capital investments were computed based on the conversion factors, including the cost of pipes.
It is important to note that in the Western Zone, the main sources of electricity are gas turbine power plants that do not have a connection to the common grid; most often, electricity is used for the oil-producing enterprises’ own needs. It is especially important to note that now there are no combined cycle gas installations in Kazakhstan [28].
Figure 15 shows a comparison of NPV as a percentage of IRR. The analysis shows that from the point of view of economic efficiency, the most acceptable is the use of a heat recovery boiler as a source of steam for technological needs. The efficiency of the project decreases since the cost of the CCPP includes a sufficiently large amount of equipment, in particular two pumps for pumping water and a fan for water cooling.
Figure 16 illustrates the payback period and investment amount for the analyzed projects. The implementation of the system for exhaust gas disposal and steam generation for technological purposes is deemed the most advantageous based on the results. However, the scheme’s implementation cost is significant, especially when taking into account the already installed and operating boilers. At an assumed bank interest rate of 10%, the payback period for such a project is estimated at 4 years.
The construction of a combined cycle gas plant is another viable option, as it generates more electricity for technological needs and sales to the Western Kazakhstan region. The project’s cost is estimated at USD 38 million, with a payback period of 7 years. However, not all electricity generated will be sold to the grid, thereby increasing the project’s payback period significantly when accounting for this factor.
Table 6 shows the results of economic and environmental calculations. According to the calculations, the potential emissions due to the shutdown of boilers will reach 13.4 thousand tons of CO2 per year for the GT + HRSG scheme. For the CCPP scheme, emissions will be reduced due to the potential generation of electricity equal to 27.9 thousand tons of CO2. Emissions due to fuel combustion will be reduced by 17.4 thousand tons of NOx per year for the scheme with HRSG. For CCPP, this figure is equal to 32 thousand tons of NOx.
According to the Tax Code of the Republic of Kazakhstan [37], the cost of emissions of 1 ton of NOx is USD 6.74. Cash savings will amount to USD 1.18 and USD 1.1 million for HRSG and CCPP, respectively.

4. Discussion

The analysis of the possibility of improving the efficiency of a gas turbine power plant at an oil field in Kazakhstan shows that the construction of an object at a new enterprise presents serious difficulties. The analysis of the possibility of obtaining process steam shows that when installing a heat recovery boiler and generating steam, gas turbine installations can produce significantly more steam than is necessary.
The literature review highlighted the need to design schemes that consider the peculiarities of gas turbine power plants and combined cycle gas turbines (CCPP) operating under specific conditions, including the absence of water sources, low electricity costs, and high temperatures. The analysis conducted in this study enables the development of more effective recommendations for transitioning from a simple gas turbine cycle to more advanced and efficient cycles in Kazakhstan’s unique conditions.
The combined cycle makes it possible to reach 193.97–262.42 MW, depending on the ambient temperature, and the share of electricity generated by a steam turbine is 28–31%, depending on the ambient temperature. The use of the combined cycle allows us to fully meet the needs of production, as well as to supply surplus to the West Kazakhstan region.
Auxiliary equipment related to the combined cycle consumes a significant amount of electricity given the absence of a large amount of water for the condenser, dry capacitors are used in the circuit, respectively, and the electricity consumption of the air fan prevails over the rest of the equipment. The fan consumption varies in the range of 6347–7888 kWh depending on the ambient temperature. All other equipment consumes no more than 470 kWh depending on the ambient temperature. The average steam output for technological needs is 338 tons/h of steam, and for a steam turbine 301.9 tons/h of steam. It should be borne in mind that steam for a steam turbine has a higher temperature, which explains a slightly lower value than for technological needs.
When upgrading with the HRSG installation, the specific fuel consumption to produce electric energy is 326.39 g per kWh, and for the basic scheme of the GTU, this figure is equal to 322.62 g per kWh. A slight increase in fuel consumption is due to additional electricity consumption by the HRSG feed pump. It is obvious that the combined cycle will have the lowest specific indicators of fuel consumption due to the generation of additional electrical energy by a steam turbine. The specific indicator for CCPP is 220.83 g per kWh at a temperature of 15 °C.
CO2 emissions in the HRSG option amount to 0.56 kgCO2/kWh, while in the basic option, emissions will amount to 0.77 kgCO2/kWh. This indicator for CCPP is 0.53 kgCO2/kWh, which is close enough to the HRSG option.
Based on the calculated payback period for options with HRSG (4 years) and CCPP (7 years), it can be concluded that the first option is the most promising for implementation, while specific CO2 emissions are quite close to each other. However, from the point of view of electrical efficiency, the CCPP option is the most preferable, but at the same time, more technically complex and expensive.

5. Conclusions

This study yielded the following outcomes:
  • New models of combined cycle gas turbines (CCPP) and gas turbine + heat recovery steam generator (GT + HRSG) were developed, considering the peculiarities of Kazakhstan’s oil field operations;
  • Dependencies of efficiency, power generation, and steam production on temperature were established;
  • Installation of a waste heat boiler for steam production significantly reduces CO2 emissions per kWh by 27%;
  • The payback period for the GT + HRSG scheme is 4 years, while that of the CCPP scheme is 7 years.

Author Contributions

Conceptualization, D.R.U.; methodology, D.R.U. and E.V.O.; software, D.R.U. and E.V.O.; validation, D.R.U. and E.V.O.; formal analysis, A.A.K.; investigation, M.S.K.; resources, M.S.K.; data curation, Z.S.D.; writing—original draft preparation, D.R.U.; writing—review and editing, D.R.U. and E.V.O.; visualization, T.V.K.; supervision, A.A.K.; project administration, A.A.K.; funding acquisition, D.R.U. and E.V.O. All authors have read and agreed to the published version of the manuscript.

Funding

This research received no external funding.

Data Availability Statement

The data presented in this study are available on request from the corresponding author. The data are not publicly available due to university restrictions.

Conflicts of Interest

The authors declare no conflict of interest.

Nomenclature

Wpower, kW
m f ˙ fuel mass flow rate; kg/s
LVHlower heating value, kJ/kg
Qheat flow, kJ/s
Dmass flow rate, kg/s
hspecific enthalpy, kJ/kg
NVPnet present value, USD
PBpayback period, year
Bcash flow, USD
I0primary capital investments, USD
rinterest rate
Greek letters
ηefficiency
Subscripts
0inlet flow
1primary air flow
2secondary air flow
compcompressor
turbturbine
cccombustion chamber
gtgas
ststeam turbine
ppump
ffeed water
sat.saturated
s.w.saturated water
boilboiler

References

  1. UNFCCC: Kyoto Protocol to the United Nations Framework Convention on Climate Change. 1997. Available online: https://unfccc.int/kyoto_protocol# (accessed on 20 January 2023).
  2. Mohsen, K.; Almas, H.; Mehdi, K. Environmental implications of economic complexity and its role in determining how renewable energies affect CO2 emissions. Appl. Energy 2022, 306, 117948. [Google Scholar]
  3. Seungchul, W.; Seungju, B.; Kihyung, L. On-board LPG reforming system for an LPG hydrogen mixed combustion engine. Int. J. Hydrog. Energy 2020, 45, 12203–12215. [Google Scholar]
  4. Nami, H.; Ertesvåg, I.; Agromayor, R.; Riboldi, L.; Nord, L. Gas turbine exhaust gas heat recovery by organic Rankine cycles (ORC) for offshore combined heat and power applications—Energy and exergy analysis. Energy 2018, 165, 1060–1071. [Google Scholar] [CrossRef]
  5. Taohong, L.; Guoqiang, Z.; Yongyi, L.; Yongping, Y. Performance analysis of partially recuperative gas turbine combined cycle under off-design conditions. Energy Convers. Manag. 2018, 162, 55–65. [Google Scholar]
  6. Dhinesh, T.; Faisal, A.; Kumar, P. Thermal performance and economic analysis of supercritical Carbon Dioxide cycles in combined cycle power plant. Appl. Energy 2019, 255, 113836. [Google Scholar]
  7. Abigail, G.; Agustín, A.-C.; Maria GonzálezDíaz, O.; Méndez-Aranda, Á.; Lucquiaud, M.; González-Santaló, J. Effect of the ambient conditions on gas turbine combined cycle power plants with post-combustion CO2 capture. Energy 2017, 134, 221–233. [Google Scholar]
  8. Panowski, M.; Zarzycki, R.; Kobyłecki, R. Conversion of steam power plant into cogeneration unit—Case study. Energy 2021, 231, 120872. [Google Scholar] [CrossRef]
  9. Lecompte, S.; Huisseune, H.; van den Broek, M.; Vanslambrouck, B.; De Paepe, M. Review of organic Rankine cycle (ORC) architectures for waste heat recovery. Renew. Sustain. Energy Rev. 2015, 47, 448–461. [Google Scholar] [CrossRef]
  10. Aichmayera, L.; Spellingb, J.; Laumerta, B. Thermoeconomic analysis of a solar dish micro gas-turbine combined-cycle power plant. In Proceedings of the International Conference on Concentrating Solar Power and Chemical Energy Systems SolarPACES 2014, Beijing, China, 16–19 September 2014. [Google Scholar]
  11. Esquivel-Patiño, G.; Nápoles-Rivera, F. Environmental and energetic analysis of coupling a biogas combined cycle power plant with carbon capture, organic Rankine cycles and CO2 utilization processes. J. Environ. Manag. 2021, 300, 113746. [Google Scholar] [CrossRef]
  12. Zoghi, M.; Habibi, H.; Chitsaz, A.; Ghazanfari Holagh, S. Multi-criteria analysis of a novel biomass-driven multi-generation system including combined cycle power plant integrated with a modified Kalina-LNG subsystem employing thermoelectric generator and PEM electrolyzer. Therm. Sci. Eng. Prog. 2021, 26, 101092. [Google Scholar] [CrossRef]
  13. Montiel-Bohórquez, N.D.; Saldarriaga-Loaiza, J.; Pérez, J. Analysis of investment incentives for power generation based on an integrated plasma gasification combined cycle power plant using municipal solid waste. Case Stud. Therm. Eng. 2022, 30, 101748. [Google Scholar] [CrossRef]
  14. Iliev, I.K.; Terziev, A.K.; Beloev, H.I.; Nikolaev, I.; Georgiev, A.G. Comparative analysis of the energy efficiency of different types co-generators at large scales CHPs. Energy 2021, 221, 119755. [Google Scholar] [CrossRef]
  15. Massucco, S.; Pitto, A.; Silvestro, F. A gas turbine model for studies on distributed generation penetration into distribution networks. In Proceedings of the 2011 IEEE Power and Energy Society General Meeting, Detroit, MI, USA, 1 January 2011. [Google Scholar]
  16. Dirik, M. Prediction of NOx emissions from gas turbines of a combined cycle power plant using an ANFIS model optimized by GA. Fuel 2022, 321, 124037. [Google Scholar] [CrossRef]
  17. Chen, W.; Liang, Y.; Luo, X.; Chen, J.; Yang, Z.; Chen, Y. Artificial neural network grey-box model for design and optimization of 50 MWe-scale combined supercritical CO2 Brayton cycle-ORC coal-fired power plant. Energy Convers. Manag. 2021, 249, 114821. [Google Scholar] [CrossRef]
  18. Abdelhafidi, N.; Halil Yılmaz, I.; Bachari, N. An innovative dynamic model for an integrated solar combined cycle power plant under offdesign conditions. Energy Convers. Manag. 2020, 220, 113066. [Google Scholar] [CrossRef]
  19. Gou, X.; Zhang, H.; Li, G.; Cao, Y.; Zhang, Q. Dynamic simulation of a gas turbine for heat recovery at varying load and environment conditions. Appl. Therm. Eng. 2021, 195, 117014. [Google Scholar] [CrossRef]
  20. Zhang, N.; Cai, R. Analytical solutions and typical characteristics of part-loadperformances of single shaft gas turbine and its cogeneration. Energy Convers Manag. 2002, 43, 1323–2337. [Google Scholar] [CrossRef]
  21. Bassily, A.M. Enhancing the efficiency and power of the triple-pressure reheat combined cycle by means of gas reheat, gas recuperation, and reduction of the irreversibility in the heat recovery steam generator. Appl. Energy 2008, 85, 1141–1162. [Google Scholar] [CrossRef]
  22. Kotowicz, J.; Brzeczek, M. Analysis of increasing efficiency of modern combined cycle power plant: A case study. Energy 2018, 153, 90–99. [Google Scholar] [CrossRef]
  23. Pattanayak, L.; Padhi, B. Liquefied natural gas regasification cold energy hybrid system integration in gas-steam combined cycle power plant model: Enhancement in power generation and performance. Appl. Therm. Eng. 2021, 193, 116985. [Google Scholar] [CrossRef]
  24. Prasad, B.N. Energy and exergy analysis of intercooled combustion-turbine based combined cycle power plant. Energy 2013, 59, 277–284. [Google Scholar]
  25. Kruk-Gotzman, S.; Ziółkowski, P.; Iliev, I.; Negreanu, G.-P.; Badur, J. Techno-economic evaluation of combined cycle gas turbine and a diabatic compressed air energy storage integration concept. Energy 2023, 266, 126345. [Google Scholar] [CrossRef]
  26. Pashchenko, D. Integrated solar combined cycle system with steam methane reforming: Thermodynamic analysis. Int. J. Hydrog. Energy 2023, in press. [Google Scholar] [CrossRef]
  27. Environmental Code of the Republic of Kazakhstan Dated January 2. 2021. No.400-VI SAM. Available online: https://adilet.zan.kz/ (accessed on 20 January 2023).
  28. On the Concept of the Transition of the Republic of Kazakhstan to a “Green Economy” Comment to the Decree of the President of the Republic of Kazakhstan Dated May 30. 2013. No. 577. Available online: https://policy.asiapacificenergy.org/ (accessed on 19 January 2023).
  29. The Concept of the Development of the Fuel and Energy Complex of the Republic of Kazakhstan until 2030, Resolution of the Government of the Republic of Kazakhstan, Dated June 28. 2014. No. 724. Available online: https://policy.asiapacificenergy.org/ (accessed on 20 January 2023).
  30. KPO. Available online: https://kpo.kz/ru/o-kompanii (accessed on 19 January 2023).
  31. Zuming, L.; Karimi, I. New operating strategy for a combined cycle gas turbine power plant. Energy Convers. Manag. 2018, 171, 1675–1684. [Google Scholar]
  32. Liu, Z.; Karimi, I.A. Simulating combined cycle gas turbine power plants in Aspen HYSYS. Energy Convers. Manag. 2018, 171, 1213–1225. [Google Scholar] [CrossRef]
  33. Ganapathy, V. Industrial Boilers and Heat Recovery Steam Generators; Marcel Dekker: New York, NY, USA, 2003; pp. 85–93. [Google Scholar]
  34. Steen, M. Greenhouse Gas Emissions from Fossil Fхuel Fired Power Generation Systems; DG-JRC/IAM; European Commission: Brussels, Belgium, 2001. [Google Scholar]
  35. Aspen HYSYS V9. 2017. Available online: www.aspentech.com (accessed on 19 January 2023).
  36. Naemi, S.; Saffar-Avval, M.; Behboodi Kalhori, S.; Mansoori, Z. Optimum design of dual pressure heat recovery steam generator using nondimensional parameters based on thermodynamic and thermoeconomic approaches. Appl. Therm. Eng. 2013, 52, 371–384. [Google Scholar] [CrossRef]
  37. Code of the Republic of Kazakhstan Dated December 25, 2017 No. 120-VI “On Taxes and Other Mandatory Payments to the Budget (Tax Code)”. Available online: https://adilet.zan.kz/eng (accessed on 20 January 2023).
Figure 1. Dependence of GTPP and GTU parameters on ambient air temperature.
Energies 16 02704 g001
Figure 2. Methodology of the conducted research.
Energies 16 02704 g002
Figure 6. Dependence of power generation on ambient temperature.
Energies 16 02704 g006
Figure 8. Power consumption by auxiliary equipment of schemes.
Energies 16 02704 g008
Figure 9. Dependence of steam production on ambient temperature.
Energies 16 02704 g009
Figure 10. Efficiency of the considered schemes depending on temperature.
Energies 16 02704 g010
Figure 11. Specific fuel consumption for electricity production.
Energies 16 02704 g011
Figure 12. Steam generation by boilers and their efficiency per year.
Energies 16 02704 g012
Figure 13. CO2 emissions from the schemes under consideration.
Energies 16 02704 g013
Figure 14. Specific CO2 emissions per kWh of electricity produced.
Energies 16 02704 g014
Figure 15. NPV indicators as a percentage of IRR.
Energies 16 02704 g015
Figure 16. Payback periods for projects.
Energies 16 02704 g016
Table 1. Technological parameters of GTU.
ParameterUnitsValue
Compressor type°Сaxial
Maximum permissible temperature in the compressor°С360
Maximum permissible temperature in the turbinebar1104
Maximum allowable pressurerpm14
Minimum permissible speedrpm4858
Maximum permissible speed°С5200
Table 2. Description of the schemes under consideration.
#SchemeEquipment
1Basic schemeGas turbine unit
2GTU + HRSGGTU + HRSG
3CCPPGTU + HRSG + Steam turbine
Table 3. Input parameters.
Inlet ParameterUnitsValue
Gas turbine cycle (Figure 3)
Fuel inletkg/s3.15–4.1
Fuel temperature°C50
Air temperature°C−25–35
Air pressurekPa101.325
Air flowratekg/s129.5–163.4
Air compositionMass fractionN2—0.76, O2—0.24
Fuel compositionMass fractionCH4—0.954, C2H6—0.0035, C3H8—0.0025, iC4H10—0.0016, CO2—0.0107, N2—0.0275
Gas turbine + HRSG (Figure 4)
Boiler water inletkg/sdependent from exhaust gas flow and temperature
Steam pressureMPa14
Steam temperature°C400
Feedwater temperature°C60
CCPP (Figure 5)
Boiler water inletkg/sdependent from exhaust gas flow and temperature
Steam pressureMPa11
Steam temperature°C500
Feedwater temperature°C60
Table 4. Description of the parameters.
ParameterActualError,%
Gfg3.30.0
Gair130.90.0
Tair025.00.0
Tair1--
Tg0--
Tcc1104.01.8
Tex543.00.9
ηCOMP--
ηTURB--
WCOMP--
WTURB--
WGT36,310.00.5
ηGT0.30.5
Table 5. Basic data for economic calculation.
ParameterUnitsValue
Gas costUSD/1000 m346.51
Electricity costUSD/kWh0.05
Cost of tubes per meterUSD/m119.66
Cost of steam turbineUSD/kW905.00
Cost of HRSGUSD/kW400.00
Installation work (as percent from all work costs)%10
Table 6. Results of economic analysis.
ParameterUnitsGT + HRSGCCPP
Decrease in CO2 from saved NGtCO2/year13,410.2627,893.41
Decrease in NOx from saved NGtNOx/year17,402.1832,434.28
Decrease in gas consumptionmln.m3/year138.09115.51
Decrease in payments for NOx emissionsUSD/year1,184,508.0451,103,846.742
Disclaimer/Publisher’s Note: The statements, opinions and data contained in all publications are solely those of the individual author(s) and contributor(s) and not of MDPI and/or the editor(s). MDPI and/or the editor(s) disclaim responsibility for any injury to people or property resulting from any ideas, methods, instructions or products referred to in the content.

