Article

Vertical Axis Wind Turbine Layout Optimization

1
DTU Management, Technical University of Denmark, Akademivej 358, 2800 Kongens Lyngby, Denmark
2
Vattenfall BA Wind, Jupitervej 6, 6000 Kolding, Denmark
3
Formerly Vattenfall BA Wind, 2800 Kongens Lyngby, Denmark
*
Author to whom correspondence should be addressed.
Energies 2023, 16(6), 2697; https://doi.org/10.3390/en16062697
Submission received: 31 January 2023 / Revised: 3 March 2023 / Accepted: 4 March 2023 / Published: 14 March 2023
(This article belongs to the Special Issue Wind Turbine Advances)

Abstract

:
Vertical Axis Wind Turbines (VAWTs) are not mature enough yet for offshore wind farms, but they offer benefits compared to conventional Horizontal Axis Wind Turbines (HAWTs). Higher power densities, reduced wakes, lower center of mass, and different power and thrust curves make VAWTs an interesting option to complement existing wind farms. The optimization of wind farm layouts—finding the optimal positions of wind turbines in a park—has proven crucial to extract more energy from conventional wind farms. In this study, we build an optimizer for VAWTs that can consider arbitrarily shaped layouts as well as obstacles in the area. We adapt a recent model for the wakes of VAWTs considering a Troposkien design. We can then model and optimize a large VAWT park in a real wind scenario and assess for the first time its performance operating Troposkien VAWTs. In addition, we present a novel model for wind farm optimization that considers the clockwise and counterclockwise rotation of turbines. This optimization exploits the asymmetric wakes of VAWTs, thus increasing the total energy production. We benchmark our optimization on realistic instances and compare VAWTs and HAWTs wind farm layouts, showing that VAWTs can achieve higher density and power production than HAWTs in the same area. Finally, the wake loss reduction is compared to the literature.

Graphical Abstract

1. Introduction

Horizontal Axis Wind Turbines (HAWTs) are the de-facto standard turbines for wind farms. In HAWTs, the rotor is attached to a nacelle on top of a tower, spinning around the horizontal axis. Vertical Axis Wind Turbines (VAWTs) are another family of wind turbines, whose rotor instead revolves around the vertical axis—hence the name. There are different types of VAWTs, as shown in Figure 1; the most studied ones are H-rotor turbines, in which the blades have an H shape, Savonious turbines, which are drag-type turbines, and Darrieus turbines, which are an improvement over the H-shape and are based on lift. Figure 2 shows a photo of a HAWT and a Darrieus VAWT.
Depending on the type, VAWTs can extract 30–40% of the kinetic energy in the wind, compared to about 50% efficiency of the HAWTs. On the other hand, the nacelle of HAWTs must be able to rotate the rotor to face the wind, while VAWTs are omnidirectional. For this reason, the production of VAWTs requires fewer materials, and they have fewer moving parts: these differences make them cheaper to build and maintain compared to HAWTs. VAWTs are also easier to install than HAWTs, are quieter to operate, and are equipped with low-speed blades, lessening the risk to people and birds [2]. VAWTs can also function in extreme weather, with variable winds and mountain conditions [3]. Finally, while HAWTs are self-starting, VAWTs generate torque only when already spinning, so they need additional components to begin the rotation.
In this study, we will focus on VAWTs of the Darrieus type, which consists of two aerofoils arranged in a Troposkien shape. Troposkien derives from the Greek words tropos and skein, which can be translated to “turning thread”, because it follows the oval-like shape that a thread will assume if spun while holding its ends. The advantage of such a shape is that the forces will be perpendicular to the curvature of the blade in all its points. In this way, the Darrieus can have lighter blades and use fewer materials than H-shaped vertical turbines.
The technology for VAWTs is still experimental and certainly not as mature as the HAWTs. Nonetheless, the Darrieus type has been built up to significant sizes and can offer benefits compared to HAWTs, especially for wind farms with high energy density. In this case, it is useful to optimize the placement of the turbines in order to maximize the energy produced by the turbines. While this has been amply studied in the literature for HAWTs, similar studies have not been made for VAWTs.
We will show that, according to our study, the VAWTs are promising for large wind farms because they can extract more energy per area unit compared to HAWTs. This can contribute to a lower utilization of sea area and better planning of marine zones for countries. In addition, since a VAWTs wind farm will produce more power at low wind speeds, when energy prices are typically higher due to the supply and demand balance, this technology can complement the power production of existing HAWTs wind farms. Moreover, a VAWTs wind farm will have a peak production at different times than a HAWTs wind farm, thus helping in balancing the grid. Finally, by including the direction of rotation in the optimization model, we fully exploit the asymmetric wakes of VAWTs when maximizing their power production.
The main contributions of this work are:
  • We compare the wind farm layout optimization of the commonly used HAWTs and the experimental VAWTs.
  • We show that the energy density of VAWTs can be much higher than HAWTs, leading to more efficient use of sea areas.
  • We present and solve the first layout optimization formulation that considers the direction of rotation of VAWTs, thus fully exploiting the asymmetric wakes that they create.
The paper is organized as follows: First, Section 2 gives an overview of studies in the literature on VAWTs. Section 3 presents two symmetric wake models and one asymmetric wake model that we use for VAWTs. The characteristics of the turbines used in our computational study are reported in Section 4. The objective function and the heuristic for the turbine optimization are presented in Section 5 and then modified for the asymmetric case in Section 6. Section 7 reports our computational results, comparing the solutions of VAWTs and HAWTs and showing optimized layouts for the wind farm layout problem with asymmetric wakes. Finally, Section 8 summarizes the conclusions of our study.

2. Literature

One motivation to study the VAWTs comes from a recent study by Hansen et al. [4], who discovered that pairs of VAWTs exhibit a 15% increase in power output compared to turbines operating in isolation. In addition, Dabiri [5] observed how a tighter packing between VAWTs gives them the potential to achieve a higher power density than HAWTs.
Minimal work has been conducted in the literature regarding the layout optimization for VAWTs wind farms. Chen and Agarwal [6] presented a first attempt at the layout optimization, even though they note that the results should be considered preliminary because of a very simplified wake model. Another limitation of the study is that they consider a small regular grid of 10 by 10 positions using only a constant 12 m/s unidirectional wind.
Lam and Peng [7] implemented a covariance matrix adaptation-based evolutionary strategy to maximize the power production of straight-bladed VAWTs (H-shape). This study presents a very thorough testing of the wake model and its parameters, modeling the asymmetricity of the wake. They perform a continuous optimization on a rectangular wind farm and use a sigmoid curve as a surrogate for a VAWT power curve. The layout design was later extended to wind farms with more complex boundaries but limited to a rectangular structure. They show that the optimization did improve over the initial layout configuration.
A study by Zhang et al. [8] optimizes the layout for Savonius VAWT using the particle swarm optimization algorithm. Bons [9] optimizes the layout of a 16-turbine VAWTs farm using the fish-schooling model. Even though the wake model is low fidelity, results showed an increase in production for certain alignments of counter-rotating turbines compared to isolated turbines.
Sahebzadeh et al. [10] use a computational fluid dynamic model to study double rotor arrangements of co-rotating Darrieus H-type vertical axis wind turbines. The results confirm the potential for compact arrays of VAWTs with high power densities.
Vergaerde et al. [11,12], as well as Su et al. [13], experimentally study the wake behind paired VAWTs in a wind tunnel, showing similar results. Bremseth and Duraisamy [14] and Duraisamy and Lakshminarayan [15] study a single vertical axis wind turbine, as well as pairs and arrays of vertical axis wind turbines, using numerical simulation. Silva and Danao [16] study the effect of separation distance between turbines. The study is carried out for three VAWTs in a pyramid shape configuration, with varying oblique angles.

3. Wake Model

In order to optimize a wind farm of Troposkien VAWTs, we first need to model the wake effect. The wake effect is an aerodynamic phenomenon that each turbine generates past its rotor. In the area of the wake effect, the wind speed is lower as a result of the turbine extracting energy from the wind. Thus, subsequent wind turbines that fall into this area will receive less wind and extract less power. By accounting for this effect when placing the turbines in the wind farm, we can significantly reduce wake losses and thus improve the energy yield of the wind farm. Since wakes are evaluated thousands of times during the optimization, we use analytical models, which have short computation times compared to computational fluid dynamics (such as large-eddy simulation or Reynolds-averaged Navier–Stokes methods).
For VAWTs, because of the rotation of the blades, wakes are deflected along the spanwise direction, thus making the wake asymmetric. At higher wind speed ratios, this deflection is negligible, while it should be more relevant at lower wind speeds. In the first two wake models discussed below, this small deflection is not accounted for. In the third model, we tweak the second model to account for the asymmetry. In any case, the optimization techniques presented do not depend on the wake model used and can adopt more accurate asymmetric wake models.

3.1. Top-Hat Wake Model

A top-hat model for H-shaped VAWTs is proposed in [17]. The wake is indeed modeled as a top-hat shape, and the wind speed deficit is computed as follows:
Δ U U ( x ) = 2 a ( 1 + 2 k w z x / H ) ( 1 + 2 k w y x / D )
where x is the distance from the turbine, a = 0.5 ( 1 1 C T ) is the induction factor, k w z and k w y are the expansion rates of the wake in the vertical and spanwise directions, respectively, and H and D are the height and the width of the rectangle that the rotor describes. Finally, C T is the thrust coefficient of the specific turbine considered.
By rearranging the equation, we obtain:
Δ U U ( x ) = ( 1 1 C T ) A 0 A w ( x )
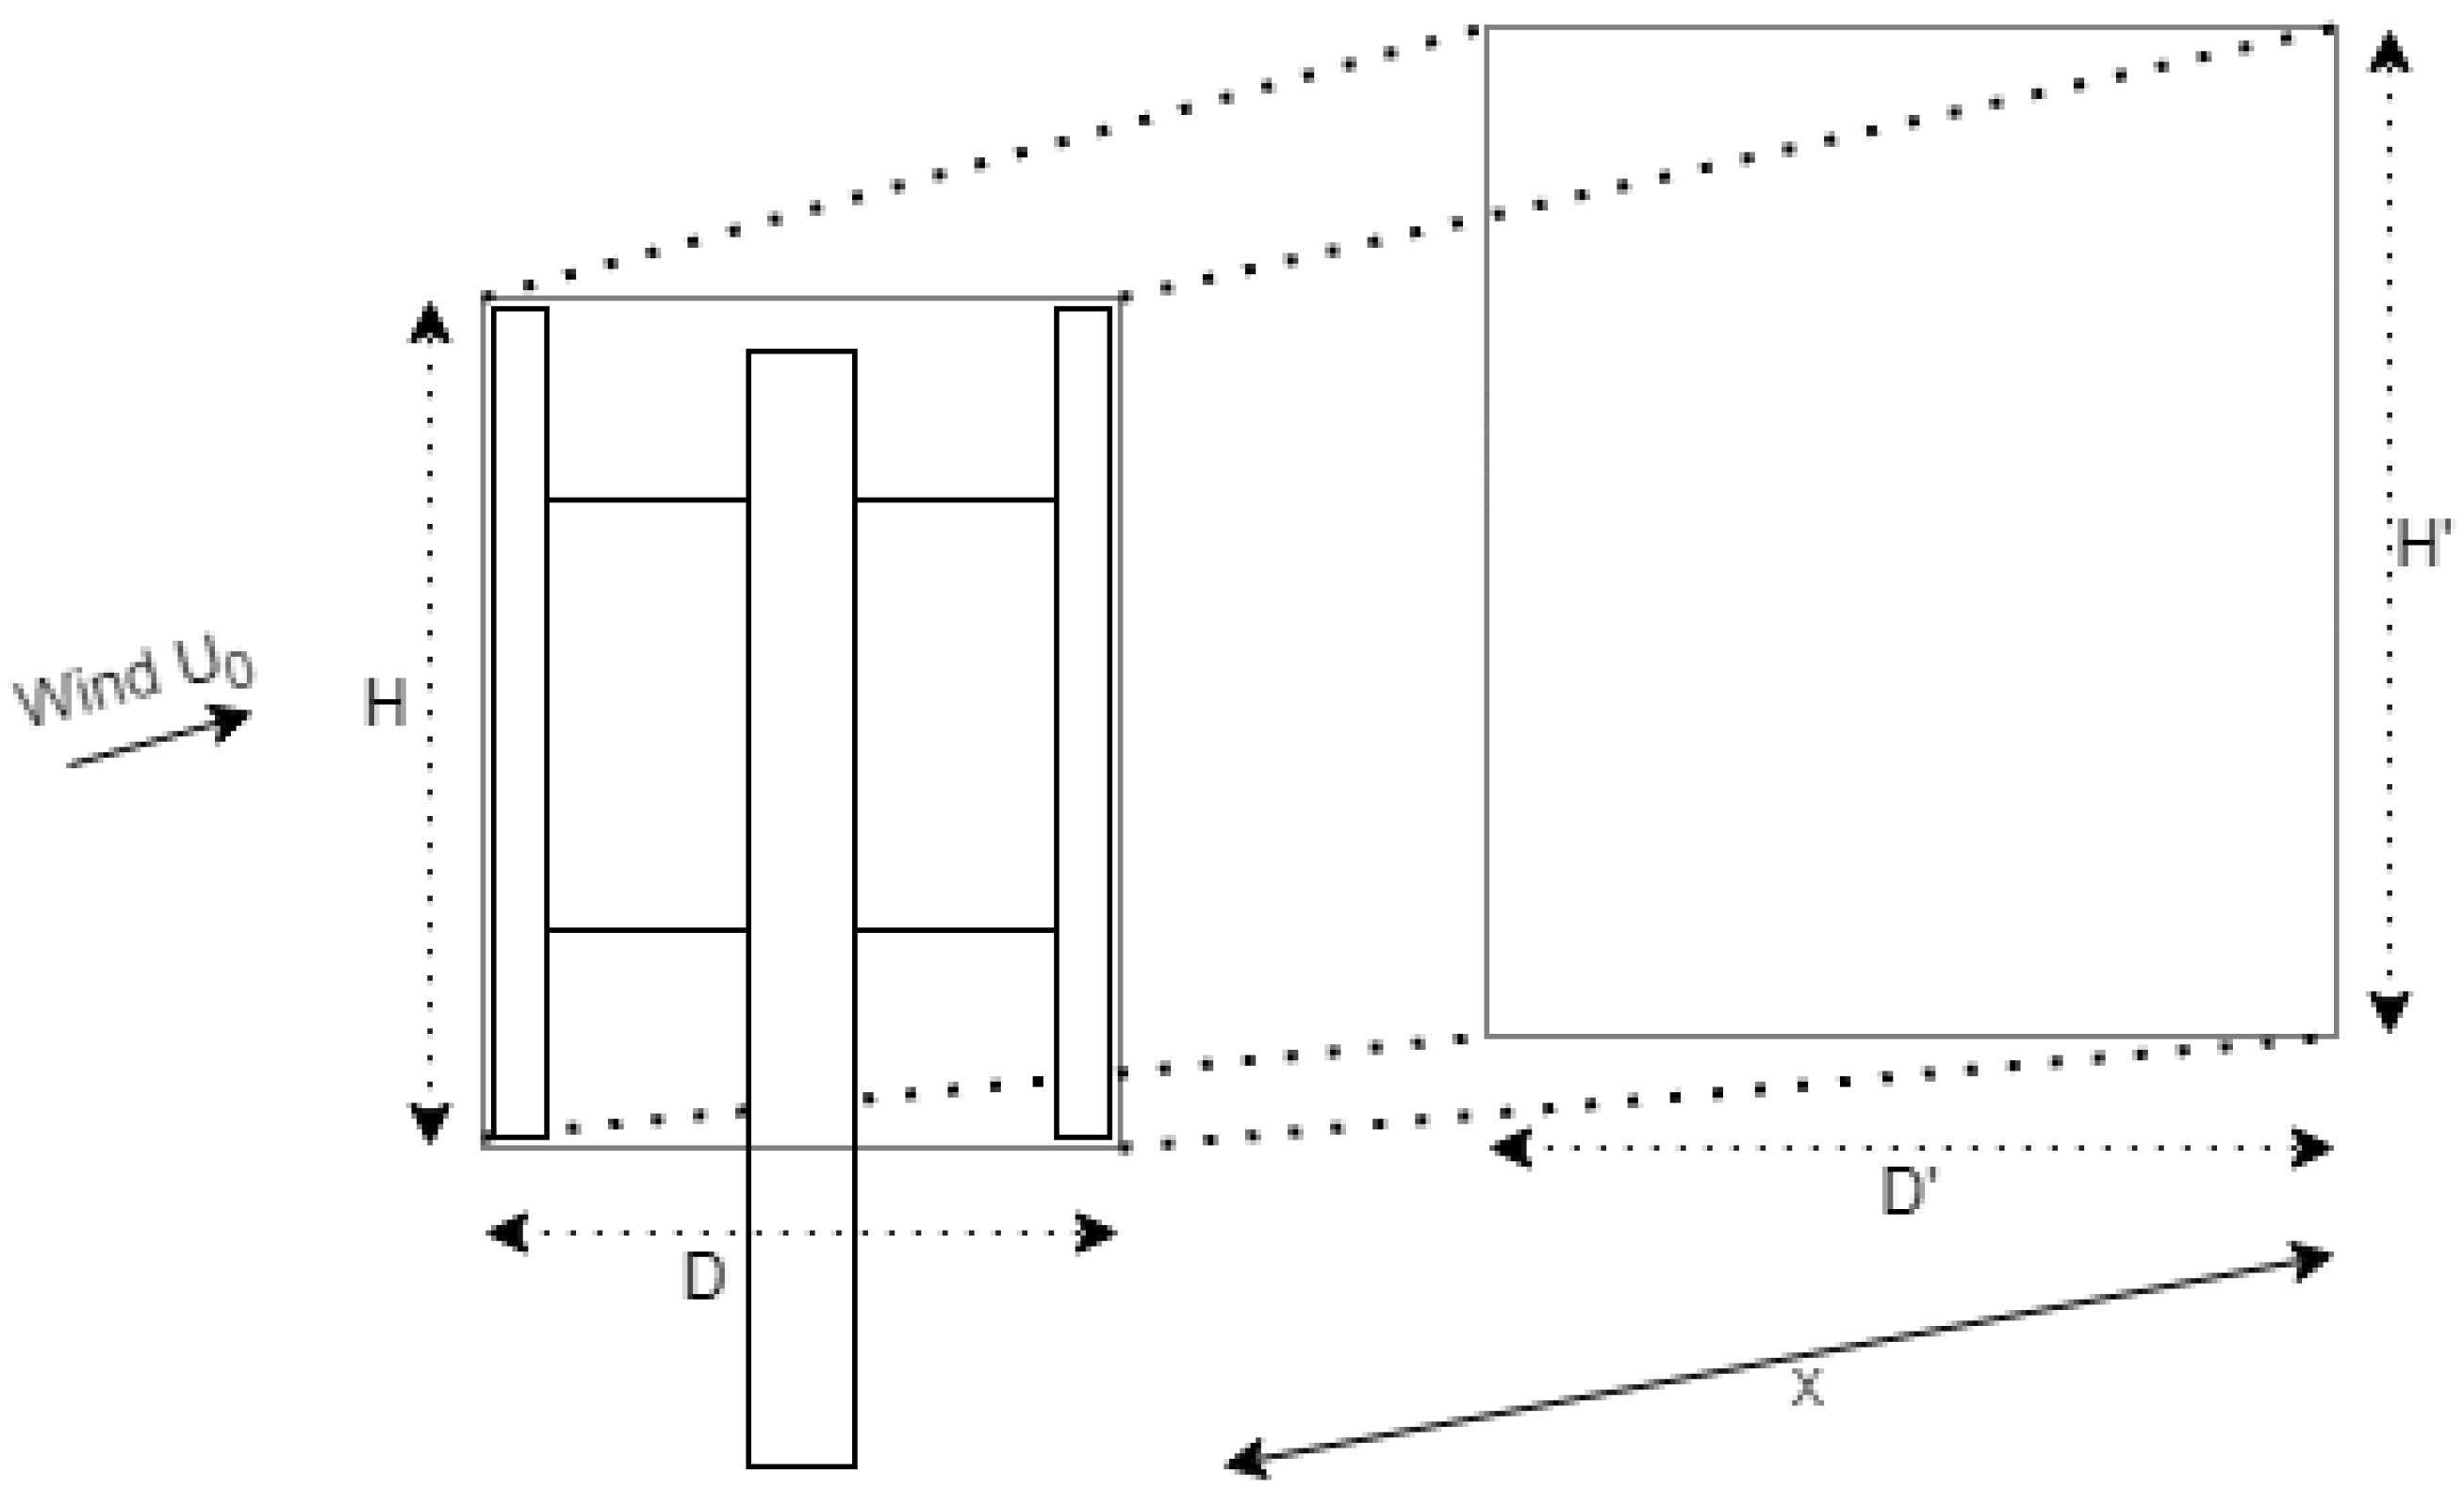
where it is clearer that, in this model, the wind speed deficit depends on the ratio of the areas between the area spanned by the turbine A 0 and the area spanned by the wake A w ( x ) at a certain distance x. When rotating, H-shaped rotors span a rectangular area, depending on the height H of the turbine and the span D of the rotor. We show a schema of this wake model in Figure 3.
To adapt the top-hat model [17] for the Darrieus model, we modify the area spanned by the turbine. Instead of spanning a rectangle, Darrieus VAWTs describe a Troposkien shape. We approximate this shape with an ellipse. Thus, we modify the wake model using the ellipse area A 0 = π 4 D H , where D is the axis of the ellipse on the horizontal plane, and H is the vertical axis (height) of the turbine. Similarly, A w = π 4 D w H w , which can be computed as D w = D + 2 k w y x and H w = H + 2 k w z x . Following [17], we assume that the expansion rate is the same along the two axes k w z = k w y = k w . In this way, we adapt the top-hat wake model to be suitable for the Troposkien topology.

3.2. Gaussian Wake Model

The wind velocity deficit can be described using a two-dimensional Gaussian shape for the wake [17]:
Δ U U ( x ) = 1 1 C T 2 π A w ( x ) A 0 exp 1 2 z z h σ z ( x ) 2 + y σ y ( x ) 2
where A w is the projected area of the wake at distance x from the turbine A w ( x ) = π 4 σ z ( x ) σ y ( x ) . Furthermore, A 0 = π 4 D 0 H 0 for the ellipse at the turbine. Changing these two areas are the only modification needed to use the Gaussian model for Troposkien turbines. Thus, σ z ( x ) = k w x + ϵ H 0 and σ y ( x ) = k w x + ϵ D 0 are the projection of the two axes of the ellipse at distance x from the turbines.
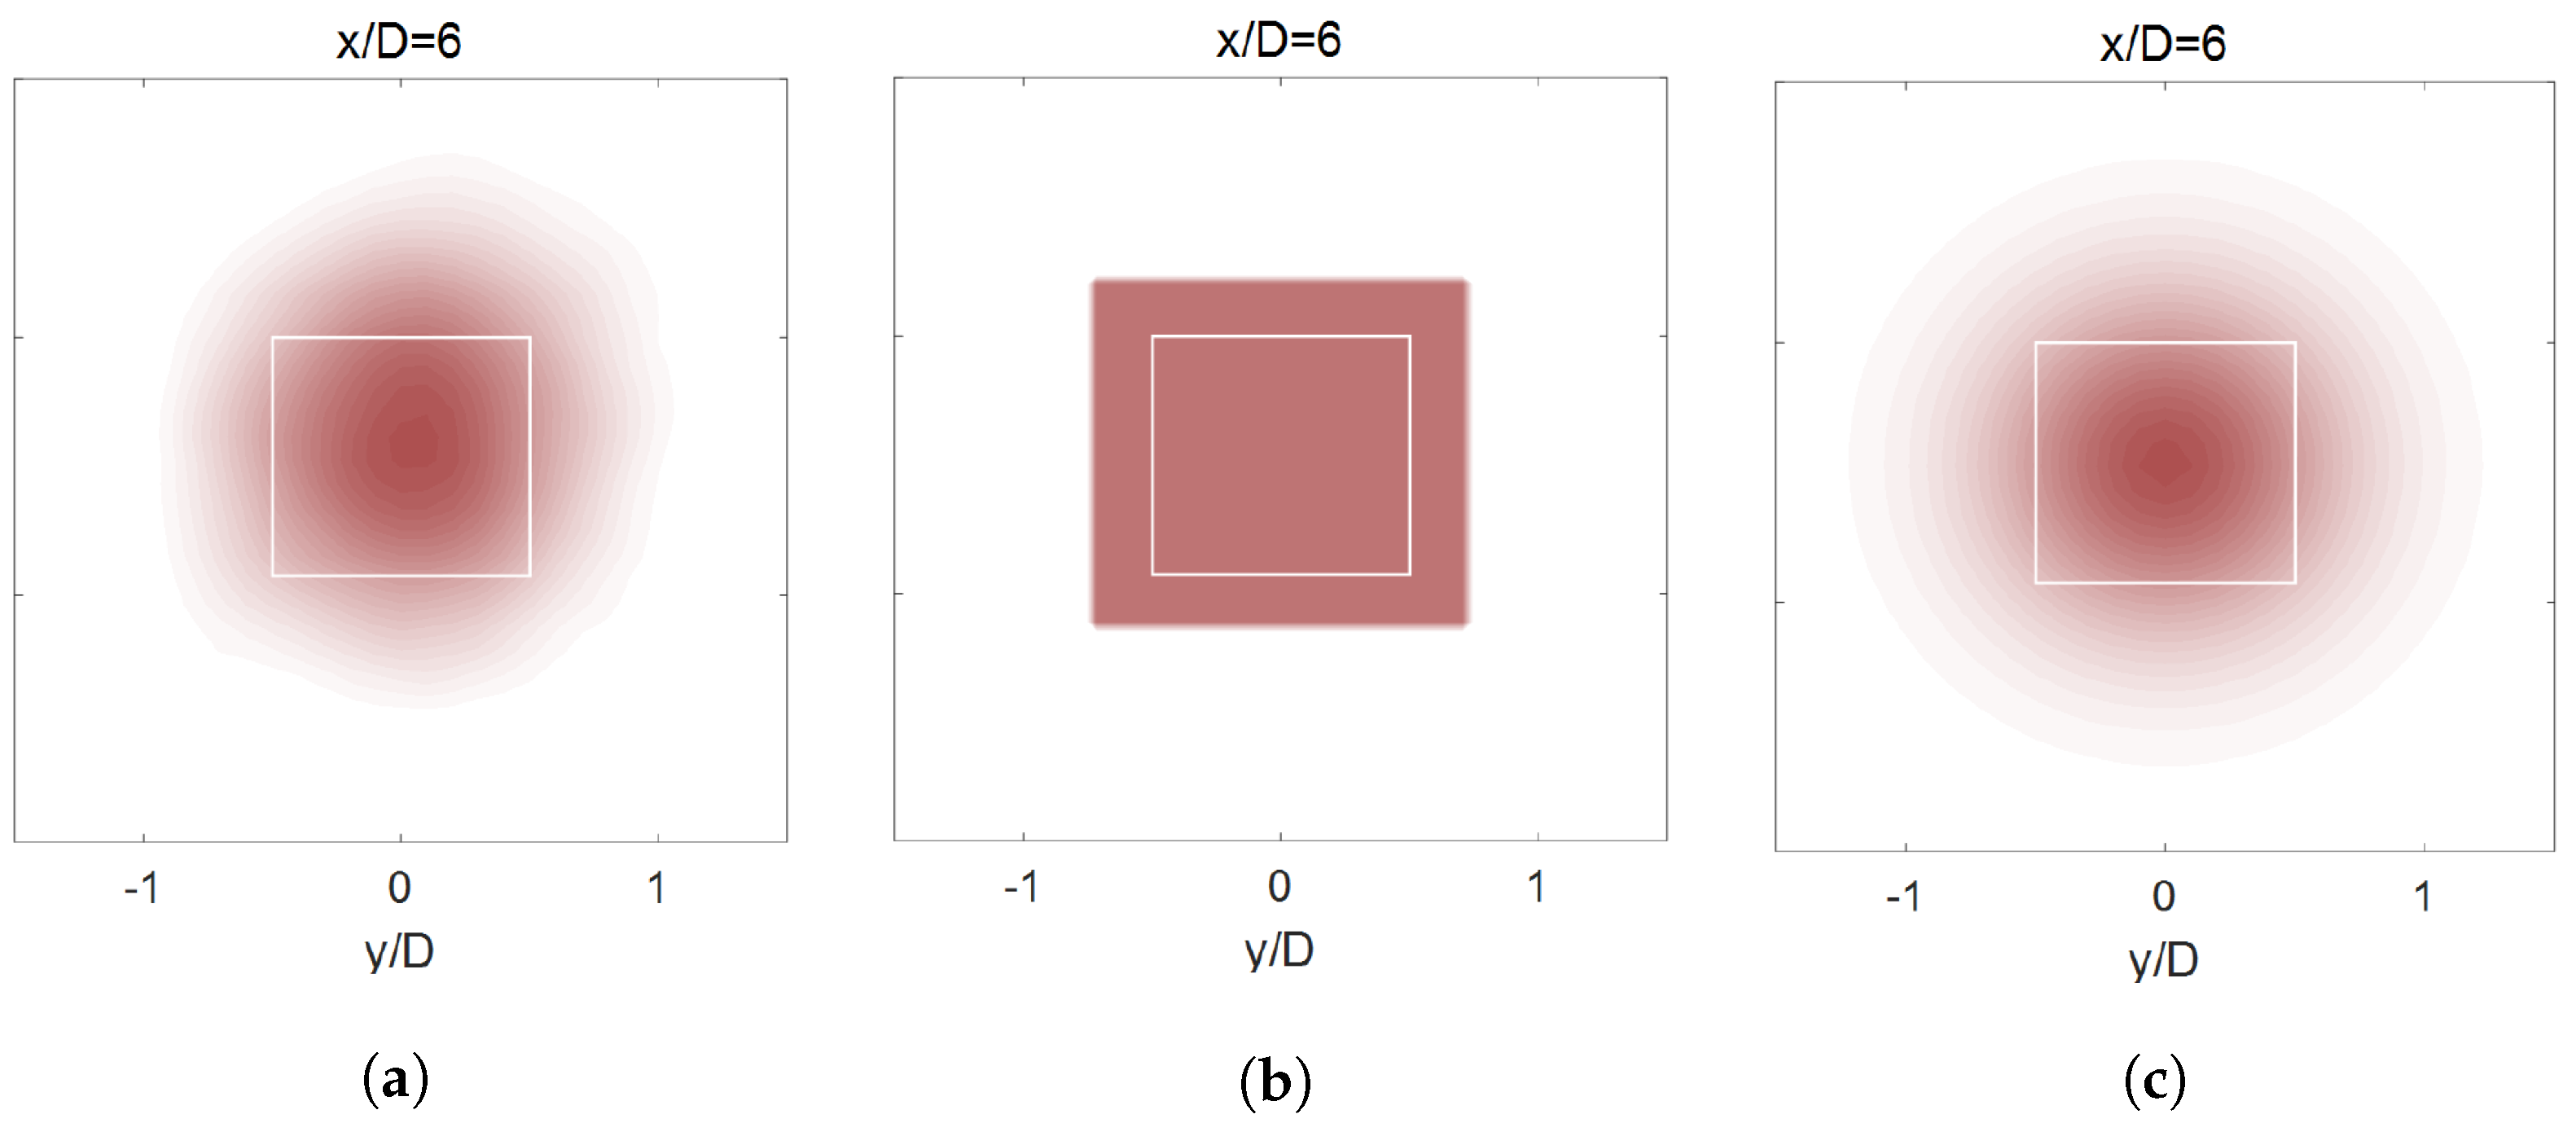
These two equations assume an elliptical shape for the wakes, approximating the Troposkien shape. We illustrate in Figure 4 the wakes as seen facing the turbine using these two models, and the corresponding wake from a large eddy simulation. The Gaussian model appears to model the wakes better than the top-hat model.

3.3. Asymmetric Gaussian Wake Model

We modify the two-dimensional Gaussian wake model described above to account for the asymmetry of the wake given by the direction of rotation of the VAWT. Indeed, if the turbine rotates in the clockwise direction, the wake will be slightly deflected to the right, as seen facing the turbine, and vice-versa for the counterclockwise direction. Following [7], we use two wake decay constants, k w for the windward side and k l for the leeward side. Thus, the wake cone will generate a stronger wake on the windward side and a lighter wake on the leeward side, thus modeling the wake asymmetry, as shown in Figure 5. Finally, we interpolate the two wake decay constants to ensure a continuous wake.

4. Turbines

We used real VAWT and HAWT for our experiments.
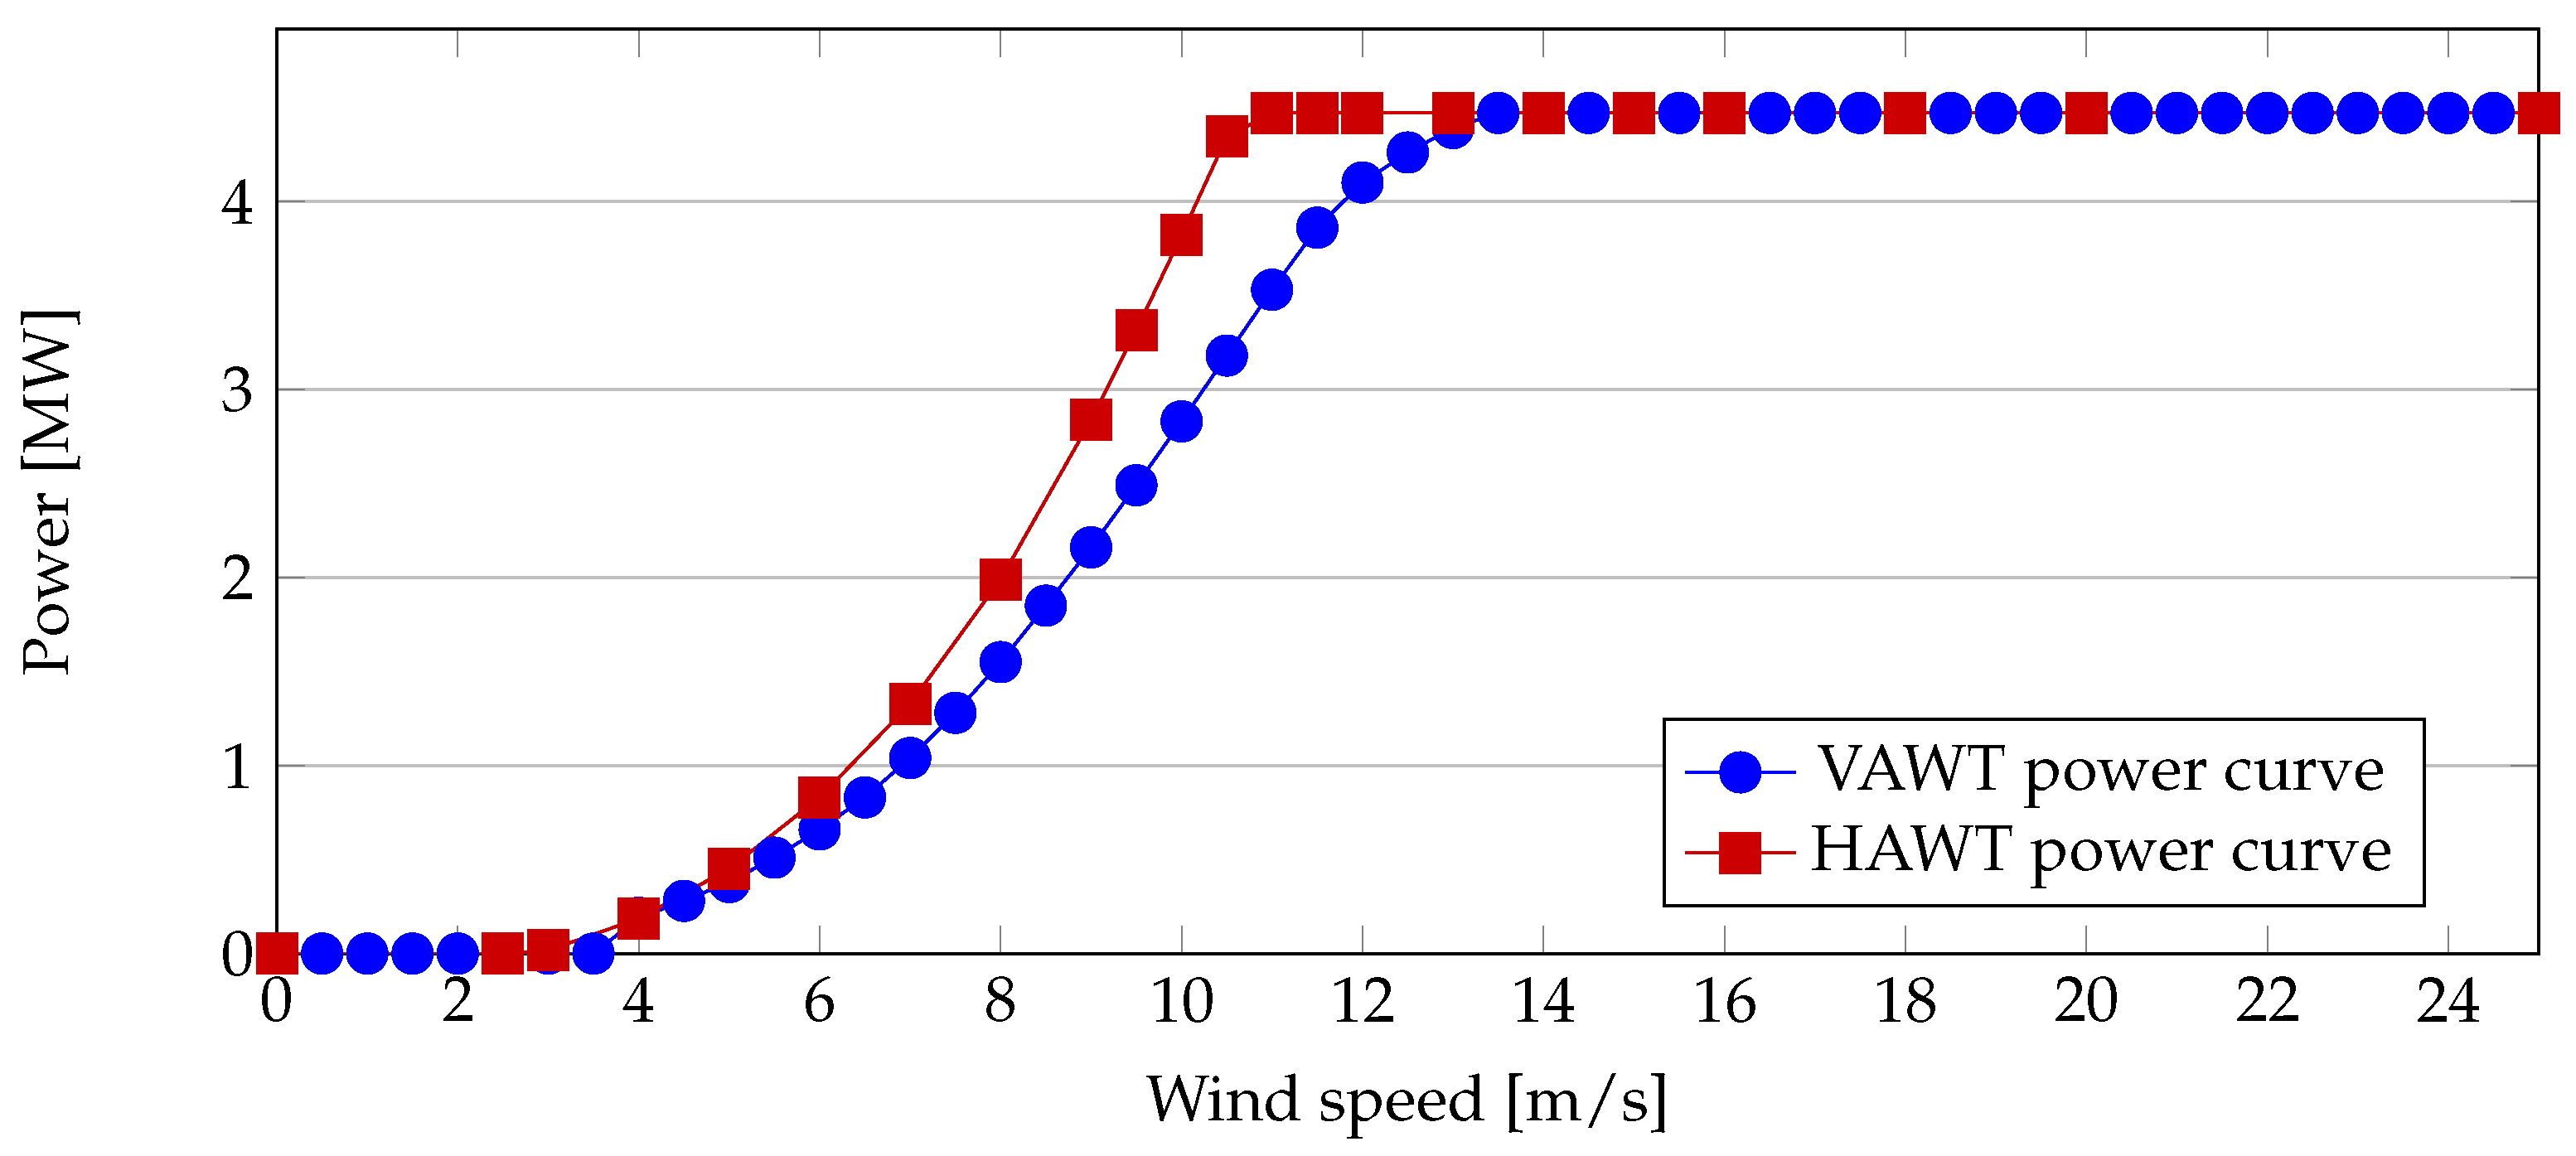
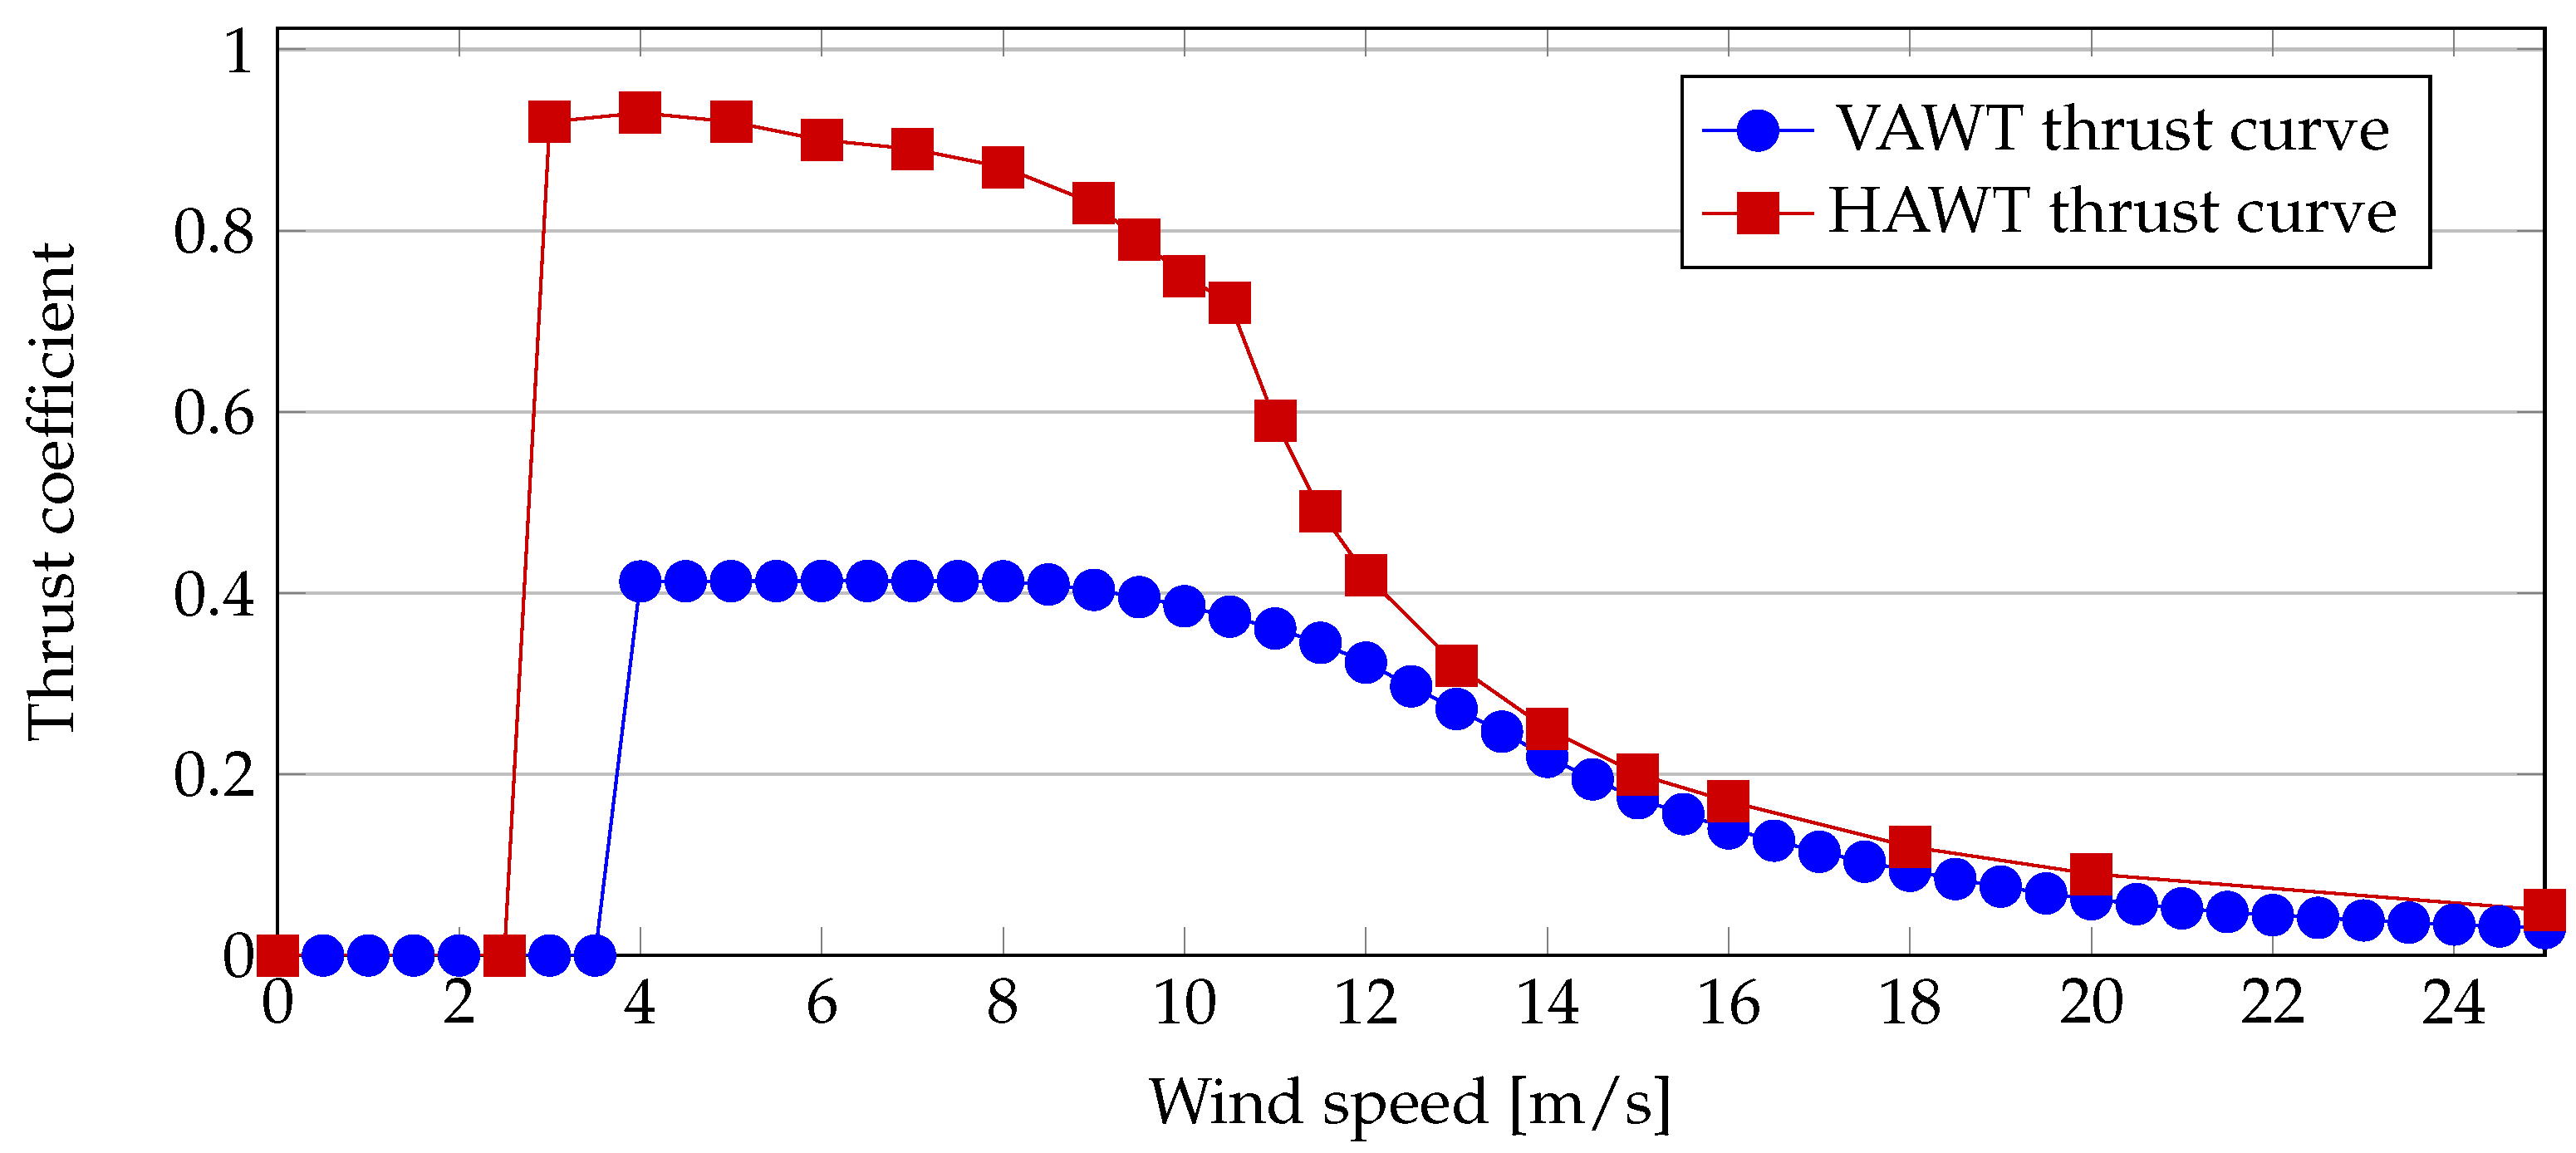
The VAWT is the FP7 DeepWind wind turbine, which has a Darrieus architecture and a nominal capacity of 5 MW [18]. It reaches a height of 143 m and spans 121 m. The HAWT is based on an NREL turbine [19], scaled down to 5 MW to match the capacity of the VAWT. Its rotor spans 116 m and the hub height is 88 m, for a total height of 146 m (to the tip of the blade). The power curves for the two turbines are shown in Figure 6, and the thrust curves in Figure 7. The tip-speed ratio selected for each wind speed is the optimal one to maximize the power extraction, until the turbine nominal power, in which the tip-speed ratio is set to keep the power constant.

5. Heuristic

In this section, we present the heuristic technique used to optimize the wind farm layout. Our objective function is to maximize the Net Present Value (NPV) of the wind farm. The NPV is a financial metric that reflects the current monetary value of a project, often used to assess a project’s financial soundness. It is defined as the difference between the revenues and costs discounted cashflows of the project over its lifetime. In our optimization, we maximize the NPV:
m a x NPV = k = 0 K revenues k costs k ( 1 + r ) k
where r is the discount rate, and K is the number of years of operation of the wind farm, typically 25 years. In particular, we consider the relevant factors contributing to the NPV that the optimization can influence: the energy production of each turbine, E i , the wake losses between pairs of turbines L i j , and foundation costs F i . Thus, we can express our optimization problem as:
m a x E P i = 1 N E i x i + E P i = 1 N j = 1 , i j N L i j x i x j i = 1 N F i x i
s . t . i = 1 N x i = T
x i + x j 1 if d i j d m i n i , j [ 1 , , N ] , i j
x i { 0 , 1 } i [ 1 , , N ]
where N is the number of available positions at which turbines can be placed in the wind farm, and E P is the energy price constant used to translate the energy production to expected revenues (we include the discount factor over the lifetime in this constant). The objective function (5) expresses the NPV: the first term represents the expected revenues from electricity production, the second term represents the revenue losses due to the wake effect ( L i j 0 ), where we use the wake model to compute the pairwise wake loss caused by the turbine in position j on position i, and the third term represents the foundation costs. The binary variables x are decision variables, indicating whether or not there is a turbine in a given position. Constraint (6) ensures that the desired number of turbines, T, is placed in the solution. Constraints (7) forbid turbines in the solution to be closer than the minimum distance d m i n . In total, the quadratic model has O ( N ) variables and O ( N 2 ) constraints.
We use a heuristic approach to solve the optimization problem based on [20]. The heuristic creates an initial layout solution using an algorithm based on the P-dispersion sum problem [21]. The layout is then iteratively improved by moving a turbine from its current location to another location in its surroundings. If the move improves the objective function, it is accepted, and the current solution is updated. A Variable Neighborhood Search (VNS) metaheuristic [22] is adapted for this problem. VNS alternates phases of local search, in which the current solution is improved by exploring neighborhoods and moving to improved solutions, and shake phases, in which the current best solution is modified in order to escape points of local optimum. In particular, different neighborhoods are used in the search for improving moves: the 1-opt move, which moves one turbine at a time to new positions, and in the 2-opt move, which evaluates the combinations of moving two turbines in the layout at the same time. For the shake phase of VNS, all turbines in a portion of the layout are removed and then relocated to other positions, possibly worsening the current value of the objective function. From this new starting point, the VNS performs another local search based on the two neighborhoods until it stops improving. The iterations of local search and shake phases are repeated until a time limit is reached. For the purpose of this paper, the heuristic used in the optimization is the same for the vertical axis and horizontal axis wind turbines.

6. Asymmetric Wakes Layout Optimization

As discussed, using the Gaussian analytical wake model from [17] and different decay constants from [7], we can consider the asymmetry of wakes of VAWTs. We now present a formulation for the layout optimization problem that can decide the direction of rotation of VAWTs. Each VAWT can rotate clockwise or anticlockwise, thus casting its wake in a different direction. The layout optimization can thus exploit this characteristic, leading to improved wind farm layouts for VAWTs.
Interestingly, we need only minor modifications to the MIP formulation presented in the previous section. Since for each position the turbine can spin either clockwise or counterclockwise, we double the number of decision variables associated with the N available positions. We now have 2 N binary variables x: the first N are for clockwise spinning turbines, and the second half for counterclockwise. Naturally, we cannot have a turbine spinning in both directions, so we need to add a constraint for each position ensuring that no more than one rotating direction is selected:
x i + x i + N 1 i { 1 , , N }
Due to the minimum distance constraint (7), though, we are already forbidding turbines from being placed closer than a certain distance. Since each turbine i and its counterpart i + N are located at the same position, constraint (9) becomes redundant and can be omitted.
Thus, the layout optimization formulation for VAWT rotations becomes expressed as a MILP:
m a x E P i = 1 2 N E i x i + E P i = 1 2 N j = 1 , i j 2 N L i j z i j i = 1 2 N F i x i
s . t . i = 1 2 N x i = T
  x i + x j 1 if d i j d m i n i , j [ 1 , , 2 N ] , i j
z i j x i i , j [ 1 , , 2 N ]
z i j x j i , j [ 1 , , 2 N ]
  z i j x i + x j 1 i , j [ 1 , , 2 N ]
    x i { 0 , 1 } i [ 1 , , 2 N ]
z i j { 0 , 1 } i , j [ 1 , , 2 N ]
where we introduce the new set of variables z i j to linearize the product of binary variables in the original objective function. Constraints (13) to (15) are the linearization constraints, ensuring that z i j = x i x j . The other major change in the problem is the matrix L, which contains the pairwise energy losses. The pairwise matrix contains the precomputed wake loss caused on turbine j if turbine i is built. It is an approximation of the wake losses calculation to speed up the optimization since recomputing the wakes for each layout will be too computationally expensive. The matrix now needs to consider power losses for the combination of clockwise and counterclockwise turbines. Therefore, the power matrix has size ( 2 N ) 2 . The model is linear and has O ( N 2 ) variables and O ( N 2 ) constraints.
Such a model is clearly motivated by the characteristics of VAWTs. To the best of our knowledge, this is the first formulation of the layout problem considering the spinning direction of wind turbines.

7. Results

To compare the two types of wind turbines, we use instance B from the set of “synthetic instances” [20] that are close to real-life wind farms. In particular, the chosen wind farm area has N = 6989 available positions for the turbines. Moreover, we use real wind statistics from a Dutch wind farm, Ten Noorden van de Waddeneilanden, so that the optimization needs to account for all wind conditions and directions over the park’s lifetime.
In the first test, we place T = 99 turbines in the wind farm. We run the optimizer for two designs: with HAWTs and with VAWTs. We report in Figure 8 the two optimized solutions. In this case, the power production obtained with the HAWTs is about 2.25 TWh/y, significantly higher than for the VAWTs, reaching about 2.01 TWh/y using the top-hat wake model. The Gaussian wake model gives a slightly higher estimation for the VAWT layout, forecasting an energy production of 2.02 TWh/y. In the following, we will show the results using the top-hat model since it is more conservative—estimating higher wake losses than the Gaussian model—thus giving us the worst-case scenario.
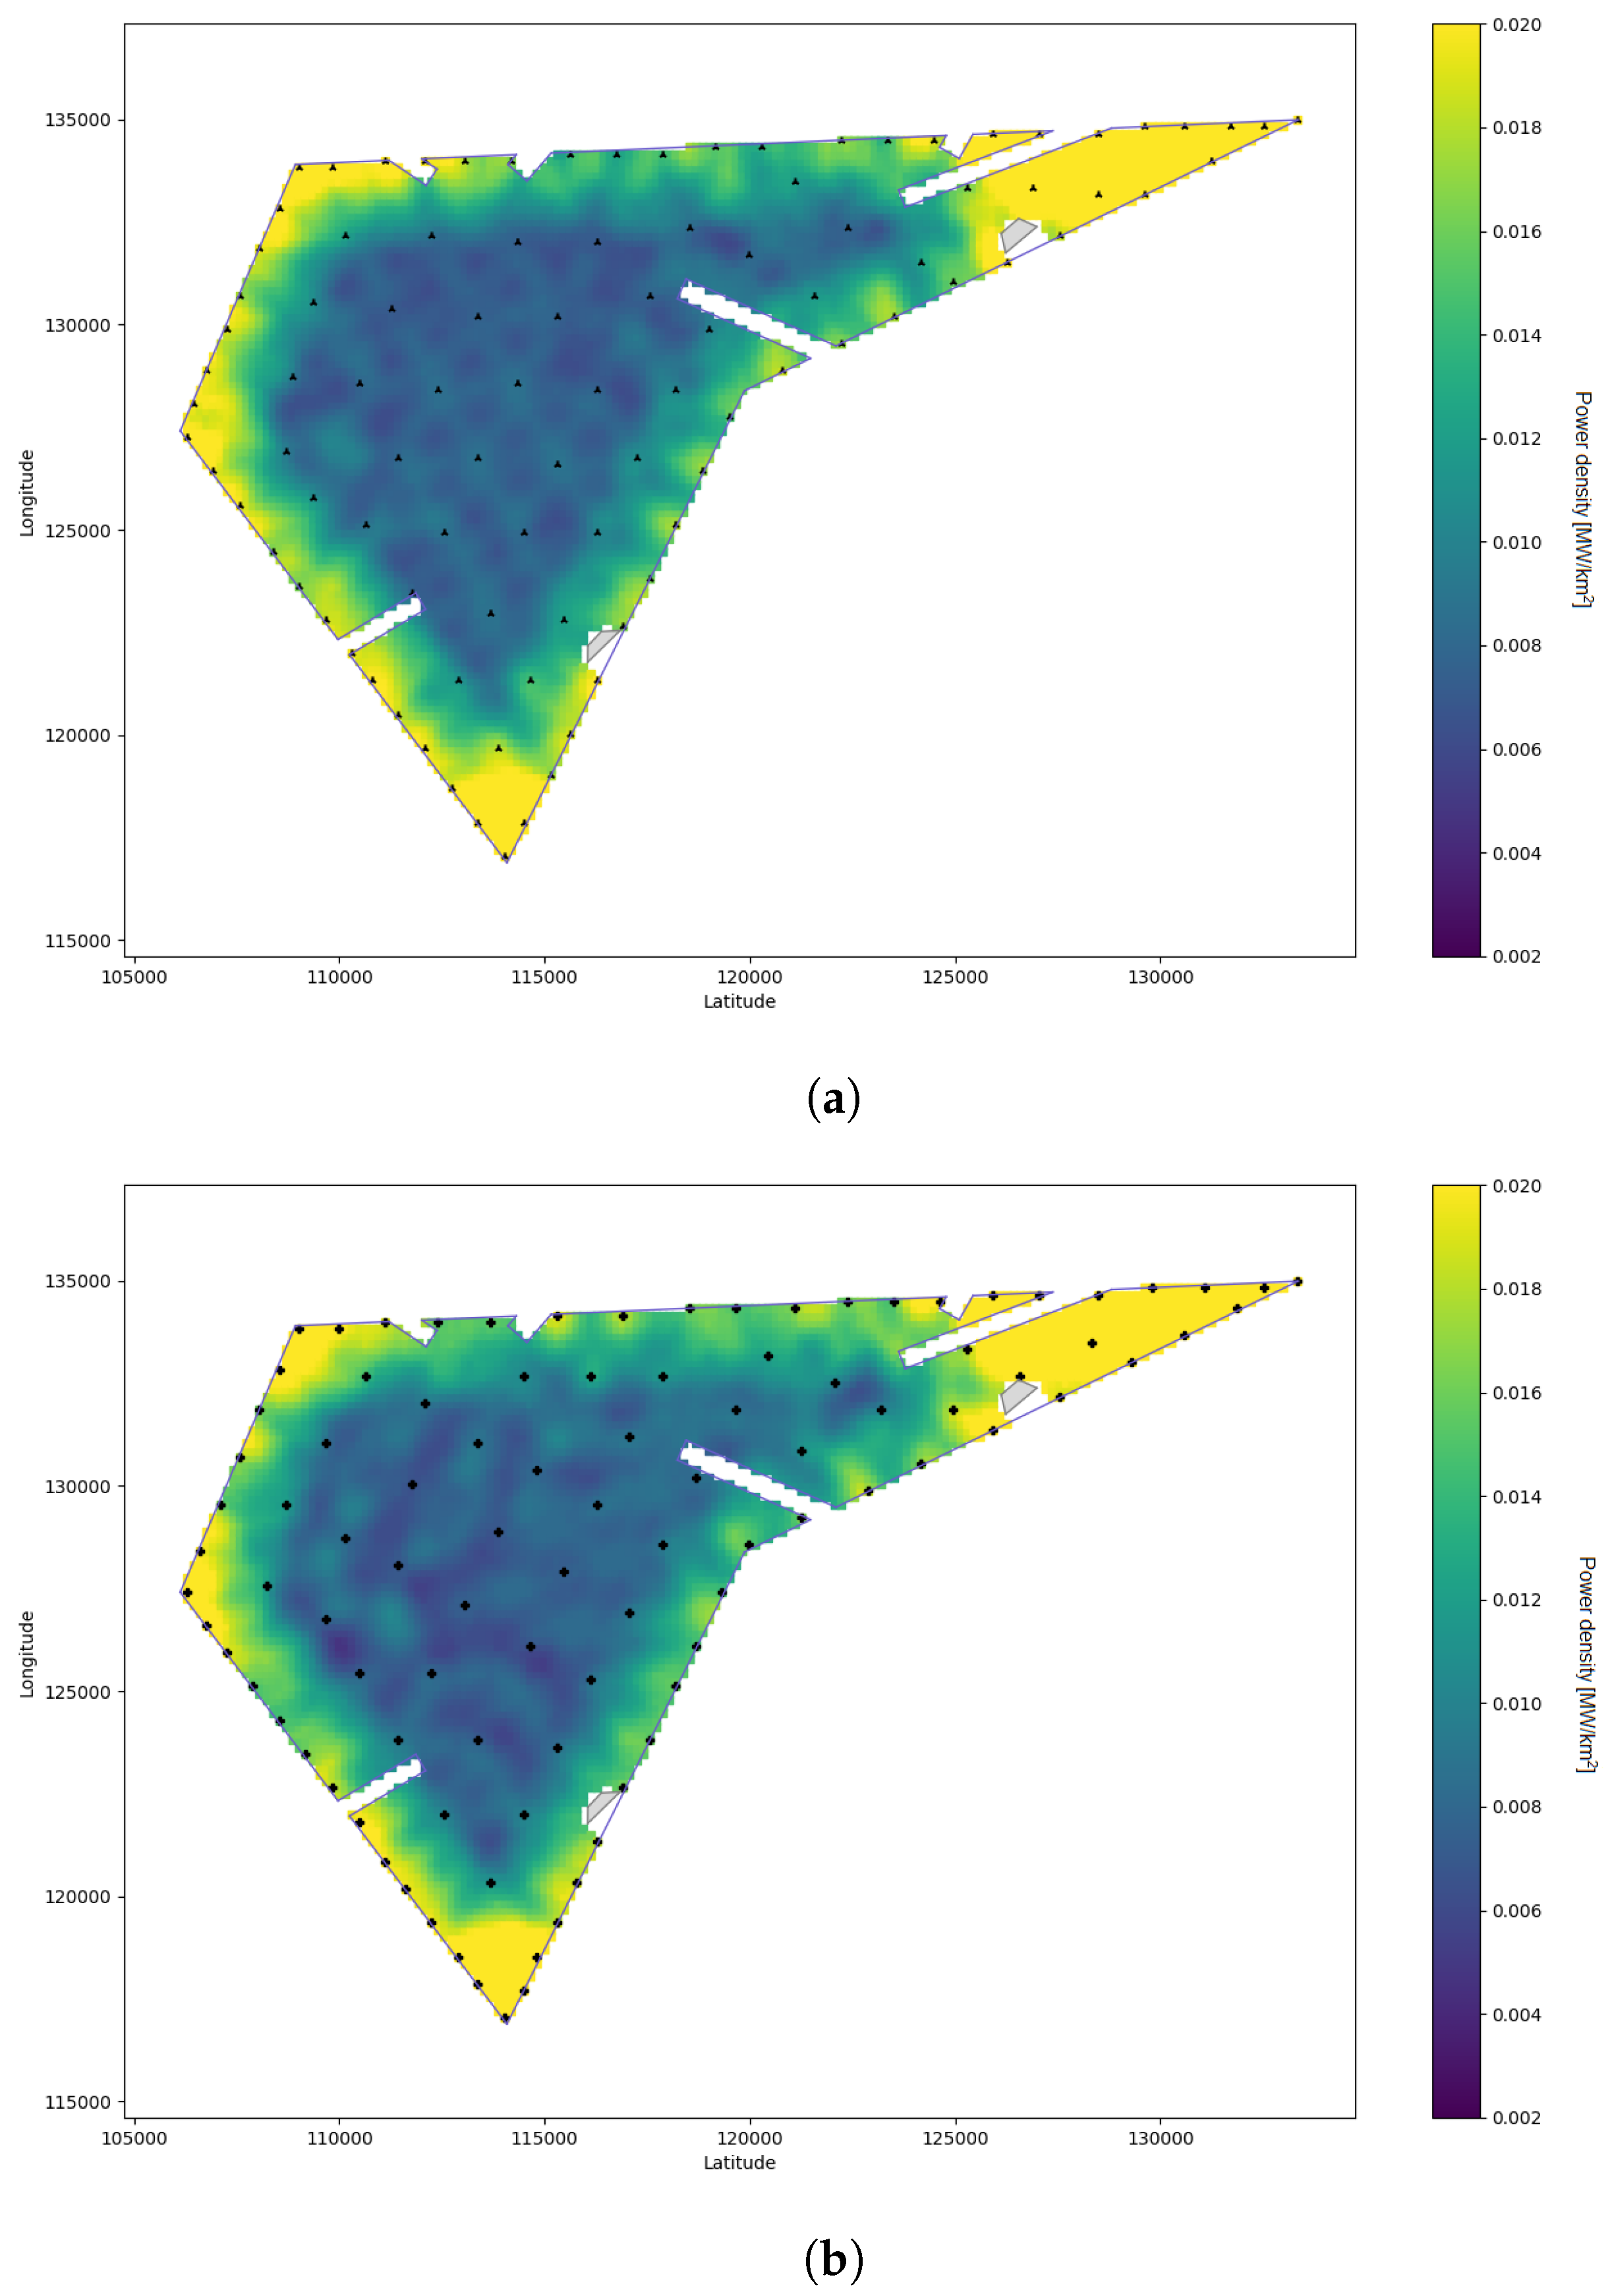
We show the layout solutions for HAWTs and VAWTs in Figure 8, and the energy density of the two solutions in Figure 9. Compared to the HAWTs solution, the energy density of the VAWTs layout is slightly higher along the borders and lower in the center of the park.
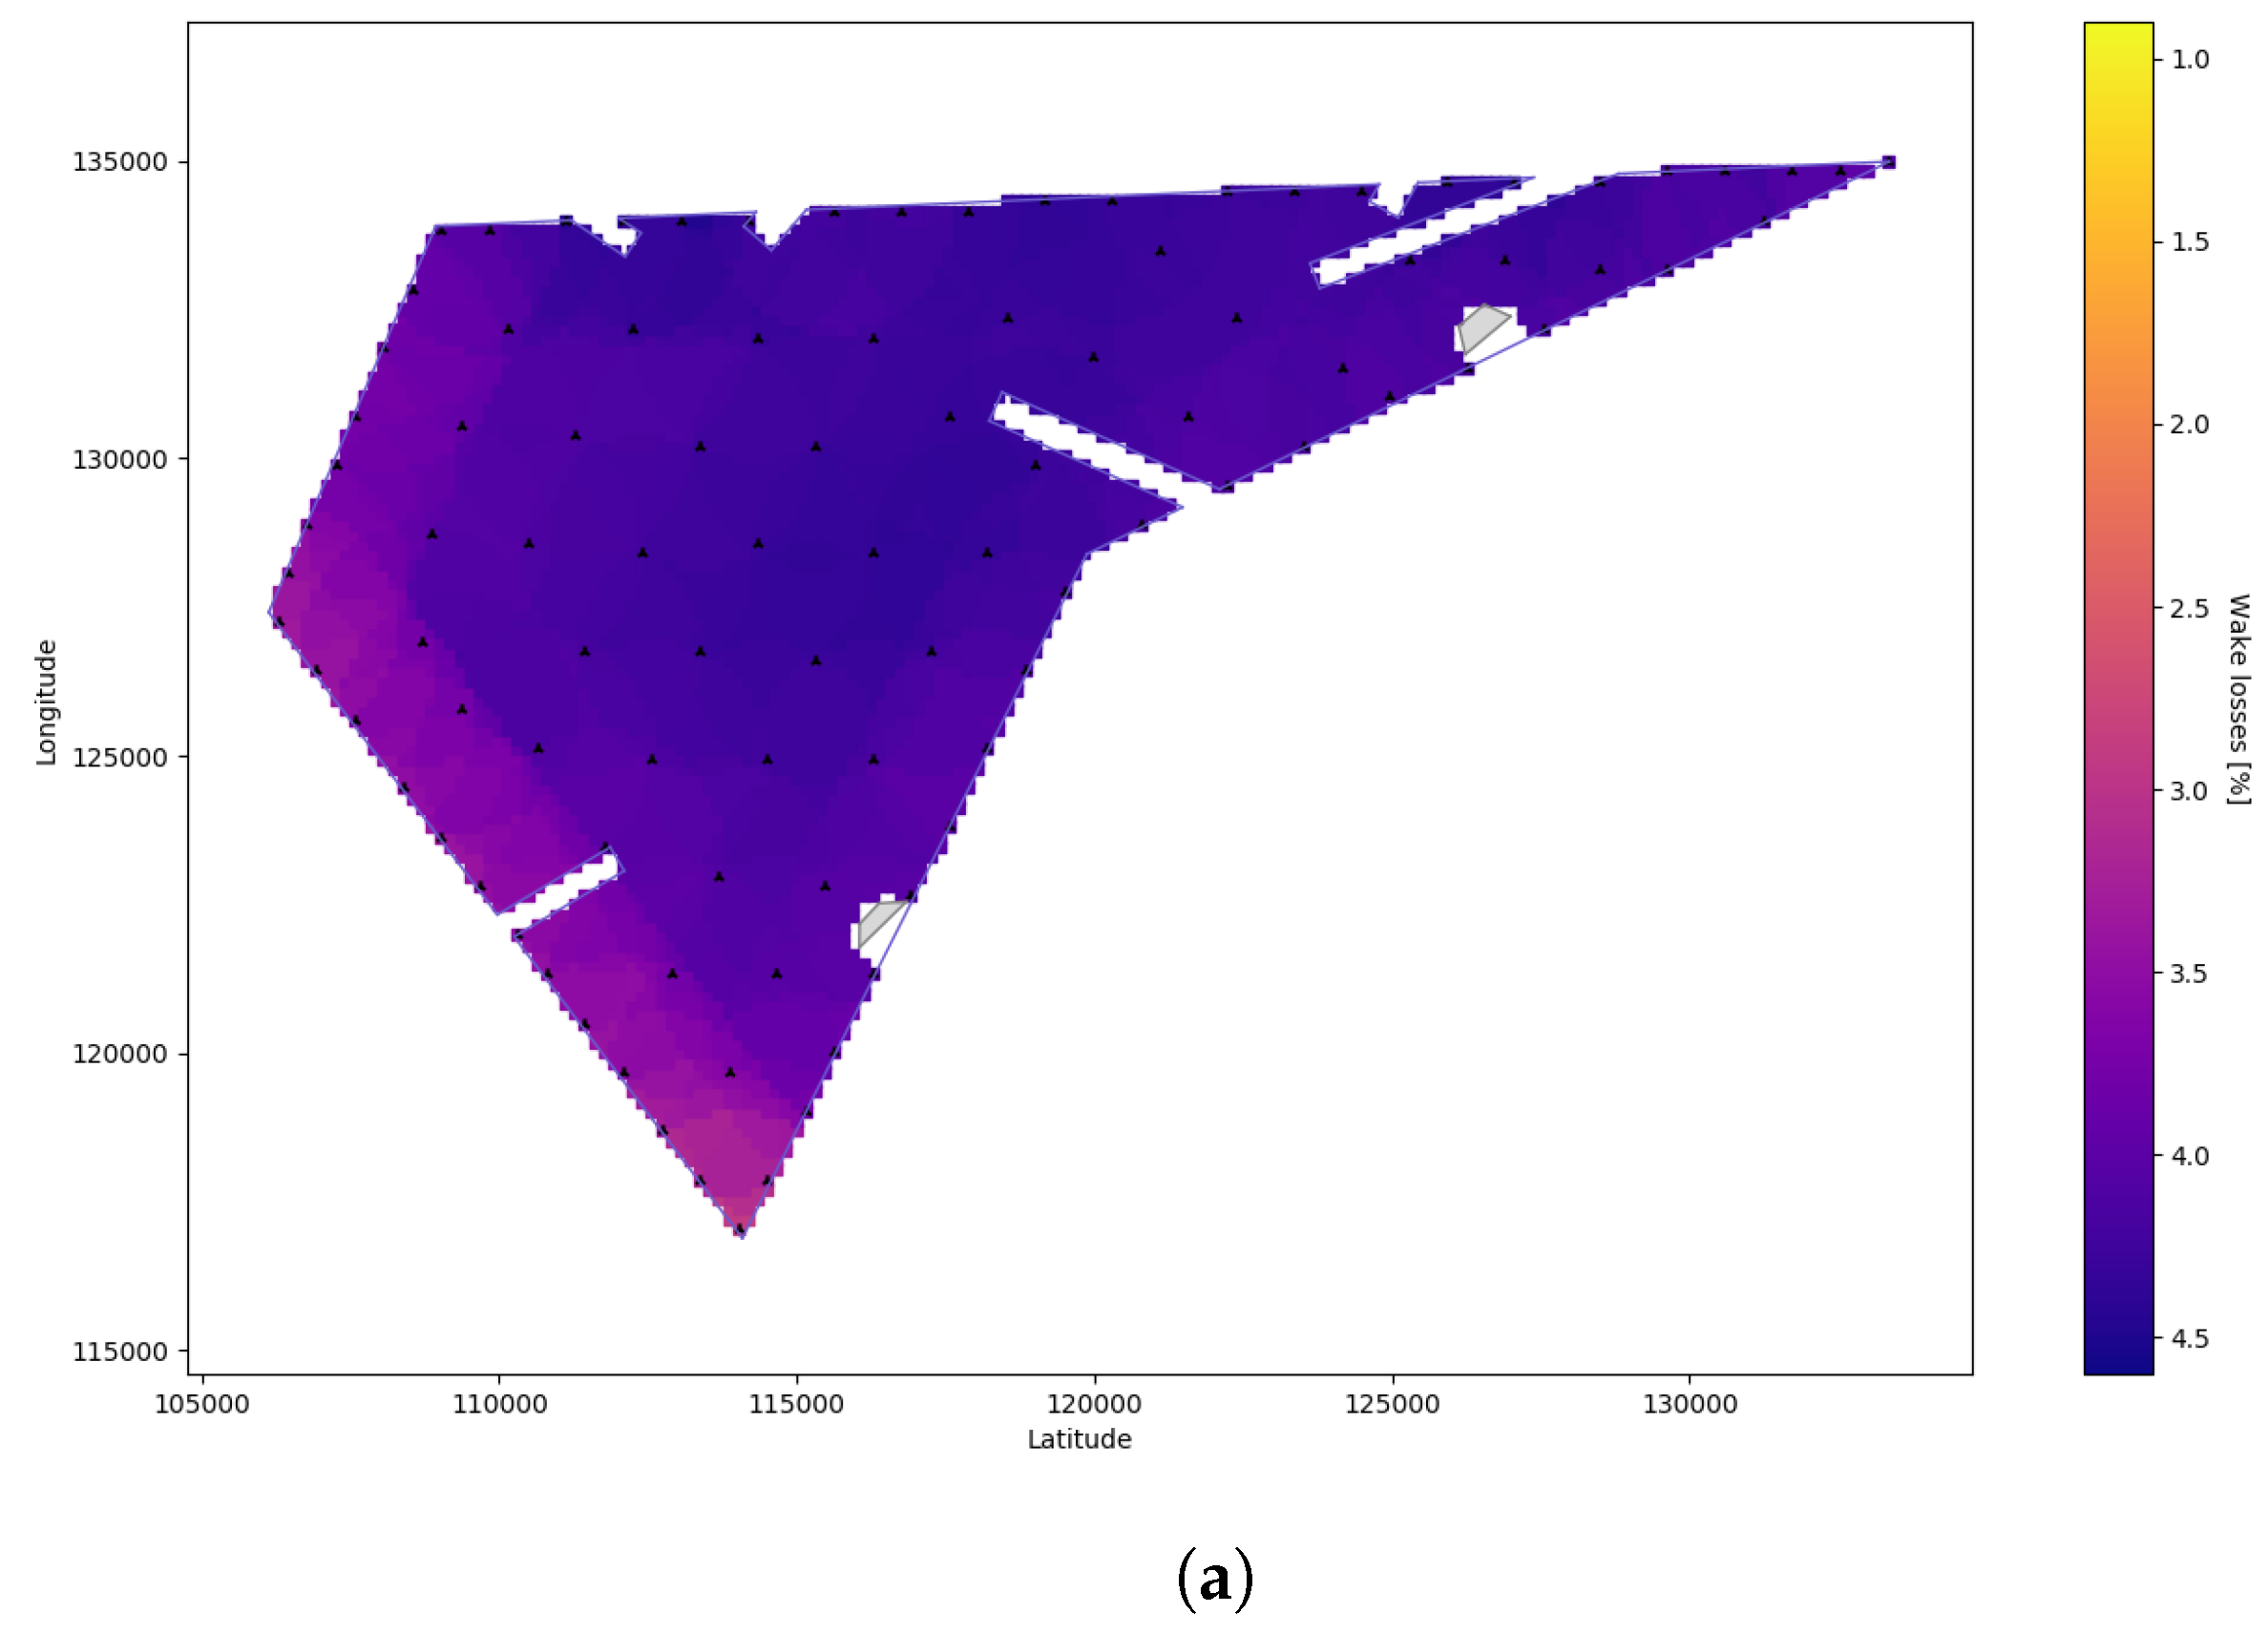
More interestingly, wake losses are compared in Figure 10. We can see that the wake effect is much higher for HAWTs than on the VAWTs. Indeed, the wake losses are lower for VAWT, both for the top-hat and the Gaussian wake model. Accordingly, a higher number of VAWTs could be placed in the wind farm site.
In the case considered so far, with 99 turbines, the energy production of HAWTs was higher than VAWTs. We therefore try to place a higher amount of VAWTs to match the energy production of HAWTs. The same electricity production is reached with T = 111 VAWTs. We show the wake losses in this case in Figure 11. We can see that the wake losses are higher than for the case with 99 VAWTs, but still significantly lower than for the layout with 99 HAWTs.
In Figure 12, we compare the Annual Energy Production obtained with the two technologies. For a lower amount of turbines, the HAWTs produce more energy than VAWTs. When the number of turbines increases, and thus the energy density is higher, VAWTs do outperform HAWTs. Thanks to lower wakes and a lower minimum distance, 510 VAWTs can be placed in the site compared to 460 HAWTs. The AEP of VAWTs in this case is 8.92 TWh/y, compared to 8.02 TWh/y of HAWTs. To have a proper comparison on the benefits of VAWTs, though, we should also consider the manufacture, installation, and operations and maintenance costs. Unfortunately, VAWTs are still a new technology, and we could not find available data for a more thorough cost analysis.
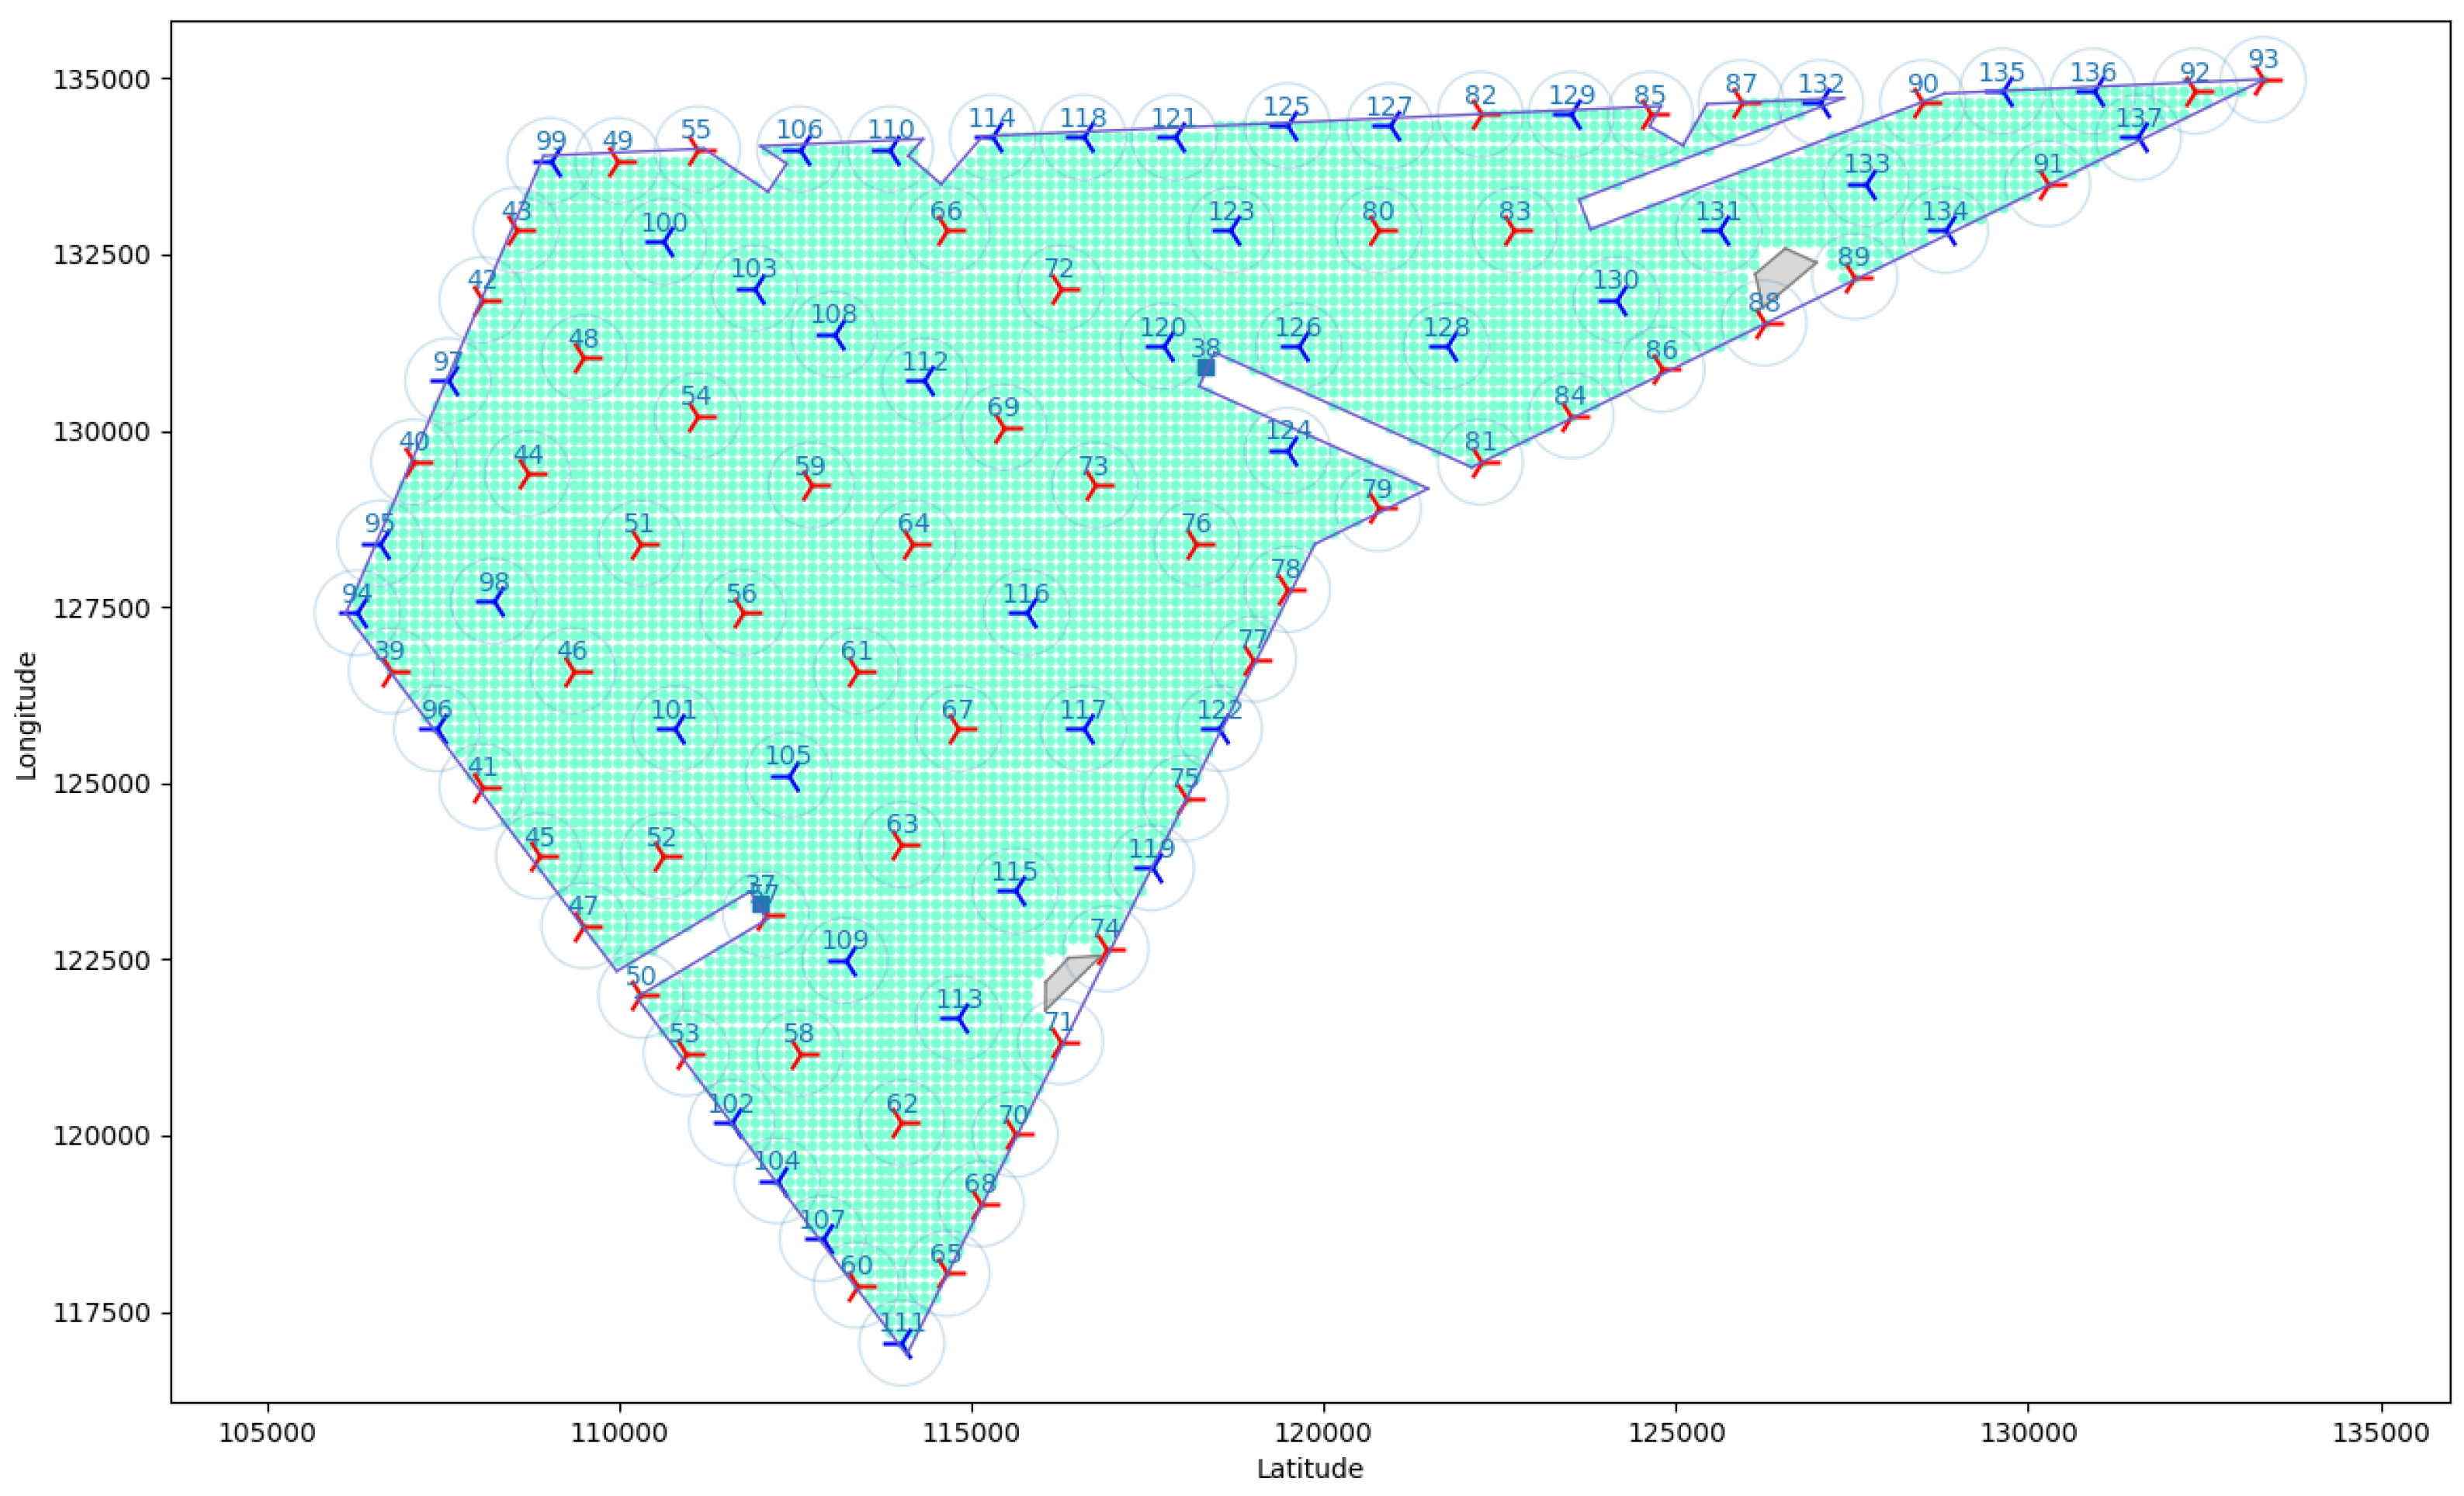
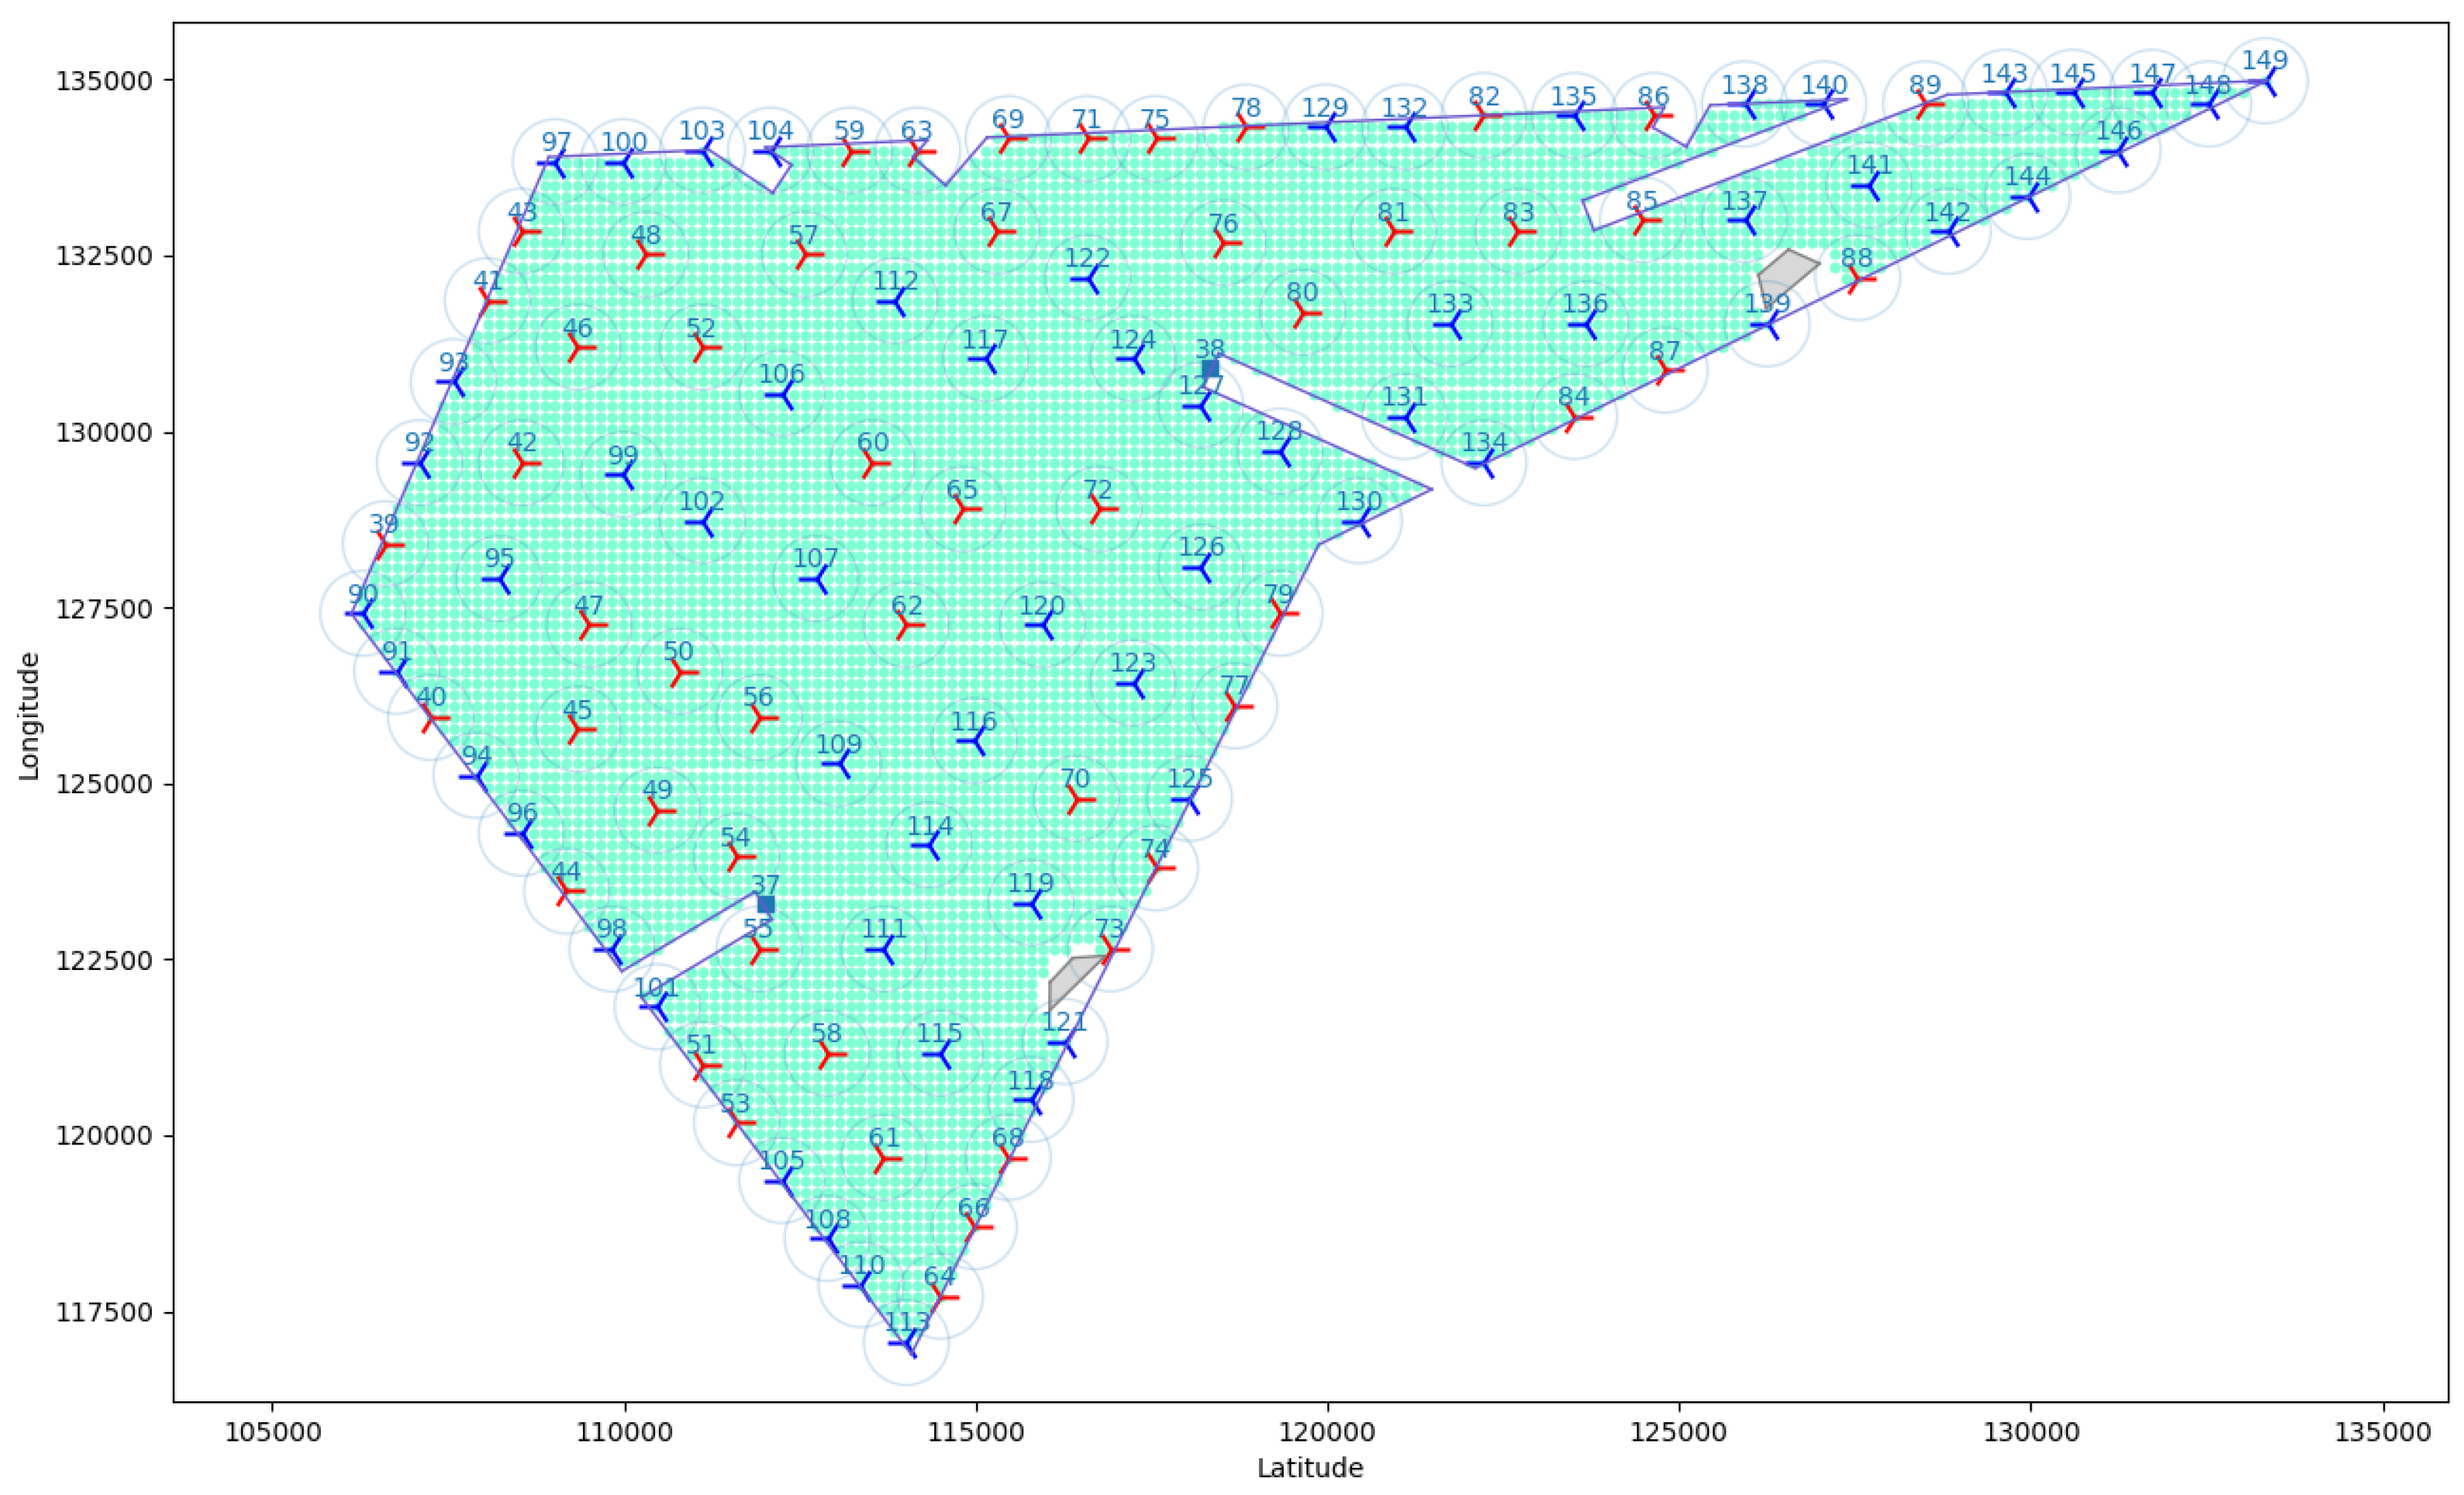
Finally, we show an optimized layout using the asymmetric wake model in Figure 13. The optimization is free to choose the best direction of rotation for each turbine. We highlight in red VAWTs rotating clockwise and in blue counterclockwise. Of the 99 turbines placed in the wind farm, 55 are rotating clockwise and 44 counterclockwise. Interestingly, the total power production is about 2.01 TWh/y, only slightly less than the layout computed with the (symmetric) Gaussian wake model despite a different configuration of turbines. Figure 14 reports the solution for a higher density layout, placing 111 turbines: 51 rotating clockwise, 60 counterclockwise.

8. Conclusions

We studied the wind farm layout optimization problem using the experimental VAWTs and compared it to the traditional HAWTs. We implemented two wake models for the VAWTs, the top-hat model and the Gaussian model, based on [17]. Using these wake models, we adapted a heuristic based on VNS for layout optimization of VAWTs. In addition, we adapted the Gaussian wake model to include the skewed wakes of VAWTs and presented the first MILP formulation for the layout problem with asymmetric wakes.
We compared the layout solutions using HAWTs and VAWTs on the same wind farm site. We confirm several observations from the literature: when the energy density is high, VAWTs produce more energy than HAWTs from the same site. Thus, one of the advantages of a VAWT wind farm is to extract more energy from the same area. Given the increasing utilization of sea areas for wind energy, VAWTs could be an option to increase wind energy production without occupying large areas of the sea. Given the lower amount of wakes, VAWTs can also reduce the wake effect of one wind farm on other nearby wind farms, which is an increasing concern due to the rapid development of wind farms in close proximity. Since VAWTs are cheaper to produce and have different characteristics than HAWTs, a wind farm with this technology can complement existing wind farms, producing electricity in low wind or in more extreme conditions and also affecting less nearby wind farms due to reduced wakes. Another promising application is to use VAWTs on floating foundations, given their low center of mass, thus opening new sea areas to wind energy development. On the contrary, these potential benefits have not been proven yet, since few VAWTs have been built on a large scale and none in offshore conditions. Finally, we presented an optimization model that considers asymmetric wakes. In this formulation, VAWTs are placed with a clockwise and counterclockwise spinning, which makes it possible to fully exploit the interaction of skewed wakes.
A limitation of our study is the wake models, which were adapted for Troposkien turbines. Future work should explore this direction to have higher fidelity in the wake model, which will make it possible to fully exploit the wake asymmetry in the wind farm layout.

Author Contributions

Conceptualization, D.C., G.B. and D.P.; methodology: D.C., G.B. and D.P.; resources: G.B.; software: D.C.; data curation, D.C.; supervision: G.B. and D.P.; writing—original draft, D.C.; writing—review and editing, D.C. and D.P.; visualization, D.C. All authors have read and agreed to the published version of the manuscript.

Funding

This research is partly funded by Innovation Fund Denmark (IFD) under File No. 9065-00162B.

Data Availability Statement

Synthetic instances can be downloaded from https://figshare.com/articles/dataset/Synthetic_Instances_for_Large_Offshore_Wind_Farm_Layout/13134731/1, accessed on 3 March 2023.

Conflicts of Interest

The authors declare no conflict of interest.

Abbreviations

The following abbreviations are used in this manuscript:
VAWTsVertical Axis Wind Turbines
HAWTsHorizontal Axis Wind Turbines
NPVNet Present Value
VNSVariable Neighborhood Search

References

  1. Castellani, F.; Astolfi, D.; Peppoloni, M.; Natili, F.; Buttà, D.; Hirschl, A. Experimental Vibration Analysis of a Small Scale Vertical Wind Energy System for Residential Use. Machines 2019, 7, 35. [Google Scholar] [CrossRef] [Green Version]
  2. Vertical Axis Wind Turbines Advantages & Disadvantages. 2017. Available online: https://blog.arcadia.com/vertical-axis-wind-turbines-advantages-disadvantages/ (accessed on 4 August 2022).
  3. Riegler, H. HAWT versus VAWT. Refocus 2003, 4, 44–46. [Google Scholar] [CrossRef]
  4. Hansen, J.T.; Mahak, M.; Tzanakis, I. Numerical modelling and optimization of vertical axis wind turbine pairs: A scale up approach. Renew. Energy 2021, 171, 1371–1381. [Google Scholar] [CrossRef]
  5. Dabiri, J.O. Potential order-of-magnitude enhancement of wind farm power density via counter-rotating vertical-axis wind turbine arrays. J. Renew. Sustain. Energy 2011, 3, 043104. [Google Scholar] [CrossRef] [Green Version]
  6. Chen, X.; Agarwal, R. Optimal placement of horizontal-and vertical-axis wind turbines in a wind farm for maximum power generation using a genetic algorithm. Int. J. Energy Environ. 2012, 3, 927–938. [Google Scholar]
  7. Lam, H.; Peng, H. Development of a wake model for Darrieus-type straight-bladed vertical axis wind turbines and its application to micro-siting problems. Renew. Energy 2017, 114, 830–842. [Google Scholar] [CrossRef]
  8. Zhang, B.; Song, B.; Mao, Z.; Tian, W. A novel wake energy reuse method to optimize the layout for Savonius-type vertical axis wind turbines. Energy 2017, 121, 341–355. [Google Scholar] [CrossRef] [Green Version]
  9. Bons, N. Optimization of Vertical Axis Wind Turbine Farm Layout; American Institute of Aeronautics and Astronautics: Reston, VA, USA, 2010. [Google Scholar]
  10. Sahebzadeh, S.; Rezaeiha, A.; Montazeri, H. Towards optimal layout design of vertical-axis wind-turbine farms: Double rotor arrangements. Energy Convers. Manag. 2020, 226, 113527. [Google Scholar] [CrossRef]
  11. Vergaerde, A.; De Troyer, T.; Muggiasca, S.; Bayati, I.; Belloli, M.; Kluczewska-Bordier, J.; Parneix, N.; Silvert, F.; Runacres, M.C. Experimental characterisation of the wake behind paired vertical-axis wind turbines. J. Wind. Eng. Ind. Aerodyn. 2020, 206, 104353. [Google Scholar] [CrossRef]
  12. Vergaerde, A.; De Troyer, T.; Standaert, L.; Kluczewska-Bordier, J.; Pitance, D.; Immas, A.; Silvert, F.; Runacres, M.C. Experimental validation of the power enhancement of a pair of vertical-axis wind turbines. Renew. Energy 2020, 146, 181–187. [Google Scholar] [CrossRef]
  13. Su, H.; Meng, H.; Qu, T.; Lei, L. Wind tunnel experiment on the influence of array configuration on the power performance of vertical axis wind turbines. Energy Convers. Manag. 2021, 241, 114299. [Google Scholar] [CrossRef]
  14. Bremseth, J.; Duraisamy, K. Computational analysis of vertical axis wind turbine arrays. Theor. Comput. Fluid Dyn. 2016, 30, 387–401. [Google Scholar] [CrossRef]
  15. Duraisamy, K.; Lakshminarayan, V. Flow physics and performance of vertical axis wind turbine arrays. In Proceedings of the 32nd AIAA Applied Aerodynamics Conference, Atlanta, GA, USA, 16–20 June 2014; p. 3139. [Google Scholar]
  16. Silva, J.E.; Danao, L.A.M. Varying VAWT cluster configuration and the effect on the individual rotor and overall cluster performance. Energies 2021, 14, 1567. [Google Scholar] [CrossRef]
  17. Abkar, M. Theoretical modeling of vertical-axis wind turbine wakes. Energies 2019, 12, 10. [Google Scholar] [CrossRef] [Green Version]
  18. Bedon, G.; Paulsen, U.S.; Madsen, H.A.; Belloni, F.; Castelli, M.R.; Benini, E. Aerodynamic Benchmarking of the DeepWind Design. Energy Procedia 2015, 75, 677–682. [Google Scholar] [CrossRef] [Green Version]
  19. Bortolotti, P.; Tarres, H.C.; Dykes, K.; Merz, K.; Sethuraman, L.; Verelst, D.; Zahle, F. IEA Wind Task 37 on Systems Engineering in Wind Energy—WP2.1 Reference Wind Turbines; Technical report; International Energy Agency: Paris, France, 2019.
  20. Cazzaro, D.; Pisinger, D. Variable neighborhood search for large offshore wind farm layout optimization. Comput. Oper. Res. 2022, 138, 105588. [Google Scholar] [CrossRef]
  21. Pisinger, D. Upper bounds and exact algorithms for p-dispersion problems. Comput. Oper. Res. 2006, 33, 1380–1398. [Google Scholar] [CrossRef]
  22. Mladenović, N.; Hansen, P. Variable neighborhood search. Comput. Oper. Res. 1997, 24, 1097–1100. [Google Scholar] [CrossRef]
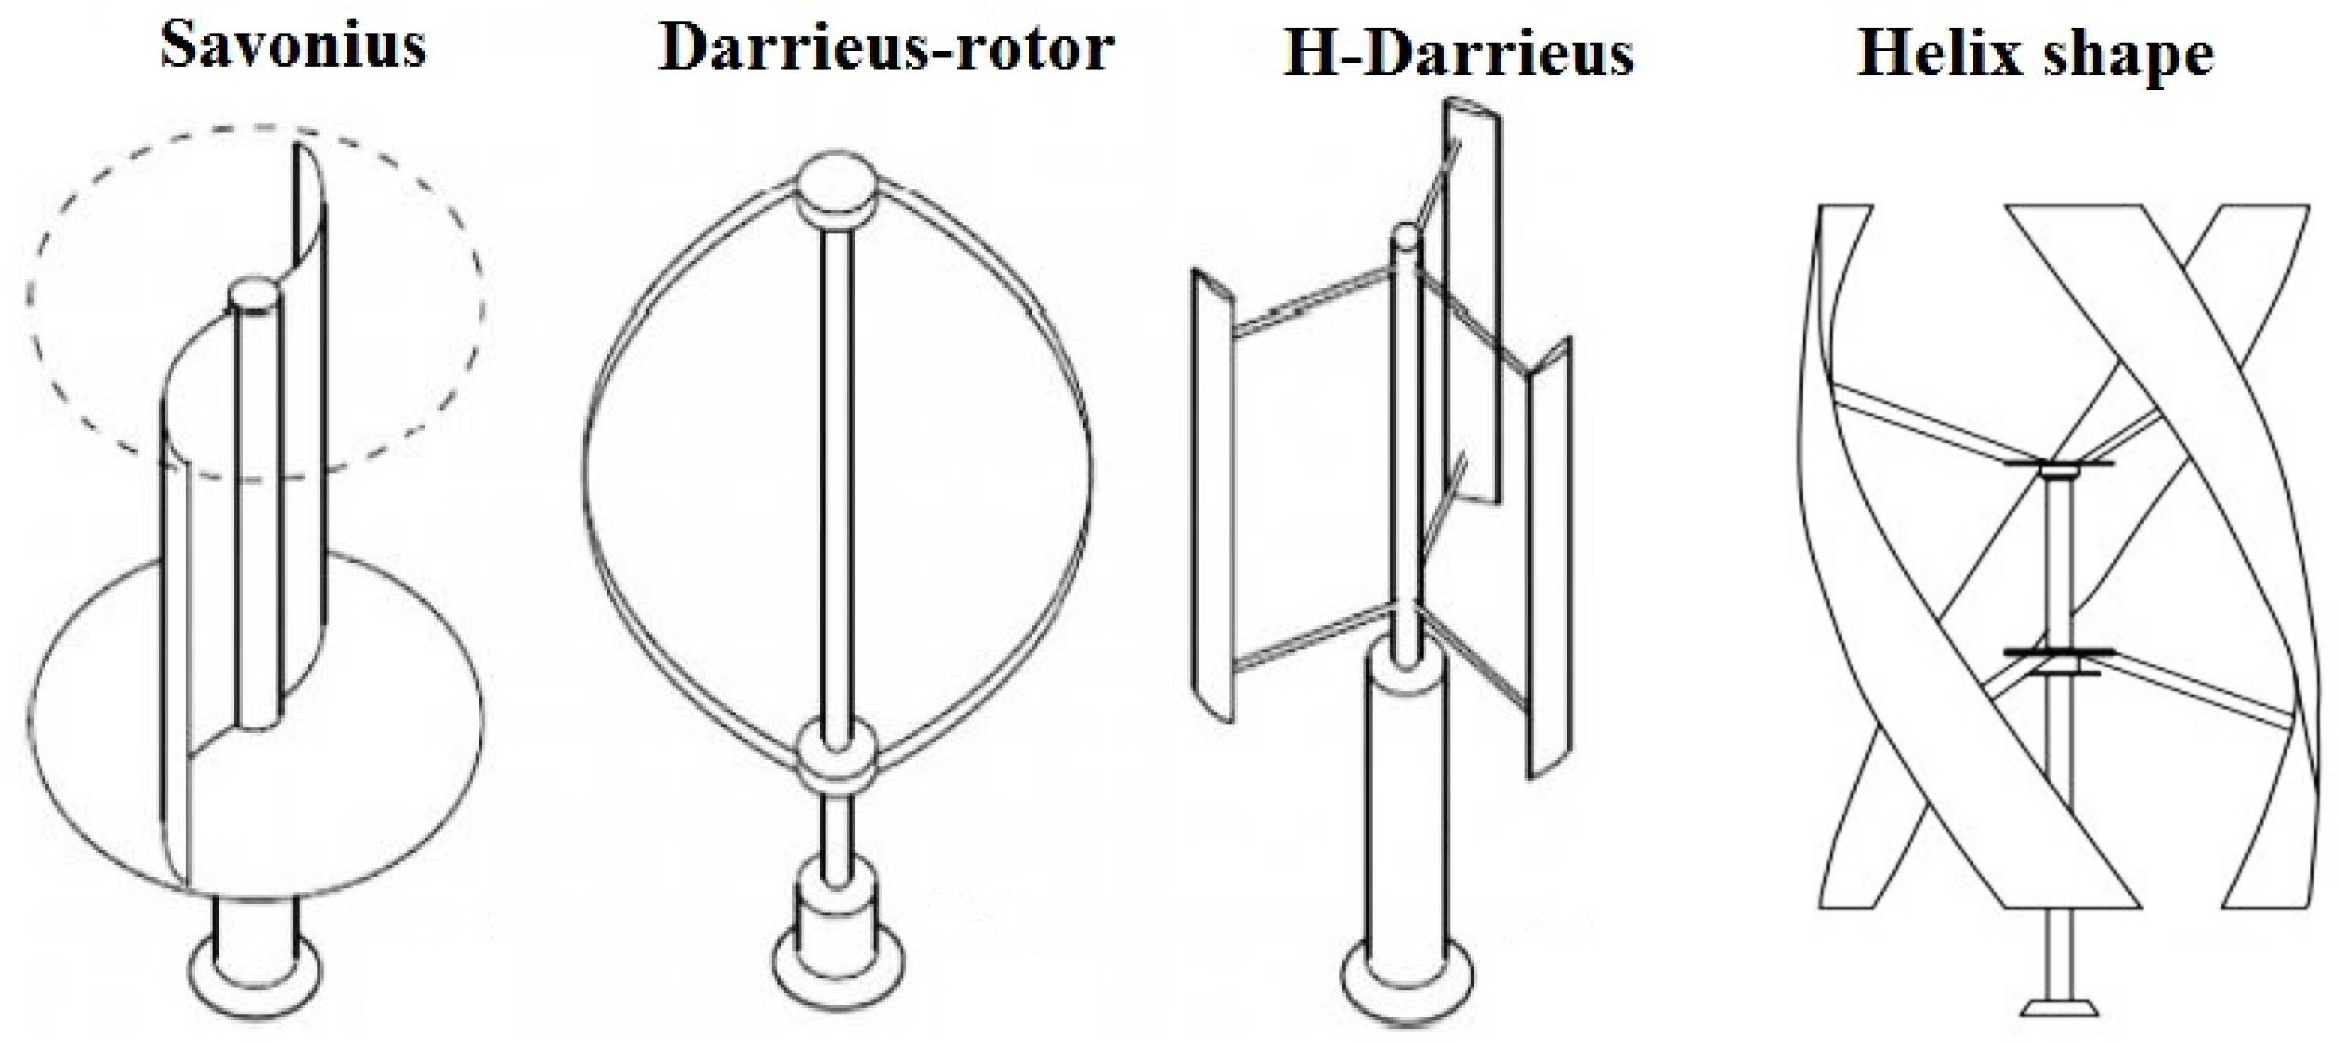
Figure 1. Different types of VAWTs: Savonius, Darrieus, H-Darrieus, Helix. Figure based on [1].
Energies 16 02697 g001
Figure 2. On the left, a typical offshore Horizontal Axis Wind Turbine (HAWT). On the right, a Vertical Axis Wind Turbine (VAWT) of the Darrieus type. Images copyright: Vattenfall and Wikipedia.
Energies 16 02697 g002
Figure 3. Schema of wake model for H-shaped VAWTs based on [1]. The expansion of the projected wake area at distance x depends on the wake decay constants k w y (vertical axis) and k w z (spanwise axis).
Energies 16 02697 g003
Figure 4. Comparison of the large eddy simulation for VAWT wakes with the top-hat and Gaussian models. Figures from Abkar [17]. Area spanned by VAWT (white rectangle) and area spanned by wake (red) at 6 rotor diameter distance when facing the VAWT. Intensity of red reflects speed deficit. (a) Large Eddy Simulation. (b) Top-hat model. (c) Gaussian model.
Energies 16 02697 g004
Figure 5. Asymmetric Gaussian wake model based on [7]. The asymmetry of the wake due to the turbine rotation is given by the windward and leeward decay constants. U 0 is the wind speed in free air, D the turbine span, and x the distance from the turbine. (a) Asymmetric wake for turbine rotating clockwise. Notice Y W > Y L . (b) Asymmetric wake for turbine rotating counterclockwise. Notice Y W > Y L .
Energies 16 02697 g005
Figure 6. Power curves of FP7 Deepwind VAWT and of NREL 5MW HAWT.
Energies 16 02697 g006
Figure 7. Thrust curves of FP7 Deepwind VAWT and of NREL 5MW HAWT.
Energies 16 02697 g007
Figure 8. Optimized layout on instance B, placing 99 turbines for both HAWT and VAWT cases. (a) HAWT solution, 2.25 TWh/y. (b) VAWT solution, 2.01 TWh/y (Top-hat wake model).
Energies 16 02697 g008
Figure 9. Energy density comparison on instance B layout with 99 turbines. (a) Energy density on HAWT solution. (b) Energy density on VAWT (Top-hat wake model) solution.
Energies 16 02697 g009
Figure 10. Wake losses comparison on instance B layout with 99 turbines. (a) Wakes on HAWT solution. (b) Wakes on VAWT (Top-hat wake model) solution.
Energies 16 02697 g010aEnergies 16 02697 g010b
Figure 11. Higher density layout using VAWTs (top-hat wake model), with a total of 111 turbines.
Energies 16 02697 g011
Figure 12. Annual energy production for HAWTs and VAWTs when varying the number of turbines placed in the wind farm. The maximum number of HAWTs that can be placed in the area is 460 with a production of 8.02 TWh/y, compared to 510 VAWTs for a total AEP of 8.92 TWh/y. VAWTs lead to a more efficient use of the wind farm area than HAWTs.
Energies 16 02697 g012
Figure 13. Layout using VAWTs with the asymmetric Gaussian wake model, placing 99 turbines. Turbines in red (pointing right) rotate clockwise, turbines in blue (pointing left) counterclockwise.
Energies 16 02697 g013
Figure 14. High density layout using VAWTs with the asymmetric Gaussian wake model, placing 111 turbines. A total of 51 turbines are rotating clockwise and 60 counterclockwise.
Energies 16 02697 g014
Disclaimer/Publisher’s Note: The statements, opinions and data contained in all publications are solely those of the individual author(s) and contributor(s) and not of MDPI and/or the editor(s). MDPI and/or the editor(s) disclaim responsibility for any injury to people or property resulting from any ideas, methods, instructions or products referred to in the content.