Abstract
Physical activity involves movements, which can be considered sources of kinetic energy, that are expected to be important during sports activities. Several transducers can transform this energy into electrical energy. Piezoelectric generators are widely used, and several applications highlight their relevance. However, the generated output power is location dependent, and the analysis of the placement of this kind of generator can be challenging. In order to assess the availability of kinetic energy sources, an acceleration data analysis method is presented. Temporal and harvester model-based studies, using data from 17 inertial measurement units (IMUs) located across the whole human body, were conducted. The results show that piezoelectric cantilever-beam harvesters can be very sensitive to impacts. Extremity segments, such as the feet or hands, can be considered as good energy sources. The most relevant features are proposed as criteria to easily evaluate the harvestable energy sources.
1. Introduction
The growing market of wearable sensors, offers new solutions for monitoring parameters in athletes [1]. Sensors integrated into accessories are becoming more common. A dozen brands offer watches equipped with different sensors, such as fēnix® 7S (Garmin Ltd., Olathe, KS, USA) and Polar Pacer Pro (Polar Electro, Kempele, Finland), and some research teams have worked on cloth-embedded sensors [2,3]. The development of these systems not only facilitates the measurement of the desired parameters, but also allows longer-term experiments, such as studies related to the field of occupational risk assessment, to be conducted [4,5]. Nevertheless, these embedded systems face some challenges, e.g., they need a power supply to operate. Electrochemical batteries are the primary choice for meeting electrical energy needs, as they show good performance. Indeed, innovative materials and technologies such as the widely used lithium-ion batteries, have advantageous characteristics, such as their energy density (120–750 ) [6]. Depending on the use, the battery life can reach a few hours. Despite the attractiveness of this type of energy storage, some drawbacks cannot be overlooked. The charging time can be a few hours and can impact application feasibility, as it is necessary to extract and recharge the battery in most integrated systems. Moreover, the battery lifespan is not endless. The number of charging cycles of lithium-ion and zinc–bromine batteries during their lifespan, are roughly 5000 and 2000 cycles, respectively [6]. The life cycle analysis of these components highlights the environmental impacts and the need for a recycling process [7]. In addition, the use of single-use or replaceable batteries is widespread. Movesense (Suunto, Helsinki, Finland) offers wearable sensors for medical and sports applications powered by a CR 2025 battery. This solution provides good compacity and energy density but requires periodic replacement (depending on the application) and can generate a large amount of waste. The presence of toxic heavy metals highlights the need to assess the polluting potential to reduce possible negative impacts [8].
An alternative is the use of self-powered sensors, which is a field of interest [9]. For example, triboelectric generators can be used for movement detection [10]. This type of system is similar to wearable generators, as it converts the available energy sources on the human body into electrical energy [11]. Matsunaga et al. [12] worked on stretchable triboelectric generators, based on transparent carbon nanotube films. Some works have discussed different types of energy sources in the human environment, for multisource harvesting systems [13]. Among the different energy sources, the main ones are thermal energy, radio frequency energy, solar energy, and kinetic energy. Thus, energy harvesting could also be a relevant solution for power wearable sensors. Thermoelectric generators can produce up to 153 on the human body, which is sufficient to power a few components, such as micro-accelerometer sensors or temperature sensors [14]. Tainoff et al. [15] developed planar thermoelectric devices for energy harvesting. Nevertheless, drawbacks such as the toxicity of the materials, the mass of the system, and ergonomic comfort, limit their use [16]. Solar and radio frequency energy generators are highly dependent on the environment in which the activities are performed, and their production is not always stable. Satharasinghe et al. [17] developed a solar energy harvesting fabric based on a solar cell, for powering devices. Kinetic energy generators are highly dependent on human motion. They can be divided into two types: piezoelectric generators (PEGs) and triboelectric generators (TEGs). The output power density can reach ~75.52 [18,19]. According to the design, PEGs and TEGs can also be slightly cumbersome. Moreover, most PEGs are based on PZT (lead, zirconate, and titanate) materials, which are toxic and polluting. However, recent work has offered new perspectives on lead-free piezoelectric materials, e.g., Poulin-Vittrant, G. et al.’s work on ZnO nanowire-based piezoelectric nanogenerators [20,21] and Clementi, G. et al.’s work on films [22].
Challenges related to the sports field can be divided into performance assessment and athlete instrumentation, and various and numerous sensors are used [23]. Powering the various devices needed can require significant amounts of energy. However, athletes consume large amounts of energy during their training or during competitions [24,25], which is related to the effort made and the performed actions. The resulting body activity produces a lot of kinetic energy. Nevertheless, to the best of our knowledge, there are almost no studies that precisely investigate kinetic energy sources on the human body for sports applications. The energy sources depend on the performed actions, and can be localized anywhere on the human body. Kim, J. et al. [26] developed a fabric-based wearable piezoelectric energy harvester, which operates under bending and pressing. The versatility and scalability of PEGs allow them to be organized in various configurations, to harvest energy from kinetic sources, making the PEG a good candidate for a harvester solution, to overcome the excessive use of batteries. Liu, Y. et al. [27] present a survey on the different technologies to harvest energy from the human body. They show that the piezoelectric transducer is a promising candidate.
Several architectures and technologies for piezoelectric harvesters exist in the literature [28]. They have many advantages, such as ease of use and implementation [19]. PEGs can also be used for activity recognition [29]. These devices are self-powered, and their beam structure is very common; thus, they have a lot of applications [30]. Further, the generator operation is based on vibrations. The miniaturization of these devices makes it very challenging to design them for optimal response to the human body (maximum energy production). In addition, the electrical tuning of the energy harvester circuit is an important aspect, to maximize the power flow; Brenes A. et al. [31] presented a review on the effective implementation of maximum power-point tracking. Human movement operates mainly at low frequency, and is essentially nonperiodic [32]. It is necessary to adapt the transducer to the source frequencies accordingly. Zhang Q. et al. [33] presented an escapement mechanism to operate a piezoelectric cantilever beam below 2 Hz excitation.
The harvested energy depends on the localization and orientation of the PEG on the human body. Indeed, the design of harmonic devices for non-stationary signals is complex, especially for signals of highly dynamic actions, such as sports actions. Performing experimental measurements aimed at optimizing the placement of PEGs, can be tedious, and experimenting with combinations of possible localization and orientation is cumbersome. Furthermore, the required experimental setup is neither trivial nor ergonomic. The actions performed by athletes are restricted, and accurate measurements of the PEG output voltage require high-impedance devices. An alternative approach that can be used is based on electromechanical models, this method offers more flexibility. Regardless of whether the models are lumped parameter models or distributed parameter models, the simulation of cantilevered PEGs can be fastidious. There are tradeoffs between computational time and model accuracy [34,35].
Thus, the aims of this paper are to give guidelines and propose a method for determining the optimal placement of cantilevered PEGs on the human body. The proposed method is applied to the sports field and is based on real accelerometer data and electromechanical models. Features of interest are extracted from acceleration data, to analyze the available kinetic energy sources from cantilevered PEGs.
2. Materials and Methods
To assess the availability of kinetic sources for energy harvesters, acceleration analysis is generally conducted, as acceleration data directly translate the dynamic behavior of systems. Using 3DOF accelerometers (IMU) allowed us to measure the acceleration in every direction, to simulate different orientations of the generators. Moreover, IMUs are widely used, and a large quantity of available data exist. This allowed us to assess kinetic energy sources with ease before proceeding to the experiments. Thus, experimental acceleration data were recorded from the human body, details of which are provided in the following sections. Newton’s second law illustrates, according to the following formula, the fundamental principle of dynamics:
where is the external force applied to a system, m is the system mass in motion, and is the acceleration of the system. Piezoelectric materials are characterized by their capacity to transform mechanical stress into electric charge. Thus, the acceleration is related to the electric charge displacement into the material. Linear piezoelectricity is modeled as an augmentation of elasticity and dielectric behavior, according to two governing equations linking stress, T, strain, S, electric field, E, charge density, D, elastic flexibility, s, permittivity, , and piezoelectric coefficient, d.
2.1. Harvester Considerations
This paper focuses on cantilever beam-based piezoelectric harvesters. As illustrated in Figure 1, this kind of harvester can be represented as a beam, clamped at one end and free at the other.

Figure 1.
Schematic of a clamp-free unimorph beam.
Many parameters can be adapted, such as the shape, the material, and the structure, and tip mass can be added to modify the beam’s behavior.
The operating principle is based on vibrations. The input acceleration amplitude and frequency are the main criteria to be evaluated. Thus, the generator is designed according to its application. Human motion frequencies are mainly between 3 and 26 Hz [36]. However, sports movements also possess many action-induced impacts. Running, sprinting, striking, and similar actions cause many impacts. These signals present a wide frequency spectrum and can also operate generators.
The appearance of the different actions performed during a circuit can be biased. Indeed, basic training, competition training, and competition conditions are different. Movement frequencies and intensities are also dependent on the particular sport [37]. The conducted study illustrates a kinetic energy availability assessment method and its relevance.
2.2. Distributed Parameter Model
A unimorph structure, in the absence of tip mass, was used, as it offers greater simplification for the analysis method. The distributed parameter model offers the best predictions, as it is based on the analytical solution of the coupled electromechanical system equations [35,38]. This model considers modal analysis, with Euler–Bernoulli assumptions. The resulting equations are as follows:
where is the voltage response to a resistive load R, is the modal coordinate for the r-th vibration mode, is the mechanical damping ratio of the r-th vibration mode, is the undamped natural frequency of the r-th vibration mode, is the modal electromechanical coupling term for the r-th vibration mode, and is the modal mechanical forcing function. Equation (2) is the mechanical equation of motion in modal coordinates, and Equation (3) is the governing electrical circuit equation. In the absence of tip mass and by neglecting the small base rotation of the beam, the modal mechanical forcing function can be written as
where is the mass per unit length, is the transverse displacement of the beam base, and is the mass-normalized eigenfunction of the r-th vibration mode
where , and are obtained as
The various necessary parameters are listed in Table 1.

Table 1.
Parameters of the model.
The single-mode voltage response function can be written in the Laplace domain using (2) and (3).
The modal mechanical forcing function can be rewritten as
where A(p) is the base acceleration. Thus, the resulting transfer function can be written as . The Mathworks Matlab (R2022b) software was used to simulate the model. Specifically, the Matlab lsim() function was used; it discretizes the continuous transfer function, (H(p)), to a recurrence equation and converts the sampled acceleration data, (a(t)), with a first-order hold. The output was then computed using the recurrence equation applied to the samples as a digital finite-response filter. This numerical method is fast.
For simulation purposes, the acceleration data were upsampled. This operation does not add information to the signal and allows smaller time step computations to be performed, for better precision. The resampling factor was evaluated using the relative error (RE) in the simulated energy.
where i is the resampling factor, and E is the simulated energy obtained from the model using the associated upsampled acceleration data.
Finally, passive control was assumed, with a constant resistive load R, at the harvester output, and the energy of the simulated harvester model was calculated as
where is the harvester model voltage response. To simulate the harvester model response, the data extracted from [38] were used, the characteristics are reported in Table 2.

Table 2.
Materials properties of the unimorph cantilever, extracted from [38].
2.3. Hardware and Software Configurations
The computations were performed using Matlab R2022b (MathWorks, Inc., Portola Valley, CA, USA) on Windows 10 (Microsoft Corporation, Redmond, WA, USA). The hardware system was built on an AMD Ryzen 5 2600 Six-Core 3.4 GHz (CPU), with 16 Gb RAM memory. Computations were performed in less than 1 s, for 992,290 samples of temporal data.
2.4. Motion Capture
A (right-handed) subject performed a ~13-min circuit of simulated sports actions, where classical actions related to basketball, volleyball, and handball were represented. Raw acceleration data were recorded and then manually labeled; the acquisition was performed using Xsens MVN Link (Xsens Technologies B.V., Enschede, The Netherlands) [39]. The system was composed of 17 IMUs, with 9 degrees-of-freedom (3-axis accelerometer, 3-axis gyroscope, 3-axis magnetometer), located on both hands, both forearms, both upper arms, both shoulders, both feet, both lower legs, both upper legs, pelvis, head, and T8 (sternum). The sampling frequency was 240 Hz.
The attachments and protocol provided by Xsens were used to place the sensors on the body. Extra sports straps were used to increase the robustness of the attachment. Soft tissue artifacts were not considered. The sensors were placed close to the bones, to limit these undesirable effects. Consequently, the results of the studied harvesters are valid if the attachment method is similar. The x-axis of the sensors was aligned with the length of the segments; the y-axis was aligned with the thickness of the segments; and the z-axis was aligned with the outgoing normal direction. Figure 2 presents the Xsens sensor frames on the human body segments. Details about the sensors’ placement are given in the MVN manual [40].
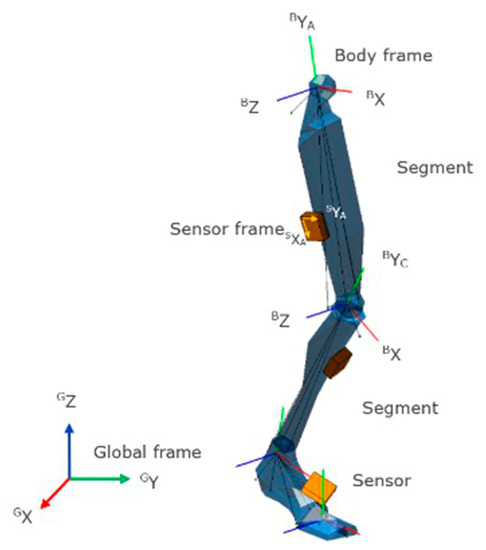
Figure 2.
Xsens sensor reference frames and segment reference frames [40].
2.5. Data Characteristics
Acceleration data can be mathematically categorized as finite energy signals, as they are non-stationary and have a finite time span. is the space of finite energy signals. The mathematical signal energy, , is obtained as
where s is the finite energy signal. Moreover, sport-related actions can be manifold, and high-velocity interactions between the body and the environment are observable. Feet come into contact with the floor during running and jumping, and there are ball interactions during hits and passes; all of these cause high acceleration and deceleration magnitudes, translated as abrupt changes. To perform a detailed time–frequency analysis, it is not possible to use a common tool such as the Fourier transform, because it does not allow one to precisely locate the transients of the signal. Thus, here, the wavelet transform was used [41]. For the precise representation of the different frequencies present in the acceleration, the continuous wavelet transform (CWT [42]) was computed (using the cwt() function in Matlab), and for signal decomposition or reconstruction, the maximum overlap discrete wavelet transform (MODWT [43]) was computed (using the modwt() function in Matlab).
As discussed in the above paragraph, acceleration data contain impacts. This is related to quick and abrupt changes in the signal transients. Depending on the width of the impacts, the frequency spectrum can be very wide or even present all frequencies, as in the theoretical Dirac delta distribution. Nevertheless, the whole dynamic is only observable if the sampling frequency is at least two times greater than the maximum frequency of the impacts, according to the Nyquist–Shannon theorem [44].
2.6. Harvester Orientation Influence
The harvested energy is inherently related to the harvester’s location on the human body. Positions with periodic and highly dynamic motions are the most suitable ones. Moreover, the harvester’s orientation impacts the potential energy harvested. The harvester’s structure allows voltage to be generated from unidirectional stress only, in correspondence with the deflection axis (DA) of the beam. To assess orientation influence, the harvester model was simulated for multiple angular rotations from the IMU reference frame. Nevertheless, to avoid redundancy in the results, the range of angular variation was restricted. The Cartesian space is defined by three axes ; thus, three rotations could be introduced, and are the rotation matrixes for the x-axis (which rotates the y-axis to the z-axis), the y-axis (which rotates the z-axis to the x-axis), and the z-axis (which rotates the x-axis to the y-axis), respectively. The general orientation in space can be obtained by multiplying , i.e., the Cardan angles. The number of possible rotations for one vector can be represented by a sphere (Figure 3); however, according to the harvester structure, this space can be reduced:
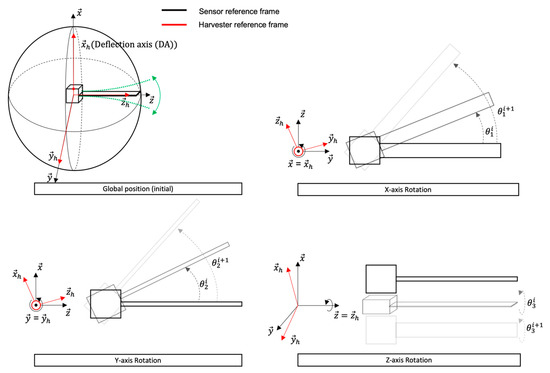
Figure 3.
Harvester orientation in Cartesian space. The rotation around the -axis (deflection) does not impact the deflection direction. The harvested energy is not impacted.
- The harvester has a single degree of freedom. Therefore, it has rotation invariance around the DA, which does not change its direction;
- The harvested energy is independent of the voltage sign (i.e., the acceleration sign). Therefore, it has symmetry invariance, as shown below:
The space of possible orientation is now contained in a hemisphere. Assuming that the DA is equal to the axis, every possible rotation in 3D space can be obtained with
where is the identity matrix.
2.7. Most Relevant Features (MRFs)
As the input signals of the model are not stationary, it is interesting to analyze the features offering optimal harvesting. Depending on the quality factor, the best efficiency is obtained when the harvester operates in its bandwidth. Impulses are relevant to the power harvester because of the large frequency spectrum. They are a frequent occurrence in sports. To determine if impulses were part of the MRFs, they were extracted from the acceleration data and compared to both the total signal energy and the harvested energy of the simulated model. The method is described in Figure 4.
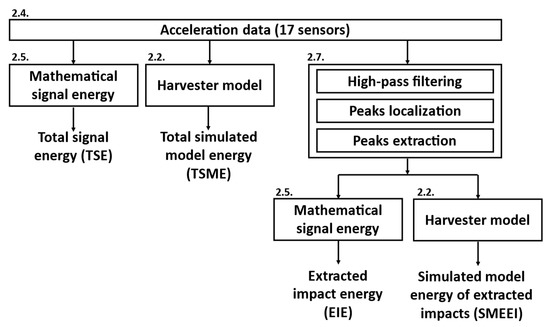
Figure 4.
Flowchart of impact evaluation. The first step consists of calculating the mathematical signal energy and simulating the harvester model energy, using the total acceleration data. The second step consists of extracting the impacts from the acceleration data, and then calculating the new mathematical signal energy and simulating the new harvester model energy. The numbers displayed above the blocks represent the paper sections where the method is discussed.
To extract the impacts from the acceleration data, the first step was performing high-pass filtering, using MODWT and inverse MODWT, to keep the high-frequency components. Then, peak localization was performed with the Matlab findpeaks() function, which gives the local maxima in a sliding window. Finally, using the corresponding peak localization on the acceleration data, the impacts were extracted with an adapted time window. This method is illustrated in the Section 3.
3. Results and Discussion
3.1. Simulation of Harvester Model
The resonant frequency of the first vibration mode of the simulated model was equal to 48.8 Hz, with a phase of −90 degrees. The Bode diagram is shown in Figure 5. Here, only the first vibration mode was considered, as the second mode (~301.5 Hz) was far from the Nyquist frequency of the acceleration data (120 Hz). To accurately simulate the temporal voltage responses, the acceleration data were upsampled using a resampling factor, where the value was chosen to obtain a relative error (RE) of less than 1%. Figure 6 presents the RE for each axis of each sensor.
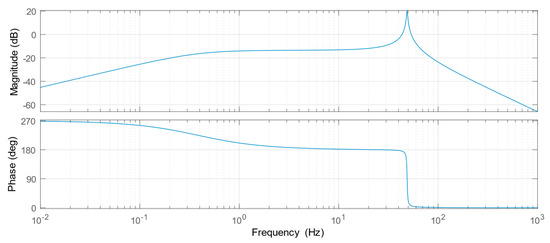
Figure 5.
Bode plot of the harvester model. Peak resonance is observed at 48.8 Hz.
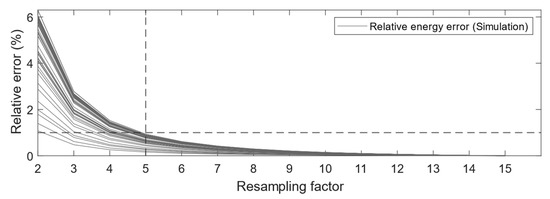
Figure 6.
Relative error in energy simulations according to the resampling factor of the acceleration data. One line is drawn for each of the 17 sensors.
It is suitable to increase the resampling factor to reduce the simulation artifacts, but high values impact the simulation time. Consequently, the value of the factor was fixed to five.
The resampled acceleration data were used as inputs to the harvester model. Figure 7 presents the predicted voltage response using the acceleration data on the y-axis of the left-foot IMU.
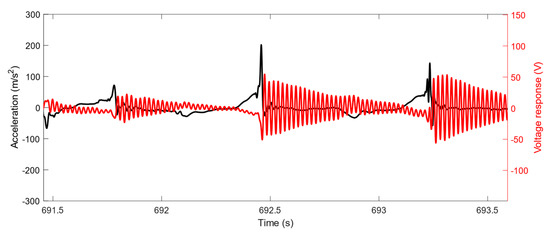
Figure 7.
Acceleration data of the left foot on the y-axis (black) and model voltage response (red). The original data were clipped for illustration purposes.
Observing the temporal response highlights that a brief impact of high acceleration magnitude gave a higher voltage generation. Indeed, impacts present large frequency spectra, which can operate the harvester in its bandwidth. The observed pseudo-periods in the voltage transients, were equal to the resonance frequencies of the harvester.
3.2. Harvester Orientation
Not all sensor locations experienced the same acceleration profiles nor impacts, related to the physical activity of the subject. Depending on the original positioning of the IMUs on the body, the optimal DA orientation was obtained by rotating the local reference frame according to two axes of rotation. Assuming that the DA was aligned with the IMU’s x-axis, Figure 8 presents the orientation influence on energy simulation for the right hand, found by investigating the y- and z-axis rotations (results for all evaluated locations are presented in Figure A1).
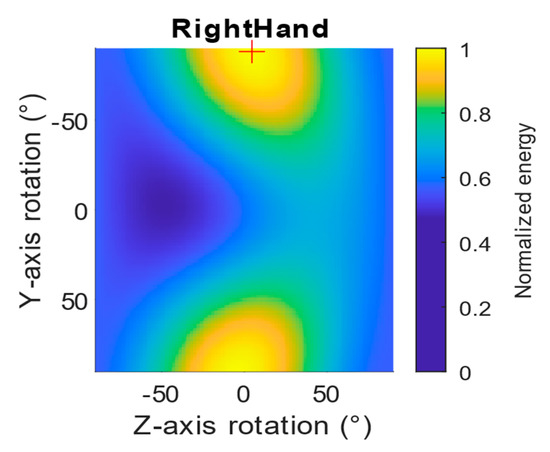
Figure 8.
Orientation influence on harvester normalized energy simulation for the right hand from IMU local reference frame. Optimal orientation is indicated by a red cross. Xsens location labels are used.
Taking the results for the right hand, the optimal DA orientation was obtained with rotations of −88° around the y-axis and 4.5° around the z-axis (Figure 9). In this case, it approximately represented the direction normal to the surface of the hand. The optimal DA orientation was obtained for each location in the same way.
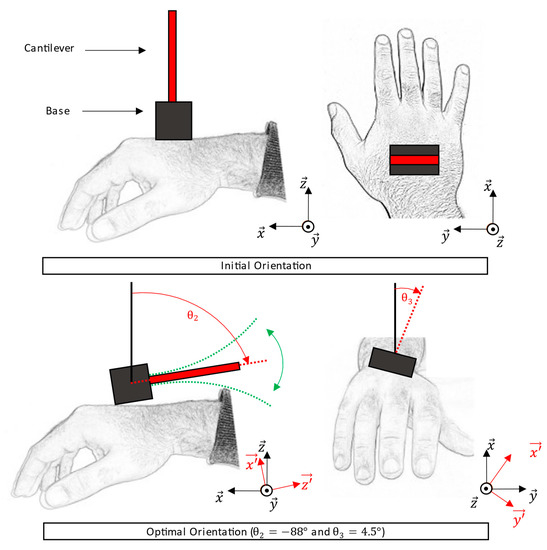
Figure 9.
Initial and optimal orientations of the harvester on the right hand. On the top, the initial fictive placement of the harvester is presented. This position corresponds to the IMU orientation with the DA aligned with . On the bottom, the optimal orientation, according to Figure 8, is presented, with rotation around .
3.3. Body Optimal Placement
By extracting the best orientation for all locations, the optimal placement for harvesting energy based on the simulated actions was evaluated. Figure 10 presents the normalized simulated energy at the 17 sensor locations for optimal DA orientation.
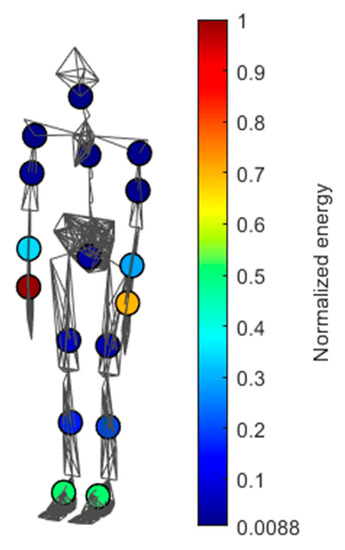
Figure 10.
Normalized energy simulation of the different sensor locations, mapped on the biomechanical model constructed using Xsens. In this case, with a right-handed subject, the best location is the right hand.
Body extremity segments were found to be suitable for energy harvesting. In this study, the best placement was found to be located on the right hand. Hands and feet were both mainly used, and showed various impacts related to the performed sports actions. Shoulders, sternum, head, and upper legs were less relevant.
Moreover, differences between left and right body parts were caused by the non-symmetrical nature of the performed actions, and by the fact that the subject was right-handed.
3.4. Impact Distribution
To better understand the energy simulation results of the harvester model, a time–frequency analysis of the acceleration data was conducted. Figure 11 shows the CWT of the acceleration data of one IMU location, using the Morse wavelet.
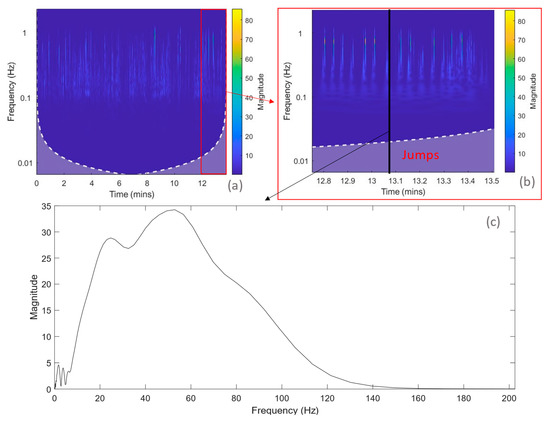
Figure 11.
(a) CWT of acceleration data of the left foot for optimal DA orientation. The Morse wavelet was selected for visualization. (b) Partial visualization of the CWT for illustrating the frequency components present in jumps. (c) Temporal frame of the frequency spectrum of an impact caused by a jump. This figure shows the frequency spectrum repartition for a fixed time.
Frequencies were mainly between 1 Hz and 120 Hz. As mentioned above, frequency band observation was limited by the value of the IMU sampling frequency. For the left foot, magnitudes were higher when the frequency was greater than 10 Hz. Vertical lines, corresponding to impacts related to the subject’s jumps, can be observed. One can observe that the frequency bands of the impacts were relatively large, and the maximum value reached was ~52 Hz.
To assess the influence of impacts on the simulated energy, the method presented in Figure 4 was used. The acceleration data were filtered using the first four frequency bands of MODWT with the Sym4 wavelet, which corresponded to frequencies between 75 Hz and 1200 Hz (due to resampling). The minimum peak value detection was set to 30 , and the minimum space between peaks was set to 50 . Localized peaks were extracted from a centered window of 50 samples (~41 ). Figure 12 presents the original data and their reconstructed signals, based on impacts only.
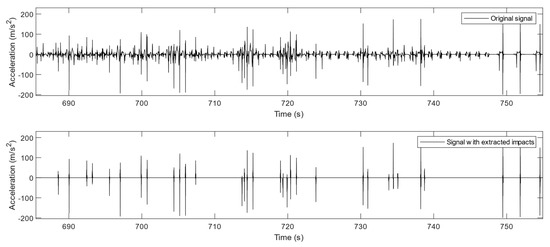
Figure 12.
The graph on the top shows the original resampled acceleration data. The graph on the bottom shows the same signal with the extracted impacts.
The mathematical energy of the original acceleration data was compared to the simulated energy of the harvester model. Figure 13 shows the different normalized energy values for raw acceleration data (TSE) and harvester model simulation (TSME), according to each location.
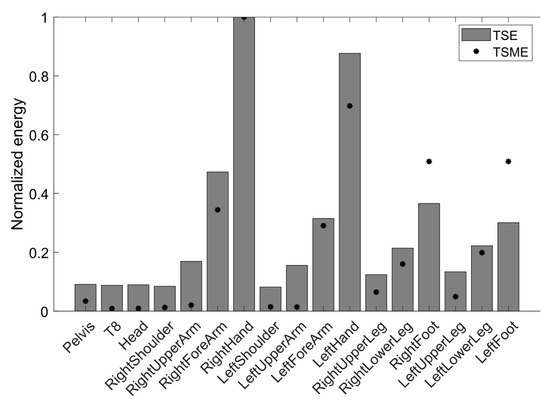
Figure 13.
Normalized energy of acceleration data (TSE) and simulated harvester model (TSME), at different body locations.
Overall, the trends of TSE and TSME were similar. A large value of simulated energy in the harvester model, can be translated as a high mathematical signal energy value. TSE can be seen as a meta-indicator that indicates the presence of suitable locations to harvest energy. Nevertheless, this indicator only allows qualitative observations to be conducted. This observation was then conducted for the extracted impacts. Figure 14 presents the energy ratios obtained from the original acceleration data and the extracted impacts.
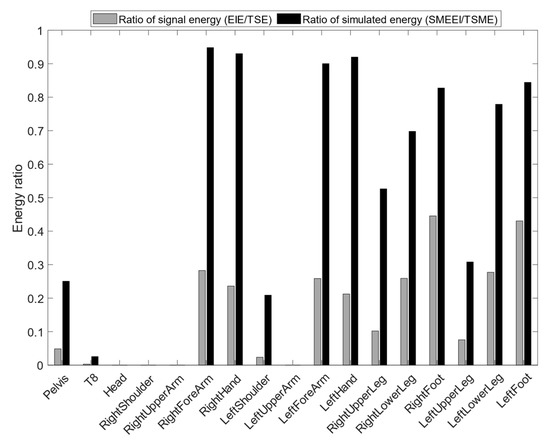
Figure 14.
Ratios of energy from original data and extracted impacts only. The signal energy was obtained using the mathematical energy (Equation (12)), and the simulated energy was obtained using the harvester model simulation.
In locations such as hands and forearms, the impacts caused more than 90% of the simulated energy. The extracted impacts caused less than 30% of the mathematical energy of the original data. More than 70% of the simulated energy for feet and lower legs was caused by impacts. The extracted impacts caused less than 50% of the original mathematical energy. Some locations such as upper arms, head, T8, and shoulders were not affected by impacts, since they had very few detected peaks. Overall, a high simulated energy value was caused by impacts, which could then be considered MRFs. Impact number, period, and amplitude for each location are summarized in Table 3.

Table 3.
Impact characteristics for each location. Mean and standard deviation (SD) are shown for period and amplitude features (mean ± SD).
As mentioned above, impacts affected the extremities of the human body more and occurred more often than once every 3.3 s.
3.5. Limitations and Future Studies
The performed actions could have impacted the results, as the results were based on accelerometer data and harvester parameters. However, identifying impacts as MRFs is relevant, as they are representative of sports activity.
Some aspects, such as IMU sampling frequency, can give a better interpretation of the optimal placement. It was seen that impacts can present many frequencies. Thus, increasing the sampling frequency could make a better acquisition of dynamics possible. In addition, this could allow the model to be simulated with smaller time steps and, thus, predictive precision to be improved. One could then also use this method to quantify the available power, using the model to design sensors for various applications. Additionally, it is also necessary to consider the number of vibration modes to simulate the model, especially if the acceleration frequencies are close to the mode frequencies.
Acceleration data can be biased, due to soft tissue artifacts. Indeed, skin or muscles can add relative movement, depending on the robustness of the fixations. Moreover, impacts can be slightly absorbed or dampened by these tissues. However, the experiments were conducted with acquisition devices mounted on a real person, in the way harvesters could be. The generators can be attached in the same way as the IMUs. Indeed, they have the same mass and a similar size. Typically, in the Xsens MVN Link combination, used to generate data, the IMUs are in plastic cases, attached to the human body by self-gripping strips. Thus, soft tissue artifacts and other defects in the transmission of motion from the human body to the sensor or the energy recovery device, are similar.
Concerning the harvester, the mechanical limits of the beam were not considered. An excessive acceleration value could induce a very large deflection in the beam, causing damage that could lead to loss of performance and eventually to the destruction of the device. Some applications defer the use of casings designed to mechanically limit deflection. Thus, the maximum voltage could be deduced, and used in the method as a constraint.
Ergonomics aspects were not studied in this paper. Nevertheless, the proposed method allows the determination of the optimal configuration and mapping of the distribution of the energy prediction, according to the acceleration measurements. Tradeoffs could be drawn to obtain the best configuration under ergonomic and practical constraints.
Future studies will look at ergonomic and practical validity aspects through experiments.
4. Conclusions
This paper presents a method for determining the optimal placement of cantilevered PEGs, using a numerical model and experimental acceleration data from sports movements. The assumptions and materials used are listed, which could later help other similar studies to be performed under the desired application conditions.
The optimal placement and orientation of a cantilevered PEG were assessed. The results show that, in the current application, the axis normal to the surface of the right hand was the optimal placement. Extremity segments such as the feet, hands, and lower arms were identified as better energy sources. The predicted energy for the foot locations is about 50% of the predicted energy for the right hand location. In general, upper arm and leg locations correspond to less than 20% of the predicted energy of the right hand location. Impacts, among the acceleration data, were identified as relevant features for operating the harvester. Indeed, for the most promising locations, at least 80% of the predicted energy is due to the impacts. They can represent the majority of the available energy sources. The MRFs can be good indicators to quickly determine the variables of interest for qualitative energy source assessment. This method offers more flexibility and ease for the determination of energy sources. There are many databases composed of inertial data (i.e., acceleration), which offer the opportunity to conduct studies on various applications in an easier way. However, when it comes to accurately quantifying simulated values, it is necessary to consider the experimental conditions, to evaluate the quality of the measured acceleration data.
Future studies could focus on the experimental analysis of energy sources. Experimental methods are challenging and cumbersome, because they require high-precision instruments (high-impedance analyzers) and body instrumentation. As compared to the use of IMUs, the range of possible actions and flexibility are reduced.
Author Contributions
Conceptualization, D.H. and G.J.; methodology, D.H. and G.J.; software, D.H.; validation, D.H., G.J. and F.R.; formal analysis, D.H.; investigation, D.H.; resources, D.H.; data curation, D.H.; writing—original draft preparation, D.H.; writing—review and editing, D.H., G.J., J.P., A.-r.A.L. and F.R.; visualization, D.H. and G.J.; supervision, G.J. and F.R.; project administration, G.J. and F.R.; funding acquisition, F.R. All authors have read and agreed to the published version of the manuscript.
Funding
This research was funded by CNRS (GDR-SPORT-AP2020), with the support of ANR, in the framework of the PIA EUR DIGISPORT project (ANR-18-EURE-0022).
Data Availability Statement
The data presented in this study are available on request from the corresponding author.
Conflicts of Interest
The authors declare no conflict of interest.
Appendix A
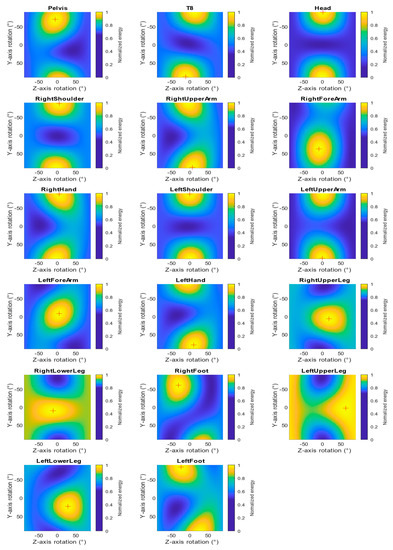
Figure A1.
Orientation influence on harvester normalized energy simulation from IMU local reference frame. Optimal orientation is indicated by a red cross. Xsens location labels are used.
References
- Seshadri, D.R.; Li, R.T.; Voos, J.E.; Rowbottom, J.R.; Alfes, C.M.; Zorman, C.A.; Drummond, C.K. Wearable sensors for monitoring the internal and external workload of the athlete. NPJ Digit. Med. 2019, 2, 71. [Google Scholar] [CrossRef]
- Scataglini, S.; Moorhead, A.P.; Feletti, F. A Systematic Review of Smart Clothing in Sports: Possible Applications to Extreme Sports. Muscle Ligaments Tendons J. 2020, 10, 333. [Google Scholar] [CrossRef]
- Sayem, A.S.M.; Teay, S.H.; Shahariar, H.; Fink, P.L.; Albarbar, A. Review on Smart Electro-Clothing Systems (SeCSs). Sensors 2020, 20, 587. [Google Scholar] [CrossRef]
- Mudiyanselage, S.E.; Nguyen, P.H.D.; Rajabi, M.S.; Akhavian, R. Automated Workers’ Ergonomic Risk Assessment in Manual Material Handling Using sEMG Wearable Sensors and Machine Learning. Electronics 2021, 10, 2558. [Google Scholar] [CrossRef]
- Ranavolo, A.; Draicchio, F.; Varrecchia, T.; Silvetti, A.; Iavicoli, S. Wearable Monitoring Devices for Biomechanical Risk Assessment at Work: Current Status and Future Challenges—A Systematic Review. Int. J. Environ. Res. Public Health 2018, 15, 2001. [Google Scholar] [CrossRef]
- Durmus, Y.E.; Zhang, H.; Baakes, F.; Desmaizieres, G.; Hayun, H.; Yang, L.; Kolek, M.; Küpers, V.; Janek, J.; Mandler, D.; et al. “Side by Side Battery Technologies with Lithium-Ion Based Batteries. Adv. Energy Mater. 2020, 10, 2000089. [Google Scholar] [CrossRef]
- Mohr, M.; Peters, J.F.; Baumann, M.; Weil, M. Toward a cell-chemistry specific life cycle assessment of lithium-ion battery recycling processes. J. Ind. Ecol. 2020, 24, 1310–1322. [Google Scholar] [CrossRef]
- Moreno-Merino, L.; Jiménez-Hernández, M.E.; de la Losa, A.; Huerta-Muñoz, V. Comparative assessment of button cells using a normalized index for potential pollution by heavy metals. Sci. Total Environ. 2015, 526, 187–195. [Google Scholar] [CrossRef]
- Zhao, L.; Li, H.; Meng, J.; Li, Z. The recent advances in self-powered medical information sensors. InfoMat 2020, 2, 212–234. [Google Scholar] [CrossRef]
- Wang, S.; Lin, L.; Wang, Z.L. Triboelectric nanogenerators as self-powered active sensors. Nano Energy 2015, 11, 436–462. [Google Scholar] [CrossRef]
- Proto, A.; Penhaker, M.; Conforto, S.; Schmid, M. Nanogenerators for Human Body Energy Harvesting. Trends Biotechnol. 2017, 35, 610–624. [Google Scholar] [CrossRef]
- Matsunaga, M.; Hirotani, J.; Kishimoto, S.; Ohno, Y. High-output, transparent, stretchable triboelectric nanogenerator based on carbon nanotube thin film toward wearable energy harvesters. Nano Energy 2020, 67, 104297. [Google Scholar] [CrossRef]
- Lossec, M. Multisource Systems for Harvesting Energy in the Human Environment: Modeling and Sizing Optimization. École Normale Supérieure de Cachan—ENS Cachan. 2011. Available online: https://theses.hal.science/tel-00618233/file/Lossec2011.pdf (accessed on 1 January 2023).
- Yuan, J.; Zhu, R. Self-Powered Wearable Multi-Sensing Bracelet with Flexible Thermoelectric Power Generator. In Proceedings of the 2019 20th International Conference on Solid-State Sensors, Actuators and Microsystems & Eurosensors XXXIII (TRANSDUCERS & EUROSENSORS XXXIII), Berlin, Germany, 23–27 June 2019; pp. 1431–1434. [Google Scholar] [CrossRef]
- Tainoff, D.; Proudhom, A.; Tur, C.; Crozes, T.; Dufresnes, S.; Dumont, S.; Bourgault, D.; Bourgeois, O. Network of thermoelectric nanogenerators for low power energy harvesting. Nano Energy 2019, 57, 804–810. [Google Scholar] [CrossRef]
- Satharasinghe, A.; Hughes-Riley, T.; Dias, T. A Review of Solar Energy Harvesting Electronic Textiles. Sensors 2020, 20, 5938. [Google Scholar] [CrossRef]
- Satharasinghe, A.; Hughes-Riley, T.; Dias, T. Solar energy-harvesting e-textiles to power wearable devices. Proceedings 2019, 32, 1. [Google Scholar]
- Rong, G.; Zheng, Y.; Sawan, M. Energy Solutions for Wearable Sensors: A Review. Sensors 2021, 21, 3806. [Google Scholar] [CrossRef]
- Covaci, C.; Gontean, A. Piezoelectric Energy Harvesting Solutions: A Review. Sensors 2020, 20, 3512. [Google Scholar] [CrossRef]
- Poulin-Vittrant, G.; Oshman, C.; Opoku, C.; Dahiya, A.; Camara, N.; Alquier, D.; Hue, L.-P.T.H.; Lethiecq, M. Fabrication and Characterization of ZnO Nanowire-based Piezoelectric Nanogenerators for Low Frequency Mechanical Energy Harvesting. Phys. Procedia 2015, 70, 909–913. [Google Scholar] [CrossRef]
- Tlemcani, T.S.; Justeau, C.; Nadaud, K.; Alquier, D.; Poulin-Vittrant, G. Fabrication of Piezoelectric ZnO Nanowires Energy Harvester on Flexible Substrate Coated with Various Seed Layer Structures. Nanomaterials 2021, 11, 1433. [Google Scholar] [CrossRef]
- Clementi, G.; Lombardi, G.; Margueron, S.; Suarez, M.A.; Lebrasseur, E.; Ballandras, S.; Imbaud, J.; Lardet-Vieudrin, F.; Gauthier-Manuel, L.; Dulmet, B.; et al. LiNbO3 films—A low-cost alternative lead-free piezoelectric material for vibrational energy harvesters. Mech. Syst. Signal. Process. 2021, 149, 107171. [Google Scholar] [CrossRef]
- Aroganam, G.; Manivannan, N.; Harrison, D. Review on Wearable Technology Sensors Used in Consumer Sport Applications. Sensors 2019, 19, 1983. [Google Scholar] [CrossRef]
- Walker, E.J.; McAinch, A.J.; Sweeting, A.; Aughey, R.J. Inertial sensors to estimate the energy expenditure of team-sport athletes. J. Sci. Med. Sport 2016, 19, 177–181. [Google Scholar] [CrossRef]
- Starner, T. Human-powered wearable computing. IBM Syst. J. 1996, 35, 618–629. [Google Scholar] [CrossRef]
- Kim, J.; Byun, S.; Lee, S.; Ryu, J.; Cho, S.; Oh, C.; Kim, H.; No, K.; Ryu, S.; Lee, Y.M.; et al. Cost-effective and strongly integrated fabric-based wearable piezoelectric energy harvester. Nano Energy 2020, 75, 104992. [Google Scholar] [CrossRef]
- Liu, Y.; Khanbareh, H.; Halim, M.A.; Feeney, A.; Zhang, X.; Heidari, H.; Ghannam, R. Piezoelectric energy harvesting for self-powered wearable upper limb applications. Nano Sel. 2021, 2, 1459–1479. [Google Scholar] [CrossRef]
- Elahi, H.; Eugeni, M.; Gaudenzi, P. A review on mechanisms for piezoelectric-based energy harvesters. Energies 2018, 11, 1850. [Google Scholar] [CrossRef]
- Khalifa, S.; Lan, G.; Hassan, M.; Seneviratne, A.; Das, S.K. HARKE: Human Activity Recognition from Kinetic Energy Harvesting Data in Wearable Devices. IEEE Trans. Mob. Comput. 2018, 17, 1353–1368. [Google Scholar] [CrossRef]
- Ju, S.; Ji, C.H. Impact-based piezoelectric vibration energy harvester. Appl. Energy 2018, 214, 139–151. [Google Scholar] [CrossRef]
- Brenes, A.; Morel, A.; Juillard, J.; Lefeuvre, E.; Badel, A. Maximum power point of piezoelectric energy harvesters: A review of optimality condition for electrical tuning. Smart Mater. Struct. 2020, 29, 033001. [Google Scholar] [CrossRef]
- Nastro, A.; Pienazza, N.; Baù, M.; Aceti, P.; Rouvala, M.; Ardito, R.; Ferrari, M.; Corigliano, A.; Ferrari, V. Wearable Ball-Impact Piezoelectric Multi-Converters for Low-Frequency Energy Harvesting from Human Motion. Sensors 2022, 22, 772. [Google Scholar] [CrossRef] [PubMed]
- Zhang, Q.; Liu, Z.; Jiang, X.; Peng, Y.; Zhu, C.; Li, Z. Experimental investigation on performance improvement of cantilever piezoelectric energy harvesters via escapement mechanism from extremely Low-Frequency excitations. Sustain. Energy Technol. Assess. 2022, 53, 102591. [Google Scholar] [CrossRef]
- Baishya, S.; Borthakur, D.; Kashyap, R.; Chatterjee, A. A High Precision Lumped Parameter Model for Piezoelectric Energy Harvesters. IEEE Sens. J. 2017, 17, 8350–8355. [Google Scholar] [CrossRef]
- Erturk, A.; Inman, D.J. Piezoelectric Energy Harvesting; John Wiley & Sons: Hoboken, NJ, USA, 2011. [Google Scholar]
- Skogstad, S.A.; Nymoen, K.; Høvin, M.; Holm, S.; Jensenius, A.R. Filtering Motion Capture Data for Real-Time Applications. In Proceedings of the 13th International Conference on New Interfaces for Musical Expression, NIME’13, Daejeon, Republic of Korea, 27–30 May 2013. [Google Scholar]
- Stone, N.M.; Kilding, A.E. Aerobic Conditioning for Team Sport Athletes. Sports Med. 2009, 39, 615–642. [Google Scholar] [CrossRef]
- Erturk, A.; Inman, D.J. A Distributed Parameter Electromechanical Model for Cantilevered Piezoelectric Energy Harvesters. J. Vib. Acoust. 2008, 130, 041002. [Google Scholar] [CrossRef]
- Roetenberg, D.; Luinge, H.; Slycke, P. Xsens MVN: Full 6DOF Human Motion Tracking Using Miniature Inertial Sensors; Tech. Rep. 1; Xsens Motion Technologies BV: Enschede, The Netherlands, 2009; pp. 1–7. [Google Scholar]
- Myn, U.; Link, M.; Awinda, M. Xsens MVN User Manual; Xsens Motion Technologies BV: Enschede, The Netherlands, 2015. [Google Scholar]
- Pathak, R.S. The Wavelet Transform; Springer Science & Business Media: Berlin, Germany, 2009; Volume 4. [Google Scholar]
- Lilly, J.M. Element analysis: A wavelet-based method for analysing time-localized events in noisy time series. Proc. R. Soc. A Math. Phys. Eng. Sci. 2017, 473, 20160776. [Google Scholar] [CrossRef]
- Percival, D.B.; Mofjeld, H.O. Analysis of Subtidal Coastal Sea Level Fluctuations Using Wavelets. J. Am. Stat. Assoc. 1997, 92, 868–880. [Google Scholar] [CrossRef]
- Lagö, T. Digital sampling according to Nyquist and Shannon. Sound Vib. 2002, 36, 20–22. [Google Scholar]
Disclaimer/Publisher’s Note: The statements, opinions and data contained in all publications are solely those of the individual author(s) and contributor(s) and not of MDPI and/or the editor(s). MDPI and/or the editor(s) disclaim responsibility for any injury to people or property resulting from any ideas, methods, instructions or products referred to in the content. |
© 2023 by the authors. Licensee MDPI, Basel, Switzerland. This article is an open access article distributed under the terms and conditions of the Creative Commons Attribution (CC BY) license (https://creativecommons.org/licenses/by/4.0/).