Abstract
Strong overpressure conditions are widely distributed in the deep Longmaxi Formation (Fm) shale reservoirs in the Southern Sichuan Basin, with pressure coefficients ranging from 1.75 to 2.45. Overpressure plays a positive role in the high yield of shale gas, but a detailed study of its generation mechanism, evolution history, and potential impact on pore development is still lacking. This study’s evidence from theoretical analysis and the logging response method indicates that hydrocarbon generation expansion is the main generation mechanism for strong overpressure. Through the combined analysis of basin modeling, inclusions analysis, and numerical simulation, pressure evolution at different stages is quantitatively characterized. The results show that, during the shale’s long-term subsidence process, the shale reservoir’s pressure coefficient increased to 1.40 because of oil generated by kerogen pyrolysis. Then it increased to 1.92 due to gas generated by residual oil cracking. During the late strong uplift process of the shale, temperature decrease, gas escape, and stratum denudation caused the pressure coefficient to first decrease to 1.84 and then increased to 2.04. Comparing pore characteristics under different pressure coefficients indicates that higher pressure coefficients within shale reservoirs contribute to the maintenance of total porosity and the development of organic macropores, but the influence on the morphology of organic pores is negligible. These results will provide the scientific basis for optimizing sweet spots and guiding shale gas exploration in the study area.
1. Introduction
Abnormal pressures are wildly developed in sedimentary basins, and more than 180 basins with abnormal pressures have been identified worldwide, the vast majority of which are overpressured basins [1,2,3,4]. Overpressure, referring to the fluid pressure significantly higher than a hydrostatic pressure at a given depth, dominates in deeply buried strata [5]. A comprehensive understanding of the generation mechanism and evolution process of overpressure is becoming increasingly important for the research on petroleum geology and the drilling engineering deployment because of its profound impact on the generation, migration, accumulation of oil and gas, and drilling safety [6,7,8,9,10,11,12]. For example, differences in overpressure evolution characteristics (formation time, pressure intensity, and duration time) in Yinggehai Basin and Qiongdongnan Basin, China, are proven to have different degrees of delay effect on the mature and hydrocarbon generation of organic matter [6]. It is suggested that the overpressure related to disequilibrium compaction protects the reservoir quality of the Mexico Gulf basin [7]. The overpressure caused by disequilibrium compaction and hydrocarbon generation expansion in the Bohai Bay basin in China is considered to promote the migration of the oil generated in the Es3u downward to the Es4 reservoirs and improve the efficiency of oil accumulation [12].
With detailed research on shale reservoir characteristics and shale gas enrichment patterns under the different structural settings and sedimentary environments, as well as the application of horizontal well and hydraulic fracturing technology, great progress in China’s shale gas exploration has been made in the Silurian Longmaxi Formation (Fm) shale in Sichuan Basin [13,14,15]. Early exploration focused on shallow formations with burial depths less than 3500 m in the Southeastern Sichuan Basin, where both normal pressure (pressure coefficient < 1.2) and overpressure (1.2 < pressure coefficient < 1.6) exist in shale reservoirs. However, the shale reservoir with economic value is mainly under overpressure conditions. Numerous research has been undertaken on the overpressure characteristics and their impact on shale reservoirs. This suggests that the overpressure was related to gas generated from the retention oil thermal cracking and evolved into normal pressure in some areas due to the late tectonic activity [11,16,17,18]. The existence of overpressure is proven to be in favor of enrichment and high production of shale gas because overpressured shale reservoirs are generally characterized by better reservoir conditions (porosity and pore structure) compared with normally pressured shale reservoirs [19,20].
In recent years, shale gas exploration in the Longmaxi Fm has gradually advanced to deep formations with burial depths ranging from 3500–4500 m in the Southern Sichuan Basin. Exploration. Practice shows that different degrees of overpressure (pressure coefficient > 1.6) exist in deep shale reservoirs, but gas yield between wells varies greatly. The correlation between pressure and gas yield is not linear and clear. The published research attributed it to the differences in hydrocarbon generation conditions and preservation conditions between shale at shallow and deep buried settings, but the potential impact of different overpressure conditions has not been paid attention to [21]. In addition, the understanding of the generation mechanism and evolution process of overpressure in deep shale reservoirs is still inadequate and controversial due to the analysis method. For example, based on the geological background analysis only, overpressure generation is attributed to disequilibrium compaction, tectonic activity, or hydrocarbon generation expansion [22,23,24]. According to the paleo-pressure value obtained by inclusion analysis, some researchers suggested that the pressure coefficient decreased in the uplift stage [25,26]. In contrast, by using basin modeling, other researchers believed that the pressure coefficient increased continuously or remained stable in the uplift stage [27,28]. Additional detailed studies are required to characterize overpressure characteristics and determine their potential impacts on shale reservoirs. The objectives of this study are (i) to identify the main generation mechanism of overpressure by applying multiple methods; (ii) to achieve the whole process characterization of paleo-pressure evolution by using basin modeling, numerical simulation, and paleo-pressure reconstruction, and (iii) to clarify the effects of different strong overpressure conditions on pore development. These results will provide the scientific basis for optimizing sweet spots and guiding shale gas exploration in the study area.
2. Geological Background
The Sichuan Basin is a Palaeozoic oil- and gas-bearing superimposed basin developed on the upper Yangtze Craton, covering an area of more than 18 × 104 km2 (Figure 1). The basin in the north is connected with Micang Mountain and Daba Mountain, and the southern part is situated adjacent to Daxiangling Mountain. The western part connects to Longmen Mountain, whereas the eastern part is bounded by the Hubei-Hunane-Guizhou fold belt. Divided by the Huayingshan and Longquanshan anticlines, the basin is divided into six secondary tectonic units (including the north, east, south, southwest, west, and central zones).
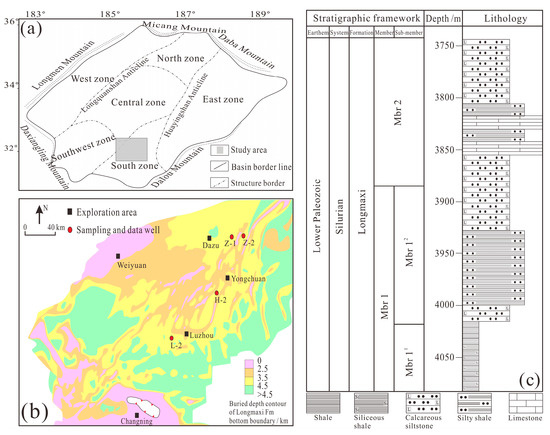
Figure 1.
(a) Structure division of Sichuan Basin and the location of the study area; (b) geological map of the southern Sichuan Basin, showing the present-day burial depth of the Silurian Longmaxi Fm shale and the locations of sampling and data wells; (c) stratigraphic column of the Lower Silurian Fm of Well H-2 in the study area.
Two tectonic stages are responsible for the evolution of the Sichuan Basin: the Early Palaeozoic to Triassic cratonic depression stage and the Late Triassic to Eocene foreland basin stage. The present tectonic pattern was formed under the control of a series of tectonic movements, including Caledonian (late Sinian-Silurian), Hercynian (Devonian-Permian), Indosinian (Triassic), Yanshanian (Jurassic-Late Cretaceous), and Himalayan (Paleogene-Quaternary). The Sichuan Basin is covered by the strata from the Neoproterozoic to the Quaternary. The Early Palaeozoic to Triassic cratonic depression deposits consist of marine carbonates, and that of the Late Triassic to Eocene foreland basin mainly consists of continental clastic rocks. During the Early Silurian, the south zone of the Sichuan Basin was in a shallow to deep water continental shelf environment, forming a set of thick shale (Longmaxi Fm shale) with a thickness of approximately 300 m. According to cycle characteristics, the Longmaxi Fm shale can be divided into the upper (Member 2 (Mbr 2)) and lower (Mbr 1) two members. From the bottom up, the lithology of the Mbr 1 of Longmaxi Fm shale changes from black organic-rich siliceous shale to grey organic-poor silty shale and calcareous siltstone (Figure 1). Based on cycle characteristics and lithologic changes, the Mbr 1 of Longmaxi Fm shale can be further divided into the upper (Mbr 12) and lower (Mbr 11) two sub-members.
The deep shales studied in this paper come from the Luzhou, Yongchuan, and Dazu areas in the southern Sichuan Basin (Figure 1). The burial depth of the Longmaxi Fm shale in the Southern Sichuan Basin is mainly influenced by regional tectonic activity. Unlike the shale in Changning and Weiyuan areas which have experienced late strong uplift and are now buried at a shallow depth of 2000–3500 m, the study area has experienced relatively little uplift, so the shales are buried at a deep depth of 3500–4500 m. The study area, especially the Luzhou area, is in the depositional center of the deep-water shelf during the Early Silurian, and the thickness of shales exceeds 400 m. The TOC content of shale ranges from 0.4–18.4%, with an average value of 2.5%, and the high TOC section is concentrated in the Mbr 11 of Longmaxi Fm [29]. The thermal evolution of the shale has reached a highly over-maturity stage, with the average equivalent vitrinite reflectance over 2.4% [30]. The development degree of large faults and the intensity of tectonic activity in the study area are both relatively lower, and the overpressure is widely distributed, making it a tectonically stable area suitable for shale gas enrichment and accumulation. Overall, the deep Longmaxi Fm shale gas reservoir in the study area has both excellent hydrocarbon generation and preservation conditions. Therefore, a key area and a major target layer for future shale gas exploration in the Sichuan Basin.
3. Samples and Analytical Methods
3.1. Overpressure Analysis Method
In this study, the measured pressure data of over 26 horizontal wells were collected from the PetroChina Research Institute of Petroleum Exploration & Development-Langfang to investigate the characteristics of overpressure. Well-log data, including sonic, resistivity, and density, from four typical Wells (L-2, H-2, Z-1, and Z-2) in the study area were selected to analyze the overpressure distribution and identify its generation mechanism. The logging analysis methods used include the logging curve combination method and the density vs. vertical effective stress plots method. The effective vertical stress (MPa) in shale is determined by subtracting the pore pressure calculated by the Eton (1972) method from the pore fluid pressure obtained by density logging [31].
3.2. Basin Modeling Method
This study used one-dimensional basin modeling in PetroMod® 2016 Software to reconstruct the burial, thermal, and maturity evolving histories of representative Well H-2. In the burial history modeling, the parameters to be input include the burial depth of the top and bottom boundary, lithology and absolute age of each stratum, and the start and end time and denudation thickness corresponding to the denudation event. These data were acquired by drilling and seismic data, as well as published research results. Relevant research pointed out the erosion thickness of the middle Silurian to early Permian, the late Permian, the late Triassic, and the late Cretaceous to nowadays in the study area are 300 m, 200 m, 400 m, and 2800 m, respectively [30,32]. The thermal and maturity evolution histories modeling was achieved by EASY% Ro [33]. The parameters that need to be determined include present-day heat flow and paleo-heat flows, the latter of which is acquired according to published research results. The results show that the heat flow value in the study area was at a relatively low stage (46~54 mW/m2) in the early Paleozoic, reached the peak (60~80 mW/m2) at about 259 Ma, gradually declined during the late Permian to the late Triassic, and then maintained a nearly stable heat flow (average 53 mW/m2) to the present day [30,34,35]. The present-day heat flow calculated by the geothermal gradient and thermal conductivity of rock was provided by the PetroChina Research Institute of Petroleum Exploration & Development-Langfang, which is 53.8 mW/m2. Finally, the measured equivalent vitrinite reflectance (Reqv) was used to calibrate the modeling results.
3.3. Fluid Inclusions Analysis Method
To obtain information on trapping temperature and trapping pressure, one typical fibrous calcite vein in the core from the Mbr 11 of Longmaxi shale with burial depths of 4028.5 m was collected from Well H-2 for systematic fluid inclusion analysis (petrographic observation, Raman spectral analysis, and micro-thermometric analysis) and calculation. Firstly, the core sample was prepared as thick, doubly polished sections approximately 100 μm in thickness. Secondly, a NIKON-LV100 microscope equipped with transmission white light and incident ultraviolet light (UV) source was used to observe the types and morphological characteristics of fluid inclusions. Thirdly, some single-phase methane inclusions were selected for laser Raman analysis to determine the Raman band shift (Vd) of host minerals and fluid composition, which was conducted using a JY/Horiba LabRAM HR800 Raman system equipped with a frequency-doubled Nd: YAG laser (532.06 nm). The Vd of methane was taken into the formula fitted according to the experimental results [36] to calculate its density. The formula is as follows:
where represents the density of methane inclusions (g/cm3) and D (cm−1) is the difference between the measured peak position of methane in inclusion (Vd) and the known peak position of methane near zero pressure (V0). The lab reference shift V0 for our laboratory is 2917.52 cm−1.
Then, some two-phase aqueous inclusions that coexisted with methane inclusions were selected for micro-thermometric analysis to obtain the homogenization temperature (Th) and determine the trapping temperature, which was conducted on a calibrated Linkam THM600 heating−freezing stage with a heating rate of 5 °C/min. Finally, the equation of state for the supercritical methane system established by Duan et al. (1992) was used to calculate trapping pressure [37]. Only high-density and high-purity methane inclusions were selected for calculation. The equation is as follows:
where Z is the compression factor; P is the pressure (bar); T is the temperature (K), V is the molar volume (dm3/mol) calculated by molar mass and the density of methane inclusions; R is the gas constant (0.08314467 bar·dm3·K−1·mol−1); Pr and Tr are the relative pressure and temperature, respectively; Pc and Tc are the critical pressure (46 bar) and temperature (190.4 K), respectively.
3.4. Pore Characteristics Analysis Method
To determine the control effect of different strong overpressure conditions on pore development, a comparative study of three overpressured shale reservoirs (Well L-02 with a pressure coefficient of 2.24, Well H-2 with a pressure coefficient of 2.04, and Well Z-2 with a pressure coefficient of 1.86) was conducted. The relative position of the three wells can be seen in Figure 1. A total of 22 core samples from the Mbr 11 of Longmaxi Fm shale of three typical wells were selected for analytical testing. The samples came from a 3850–4320 m depth interval, and the lithology is black shale. The mineral composition was quantitatively analyzed by using Bruker D8-AdvanceX-ray diffractometer. Before the test, the shale samples were crushed into powders with a grain size of <150 μm. All tests were carried out under the SY/T 5163–2010 standard. The total organic carbon (TOC) content was measured by a Leco CS230 carbon/sulfur Analyzer based on the Chinese national standard GB/T 19145-2003. Before analyzing, all samples were crushed into less than 100 mesh and pretreated with hydrochloric acid for 48 h to remove the inorganic carbon. Total porosity measurements were carried out with Ultrapore-300 using a helium expansion method. Several samples with similar material composition were argon-ion-milled with Gatan 600 DuoMill using a custom-designed sample holder and then observed and analyzed using Focused ion beam-Scanning Electron Microscopy (FIB-SEM, Quanta 200F) in low vacuum mode at the PetroChina Research Institute of Petroleum Exploration & Development. Considering the heterogeneity of shales, 60 evenly spaced pictures were taken within the sample to document the morphology and organic pores. All the experiments were performed at a humidity and temperature of 35% and 25 °C, respectively. SEM image analysis was implemented on Avizo® 2019 Software. By adjusting the threshold of images, organic pores were extracted to further carry out the pore shape coefficient and pore size distribution analysis. The pores’ shape coefficient is calculated according to the following equation: 4*PI*A/P2 where PI is Π; A is the area of the region, and P is the perimeter of the region.
4. Results
4.1. Well-Log Response Characteristics of Overpressure
The pressure coefficient (the ratio of actual fluid pressure to normal hydrostatic pressure at the same depth) is applied to quantify the intensity of fluid pressure in this study. The pressure coefficient between 1.2 and 1.8 is regarded as overpressure, and a value greater than 1.8 is regarded as strong overpressure. The plots of pressure coefficients and fluid pressures versus depths are presented in Figure 2. It can be seen that the fluid pressures of the Mbr 11 of Longmaxi Fm shale are higher than hydrostatic pressures with pressure coefficients ranging from 1.79–2.42, indicating strong overpressure is wildly developed in the study area. Secondly, significant variation in pressure coefficient can be observed even at a similar burial depth, indicating that the evolution of fluid pressure is complex and different among different gas reservoirs.
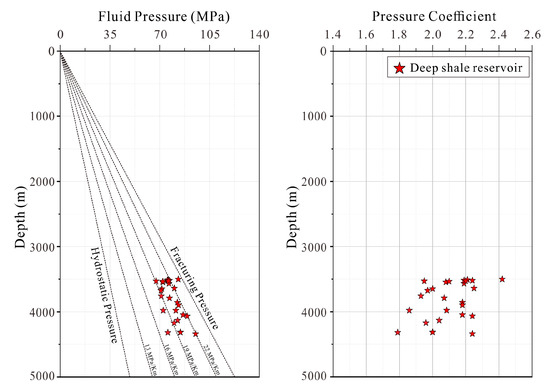
Figure 2.
Plots of measured pressure and corresponding pressure coefficient versus depth in the study area show strong overpressure development in deep shale reservoirs.
For shale with normal pressure, an enhanced compaction effect with increasing depth will cause acoustic travel time to decrease and density to increase. In contrast, the existence of overpressure will weaken the compaction effect and cause the logging response characteristics to deviate from the normal compaction trend. Therefore, shale overpressure is commonly identified based on wireline logging methods and confirmed by measured pore pressure data where available. In addition, combining sonic, density, and resistivity logging is necessary to identify overpressure development because the abnormal trend of single logging response may be affected by other factors. In this study, one representative Well, H-2, with a pressure coefficient of 2.04, is investigated for its well-logging responses to overpressures in the Longmaxi Fm shales to gain insights into the fluid pressure distribution and the mechanism of overpressure generation. The profiles of sonic, resistivity, and density data, as well as measured fluid pressure data, are shown in Figure 3. It can be seen that the sonic log data of the Mbr 11 of Longmaxi Fm shales display obvious responses to strong overpressure, which have longer acoustic travel time than the normally pressured shales for the corresponding depth. The density log data of the shale with anomalously high acoustic travel time also respond to the strong pressure, which shows an abnormal decreasing trend. The resistivity log data indicate that overpressured shales show abnormally increased trends compared with normally pressured shales identified by the sonic and density log responses. Based on the sonic, density, and resistivity log response and measured pressure data, the top of the strong overpressure in this well can be placed at 4015 m.
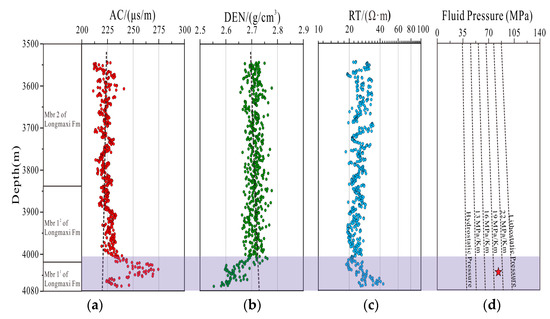
Figure 3.
Comprehensive shale compaction curves of Well H-2, including (a) Acoustic transit time [AC], (b) Density [DEN], (c) Resistivity [RT], (d) Fluid pressure data from drill stem test (DST), indicating strong overpressure develops in the Mbr 11 of Longmaxi Fm shale. The red pentagram within (d) represents the measured fluid pressure of 81.63 MPa.
4.2. Burial and Thermal Histories Modeling
Basin modeling results are presented in Figure 4. It can be seen the burial history of Longmaxi Fm shale in the study area can be divided into two stages: (1) long-term subsidence stage (444–65 Ma), during which shale experienced two rapid subsidence (444–432 Ma and 260–240 Ma), two slow subsidence (298–264 Ma and 227–65 Ma) and three weak uplifts (432–298 Ma, 264–260 Ma, and 240–227 Ma). By the end of 65 Ma, the shale depth reached 6800 m; (2) late strong uplift stage (65–0 Ma), during which shale experienced a continuous strong uplift and denudation and reached the current burial depth of about 4100 m (Figure 4a). Sedimentation rate modeling indicates that the study area has relatively lower sedimentation rates (less than 100 m/Ma) during the slow subsidence periods and reached more than 354 m/Ma and 135 m/Ma in the late Silurian and Early Triassic rapid subsidence periods, respectively (Figure 4b).
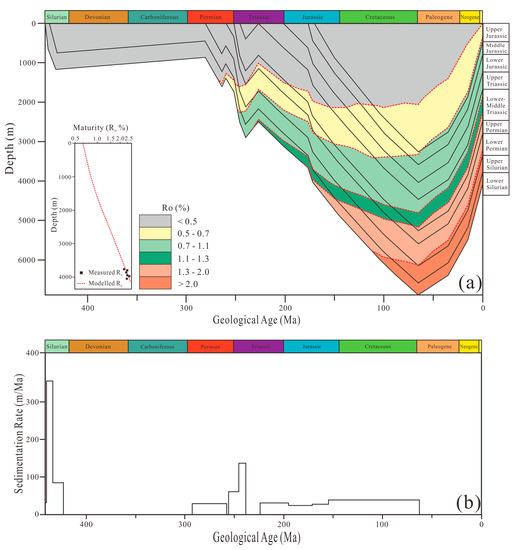
Figure 4.
Modeling and calibration results. (a) The burial, thermal, and maturity evolution history of Well H-2; (b) Sedimentation rate of Well H-2, showing more than 354 m/Ma and 135 m/Ma in the late Silurian and Early Triassic rapid subsidence periods, respectively.
The thermal and maturity evolution history of the Longmaxi Fm shale in the study area can also be divided into two stages, corresponding to the burial history: (1) temperature increasing stage (444–65 Ma), the formation temperature increased from 25 °C to 211 °C, and the maturity of organic matter increased from 0.2% to 2.7%. It can be subdivided into five stages according to the difference in the maturity of organic matter: immature stage (444~280 Ma), low-mature stage (280~246 Ma), mature stage (246~195 Ma), high-mature state (195~117 Ma), and over-mature state (117~65 Ma); (2) cooling stage (65–0 Ma), the formation temperature decreased from 211 °C to 129 °C, and the thermal maturity process tended to stop. The good agreements between modeled and measured Ro values indicate the appropriateness of related parameters and modeling results (Figure 4).
4.3. Fluid Inclusion Analysis
4.3.1. Petrographic Observations
At room temperature, fluid inclusion assemblages observed in fibrous calcite veins consist of single-phase methane inclusions and two-phase aqueous inclusions (Figure 5). The methane inclusions occurred a lot in veins and were predominantly quadrangle and sub-rounded with diameters ranging from 3–20 μm, appearing either in groups or isolated. Most of the methane inclusions were bright in the middle and grayish-black at the edge and had relatively low transparency, whereas a few inclusions were almost completely opaque (Figure 5a,b). The two-phase aqueous inclusions were elongated quadrangle, rhombic, and irregular shapes with long axis ranging from 3–10 μm and were generally alongside methane inclusions (Figure 5c,d). This phase coexistence in the same fluid inclusion assemblage indicates that fluid inclusions were trapped during a two-phase immiscible field, and the aqueous inclusions were methane saturated. Therefore, the measured homogenization temperatures of the aqueous inclusions represent the trapping temperatures of inclusion.
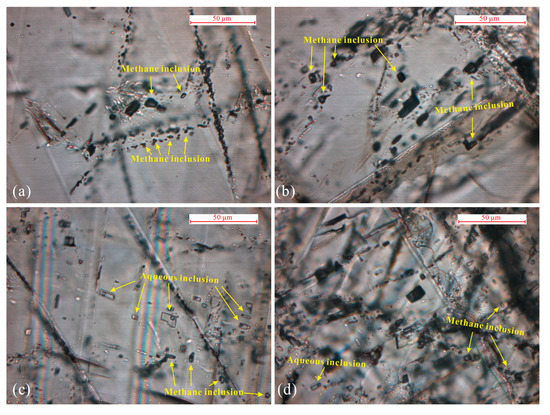
Figure 5.
Occurrences and morphologies of representative methane inclusions (a,b) and aqueous inclusions (c,d) in fibrous calcite veins within the Mbr 11 of Longmaxi Fm shale of well H-2, Southern Sichuan Basin.
4.3.2. Raman Spectroscopy Analysis
After petrographic observation, several single-phase methane inclusions with relatively regular morphology and complete preservation were selected to check components and calculate density by Raman spectroscopy analysis. In the Raman spectra, only high-intensity peaks of methane and host mineral calcite can be observed, indicating the high purity of the methane inclusions (Figure 6). The trapping pressure calculation of fluid inclusions is greatly influenced by fluid components. The calculation of single-component inclusions is relatively accurate, whereas that of multi-component inclusions would not be precise due to the difficult estimation of the concentration of each component [38]. The methane inclusions found in this study were confirmed to be of high purity, providing favorable conditions for accurate calculation. The measured Raman band shift (Vd) of the methane inclusions is 2911.28 cm−1. Taking the Vd into empirical formulae, the corresponding inclusion density is calculated to be 0.2640 g/cm3, which indicates that it belongs to supercritical high-density methane inclusions and is suitable for capture pressure calculation.
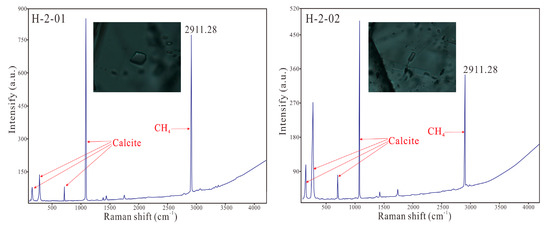
Figure 6.
Laser Raman spectra of the methane inclusions in fibrous calcite vein within the Mbr 11 of Longmaxi Fm shale of Well H-2, Southern Sichuan Basin. The Raman scattering peaks representing the host mineral calcite are 156 cm−1, 283 cm−1, 713 cm−1, and 1086 cm−1.
4.3.3. Microthermometry and Trapping Pressure Calculation
Before trapping pressure calculations, the capture temperature of methane inclusion needs to be determined. Previous research suggested that the lowest homogenization temperature of two-phase aqueous inclusions coexisted with methane inclusions in immiscible fluid inclusions was the trapping temperature [16,39]. Therefore, this study selected two-phase aqueous inclusions that coexisted with methane inclusions for micro-thermometric analysis, and the homogenization temperatures’ results are presented in Figure 7. It can be seen that homogeneous temperature distribution is unimodal, varying from 165 °C to 189 °C. Taking the density of methane inclusions analyzed by Raman spectroscopy and the measured minimum homogenization temperature of aqueous inclusions into the equation of state, the calculated trapping pressure and corresponding pressure coefficient are 95.21 MPa and 1.84, respectively (Table 1).
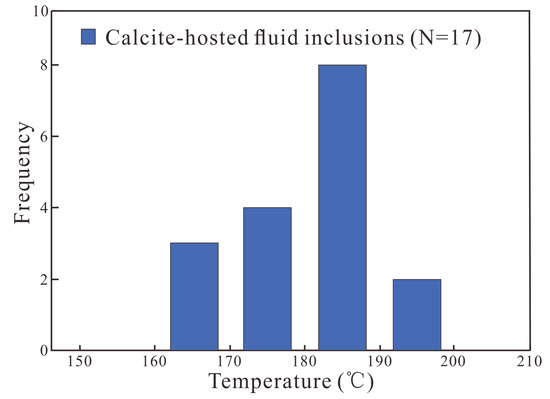
Figure 7.
Histograms for homogenization temperature of fluid inclusions obtained from the Mbr 11 of Longmaxi Fm shale in Well H-2. N indicates the total number of fluid inclusions tested.

Table 1.
Analysis and calculation results of representative methane inclusions in fibrous calcite vein from Well H-2 in the Southern Sichuan Basin.
4.4. Shale Reservoir Characteristics
4.4.1. TOC Content and Mineral Composition
Table 2 shows that overpressured shale samples from three related wells have similar TOC contents and mineral composition. The TOC contents of samples from Well L-2, Well H-2, and Well Z-2 range from 1.78–5.79 %, 2.03–5.88%, and 1.53–5.10%, with average values of 3.20%, 3.39%, and 2.94%, respectively. The TOC contents increase with the increase of buried depth and exhibit a negative correlation with the density logging response (Figure 8). The mineral compositions are dominated by siliceous minerals (including quartz and feldspar), ranging from 55.5–73.3%, 40.7–85.4%, and 42.7–72.7%, with average values of 63.1%, 63.0%, and 56.2%, respectively. This is followed by clay minerals, ranging from 16.4–32.8%, 9.9–43.3%, and 21.3–32.2%, with average contents of 25.9%, 27.5%, and 26.3%, respectively. The content of carbonate minerals (including calcite and dolomite) is the lowest, ranging from 16.4–32.8%, 9.9–43.3%, and 21.3–32.2%, with average values of 25.9%, 27.5%, and 26.3%, respectively. Their lithofacies belong to siliceous shale and mixed shale.
Table 2.
Total organic carbon content, mineral composition, and total porosity data of three representative Mbr 11 of Longmaxi Fm shale reservoirs located in the Southern Sichuan Basin.
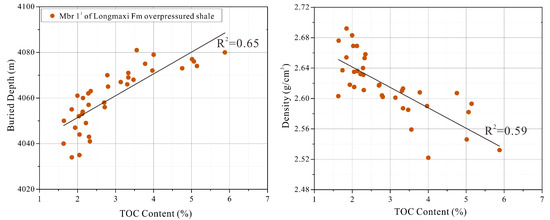
Figure 8.
Cross-plots of buried depth and logging density versus TOC content in 4020–4100 m interval of the Mbr 11 of Longmaxi Fm shale of Well H-2. The strong correlation between density and organic matter abundance indicates that overpressure and organic matter enrichment control density.
4.4.2. Total Porosity and Organic Pores Characteristics
The total porosity results of three groups of samples are presented in Table 2. The pore development of Well L-2 is relatively better, with porosity ranging from 4.54–7.03% (averaging 5.57%), followed by Well H-2, with porosity ranging from 2.95–5.25 % (averaging 4.28%). The pore development of Well Z-2 is relatively poorer, with the porosity ranging from 1.92–4.12%, with an average of 3.01%. The cross plots of total porosity with TOC content, clay minerals, and siliceous minerals show that the porosity of Well L-2 is generally higher than that of Well Z-2, even under the same TOC content and mineral compositions (Figure 9).
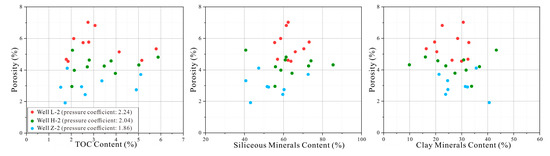
Figure 9.
A comparison of the total porosity of shale reservoirs with similar material composition and different pressure coefficients illustrates that the L-2 shale reservoir with a pressure coefficient of 2.24 has a relatively higher total porosity, and the Z-2 shale reservoir with a pressure coefficient of 1.86 has relatively lower total porosity.
According to FIB-SEM results (Figure 10), the organic pore in the Mbr 11 of Longmaxi Fm overpressured shale is the intrarenal pore developed in organic matter with round, elliptic, and crescent shapes. The image analysis results of the three groups of samples show that there is no significant statistical difference in the percentage of organic pores with different shape coefficients, but the percentage of organic pores with different diameters changes greatly (Figure 11). The percentages of organic pores with shape coefficients greater than 0.7 are all greater than 65%, and the percentages between 0.4 and 0.7 are about 25%. This characteristic indicates that organic pores in the deep Longmaxi Fm shale are mainly round and oval, and irregular pores are relatively limited. The pore size distribution of organic pores among three groups of samples exhibits a significant decrease trend. The size of organic pores in Well L-2 is the largest, and its percentages of diameters larger than 100 nm, ranging from 50–100 nm, and smaller than 50 nm are 56.10%, 21.19%, and 22.71%, respectively. Followed by Well H-2, the percentages are 15.09%, 68.18%, and 16.72%, respectively. The size of organic pores in Well Z-2 is the smallest, and the percentages are 13.89%, 29.88%, and 56.24%, respectively.
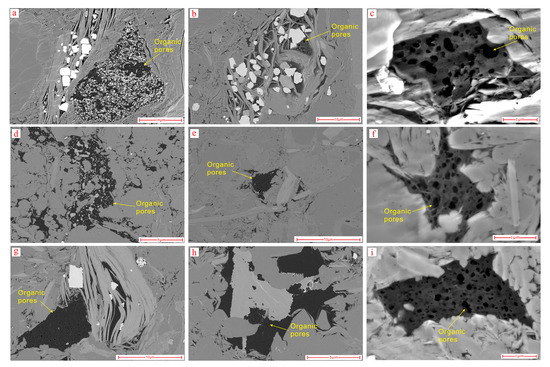
Figure 10.
Comparison of the morphology of organic pores in the Mbr 11 of Longmaxi Fm shale reservoirs with different pressure coefficients. (a–c) Well L-2 with a pressure coefficient of 2.24; (d–f) Well H-2 with a pressure coefficient of 2.04; (g–i) Well Z-2 with a pressure coefficient of 1.86.
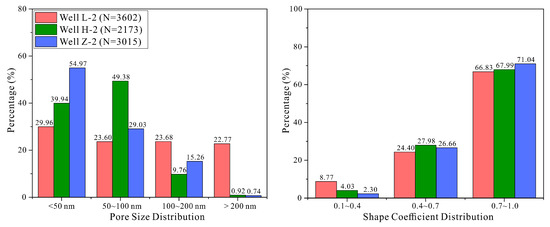
Figure 11.
Based on FIB-SEM image analysis, comparing the structural characteristics of organic pores in the Mbr 11 of Longmaxi Fm shale with different pressure coefficients. A higher proportion of organic macropores occur in shale reservoirs with a higher pressure coefficient. However, no differences are presented in shape coefficient distribution, illustrating the positive impact of the pressure coefficient on the pore size distribution of organic pores and the limited impact on pore morphology. N represents the total number of organic pores counted.
5. Discussion
5.1. Generation Mechanism for Strong Overpressure
Theoretical analysis and numerical simulation analysis based on geological conditions and distribution characteristics of overpressure are commonly utilized in the early research of analyzing overpressure generation mechanisms in the study area. However, the above two methods actually belong to indirect analysis methods, often resulting in many differences and uncertainties in determining the mechanism. For example, Liu et al. (2015) found that overpressured Longmaxi Fm shale had abnormally high porosity and was characterized by “under-compaction” and thus proposed that disequilibrium compaction was the main generation mechanism of overpressure [22]. Liu et al. (2016) believed that Longmaxi Fm shale experienced rapid uplift in the late stage without fluid escape, resulting in the maintenance of fluid pressure, the rapid reduction of overburden pressure, and the apparent increase of pressure coefficient and then suggested tectonic activity played an important role in overpressure generation [23]. Chen et al. (2016) concluded that hydrocarbon generation expansion was the main mechanism because the Longmaxi Fm shale was characterized by a high abundance of organic matter and thermal maturity [24]. In recent years, geophysical logging response methods (logging combination method, Bowers method, acoustic velocity density cross mapping method) have been widely used in many overpressure basins around the world because it provides direct evidence for identifying the main mechanism [4,12,40,41]. In this section, the combined evidence from theoretical analysis and logging response method indicates that hydrocarbon generation expansion is the main mechanism of strong overpressure in deep Longmaxi Fm shale in the Southern Sichuan Basin.
The generation mechanisms of overpressure mainly include disequilibrium compaction, hydrocarbon generation expansion, diagenesis (clay mineral transformation), and tectonic compression. The overpressure related to disequilibrium compaction generally occurs in thick mudstone, marl, and shale successions with low penetrability [42,43]. High sedimentation rates are essential for this mechanism, resulting in a rapid increase in overburden pressure [44]. In this case, overpressure would develop if fluids cannot be expelled sufficiently and rapidly. Basin modeling indicates that sedimentation rates of the study area are relatively higher only in the early-middle Silurian (444–432 Ma) and early-middle Triassic (254–241 Ma), with values more than 100 m/Ma (Figure 4b). Therefore, the generation of strong overpressure should be earlier than 241Ma, if caused by disequilibrium compaction. The maintenance of overpressure in a basin depends on the competition of overpressure generation and dissipation mechanisms. The study area experienced four tectonic uplifts, especially the fourth continuous strong uplift, which lasted from the Late Cretaceous to the present day, with a denudation thickness of over 2000 m. The temperature decrease and gas escape during this process may cause the overpressure caused by disequilibrium compaction to dissipate to a certain extent. Therefore, theoretically, disequilibrium compaction is unlikely to be the main mechanism of strong overpressure generation.
Clay mineral transformation in the diagenetic stage causes the orientational arrangement of minerals, further weakening the framework strength of rock particles and shifting compressive load from matrix to pore fluids [45]. In this case, overpressure will develop if pore fluid cannot be expelled in time. However, lithofacies paleogeography research suggested that the study area was in a semi-deep to deep water shelf environment in the Early Silurian and mainly developed siliceous shale [46,47]. The test results of mineral composition in this study are consistent with the above conclusion (Table 2). The average content of siliceous minerals in the Mbr 11 of Longmaxi Fm shale is as high as 53.5% to 63.1%, and the average content of clay minerals is between 25.9% and 29.3%. Therefore, it is doubtful that the transformation of relatively limited clay mineral content can generate strong regional overpressure and maintain it till now.
Structural compression can increase the minimum horizontal stress and cause overpressure similar to the vertical disequilibrium compaction mechanism [48]. The following three reasons theoretically indicate that tectonic compression is unlikely to contribute to strong overpressure. Firstly, the study area is located in the stable structural belt within the basin, with relatively lower tectonic activity intensity. Secondly, the current exploration area is mainly distributed in the core of the wide gentle syncline, and its tectonic compression deformation is relatively lower. Finally, the overpressure distribution shows that strong overpressure only occurs in the Mbr 11 of Longmaxi Fm reservoir with gas saturated but not in the adjacent water-saturated reservoirs. These distinct pressure states within the two reservoirs negate the tectonic compression mechanism.
Overpressure related to hydrocarbon generation expansion occurs when the volume increase rate due to hydrocarbon generation exceeds the volume loss rate caused by hydrocarbon migration and expulsion [49,50]. The magnitude of overpressure generated by this mechanism is controlled by organic matter abundance, type, thermal maturity, and rock permeability [42,51]. The Mbr 11 of Longmaxi Fm shale in the study area was deposited under the deep-water shelf environment, which is characterized by large single-layer thickness (more than 60 m) and stable lateral distribution. The microscopic organic components are dominated by sapropelinite (above 90%), indicating type I kerogen. The TOC contents range from 1.53–5.88%, with an average value higher than 3.30%. The calculated average equivalent vitrinite reflectance exceeds 2.40%, indicating the shale has reached the over-mature stage. Thermal evolution history modeling revealed that oil generation in Longmaxi Fm shale in the study area mainly occurred during 247–192 Ma, and gas generation mainly occurred during 163–65 Ma. The above factors provide theoretical evidence for the generation of strong pressure due to hydrocarbon generation expansion in the study area.
Overpressures with different mechanisms can be determined by the comprehensive analysis of logging curves due to their unique logging response characteristics. Overpressure caused by disequilibrium compaction is considered to inhibit sediment compaction and maintain primary pores and pore water contents [3], resulting in abnormally low density and resistivity and abnormally high acoustic travel time compared with logging response in normal pressure. In comparison, overpressure related to hydrocarbon generation expansion, especially when sediments are compacted and pore water is replaced by hydrocarbon, presents abnormally high resistivity and acoustic travel time and slightly decreasing density on wireline logs [4]. The transformation of clay minerals destroys and changes the microstructure of shale, resulting in abnormally increasing density and acoustic travel time on wireline logs [45]. Tectonic compression further strengthens the compaction effect of rocks, so the overpressure related to this mechanism will not cause apparent anomalies in the three logging responses [52]. In deep Longmaxi Fm shale, the acoustic travel time and resistivity data in the strong overpressured systems show an apparent increase compared with those in normally pressured zones, and the density data present a certain decrease (Figure 3). These characteristics indicate that strong overpressure is closely associated with hydrocarbon generation expansion. In addition, it is worth noting that density is not only related to overpressure but controlled by material composition. There is a good negative correlation between the TOC and density of Well H-2 (Figure 8), which indicates that overpressure related to hydrocarbon generation expansion and the enrichment of organic matter together lead to the abnormal reduction of density logging response.
Density-vertical effective stress cross plots can effectively identify the different generation mechanisms of overpressure [53,54]. For normally compacted stratum, increasing trends are presented in both effective vertical stress acting on the rock matrix and density with increasing depth, which forms a loading curve. Compaction is impeded for the overpressured strata with disequilibrium compaction origin, which will simultaneously reduce density and effective vertical stress. Therefore, the data points of the overpressured stratum that experienced disequilibrium compaction remain on the loading curve [55]. In contrast, strata that first compact under normal pressure conditions and then become overpressured by hydrocarbon generation expansion form an unloading curve. Hydrocarbon generation expansion will significantly reduce the effective stress but slightly reduce the density due to the irreversibility of the compaction process. Thus, overpressures generated by this mechanism follow a pathway that deviates from the loading curve [40]. In this study, density-vertical effective stress cross plots from four representative wells show that all of the normally pressured data points from the Mbr 2 and Mbr 12 of Longmaxi Fm shales fall on the loading curve, indicating the normal compaction process (Figure 12). On the contrary, all of the strong overpressured data points from the Mbr 11 of Longmaxi Fm lie outside the loading curve, significantly reducing effective vertical stress. This characteristic indicates that hydrocarbon generation expansion is the main generation mechanism of strong overpressure.
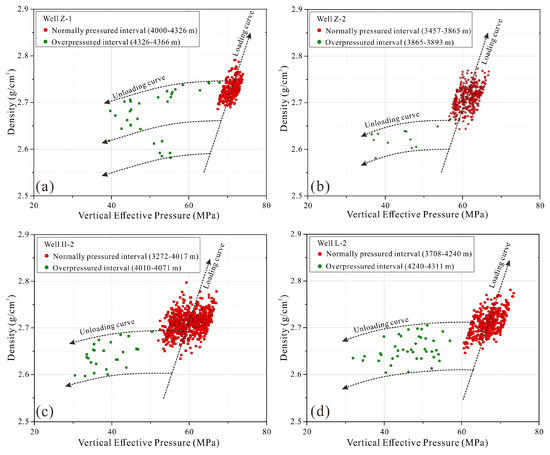
Figure 12.
Vertical effective stress–density cross plots for four wells in the study area. (a) Well Z-1; (b) Well Z-2; (c) Well H-2; (d) Well L-2. The points lie on the loading curve, indicating normal compaction, or overpressure caused by disequilibrium compaction, whereas the data are on an unloading curve, suggesting overpressure resulted from hydrocarbon generation expansion.
5.2. Reconstruction of the Paleo-Pressure Evolution History
The most commonly used methods in the early research of reconstructing paleo-pressure evolution in the study area are basin modeling and paleo-pressure reconstruction [25,26,27,28,39]. Both methods have their applicability and limitations. Combining with the paleo-pressure coefficient obtained by inclusion analysis and the measured present-day pressure coefficient, Wang et al. (2020) concluded that the pressure coefficient of Longmaxi Fm shale during the uplift stage changed from 2.20 at 85 Ma to 1.55 at present [11]. It can be seen that the advantage of this method lies in the accuracy of evolution results, but it cannot clearly reflect the pressure characteristics at a certain time during the evolution process. Through basin modeling, Liu et al. (2020) proposed that the pressure coefficient of Longmaxi Fm shale during the uplift stage increased slowly from 1.80 to 2.50 when considering the influence of temperature decrease [25]. In contrast, Wu et al. (2022) believed that the pressure coefficient during the uplift stage always slightly fluctuated near 2.1 under the influence of gas escape [28]. The above results show that the advantages of basin modeling come from its ability to characterize the entire process of pressure evolution. However, the accuracy of the evolution results is limited by what geological factors are considered and what initial pressures are set. In general, the published research on pressure evolution only focuses on the uplift stage, and its characterization results are limited by the methods used. Recently, Qiu et al. (2020) proposed a new idea (basin modeling + numerical simulation + paleo-pressure reconstruction) to reconstruct paleo-pressure evolution history, which is more accurate in characterizing the whole process and has been well applied in several normal-pressured, weakly overpressured, and negative-pressured reservoirs [56].
The new reconstruction method is adopted in this study to obtain quantitative values of fluid pressure and pressure coefficient during individual geological periods. First, the corresponding mathematical model is used to quantitatively calculate the contribution of each main control factor to the fluid pressure. According to the subsidence and uplift of the stratum and the change of main control factors, the reconstruction of paleo-pressure evolution in the study area can be divided into two stages. The first is the long-term subsidence stage (overpressure generation), when fluid pressure is mainly controlled by hydrocarbon generation expansion. The second stage is the late strong uplift stage (overpressure adjustment), when hydrocarbon generation tends to stop, and the overpressure is adjusted to a certain extent under the control of temperature decrease, pore rebound, and gas escape. Then, the pressure evolution process is clarified under the constraint of the paleo-pressure restored by fluid inclusions analysis and the measured present-day pressure.
5.2.1. Paleo-Pressure Evolution during the Overpressure Generation Stage
After confirming that hydrocarbon generation expansion is the main generation mechanism of overpressure, a quantitative evaluation model of hydrocarbon generation pressurization proposed by Tang et al. (2022), is used to reconstruct the paleo-pressure evolution in this study [55]. Taking the hydrocarbon expulsion process and the influence of overpressure on pore fluid compression, this model has been well applied to reconstruct the paleo-pressure evolution of Qiongzhusi Fm shale in the Sichuan Basin and Shahejie Fm shale in the Bohai Bay Basin, China [57,58].
For the type I kerogen, this model consists of two main parts: oil generated by kerogen pyrolysis (Ro: 0.5–1.3%) and gas generated by crude oil cracking (Ro: >1.3%), and follows five assumptions: (1) the initial pore pressure is hydrostatic pressure (Ph), and the pore is filled with water; (2) hydrocarbon generation does not influence normal compaction; (3) hydrocarbon generation process follows the mass balance and volume balance principles; (4) all water, oils, and gases in the reservoir are under a unified pressure system; (5) the thermal expansion of fluids can be ignored. In the process of oil generated by kerogen pyrolysis, the volume of crude oil generation (V1) equals the reduced volume of original kerogen (Vk) and the compressed volume of pore water (ΔVw) and residual kerogen (ΔVk). Therefore, the increment of fluid pressure (ΔP) can be expressed by the following formula:
where Hio is the original hydrogen index of kerogen; F is the Conversion ratio of kerogen; Mko is the original mass of kerogen; and are the density of crude oil and kerogen, respectively; Co and Cw are the compressibility of oil and formation water; Vwo is the volume of formation water; α is the residual coefficient of oil, which is the ratio of the mass of retention oil in shale pores to the mass of the original oil generated; n is the ratio of kerogen density to crude oil density.
In the process of gas generated by crude oil cracking, the volume of adsorbed gas and free gas (Vspt) equals the total volume of gas generated by crude oil cracking (Vg) minus the volume of gas dissolved in oil (Vgo) and water (Vgw). The volume of gas that can be contained in the actual stratum (V) equals the volume reduced by crude oil cracking (Vod) and the volume of residual oil (ΔVo) and water (ΔVw) being compressed minus the volume of residual carbon (ΔC). Taking Vspt and V into the gas equation of state to calculate the increment of fluid pressure (ΔP):
where Ø is oil saturation; V1 is the volume of the pore (V1 = Vw + Vo); Cr is the cracking proportion of crude oil; N is the volume ratio of gas relative to cracked oil in standard conditions; Bo is oil volume factor; Po and To are pressure and temperature in standard conditions, respectively; P1, T1, and Z1 are formation pressure, temperature, and gas compressibility factor during crude oil cracking, respectively; Zo is the compressibility of gas in standard conditions; Sgo and Sgw are the solubilities of gas in oil and water, respectively; Vr is the volume of remaining carbon residue after crude oil cracking.
The burial and thermal evolution parameters of Well H-2 are taken into the hydrocarbon generation pressurization model to calculate paleo-pressure (Figure 13). Considering the change of hydrocarbon generating stage and pressure state, the pressure evolution of deep Longmaxi Fm shale can be divided into three stages before 65 Ma: (1) Silurian–Early Triassic (443–244 Ma): the shale was shallowly buried and still in the immature to the low mature stage with relatively limited hydrocarbon generation. During this period, fluid pressure was roughly equal to the hydrostatic pressure, causing the shale to maintain normal pressure. When the thermal maturity reached 0.7%, the corresponding fluid pressure and pressure coefficient were about 25.10 MPa and 1.10, respectively; (2) Early Triassic–Early Jurassic (244–192 Ma), the shale continued to subside, and its thermal maturity increased from 0.7% to about 1.3%. During this period, a large amount of oil generated by kerogen pyrolysis led to overpressure. When the thermal maturity reached 1.3%, the cumulative pressurization was about 12.81 MPa. The corresponding fluid pressure and pressure coefficient were about 45 MPa and 1.40, respectively; (3) Early Jurassic–Late Cretaceous (192–65 Ma), the shale subsided significantly, and its maturity increased from 1.3% to 2.6%. During this period, a large amount of natural gas generated by crude oil cracking greatly increased the fluid pressure, resulting in strong overpressure. At the maximum burial position, the cumulative pressurization was about 61.70 MPa, and fluid pressure and pressure coefficient reached 128.96 MPa, and 1.92, respectively.
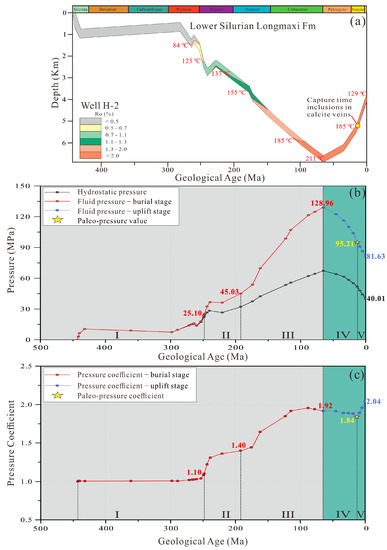
Figure 13.
Overpressure evolution of deep Longmaxi Fm shale reservoir in the Southern Sichuan Basin. (a) Burial, thermal, and maturity histories of the Mbr 11 of Longmaxi Fm shales, presenting the formation temperature corresponding to different mature stages and the trapping temperature obtained by inclusion analysis (165 °C); (b) evolution of hydrostatic pressure and fluid pressure of shale reservoir, illustrating fluid pressure increases to 128.96MPa during the long-term subsidence stage owing to hydrocarbon generation expansion and decreases to 81.63MPa at the late strong uplift stage because of temperature reduction and gas escape.; (c) evolution of pressure coefficient of shale reservoir, showing an apparent five stages from 445 Ma to present.
5.2.2. Paleo-Pressure Evolution during the Overpressure Adjustment Stage
Pore rebound caused by the weakening of the overlying load, temperature decrease, and gas escape are three important mechanisms leading to the reduction of fluid pressure in the period of gas reservoir uplift [55]. However, the pore structure of shale after compaction is dominated by micron- and nano-scale pores, resulting in a less significant pore rebound effect than that of sandstone. Li et al. (2016) found that the Longmaxi Fm shale in Southeast Sichuan Basin was denuded over 3800 m, but its volume of pore rebound was less than 2% [27]. Therefore, the influence of pore rebound on fluid pressure can be ignored in this study, and the pressure evolution of deep Longmaxi Fm shale in the late uplift stage is controlled by temperature decrease and gas escape.
Since the thermal expansion coefficients of the shale skeleton and pore fluid are unequal, the deformation of pore space cannot compensate for the volume decrease of pore fluid under reduced temperature conditions, decreasing the fluid pressure [56]. At present, Soave Redlich Kwong (SRK) equation of state is widely used to quantitatively evaluate the impact of temperature on gas reservoir pressure [59]:
where P, T, and V are pressure, temperature, and volume, respectively; R is gas constant; α(T) is the intermolecular gravitational force; b is the volume of the gas molecule itself; ꞷ is eccentricity factor; Tc and Pc are the critical temperature and critical pressure of the gas, respectively.
Basin modeling showed that the temperature and fluid pressure of the deep Longmaxi Fm shale at the maximum burial depth was about 211 °C and 128.96 MPa, respectively. The current temperature and fluid pressure reach approximately 130 °C and 81.63 MPa, respectively. Taking paleo and current temperatures into the SRK equation of state, the pressure reduction caused by temperature decrease is 27.81 MPa. To balance with the current actual fluid pressure, the pressure reduction caused by gas escape should reach at least 19.52 MPa. The paleo-pressure restored by the inclusion indicates that the fluid pressure of the gas reservoir reached 95.21 MPa around 13 Ma, and the corresponding pressure coefficient was 1.84. Finally, the shale reservoir’s fluid pressure and pressure coefficient evolution curves are plotted by combining the above-calculated data and measured data (Figure 13). According to the trend of the pressure coefficient, the pressure evolution in the strong uplift stage can be divided into two stages: (1) Early Paleogene–Early Neogene (65–13 Ma), the fluid pressure decreased from 128.96 MPa to 95.21 MPa, in which the pressure reductions caused by temperature decrease and gas escape were 17.22 MPa and 16.56 MPa, respectively (Figure 13). At the same time, the overburden pressure is reduced by 15.50 MPa due to uplift and erosion. Since the ratio of fluid pressure reduction to overburden pressure reduction is greater than 1.92, the pressure coefficient also decreases from 1.92 to 1.84; (2) Early Neogene–present (13–0 Ma), there are no inclusions below 160 ℃ found in the veins, which indicates microfractures were closed at this stage and the gas escape gradually slowed down. The reduction of fluid pressure was mainly controlled by temperature decrease. In this stage, fluid pressure decreased from 95.21 MPa to 81.63 MPa, in which the pressure reductions caused by temperature decrease and gas escape were 10.59 MPa and 2.96 MPa, respectively. Meanwhile, the overburden pressure is reduced by 11.74 MPa. Because the ratio of fluid pressure reduction to overburden pressure reduction is greater than 1.84, the pressure coefficient increased from 1.84 to 2.04.
5.3. Influence of Pressure State on Pore Development
In addition to material compositions and thermal maturity, the pressure state of the shale reservoir is also an important control factor for pore development [60,61,62]. The qualitative analysis proposed that the pore development results from the balance between overburden pressure and fluid pressure, and the increase of fluid pressure due to hydrocarbon generation and retention largely offsets the overburden pressure, protecting the pore structure [63]. The differential influence of overpressure and normal pressure on pore development has also been quantitatively investigated in recent years. Liu et al. (2020) compared shale reservoirs with similar material composition and found that shale reservoir with overpressure (Jiaoshiba area) has a higher porosity and surface porosity compared with normally pressured shale reservoirs (Nanchuan and Pengshui area) [63]. Wang et al. (2020) proposed that the evolution of the pressure state from overpressure to normal pressure will cause the organic pores to gradually transform from nearly round macropores with hundreds of nanometers to micrometers into elliptic or irregular micropores and mesopores less than 50 nm [8]. In general, the quantitative observation results are consistent with the qualitative analysis; that is, the existence of overpressure protects the pores, whereas the pores within normally pressured shale reservoirs are damaged to some extent.
Our paleo-pressure evolution results show that the pressure state of the deep Longmaxi Fm shale reservoirs has only undergone minor adjustments during the uplift stage and still maintains the strong overpressured state today (Figure 13). Comparative research about three shale reservoirs with different pressure coefficients was conducted to determine whether strong overpressure conditions affect pore development. Our research shows that, in the case of similar TOC content and mineral, samples from Well L-2 (with a pressure coefficient of 2.24) generally have relatively higher total porosity, and most organic pores are larger than 100 nm in diameter; samples from Well H-2 (with a pressure coefficient of 2.04) have moderate porosity and the diameter of most of the organic pores range from 50–100 nm; samples from Well Z-2 (with a pressure coefficient of 1.86) generally have relatively lower porosity and most organic pores are less than 50 nm (Figure 11). The shape coefficient distributions of organic pores in the three reservoirs are consistent. The above results show that, even under the background of strong overpressure, the effect of pressure on pore development is still different. Higher overpressure coefficients contribute to the maintenance of total porosity and the development of organic macropores, but the influence on the morphology of organic pores is negligible.
Shale gas stored in organic-rich shale mainly exists in the form of both free gas and adsorbed gas [64,65,66,67]. The total amount of free gas under geological conditions is the key to the high yield of shale reservoirs in the early stage of development [14]. Since free gas is mainly stored in macropores and fractures [68,69], the storage capacity of free gas is dependent on total porosity and the proportion of macropores. Adsorbed gas is mainly adsorbed on the surfaces of micropores and mesopores of organic matter and clay minerals [70,71,72,73,74], so the development of mesopores and micropores determines the ability to store adsorbed gas. For deep shale reservoirs, the pressure state could be one of the decisive factors for pore development and storage capacity. Our results indirectly suggest that under the background of strong overpressure, shale reservoirs with higher pressure coefficient (>2.0) are characterized by larger pore volume because of higher total porosity and a higher proportion of organic macropores, which contribute to the storage of free gas. In contrast, shale reservoir with relatively lower pressure coefficient (<2.0) are featured by higher specific surface area owing to lower total porosity and higher proportions of organic meso- and micro-pores, which is beneficial to the storage of free gas.
6. Conclusions
Different degrees of strong overpressures are developed in the deep Longmaxi Fm shale in Southern Sichuan Basin, with pressure coefficients ranging from 1.75–2.45. To reveal the origin and evolution of strong overpressure and its influence on pore development, logging responses analysis, basin modeling, numerical simulation, fluid inclusion analysis, and pore characteristics analysis were analyzed, and the new method to restore paleo-pressure evolution history was applied in this study. The main conclusions can be drawn as follows:
Evidence from theoretical analysis based on geological background, comprehensive logging curve, and vertical effective stress-density cross plot indicate that hydrocarbon generation expansion is the main generation mechanism for the strong overpressure that existed in the Mbr 11 of Longmaxi Fm shale.
The pressure evolution of the Mbr 11 of Longmaxi Fm shale during the long-term subsidence stage, simulated by the mathematical model of hydrocarbon generation pressurization, has evolved through three stages: the first stage (443–244 Ma) was marked by normal pressure (pressure coefficient: 1.10) due to relatively lower thermal maturity and limited hydrocarbon generation; the second stage (244–192 Ma) was featured by overpressure (pressure coefficient: 1.40) owing to a large amount of oil generated by kerogen pyrolysis; the third stage (192–65 Ma) was characterized by strong overpressure (pressure coefficient: 1.92) because of a large amount of natural gas generated by crude oil cracking.
During the late strong uplift stage, the pressure evolution of the shale, analyzed by SRK state equation and fluid inclusion, has evolved through two stages: in the first stage (65–13 Ma), the reduction of fluid pressure controlled by temperature decrease and gas escape is higher than the reduction of overburden pressure, slowly decreasing the pressure coefficient from 1.92 to 1.84; in the second stage (65–13 Ma), the degree of gas escape is weakened, and the pressure reduction caused by temperature reduction is higher than the reduction of overburden pressure, gradually increasing the pressure coefficient from 1.84 to 2.04.
Under the background of strong overpressure, the influence of pressure on pore development is different, but the influence on the morphology of organic pores can be ignored. Higher pressure coefficients contribute to the maintenance of total porosity and the development of organic macropores, which could further cause differences in the content of adsorbed gas and free gas in deep shale reservoirs. The organic pores with different strong overpressure conditions are mainly round and oval.
Author Contributions
Conceptualization, L.W. and J.Y.; methodology, L.W. and J.Y.; software, J.Y.; validation, L.W.; formal analysis, J.Y.; investigation, S.S. and Z.S.; data curation, S.S. and Z.S.; writing—original draft preparation, J.Y.; writing—review and editing, L.W., D.D., and Z.G.; visualization, L.W.; supervision, D.D. and Z.G.; project administration, L.W.; funding acquisition, L.W. All authors have read and agreed to the published version of the manuscript.
Funding
This work was supported by the Fundamental Research Funds for China University of Geoscience (Beijing) under Award Numbers 35832019035. Financial support from the National Natural Science Foundation of China under Award Number 41702133 is also greatly appreciated.
Data Availability Statement
The data are available from the corresponding author upon reasonable request.
Acknowledgments
We are grateful to the Research Institute of Petroleum Exploration & Development, PetroChina, Beijing, for providing samples, data, and permission to publish this paper.
Conflicts of Interest
The authors declare that they have no known competing financial interests or personal relationships that could have appeared to influence the work reported in this paper.
References
- Hunt, J.M. Generation and migration of petroleum from abnormally pressured fluid compartments. AAPG Bull. 1990, 74, 1–12. [Google Scholar]
- Warbrick, R.E.; Osborne, M.J. Mechanisms that generate abnormal pressure: An overview. In Abnormal Pressure in Hydrocarbon Environments: AAPG Memoir; Law, B.E., Ulmishek, G.F., Slavin, V.I., Eds.; AAPG: Tulsa, OK, USA, 1998; pp. 13–43. [Google Scholar]
- Guo, X.W.; He, S.; Liu, K.Y.; Song, G.Q.; Wang, X.J.; Shi, Z.S. Oil generation as the dominant overpressure mechanism in the cenozoic dongying depression, Bohai Bay Basin, China. AAPG Bull. 2010, 94, 1859–1881. [Google Scholar] [CrossRef]
- Zhao, J.Z.; Li, J.; Xu, Z.Y. Advances in the origin of overpressures in sedimentary basins. Acta Pet. Sin. 2017, 38, 973–998. [Google Scholar] [CrossRef]
- Pang, X.Q.; Jia, C.Z.; Wang, W.Y. Petroleum geology features and research developments of hydrocarbon accumulation in deep petroliferous basins. Petrol. Sci. 2015, 12, 1–53. [Google Scholar] [CrossRef]
- Hao, F.; Zou, H.Y.; Gong, Z.S.; Yang, S.G.; Zeng, Z.P. Hierarchies of overpressure retardation of organic matter maturation: Case studies from petroleum basins in China. AAPG Bull. 2007, 91, 1467–1498. [Google Scholar] [CrossRef]
- Hunt, J.M.; Whelan, J.K.; Eglinton, L.B.; Cathles, L.M., III. Relation of Shale Porosities, Gas Generation, and Compaction to Deep Overpressures in the U.S. Gulf Coast. In Abnormal Pressures in Hydrocarbon Environments; Law, B.E., Ulmishek, G.F., Slavin, V.I., Eds.; AAPG: Tulsa, OK, USA, 1998; Volume 70, pp. 87–104. [Google Scholar]
- Lee, Y.; Deming, D. Overpressures in the Anadarko basin, southwestern Oklahoma: Static or dynamic? AAPG Bull. 2002, 86, 145–160. [Google Scholar]
- Stricker, S.; Jones, S.J.; Sathar, S.; Bowen, L.; Oxtoby, N. Exceptional reservoir quality in HPHT reservoir settings: Examples from the Skagerrak Formation of the Heron Cluster, North Sea, UK. Mar. Pet. Geol. 2016, 77, 198–215. [Google Scholar] [CrossRef]
- Mosca, F.; Djordjevic, O.; Hantschel, T.; McCarthy, J.; Krueger, A.; Phelps, D.; Akintokunbo, T.; Joppen, T.; Koster, K.; Schupbach, M.; et al. Pore pressure prediction while drilling: Three-dimensional earth model in the Gulf of Mexico. AAPG Bull. 2018, 102, 691–708. [Google Scholar] [CrossRef]
- Wang, R.Y.; Nie, H.K.; Hu, Z.Q.; Liu, G.X.; Xi, B.B.; Liu, W.X. Controlling effect of pressure evolution on shale gas reservoir: A case study of the Wufeng-Longmaxi Formation in the Sichuan Basin. Nat. Gas Ind. 2020, 40, 1–11. [Google Scholar]
- Hua, Y.Q.; Guo, X.W.; Tao, Z.; He, S.; Dong, T.; Han, Y.J.; Yang, R. Mechanisms for overpressure generation in the bonan sag of Zhanhua depression, Bohai Bay Basin, China. Mar. Petrol. Geol. 2021, 128, 105032. [Google Scholar] [CrossRef]
- Dong, D.Z.; Gao, S.K.; Huang, J.L.; Guan, Q.Z.; Wang, S.F.; Wang, Y.M. Discussion on the exploration & development prospect of shale gas in the Sichuan Basin. Nat. Gas Ind. 2015, 2, 9–23. [Google Scholar]
- Ma, Y.S.; Cai, X.Y.; Zhao, P.R. China’s shale gas exploration and development: Understanding and practice. Pet. Explor. Dev. 2018, 45, 589–603. [Google Scholar] [CrossRef]
- Jiang, Z.X.; Song, Y.; Tang, X.L.; Li, Z.; Wang, X.M.; Wang, G.Z.; Xue, Z.X.; Li, X.; Zhang, K.; Chang, J.Q.; et al. Controlling factors of marine shale gas differential enrichment in southern China. Pet. Explor. Dev. 2020, 47, 661–673. [Google Scholar] [CrossRef]
- Gao, J.; Zhang, J.; He, S.; Zhao, J.; He, Z.; Wo, Y.; Feng, Y.; Li, W. Overpressure generation and evolution in Lower Paleozoic gas shales of the Jiaoshiba region, China: Implications for shale gas accumulation. Mar. Petrol. Geol. 2019, 102, 844–859. [Google Scholar] [CrossRef]
- Wang, Q.; Wei, X.F.; Wei, F.B.; Yan, J.H.; Wan, L. Overpressure in shale gas reservoirs of Wufeng-Longmaxi formations, Fuling area, southeastern Sichuan Basin. Petrol. Geol. Exp. 2019, 41, 333–340. [Google Scholar]
- Zeng, Y.; Hou, Y.G.; Hu, D.F.; He, S.; Liu, R.B.; Dong, T.; Yang, R.; Li, X.C.; Ye, Y.F. Characteristics of shale fracture veins and paleo-pressure evolution in normal pressure shale gas zone, Southeast Margin of Sichuan Basin. Journal of Earth Science 2022, 47, 1819–1833. [Google Scholar]
- Gao, J.; Li, H.L.; He, Z.L.; LI, S.J.; Liu, G.X.; Yuan, Y.S.; Li, Y.Q.; Li, T.Y.; He, S. Pressure evolution, enrichment and preservation of normal-pressure shale gas in the Pengshui area of eastern Chongqing. Nat. Gas Ind. 2022, 42, 124–135. [Google Scholar]
- Hu, D.F.; Wei, Z.H.; Li, Y.P.; Liu, Z.J.; Yuan, T.; Liu, X.J. Deep shale gas exploration in complex structure belt of the southeastern Sichuan Basin: Progress and breakthrough. Nat. Gas Ind. 2022, 42, 35–44. [Google Scholar]
- He, Z.L.; Nie, H.K.; Hu, D.F.; Jiang, T.X.; Wang, R.Y.; Zhang, Y.Y.; Zhang, G.R.; Lu, Z.Y. Geological problems in the effective development of deep shale gas: A case study of Upper Ordovician Wufeng-Lower Silurian Longmaxi formations in Sichuan Basin and its periphery. Acta Pet. Sin. 2020, 41, 379–391. [Google Scholar]
- Liu, R.B. Analyses of influences on shale reservoirs of Wufeng-Longmaxi Formation by overpressure in the south-eastern part of Sichuan Basin. Acta Sedimentol. Sin. 2015, 33, 817–827. [Google Scholar]
- Liu, H.L.; Wang, H.Y.; Fang, C.H.; Guo, W.; Sun, S.S. The formation mechanism of over-pressure reservoir and target screening index of the marine shale in the South China. Earth Sci. Front. 2016, 23, 48–54. [Google Scholar]
- Chen, Z.P.; Liang, X.; Zhang, J.H.; Wang, G.C.; Liu, C.; Li, Z.F.; Zou, C. Genesis analysis of shale reservoir over-pressure of Longmaxi Formation in Zhaotong demonstration area, dianqianbei depression. Nat. Gas Geosci. 2016, 27, 442. [Google Scholar]
- Liu, D.D.; Guo, J.; Pan, Z.K.; Du, W.; Zhao, F.P.; Chen, Y.; Shi, F.L.; Song, Y.; Jiang, Z.X. Overpressure evolution process in shale gas reservoir: Evidence from the fluid inclusions in the fractures of Wufeng Formation-Longmaxi Formation in the southern Sichuan Basin. Nat. Gas Ind. 2021, 41, 12–22. [Google Scholar]
- Liang, Z.K.; Jiang, Z.X.; Wu, W.; Guo, J.; Wang, M.; Liu, D.D.; Nie, Z.; Xue, Z.X. Characteristics and geological significance of fluid inclusion of Wufeng-Longmaxi Formation in different tectonic units in Changning area, southern Sichuan. J. Cent. South Univ. (Sci. Technol.) 2022, 53, 3652–3665. [Google Scholar]
- Li, S.J.; Yuan, Y.S.; Sun, W.; Sun, D.S.; Jin, Z.J. The formation and destruction mechanism of shale gas overpressure and its main controlling factors in Silurian of Sichuan Basin. Nat. Gas Geosci. 2016, 27, 924–931. [Google Scholar]
- Wu, J.; Chen, X.Z.; Liu, W.P.; Wu, W.; Gao, Y.; Luo, C.; Deng, B.; Zhou, Z. Fluid activity and pressure evolution process of Wufeng-Longmaxi shales, Southern Sichuan Basin. J. Earth Sci. 2022, 47, 518–531. [Google Scholar]
- Zou, C.N.; Zhao, Q.; Cong, L.Z.; Wang, H.Y.; Shi, Z.H.; Wu, J.; Pan, S.Q. Development progress, potential and prospect of shale gas in China. Nat. Gas Ind. 2021, 41, 1–14. [Google Scholar]
- Chen, S.B.; Zhu, Y.M.; Chen, S.; Han, Y.F.; Fu, C.Q.; Fang, J.H. Hydrocarbon generation and shale gas accumulation in the Longmaxi Formation, southern Sichuan Basin, China. Mar. Petrol. Geol. 2017, 86, 248–258. [Google Scholar]
- Eaton, B.A. Graphical method predicting pressure worldwide. World Oil 1972, 185, 51–56. [Google Scholar]
- Liang, X.; Xu, J.L.; Wang, Y.; Fang, X.Y.; Zhao, L.; Wu, Y.J.; Deng, B. The shale gas enrichment factors of Longmaxi Formation under gradient basin-mountain boundary in South Sichuan Basin: Tectono-depositional differentiation and discrepant evolution. Chin. J. Geol. 2021, 56, 60–81. [Google Scholar]
- Sweeney, J.J.; Burnham, A.K. Evaluation of a simple model of vitrinite reflectance based on Chemical kinetics. AAPG Bull. 1990, 74, 1559–1570. [Google Scholar]
- Cao, H.Y.; Zhu, C.Q.; Qiu, N.S. Thermal evolution of lower Silurian Longmaxi Formaiton in the Eastern Sichuan Basin. J. Earth Sci. Environ. 2015, 37, 22–32. [Google Scholar]
- Qiu, D.F.; Li, S.J.; Yuan, Y.S.; Mao, X.P.; Zhou, Y.; Sun, D.S. Geohistory modeling and its petroleum geological significance of Middle-Upper Yangtze area. Pet. Geol. Recovery Effic. 2015, 22, 6–13. [Google Scholar]
- Zhang, J.L.; Qiao, S.H.; Lu, W.J.; Hu, Q.; Chen, S.G.; LIU, Y. An equation for determining methane densities in fluid inclusions with Raman shifts. J. Geochem. Explor. 2016, 171, 20–28. [Google Scholar] [CrossRef]
- Duan, Z.; Møller, N.; Weare, J.H. An equation of state for the CH4-CO2-H2O system: I. Pure systems from 0 to 1000 °C and 0 to 8000 bar. Geochem. Cosmochim. Acta 1992, 56, 2605–2617. [Google Scholar] [CrossRef]
- Li, W.; He, S.; Zhang, B.Q.; He, Z.L.; Chen, M.F.; Zhang, D.W.; Li, T.Y.; Gao, J. Characteristics of paleo-temperature and paleo-pressure of fluid inclusions in shale composite veins of Longmaxi Formation at the western margin of Jiaoshiba anticline. Acta Pet. Sin. 2018, 39, 402–415. [Google Scholar]
- Yang, W.; He, S.; Su, A.; Iglauer, S.; Zhai, G.Y.; Zhou, Z.; Dong, T.; Tao, Z.; Wei, S.L. Paleo-Temperature and -Pressure Characteristics of Fluid Inclusions in Composite Veins of the Doushantuo Shale (Yichang Area, South China): Implications for the Preservation and Enrichment of Shale Gas. Energy Fuels 2021, 35, 4091–4105. [Google Scholar] [CrossRef]
- Li, C.; Zhang, L.K.; Luo, X.R.; Lei, Y.H.; Yu, L.; Cheng, M.; Wang, Y.S.; Wang, Z.L. Overpressure generation by disequilibrium compaction or hydrocarbon generation in the Paleocene Shahejie Formation in the Chezhen Depression: Insights from logging responses and basin modelling. Mar. Petrol. Geol. 2021, 133, 105258. [Google Scholar] [CrossRef]
- Li, C.; Luo, X.R.; Zhang, L.K.; Fan, C.W.; Xu, C.G.; Liu, A.Q.; Li, H.; Li, J.; Lei, Y.H. New understanding of overpressure responses and pore pressure prediction: Insights from the effect of clay mineral transformations on mudstone compaction. Eng. Geol. 2022, 297, 106493. [Google Scholar] [CrossRef]
- Osborne, M.J.; Swarbrick, R.E. Mechanisms for generating overpressure in sedimentary basins: A reevaluation. AAPG Bull. 1997, 81, 1023–1041. [Google Scholar]
- Satti, I.A.; Ghosh, D.; Yusoff, W.I.W. 3-D predrill overpressure prediction using prestack depth-migrated seismic velocity in a field of southwestern Malay Basin. Arab. J. Geosci. 2015, 8, 7387–7398. [Google Scholar] [CrossRef]
- Liu, H.; Yuan, F.F.; Jiang, Y.L.; Zhao, M.; Chen, K.T.; Guo, Z.Y.; Wang, Y.Q. Mechanisms for overpressure generated by the undercompaction of paleogene strata in the Baxian depression of Bohai Bay Basin, China. Mar. Petrol. Geol. 2019, 99, 337–346. [Google Scholar] [CrossRef]
- Lahann, R.W.; Swarbrick, R.E. Overpressure generation by load transfer following shale framework weakening due to smectite diagenesis. Geofluids 2011, 11, 362–375. [Google Scholar] [CrossRef]
- Wu, J.; Liang, C.; Yang, R.C.; Hu, Z.Q.; Li, W.J.; Xie, J. The genetic relationship between paleoenvironment, mineral compositions and lithofacies in the Ordovician–Silurian Wufeng–Longmaxi sedimentary succession in the Sichuan Basin, SW China. J. Asian Earth Sci. 2022, 236, 105334. [Google Scholar] [CrossRef]
- Wang, Y.M.; Wang, S.F.; Dong, D.Z.; Li, X.J.; Huang, J.L.; Zhang, C.C.; Guan, Q.Z. Lithofacies characterization of Longmaxi Formation of the Lower Silurian, southern Sichuan. Earth Sci. Front. 2016, 23, 119–133. [Google Scholar]
- Osborne, M.J.; Swarbrick, R.E. Diagenesis in North Sea HPHT clastic reservoirs—Consequences for porosity and overpressure prediction. Mar. Petrol. Geol. 1999, 16, 337–353. [Google Scholar] [CrossRef]
- Berg, R.R.; Gangi, A.F. Primary migration by oil-generation microfracturing in low-permeability source rocks: Application to the Austin Chalk, Texas. AAPG Bull. 1999, 83, 727–756. [Google Scholar]
- Tingay, M.R.P.; Morley, C.K.; Laird, A.; Limpornpipat, O.; Krisadasima, K.; Pabchanda, S.; Macintyre, H.R. Evidence for overpressure generation by kerogen –to-gas maturation in the northern Malay Basin. AAPG Bull. 2013, 97, 639–672. [Google Scholar] [CrossRef]
- Luo, X.R.; Vasseur, G. Geopressuring mechanism of organic matter cracking: Numerical modeling. AAPG Bull. 1996, 80, 856–874. [Google Scholar]
- Zhang, L.; Xiang, C.; Dong, Y.; Zhang, M.; Lv, Y.; Zhao, Z.; Long, H.; Chen, S. Abnormal pressure system and its origin in the Nanpu sag, Bohai Bay Basin. Oil Gas Geol. 2018, 39, 664–675. [Google Scholar]
- Tingay, M.R.P.; Hillis, R.R.; Swarbrick, R.E.; Morley, C.K.; Damit, A.R. Origin of overpressure and pore-pressure prediction in the Baram province, Brunei. AAPG Bull. 2009, 93, 51–74. [Google Scholar] [CrossRef]
- Bowers, G.L. Detecting high overpressure. Lead. Edge 2002, 21, 174–177. [Google Scholar] [CrossRef]
- Tang, L.; Song, Y.; Zhao, Z.G.; Jiang, Z.X.; Jiang, S.; Chen, X.Z.; Li, Z.; Li, Q.W. Origin and evolution of overpressure in shale gas reservoirs of the Upper Ordovician Wufeng Formation–Lower Silurian Longmaxi Formation in the Sichuan Basin. Nat. Gas Ind. 2022, 42, 37–53. [Google Scholar]
- Qiu, N.S.; Liu, Y.F.; Liu, W.; Jia, J.K. Quantitative reconstruction of formation paleo-pressure in sedimentary basins and case studies. Sci. China Earth Sci. 2020, 63, 808–821. [Google Scholar] [CrossRef]
- Guo, X.W.; He, S.; Liu, K.Y.; Dong, T.T. A quantitative estimation model for the overpressure caused by natural gas generation and its influential factors. Earth Sci. J. China Univ. Geosci. 2013, 38, 1263–1270. [Google Scholar]
- Liu, W.; Qiu, N.S.; Xu, Q.C.; Liu, Y.F.; Shen, A.J.; Zhang, G.W. The evolution of pore-fluid pressure and its causes in the Sinian-Cambrian deep carbonate gas reservoirs in central Sichuan Basin, southwestern China. J. Petrol. Sci. Eng. 2018, 169, 96–109. [Google Scholar] [CrossRef]
- Ma, D.W.; Qiu, N.S.; Xu, W. Study on the genesis mechanism of abnormal low pressure in Sulige gas field in Ordos Basin. Geol. Sci. 2011, 46, 1055–1067. [Google Scholar]
- Wang, X.M.; Liu, L.F.; Wang, Y.; Sheng, Y.; Zheng, S.S.; Wu, W.W.; Luo, Z.H. Comparison of the pore structures of Lower Silurian Longmaxi Formation shales with different lithofacies in the southern Sichuan Basin, China. J. Nat. Gas Sci. Eng. 2020, 81, 103419. [Google Scholar] [CrossRef]
- Sun, W.J.B.; Zuo, Y.J.; Wu, Z.H.; Liu, H.; Zheng, L.J.; Wang, H.; Shui, Y.; Lou, Y.L.; Xi, S.J.; Li, T.T.; et al. Pore characteristics and evolution mechanism of shale in a complex tectonic area: Case study of the Lower Cambrian Niutitang Formation in northern Guizhou, southwest China. J. Petrol. Sci. Eng. 2020, 193, 107373. [Google Scholar] [CrossRef]
- Liu, S.G.; Jiao, K.; Zhang, J.C.; Ye, Y.H.; Xie, G.L.; Deng, B.; Ran, B.; Li, Z.W.; Wu, J.; Li, J.X.; et al. Research progress on the pore characteristics of deep shale gas reservoirs: An example from the Lower Paleozoic marine shale in the Sichuan Basin. Nat. Gas Ind. 2021, 41, 29–41. [Google Scholar]
- Liu, S.G.; Ye, Y.H.; Ran, B.; Jiang, L.; Li, Z.W.; Li, J.X.; Song, J.X.M.; Jiao, K.; Li, Z.Q.; Li, Y.W. Evolution and implications of shale pore structure characteristics under different preservation conditions. Reserve Eval. Dev. 2020, 10, 1–11. [Google Scholar]
- Ross, D.J.K.; Bustin, R.M. Characterizing the shale gas resource potential of Devonian-Mississippian strata in the Western Canada sedimentary basin: Application of an integrated formation evaluation. AAPG Bull. 2008, 92, 87–125. [Google Scholar] [CrossRef]
- Michael, B.; Xia, W.W.; John, S. Shale gas play screening and evaluation criteria. Chin. Petrol. Explor. 2009, 3, 51–64. [Google Scholar]
- Li, Y.X.; Qiao, D.W.; Jiang, W.L.; Zhang, C.H. Gas content of gas-bearing shale and its geological evaluation summary. Geol. Bull. China 2011, 30, 308–317. [Google Scholar]
- Sander, R.; Pan, Z.; Connell, L.D.; Camilleri, M.; Grigore, M.; Yang, Y. Controls on methane sorption capacity of Mesoproterozoic gas shales from the Beetaloo Subbasin, Australia and global shales. Int. J. Coal Geol. 2018, 199, 65–90. [Google Scholar] [CrossRef]
- Liu, A.; Fu, X.; Wang, K.; An, H.; Wang, G. Investigation of coalbed methane potential in low-rank coal reservoirs-Free and soluble gas contents. Fuel 2013, 112, 14–22. [Google Scholar] [CrossRef]
- Zhou, Q.; Xiao, X.; Tian, H.; Pan, L. Modeling free gas content of the lower Paleozoic shales in the Weiyuan area of the Sichuan Basin, China. Mar. Pet. Geol. 2014, 56, 87–96. [Google Scholar] [CrossRef]
- Zhang, T.; Ellis, G.S.; Ruppel, S.C.; Milliken, K.; Yang, R. Effect of organic-matter type and thermal maturity on methane adsorption in shale-gas systems. Org. Geochem. 2012, 47, 120–131. [Google Scholar] [CrossRef]
- Gasparik, M.; Bertier, P.; Gensterblum, Y.; Ghanizadeh, A.; Krooss, B.M.; Littke, R. Geological controls on the methane storage capacity in organic-rich shales. Int. J. Coal Geol. 2014, 123, 34–51. [Google Scholar] [CrossRef]
- Baruch, E.T.; Kennedy, M.J.; Löhr, S.C.; Dewhurst, D.N. Feldspar dissolution-enhanced porosity in Paleoproterozoic shale reservoir facies from the Barney Creek Formation (McArthur Basin, Australia). AAPG Bull. 2015, 99, 1745–1770. [Google Scholar] [CrossRef]
- Wang, Y.; Zhu, Y.; Liu, S.; Zhang, R. Methane adsorption measurements and modeling for organic-rich marine shale samples. Fuel 2016, 172, 301–309. [Google Scholar] [CrossRef]
- Hu, H.; Hao, F.; Lin, J.; Lu, Y.; Ma, Y.; Li, Q. Organic matter-hosted pore system in the Wufeng-Longmaxi (O3w-S11) shale, Jiaoshiba area, Eastern Sichuan Basin, China. Int. J. Coal Geol. 2017, 173, 40–50. [Google Scholar] [CrossRef]
Disclaimer/Publisher’s Note: The statements, opinions and data contained in all publications are solely those of the individual author(s) and contributor(s) and not of MDPI and/or the editor(s). MDPI and/or the editor(s) disclaim responsibility for any injury to people or property resulting from any ideas, methods, instructions or products referred to in the content. |
© 2023 by the authors. Licensee MDPI, Basel, Switzerland. This article is an open access article distributed under the terms and conditions of the Creative Commons Attribution (CC BY) license (https://creativecommons.org/licenses/by/4.0/).