Abstract
All requirements for the express control of unstable hydrocarbon media and devices for their implementation to obtain reliable measurement results are determined. The features of the control of volatile hydrocarbon media and their mixtures with industrial small-sized refractometers operating on the effect of total internal reflection are considered. The new method for determining components and the ratio between concentrations of them in a mixture of volatile hydrocarbon media is developed. There are no analogs to this method in the world. This method allows determining the presence of one volatile hydrocarbon medium in another in a ratio of 1% to 99% or more. The new design of a small-sized refractometer has been developed, which makes it possible to measure the refractive index in visible light. In the refractometer’s newly developed design, the refractive index measurement range of a condensed medium is from 1.2500 to 1.7000 (measurement error 0.0004). New dependencies of change in density ρ for various grades of hydrocarbon fuel (in the Russian Federation) on temperature T have been established. After adjusting the coefficients, these dependencies can be used for fuel produced in various world countries. The results of the research on different gasoline types and their mixtures are presented.
1. Introduction
Every year there is a growth of energy required for the needs of humanity [1,2,3,4,5,6]. Various technologies and methods for energy production are being developed in addition to those used [2,5,7,8,9,10] to solve the problem of increasing energy production. Several energy sectors have achieved some success in this direction [2,3,7,10,11,12]. There are attempts to transition to alternative energy sources for generating electrical energy [1,13,14,15,16,17,18]. This saves some of the oil and gas reserves for future generations. In the nuclear power industry, significant progress has also been made in generating electrical energy [4,8,19,20,21,22,23,24,25]. Unfortunately, in some branches of the fuel and energy complex, the attempts to replace hydrocarbon media (for example, gasoline, kerosene, including aviation, diesel fuel, and others) with alternative energy sources have yet to bring significant success. The fuel consumption from oil is increasing every year [26,27,28,29]. Prices for hydrocarbon fuels are gradually rising. The storage and transportation costs of hydrocarbon fuels are increasing [30,31,32]. At the same time, more and more situations arise when the consumer receives fuel of a lower quality than necessary. There are many reasons for the deterioration of the quality of gasoline, kerosene, and diesel fuel [32,33,34,35,36,37,38,39,40,41]. Several main ones can be distinguished.
The first of these reasons is related to the improper storage of various fuels by ordinary consumers (people) and organizations. Fuel is bought on reserve (at discounts). In most cases, there are no proper conditions and special containers for long-term fuel storage. The second reason, often encountered when delivering fuel to consumers, is related to the fact that two types of fuel are mixed (for example, the gasoline of the AI-92 brand gets into the gasoline of the AI-80 brand, or the gasoline of the AI-92 brand gets into the gasoline of the AI-95 brand). This is quite common, since the capacity where new fuel is poured is not always checked. In this situation, a mixture of two types of gasoline or diesel fuel with gasoline is formed, which is worse for the engine. Using such mixtures leads to rapid engine wear and increased fuel consumption per 100 km. A similar situation can occur with kerosene of various grades. In small aviation, this leads to various negative situations during flights. At airports, this can lead to flight delays. Another reason for the low quality of the fuel is associated with the insufficient purification of oil before distillation due to high costs (this applies to heavy grades of oil with two or three fractions (the third is intermediate)) [29,32,37,40,41,42,43,44,45]. Gasoline has a lower octane number, bringing additives to the desired state. In some cases, there is a failure in the technological process, which must be constantly monitored using sampling (quick express control). It further leads to a decrease in the quality of the batch of gasoline, and again it is necessary to spend a large amount of energy and time restoring the properties of such gasoline after long-term storage. It makes no sense to talk about the negative consequences for the car engine when using such gasoline; there will always be some. The last of the main reasons for the decline in fuel quality is associated with the deliberate mixing of one brand of gasoline with another (lower quality gasoline, which is cheaper, is added to high-quality gasoline). A similar situation also arises with diesel fuel, to which kerosene or gasoline of the AI-80 brand is added. Next, additives are used to increase the octane number of the gasoline mixture. Diesel fuel diluted with another medium is also treated to improve energy efficiency. Nobody deliberately dilutes aviation kerosene since there can be serious consequences as a result of these actions in the event of a catastrophe of a moving object.
Therefore, an essential role in the fuel and energy complex system is assigned to fast and reliable methods of the express control of the state of the fuel at the sampling site [46,47,48,49,50,51,52,53,54,55,56,57]. In most cases, in a limited amount of time (less than 5 min), it is necessary to determine whether this fuel can be used with high reliability and, moreover, to establish the reason for the low quality of the fuel if it is a mixture of hydrocarbon media (for example, two types of gasoline, gasoline and kerosene). This is because, in some cases, as an exception, at a specific concentration between the components in a hydrocarbon mixture, it can be used as a fuel for cars in emergency situations, or for tracked vehicles, marine mobile vehicles, and others. For example (in the Russian Federation), a 99/1 or 98/2 ratio mixture of gasoline of the AI-95 brand and gasoline of the AI-92 brand, 99/1 diesel fuel with gasoline of the AI-80 brand mixture, or a 99/2 mixture with gasoline of the AI-92 brand are used. In such a situation, this ratio and mixture composition must be established at the sampling place in the specified period.
In addition, express control methods should not introduce irreversible changes in the physical structure of the medium and contribute to the occurrence of chemical reactions that will change the chemical composition of the medium. Devices designed to implement these methods should be applied to control a large number of media under study (in demand by many consumers to solve various problems).
To determine the relationships between the concentrations of hydrocarbon media in mixtures, the measurement error of the parameters should be at most 0.5%. Such accuracy will allow getting the necessary result for making an informed decision.
All these requirements are currently satisfied only by two methods. One of them is based on the use of the phenomenon of nuclear magnetic resonance (NMR) [41,52,53,57,58,59,60,61,62,63,64], and the other uses the phenomenon of refraction [65,66,67,68,69,70].
The comparative analysis of designs of industrial refractometers [65,68,70,71,72,73,74] with small-sized NMR spectrometers and relaxometers [52,53,57,59,75,76,77,78,79] showed that they have undeniable advantages in terms of design size, weight, and cost. For this reason, refractometers are preferred for the express control of the state of liquid media and their mixtures. The most widely used for express control among refractometers are devices whose operating principle is based on the phenomenon of total internal reflection (TIR). In designs of refractometers of this type, the measurement error of the refractive index n is from 0.1 to 0.03. The process of measuring n is fully automated. Our experiments showed that when studying the state of volatile hydrocarbons (gasoline, kerosene, diesel fuel) and their mixtures in express mode, several problems arise at the sampling point.
One is related to stabilizing the temperature T of the medium under study on the upper face of the prism. In small industrial refractometers for the total internal reflection phenomenon, measuring n is set to T = 293 K. Establishing this mode requires a certain time and additional battery energy, which may not be enough during long-term operation. It can be cold or hot, hydrocarbons may not freeze, and measuring n at a negative temperature T is often necessary.
Another problem is the low accuracy of n measurement. In this case, it is tough to determine minor deviations in the value of n. There are a lot of such problems when using hydrocarbon media. For example, a mixture of two oils (one oil was stored in a container) is drained, but not all (a small part remains), and another is added. Involuntarily, for example, a mixture of oils with a volume concentration of 0.98 to 0.02 results. Such a component should not be used for chemical and biological purposes, and the problem must be revealed during express control. It cannot be achieved using the considered designs of small-sized refractometers. It is also impossible to determine the composition of the mixture and the concentrations between the components. Similar situations very often occur with types of gasolines and kerosenes. It should be noted that hydrocarbons, especially volatile ones, do not enter into chemical reactions with each other (even after intense mixing) but form a conglomerate.
During measurements, if the medium under study is a mixture of two volatile hydrocarbon media (for example, two types of gasoline, gasoline and kerosene), another problem arises. The mixture’s temperature and prism during the measurement of n must be stabilized to T = 293 K. The amount of time needed to achieve this depends on the environment’s temperature and the mixture under study. During this, changes may occur in the test mixture (for example, a mix of gasoline or other volatile carbon compounds). Lighter media will rise to the top, and heavier media will sink. A situation may arise when the lower edge of the refractometer prism, along which measurements are taken, will only border on the medium from the mixture we are testing (for example, the gasoline of the AI-92 brand). All impurities in the mixture will be above the layer of the gasoline of the AI-92 brand, which borders on the prism. The device will not allow the determination of the presence of impurities (for example, other types of gasoline) in the mixture. As a result, the nm value of the mixture will be measured, which corresponds to the standard value, for example, of the gasoline of the AI-92 brand that is being tested. We examine gasoline with impurities, but the device shows that the gasoline meets the standard. A similar situation applies to kerosene, aviation fuel, anti-icing media for aircraft objects, etc. The composition of the mixture and the concentration of its components cannot be determined. These situations have not been considered in the literature. Many users of refractometers and scientists who conduct research are not aware of these situations. This leads to errors when using small-sized refractometers for the state control of volatile hydrocarbon media (if the medium under study is a mixture). The development of new methods and devices for its implementation is required to solve these problems. The refractometers in operation and the methods used for determining the composition of the mixture based on the measurements carried out with them do not allow the solving of these problems.
Therefore, our work aims to develop a new method for determining the state and mixture composition of volatile hydrocarbon media and their concentrations of components. For the practical implementation of the new method, it will be necessary to develop a new design of a small-sized refractometer that can be used for the express control of condensed media. This must be developed since the relevance of tasks related to the express control of fuel and other media is constantly increasing.
2. New Method for Controlling the State of Volatile Hydrocarbon Media and Their Blends
The analysis of the research data [65,66,67,68,69,70,71,72,73,80,81,82,83,84,85,86,87,88,89] of condensed media using various methods based on the refraction phenomenon for measuring nm and designs of small-sized refractometers for implementing express control allowed us to develop a new method for investigating hydrocarbon media. The test sample is placed in a closed volume of 10 mL. Further, the sample in this volume is mixed. Let us consider the most difficult option: we do not know the composition of the sample (it may contain one or more media). The mass Mm of the given sample mixture volume is determined. We assume that the sample probably consists of volatile hydrocarbon media. After intensive mixing, a small volume is taken from the sample, which is placed between two prisms. The edges of the two prisms that are in contact with the medium are equipped with special silicone gaskets. These gaskets form a small hermetic volume (the weight of the upper prism in our refractometer design presses one gasket against the other). This will significantly reduce the evaporation rate of the volatile hydrocarbon media. To form the light-shadow boundary, which is used to measure the refractive index nm, we use daylight (for example, the radiation of the Sun and lighting fixtures in the room). The spectrum of this light contains a yellow Na line (λ = 589.3 nm), on which measurements of refractive indices of various condensed media are carried out for comparison with standard ones made in laboratories. To do this, it is necessary that the light enters only on the face at one of the prisms, which is in contact with the liquid mixture. No light should enter the second prism at this moment. As a result, at the exit from prism 1 (let it be the lower prism), a light-shadow boundary is formed and the next value of the refractive index nb is measured. Further, the light flow to the prism of 1 is stopped. Now, only the prism of 2 is receiving light (let it be the top prism of 2 that sits on top of the gasket of the bottom prism of 1). The value of the refractive index nt is measured along the light-shadow boundary. The temperature T of the investigated mixture and the prisms is the same. The T value corresponds to the air temperature outdoors or indoors, since they are in the same conditions.
It should be noted that two measurements of the refractive indices nt and nb in the upper and lower layers of the investigated mixture must be carried out very quickly (during the time interval Δt = 5–7 s). During this time, in the measured two layers (top and bottom) there will be no significant movement between the media that make up the mixture. In a sealed volume, which we implemented in the new design of the refractometer, the evaporation of volatile hydrocarbon media over such a time can be considered insignificant. The temperature T during the time Δt almost does not change.
According to the measurement results, the following relation should be obtained: nt = nb. This means that the sample is well mixed. If this ratio is not met, the sample must be remixed. This is one of the features of the method we developed for visible light. This feature makes it possible to exclude in advance one measurement error, which very often occurs when using industrial small-sized refractometers operating on the TIR phenomenon during the express control of mixtures consisting of volatile hydrocarbon media. Further, the measured value of nt (taking into account the temperature T) is compared with the standard values of volatile hydrocarbon media (gasoline, kerosene, etc.). If there is a match, then the process of the express control of this sample is completed (the medium is installed and its quality is confirmed).
If it was not possible to determine the medium by the measured value nt (the sample has been between the prisms all this time), then the measurement process continues. It is necessary to wait between the first measurements of nt and nb for a time of the order of 120–130 s. During this time, changes will occur in the investigated layers of the mixture placed in a sealed volume. The light fraction of the sample will rise to the top layer of the mixture and form contact with the top prism edge. The heavy fraction will sink down and form contact with the lower prism face. During this time, the ambient temperature T may change. Therefore, measurements should be started from the upper face of the prism. In measuring the refractive index value of and temperature T1, the T1 value may differ from the temperature during the first measurements on this sample. Next, the light is fed to the lower prism and measures the refractive index value of at the same temperature T1. These two measurements must be realized in a time interval Δt. Based on the measured values of and (taking into account the temperature T1), it is possible to determine the media at the upper and lower levels of the mixture. This allows the determination of the composition of the mixture.
A mixture of three volatile hydrocarbon media is extremely rare. It is difficult to use such mixtures as fuel for various vehicles. This mixture can be formed in very rare cases due to a person’s great carelessness when storing fuel or changing containers. Basically, this case applies to gasoline. This case will also be considered in our work.
To determine the volatile hydrocarbon media concentrations in the investigated mixture, the basic refraction equation is [67,68,71,72,73,80,83]:
where nm—the refractive index of the mixture measured at the initial moment (nm = nt = nb), n1, n2 …….nn—values of refractive indices of media that the investigated mixture may consist of, K1, K2 ……Kn—coefficients that characterize the relative content of various media in the investigated mixture (if it is necessary to determine the percentage, these coefficients are multiplied by 100%).
nm = K1n1 + K2n2 + ……+ Knnn
Taking into account the measurement method developed by us (for the case of the content of only two volatile hydrocarbon media from the investigated mixture), Equation (1) takes the following form:
In Equation (2) the three measured values (nt, , ) of the refractive index are known. In this case, in accordance with the Cauchy theorem, Equation (2) has a unique solution with respect to the coefficients K1 and K2. The concentrations of media K1 and K2 in the mixture are uniquely determined. The process of the express control of the state and composition of the sample is completed.
The solution of Equation (2) with respect to coefficients K1 and K2 in some cases does not exist (for example, due to the presence of three volatile hydrocarbon media or dissolved impurities in the mixture). For the case of the presence of three hydrocarbon media in the investigated sample, Equation (2) must be transformed into the following form:
An unambiguous solution of Equation (3) with respect to the coefficients K1, K2, K3 and the selected value n3 for three measured values (nt, , ) is not presented. There will be a large number of options for solving Equation (3) by the coefficients K1, K2, and K3, taking into account the choice of the real refractive index n3 of the third medium. The third medium is selected from real conditions (the color of the mixture of the volatile hydrocarbon media should not change). For example, it does not make sense to mix diesel fuel strongly with gasolines (the media differ in color (gasoline is pale yellow, diesel fuel is the color of brewed tea)). The presence of a foreign medium in gasoline will be very clearly visible visually. On the contrary, you can add a little of two different gasolines to diesel fuel. It will be less noticeable visually. Therefore, after obtaining all possible values of K1, K2, K3, and n3, it is necessary to analyze the obtained data.
Results that are contrary to logic and real life should be rejected. For example, a mixture of gasolines of the AI-95 and AI-92 brands and alcohol (methanol) was obtained in a ratio of 0.4:0.3:0.3. In reality, there can be no such fuel for a car. Of the real results of solving Equation (3), there will be a maximum of two or three options. In these variants, we know the mixture composition and its weight coefficients. To unambiguously determine the coefficients K1, K2, and K3 and the third component in the mixture, we developed the following method based on the mass ratio. To implement it, before measuring the refractive indices using a refractometer, the sample was weighed. The value of the mass Mm was obtained. Depending on the volume of the studied mixture (for example, the volume is 10 or 100 mL), the value of the mass will be different. Next, the following proportion is drawn up:
where ρ1, ρ2, and ρ3 are values of densities of the two media established by us in a mixture and one media assumed by us. When choosing a density value, the value of temperature T1 must be taken into account.
Mm = Vm (ρ1K1 + ρ2K2 + ρ3K3)
The fulfillment of Equation (4) makes it possible to unambiguously establish the values of K1, K2, and K3, as well as the value of n3, which allows one to determine the type of the third medium. Therefore, during the use of this technique in express control, it is necessary to have a measuring vessel with a volume of 10 mL and a scale with a measurement error of 0.1 g or less to solve this task.
The values ρ1, ρ2, and ρ3 for different temperatures of T for all brands of gasoline and diesel fuel are determined using the following ratio:
where T0 = 293 K, n is the medium number in the mixture, Δρn is value of temperature correction, which is a known value for all manufactured petroleum products, and T1 is the temperature of the mixture at the measuring of and .
ρn(T) = T0 − Δρ·(T0 − T1)
It may turn out that there is no solution for Equation (4). In addition, the measured value nm = nt = nb does not correspond to any known hydrocarbon medium and the measured values of nt and nb do not change over time. In this case, the research medium is considered to be of poor quality. The sample is sent for analysis to a stationary laboratory. This medium is temporarily unused. It can be argued that the medium contains dissolved impurities that are not related to hydrocarbons. These impurities are difficult to visually determine.
3. The Design of Small-Size Refractometer and Principal Realization of Refractive Index Measuring
For the practical implementation of the proposed method during the express control of the volatile hydrocarbon media state and its mixtures, a design of a small-sized refractometer was developed. A feature of the use of this refractometer design is that the refractive index measurements can be carried out in visible light (for example, sunlight, under artificial lighting in rooms or using a stationary or portable light source, for example, a lamp). Figure 1 shows the block diagram of the optical part of the refractometer and the light ray propagation for two cases of measuring the refractive indices of the investigation mixture. For case (a) the value of nt is measured; for (b), the value of nb is measured.
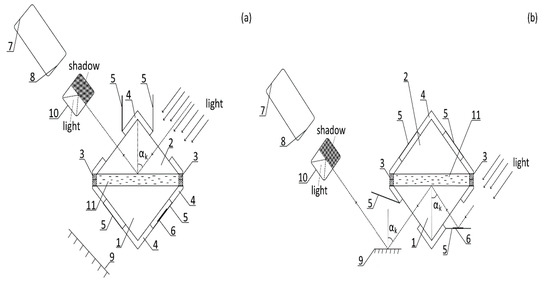
Figure 1.
The structural diagram of the optical refractometer part and ray propagation in the upper (a) and lower (b) prism: 1 is lower triangular prism (leucosapphire material), 2 is upper triangular prism (leucosapphire material), 3 is silicone gaskets, 4 is swivel mount of prisms, 5 is closing shutter, 6 is mirror, 7 is eyepiece, 8 is lens on movable mount, 9 is mirror, 10 is plate for registration of the light-shadow boundary, and 11 is research mixture.
In the developed design of the refractometer using silicone gasket 3, the possibility of placing a liquid medium in a sealed volume is realized. This volume is located between two prisms 1 and 2 (Figure 1).
Using specialized movable covers 5, it is possible to control the light flow on the prism faces 1 and 2. For light to enter the prism 1, a flat mirror 6 is placed on one of the covers 5. The reflected light rays from the mirror 6 arrive at the edge of the prism 1 and pass into the prism interior at different angles. Next, the light rays enter the face of the prism 1, which is in contact with the investigated liquid medium 11. The rays part experiences total internal reflection from the prism-investigation medium boundary and comes after the mirror 9 to a translucent plate 10 with a grid in the crosshair form. This rays part forms the light part of the image on the plate 10. The rest of the rays part is refracted and reflected on the boundary layer to the prism face and the investigated medium 11. The reflected part of these rays after the mirror 9 forms a dark part of the light (shadow) on the plate 10. The boundary between light and shadow is determined by the critical angle αh of the light beam incidence on the boundary between the prism and the investigated medium (Figure 1).
The value of αh is determined at the next relation:
where np—the refractive index of the material that made the prism.
αh = arcsin (nm/np)
The position of the light-shadow boundary is related to the rotation angle of plate 10 with respect to the angle αh. In the case of placing the border light-shadow in the crosshairs of the plate 10, the rotation angle of the plate 10 becomes equal to αh. The value of nm is determined from Equation (6). The calibration of the refractometer scale is made in accordance with the Equation (6). The measurement accuracy nm is determined by the mechanics of adjusting the position of the plate 10; also, by providing the conditions for the incidence of part of the light rays used for measurements on the front faces of the prism 1 and 2 at an angle of 90 degrees. To do this, the user can adjust the position of the mirror 6 by changing the angle of the cover 5 with respect to the direction of the incident light.
4. Results and Discussion
In Figure 2, Figure 3 and Figure 4, for example, the investigation results of two hydrocarbon media mixtures obtained using the refractometer design developed by us are presented. Using the method developed by us, the results of these investigations determined the mixture composition and the ratio between the components in it.
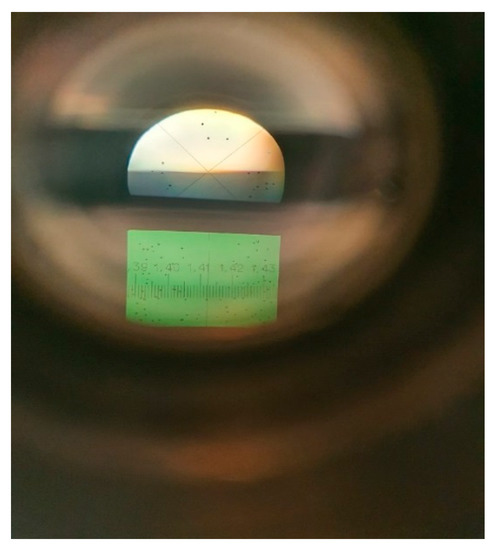
Figure 2.
The light-shadow boundary and refractometer scale measuring the refractive indices of two gasolines of AI-92 and AI-80 brands in a mixture at the ratio of 0.7 to 0.3.
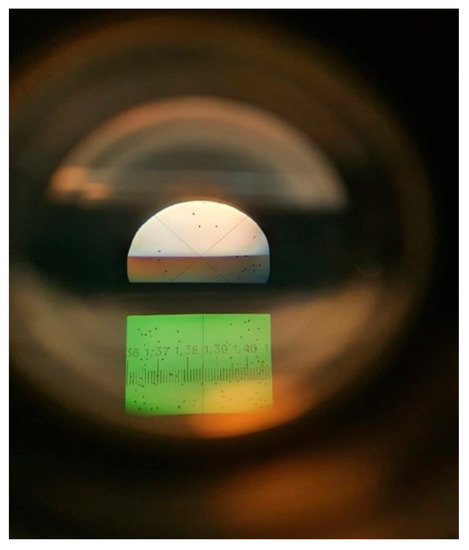
Figure 3.
The light-shadow boundary and the refractometer scale measuring a mixture of two gasolines (AI-92 and AI-80) using the upper prism 1 (Figure 1). Gasolines of AI-92 and AI-80 brands are mixed in a proportion of 0.7 to 0.3.
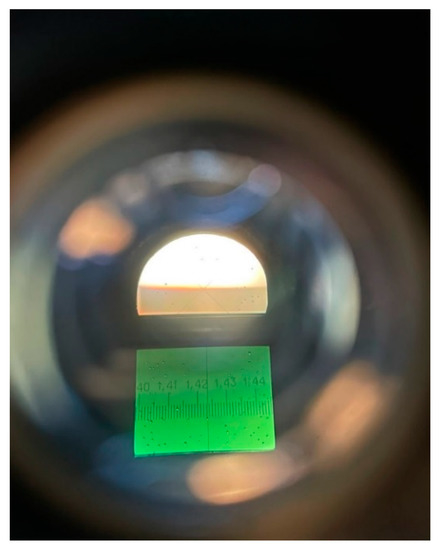
Figure 4.
The light-shadow boundary and the refractometer scale measuring a mixture of two gasolines (AI-92 and AI-80) using the lower prism 2 (Figure 1). Gasolines of AI-92 and AI-80 brands are mixed in a proportion of 0.7 to 0.3.
At the initial time of measurement (after mixing the mixture under investigation), the following values were obtained: nm = nt = nb = 1.4121 ± 0.0004 (for T = 300.2 K). Then, after 140 s, in accordance with the developed method, two measurements were made using visible light entering the faces of the upper 2 and lower 1 triangular prism in turn (Figure 1). Figure 3 and Figure 4 show the results of these measurements.
This made it possible to establish two values of the refractive index: = 1.3850 ± 0.0004 (for T = 300.3 K) and = 1.4235 ± 0.0004 (for T = 300.3 K). The analysis of the data obtained showed that the top layer of the mixture contained gasoline of the AI-80 brand, and the bottom layer of the mixture contained gasoline of the AI-92 brand. Using Equation (2) for the measured values of the refractive indices nt, , , the coefficients K1 = 0.2978 and K2 = 0.7022 were obtained. The obtained values of the coefficients K1 and K2 with an insignificant error correspond to the concentrations of gasolines AI-80 and AI-92 in the mixture prepared by us for research. This confirms the adequacy of the method developed by us for monitoring the state of volatile hydrocarbon media and their mixtures.
To check the reliability of the refractometer design developed by us, we compared the measured refractive index nm of a 50% aqueous ethanol solution and Rheinol PRIMUS PX 5W-40 engine oil with a slight change in temperature T in the laboratory with the results of other measurements. The comparison was carried out with the data obtained using an industrial Abbe NAR-2T refractometer (measurement error ± 0.0002). It should be noted that a water-alcohol 50% ethanol solution is a volatile compound with a high evaporation rate. In Table 1 and Table 2 are presented the investigation results of the change in nm from T using two refractometers.

Table 1.
The change in the refractive index nm of a water-alcohol 50% ethanol solution from temperature T.
Table 2.
The change in the refractive index nm of engine oil “Rheinol PRIMUS PX 5W-40” from temperature T.
The obtained values of nm using two devices coincide within the measurement error. This confirms the reliability of refractive index measurements using the refractometer design developed by us.
To demonstrate the functionality possibilities of the developed design of a small-sized refractometer, we researched the changes in the refractive index nm of various hydrocarbon media and their mixtures as a result of changes in temperature T. The results of the investigations are presented in Figure 5 and Figure 6.
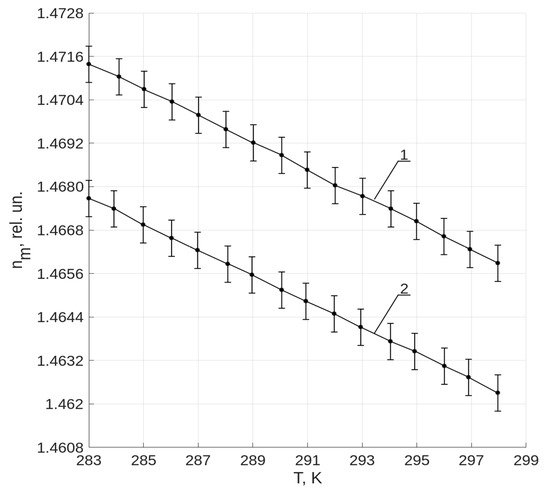
Figure 5.
The dependence of the change in the refractive index nm of Rheinol PRIMUS PX 5W-30 motor oil from temperature T. The graphs correspond to the state of the motor oil: 1 is standard; 2 is the presence in the oil of gasoline of the AI-80 brand.
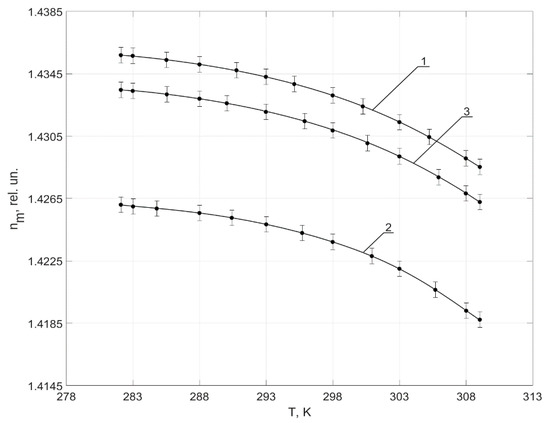
Figure 6.
The dependence of the change in the refractive index nm of different gasolines and their mixtures on temperature T. Graphs 1, 2, and 3 correspond to: gasoline of AI-95 brand; gasoline of AI-92 brand; and gasoline mixture of AI-95 and AI-92 brands in a proportion of 0.7 to 0.3.
The obtained results coincide in the dependence change structure of nm from T with the investigations results carried out by other scientists [65,66,67,68,70,71,72,73,74,82,83,84,85,86,87,88,89]. This once again confirms the great functionality of the refractometer developed by us.
To test our proposed method for determining the composition and concentrations of a mixture of three volatile hydrocarbon media, a mixture was prepared that consisted of three gasolines of AI-95, AI-92, and AI-80 brands (Russian Federation). These gasolines in the prepared mixture were in the following ratio of 94:4:2. For preparation, a vessel with a marking of 100 mL was used (scale division 0.2 mL). This allowed a volume of 2 and 4 mL in this mixture, to ensure an error of no more than 0.1 mL. In the case of forming a volume of 94 mL in a mixture, the error is about 0.2 mL, since there is evaporation when pouring the gasoline of the AI-95 brand into a flask. After mixing, the prepared mixture was placed between the prisms in a refractometer, and the following values were obtained: nm = nt = nb = 1.4312 ± 0.0004 (at T = 298.2 K). Further, in the sealed volume between the prisms of the refractometer, the mixture under study remained for about 180 s.
After that, we measured the values of the refractive index for the upper layer = 1.3861 ± 0.0004 (at T = 297.9 K) and bottom layer = 1.4246 ± 0.0004 (at T = 297.9 K) in the manufactured mixture. An analysis of the obtained values of the refractive indices showed that the gasoline of the AI-80 brand was in the upper layer of the mixture, and the gasoline of the AI-92 brand was in the lower layer of the mixture. The measured values of and coincided within the measurement error with the refractive indices of these gasoline brands.
Based on the conditions under which this method is used to study the state of the mixture, then between the gasoline layers of the AI-80 and AI-92 brands, there should be a volatile hydrocarbon medium (fuel). This medium does not enter into a chemical reaction with gasolines of the AI-92 and AI-80 brands. Data analysis on the density values of volatile hydrocarbon media used as fuel showed that this medium could be gasoline of the AI—95 brand (n = 1.4326 ± 0.0004 at T = 297.9 K) and straight-run aviation kerosene (n = 1.4274 ± 0.0004 at T = 297.9 K). Based on measured values nm, and , as well as the possible value n3, which corresponds to gasoline of the AI—95 brand or straight-run aviation kerosene (SAK), Equation (3) was solved. As a result of solving Equation (3), more than 100 different options for the coefficients K1, K2, and K3 were obtained for two possible options for the third medium in the mixture, for example, a variant of a mixture consisting of three gasolines of AI-80, AI-92, and AI-95 brands with coefficients K1 = 0.0203, K2 = 0.0408, and K3 = 0.9389. Another option is that the mixture contains the gasoline of the AI-80 brand, the gasoline of the AI-92 brand, and the straight-run aviation kerosene with coefficients K1 = 0.0403, K2 = 0.8812, and K3 = 0.0785. Another option is the same composition of the components that are contained in the mixture with the coefficients K1 = 0.0423, K1 = 0.8003, and K3 = 0.1574.
On the other hand, logic suggests that, for example, in 100 L of the mixture (if we assume that we are examining the gasoline of the AI-92 brand) there cannot be, for example, 15 L of straight-run aviation kerosene. There are a lot of such unrealistic options in the case of solving Equation (3). We exclude these options from further consideration, since in reality the probability of the occurrence of these events is close to zero.
Next, the prepared mixture is weighed with a volume of Vm = 100 mL. It should be noted that during express control on the territory, we will mainly weigh the mixture in a volume of 10 mL. If possible, no one weighs the test mixture in a volume of 100 mL. For scales to control such a weight there is no problem. After weighing, the following value of mass Mm = 74.42 ± 0.10 gr of the research mixture was obtained. Theoretically, it is possible to use scales with an error of ± 0.05 gr. This will increase the accuracy of determining K1, K1, and K3. The obtained value of Mm will be used to check the solutions for coefficients K1, K2, and K3 obtained using the gasoline of the AI-95 brand or straight-run aviation kerosene as the third medium in the investigation mixture. For the temperature T = 297.9 K, the densities ρ of all four media were determined using Equation (5), which is used to confirm the reliability of the coefficients K1, K2, and K3 using Equation (4). The density values of these media are presented in Table 3.
Table 3.
The values of density of various media at T = 297.9 K.
The results of the substitution of all obtained values of the coefficients K1, K2, and K3 into Equation (4) for the two variants of the medium (the gasoline of the AI-95 brand or the straight-run aviation kerosene), which is placed in the mixture between the gasoline layers of the AI-80 and AI-92 brands, allowed an unambiguous solution. The third medium in the investigation mixture is the gasoline of AI-95 brand. The ratio between the coefficients in the investigation mixture is as follows: K1 = 0.0203, K2 = 0.0408, K3 = 09389. The results obtained for the gasoline concentrations in the mixture coincide within the measurement error with the values of gasoline concentrations used to prepare this mixture.
To confirm the composition of the prepared mixture and the concentration of components in it, investigations were carried out using a desktop NMR spectrometer “Pulsar” (company Oxford Instruments). The obtained results of the research showed that the mixture composition and the concentration of components in it did not change during measurements using the new method and the developed design of refractometer.
5. Conclusions
The obtained investigation results of different volatile hydrocarbon media and their mixtures confirm the validity of using the new method we developed to control its state. It should be noted that the use of the new method developed by us makes it possible to unambiguously determine the composition and component concentrations for mixtures consisting of two or three volatile hydrocarbon media. This takes less than 5 min. There are no analogs worldwide to the new method we have developed for express control.
The analysis of data from the various media investigations obtained using the small-sized refractometer we developed shows its high-functionality possibilities. The new refractometer design makes it possible to measure the refractive index of condensed media in the range from 1.2500 to 1.7000 at various temperatures T with a measurement error of 0.0004. The weight of the new refractometer does not exceed 2 kg. The measurements are carried out in visible light. If necessary, the user can use the light of a flashlight, for example, from a mobile phone. Software and a database of various media parameters for implementing the method we developed can be placed, for example, in an iPhone. This is extremely convenient when controlling the state of hydrocarbon media and their mixtures and transmitting information about the obtained results. No analogs of similar small-sized refractometers exist for the express control of condensed media.
These investigations in the future could have the following direction. Our method does not allow for the unambiguous control of a mixture state consisting of four types of hydrocarbon media, for example, gasoline of the AI-95 brand, straight-run aviation kerosene (SAK), gasoline of the AI-92 brand, and gasoline of the AI-80 brand. Using only two Equations (3) and (4) developed by us does not allow us to obtain an unambiguous answer regarding the mixture composition and the ratio between the concentrations of various hydrocarbon media in it. Therefore, it will be necessary to develop another equation for solving such problems and supplementing the method we have developed.
Another option for solving this problem may be associated with the development of a new method and, consequently, a new design of a refractometer for its implementation.
Author Contributions
Conceptualization, V.D.; methodology, V.D.; software, D.P.; validation, G.S., N.R. and D.V.; formal analysis, G.S., N.R. and V.D.; investigation, D.V.; resources, V.D., D.P. and D.V.; data curation, G.S.; writing—original draft preparation, V.D.; writing—review and editing, V.D.; visualization, D.V. and N.R.; supervision, G.S. and D.P.; project administration, V.D.; funding acquisition, V.D. All authors have read and agreed to the published version of the manuscript.
Funding
The research is partially funded by the Ministry of Science and Higher Education of the Russian Federation under the strategic academic leadership program ‘Priority 2030’ (Agreement 075-15-2021-1333 dated 30 September 2021).
Data Availability Statement
Not applicable.
Conflicts of Interest
The authors declare no conflict of interest.
Abbreviations
| NMR | nuclear magnetic resonance |
| TIR | total internal reflection |
| nm | refrective index of investigation medium |
| nt | refrective index of upper layer a the investigation mixture for first measurement |
| nb | refrective index of lower layer a the investigation mixture for first measurement |
| Kn | coefficients in the refraction equation |
| refrective index of upper layer a the investigation mixture for second measurement | |
| refrective index of lower layer a the investigation mixture for second measurement | |
| Mm | mass of investigation mixture |
| Vm | volume of investigation mixture |
| ρn | hydrocarbon medium density |
| Δρ | temperature correction for hydrocarbon media |
| SAK | straight-run aviation kerosene |
References
- Liu, B.; Lund, J.R.; Liao, S.; Jin, X.; Liu, L.; Cheng, C. Optimal power peak shaving using hydropower to complement wind and solar power uncertainty. Energy Convers. Manag. 2020, 209, 112628. [Google Scholar] [CrossRef]
- Patil, P.R.; Tanavade, S.; Dinesh, M.N. Analysis of Power Loss in Forward Converter Transformer Using a Novel Machine Learning Based Optimization Framework. Technol. Econ. Smart Grids Sustain. Energy 2022, 7, 21. [Google Scholar] [CrossRef]
- Sergeev, V.; Anikina, I.; Kalmykov, K. Using Heat Pumps to Improve the Efficiency of Combined-Cycle Gas Turbines. Energies 2021, 14, 2685. [Google Scholar] [CrossRef]
- Wu, G.; Ju, P.; Song, X.; Xie, C.; Zhong, W. Interaction and Coordination among Nuclear Power Plants, Power Grids and Their Protection Systems. Energies 2016, 9, 306. [Google Scholar] [CrossRef]
- Franke, T.; Agostinetti, P.; Aiello, G.; Avramidis, K.; Bachmann, C.; Bruschi, A.; Federici, G.; Garavaglia, S.; Granucci, G.; Grossetti, G.; et al. Review of the innovative HCD designs and the impact of their configurations on the performance of the EU DEMO fusion power plant reactor. IEEE Trans. Plasma Sci. 2018, 46, 1633–1640. [Google Scholar] [CrossRef]
- Treshcheva, M.; Anikina, I.; Sergeev, V.; Skulkin, S.; Treshchev, D. Selection of Heat Pump Capacity Used at Thermal Power Plants under Electricity Market Operating Conditions. Energies 2021, 14, 226. [Google Scholar] [CrossRef]
- Novikova, O.V.; Erastov, A.E.; Livshits, S.A. Features of evaluating the efficiency indicators of the electric power enterprise. E3S Web Conf. 2019, 124, 05057. [Google Scholar] [CrossRef]
- Lee, K.-H.; Kim, M.-G.; Lee, J.I.; Lee, P.-S. Recent Advances in Ocean Nuclear Power Plants. Energies 2015, 8, 11470–11492. [Google Scholar] [CrossRef]
- Vidal, J.V.; Rolo, P.; Carneiro, P.M.R.; Kholkin, A.L.; Soares dos Santos, M.P. Automated electromagnetic generator with self-adaptive structure by coil switching. Appl. Energy 2022, 325, 119802. [Google Scholar] [CrossRef]
- Sani, M.A.A.; Azharshah, M.D.A.; Yusof, M.I.; Sama’in, M.U.S.; Sani, N.S. Development of a Low-Cost Hydroelectric Generation System for Application on Water Pipelines. Adv. Struct. Mater. 2022, 174, 123–131. [Google Scholar] [CrossRef]
- Zargari, S.; Koozehkanani, Z.D.; Veladi, H.; Sobhi, J.; Rezania, A. Cost-effective fabrication approaches for improving output performance of triboelectric energy harvesters. J. Electrost. 2022, 115, 103640. [Google Scholar] [CrossRef]
- Ristic, M.; Vasovic, I.; Perisic, J. Revitalization and Optimization of Thermoenergetic Facilities. Lect. Notes Netw. Syst. 2020, 90, 221–249. [Google Scholar] [CrossRef]
- Lu, Q.; Xu, S.; Shao, H.; Ban, D.; Wang, C. Improving power conversion efficiency in luminescent solar concentrators using nanoparticle fluorescence and scattering. Nanotechnology 2020, 31, 455205. [Google Scholar] [CrossRef] [PubMed]
- Park, S.; Cho, Y.; Kim, S.; Lee, K.; Yi, J. Effect of Cell Electrical Mismatch on Output of Crystalline Photovoltaic Modules. Energies 2022, 15, 7438. [Google Scholar] [CrossRef]
- Shpeizman, V.V.; Nikolaev, V.I.; Pozdnyakov, A.O.; Timashov, R.B.; Averkin, A.I. Strength of Silicon Single-Crystal Wafers for Solar Cells. Tech. Phys. 2020, 65, 73–77. [Google Scholar] [CrossRef]
- Boudjemila, L.; Krasnoshchekov, V.; Olimov, S.; Diuldin, M.; Kasimakhunova, A. Some features of photoelectrical properties of highly efficient solar cells based on Si. In Proceedings of the IEEE International Conference on Electrical Engineering and Photonics, EExPolytech, St. Petersburg, Russia, 15–16 October 2020; Volume 9244000, pp. 223–226. [Google Scholar] [CrossRef]
- Boudjemila, L.; Malyshkin, V.G.; Rud, V.Y. Features of Degradation of Silicon-based Solar Photovoltavic Cells. J. Phys. Conf. Ser. 2021, 2086, 012079. [Google Scholar] [CrossRef]
- Burlakovs, J.; Vincevica-Gaile, Z.; Krievans, M.; Tamm, T.; Klavins, M. Platinum group elements in geosphere and anthroposphere: Interplay among the global reserves, urban ores, markets and circular economy. Minerals 2020, 10, 558. [Google Scholar] [CrossRef]
- Davydov, R.; Antonov, V.; Makeev, S.; Batov, Y.; Dudkin, V.; Myazin, N. New high-speed system for controlling the parameters of a nuclear reactor in a nuclear power plant. E3S Web Conf. 2019, 140, 02001. [Google Scholar] [CrossRef]
- Gulevich, A.V.; Dekusar, V.M.; Chebeskov, A.N.; Kuchinov, V.P.; Voloshin, N.P. Possibility of Fast-Reactor Exportation Under an International Nuclear Non-Proliferation Regime. At. Energy 2020, 127, 192–195. [Google Scholar] [CrossRef]
- Alekseev, P.N.; Gagarinskii, A.Y.; Kalugin, M.A.; Kukharkin, N.E.; Semchenkov, Y.M.; Sidorenko, V.A.; Subbotin, S.A.; Teplov, P.S.; Fomichenko, P.A.; Asmolov, V.G. Nuclear Power in Russia. At. Energy 2019, 126, 207–212. [Google Scholar] [CrossRef]
- Davydov, R.; Dudkin, V.; Logunov, S.; Bobyl, A. Optical Method for Controlling the Flow Rate of the Coolant in Nuclear Reactors. In Proceedings of the 2021 International Conference on Electrical Engineering and Photonics, EExPolytech, St. Petersburg, Russia, 14–15 October 2021; pp. 179–183. [Google Scholar] [CrossRef]
- Davydov, V.V.; Velichko, E.N.; Karseev, A.Y. Fiber-optic system for simulating accidents in the cooling circuits of a nuclear power plant. J. Opt. Technol. 2015, 82, 132–135. [Google Scholar] [CrossRef]
- Klinov, D.A.; Gulevich, A.V.; Kagramanyan, V.S.; Dekusar, V.M.; Usanov, V.I. Development of Sodium-Cooled Fast Reactors Under Modern Conditions: Challenges and Stimuli. At. Energy 2019, 125, 143–148. [Google Scholar] [CrossRef]
- Rowinski, M.K.; White, T.J.; Zhao, J. Small and Medium sized Reactors (SMR): A review of technology. Renew. Sustain. Energy Rev. 2015, 44, 643–656. [Google Scholar] [CrossRef]
- Nourelfath, M.; Lababidi, H.M.S.; Aldowaisan, T. Socio-economic impacts of strategic oil and gas megaprojects: A case study in Kuwait. Int. J. Prod. Econ. 2022, 246, 108416. [Google Scholar] [CrossRef]
- Ocampo Batlle, E.A.; Escobar Palacio, J.C.; Silva Lora, E.E.; Bortoni, E.D.C.; Horta Nogueira, L.A.; Carrillo Caballero, G.E.; Vitoriano Julio, A.A.; Escorcia, Y.C. Energy, economic, and environmental assessment of the integrated production of palm oil biodiesel and sugarcane ethanol. J. Clean. Prod. 2021, 311, 127638. [Google Scholar] [CrossRef]
- De Paulo, E.H.; dos Santos, F.D.; Folli, G.S.; Santos, L.P.; Nascimento, M.H.C.; Moro, M.K.; da Cunha, P.H.P.; Castro, E.V.R.; Cunha Neto, A.; Filgueiras, P.R. Determination of gross calorific value in crude oil by variable selection methods applied to 13C NMR spectroscopy. Fuel 2022, 311, 122527. [Google Scholar] [CrossRef]
- Gafurov, M.; Mamin, G.; Gracheva, I.; Murzakhanov, F.; Ganeeva, Y.; Yusupova, T.; Orlinskii, S. High-Field (3.4 T) ENDOR Investigation of Asphaltenes in Native Oil and Vanadyl Complexes by Asphaltene Adsorption on Alumina Surface. Geofluids 2019, 267, 3812875. [Google Scholar] [CrossRef]
- Mir, H.; Ratlamwala, T.A.H.; Hussain, G.; Alkahtani, M.; Abidi, M.H. Impact of sloshing on fossil fuel loss during transport. Energies 2020, 13, 2625. [Google Scholar] [CrossRef]
- Pan, C.; Ciccarelli, G.; Zhao, J.; Zhu, X.; Wang, X. Evolution characteristics of vented gaseous ethanol-gasoline air explosions in a small cuboid channel. J. Loss Prev. Process Ind. 2022, 80, 104861. [Google Scholar] [CrossRef]
- Kashaev, R.S. Structural Dynamic Ordering and the Pair Potential of Interparticle Interactions. Russ. J. Phys. Chem. A 2019, 93, 1497–1504. [Google Scholar] [CrossRef]
- La Colla, N.S.; Botté, S.E.; Marcovecchio, J.E. Atmospheric particulate pollution in south american megacities. Environ. Rev. 2021, 29, 415–429. [Google Scholar] [CrossRef]
- Bocian, P.; Biernat, K.; Matuszewska, A.; Bukrejewski, P.; Noworyta, K.R. Electrochemical impedance spectroscopy studies of gasoline oxidative stability—Attempt to devise new gasolines chemical stability index. Fuel 2021, 288, 119620. [Google Scholar] [CrossRef]
- Wang, H. Operation analysis of FCC unit for adapting to the crude oil deterioration. Pet. Refin. Eng. 2021, 51, 18–21. [Google Scholar]
- Sun, Y.; Sun, W.; Guo, L.; Zeng, W.; Lin, S. An experimental investigation of wide distillation fuel based on CTL on the combustion performance and emission characteristics from a CI engine. Fuel 2021, 310, 122262. [Google Scholar] [CrossRef]
- Hidalgo, K.J.; Sierra-Garcia, I.N.; Dellagnezze, B.M.; de Oliveira, V.M. Metagenomic Insights Into the Mechanisms for Biodegradation of Polycyclic Aromatic Hydrocarbons in the Oil Supply Chain. Front. Microbiol. 2020, 11, 561506. [Google Scholar] [CrossRef]
- Sonntag, D.B.; Baldauf, R.W.; Yanca, C.A.; Fulper, C.R. Particulate matter speciation profiles for light-duty gasoline vehicles in the United States. J. Air Waste Manag. Assoc. 2014, 64, 529–545. [Google Scholar] [CrossRef]
- Berthome, V.; Chalet, D.; Hetet, J.-F. Consequence of Blowby Flow and Idling Time on Oil Consumption and Particulate Emissions in Gasoline Engine. Energies 2022, 15, 8772. [Google Scholar] [CrossRef]
- Kashaev, R.S.; Kien, N.C.; Tung, T.V.; Kozelkov, O.V. Fast Proton Magnetic Resonance Relaxometry Methods for Determining Viscosity and Concentration of Asphaltenes in Crude Oils. J. Appl. Spectrosc. 2019, 86, 890–895. [Google Scholar] [CrossRef]
- Davydov, V.V.; Myazin, N.S.; Makeev, S.S.; Dudkin, V.I. A New Method to Study the Structure of NMR Signals Detected with the Aid of Modulation Procedure. Tech. Phys. 2020, 65, 1327–1332. [Google Scholar] [CrossRef]
- Tang, C.H.; Buskey, E.J. Impaired grazing of marine protozoa in sub-lethal exposure to the water accommodated fraction of crude oil and dispersant. Environ. Pollut. 2022, 315, 120414. [Google Scholar] [CrossRef]
- Xu, M.; Zhang, H.; Rudolph, M. Influences of oil collector on surface air nucleation in fine graphite flotation. Sep. Purif. Technol. 2022, 303, 122165. [Google Scholar] [CrossRef]
- Lin, H.; Li, Q.; Zhang, L.; Zhang, S.; Hu, X. Hydrothermal carbonization of sawdust with the bio-oil of same origin impacts evolution of structures of hydrochar. Fuel Process. Technol. 2022, 238, 107516. [Google Scholar] [CrossRef]
- Mora, M.; Fàbregas, E.; Céspedes, F.; Bartrolí, J.; Puy, N. Production and separation of value-added compounds from pine wood using pyrolysis and biorefinery techniques. Fuel Process. Technol. 2022, 238, 107509. [Google Scholar] [CrossRef]
- Gao, J.; Huang, J.; Li, X.; Yang, C.; Ma, C. Challenges of the UK government and industries regarding emission control after ICE vehicle bans. Sci. Total Environ. 2022, 835, 155406. [Google Scholar] [CrossRef] [PubMed]
- Sahu, T.K.; Kshatri, R.; Shukla, P. CImpact of Ethanol on Combustion, Performance, and Emission Characteristics of Diesel Engine. Energy Environ. Sustain. 2021, 2, 251–266. [Google Scholar] [CrossRef]
- Qin, L.; Wang, K.; Tian, F.; Zhang, F.; Yue, Y. Research on Boost Control Method for Turbocharged Gasoline Engine. Lect. Notes Electr. Eng. 2023, 818, 1305–1315. [Google Scholar] [CrossRef]
- Zhang, B.; Li, X.; Wan, Q.; Jia, G.; Yin, Z. Hydrocarbon emission control of an adsorptive catalytic gasoline particulate filter during cold-start period of the gasoline engine. Energy 2023, 262, 125445. [Google Scholar] [CrossRef]
- Li, Z.; Ying, Y.; Yang, M.; Zhao, L.; Du, W. Monitoring and path optimization of catalytic reformer in a refinery: Principal component analysis and A* algorithm application. Expert Syst. Appl. 2022, 209, 118358. [Google Scholar] [CrossRef]
- Zhu, X.-H.; He, H.-D.; Lu, K.-F.; Peng, Z.-R.; Gao, H.O. Characterizing carbon emissions from China V and China VI gasoline vehicles based on portable emission measurement systems. J. Clean. Prod. 2022, 378, 134458. [Google Scholar] [CrossRef]
- Makeev, S.S.; Myazin, N.S.; Rud, V.Y. Features of spectral analysis of nuclear magnetic resonance signal for express-control of hydrocarbon media. J. Phys. Conf. Ser. 2021, 2086, 012154. [Google Scholar] [CrossRef]
- Kashaev, R.S.; Kien, N.T.; Tung, C.V.; Kozelkov, O.V. Correlation of Physicochemical Properties of Bach Ho Oils with Proton NMR Relaxation Parameters and Their Temperature Dependence. Pet. Chem. 2019, 59, S21–S29. [Google Scholar] [CrossRef]
- Wu, Z.; Yu, Y.; Xie, W.; Liu, Y.; Hou, X. Flame Characteristics of Gasoline and a Water-in-Gasoline Mixture under a Controllable High-Temperature Thermal Atmosphere. ACS Omega 2022, 7, 38525–38535. [Google Scholar] [CrossRef] [PubMed]
- Zhao, L.; Li, X.; Xie, Y.-F.; Wu, J.-H.; Hu, W.-J. Prediction method of gasoline octane number based on adaptive variable weighting. Control Decis. 2022, 37, 2738–2744. [Google Scholar] [CrossRef]
- Guleria, G.; Lopez-Pintor, D.; Dec, J.E.; Assanis, D. A comparative study of gasoline skeletal mechanisms under partial fuel stratification conditions using large eddy simulations. Int. J. Engine Res. 2022, 23, 1658–1677. [Google Scholar] [CrossRef]
- Davydov, V.V.; Moroz, A.V.; Makeev, S.S.; Dudkin, V.V. Peculiarities of Registration of the Nuclear Magnetic Resonance Spectrum of a Condensed Medium During Express Control of Its State. Opt. Spectrosc. 2020, 128, 1678–1685. [Google Scholar] [CrossRef]
- D’yachenko, S.V.; Lebedev, L.A.; Sychev, M.M.; Nefedova, L.A. Physicomechanical Properties of a Model Material in the Form of a Cube with the Topology of Triply Periodic Minimal Surfaces of the Gyroid Type. Tech. Phys. 2018, 63, 984–987. [Google Scholar] [CrossRef]
- Myazin, N.S. Peculiarities of magnetic resonance signals processing during the express control of the liquid media state. J. Phys. Conf. Ser. 2019, 1236, 012026. [Google Scholar] [CrossRef]
- Sadovnikova, M.A.; Murzakhanov, F.F.; Mamin, G.V.; Gafurov, M.R. HYSCORE Spectroscopy to Resolve Electron–Nuclear Structure of Vanadyl Porphyrins in Asphaltenes from the Athabasca Oil Sands In Situ Conditions. Energies 2022, 15, 6204. [Google Scholar] [CrossRef]
- Davydov, V.V.; Dudkin, V.I.; Vysoczky, M.G. Small-size NMR Spectrometer for Express Control of Liquid Media State. Appl. Magn. Reson. 2020, 51, 653–666. [Google Scholar] [CrossRef]
- Safiullin, K.; Kuzmin, V.; Bogaychuk, A.; Klochkov, A.; Tagirov, M. Determination of pores properties in rocks by means of helium-3 NMR: A case study of oil-bearing arkosic conglomerate from North belt of crude oil, Republic of Cuba. J. Pet. Sci. Eng. 2022, 210, 110010. [Google Scholar] [CrossRef]
- Marusina, M.Y.; Bazarov, B.A.; Galaidin, P.A.; Marusin, M.P.; Silaev, A.A.; Zakemovskaya, E.Y.; Mustafaev, Y.N. Design of a Gradient System for a Multiphase Flowmeter. Meas. Tech. 2016, 57, 580–586. [Google Scholar] [CrossRef]
- Zverev, D.G.; Lukin, S.N.; Rodionov, A.A.; Shurtakova, D.V.; Gafurov, M.R. Multipurpose portable q-band bridge. Magn. Reson. Solids 2021, 23, 21201. [Google Scholar] [CrossRef]
- Morales-Luna, G.; Herrera-Domínguez, M.; Pisano, E.; Balderas-Elizalde, A.; Hernandez-Aranda, R.I.; Ornelas-Soto, N. Plasmonic biosensor based on an effective medium theory as a simple tool to predict and analyze refractive index changes. Opt. Laser Technol. 2020, 131, 106332. [Google Scholar] [CrossRef]
- Davydov, V.; Gureeva, I.; Dudkin, V. Flowing Refractometer for Feed Water State Control in the Second Loop of Nuclear Reactor. Energies 2022, 15, 457. [Google Scholar] [CrossRef]
- Morales-Luna, G.; García-Valenzuela, A.; Barrera, R.G. Optical Coherent Reflection from a Confined Colloidal Film: Modeling and Experiment. J. Phys. Chem. B 2018, 122, 8570–8581. [Google Scholar] [CrossRef] [PubMed]
- Bhardwaj, V.K.; Maini, S. Compact and self-aligned fluid refractometer based on the Doppler-induced self-mixing effect. Appl. Opt. 2020, 59, 3064–3072. [Google Scholar] [CrossRef]
- Davydov, V.V.; Grebenikova, N.M.; Smirnov, K.Y. An Optical Method of Monitoring the State of Flowing Media with Low Transparency That Contain Large Inclusions. Meas. Tech. 2019, 62, 519–526. [Google Scholar] [CrossRef]
- Luo, Y.; Guo, W.; Yu, L.; Xia, M.; Li, W.; Yang, K. High-precision algorithms for critical angle refractive index measurement. Appl. Opt. 2019, 58, 6057–6062. [Google Scholar] [CrossRef]
- Karabegov, M.A. The dynamic characteristics of automatic analyzers. Meas. Tech. 2013, 55, 1301–1310. [Google Scholar] [CrossRef]
- Shur, V.L.; Naidenov, A.S.; Lukin, A.Y.; Leibengardt, G.I. A liquid autocollimation refractometer. Meas. Tech. 2006, 49, 815–819. [Google Scholar] [CrossRef]
- Ojeda-Mendoza, G.J.; Contreras-Tello, H.; Rojas-Ochoa, L.F. Refractive index matching of large polydisperse silica spheres in aqueous suspensions. Colloids Surf. A Physicochem. Eng. Asp. 2018, 538, 320–326. [Google Scholar] [CrossRef]
- Xu, B.; Yang, Y.; Jia, Z.; Wang, D.N. Hybrid Fabry-Perot interferometer for simultaneous liquid refractive index and temperature measurement. Opt. Express 2017, 25, 14483–14493. [Google Scholar] [CrossRef] [PubMed]
- Davydov, V.V.; Makeev, S.S.; Dudkin, V.I. Method for Monitoring the Longitudinal Relaxation Time of Flowing Liquids Over the Entire Range of Flow Rate Measurements. Meas. Tech. 2020, 63, 368–374. [Google Scholar] [CrossRef]
- O’Neill, K.T.; Brancato, L.; Stanwix, P.L.; Fridjonsson, E.O.; Johns, M.L. Two-phase oil/water flow measurement using an Earth’s field nuclear magnetic resonance flow meter. Chem. Eng. Sci. 2019, 202, 222–237. [Google Scholar] [CrossRef]
- Chandrasekera, T.C.; Mitchell, J. Numerical inversion methods for recovering negative amplitudes in two-dimensional nuclear magnetic resonance relaxation-time correlations. Phys. Rev. E 2018, 98, 043308. [Google Scholar] [CrossRef]
- Aydin, E.; Makinwa, K.A.A. A Low-Field Portable Nuclear Magnetic Resonance (NMR) Microfluidic Flowmeter. In Proceedings of the 2021 21st International Conference on Solid-State Sensors, Actuators and Microsystems (Transducers), Orlando, FL, USA, 20–24 June 2021. [Google Scholar] [CrossRef]
- O’Neill, K.T.; Klotz, A.; Stanwix, P.L.; Fridjonsson, E.O.; Johns, M.L. Quantitative Multiphase Flow Characterisation Using an Earth’s Field NMR Flow Meter. Flow Meas. Instrum. 2017, 58, 104–111. [Google Scholar] [CrossRef]
- Chen, J.; Guo, W.; Xia, M.; Li, W.; Yang, K. In situ measurement of seawater salinity with an optical refractometer based on total internal reflection method. Opt. Express 2018, 26, 25510–25523. [Google Scholar] [CrossRef]
- Niskanen, I.; Räty, J.; Peiponen, K.-E. On the Immersion Liquid Evaporation Method Based on the Dynamic Sweep of Magnitude of the Refractive Index of a Binary Liquid Mixture: A Case Study on Determining Mineral Particle Light Dispersion. Appl. Spectrosc. 2017, 71, 1586–1592. [Google Scholar] [CrossRef]
- Guo, W.; Li, R.; Yu, L.; Chen, J.; Xia, M.; Li, W.; Yang, K. Self-referenced technology for refractive index measurement under mechanical vibration and temperature fluctuation. Appl. Opt. 2019, 58, 1862–1867. [Google Scholar] [CrossRef]
- Grebenikova, N.M.; Rud, V.Y. The influence of optical density change on measurement error of refractive index in flowing liquid. J. Phys. Conf. Ser. 2019, 1410, 012186. [Google Scholar] [CrossRef]
- Wang, S.; Liu, S.; Ni, W.; Wu, S.; Lu, P. Dual-wavelength highly-sensitive refractive index sensor. Opt. Express 2017, 25, 14389–14396. [Google Scholar] [CrossRef] [PubMed]
- Reed, B.E.; Grainger, R.G.; Peters, D.M.; Smith, A.J.A. Retrieving the real refractive index of mono- and polydisperse colloids from reflectance near the critical angle. Opt. Express 2016, 24, 1953–1972. [Google Scholar] [CrossRef] [PubMed]
- Tuoriniemi, J.; Moreira, B.; Safina, G. Determining Number Concentrations and Diameters of Polystyrene Particles by Measuring the Effective Refractive Index of Colloids Using Surface Plasmon Resonance. Langmuir 2016, 32, 10632–10640. [Google Scholar] [CrossRef] [PubMed]
- Grebenikova, N.M. The effect of optical density of the flowing liquid on the measurement error of its refractive index. J. Phys. Conf. Ser. 2019, 1400, 066029. [Google Scholar] [CrossRef]
- Li, C.; Bai, G.; Zhang, Y.; Zhang, M.; Jian, A. Optofluidics refractometers. Micromachines 2018, 9, 136. [Google Scholar] [CrossRef]
- Liu, I.-C.; Chen, P.-C.; Chau, L.-K.; Chang, G.-E. Optofluidic refractive-index sensors employing bent waveguide structures for low-cost, rapid chemical and biomedical sensing. Opt. Express 2018, 26, 273–283. [Google Scholar] [CrossRef] [PubMed]
Disclaimer/Publisher’s Note: The statements, opinions and data contained in all publications are solely those of the individual author(s) and contributor(s) and not of MDPI and/or the editor(s). MDPI and/or the editor(s) disclaim responsibility for any injury to people or property resulting from any ideas, methods, instructions or products referred to in the content. |
© 2023 by the authors. Licensee MDPI, Basel, Switzerland. This article is an open access article distributed under the terms and conditions of the Creative Commons Attribution (CC BY) license (https://creativecommons.org/licenses/by/4.0/).