Article

Optimal Axial-Probe Design for Foucault-Current Tomography: A Global Optimization Approach Based on Linear Sampling Method

by
Brahim Benaissa
1,
Samir Khatir
2,
Mohamed Soufiane Jouini
3 and
Mohamed Kamel Riahi
3,4,*,†
1
Department of Mechanical Systems Engineering, Design Engineering Lab, Toyota Technological Institute, 2 Chome-12-1, Hisakata, Tempaku Ward, Nagoya 468-8511, Japan
2
Soete Laboratory, Faculty of Engineering and Architecture, Ghent University, Technologiepark Zwijnaarde 903, B-9052 Zwijnaarde, Belgium
3
Department of Mathematics, Khalifa University of Sciences and Technology, Abu Dhabi P.O. Box 127788, United Arab Emirates
4
Emirates Nuclear Technology Center (ENTC), Khalifa University of Science and Technology, Abu Dhabi P.O. Box 127788, United Arab Emirates
*
Author to whom correspondence should be addressed.
Current address: Zarkuh Building, Khalifa University, SAN Campus, Abu Dhabi P.O. Box 127788, United Arab Emirates.
Energies 2023, 16(5), 2448; https://doi.org/10.3390/en16052448
Submission received: 19 January 2023 / Revised: 22 February 2023 / Accepted: 27 February 2023 / Published: 3 March 2023
(This article belongs to the Special Issue New Challenges in Nuclear Energy Systems)

Abstract

:
This paper is concerned with the optimal design of axial probes, commonly used in the Non-Destructive Testing (NDT) of tube boiling in steam generators. The goal is to improve the low-frequency Foucault-current imaging of these deposits by designing a novel probe. The approach uses a combination of an inverse problem solver with global optimization to find the optimal probe characteristics by minimizing a function of merit defined using image processing techniques. The evaluation of the function of merit is computationally intensive and a surrogate optimization approach is used, incorporating a multi-particle search algorithm. The proposed design is validated through numerical experiments and aims to improve the accuracy and efficiency of identifying deposits in steam generator tubes.

1. Introduction

In this paper, we address the issue of clogging in the secondary cycle of a steam generator. Clogging can lead to a number of problems that negatively impact the safe and efficient operation of the plant, including restricted coolant flow, increased temperature and pressure, reduced heat transfer efficiency, buildup of deposits and corrosion products [1,2], formation of sludge and debris, and an increased risk of leaks [3,4,5].
One approach to addressing these issues is through the use of NDT methods, allowing for the assessment of component conditions without causing damage or alteration. Low-frequency Foucault-current testing (LFFC) using axial probing is an important NDT procedure in which an alternating current passed through a coil generates an electromagnetic field and hence induces eddy currents in a conductor. By measuring the change in impedance of the coil, it is possible to determine the properties of the conductor [6,7,8] (see also the review papers [9,10]).
The design of the sensor used in Low-Frequency Foucault-current testing is crucial for the test’s accuracy and reliability. Factors such as the frequency of the sensor, the shape of the sensor’s coils, the distance between the sensor and the object being tested, and the sensor’s ability to resist demagnetization all have an impact on the performance of the test [11,12], and must be taken into account [13,14]. The optimization of the performance of axial probing is a challenging task [15]. Various approaches have been developed [16,17,18] and various genetic algorithms considered to find the optimal design. The novelty of our work, on the other hand, is that our analysis is based on the linear sampling method (LSM) [19], an inverse problem technique, that has been shown to produce quasi-qualitative results in a rapid fashion for Foucault-current signal processing. The optimal design of the axial probe is done through parameter optimization that is handled by a heuristic optimizer [20,21,22] to find the optimal values characteristic of the probe and its coils.
Our new design procedure is based on the performance of the axial probing through the use of the LSM inverse solver for Foucault’s current tomography of deposits. The LSM solver is used to quickly produce quasi-qualitative results for Foucault-current signal processing, the outcome of which is a P 1 vortex-based plot of an indicating function. This plot (image) is then processed to evaluate the approximation of a given deposition, hence evaluating the function of merit. This function of merit is then defined through image processing techniques, involving the resolution of the Foucault-current partial differential equation, supplemented with finite element mesh adaptation techniques. This makes the evaluation of the function of merit a computationally intensive task. Henceforth, a surrogate optimization approach is more appropriate for handling this resource outlay. We suggest a multi-particle search surrogate algorithm for the design part, where one can use, for instance, the Matlab toolbox [23] for global optimization and surrogate optimization [20,24].
The rest of the paper is organized as follows. In Section 2, we motivate the problem by, firstly, setting its mathematical framework (in Section 2.1) with rigorous mathematical equations that model the Foucault-current problem in a low-frequency regime, and secondly, describing the Linear Sampling method (in Section 2.2) that stands as an inverse solver, based on the LFFC model. The LSM is used in this work to evaluate the function of merit that help design the axial probe sensor. The design of the sensing parameters is initially described in Section 2.3, then detailed in Section 3. The numerical experiments are reported and discussed in Section 4. Finally, the paper closes with concluding remarks in Section 5.

2. Motivations and Setting

The Foucault-current model is based on Maxwell’s equations in the low-frequency regimes that withdraw the current displacement term. The LFFC is an important tool for understanding and predicting the behavior of electric currents in these systems, and has numerous practical applications in the design and optimization of electrical equipment.
In this study, we focus on the steam generator external tube inspection, through the penetration of axial coils from inside the tubes. This probing technique is performed by robots (earlier by field engineers) which slide the probes all along the tube and collect impedance measurement data that can be interpreted in order to assess and monitor the health quality of the boiling tubes. Particularly, we are focused on the identification of magnetite depositions in the shell side of the boiling tubes. Our motivation is mainly driven by the results of the LSM [19] for deposition identification using LFFC. This consists of an inverse tomographic solver, which we shall use in the global optimization approach to design a new axial-coil probing. Actually, the evaluation of the function of merit requires the assessment of the image produced by the LSM inverse solver. The latter requires numerical resolution of the Foucault-current model.
As we focus on the tube boiling geometric configuration it is, therefore, simpler and appropriate to consider the axisymmetric configuration of the mathematical model at hand. This representation is particularly useful in understanding the behavior of currents in cylindrical or circular structures, as the axisymmetric configuration assumes symmetry around a central axis. We sketch in Figure 1 the geometry of the boiling tube and present the case of a possible deposition occurring in its shell side. A couple of coils are also presented to form a traditional axial probe—we aim at revisiting its design with this investigation.
It is worth mentioning that such an axial probe is manufactured to penetrate the long tubes and keep the coils (generators and pickup coils) parallel to the tube wall. In practice, this design assumes a gap between the radius of the probe and the radius of the tube, which may cause extra noise in the experimental measurement. For this reason, we have assumed 5 % white noise in the impedance signal used for the LSM. Another type of probe (rotational) assumes a specific inclination angle of its coils. The study of such a specific design exceeds the interest of the current study and shall be tackled in future work.
In the sequel, we briefly describe the LFFC model in the axisymmetric configuration and then describe the LSM as an inverse problem tool that we use for the optimal design of the axial probing.

2.1. Foucault-Current Model in the Axisymmetric Configuration

By applying a divergence-free electric current density J and a frequency f (measured in Hertz (Hz)), and considering the magnetic permeability μ > 0 (measured in Henry per meter ( H · m 1 ) ) and the electric conductivity σ > 0 (measured in Siemens per meter ( S · m 1 ) ), the time-harmonic Foucault-current equation for the electric field E = (Ex,Ey,Ez)T is
curl 1 μ curl E i f σ E = i f J in f R 3 ,
where appropriate boundary conditions and the divergence of the electric field need to be considered to ensure the suitability of Equation (1) (see [25,26,27]). The inspection of conductive components, assuming symmetry such as long boiling tubes, motivates the consideration of the axisymmetric variant of the above equation where all quantities are invariant with respect to eθ. Here, (er,eθ,ez) represents the canonical basis of the cylindrical coordinate system. We further assume that J = J eθ with J ndependent from the θ coordinate. Therefore, the electric field is azimuthal: E = Eθeθ and satisfies
r 1 μ r r r E θ + z 1 μ z E θ + i f σ E θ = i f J in R + 2 ,
with R + 2 := {r = (r,z): r > 0, z R }. Note that, due to symmetry, we have Eθ|r=0 = 0. In addition, the decay radiation condition is applied as such: Eθ → 0 as r2 + z2 → +∞.
The mathematical model Equation (2) then reduces to seeking E θ = u , such that
· 1 μ r ( r u ) + i f σ u = i f J in R + 2 ,
for u satisfying the appropriate radiation decay condition. Equation (3) is then solved using, for instance, the finite element approach, which is based on its variational formulation. For a given σ including a potential deposition conductivity, the generated solution u denotes the total field, while a deposition-free (brand-new tubing) can be characterized by σ i , hence the generated solution u i represents the incident field. Finally, using these two generated solutions, we define the scattered field solution as the difference between the total field and the incident field, so
u s = u u i
For more detail about the variational formulation and the scattered field solution calculation, see [19].
In practice, we truncate the computational domain in both the r-direction and the z-direction. The artificial boundaries are put far away from the region of interest so that the homogeneous Dirichlet boundary condition doesn’t reflect or interfere with the decay of the Foucault-current wave. Actually, the wave intensity decays rapidly before it reaches the artificial boundaries. In order to have high fidelity numerical scheme, we use a first-order piece-wise continuous Lagrange polynomial finite element where the spacial mesh assumes 24 vertices per wavelength.

2.2. The Linear Sampling Method

The Linear sampling method is a powerful and widely used technique for the identification of scatterer conductivity support, using information about the scattered field.
In recent years, the LSM [28,29] has been extended [30] and refined in a number of ways to improve its accuracy and robustness [31]. For example, techniques such as regularization and sparsity-promoting optimization have been developed to better handle ill-posed inverse problems [32,33], and new techniques have been proposed in the near-field context [34,35,36] that make the method well-suited to the identification of specific scatterer properties.
The LSM is a widely used and well-established technique [37] for the identification of scatterer properties, and it continues to be an active area of research and development in electromagnetics [38], where it is highly promising when coupled with a variational shape optimization NDT technique [39] while using high-performance computing [40] to reduce the computational complexity burden for the full scale of the industrial case. The near-field context of the Foucault-current method [19] has been extended to the non-destructive testing of magnetite deposition shape identification. If we consider a data matrix formed from scattered data Equation (4) for a given source coil positioned at r and a pickup coil positioned at r
Z r r : = u s ( r , r ) , ( r , r ) r ¯ × r ¯ .
the method, which we propose to use in our analysis, approximates the solution of the following linear system for a nearby indicator function g ξ ϵ as
Z g ξ ϵ u i ( r ¯ , ξ ) ,
by applying a Tikhonov regularization and solving
ϵ g ξ ϵ + Z * Z g ξ ϵ = Z * u i ( r ¯ , ξ ) ,
where ξ is a sampling point, r ¯ = { r 1 , , r N } , with N being the number of scan collection of the probing, and u 0 stands for the incident wave solution, that we evaluate at a position ξ for a coil positioned at r .
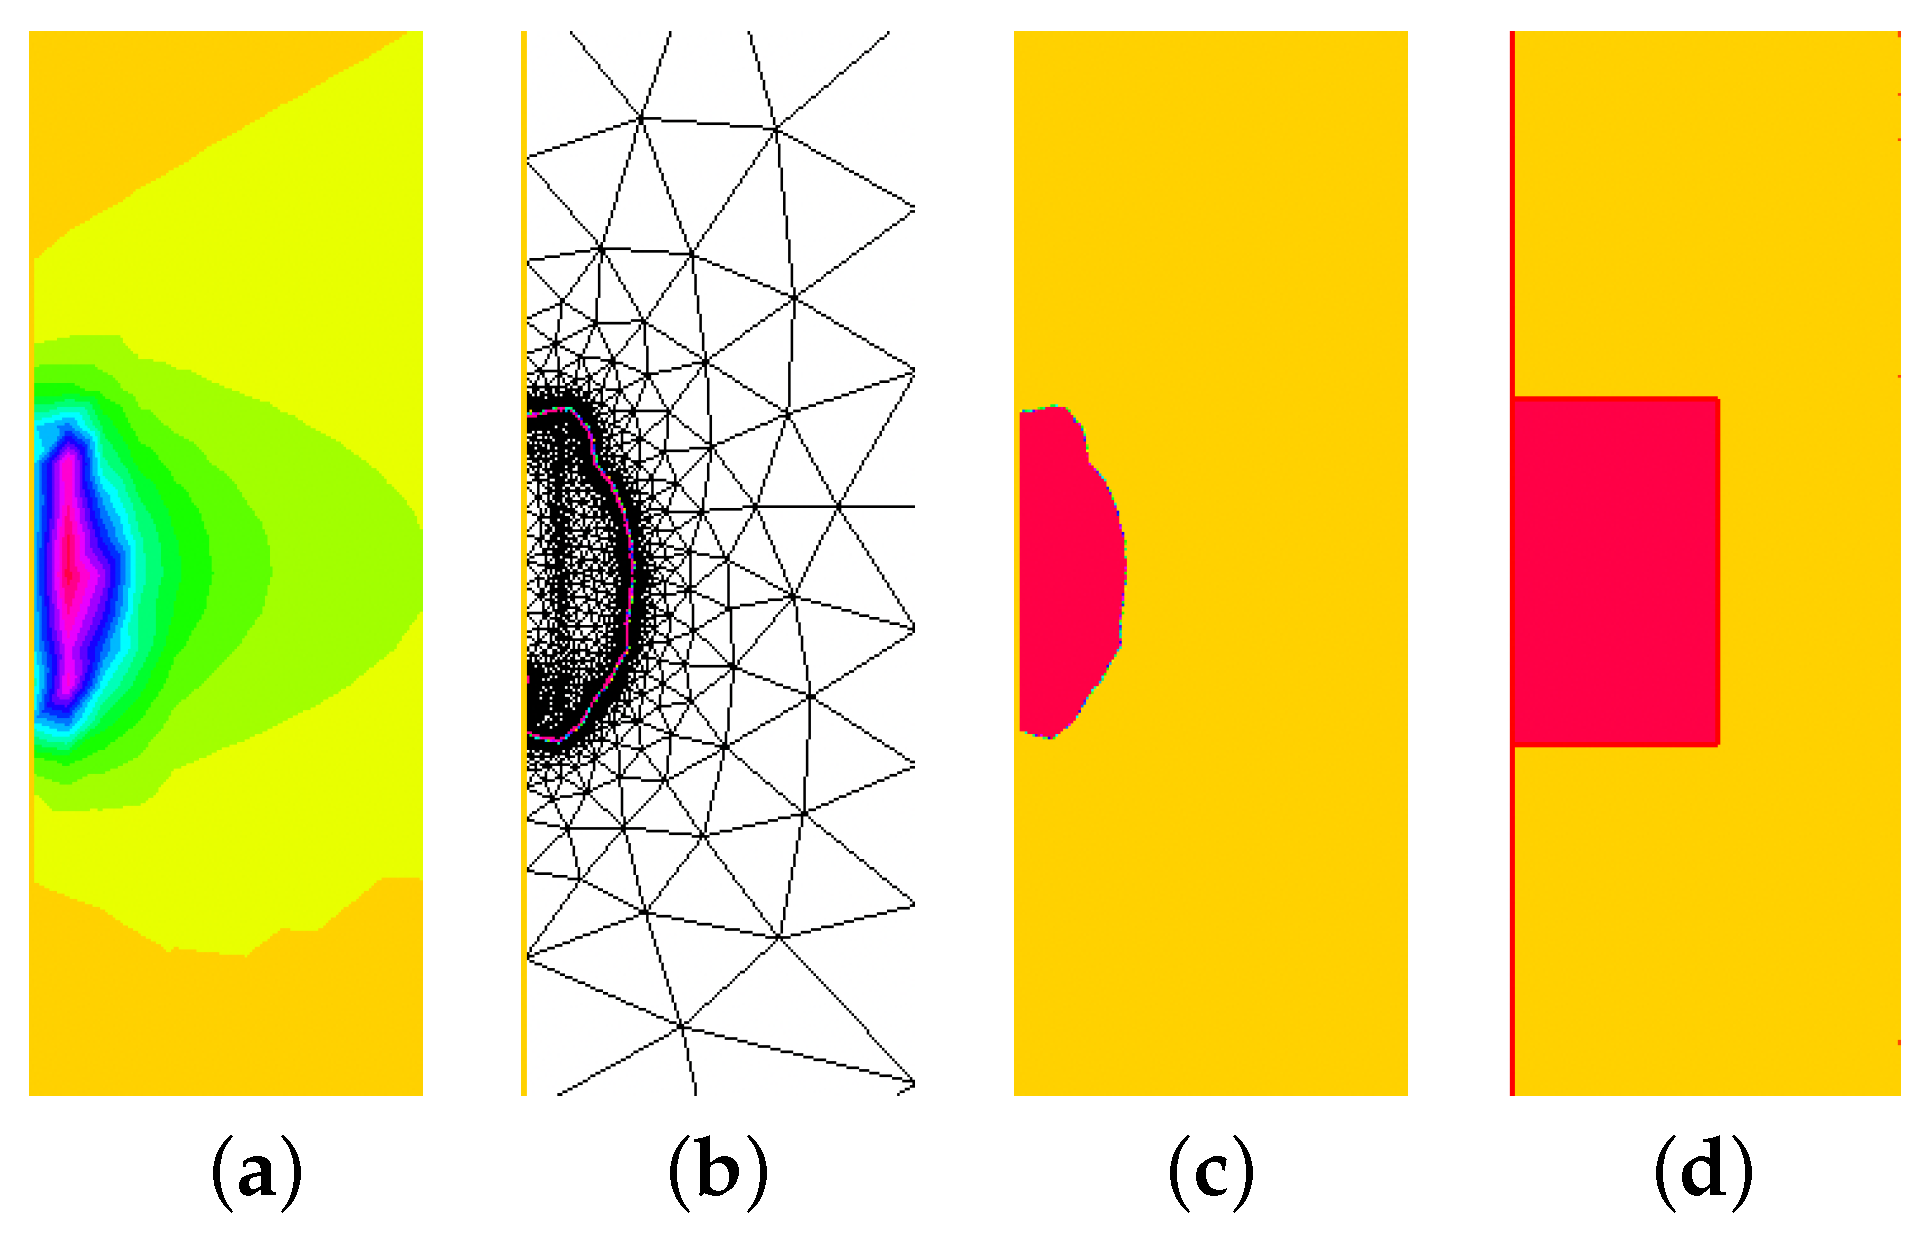
Figure 2 depicts the LSM results as a P 1 plot over the sampling region, upon which we apply the cut-off (level of trust) and then apply the finite element mesh adaptation to smooth out the edges caused by the sampling mesh, then produce a final image that better represents the deposition. With this technique, here described, the results of the LSM can be made automatic and hence quantified. We shall discuss in the sequel how this technique can help frame out the global optimization technique in order to optimally design sensors (axial probes) that are based on inverse imaging techniques such as the LSM.
It is worth mentioning that the results shown in Figure 2 are not solutions to the LFFC model Equation (3); they are actually plots of indicator functions resulting from the LSM techniques (see [19] for more details).

2.3. Sensing Design Parameters

NDT probes are used to evaluate the condition of tubes in steam generators without causing any damage. These probes come in various forms and are used to detect defects such as corrosion, pitting, and cracks in the tubes. Our focus, in this study, is on the axial probe that is based on coil pileups with a prescribed spacing.
NDT probes are an important tool in the maintenance and inspection of steam generators because they allow for the detection of defects without the need for costly and time-consuming repairs or replacements. This technique is a cost-effective and efficient alternative to more invasive methods such as hydro-testing [41,42] or dye-penetrant testing [43,44]. Additionally, NDT using probes is non-invasive and can be performed while the steam generator is in operation, minimizing downtime and disruption to plant operations.
In such a process, a probe is placed in contact with the surface of the tube and a signal is transmitted through it. The signal is then received by the probe and analyzed via the LSM, which displays the indicator function as a P 1 vortex-based plot (see Figure 2).
There are several parameters that can be adjusted to optimize the performance of the probe and improve the accuracy of the testing results. These include:
Frequency: The frequency of the signal transmitted by the probe can be adjusted to optimize the penetration depth and resolution of the signal. Higher frequencies provide a better resolution but may have limited penetration depth, while lower frequencies have greater penetration depth but lower resolutions.
Pulse duration: The duration of the pulse transmitted by the probe can also be adjusted to optimize the signal-to-noise ratio and improve the accuracy of the testing results. A shorter pulse duration may provide a better resolution but may be more sensitive to noise, while a longer pulse duration may be less sensitive to noise but may have a lower resolution.
Amplitude: The amplitude of the signal transmitted by the probe can be adjusted to optimize the sensitivity of the probe and improve the detection of small defects. Higher amplitudes may provide better sensitivity but may also increase the risk of signal saturation, while lower amplitudes may have lower sensitivity but may also reduce the risk of saturation.
Probe Lift-Off: The spacing between the probe and the surface being tested can also be adjusted to optimize the signal-to-noise ratio and improve the accuracy of the testing results. Closer probe spacing may provide a better resolution but may also increase the risk of signal interference, while greater probe spacing may have a lower resolution but may also reduce the risk of interference.
Coils’ pileups: The number of coils being used in a single probe has an impact on the quality of the signal being collected. A large number of coils may provide a better resolution, to a certain extent.
Coils’ spacing: The spacing between every two successive coils can be adjusted to optimize the quality of the signal. Small gaps between two coils (one for pickup and the other for excitation) may provide a better resolution, while greater coil spacing covers larger areas, to a certain extent, as this also depends on the excitation frequency.
Our investigation considers the optimization of the total coils’ pileups and spacing, while the radius of the coils is fixed, as well as the pulse, amplitude, and frequency. Nonetheless, we study the frequency variation impact and precision after the optimization process, as we consider that the frequency can be made variable after the probe design. Our design strategy is based on the performance of the LSM as the inverse Foucault-current solver for depositions tomography. Each iteration of the optimization is computationally expansive and we shall use a surrogate optimization model to handle the minimization in the search space.

3. Optimal Probe Design, in View of LSM Tomography Solver

As the LSM results in a finite element solution representative of the potential deposition, it is natural to consider an image processing technique and define a real-valued objective function that includes the LSM display results and compares it with a given reference image.

3.1. Function of Merit and Image Processing

We define our function of merit, which needs to be minimized using a global optimization technique, as the norm of the distance between two digital images, while the optimization problem can be formulated as follows:
min p P J ( ; p ) = D , ( p ) 2 ( R n ) ,
where p = ( f , J , k , h , s ) T stands for the set of parameters to be optimized with f standing for the frequency, J stands for the pulse intensity of the current in the probe, k stands for the number of the probe, and H , S stand for the height and spacing between coils, respectively. The difference operator D is defined as follows:
D : R n × R n R n ( a , b ) D ( a , b ) : = | i a i b | i = 1 n .
Here, D ( a , b ) is defined as the pixel difference between two images. The resulting vector is stored in a vector of size n × 1 .
In practice, we compute the relative error defined as follows:
( a , b ) : = D ( a , b ) 2 ( R n ) a 2 ( R n ) .
To calculate the difference between two binary images, we compare the corresponding pixels of two binary images and return a new image where each pixel is set to 1 if the corresponding pixels of the input images are different, and 0 if they are the same. Then, we calculate the number of pixels that are set to 1 in the resulting image, which will give the absolute difference between the two images as a measure of how different the two images are.
The Reconstruction operator , of a given impedance signal Z (see Equation (5)) generated by a given parameter p of the coil, is defined as follows:
: P R n , p ( p ) .
Equation (7) defines a nonlinear operator that maps a given parameter p to its reconstructed image via the application of the LSM, as described earlier (see also [19] for more detail about the LSM). In fact, for a given deposition, we associate the Impedance Signal measurement data matrix Z . Afterward, the LSM produces the indication function as an image ( p ) . This process of generating images results from inverse tomography (see for example plot in Figure 2). Then, we post-process the plot of the indication function through a cutoff of the iso-values and apply a mesh adaptation (for smoothing purposes). Finally, we make the image binary (black and white) to produce ( p ) .

3.2. Proof of Concept and Approach

3.2.1. Why Proof of Concept?

Boiler tubes in steam generators differ from one design to another, and the deposition also depends on the corrosion of the tube material. These deposits can lead to the formation of rust and other types of deposits on the external walls of the boiler tubes, and the tube roughness, generated by these buildups, may be tolerated at different thresholds, depending on the stockholders. Furthermore, the new technology of cladding tubes along with tube-electrical-conductivity manufacturing contributes to the LFFC wave attenuation, and hence to the best frequency used in the NDT process.
For these reasons, designing an axial probe that works for everything is not feasible. Nonetheless, we propose in this study a design procedure with a minimal example (statistically speaking) to evaluate its feasibility and to identify potential issues before investing in full-scale development. We demonstrate in our experiment how the proposed method works and can therefore be adapted in real-life scenarios while relying on the LSM to evaluate and control boiler tubes.

3.2.2. Our Approach

There are several optimization techniques that can be used to solve complex optimization problems, including (i) genetic algorithms that are inspired by the process of natural evolution. They involve a population of solutions that evolve over time through the application of genetic operators, such as crossover and mutation. (ii) Particle swarm optimization is an optimization technique involving a population of solutions, known as particles, that move through the design space in search of optimal solutions. The movement of the particles is guided by the best solutions found by the particles and the best global solution found so far. (iii) The Nelder-Mead simplex method is an optimization technique involving a set of n + 1 points in n-dimensional space (simplex), modified iteratively to search for the optimal solution.
In this current work, we investigate our optimization procedure with the deployment of the surrogate optimization, as it is a flexible and efficient method for optimizing complex systems, with complex merit functions to minimize. Furthermore, it offers a number of advantages over other optimization techniques, including its ability to handle complex, nonlinear systems and its efficiency in exploring the design space P [20,23,24].
Surrogate optimization methods are a powerful tool for optimizing complex systems, particularly those with expensive or time-consuming objectives. The method involves constructing a simplified model, known as a surrogate model, of the system being optimized. This surrogate model is used to guide the optimization process, allowing for rapid exploration of the design space and efficient identification of optimal solutions.
The surrogate optimization method is particularly useful in situations where the objective function is difficult to evaluate or the optimization problem has a large number of variables.
The surrogate optimization method can be implemented using a variety of techniques, including response surface methodology, artificial neural networks, and genetic algorithms. These techniques allow for the construction of accurate and efficient surrogate models [45] that can be used to guide the optimization process.
Our proof-of-concept probe design is based on the following workflow. Indeed, the creation of the probe is designed through steps, and each step is focused on specific parameters that need to be optimally found for a selection of the representative shapes of possible depositions.
Step 1.
Select an ensemble of deposition shape representative of the most important situations. This decision may depend on the degree of the severity of the clogging situation. For example, thick deposits may represent a danger to the steam generator by clogging the opening of the water circulation. Besides, if a deposition concentration were located near the opening (for water circulation), that would represent more danger than one far away or depositions distanced from each other and not forming an agglomeration. Of course, with a large number of selections, more promising results are expected.
Step 2.
Perform a global optimization to identify the best variables (such as coil spacing, coil height, coil pileups). The optimization is severely nonlinear, where a large number for the local optimal in the search space exists and heavily depends on the shape considered. It is recommended, therefore, to deploy a large number of multi-particle searches and use high-performance computing to this end.
Step 3.
Identify a range of the best solutions. This can be done through a study of the performance of the optimization with respect to the minimization of the cost function versus the number of coil pileups. One can perform a range of coil pileups in the probe and repeat Step 2 to converge on optimal solutions for each run case, then sort out the results with respect to the total number of coil pileups. Afterward, it becomes simpler to identify the range targeted.
Step 4.
Select the best coil pileups. This can be done through a statistical study of the covariance between the coil spacing and the coil heights, for all candidates’ coil pileups. Actually, one can select the case (number of coil pileups) by searching for the highest negative covariance, taking into account the maximum and minimum coils’ height and spacing. The covariance indicates how correlated the coils’ height and spacing are. It is better to consider the lowest coil’s height (to increase resolution) and the highest coil’s spacing (to cover as much space as possible in one excitation and pickup).
Step 5.
Perform Global optimization for each candidate in the selected range of coil pileups. Once Step 4 selects the best total number of coil pileups (say, k ), we then fix the total number of coils in the probe k = k and repeat Step 2 for every (selected) shape.
Step 6.
Select the best coils’ spacing s, and coil height h. This can be done statistically, whether based on the mean values of each parameter or with a combination of the cost function J min values.

4. Numerical Experiments and Discussion

The numerical experiments follow the steps described in Section 3.2, wherein Step 1 we have selected the representative shapes as depicted in Figure 3. We have seven distinct shapes, labeled Shape-A through Shape-G, each with unique characteristics. Shape-A is a semi-circular single deposit, Shape-B consists of two identical shapes separated by a distance of 4 mm, and Shape-C has the same spacing as Shape-B but with notable differences in the two depositions. Shape-D is a relatively thin rectangle-shaped deposit located on the shell side of the tube. Shape-E is a thin and short deposit, while Shape-F and Shape-G feature thicker deposits in the form of squares, with the edge of Shape-G being almost double that of Shape-F.
Once we have the dictionary of the shape representative, we perform the global optimization using a surrogate model. To this end, we put the parameters of interest as the coil pileups, spacing, and height. We describe the details of the optimization procedure in the sequel.
Here it is noteworthy that selecting a large number of (dummy) shape representatives will not lead to a conclusion, as per the ill-suited inverse problem used as the model for global optimization. In fact, for each and every essay relating to a particular shape, we will end up with a significant discrepancy in values compared to the optimal parameters of interest, relative to other shapes.
Our numerical experiments are implemented in Matlab for the global optimization part, while the numerical approximation of the Foucault-current Equation (1) is performed using the open software package FreeFem++ [46].
In order to maintain a high fidelity numerical scheme, we consider meshing the computational domain Ω (a truncation of R + 2 ) with 24 mesh vertices per wavelength and approximating the solution of the PDE with a piecewise continuous P 1 Lagrange finite element. The boundary conditions are set as homogeneous Dirichlet conditions, where the borders of the domain are put far away to enable the natural decay of the LFFC wave and don’t interfere with the solution.
Moreover, in the optimization procedure (led by Matlab surrogate global optimization), we used 80-multi-particles to perform the global search for minimizers in a parallel fashion. The iterations of the surrogate method are set to 160 iterations. Therefore, the total live-run of the search is 12,800 calls for the finite element resolution per one shape. In fact, every evaluation of the merit function J requires an image coming from the inverse tomographic LSM, which requires in its turn the evaluation and inversion of the LFFC model.

4.1. Coil Pileup Performance and Optimization

In this section, we describe how we can select the optimal range of the coils in a single axial probe. In fact, after performing the global optimization with the surrogate model method, we end up with the results as given in Figure 4. In this experiment, we generate several optimization problems, where, for each run, the total number of coils is fixed, while the optimization is focusing on minimizing the function of merit through the parameters of coil height and spacing.
It is shown in Figure 4 that increasing the total number of coils in the probe above eight is useless for all shape cases that we considered. On the other hand, and in all cases of the considered shapes, the backscattering probing (with one coil only) and the usual double-coil probing (widely used in industry) can be improved by using additional coils in the probe. Based on these observations, we select the range of the total number of coils (per probe) that perform well in terms of minimizing the merit function. Let us stress that the best minimum merit function reflects the best shape reconstruction using specific values of the total number of coils, their height, and their spacing in the probe. In our case, the selected range of the total number of coils that performs well is (3–8) coils per probe. We next study the values chosen by the optimization procedure through statistical covariance between the coils’ height and spacing (see Step 4). This task enables us to identify the best total number of coils per probe. In practice, for every number of coils with all shapes, we have considered two optimal values that correspond to the coils’ height and spacing. The covariance is then calculated for every number of coils, between the coils’ height and spacing for all shapes. It is worth noting that positive covariance means a linear correlation between the h-vs-s, where an increase in h leads to an increase in s and vice versa. A negative covariance indicates the opposite effect between the values of h-vs-s, where an increase in h leads to a decrease in s. The negative covariance of the best total number of coil pileups is therefore six coils per probe.

4.2. Coils’ Height and Spacing

After we have identified the optimal coil number in the probe, we now investigate their optimal height and spacing. To this end, we repeat the surrogate optimization procedure by reducing the parameter to only the height and spacing of six coils per probe. This procedure is performed for every selected shape from the representative set of shapes described in Step 1.
It is also worth noting that there is no unique minimizer for all possible situations being considered. To further reduce the complexity of the problem, we shall statistically extract the mean values for both the coils’ height and spacing. Table 1 shows the optimal values found with the surrogate optimization for all shapes considered. Following our statistical approach of selecting the best values for both coil height and spacing, we find that the best height is about 2 mm, while the best coil spacing is about 2.5 mm.

4.3. Foucault-Current Frequency Excitation

It is well-established that high frequencies result in high resolutions when it comes to electromagnetic inverse problems. However, in the context of Non-Destructive Testing (NDT) and Foucault-current techniques, we are limited to the low-frequency regime, which is characterized by the presence of the skin depth effect. Therefore, the precision of inverse tomography in the Foucault current should not be expected to be high.
Skin depth is a measure of how deeply an electromagnetic wave penetrates a conductive material. The skin depth, represented by the equation
δ = f μ σ 1 2 ,
is inversely proportional to the square root of the material’s conductivity ( σ ), the permeability ( μ ), and the frequency f of the wave [47,48].
The skin depth formula Equation (8) shows that the increase in frequency or the increase in the electrical conductivity of the tested material reduces the skin depth and vice-versa. In LFFC, we are restricted to the low-frequency regime, where the range of varying frequencies is very limited. The electrical conductivity of the tube and the depositions remains the main player that affects the quality of the tomography, and hence the design of the probe. Nevertheless, these conductivities are known by the manufacturer and hence are not considered optimization parameters in our design approach.
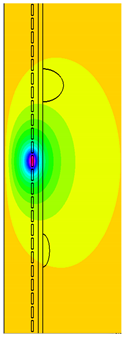
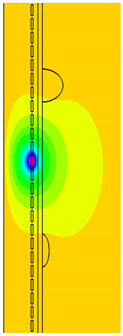
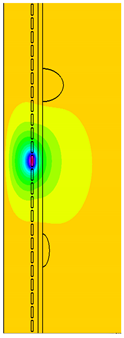
In the global optimization procedure, we did not consider optimizing the frequency of the probes, as the frequency can be adjusted after the design of the probe. However, we conduct numerical experiments here to show the effect of changing the frequencies in a given range. Table 2 shows the attenuation of the total field (in presence of the depositions) solution to Equation (3). We vary the frequency and show how shallow the penetration becomes with a high frequency when the tube conductivity is set to σ = 0.97 · 10 6 ( S · m 1 ) and its permeability is set to μ = 4 π · 10 6 ( H · m 1 ) .
Given the skin depth effect and the use of low frequencies to attenuate the region after the tube wall, the Foucault-current wave scattered back due to the presence of possible depositions will be weak. Only a few ranges of frequencies will be able to reach a sufficient portion of the deposition to generate information about the scatterer (deposition). Therefore, we should expect a slight improvement in inverse tomography while increasing the Foucault-current excitation frequency, only nearby the tube. Our results showing the selected shape of the depositions are presented in Table 3.
Our numerical results suggest that, after the determination of the optimal design of the total number of coil pileups and spacing, the combination of two frequencies (depending on the skin depth) is better for estimating the deposition, where low frequencies give high-quality results for the width of the depositions, while high frequencies recover small shapes and produce high resolutions for the part of the shape at the vicinity of the tube shell region. On the other hand, the position of the depositions is very well recovered due to the LSM itself.

5. Conclusions

We have presented in this paper a systematic approach to optimize the design of axial probes used in the non-destructive evaluation of tube boiling in steam generators. Contrary to the classical approaches of probe design, which are based on either a mathematical (direct) model or experimental tuning, our approach uses a completely different concept in which the direct model is itself an inverse solver for Foucault-current tomography. The optimal design is then performed via surrogate modeling, as the merit function is prohibitively expensive to evaluate.
Our technique shows that the axial probes with two coils, which are widely used in non-destructive evaluation in industry, can be enhanced by using six coils with a coil height of 6 mm and spacing of about 2.5 mm.

Author Contributions

Conceptualization, M.K.R. and B.B.; methodology, M.K.R.; software, M.K.R.; validation, M.K.R., M.S.J. and S.K.; formal analysis, S.K. and B.B.; investigation, M.K.R.; writing—original draft preparation, M.K.R. and B.B.; writing—review and editing, M.S.J. and M.K.R. and S.K.; visualization, M.K.R.; supervision, M.K.R.; project administration, B.B. and M.K.R.; funding acquisition, M.K.R. All authors have read and agreed to the published version of the manuscript.

Funding

This research received no external funding.

Data Availability Statement

The numerical model simulations upon which this study is based are too large to archive or transfer. Instead, we provide all the information needed to replicate the simulations; we used FreeFem++ version [v4.7] and MATLAB version 2022b. The model code, and compilation script, are available at [https://freefem.org/] and at [https://www.mathworks.com/]. The boundary condition and all simulation details, and data preprocessing codes are described clearly in this article.

Acknowledgments

The corresponding author is grateful for the administrative and technical support from Khalifa University. The authors would like to express their sincere gratitude to the reviewers for their insightful and constructive comments on the manuscript. The reviewers’ feedback has greatly improved the quality of our work and has helped us to identify areas for improvement.

Conflicts of Interest

The authors declare no conflict of interest.

References

  1. Turner, C. Fouling of nuclear steam generators: Fundamental studies, operating experience and remedial measures using chemical additives. Nucl. Rev. 2014, 2, 61–88. [Google Scholar] [CrossRef] [Green Version]
  2. Lu, D.; Yuan, B.; Wu, L.; Ma, Z.; Chen, Y. Research on the deposition model of particle-like corrosion product in SG tubes of PWR. Ann. Nucl. Energy 2015, 81, 98–105. [Google Scholar] [CrossRef]
  3. MacDonald, P.; Shah, V.; Ward, L.; Ellison, P. Steam Generator Tube Failures; Technical Report; Nuclear Regulatory Commission: Rockville, MD, USA, 1996. [Google Scholar] [CrossRef] [Green Version]
  4. Yang, G.; Pointeau, V.; Tevissen, E.; Chagnes, A. A review on clogging of recirculating steam generators in Pressurized-Water Reactors. Prog. Nucl. Energy 2017, 97, 182–196. [Google Scholar] [CrossRef] [Green Version]
  5. Melo, L. Particulate Fouling in Boiling Water Systems. In Two-Phase Flow Heat Exchangers; NATO ASI Series; Springer: Dordrecht, The Netherlands, 1988; Volume 143, pp. 461–469. [Google Scholar]
  6. Bellanova, M.; Carboni, M.; Felicetti, R. A feasibility analysis on the application of eddy current testing to the detection of the most detrimental defects in historical metallic tie-rods. NDT E Int. 2019, 104, 34–41. [Google Scholar] [CrossRef]
  7. Marchand, B.; Decitre, J.M.; Casula, O. Innovative flexible eddy current probes for the inspection of complex parts. In Proceedings of the 18th World Conference on Nondestructive Testing, Durban, South Africa, 16–20 April 2012; Available online: https://www.ndt.net/article/wcndt2012/papers/241_wcndtfinal00241.pdf (accessed on 26 February 2023).
  8. Cherepov, S.; Hesse, O.; Mook, G.; Pankratyev, S.; Uchanin, V. Optimisation of low frequency eddy current sensors using improved inductive coils and highly sensitive AMR and GMR sensor modules. In Proceedings of the 13th IMEKO TC-4 International Symposium, Athens, Greece, 29 September–1 October 2004; Volume 2, pp. 568–576. [Google Scholar]
  9. Calkins, F.T.; Flatau, A.B.; Dapino, M.J. Overview of magnetostrictive sensor technology. J. Intell. Mater. Syst. Struct. 2007, 18, 1057–1066. [Google Scholar] [CrossRef]
  10. Ali, K.B.; Abdalla, A.N.; Rifai, D.; Faraj, M.A. Review on system development in eddy current testing and technique for defect classification and characterization. IET Circuits Devices Syst. 2017, 11, 338–351. [Google Scholar] [CrossRef] [Green Version]
  11. Ulapane, N.; Alempijevic, A.; Miro, J.V.; Vidal-Calleja, T. Non-destructive evaluation of ferromagnetic material thickness using pulsed eddy current sensor detector coil voltage decay rate. NDT E Int. 2018, 100, 108–114. [Google Scholar] [CrossRef]
  12. Sophian, A.; Tian, G.; Fan, M. Pulsed eddy current non-destructive testing and evaluation: A review. Chin. J. Mech. Eng. 2017, 30, 500–514. [Google Scholar] [CrossRef] [Green Version]
  13. Huang, H.; Sakurai, N.; Takagi, T.; Uchimoto, T. Design of an eddy-current array probe for crack sizing in steam generator tubes. Ndt E Int. 2003, 36, 515–522. [Google Scholar] [CrossRef]
  14. Xin, J.; Lei, N.; Udpa, L.; Udpa, S.S. Rotating field eddy current probe with bobbin pickup coil for steam generator tubes inspection. Ndt E Int. 2013, 54, 45–55. [Google Scholar] [CrossRef]
  15. AbdAlla, A.N.; Faraj, M.A.; Samsuri, F.; Rifai, D.; Ali, K.; Al-Douri, Y. Challenges in improving the performance of eddy current testing. Meas. Control 2019, 52, 46–64. [Google Scholar] [CrossRef] [Green Version]
  16. Kincaid, T.G.; McCary, R.O. Eddy-Current Probe Design. In Review of Progress in Quantitative Nondestructive Evaluation; Springer: Berlin/Heidelberg, Germany, 1983; pp. 171–188. [Google Scholar]
  17. Dolapchiev, I.; Brandisky, K.; Ivanov, P. Eddy current testing probe optimization using a parallel genetic algorithm. Serbian J. Electr. Eng. 2008, 5, 39–48. [Google Scholar] [CrossRef]
  18. Chaiba, S.A.; Ayad, A.; Ziani, D.; Le Bihan, Y.; Javier Garcia, M. Eddy current probe parameters identification using a genetic algorithm and simultaneous perturbation stochastic approximation. J. Nondestruct. Eval. 2018, 37, 1–7. [Google Scholar] [CrossRef]
  19. Haddar, H.; Riahi, M.K. Near-field linear sampling method for axisymmetric eddy current tomography. Inverse Probl. 2021, 37, 105002. [Google Scholar] [CrossRef]
  20. Regis, R.G.; Shoemaker, C.A. A stochastic radial basis function method for the global optimization of expensive functions. INFORMS J. Comput. 2007, 19, 497–509. [Google Scholar] [CrossRef]
  21. Kermadi, M.; Moussaoui, S.; Brahimi, A.T.; Feliachi, M. Comparison of efficient global optimization and particle swarm optimization for eddy current non-destructive evaluation. In Proceedings of the 2016 International Conference on Electrical Sciences and Technologies in Maghreb (CISTEM), Marrakesh, Morocco, 26–28 October 2016; pp. 1–6. [Google Scholar]
  22. Benaissa, B.; Hocine, N.A.; Khatir, S.; Riahi, M.K.; Mirjalili, S. YUKI Algorithm and POD-RBF for Elastostatic and dynamic crack identification. J. Comput. Sci. 2021, 55, 101451. [Google Scholar] [CrossRef]
  23. The Mathworks, I. MATLAB. 2022. Available online: https://www.mathworks.com (accessed on 20 December 2022).
  24. Powell, M.J. The theory of radial basis function approximation in 1990. Adv. Numer. Anal. 1992, 2, 105–210. [Google Scholar]
  25. Rodríguez, A.A.; Valli, A. Eddy Current Approximation of Maxwell Equations: Theory, Algorithms and Applications; Springer Science & Business Media: Berlin/Heidelberg, Germany, 2010; Volume 4. [Google Scholar]
  26. Blitz, J. Electrical and Magnetic Methods of Non-Destructive Testing; Non-Destructive Evaluation Series; Springer: Amsterdam, The Netherlands, 1997; p. 2. [Google Scholar]
  27. Rachid, T.; Jacques, R. Mathematical Models for Eddy Currents and Magnetostatics; Vol. Computational Science and Engineering; Springer: Amsterdam, The Netherlands, 2014. [Google Scholar] [CrossRef]
  28. Colton, D.; Haddar, H.; Piana, M. The linear sampling method in inverse electromagnetic scattering theory. Inverse Probl. 2003, 19, S105. [Google Scholar] [CrossRef]
  29. Cakoni, F.; Colton, D.; Monk, P. The Linear Sampling Method in Inverse Electromagnetic Scattering; SIAM: Philadelphia, PA, USA, 2011. [Google Scholar]
  30. Audibert, L.; Haddar, H. A generalized formulation of the linear sampling method with exact characterization of targets in terms of farfield measurements. Inverse Probl. 2014, 30, 035011. [Google Scholar] [CrossRef] [Green Version]
  31. Arens, T.; Lechleiter, A. The linear sampling method revisited. J. Integral Equ. Appl. 2009, 21, 179–202. [Google Scholar] [CrossRef]
  32. Alqadah, H.; Valdivia, N. A frequency based constraint for a multi-frequency linear sampling method. Inverse Probl. 2013, 29, 095019. [Google Scholar] [CrossRef]
  33. Bevacqua, M.T.; Palmeri, R. Qualitative methods for the inverse obstacle problem: A comparison on experimental data. J. Imaging 2019, 5, 47. [Google Scholar] [CrossRef] [PubMed] [Green Version]
  34. Baganas, K.; Guzina, B.B.; Charalambopoulos, A.; Manolis, G.D. A linear sampling method for the inverse transmission problem in near-field elastodynamics. Inverse Probl. 2006, 22, 1835. [Google Scholar] [CrossRef]
  35. Ding, M.; Li, J.; Liu, K.; Yang, J. Imaging of local rough surfaces by the linear sampling method with near-field data. SIAM J. Imaging Sci. 2017, 10, 1579–1602. [Google Scholar] [CrossRef]
  36. Fata, S.N.; Guzina, B.B. A linear sampling method for near-field inverse problems in elastodynamics. Inverse Probl. 2004, 20, 713. [Google Scholar] [CrossRef]
  37. Arens, T. Why linear sampling works. Inverse Probl. 2003, 20, 163. [Google Scholar] [CrossRef]
  38. Chen, X. Linear Sampling Method. In Computational Methods for Electromagnetic Inverse Scattering; John Wiley & Sons: Hoboken, NJ, USA, 2017; Chapter 5; pp. 103–121. [Google Scholar]
  39. Haddar, H.; Jiang, Z.; Riahi, M.K. A Robust Inversion Method for Quantitative 3D Shape Reconstruction from Coaxial Eddy Current Measurements. J. Sci. Comput. 2017, 70, 29–59. [Google Scholar] [CrossRef] [Green Version]
  40. Riahi, M.K. A Fast Eddy-current Non Destructive Testing Finite Element Solver in Steam Generator. J. Coupled Syst. Multiscale Dyn. 2016, 4, 60. [Google Scholar] [CrossRef] [Green Version]
  41. Weehuizen, F. A review of periodic hydro-testing of reactor components with acoustic emission evaluation. NDE Nucl. Ind. 1985. [Google Scholar]
  42. Smith, A.; Williamson, R.; Low, A. Ensuring the Integrity of Subsea Hot Tap Welded Joints in Lieu of Hydro Testing. In Proceedings of the SPE Offshore Europe Oil and Gas Conference and Exhibition, Aberdeen, UK, 5–8 September 2011. [Google Scholar]
  43. Kryukov, I.; Shmelev, N.; Levchenko, A.; Rybnikov, A.; Andreev, M.; Moshnikov, A. Integrated quality control of the rotor discs of gas turbines of gas-compressor units by eddy-current and dye penetrant nondestructive testing. Russ. J. Nondestruct. Test. 2016, 52, 102–111. [Google Scholar] [CrossRef]
  44. Lopez, A.; Bacelar, R.; Pires, I.; Santos, T.G.; Sousa, J.P.; Quintino, L. Non-destructive testing application of radiography and ultrasound for wire and arc additive manufacturing. Addit. Manuf. 2018, 21, 298–306. [Google Scholar] [CrossRef]
  45. Aldrin, J.C.; Shell, E.B.; Oneida, E.K.; Sabbagh, H.A.; Sabbagh, E.; Murphy, R.K.; Mazdiyasni, S.; Lindgren, E.A. Model-based inverse methods for sizing surface-breaking discontinuities with eddy current probe variability. In AIP Conference Proceedings; AIP Publishing LLC: Melville, NY, USA, 2016; Volume 1706, p. 090002. [Google Scholar]
  46. Hecht, F. New development in FreeFem++. J. Numer. Math. 2012, 20, 251–265. [Google Scholar] [CrossRef] [Green Version]
  47. Collin, R.E. Field Theory of Guided Waves; IEEE Press: Piscataway, NJ, USA, 1991. [Google Scholar]
  48. Jackson, J.D. Classical Electrodynamics; Wiley: New York, NY, USA, 1999. [Google Scholar]
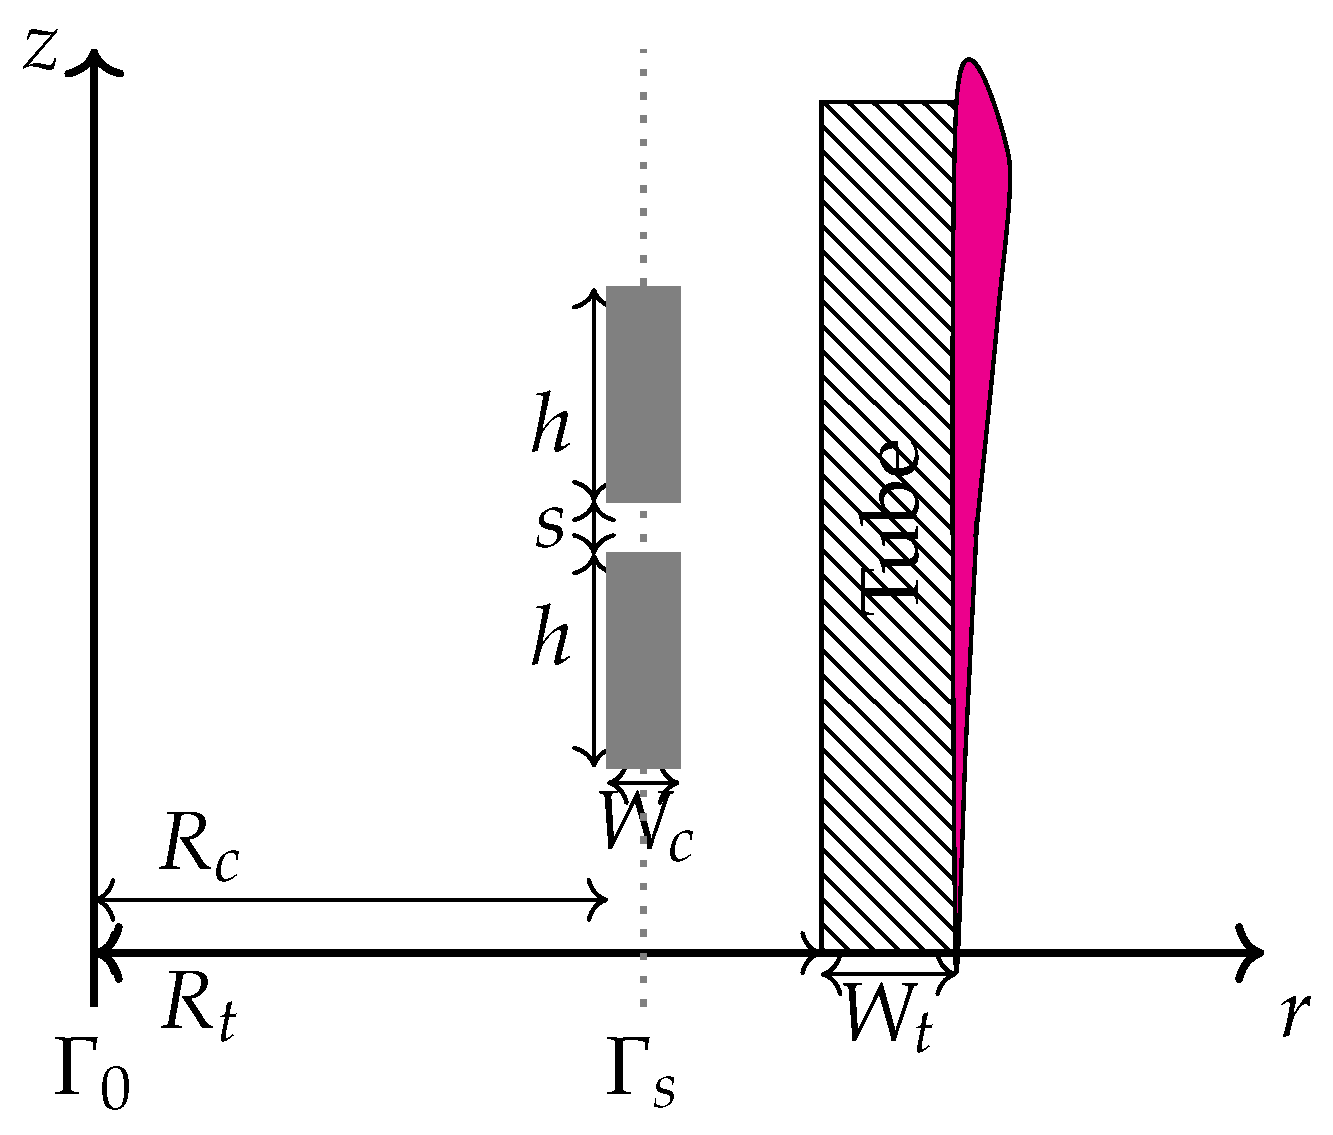
Figure 1. Sketch of the considered geometry representing the tube and the deposition in the shell side, in an axisymmetric configuration. The probe is represented with two rectangles standing for two coils with height h and spaced with distance s. The W c and the R c stand for the coil width and radius, respectively. Γ s stands for the source term position where the coils will scan the whole tube through a transition.
Energies 16 02448 g001
Figure 2. Plot of the (a) Linear Sampling solution, (b) the cut-off of 75 % , (c) the finite element mesh adaptation for the cut-off solution, and the (d) final two colored solutions that forms the best image representation of the clogging deposition.
Energies 16 02448 g002
Figure 3. Selection of shape deposition “representative” of potential deposition in the shell side of the boiling tubes in a steam generator.
Energies 16 02448 g003
Figure 4. Plots of the minimal values of the merit function J ( p opt ) with respect to the number of coils (considered in one probe) for several different shapes of the deposition. Here, opt stands for optimal. The Surrogate optimization algorithm results in p opt as an optimal solution (among which we have the number N of coils in the probe), with the data of points ( J ( p opt ) ) . The red box represents the selection of the cases that performed well.
Energies 16 02448 g004
Table 1. Global optimization results with the number of coils are fixed to 6 coils in the probe. The only parameters to optimize are the coils’ spacing and the height of the coils.
Shape min h: Coils’ Height (mm)s: Coils’ Spacing (mm)
A0.305423.30
B0.433322.17
C0.391241.34
D0.510531.81
E0.321122.00
F0.337923.90
G0.255324.28
Table 2. Plots of finite element solution of the total field u ( solution to Equation (3)) with excitation from coils for different frequencies.
f = 1 × 10 2 Hz f = 5 × 10 2 Hz f = 1 × 10 3 Hz f = 5 × 10 3 HzIso-Values
Energies 16 02448 i001Energies 16 02448 i002Energies 16 02448 i003Energies 16 02448 i004Energies 16 02448 i005
Table 3. One probe with 6 coils, each one of 2 mm height, and each two are spaced by 2.5 mm. We changed the frequency from 100 GHz to 5000 GHz.
Shape f = 1 × 10 2 Hz f = 5 × 10 2 Hz f = 1 × 10 3 Hz f = 5 × 10 3 Hz
AEnergies 16 02448 i006Energies 16 02448 i007Energies 16 02448 i008Energies 16 02448 i009Energies 16 02448 i010
BEnergies 16 02448 i011Energies 16 02448 i012Energies 16 02448 i013Energies 16 02448 i014Energies 16 02448 i015
CEnergies 16 02448 i016Energies 16 02448 i017Energies 16 02448 i018Energies 16 02448 i019Energies 16 02448 i020
DEnergies 16 02448 i021Energies 16 02448 i022Energies 16 02448 i023Energies 16 02448 i024Energies 16 02448 i025
EEnergies 16 02448 i026Energies 16 02448 i027Energies 16 02448 i028Energies 16 02448 i029Energies 16 02448 i030
FEnergies 16 02448 i031Energies 16 02448 i032Energies 16 02448 i033Energies 16 02448 i034Energies 16 02448 i035
GEnergies 16 02448 i036Energies 16 02448 i037Energies 16 02448 i038Energies 16 02448 i039Energies 16 02448 i040
Disclaimer/Publisher’s Note: The statements, opinions and data contained in all publications are solely those of the individual author(s) and contributor(s) and not of MDPI and/or the editor(s). MDPI and/or the editor(s) disclaim responsibility for any injury to people or property resulting from any ideas, methods, instructions or products referred to in the content.