Article

Comparative Performance Evaluation of Gas Brayton Cycle for Micro–Nuclear Reactors

Department of Nuclear and Quantum Engineering, Korea Advanced Institute of Science and Technology, Daejeon 34141, Republic of Korea
*
Author to whom correspondence should be addressed.
Energies 2023, 16(4), 2065; https://doi.org/10.3390/en16042065
Submission received: 28 December 2022 / Revised: 31 January 2023 / Accepted: 8 February 2023 / Published: 20 February 2023
(This article belongs to the Special Issue New Challenges in Nuclear Energy Systems)

Abstract

:
Gas Brayton cycles have been considered the next promising power cycles for microreactors. Especially the open-air and closed supercritical CO2 (S-CO2) Brayton cycles have received attention due to their high thermal efficiency and compact component sizes when compared to the steam Rankine cycle. In this research, the performances of the open-air and closed S-CO2 Brayton cycle at microreactor power range are compared with polytropic turbomachinery efficiency. When optimizing the cycle, three different optimization parameters are considered in this paper: maximum efficiency, maximum cycle specific work, and maximum of the product of both indicators. For the air Brayton cycle, the maximum of the product of both indicators allows to consider both efficiency and specific work while optimizing the cycle. However, for the S-CO2 Brayton cycle, the best performing conditions follow either maximum efficiency or the maximum cycle specific work conditions. In general, the S-CO2 power cycle should be designed and optimized to maximize the cycle specific work for commercial-scale application. The results show that the air Brayton cycle can achieve near 45% efficiency when it can couple with a microreactor with a core outlet temperature higher than 700 °C. However, the S-CO2 power cycle can still achieve above 30% efficiency when it is coupled with a microreactor with a core outlet temperature higher than 500 °C, whereas the air Brayton cycle cannot even reach breakeven condition.

1. Introduction

1.1. Background

Climate crisis due to greenhouse gases is a worldwide problem; therefore, many countries are planning on reducing the greenhouse gas emission by replacing greenhouse-gas-emitting power plants with renewable energy sources. Even though renewable energy, such as wind and solar, has been actively researched, relying only on variable renewable energy sources to fulfill the global energy consumption is, nevertheless, unreliable because of the intermittent nature of the variable renewable energy sources. Therefore, nuclear energy is also considered as a promising source of energy to reduce greenhouse gas emission, because nuclear energy can steadily generate electricity and does not emit any greenhouse gases while generating electricity. Furthermore, with the advent of small modular reactors (SMRs) and microreactors, nuclear electricity has become more affordable in the remote isolated regions, where the electricity grid infrastructure is not fully developed and connected.
Previously, the steam Rankine cycle was widely used as a power conversion cycle for various types of power plants, including coal-fired and nuclear ones. According to Fleming et al., the cycle efficiency of the steam Rankine cycle ranges from 35% to 40% for the low temperature ranges (300 °C to 450 °C) [1]. However, with the development of technologies, using only the steam Rankine cycle for heat to electricity is at question. Additionally, with the development of SMRs, the power conversion system has to be minimized in size. Figure 1 shows the turbine and cooler size comparison for steam Rankine cycle, supercritical CO2 (S-CO2), and helium Brayton cycles. As shown in the figure, the size of the main components for the gas Brayton cycle is much smaller than those of the steam Rankine cycle. Thus, applying a gas Brayton cycle as the power conversion system for a next-generation reactor, especially the microreactor, is more plausible than using the steam Rankine cycle in the perspective of the size and temperature.
Currently, microreactors are being actively developed by many private companies, including Westinghouse and OKLO. eVinci, a microreactor developed by Westinghouse, is a liquid sodium heat pipe cooled reactor with power output from 200 kWe to 5 MWe. An open-air Brayton cycle, with an operating temperature of 600 °C or higher, is utilized as a power conversion system, and its innovative design is a combination of space reactor technologies and commercial nuclear system design [2,3]. Similarly, OKLO is developing Aurora, a 1.5 MWe liquid sodium heat piped cooled microreactor with an S-CO2 Brayton cycle as the power conversion system. OKLO is also known for actively engaging regulatory bodies for the licensing of the reactor [2].
Out of the various working fluids for the gas Brayton cycle, air and S-CO2 were selected for this research, since this study focuses on the microreactor application. The air Brayton cycle is an open Brayton cycle, in which air is taken from the ambient atmosphere and exhausted after expansion in the turbine. The open-air Brayton cycle is already extensively used by aerospace and power industries, and it is fully matured technology.
On the other hand, the S-CO2 cycle is a closed Brayton, in which the working fluid circulates in a closed loop. Since the early 2000s, many countries are developing environmentally friendly Generation IV nuclear reactors with high efficiency. Due to limitations of the steam Rankine cycle, the gas cycles, including the direct or indirect S-CO2 Brayton cycle, are being researched actively [4]. Rogalev et al. conducted the optimization and economic analysis of the closed S-CO2 and semi-closed oxy-fuel combustion power cycles for multiscale power generation, concluding that using an S-CO2 power cycle leads to a 3.3% increase in the net efficiency in a nuclear power plant with the BREST-OD-300 reactor [5,6]. Additionally, Echogen concluded that the S-CO2 technologies can displace the steam cycle with lower capital and O&M costs, which can reduce LCOE by 20% [7]. Thus, the S-CO2 cycle is one of the prospective working fluids for a power conversion system in commercial nuclear reactors, especially in microreactors. Additionally, the size of the main components, including heat exchangers, of the cycle is compact, since CO2 becomes very dense, which reduces the work required for the compression dramatically [8].
In summary, a gas Brayton cycle will be very likely to be used in conjunction with the next-generation reactor technologies, because their reactor outlet temperatures will probably be higher than 450 °C. Even though many studies on the S-CO2 cycles have been conducted as shown in the literature review, they were analyzed economically or in a different temperature range. In this paper, the performance of the open-air Brayton cycle and supercritical carbon dioxide (S-CO2) power cycles at various power output levels are compared for the next-generation nuclear reactor application. The power output range is targeted for microreactor application, which is from 500 kWe to 10 MWe [9].

1.2. Methods

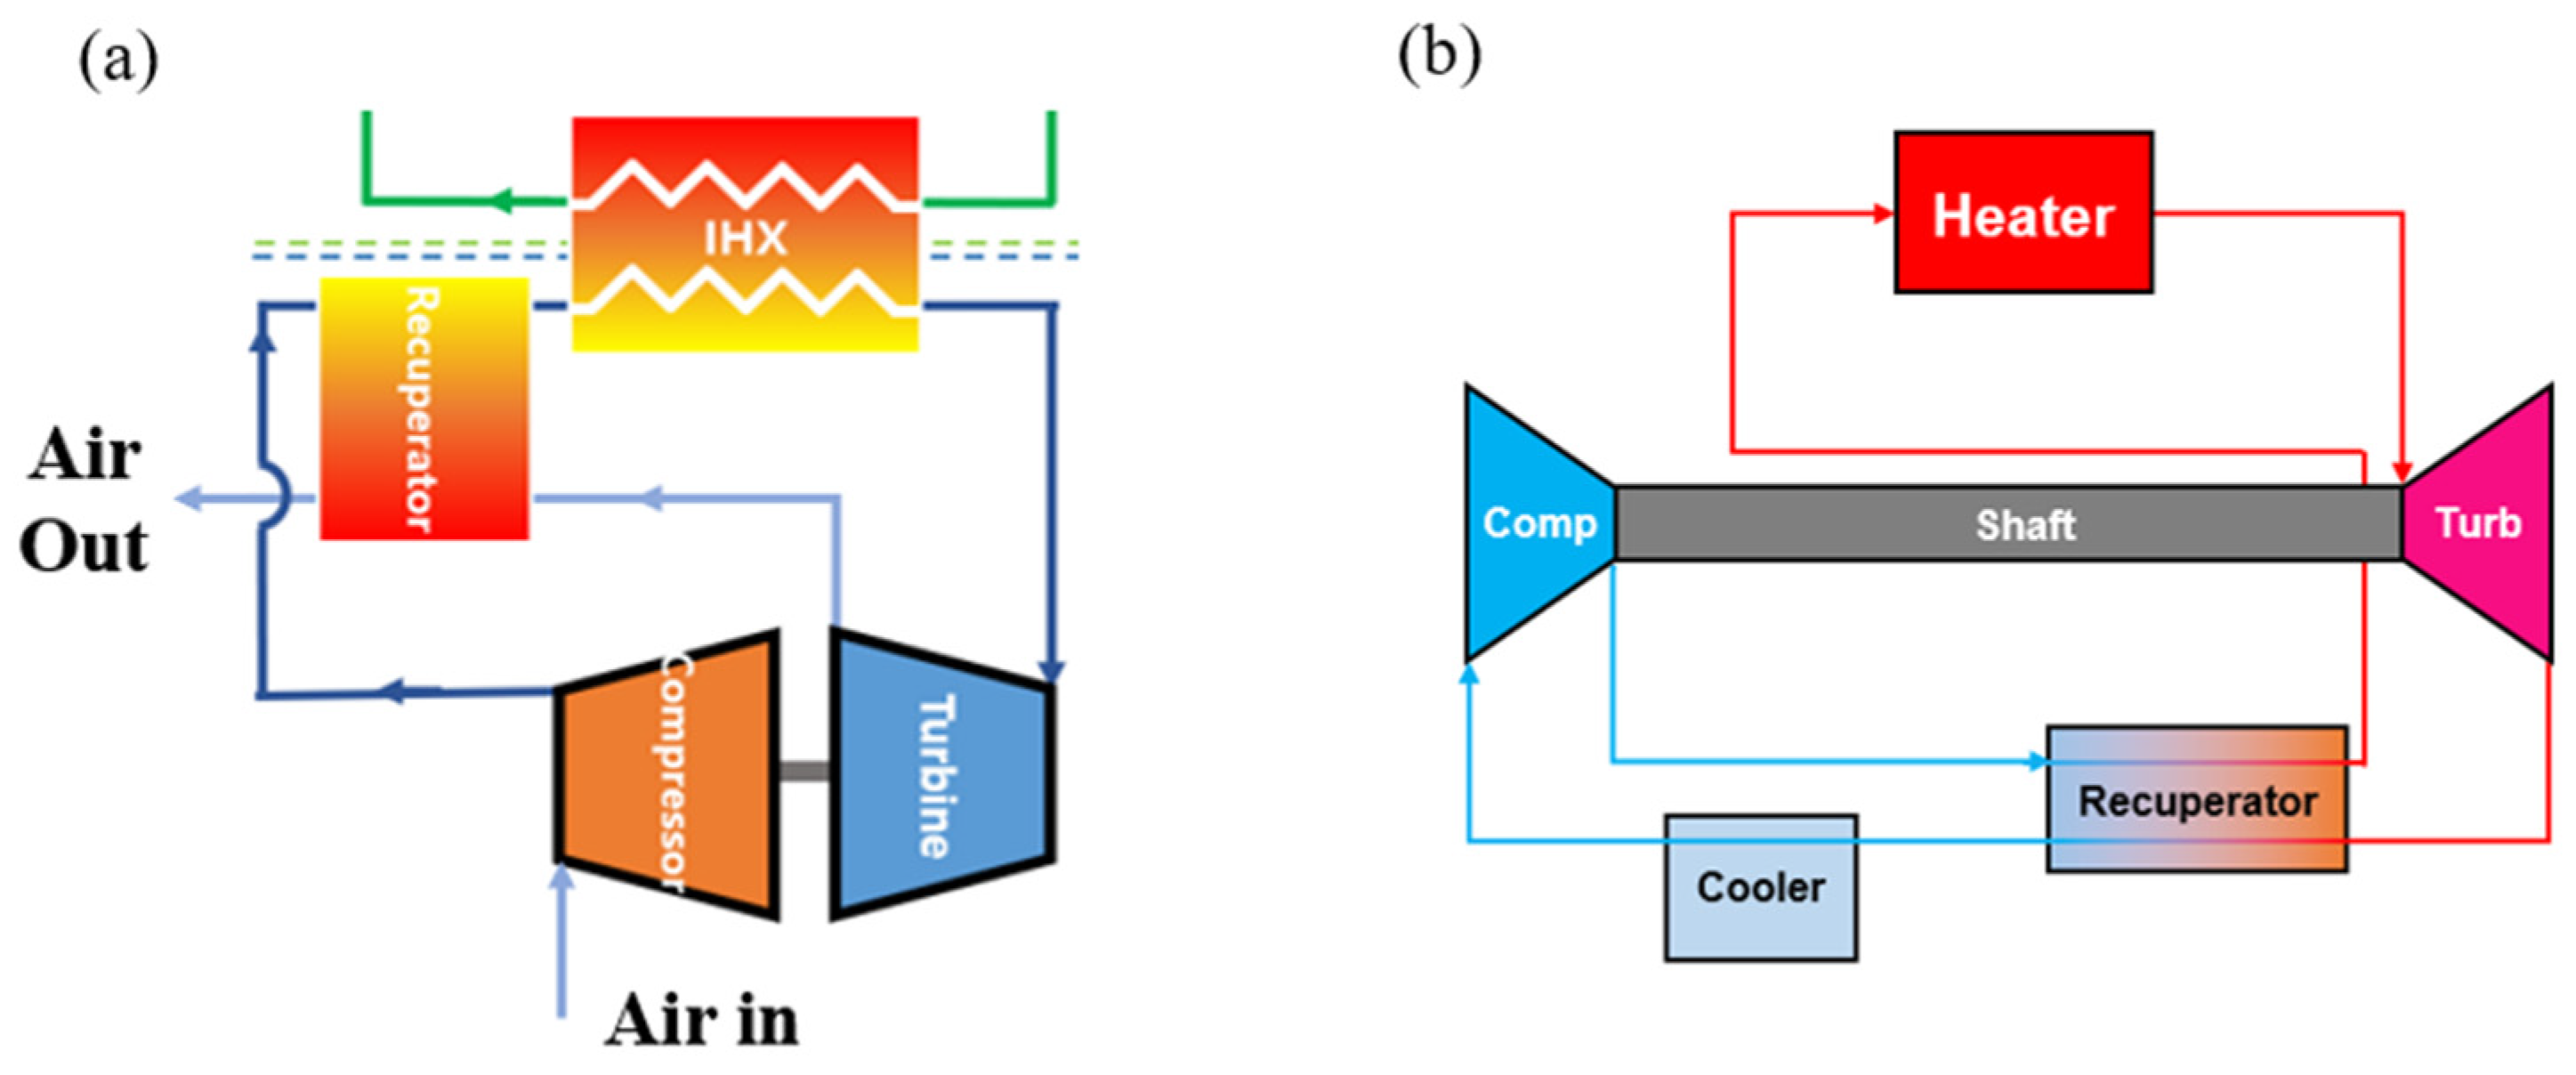
A simple recuperated cycle layout was selected for both cycles as shown in Figure 2. Both cycles include an intermediate heat exchanger, turbine, compressor, and recuperator. The main difference between the open and closed cycle is that the closed cycle needs a cooler because the heated working fluid in the cycle needs to be cooled to the minimum temperature of the cycle before the fluid circulates back to the compressor.
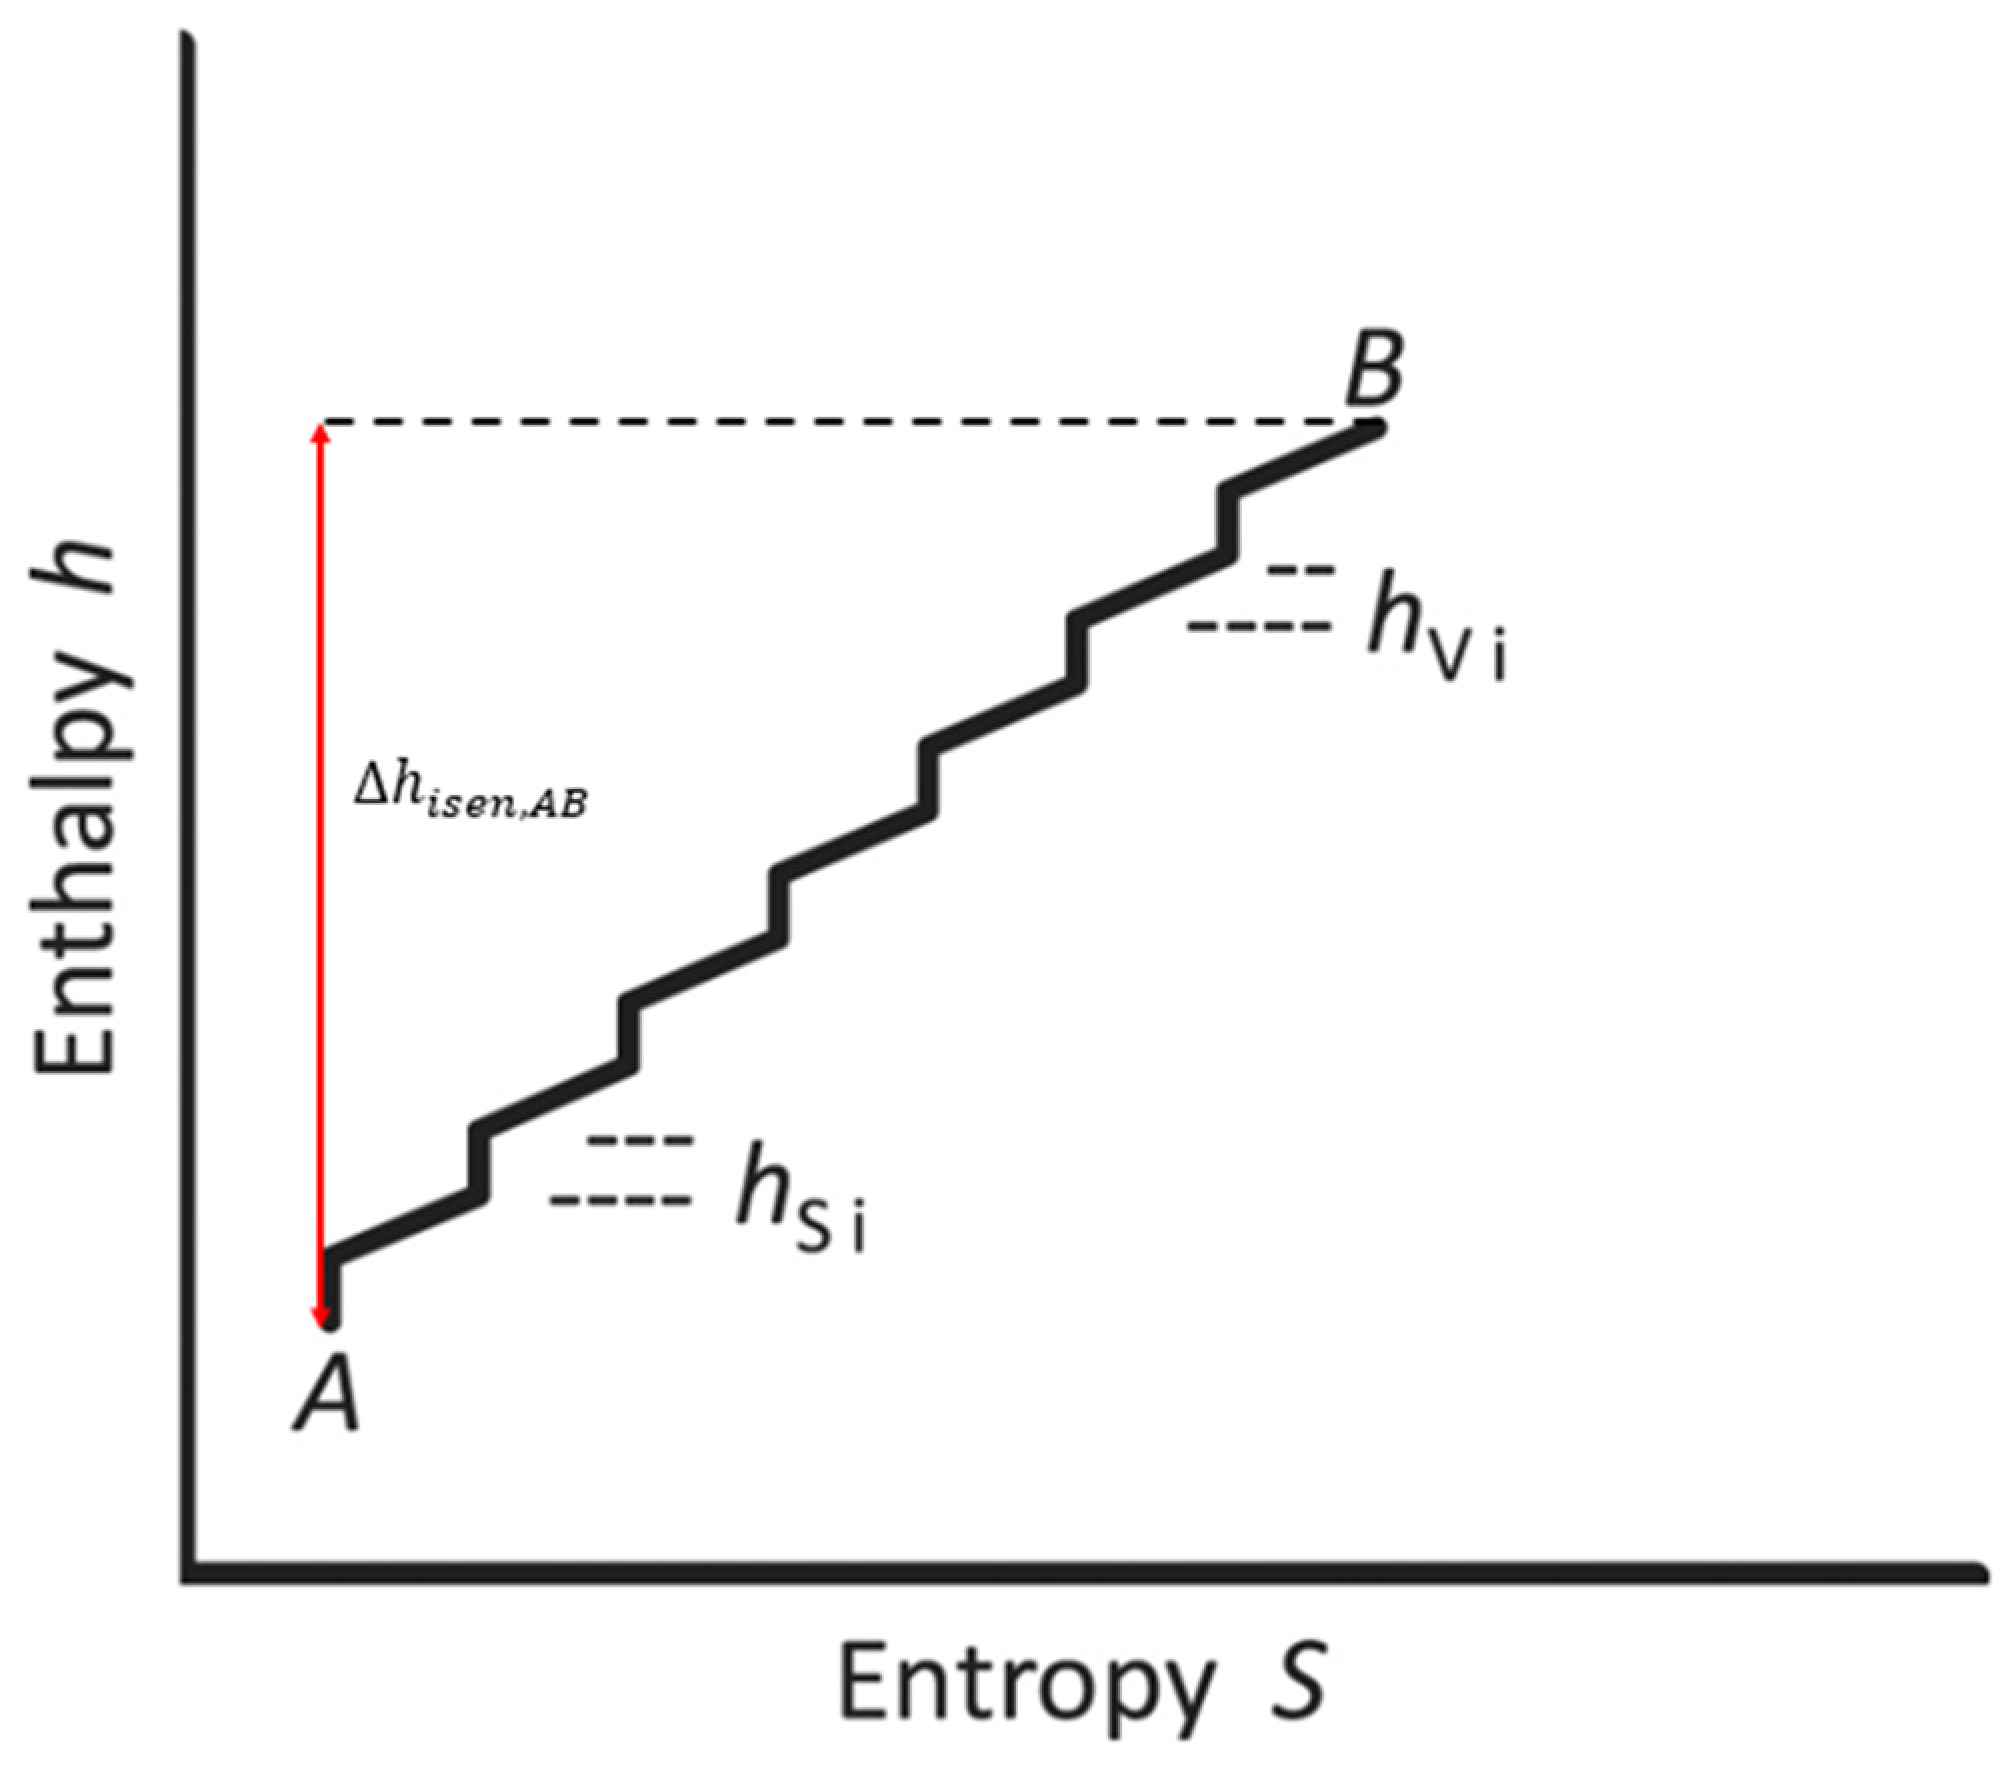
When comparing the performance of the cycles, the efficiencies of the turbine and the compressor have to be determined. However, the turbomachinery isentropic efficiency can be varied with the number of stages used in the turbomachinery. Therefore, polytropic efficiency should be used to compare the open-air and closed S-CO2 Brayton cycles from lab-scale to microreactor applications. Polytropic efficiency is also called “small-stage efficiency” [10]. The definition of the polytropic efficiency is given in Figure 3. Let point A and B be the compressor inlet and outlet points, respectively. By dividing the compression process by infinitesimal stages, the polytropic efficiency from points A to B can be calculated. Equations (1) and (3) show the mathematical definition of the compressor’s polytropic efficiency and isentropic efficiency, respectively.
η poly = Δ h poly , A B Δ h A B
Δ h poly , A B = l i m N i = 1 N h s , i
η isen = Δ h isen , A B Δ h A B
The polytropic efficiency of the turbomachinery will be converted to the isentropic efficiency to be used in the cycle optimization code, which will be discussed in a later section. With the selected cycle layout and the isentropic efficiencies of the turbomachinery, the cycle will be optimized. When optimizing each cycle, the optimization parameter needs to be chosen carefully. In many studies, the cycle is optimized so that the cycle has the maximum cycle thermal efficiency, because designing the cycle with the highest cycle efficiency will generate maximum power output with given thermal input. However, considering the cycle efficiency alone could be misleading when designing the power cycle for microreactors. For the microreactor application, the total volume of the cycle also has to be minimized. Even though the cycle efficiency is high, if the volume it occupies is too large, the cycle cannot be considered as fully optimized. Therefore, the specific work output, which is the work produced per unit mass of gas flowing in the cycle, should also be considered as a parameter for the cycle optimization [11]. In this paper, comparative performance evaluation of simple recuperated open-air and closed S-CO2 Brayton cycle at various power output levels will be researched using polytropic efficiency. As the cycle optimization parameters, the cycle thermal efficiency and the cycle specific work will be considered.

2. Cycle Design

2.1. S-CO2 Brayton Cycle

The simple recuperated Brayton cycle was used for a fair comparison between the two cycles. The cycle performance was predicted at the turbine inlet temperature (TIT) 500 °C, 700 °C, and 900 °C to represent the sodium-cooled fast reactor (SFR), molten salt reactor (MSR), and high-temperature gas-cooled reactor (HTGR). To maintain the CO2 at the supercritical state, the minimum temperature and the maximum pressure were fixed at 20 MPa and 35 °C, which is above the critical point of CO2 (7.38 MPa and 31.1 °C).
When optimizing the cycle, the pressure drop at the heat exchangers should be considered. As shown in Figure 2b, the simple recuperated S-CO2 Brayton cycle has three different heat exchangers: intermediate heat exchanger (IHX), recuperator, and cooler. The pressure drops of each heat exchanger could vary according to its design. Based on the previous research, which includes the operating condition and the design values of the S-CO2 Brayton cycle, the pressure drops at each heat exchanger were selected [12,13,14,15,16]. The design values of the S-CO2 cycle are given in Table 1.

2.2. Air Brayton Cycle

Similar to the S-CO2 Brayton cycle, the cycle layout for the open-air Brayton cycle is given in Figure 2a. At the TIT of 500 °C, the open-air Brayton cycle has negative power, because the work consumed by the compressor is greater than the power generated by the turbine. Thus, TITs of 700 °C and 900 °C were calculated for the open-air Brayton cycle [17]. This already indicates that applying the open-air Brayton cycle for a core outlet temperature equal to or lower than 500 °C is not possible. To compare the air and S-CO2 cycles fairly, the minimum temperature of the air Brayton cycle was also fixed to 35 °C. The air Brayton cycle has two heat exchangers, the IHX and the recuperator. Based on the previous research on the air Brayton cycle, which includes the operating condition of commercial air Brayton cycle and the design values, the pressure drops of each heat exchanger were selected [18,19,20]. Different from the S-CO2 Brayton cycle, the minimum pressure was fixed to the atmospheric pressure. The design values of the air Brayton cycle are listed in Table 2.

3. Design of Turbomachinery

3.1. Polytropic Efficiency for Turbomachinery

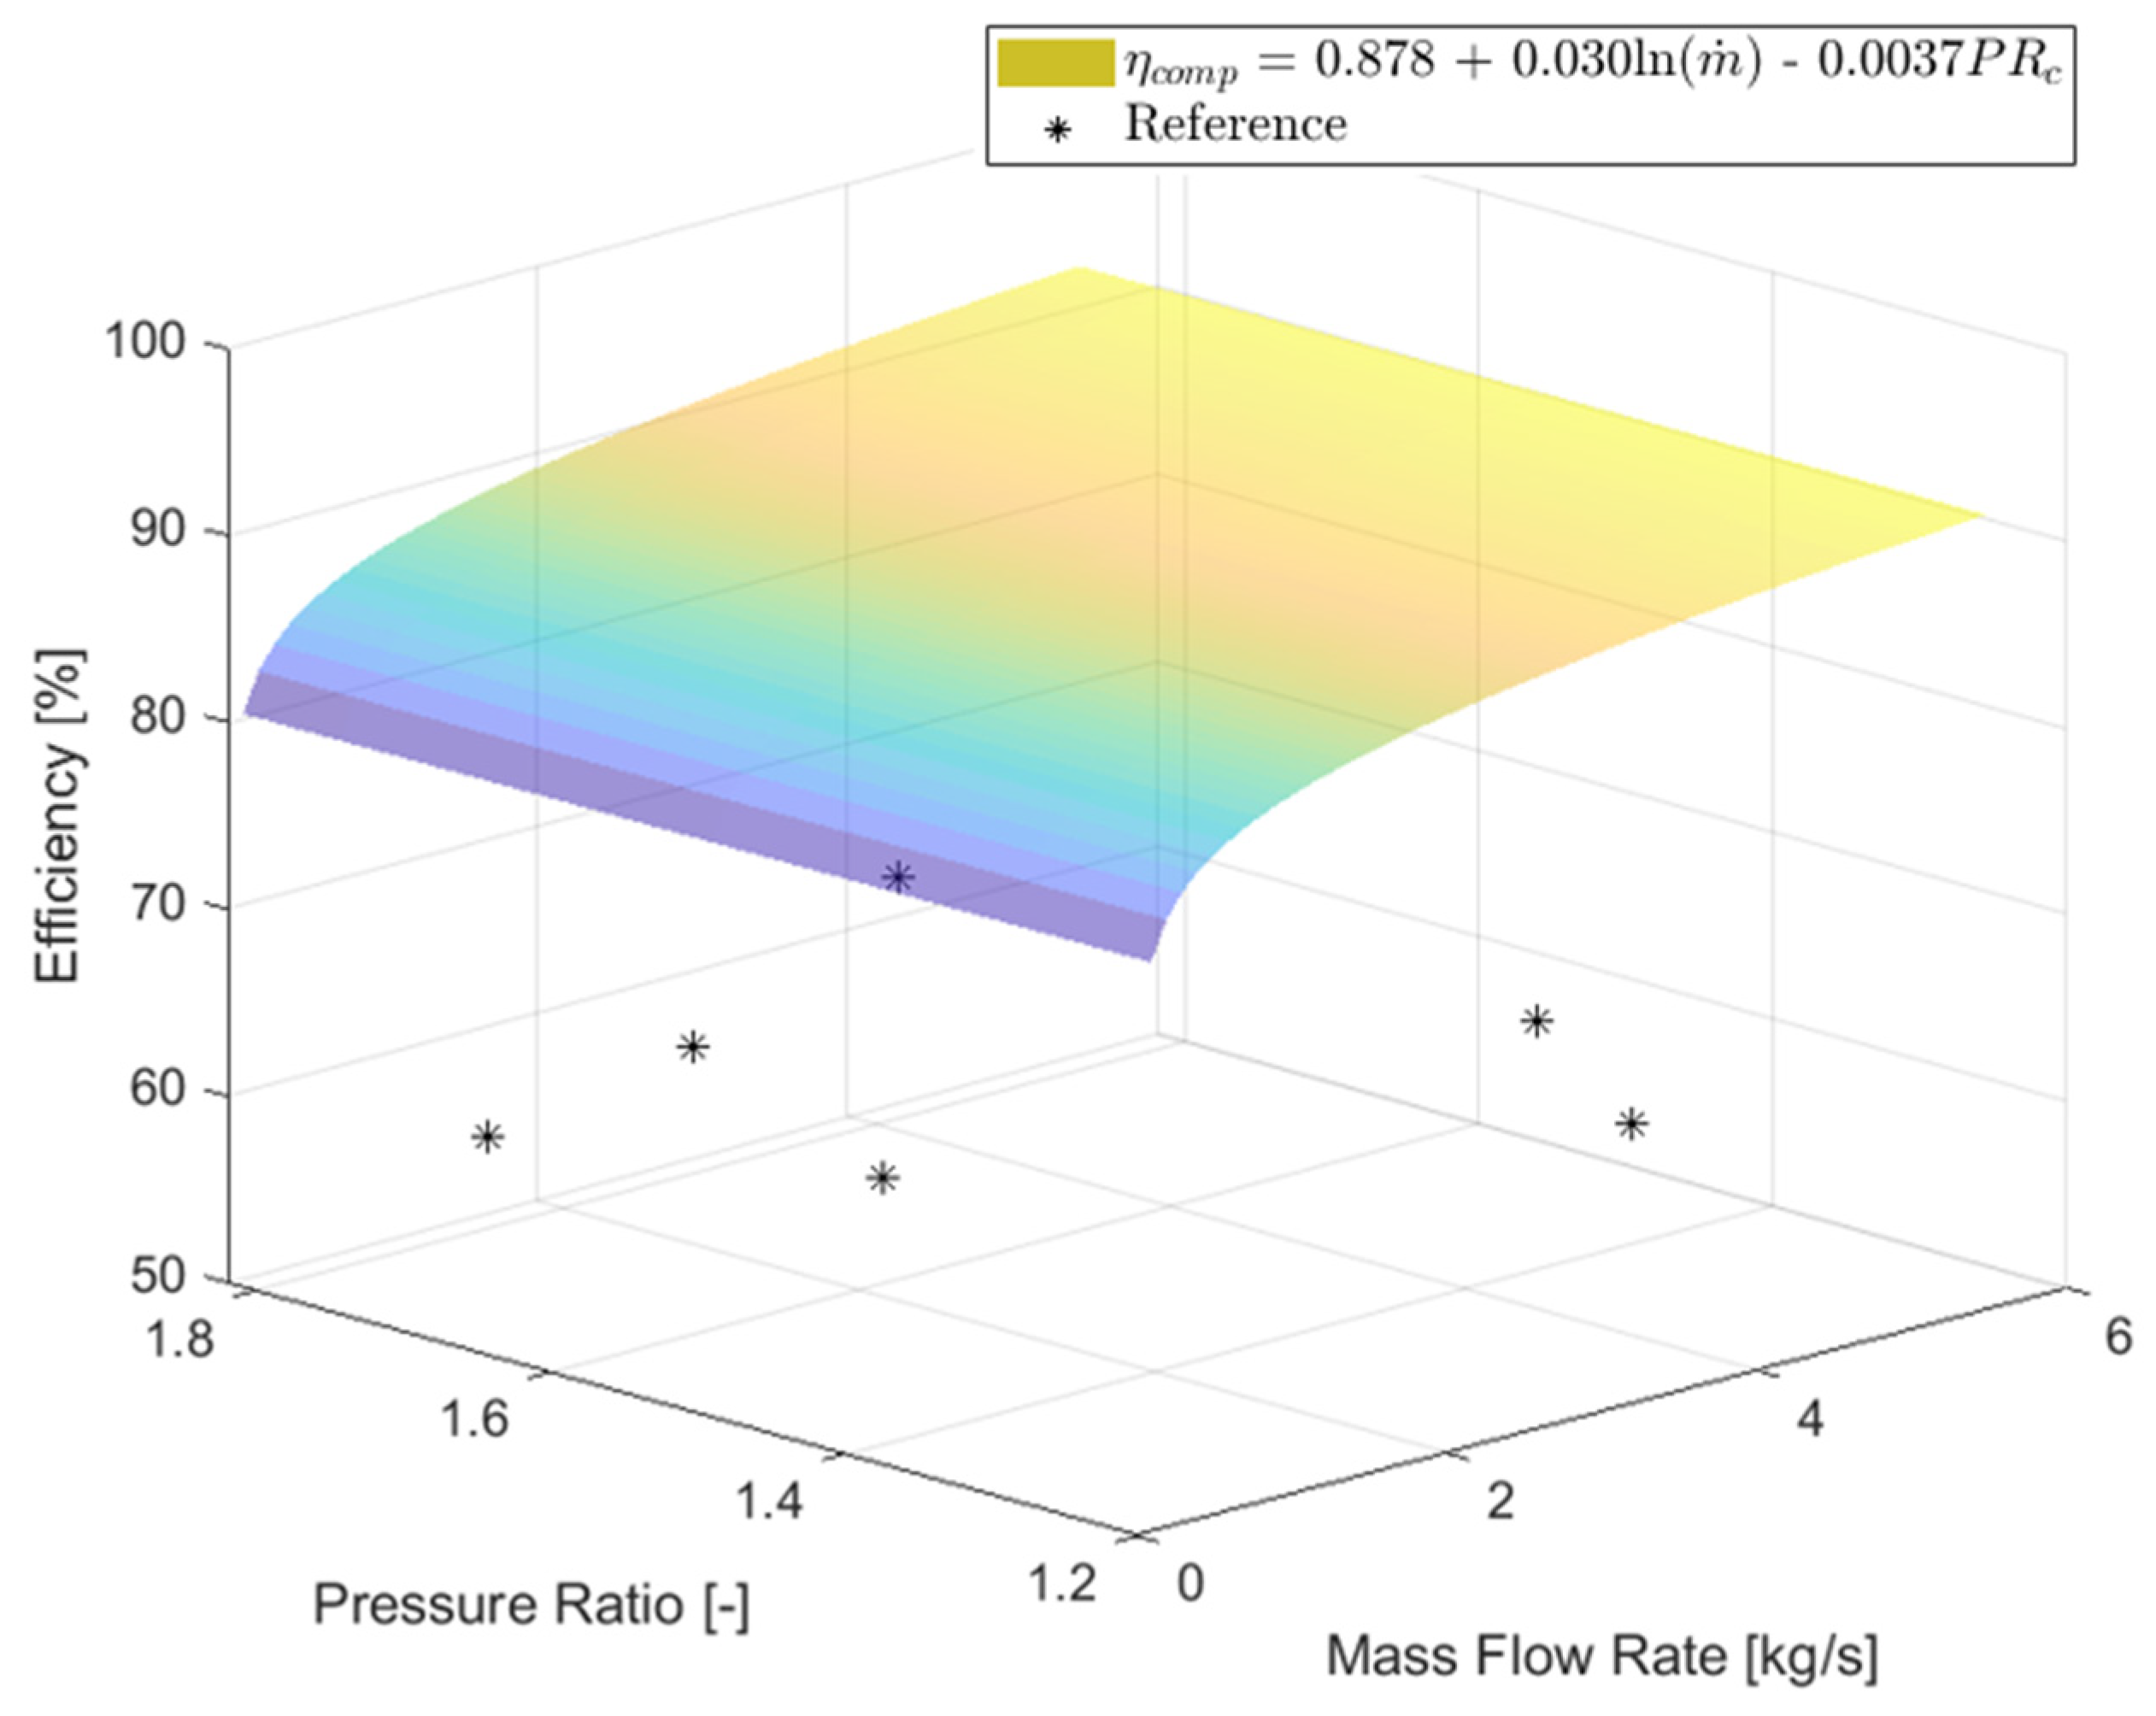
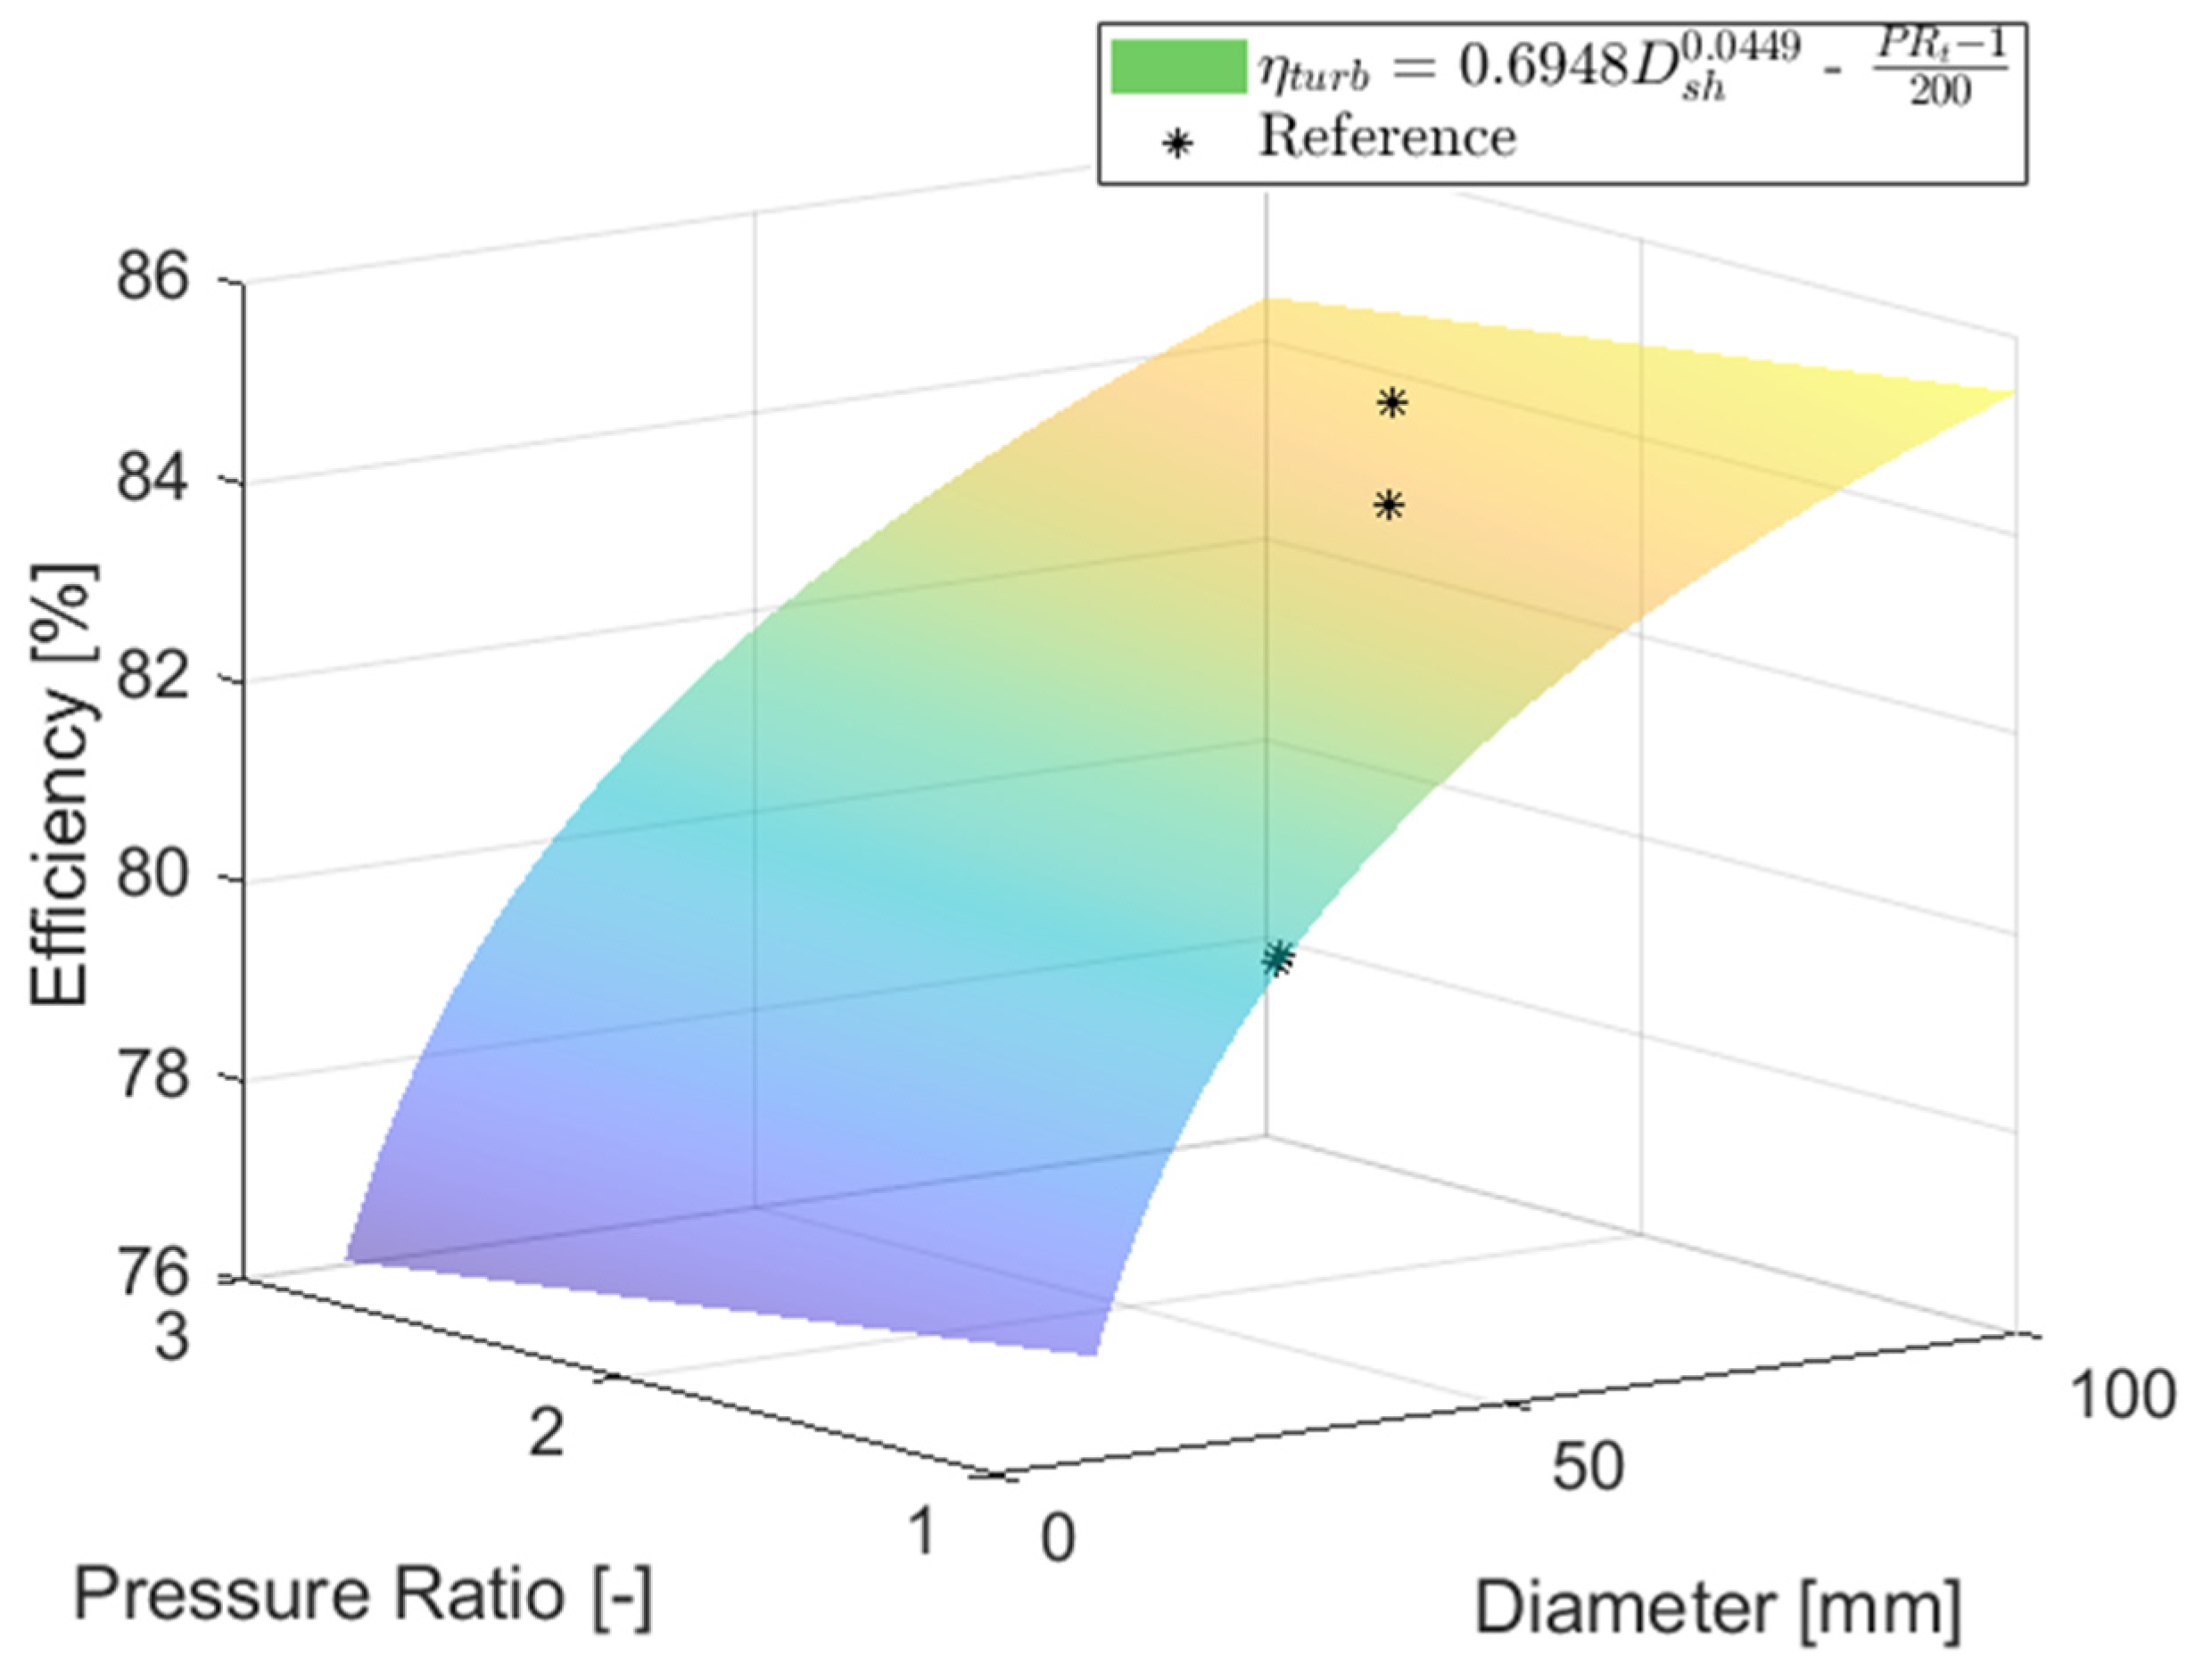
The performance of the turbomachinery varies with the design parameters, including flow rate, power, and inlet conditions. However, fully designing the turbomachinery at each power level is not plausible for this study. Therefore, the polytropic efficiencies of the compressor and the turbines were calculated using empirical correlation. Equations (4) and (5) are the correlations for the polytropic efficiencies for the compressor and turbine, which reflect the current state of the art [21]. Figure 4 and Figure 5 represent the compressor and turbine polytropic efficiency.
η poly , comp = 0.878 + 0.030 ln m ˙ 0.0037 P R c
η poly , turb = 0.6984 d s h 0.0449 P R t 1 200
where m ˙ and d s h represents the mass flow rate and rotor shroud diameter, respectively.
The correlations were intentionally developed for the general gas turbine and compressors; therefore, many air Brayton cycle studies were based on the equations. However, due to dramatic changes in CO2 thermal properties near the critical point, as shown in Figure 6, the equations, especially for the compressor, need to be validated before application. Table 3 and Table 4 list the S-CO2 compressor and turbine experimental facility design values, and Figure 7 and Figure 8 show the comparison of the equation with the S-CO2 compressor and turbine design values, respectively.
Table 3. S-CO2 Compressor Experimental Facility Design Values [14,22,23,24,25,26].
CompressorPressure Ratio [-]Mass Flow Rate [kg/s]Efficiency [%]Shaft Speed [RPM]
SCIEL1.83.20~6570,000
SNL1.823.5367.5375,000
Japan Institute of Applied Energy~1.51.20~60100,000
IST1.805.4660.7875,000
KIER1.753.70~6570,000
KAIST1.301.505640,000
Table 4. S-CO2 Turbine Experimental Facility Design Values [24,26].
TurbinePressure Ratio [-]Rotor
Diameter [mm]
Efficiency [%]Shaft Speed [RPM]
SNL1.868.184.075,000
SNL1.868.385.075,000
IST1.68653.079.875,000
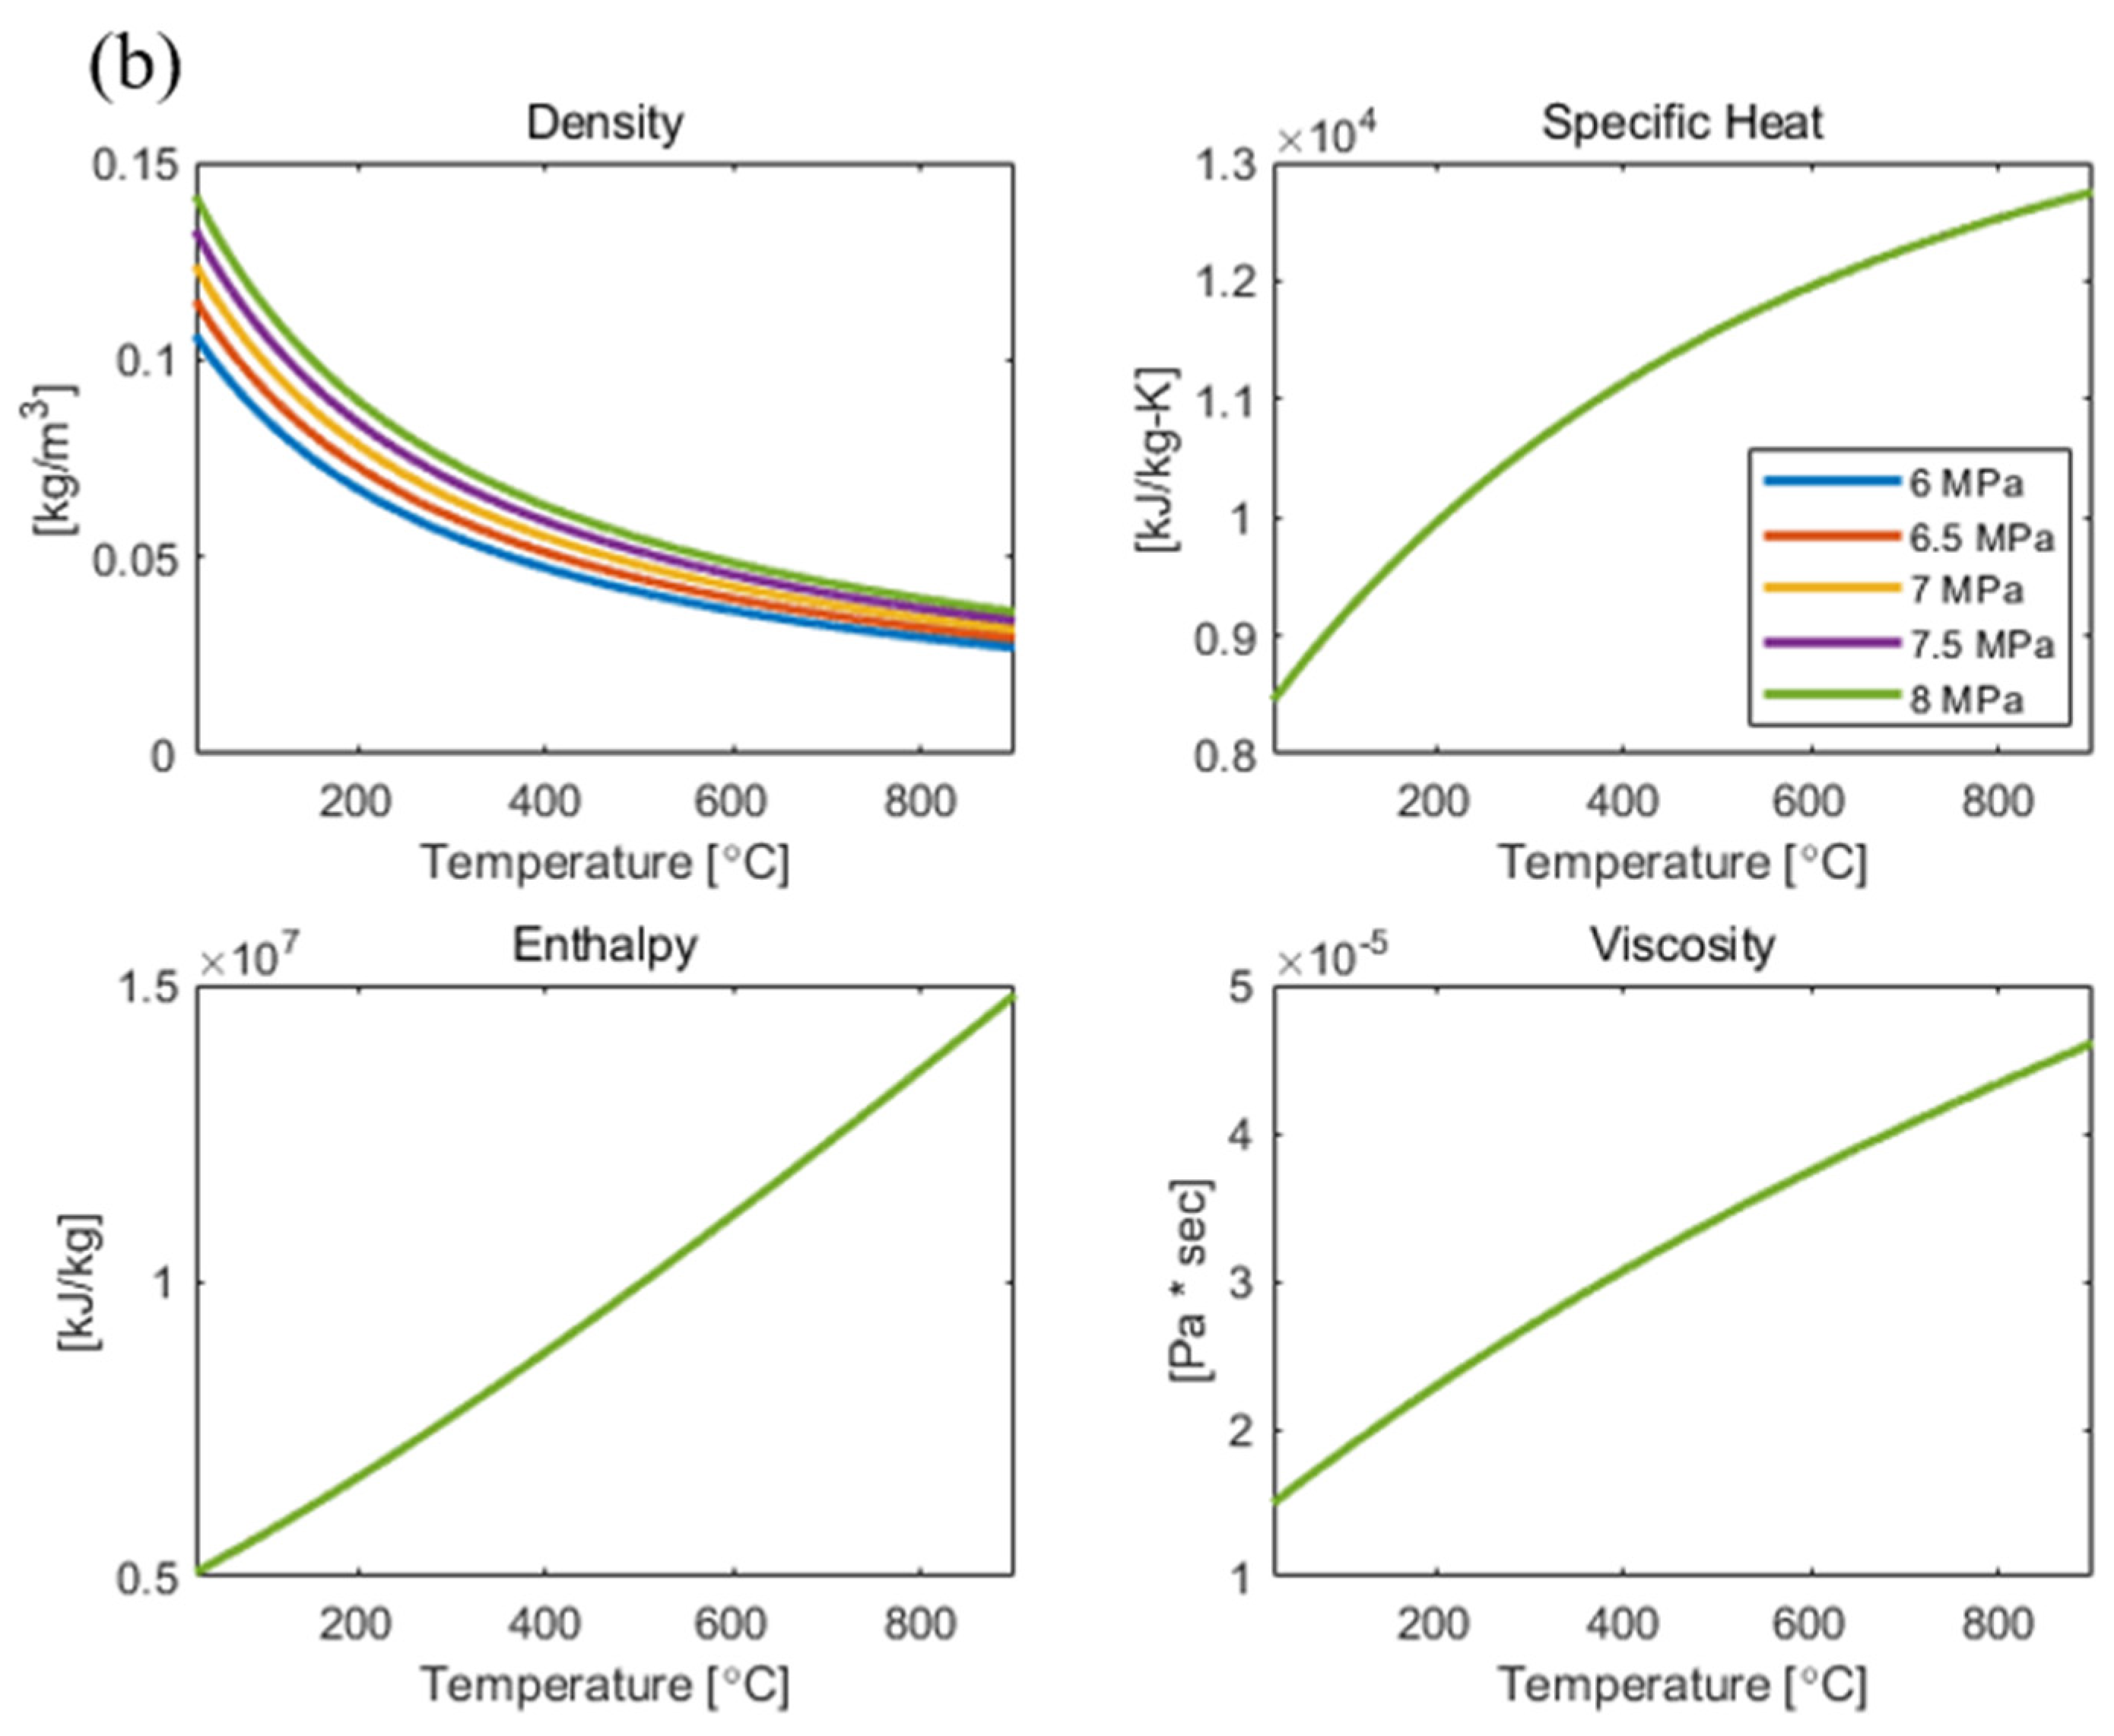
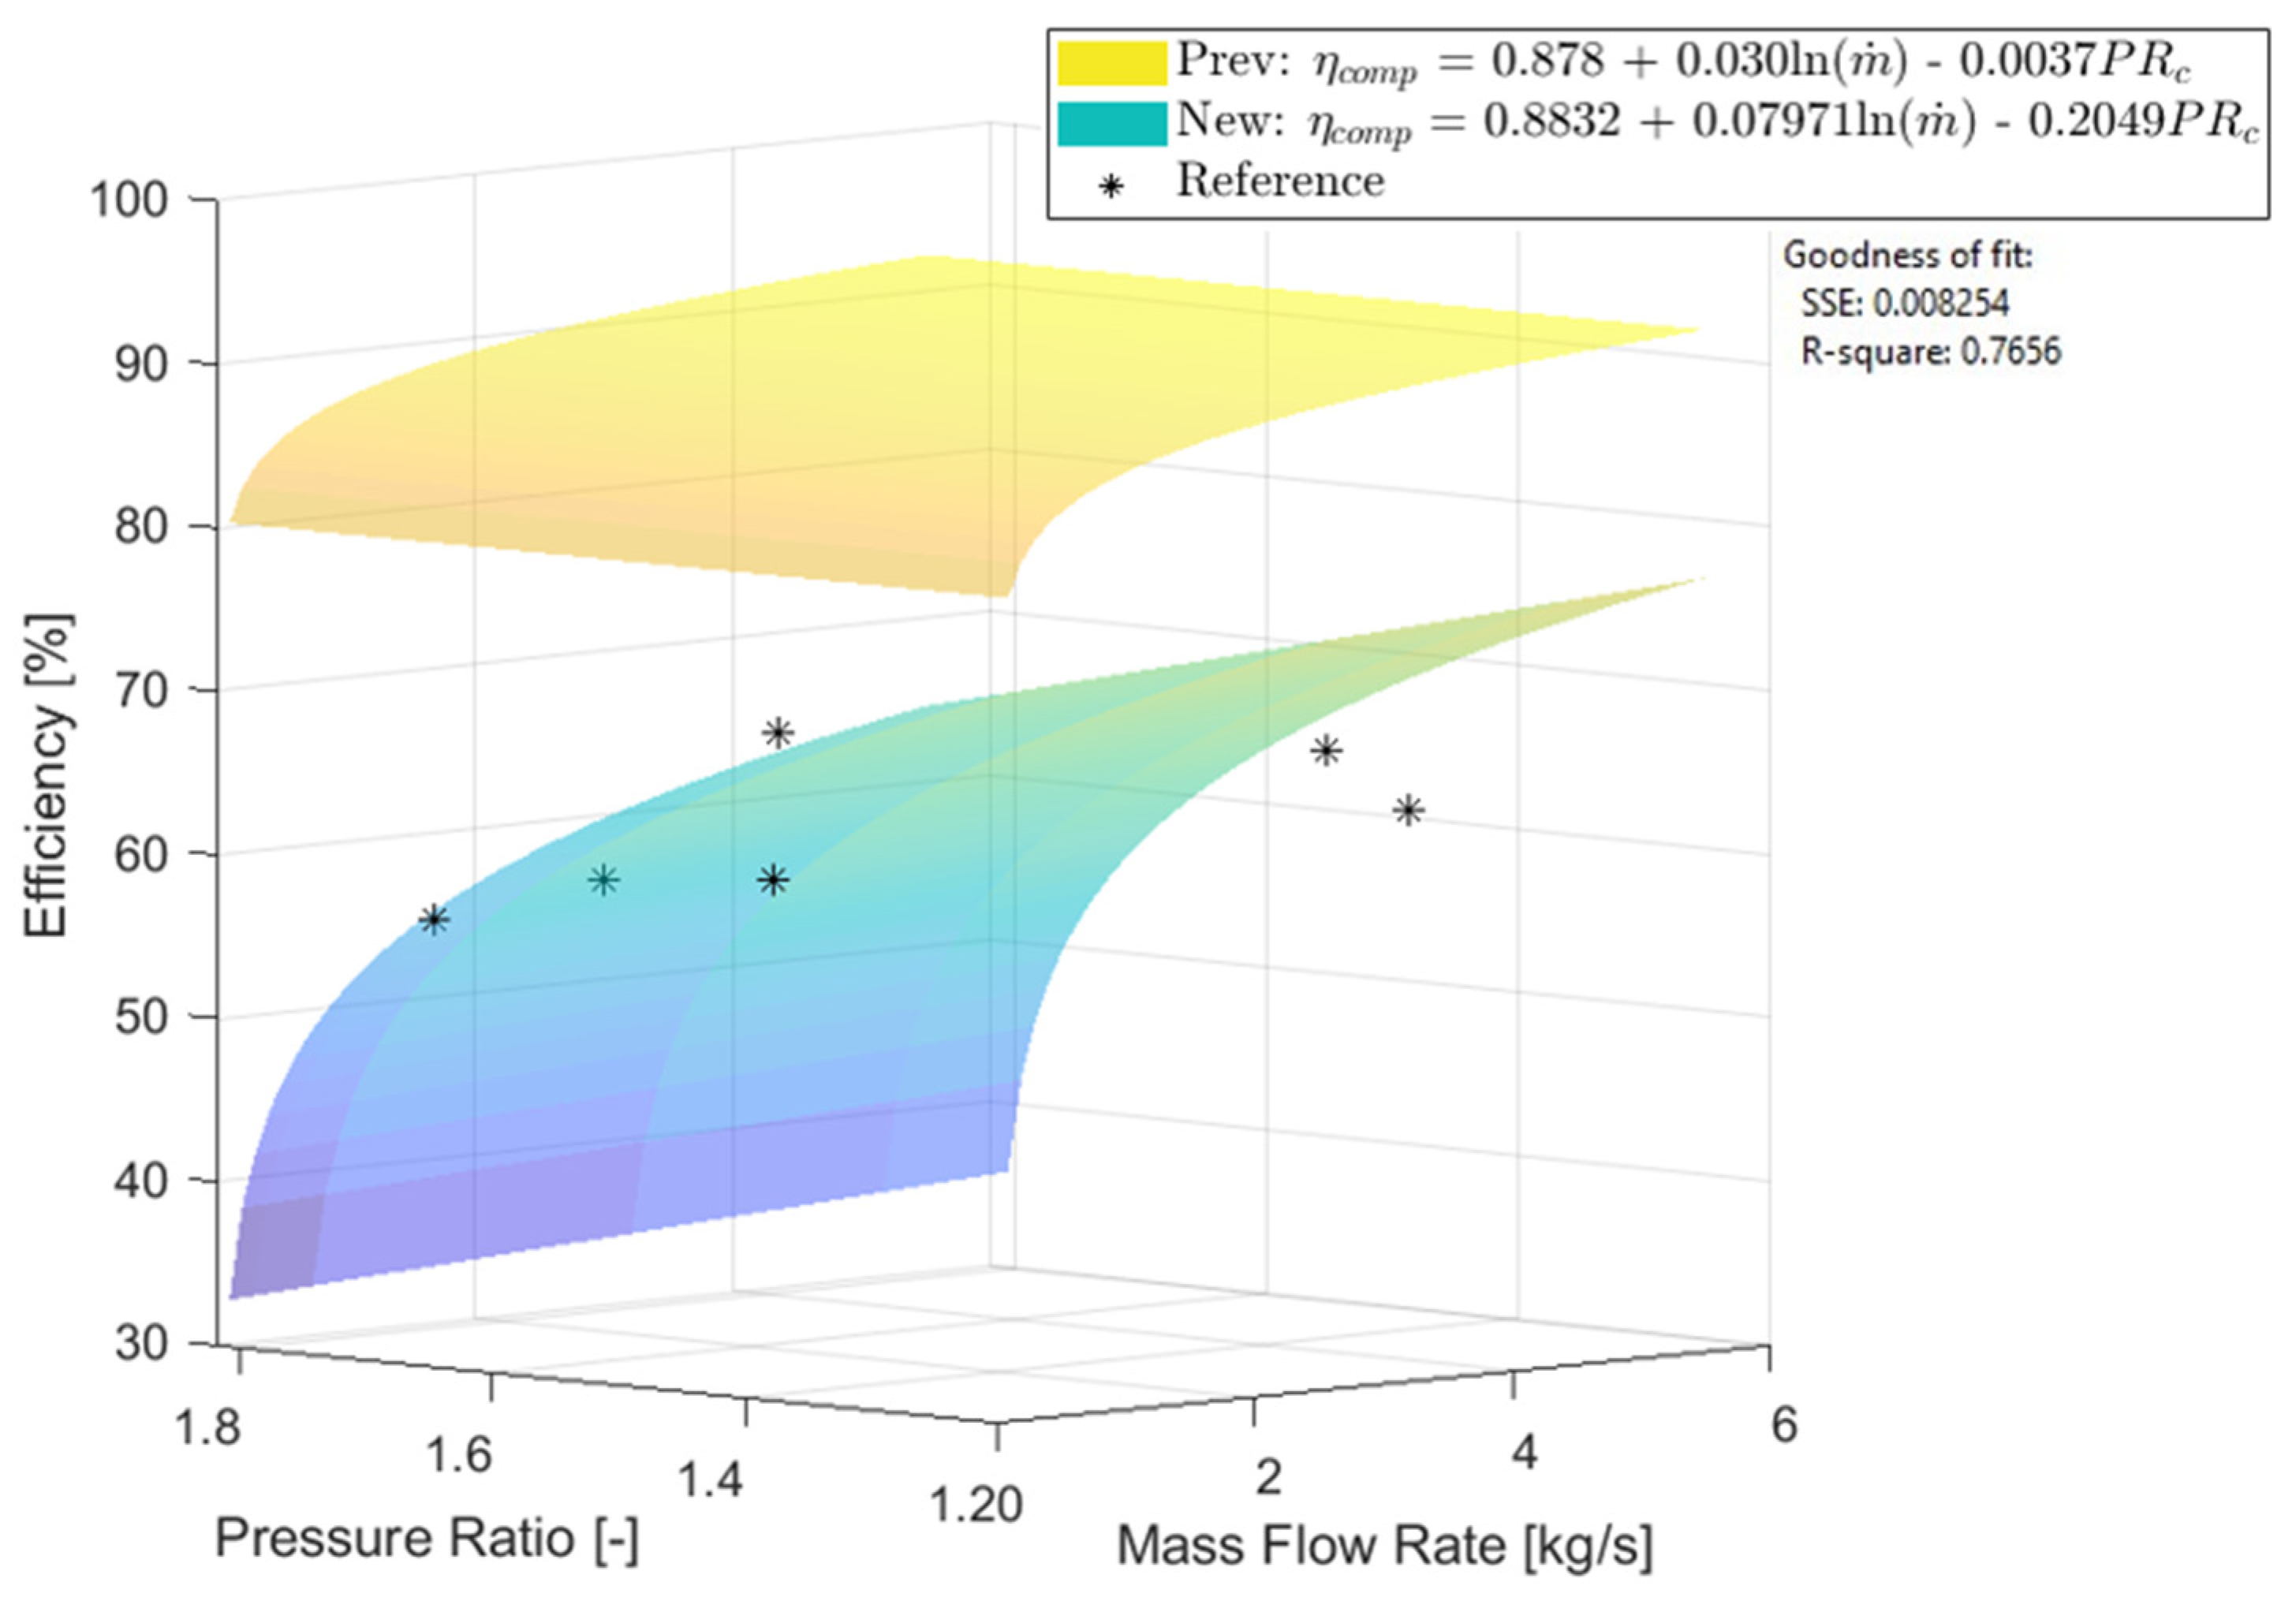
As shown in Figure 8, the deviation between the turbine polytropic efficiency calculated by Equation (5) and the S-CO2 turbine experimental facility design values was nearly negligible, with a maximum error of 3.6%. However, as shown in Figure 7, the compressor polytropic efficiency calculated using Equation (4) and the S-CO2 compressor experimental facility design values were substantially different. The main reason for the deviation in the compressor efficiency is the real gas effect of CO2 near the critical point. Figure 6b shows the thermal properties of CO2 near the turbine operating range. The thermal properties of CO2 at the turbine inlet condition show near ideal gas behavior. However, the thermal properties of CO2 near the critical point, or at the compressor inlet condition, show a very strong real gas effect. Therefore, Equation (5) can be used to predict the S-CO2 turbine polytropic efficiency, but a new equation is needed for the S-CO2 compressor polytropic efficiency. Based on the S-CO2 compressor experimental design values, the new equation for the S-CO2 polytropic efficiency was fitted using MATLAB code. Equation (6) shows the new equation, and Figure 9 shows the comparison between the new and previous equations. As the equation is fitted using the operating data points, the R-squared value, which is widely used to measure the goodness-of-fit, is determined to be 0.77 [27]. A 0.77 R-square value is not an ideal value for the regression analysis, but since not much data are currently available and the uncertainties of the data are also not negligible, which leaves small room for improvement from the current correlation, Equation (6) was used for the following analysis. The polytropic efficiency curve for the S-CO2 compressors can be improved as more S-CO2 compressor experimental data become available in the future.
η poly , comp = 0.8832 + 0.07971 ln m ˙ 0.2049 P R c

3.2. Conversion from Polytropic Efficiency to Isentropic Efficiency

The turbomachinery polytropic efficiencies should be converted to the isentropic efficiencies for the cycle optimization code. For the air Brayton cycle, the air was assumed to be an ideal gas, which follows the ideal gas law. The isentropic efficiency of the air turbomachinery can be calculated using the following equations:
η isen , comp = Isentropic   Compressor   Work Real   Compressor   Work = T isen , out T i n T r e a l , o u t T i n = P R c o m p γ 1 γ 1 P R c o m p n 1 n 1
η i s e n , t u r b = 1 P R t u r b γ 1 γ η p o l y , t u r b 1 P R t u r b γ 1 γ
where T i n is the temperature of the air at the inlet, T i s e n , o u t is the temperature of the air at the exit for isentropic process, and T r e a l , o u t is the temperature of the air at the exit for real process.
For an ideal gas, such as air, Equations (9) and (10) can be used to convert polytropic turbomachinery efficiency to the isentropic efficiency.
However, Equations (7) and (8) cannot be used to convert the polytropic efficiency to the isentropic efficiency of S-CO2 turbomachinery, because the ideal gas law used to derive the equations does not apply to CO2 near the critical point. Thus, instead of the ideal gas law, P V = Z R T is used, where Z is the compressibility factor.
After rearranging the equations, Equations (9) and (10) show the conversion from S-CO2 polytropic efficiency to the isentropic efficiency. The detailed derivation of the equations is given in Appendix A.
n 1 n = 1 η p o l y , c o m p γ 1 γ + P 1 1 η p o l y , c o m p 1 P β T β P h P T h T P
n 1 n = η p o l y , t u r b γ 1 γ + 1 η p o l y , t u r b 1 P β T β P h P T h T P
where β P = 1 T + 1 Z Z T P and β T = 1 P 1 Z Z P T .

4. Cycle Optimization

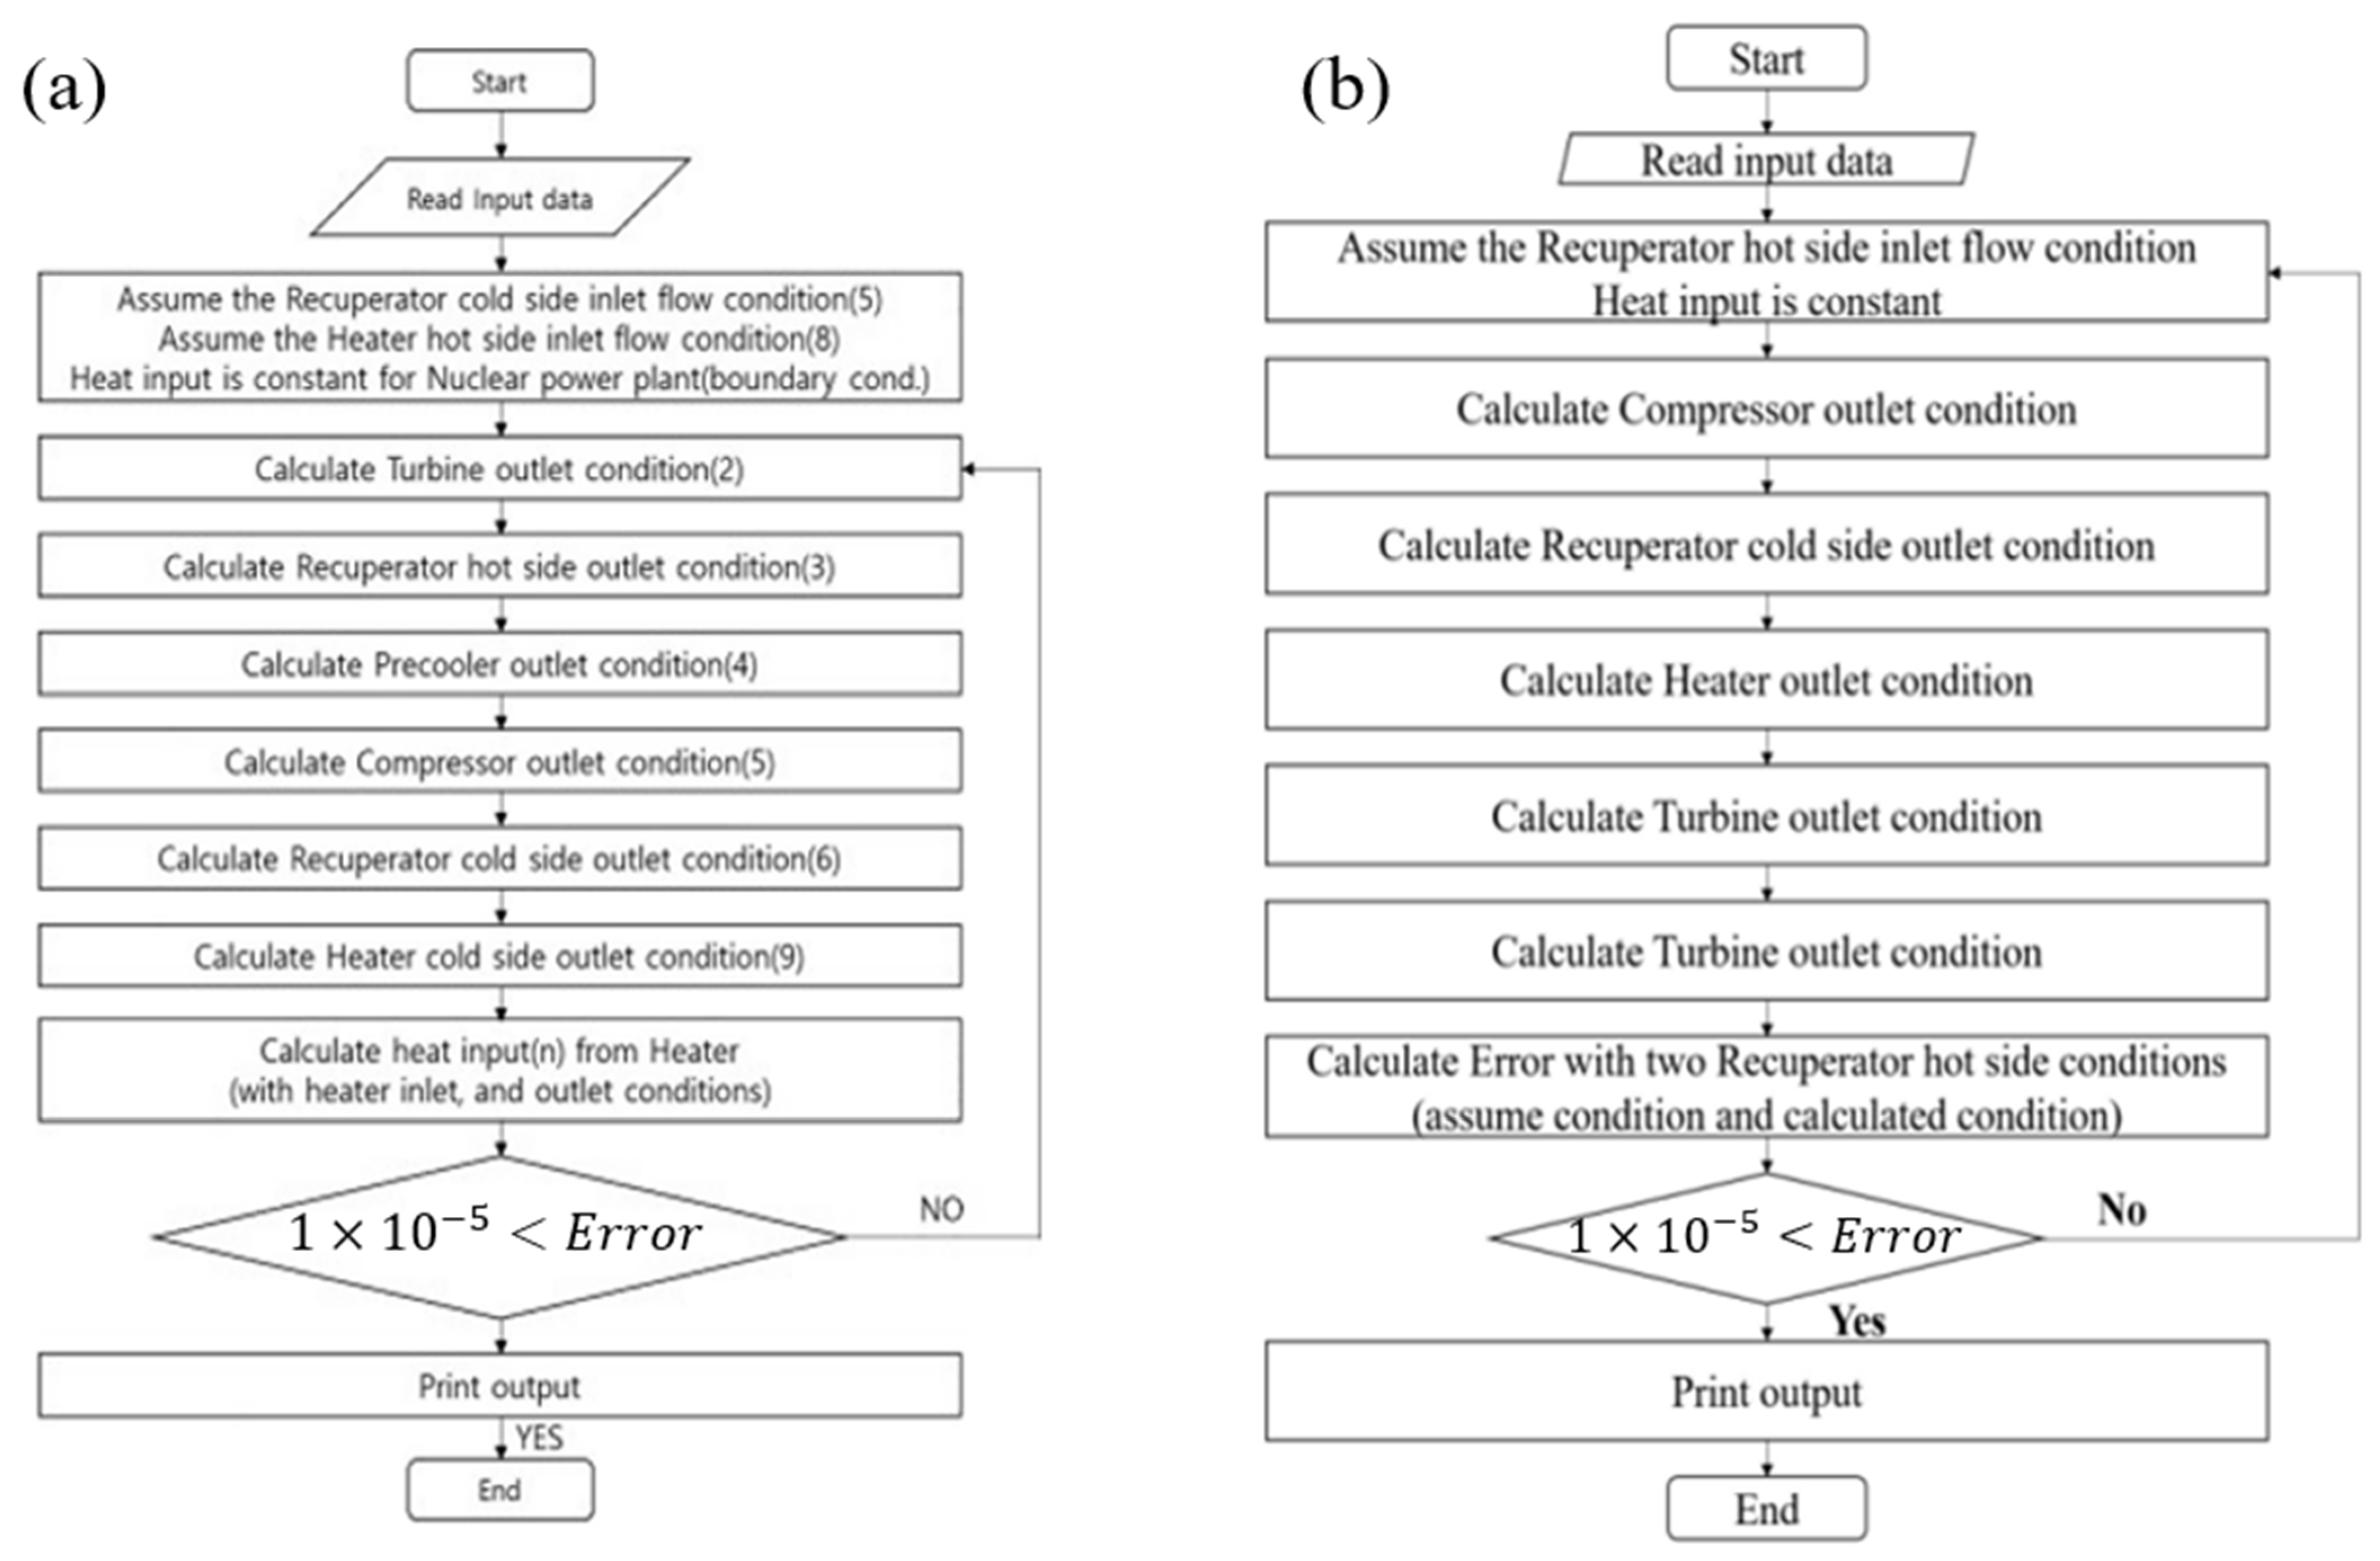
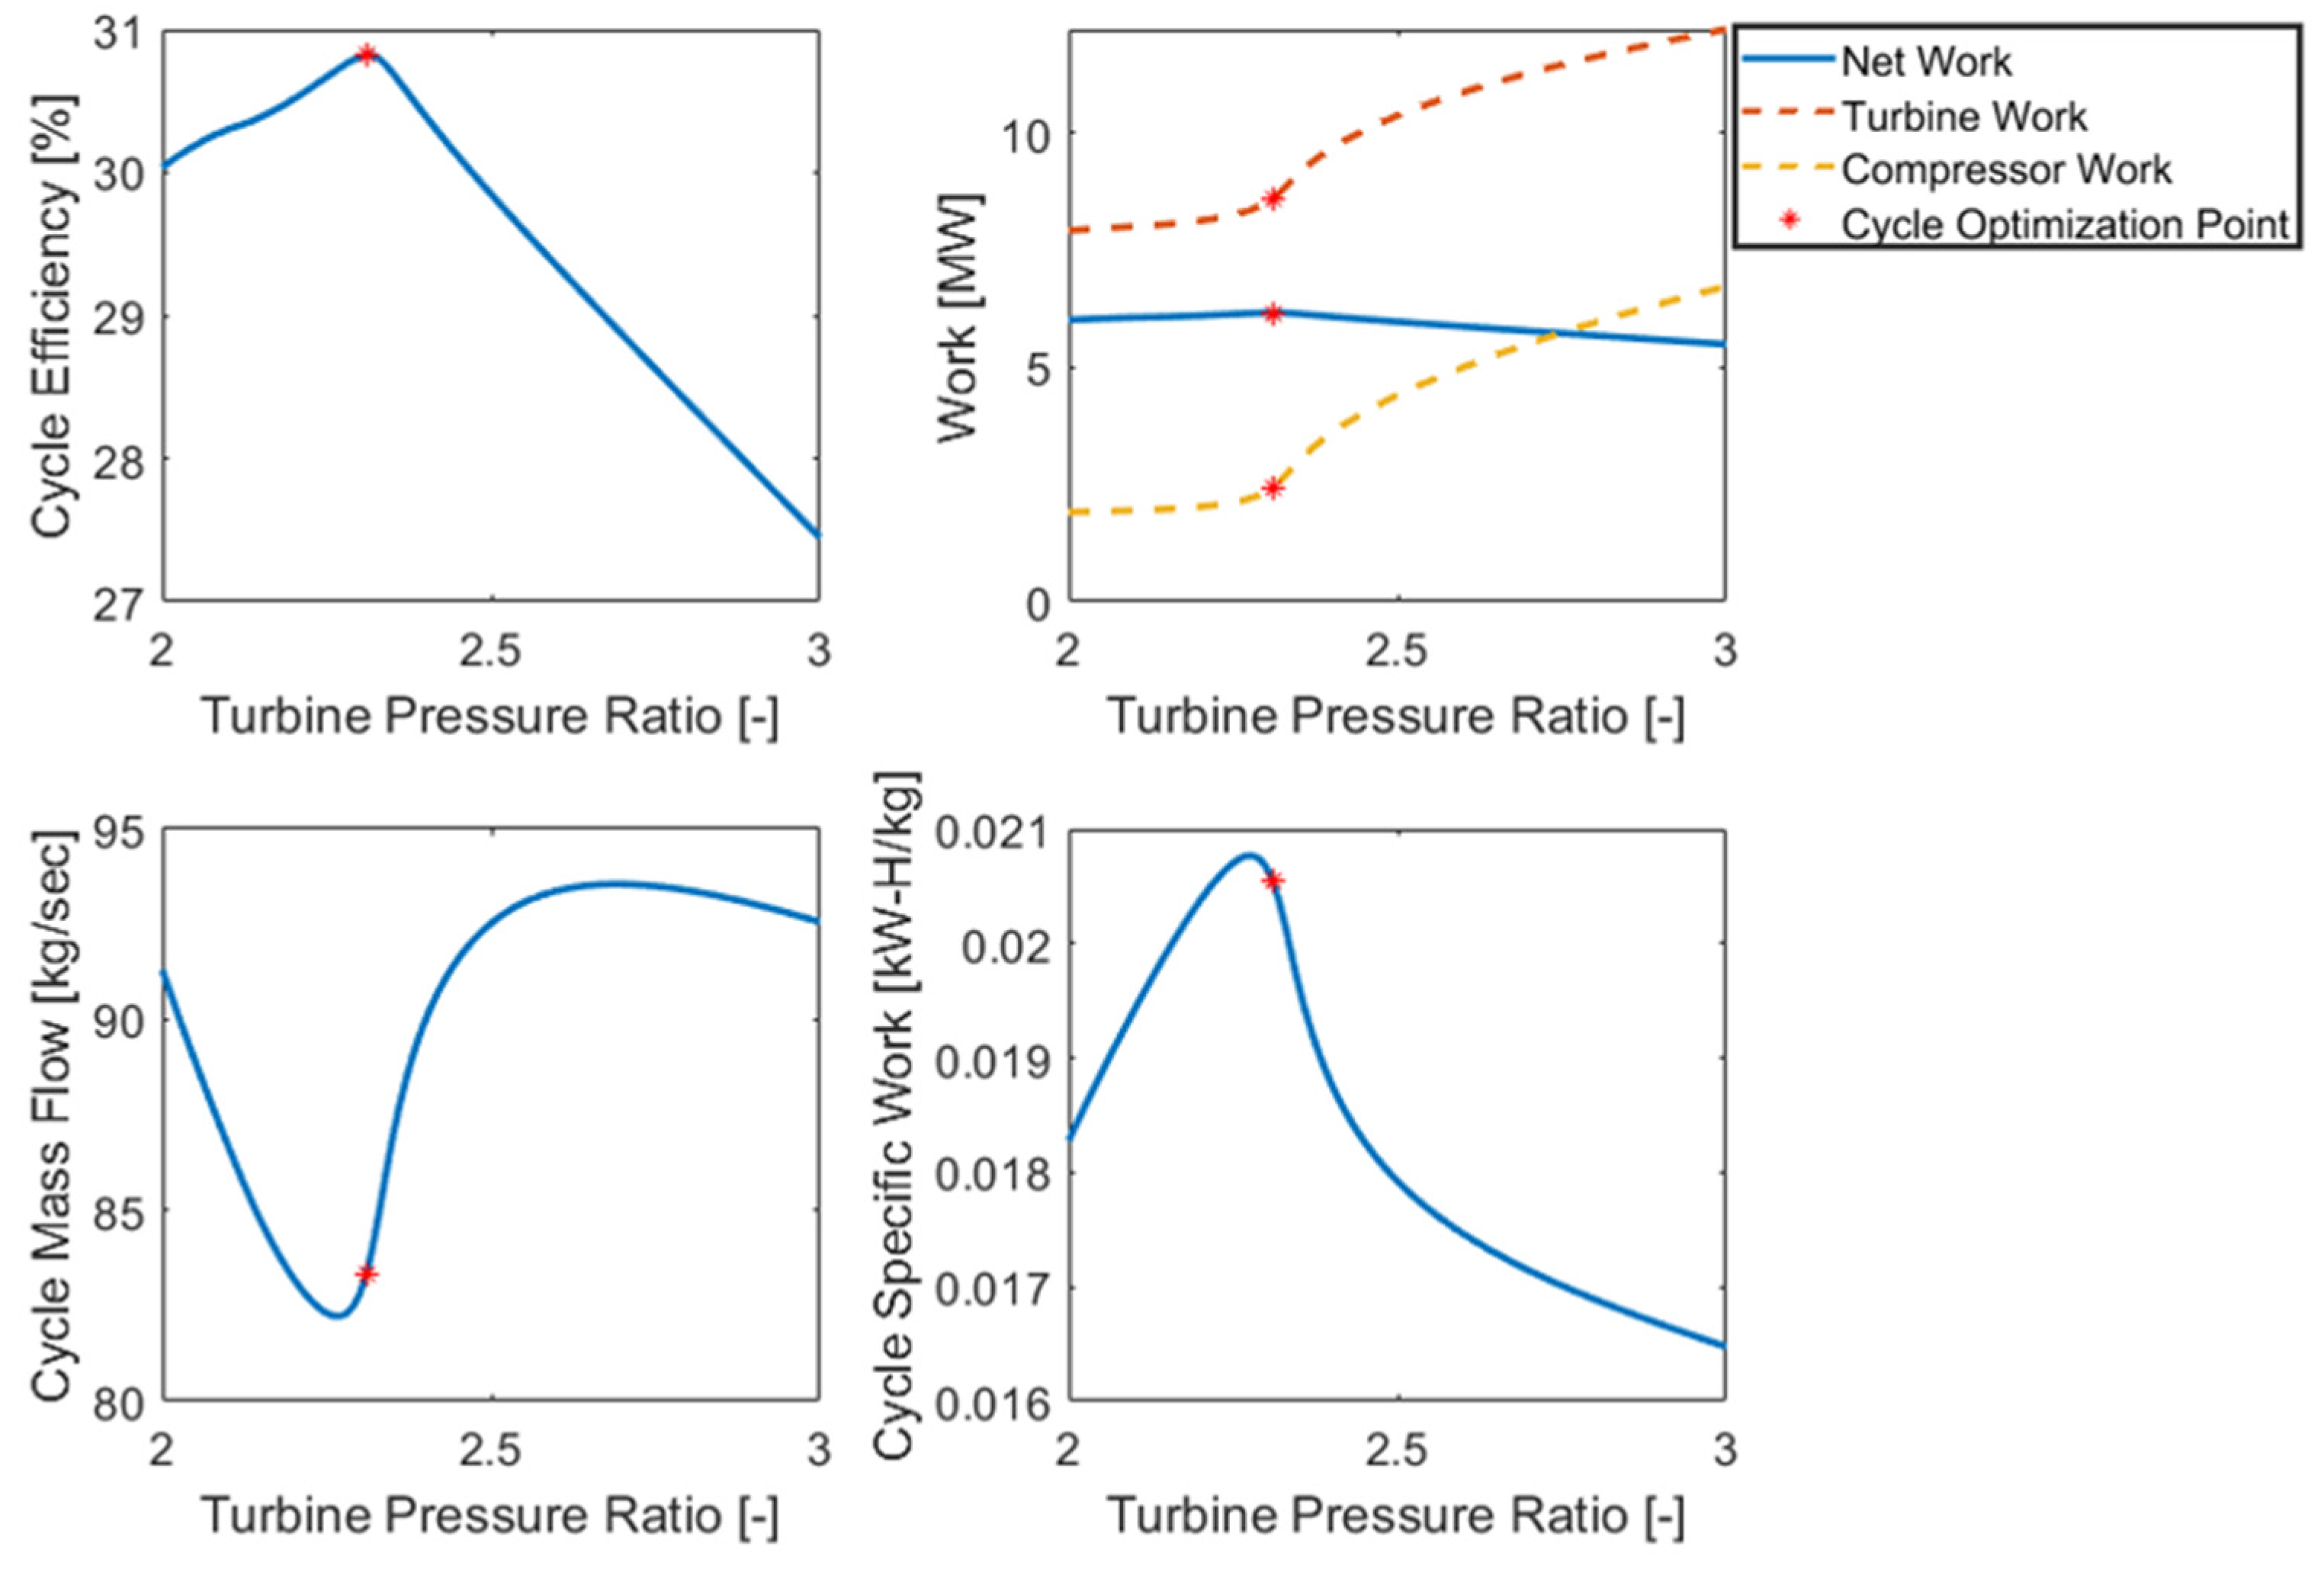
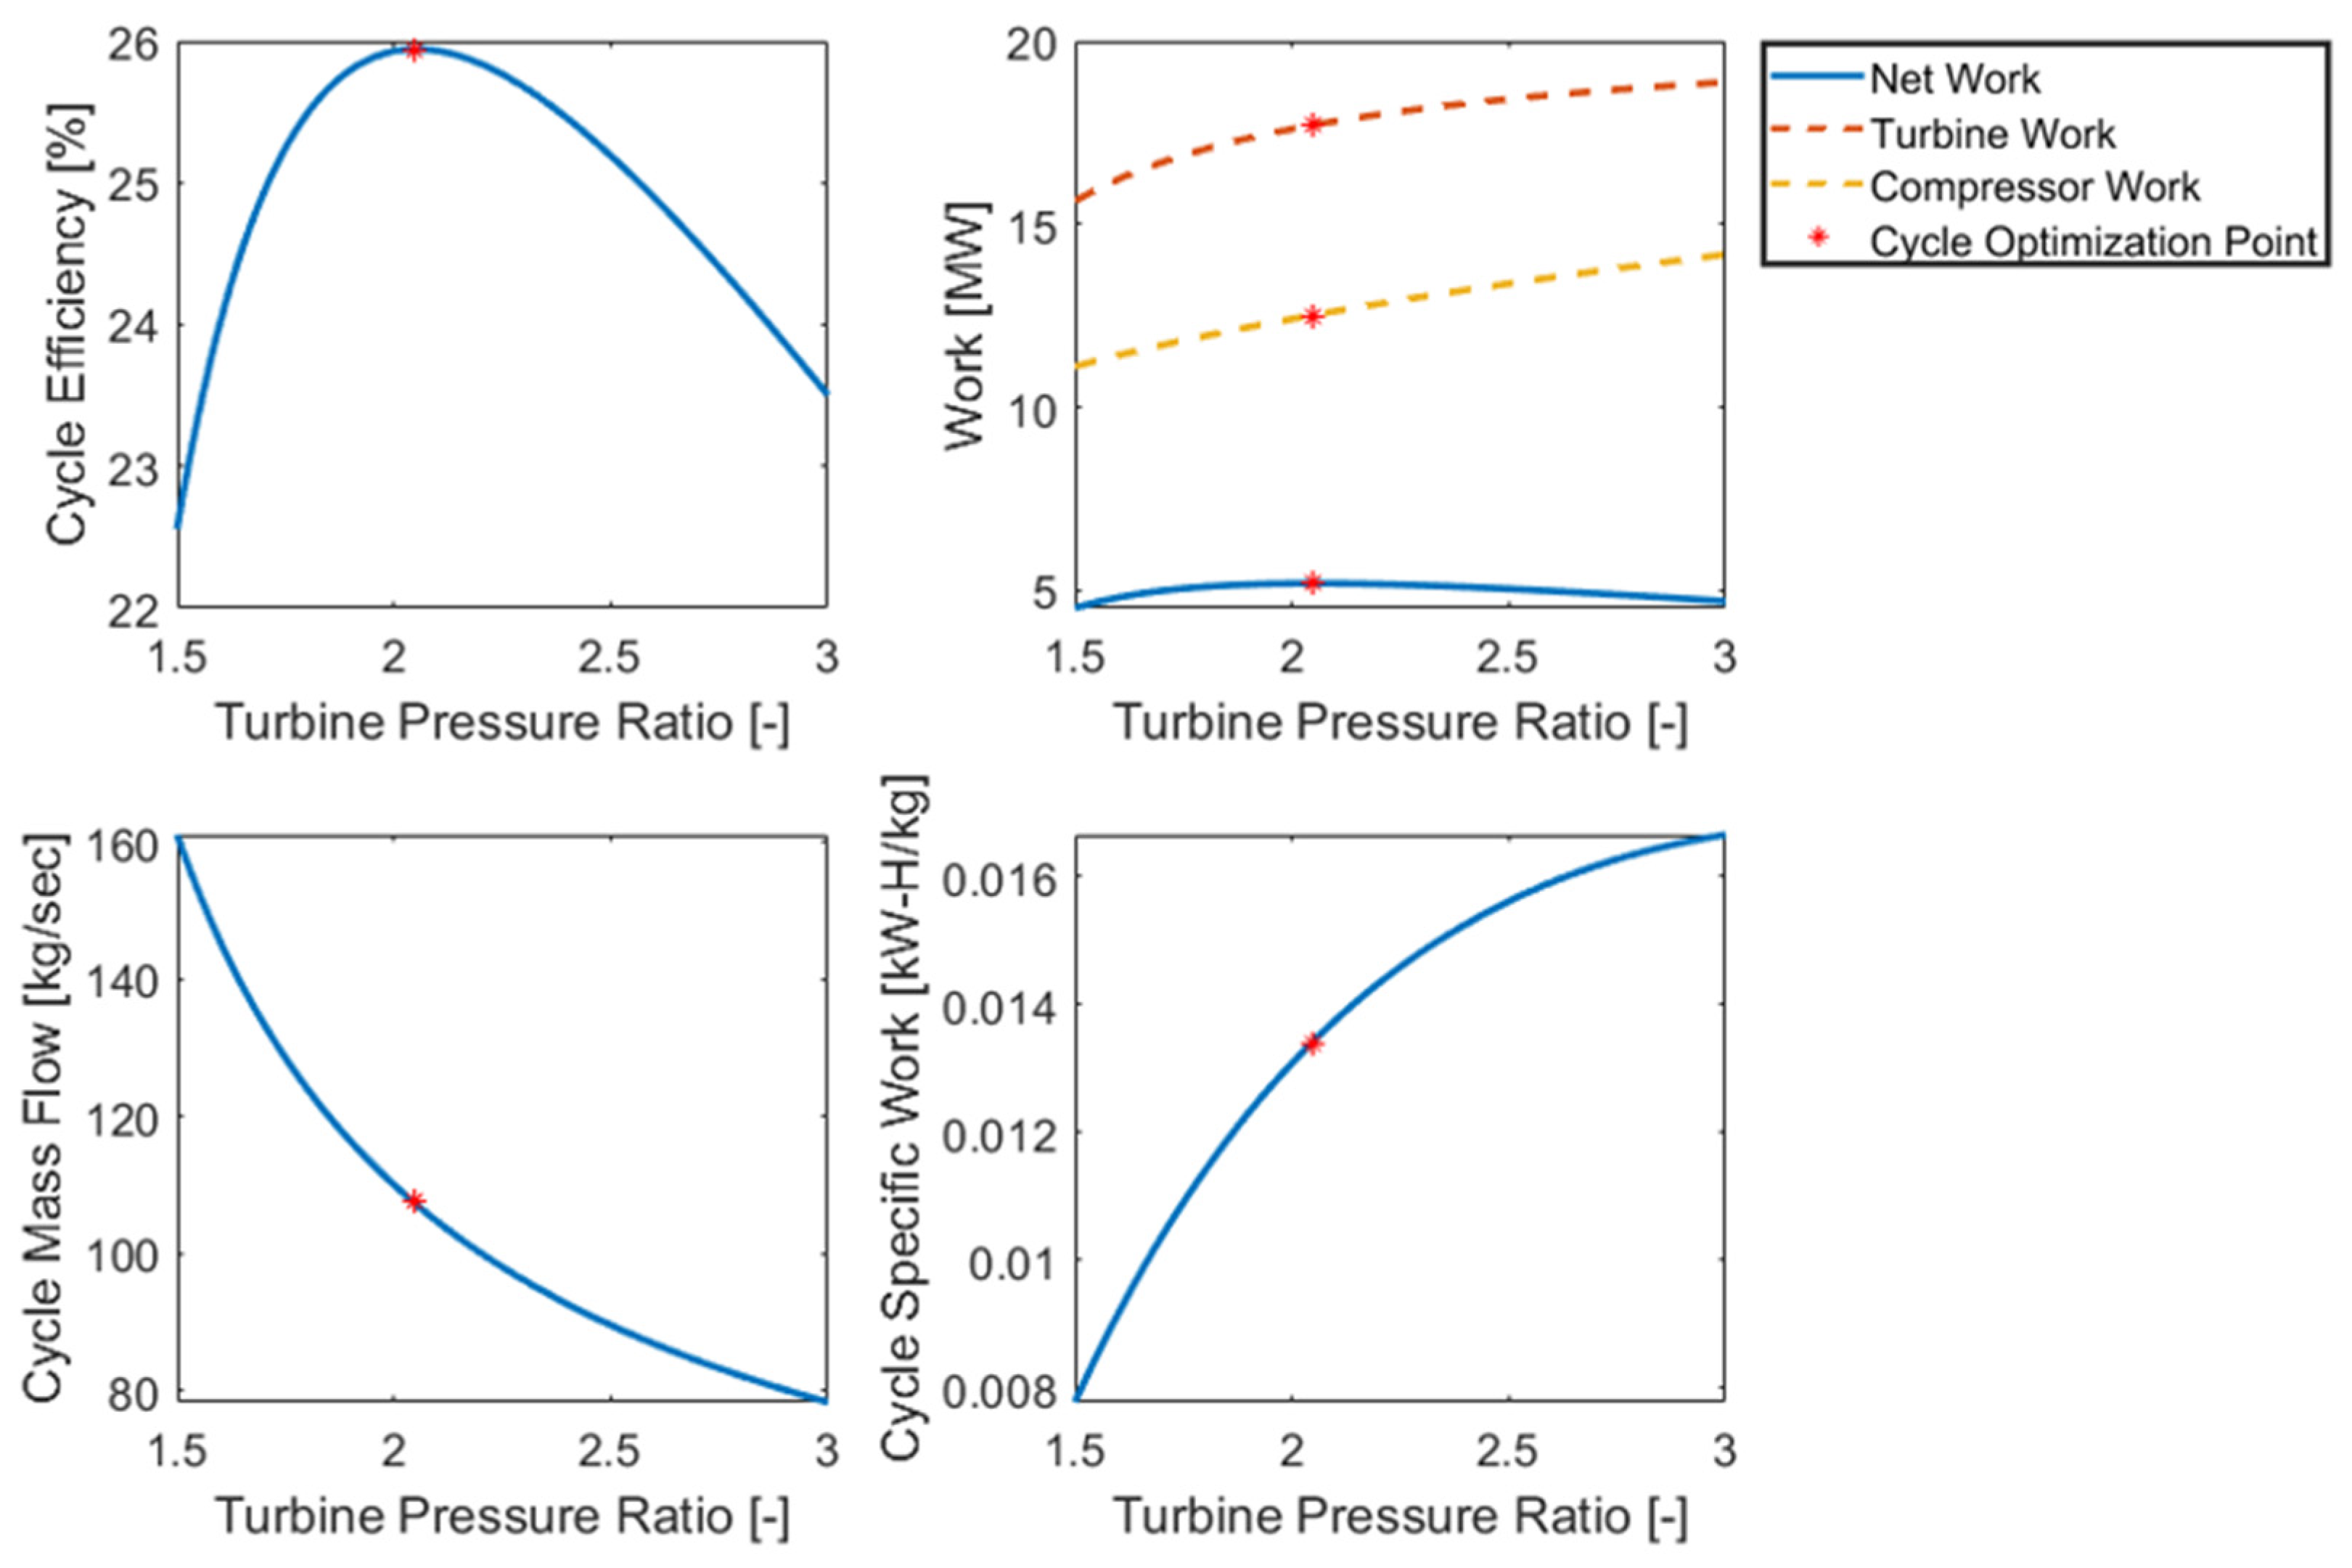
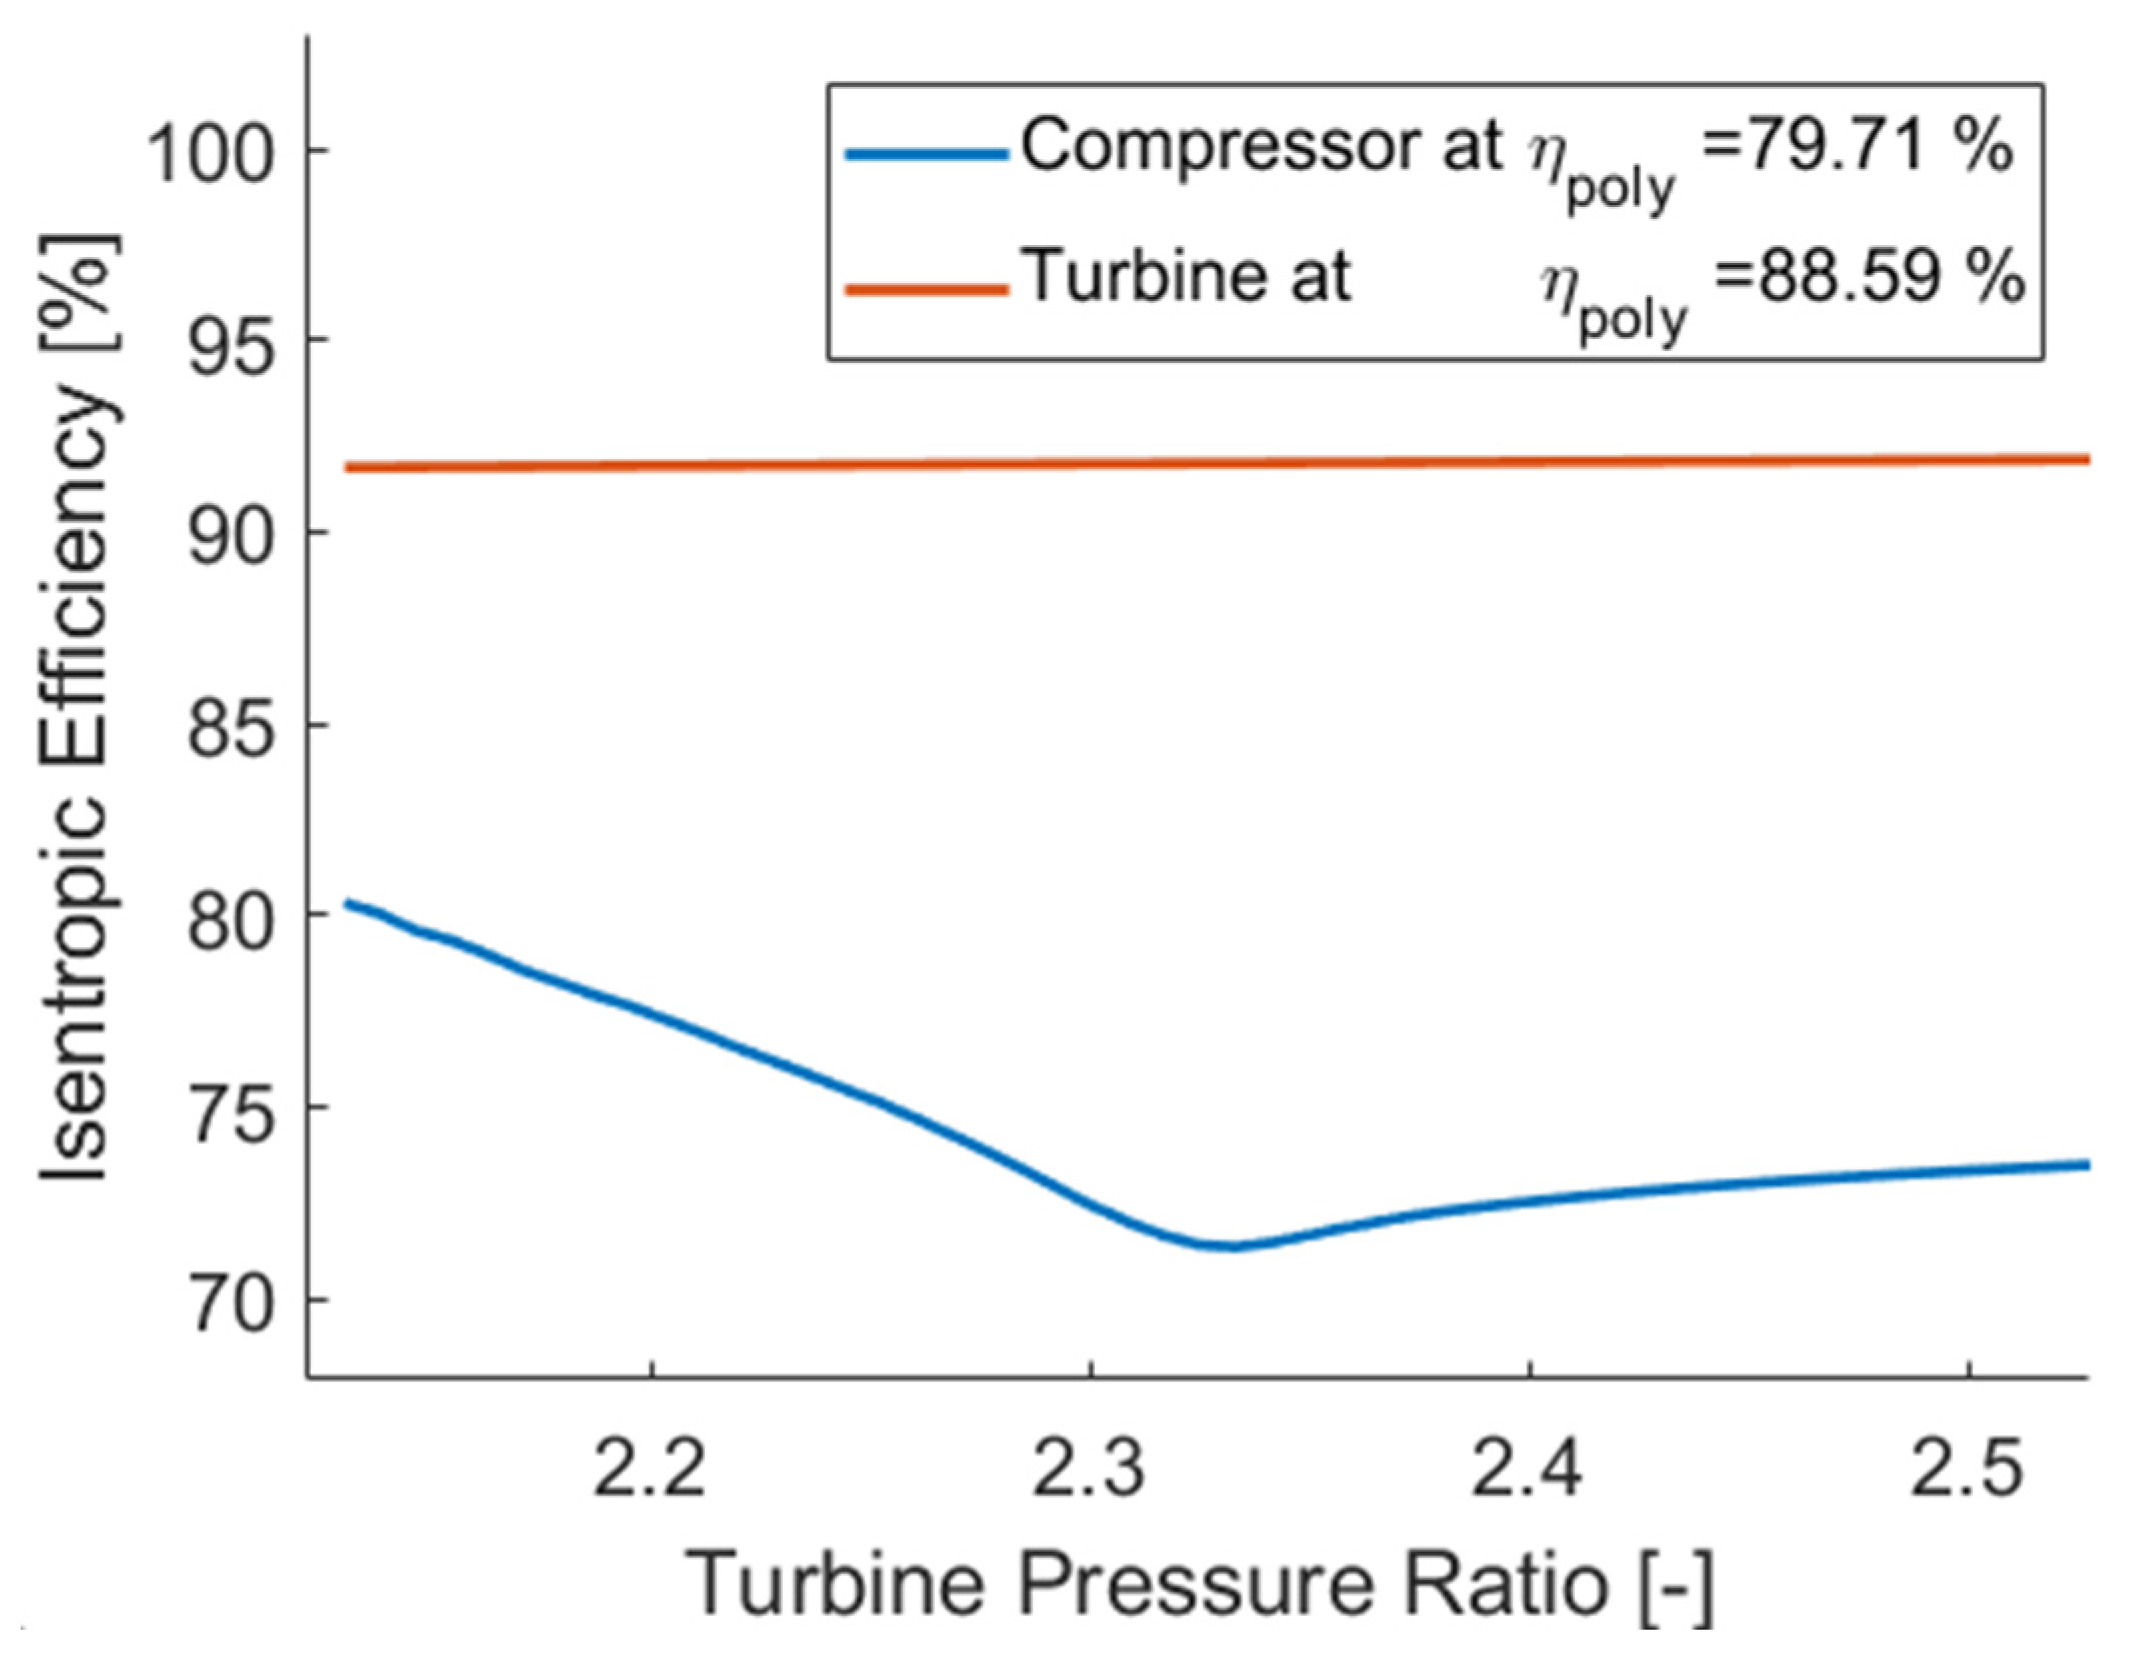
For the cycle optimization, KAIST-CCD (closed-cycle design) and KAIST-OCD (open-cycle design), which are the MATLAB based in-house codes, were used [28,29]. The thermal properties of CO2 and air were calculated using NIST-REFPROP database version 10.0 [30]. Figure 10 shows the flowchart of the KAIST-CCD and OCD codes, respectively. The design parameters given in the previous sections, including the pressure drops and turbomachinery isentropic efficiencies, were included in the code input. In the cycle optimization codes, the turbine pressure ratio range was given as a variable, and cycle output, such as cycle efficiency, turbine work, and cycle specific work, are calculated at each turbine pressure drop. The examples of the KAIST-CCD and KAIST-OCD code results are given in Figure 11 and Figure 12, respectively, in which the red points on the plots represent the cycle optimization point with the maximum cycle efficiency.
To increase the cycle efficiency, the recuperated heat between the high-pressure side of the turbine and the low-pressure side of the compressor outlet has to be maximized. For an S-CO2 cycle, it is well known that due to the significant changes in specific heat of S-CO2 in a recuperator, an inner pinch problem can occur. If the inner pinch problem is not considered when designing a recuperated cycle, a non-physical cycle design can be obtained by assuming physically non-realizable recuperator effectiveness. In KAIST-CCD code, an algorithm using an artificial neural network is already built in to avoid the inner pinch problem while optimizing the cycle [31].
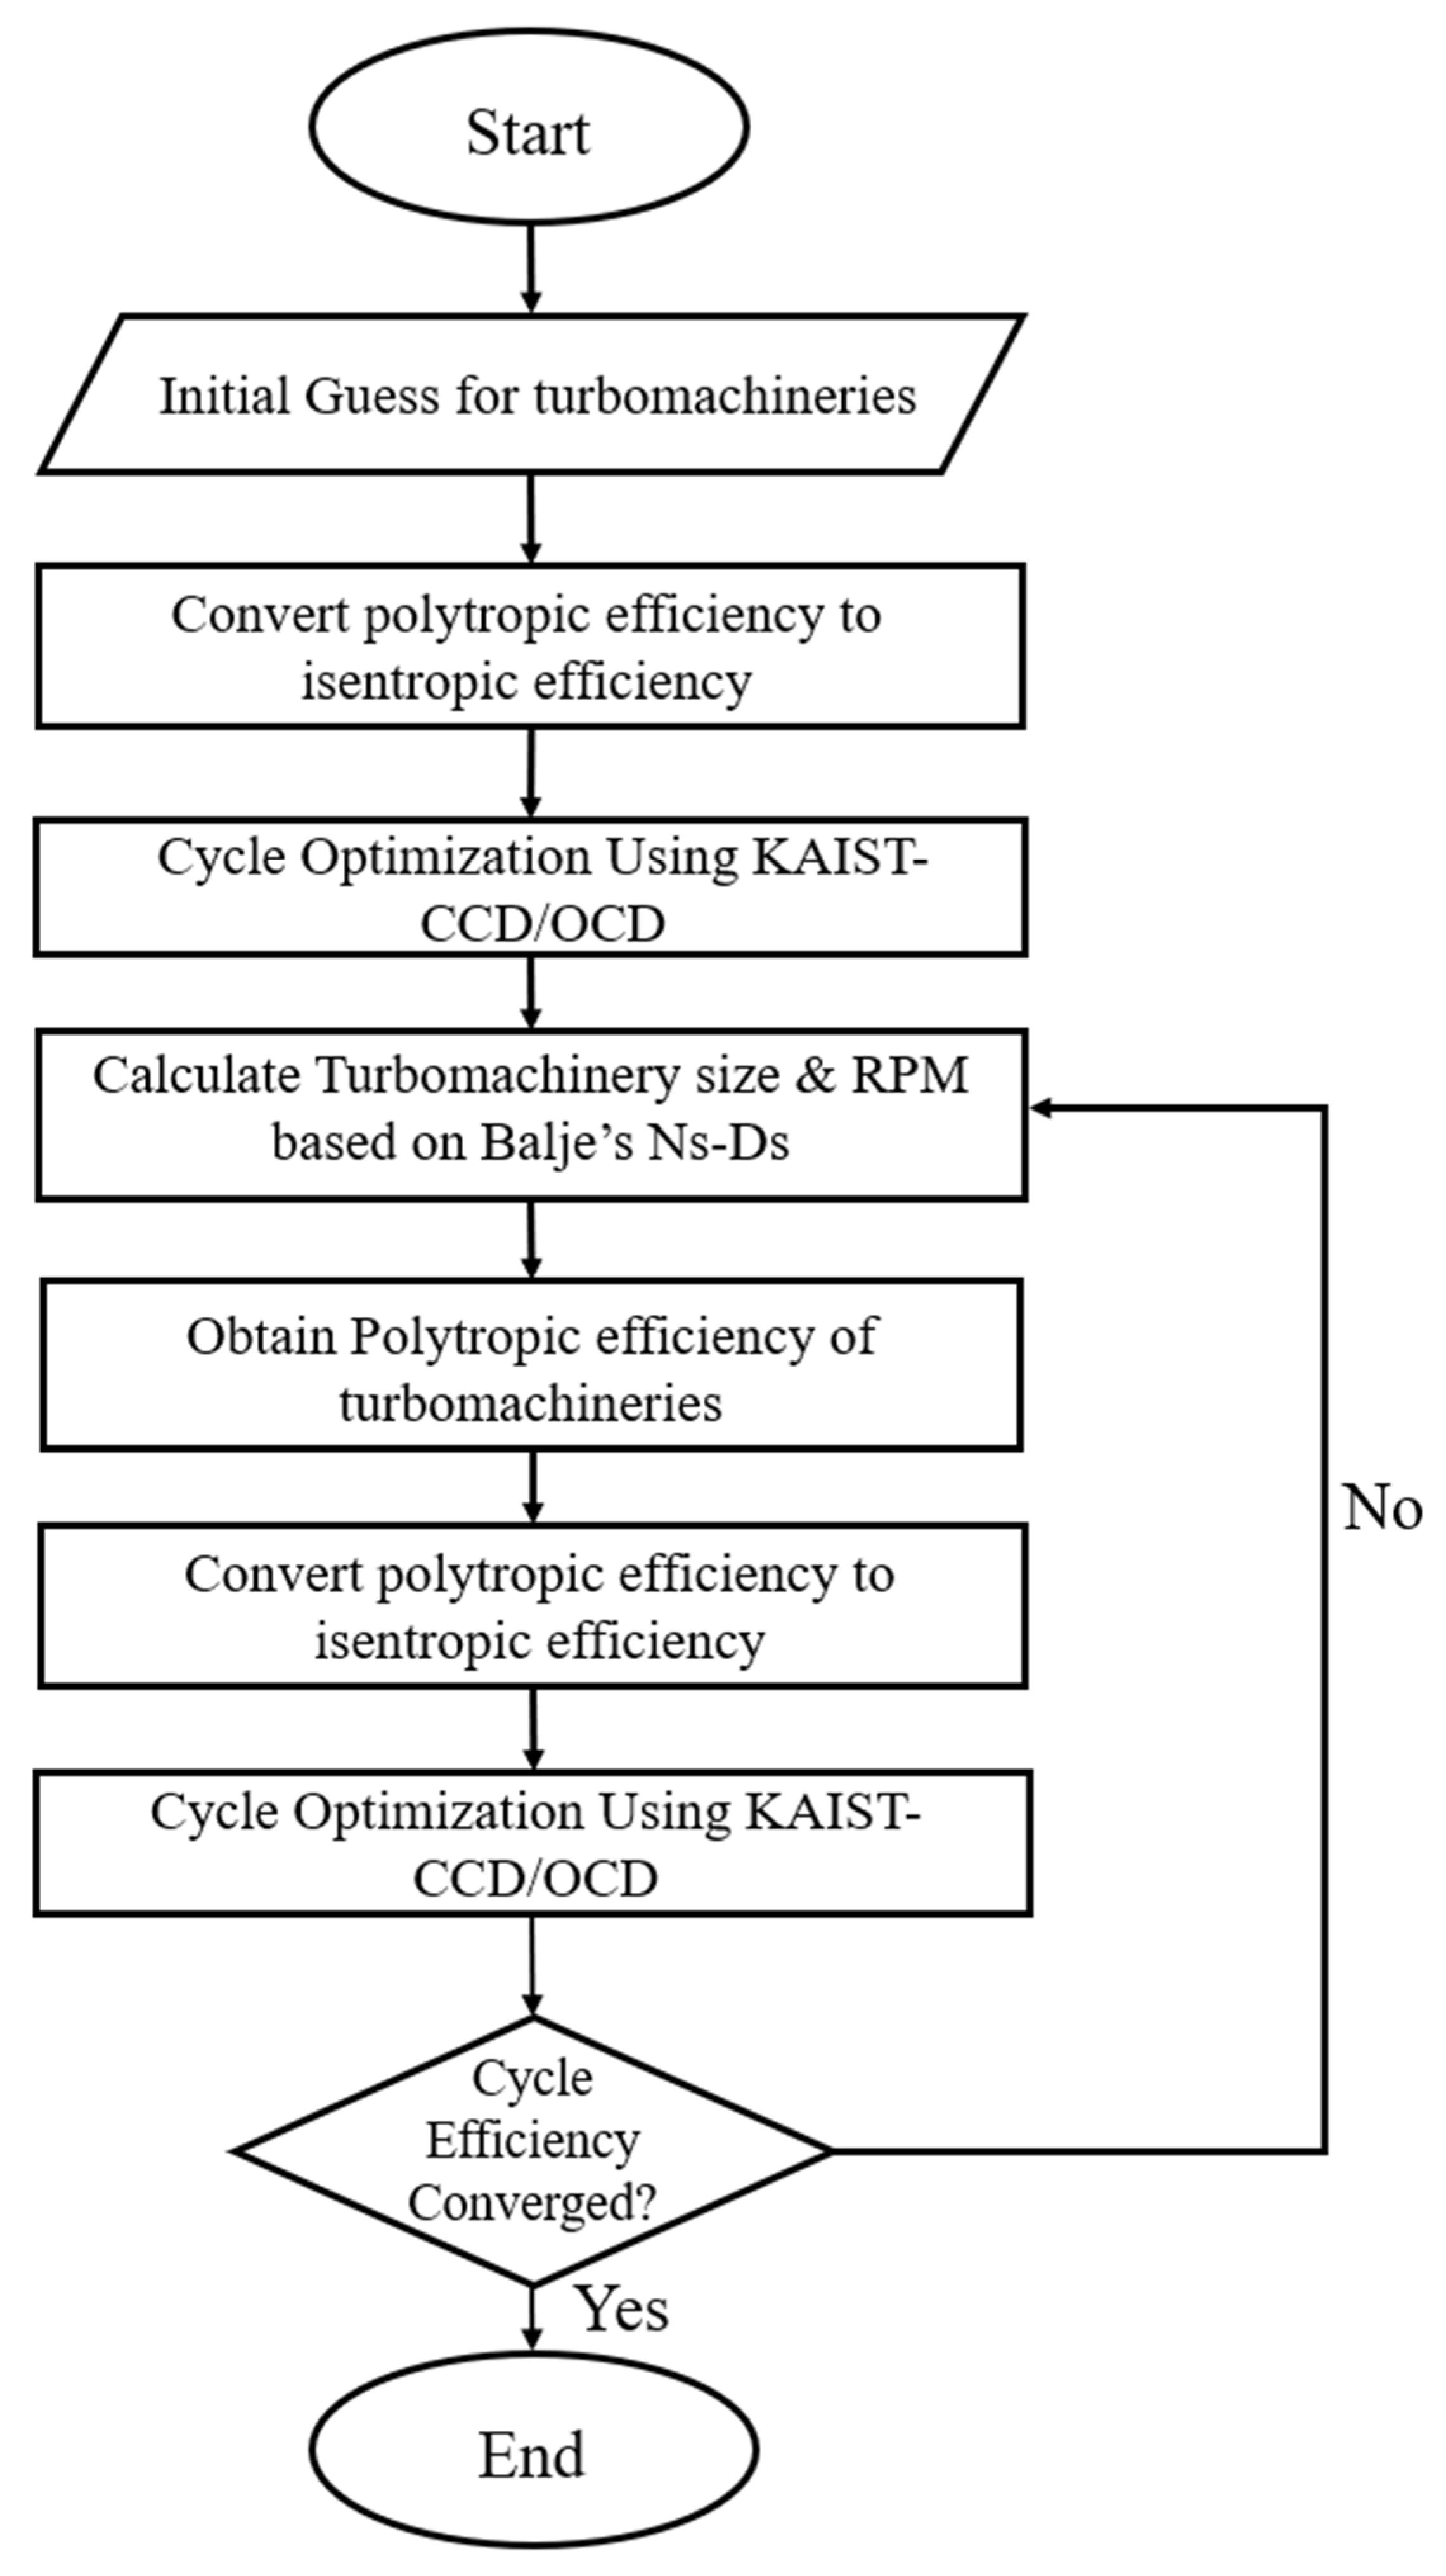
In this study, the modified version of KAIST-CCD and KAIST-OCD were used to optimize the gas Brayton cycles at different power outputs. The main difference between the original code and the modified code is that the isentropic efficiency was used for the turbomachinery, where the polytropic efficiency was converted to the isentropic efficiency in the modified code. In other words, the turbomachinery isentropic efficiencies were fixed for the original codes, whereas the isentropic efficiencies were varied as the turbine pressure ratio changed in the modified versions, because the inlet conditions of the turbomachinery have to be reflected while the polytropic efficiency is converted to the isentropic efficiency using Equations (7)–(10). Thus, at different turbine pressure ratios, the inlet condition of the compressor varies, resulting in a change in the isentropic efficiency. Figure 13 shows the flowchart for the modified optimization code used in this paper.
With the initial guess for the turbomachinery polytropic efficiencies and design parameters selected in Table 1 and Table 2, the modified KAIST-CCD and OCD were used to calculate the cycle parameters. Based on the calculated cycle parameters, the turbomachinery rotor sizes and rotational speed were calculated using Balje’s n s d s (specific speedspecific diameter) diagram [31]. Equations (11) and (12) show the definition for the specific speed and specific diameter, respectively.
n s = ω V g H a d 3 4
d s = D g H a d 1 4 V
where ω is the rotational speed, D is rotor diameter, V is the volumetric flow rate, g is the gravitational acceleration, and Had is the adiabatic head.
Using the n s d s diagram, the isentropic efficiency of the turbomachinery can be calculated [32]. Conversely, with the isentropic efficiency calculated in the optimization code, the rotor diameter and the rotational speed were calculated using the diagrams and Equations (11) and (12). With the calculated rotor diameter, pressure ratio, and mass flow rate of the cycle, Equations (4)–(6) were used to calculate the polytropic efficiencies again. Then, the turbomachinery polytropic efficiencies were converted to the isentropic efficiencies to be used in the code. These processes were repeated until the cycle thermal efficiency converged with the convergence criteria of 10 4 . The optimization parameter could be either the cycle efficiency or the cycle specific work. Therefore, the maximum efficiency optimization and the maximum cycle specific work optimization were compared. Furthermore, the new cycle optimization mode, at which the product of the cycle efficiency and the specific work are maximized, was also evaluated. The new cycle optimization mode will be called the mixed mode.

5. Results and Discussion

5.1. Open-Air Brayton Cycle

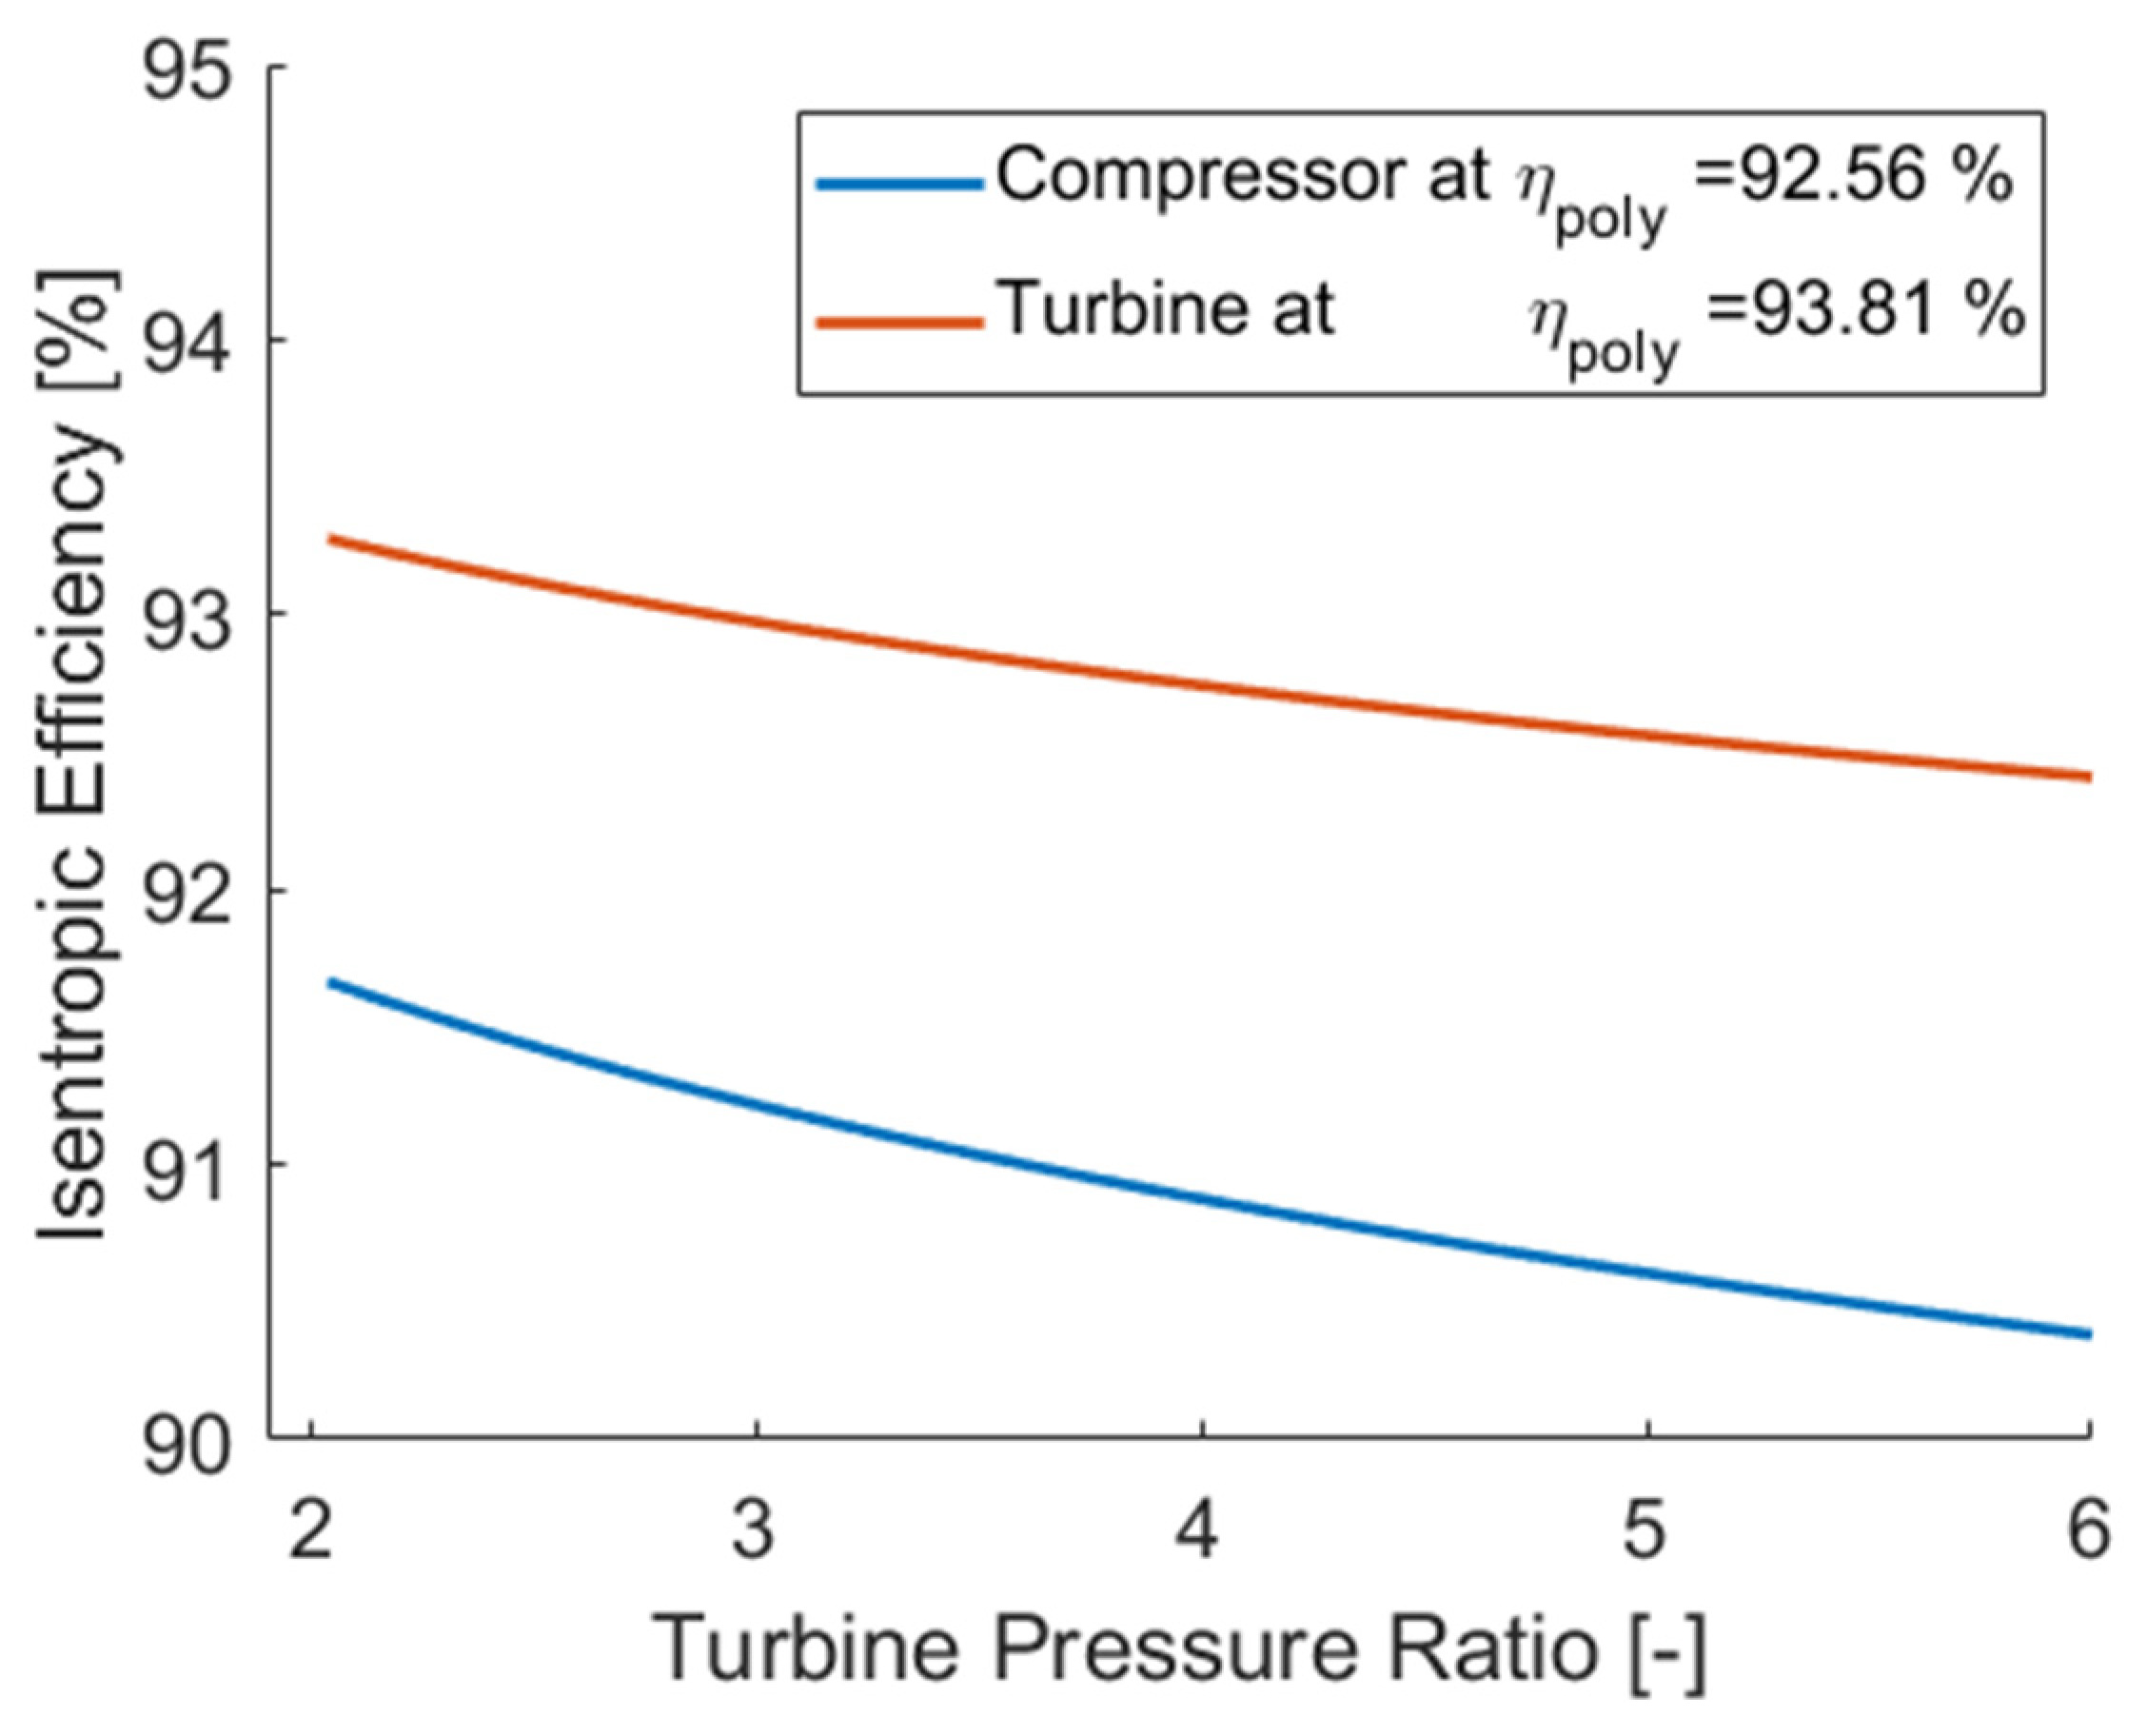
This section shows the result of the open-air simple recuperated Brayton cycle optimization results with three different optimization modes: maximum efficiency, maximum cycle specific work, and maximum mix mode. At each different power output, the modified KAIST-OCD code optimizes the cycle based on the selected optimization mode. An example of the modified KAIST-OCD cycle optimization code results at a specific power output is given in Figure 14, Figure 15 and Figure 16. Based on Equations (7) and (8), the polytropic efficiencies of the compressor and the turbine were converted to the isentropic efficiencies as shown in Figure 14.
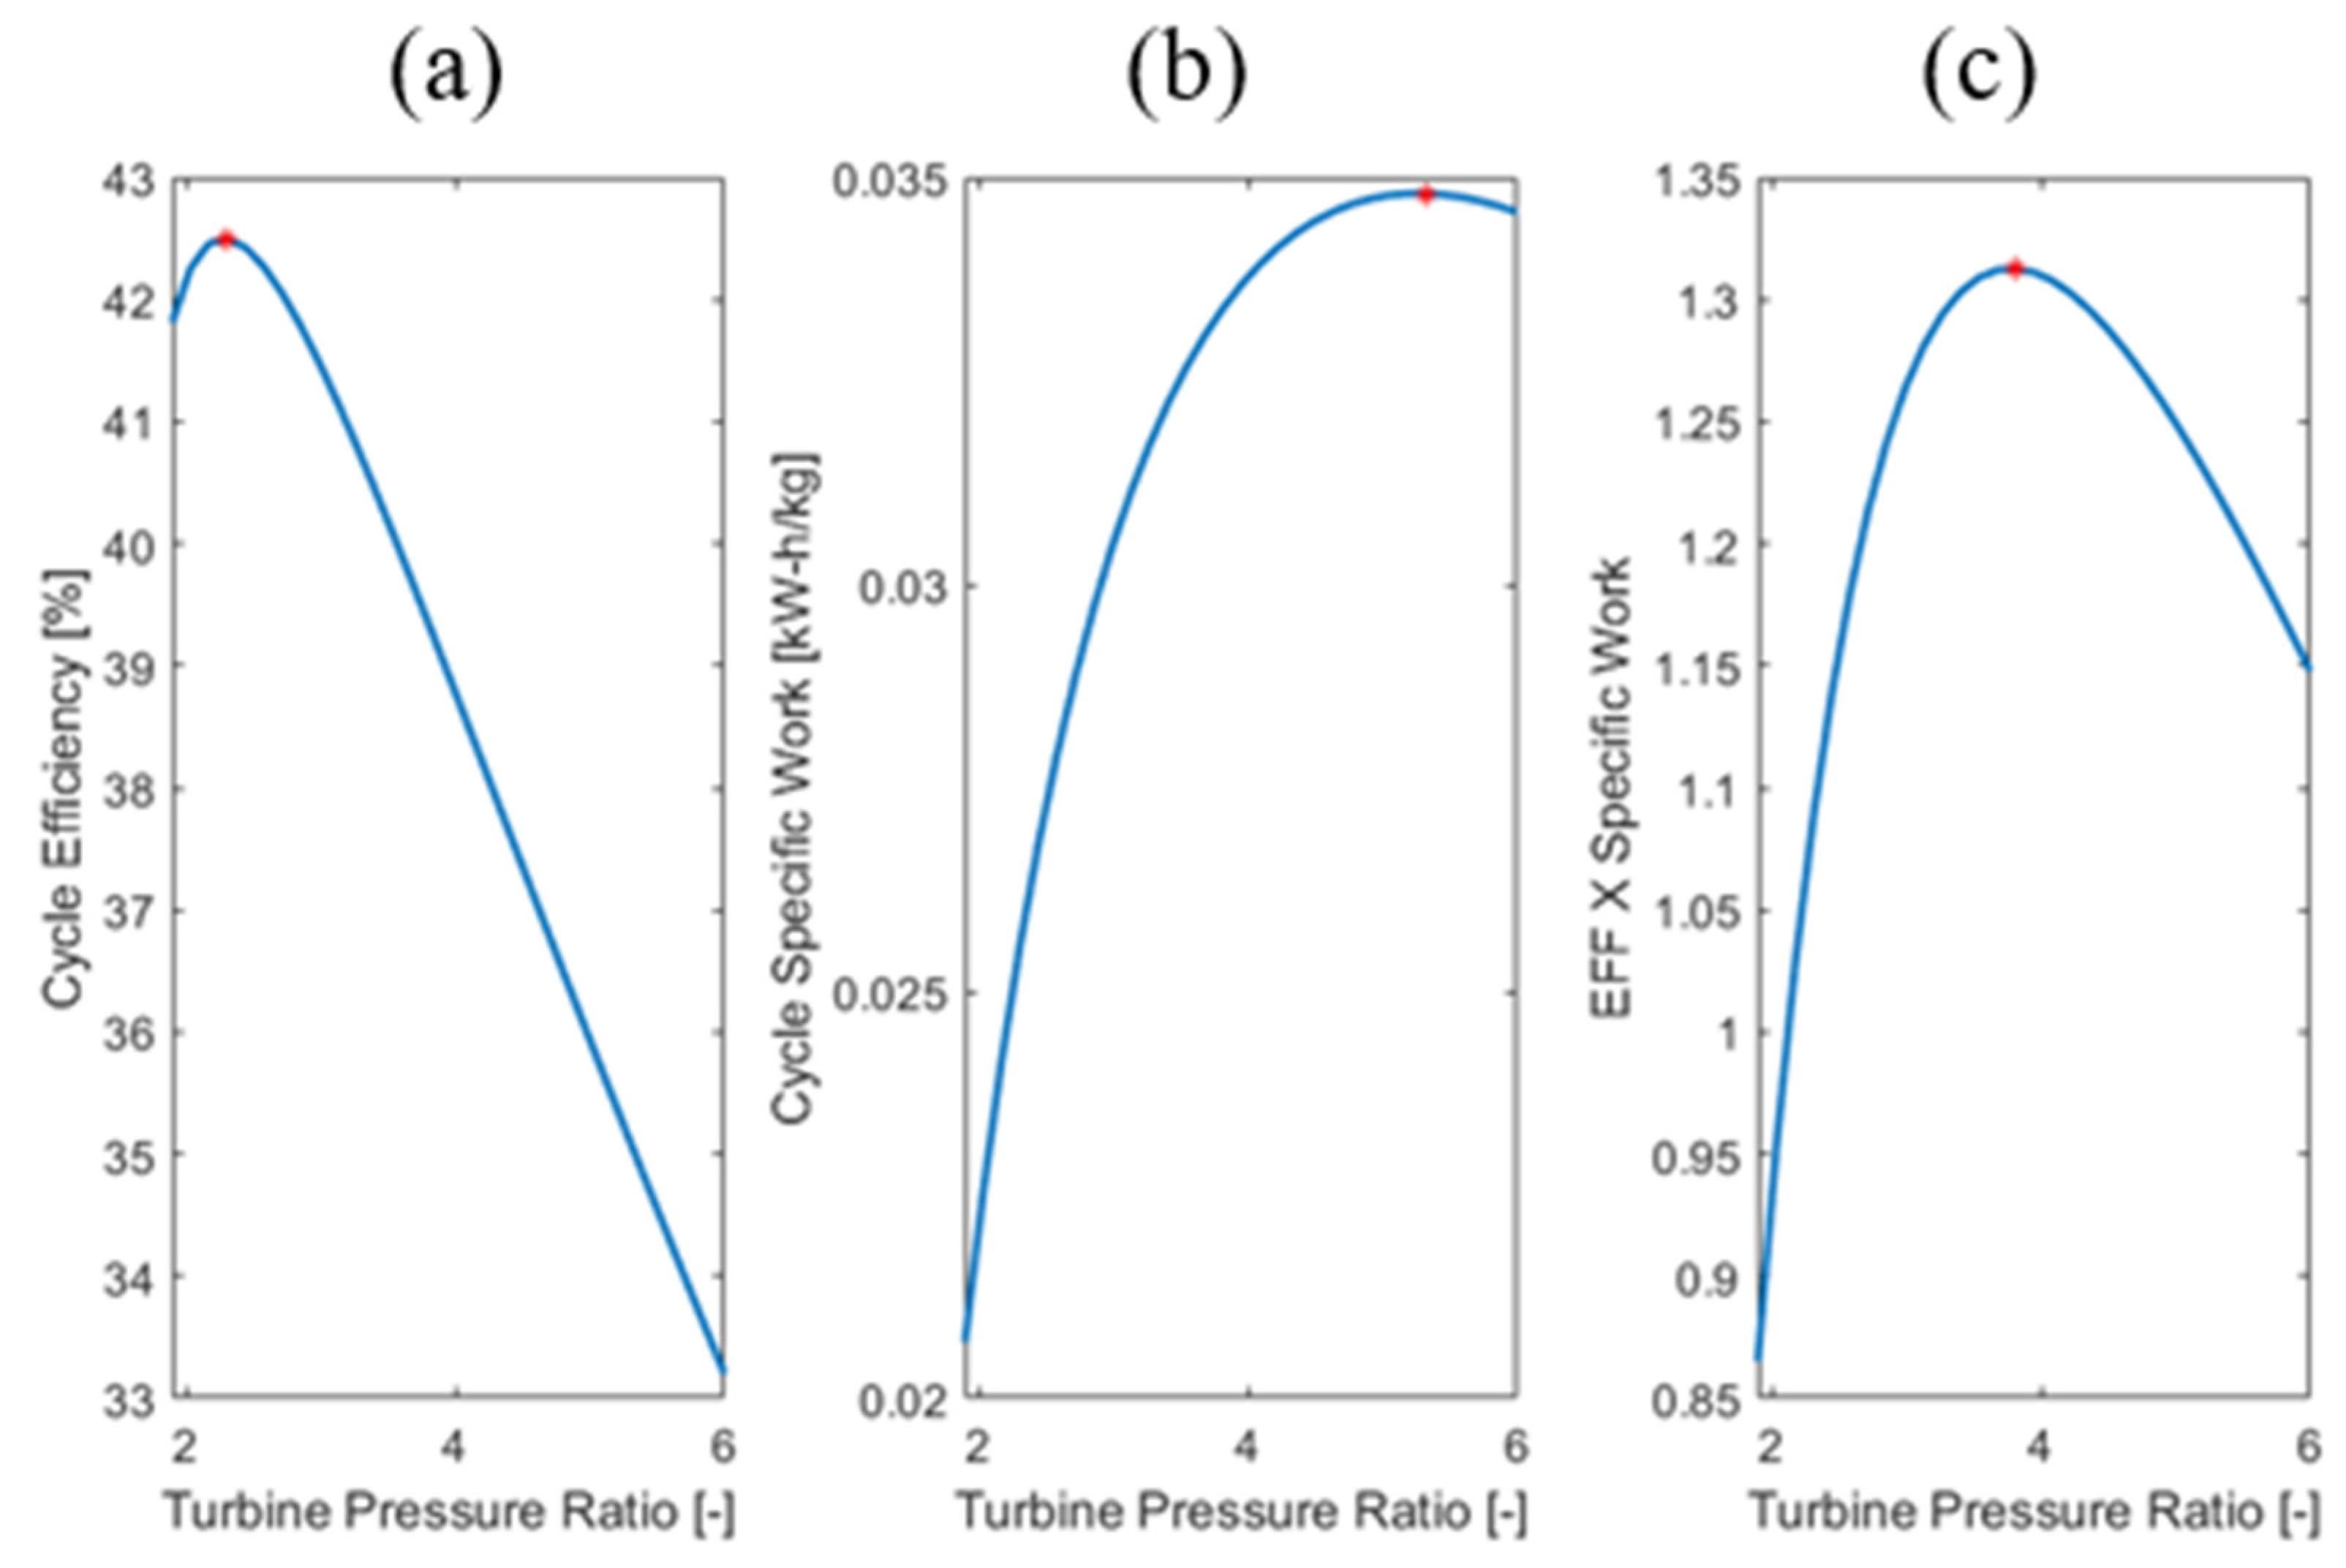
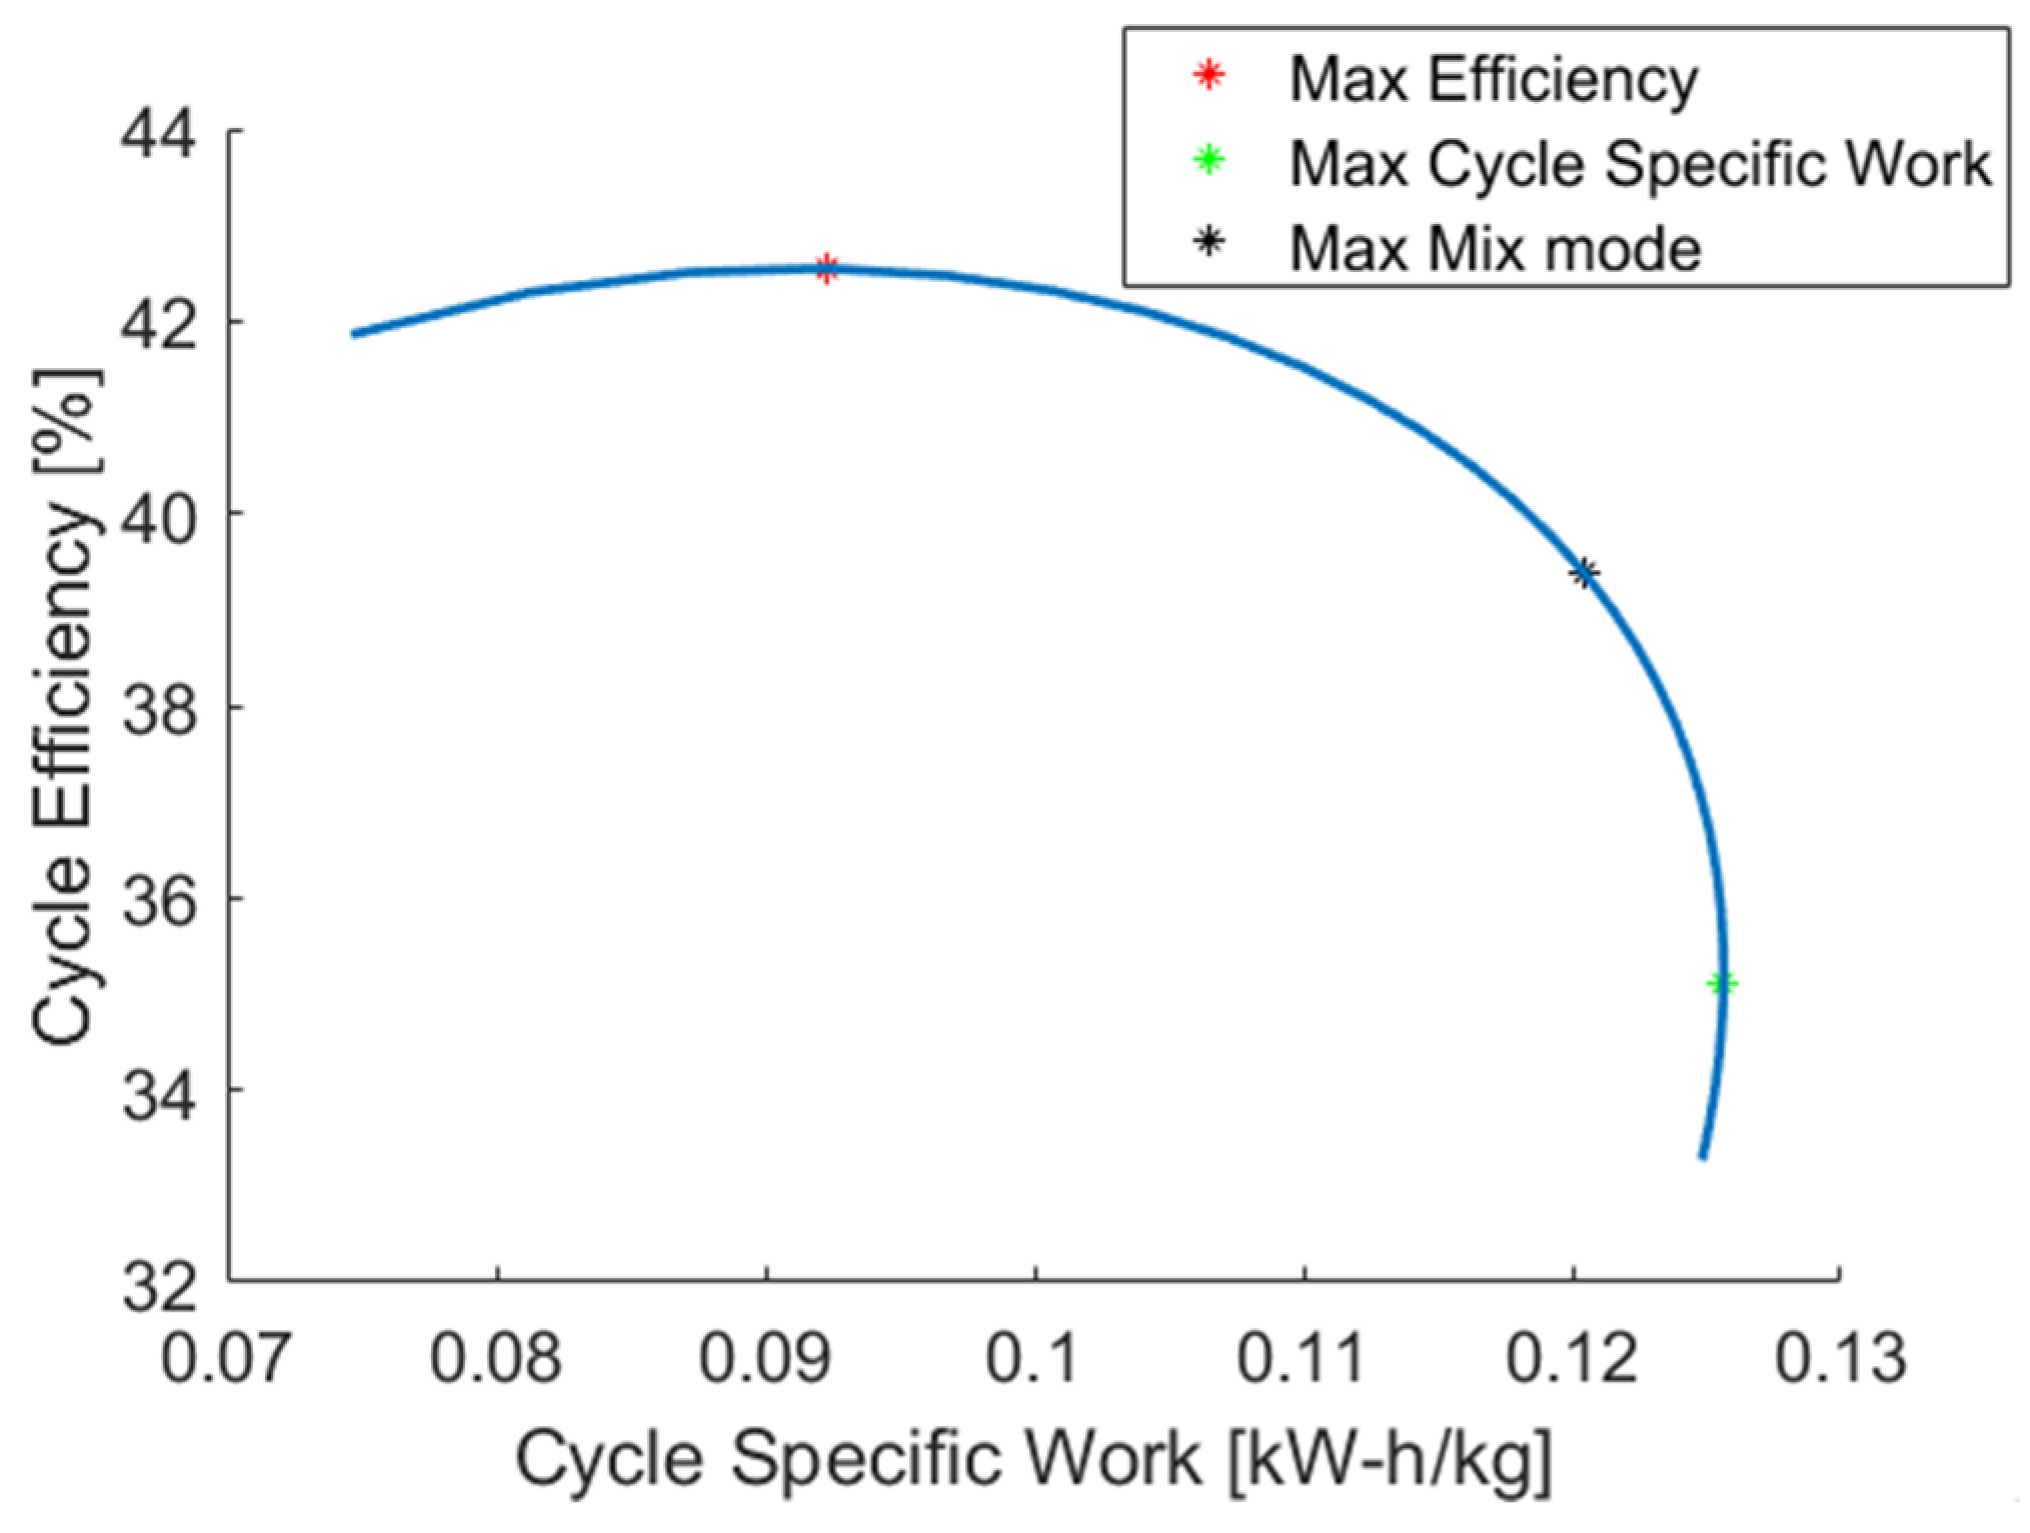
Using these turbomachinery isentropic efficiencies at each turbine pressure ratio, the cycle efficiency, cycle specific work, and the mix mode were calculated as shown in Figure 15, where the red points on the plots represent the maximum point of corresponding parameters. Figure 16 shows the cycle efficiency plotted over the cycle specific work, where the red, black, and green points represent the point at which the cycle efficiency, cycle specific work, and the mix mode were maximized, respectively. If the cycle is optimized with the maximum cycle efficiency, the cycle specific work is relatively lower than the cycle optimized with the maximum cycle specific work. Thus, the cycle maximized with the maximum mix mode contemplates both efficiency and specific work, causing the optimized point to have relatively high cycle efficiency and cycle specific work together.
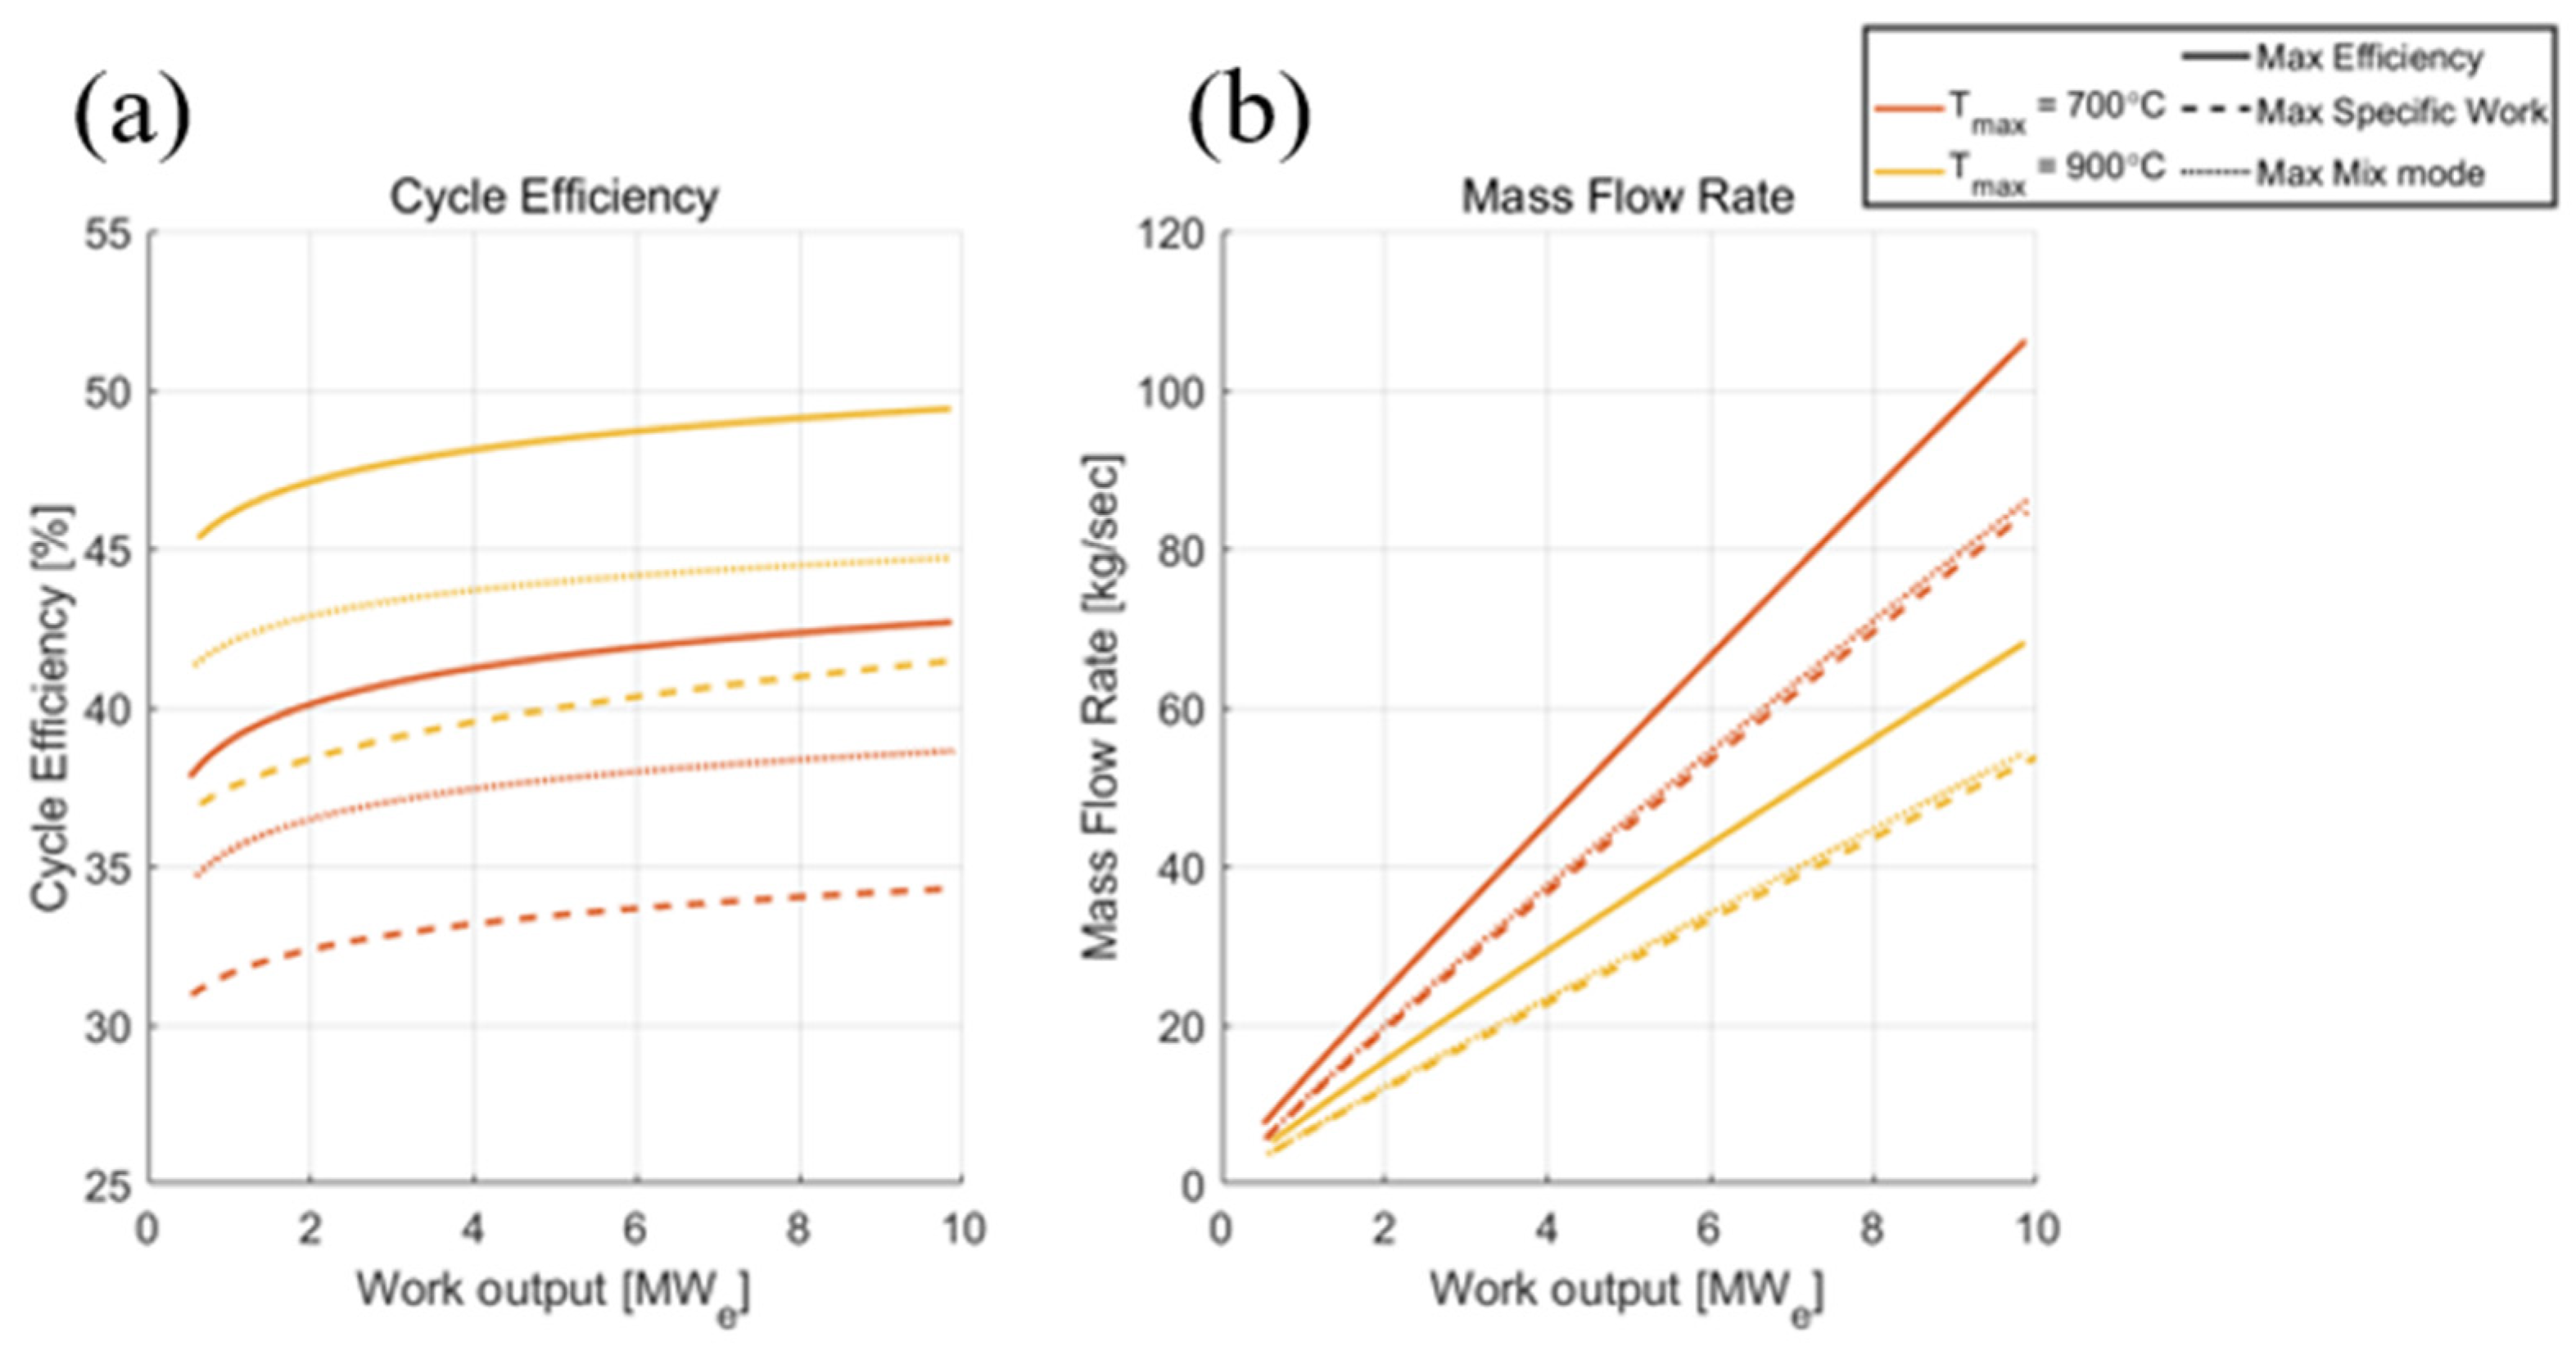
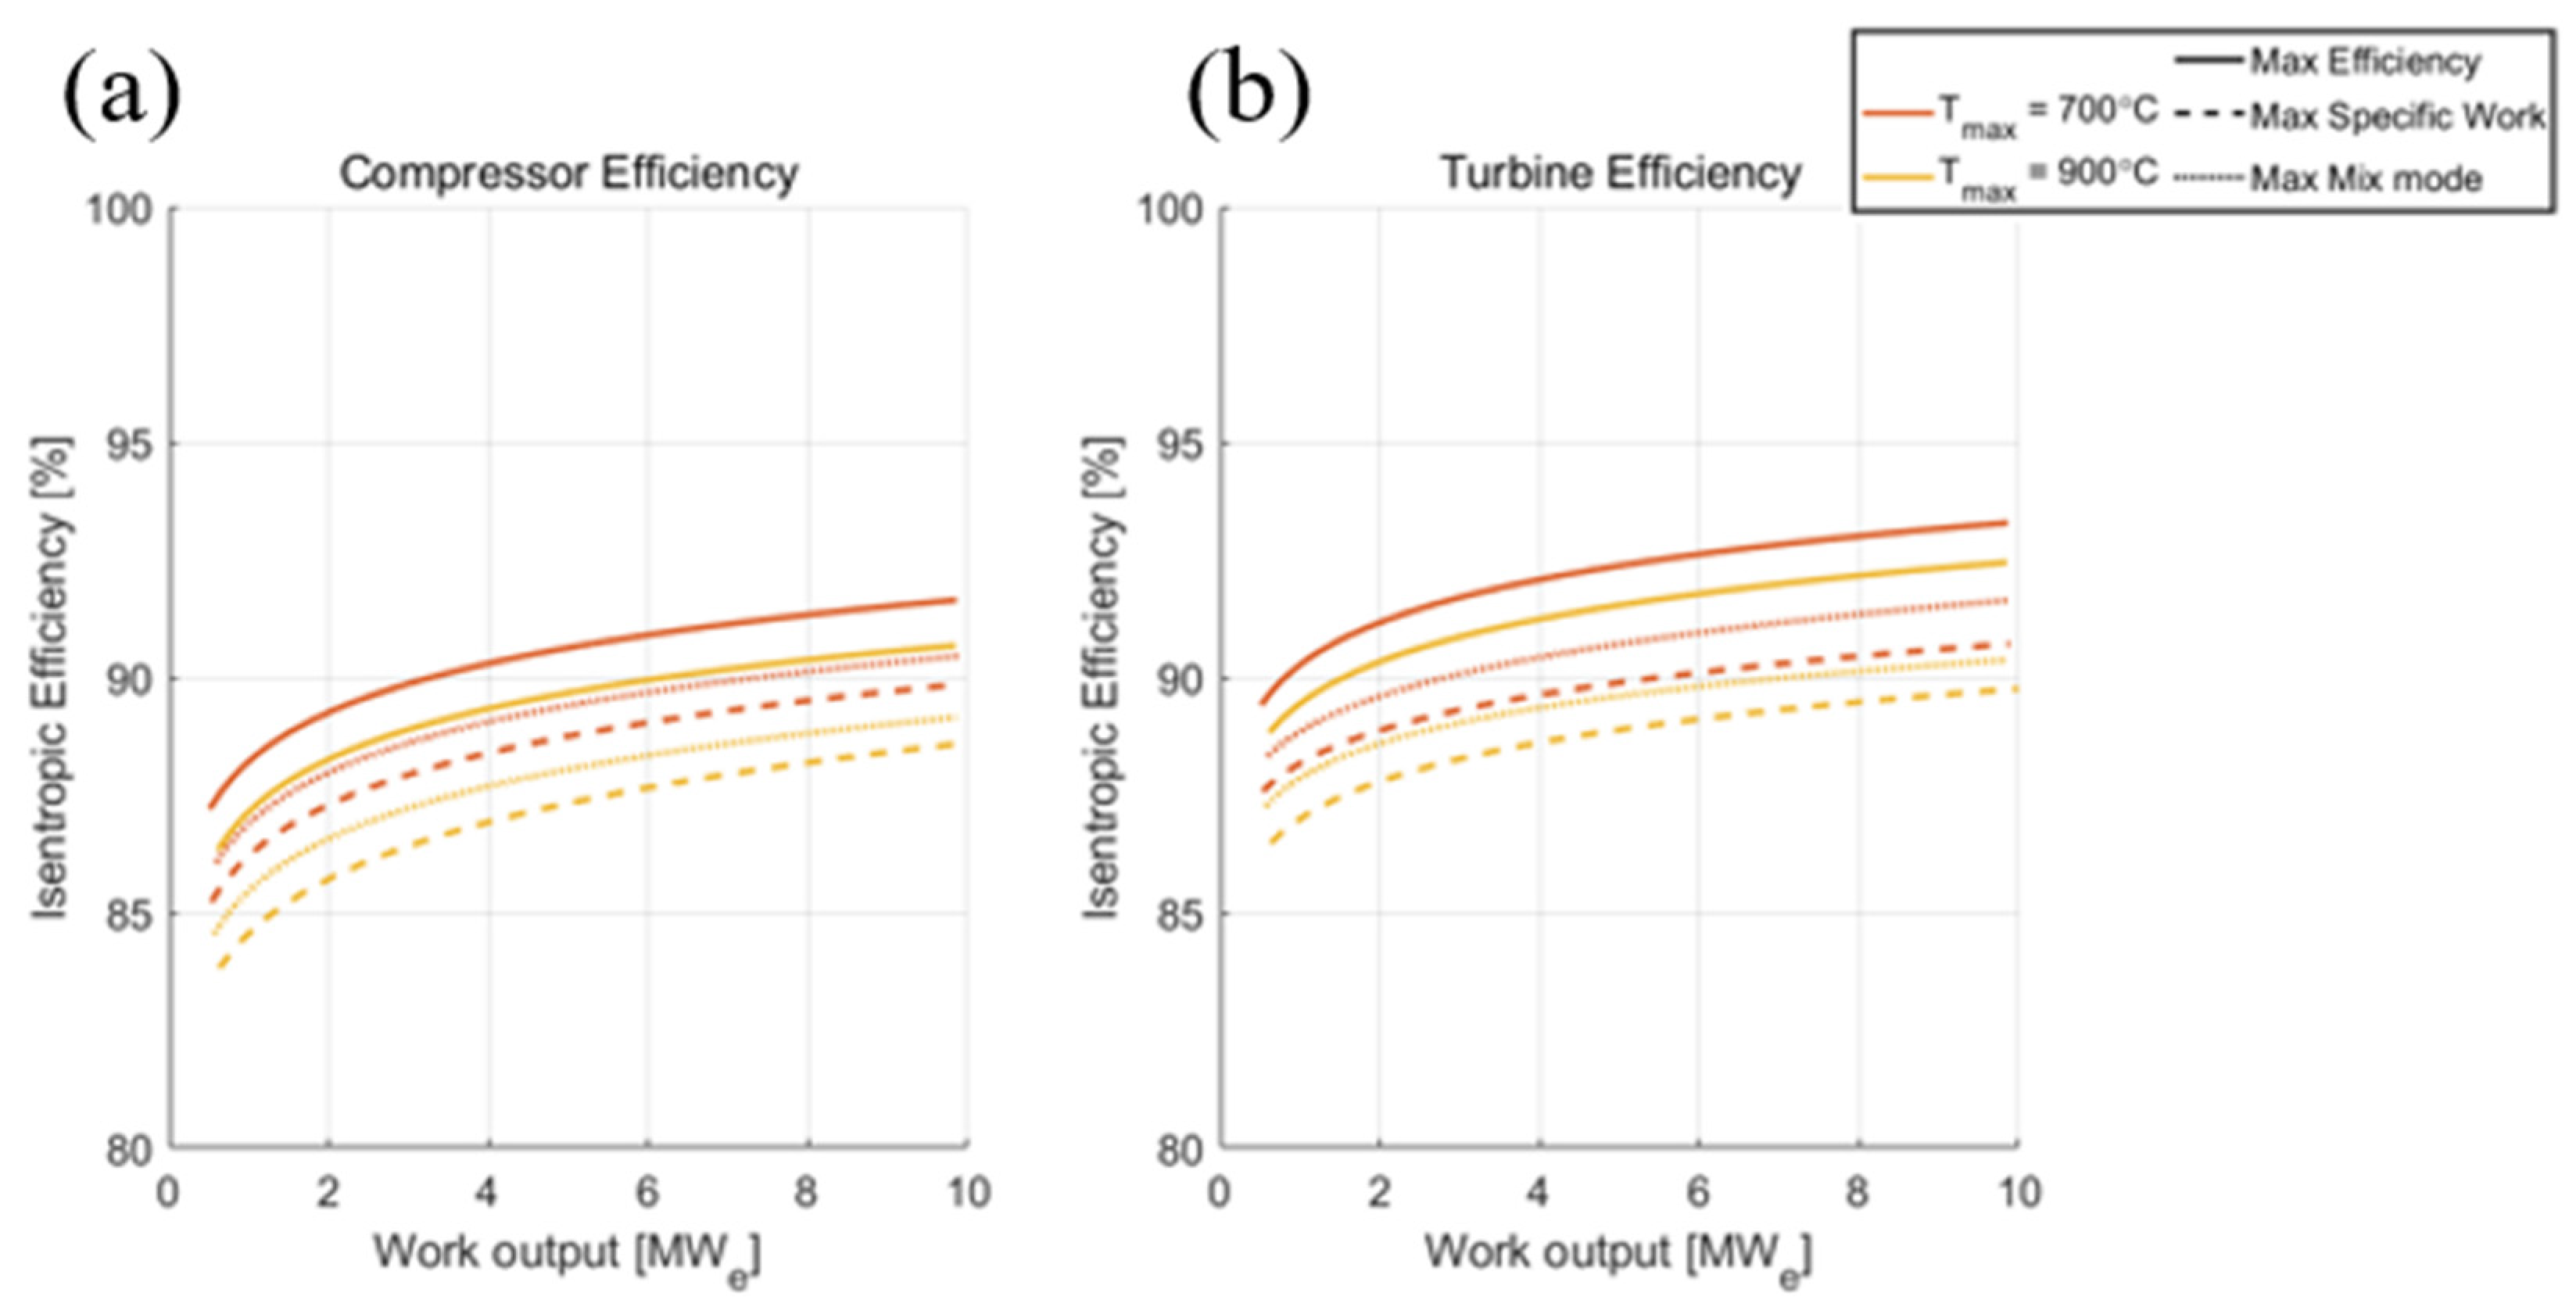
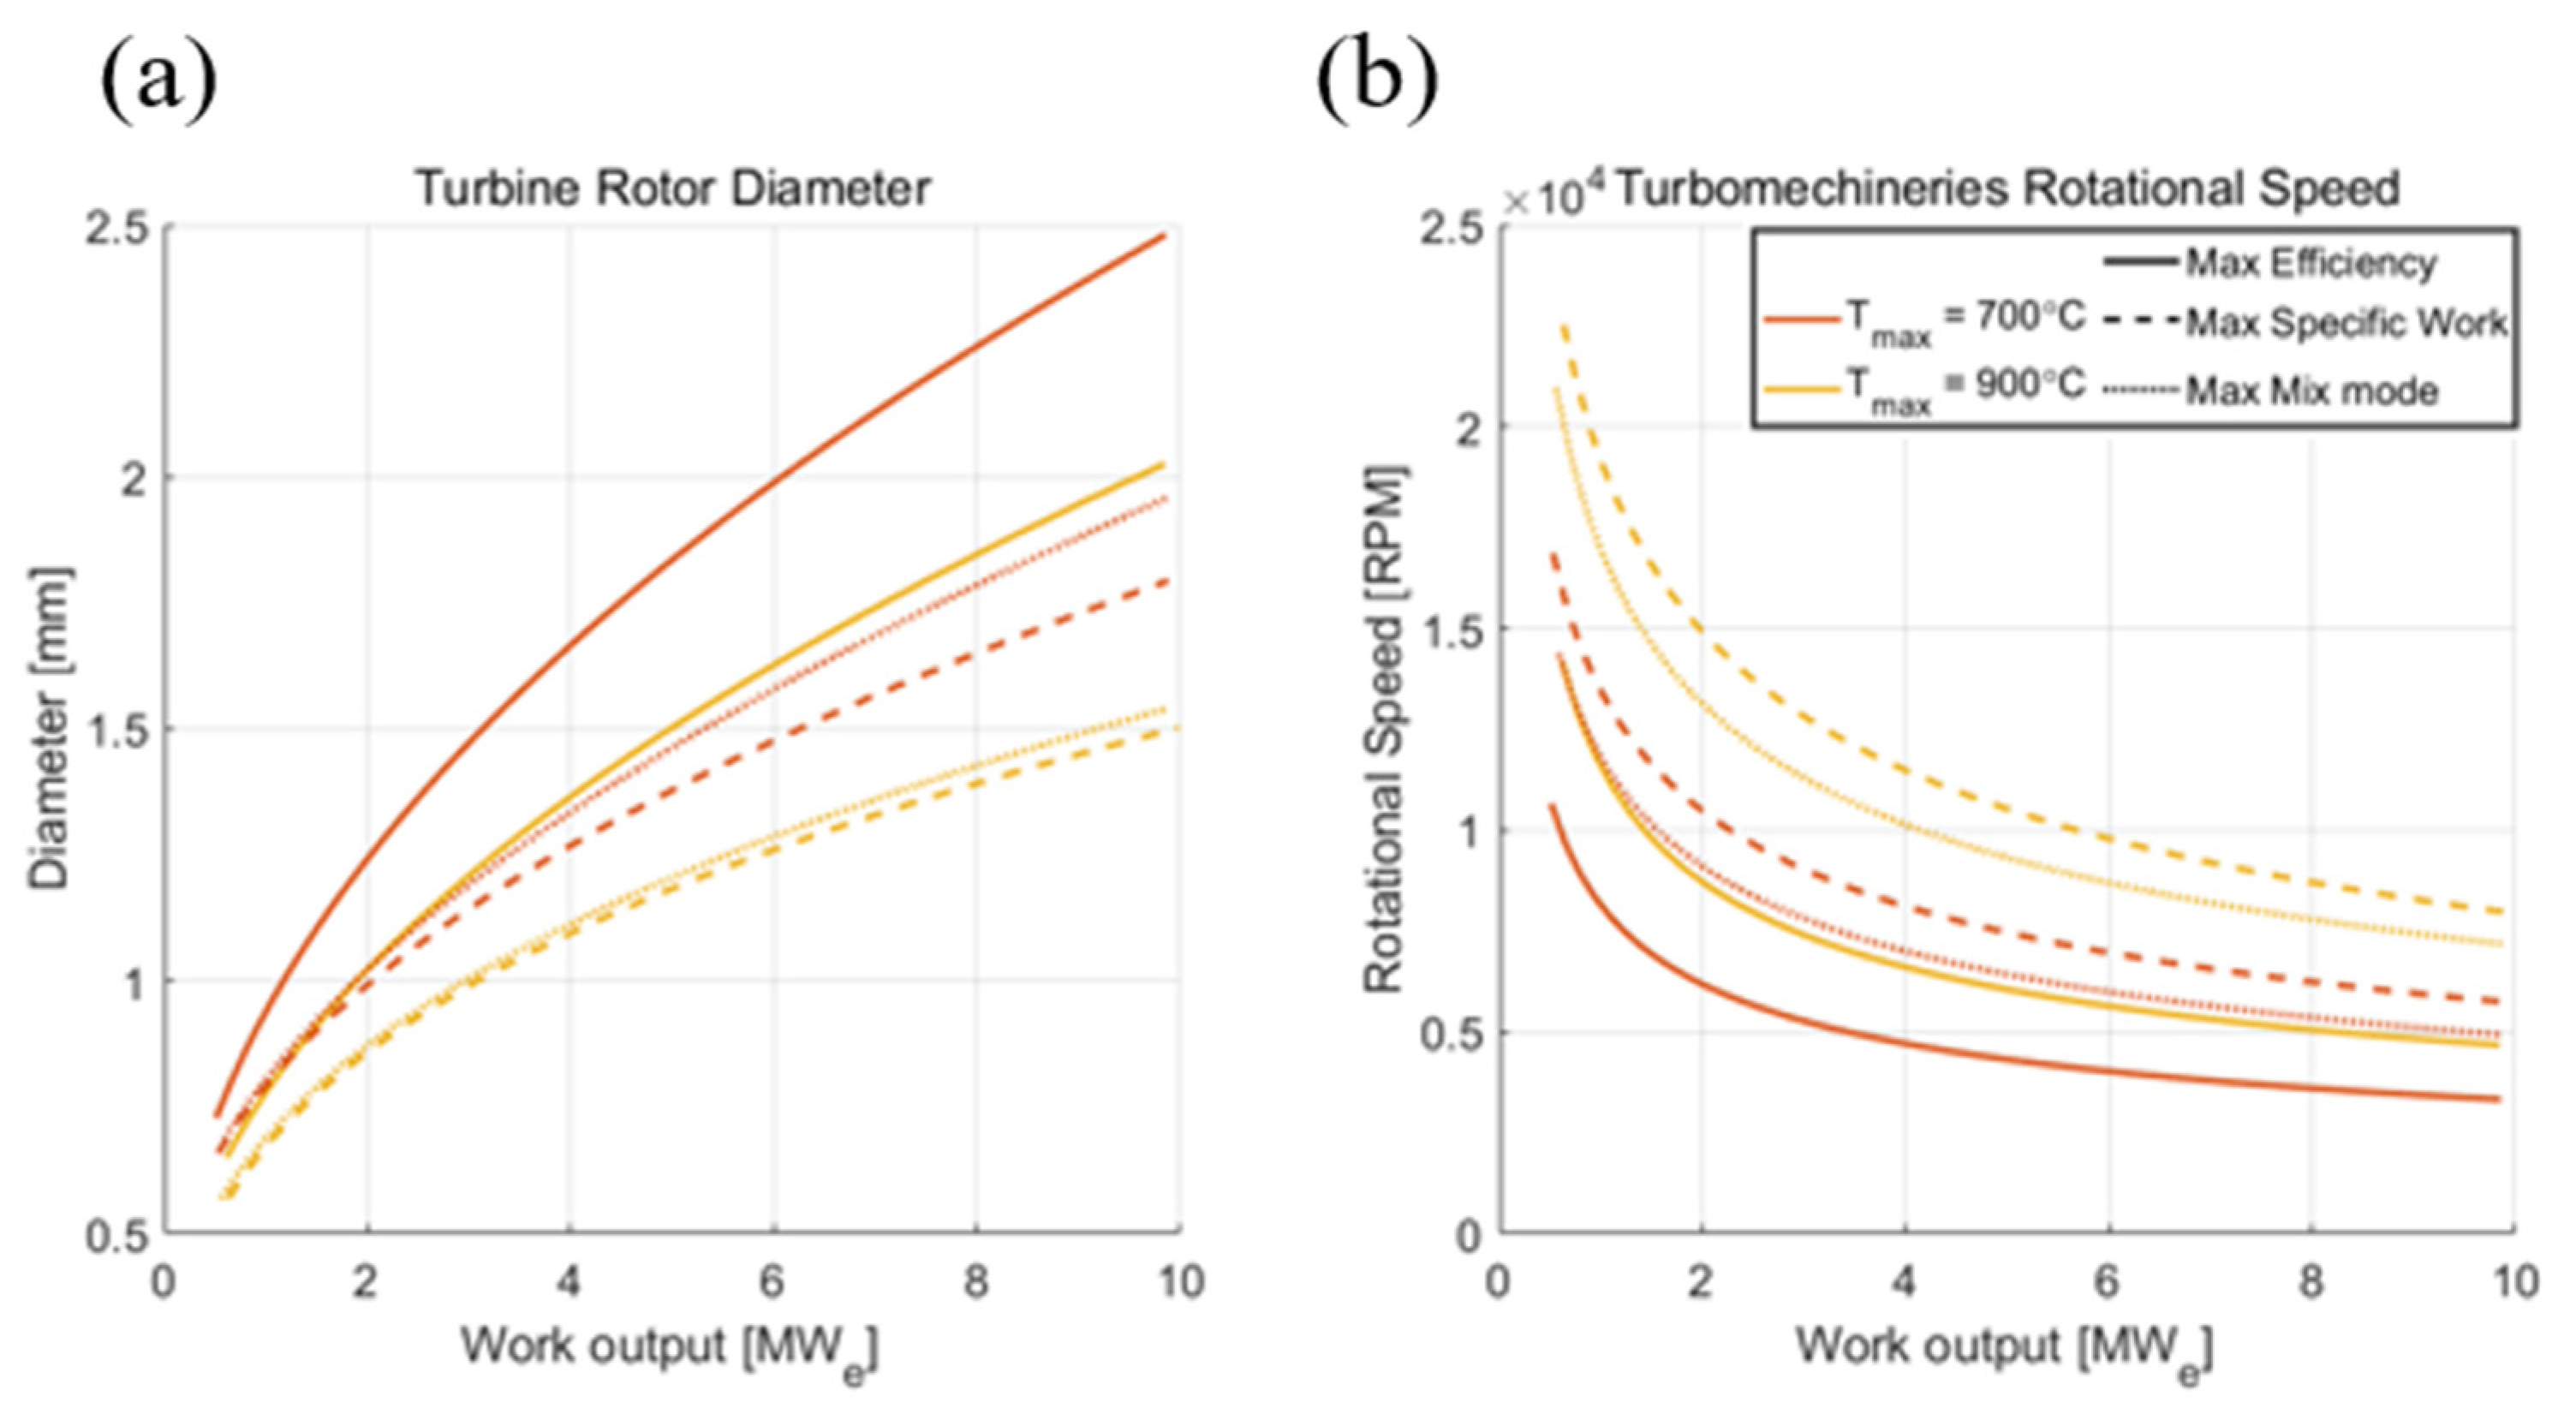
Figure 17, Figure 18 and Figure 19 show the results of the simple recuperated open-air Brayton cycle optimization results. As expected, the optimized cycle efficiency was dependent on the optimization mode. The cycle optimized at the maximum cycle specific work gave the lowest cycle efficiency among the three different optimization modes. The cycle optimized at the maximum mix mode considered both efficiency and the specific work, resulting in an intermediate cycle efficiency.

5.2. Closed S-CO2 Brayton Cycle

This section shows the results of the closed S-CO2 simple recuperated Brayton cycle optimization with three different optimization modes. An example of the modified KAIST-CCD cycle optimization code at a specific power output is given in Figure 20, Figure 21 and Figure 22. The turbine pressure ratio was limited to 2.58, at which the cycle minimum pressure or the compressor inlet pressure was still above 7.40 MPa. Based on Equations (9) and (10), the polytropic efficiencies of the compressor and the turbine were converted to the isentropic efficiencies. When compared to the isentropic efficiency of the open-air Brayton cycle given in Figure 14, the shape of the S-CO2 compressor isentropic efficiency curve converted from the polytropic efficiency seems to be very different and counterintuitive. The main reason for the behavior seems to originate from the strong real gas effect of CO2 near the critical point. As shown in the previous equations, the compressibility factor, Z, cannot be ignored in the calculation. Thus, when the compressibility factor is considered, the isentropic efficiency near the critical pressure is affected substantially.
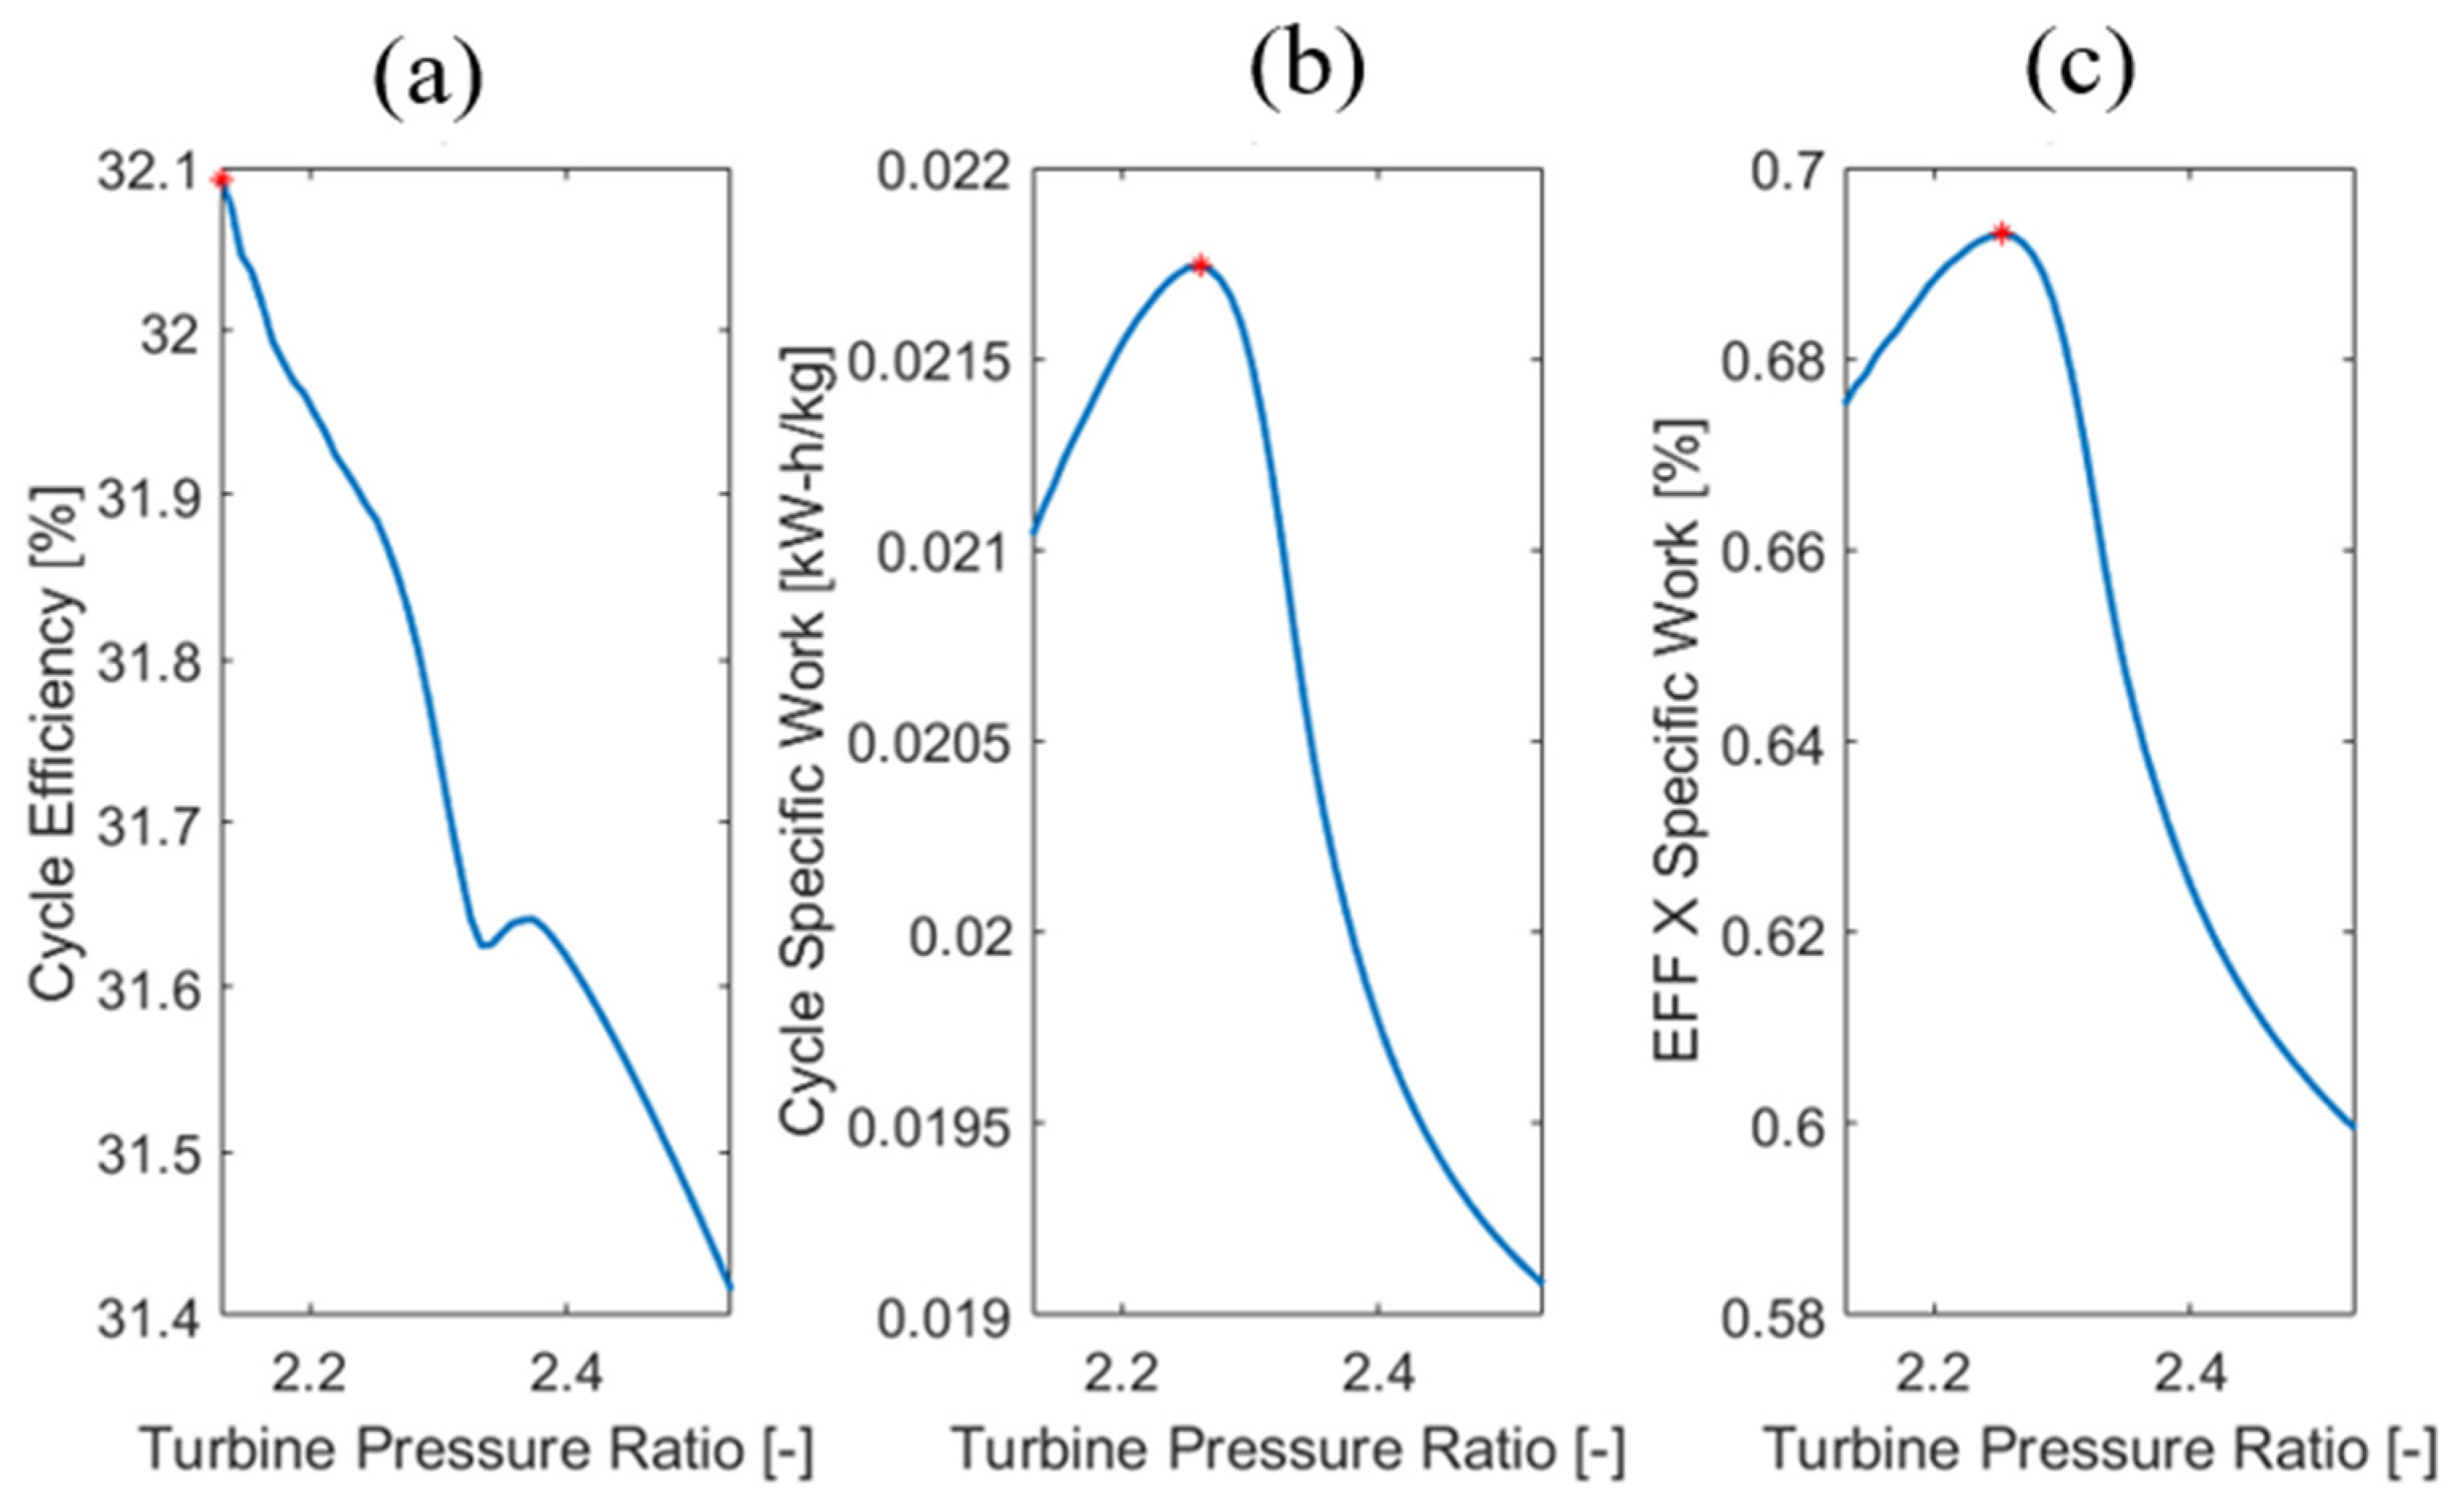
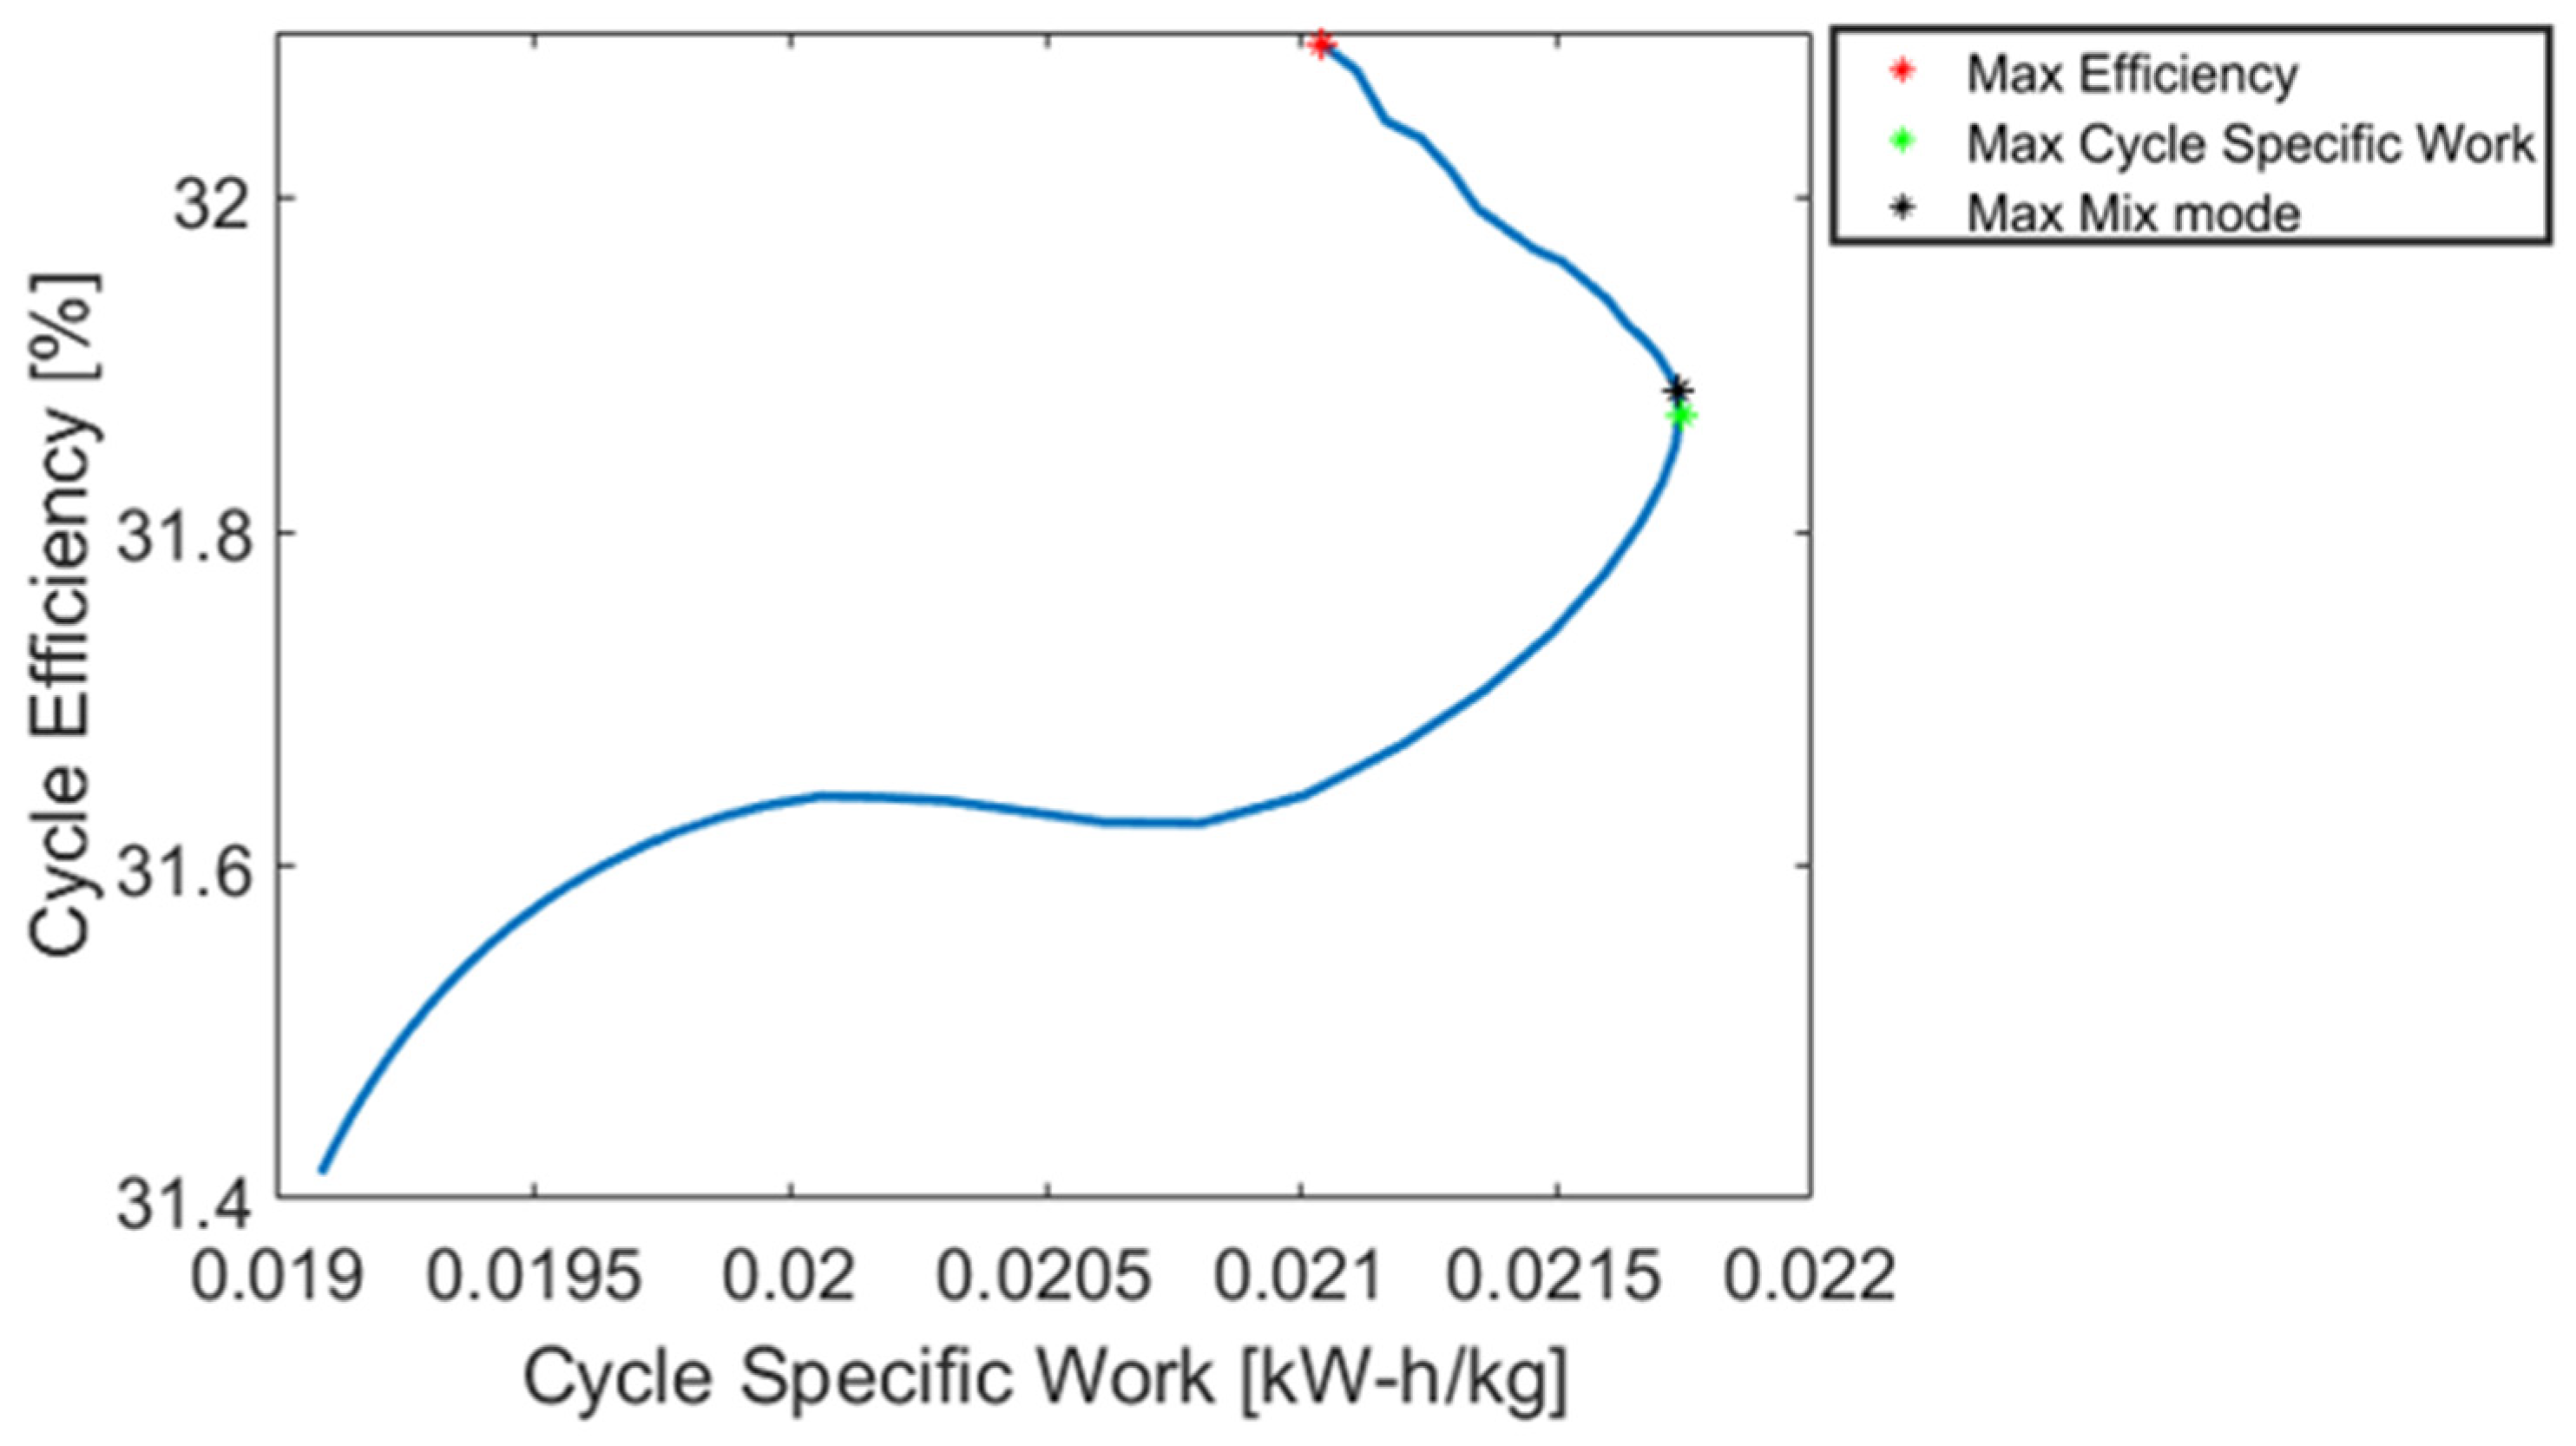
Using these turbomachinery isentropic efficiencies at each turbine pressure ratio, the cycle efficiency, cycle specific work, and the mix mode were calculated as shown in Figure 21, where the red points on the plots represent the maximum point of corresponding parameters. Figure 22 shows the cycle efficiency plotted over the cycle specific work, where the red, black, and green points represent the point at which the cycle efficiency, cycle specific work, and the mix mode, respectively, were maximized. Similar to the open-air Brayton cycle, if the cycle is optimized with the maximum cycle efficiency, the cycle specific work is relatively lower than that in the cycle optimized with the maximum cycle specific work. However, the cycle optimized with the mix mode is almost the same as the cycle optimized with the specific work. The same trend continues in Figure 23, Figure 24 and Figure 25.
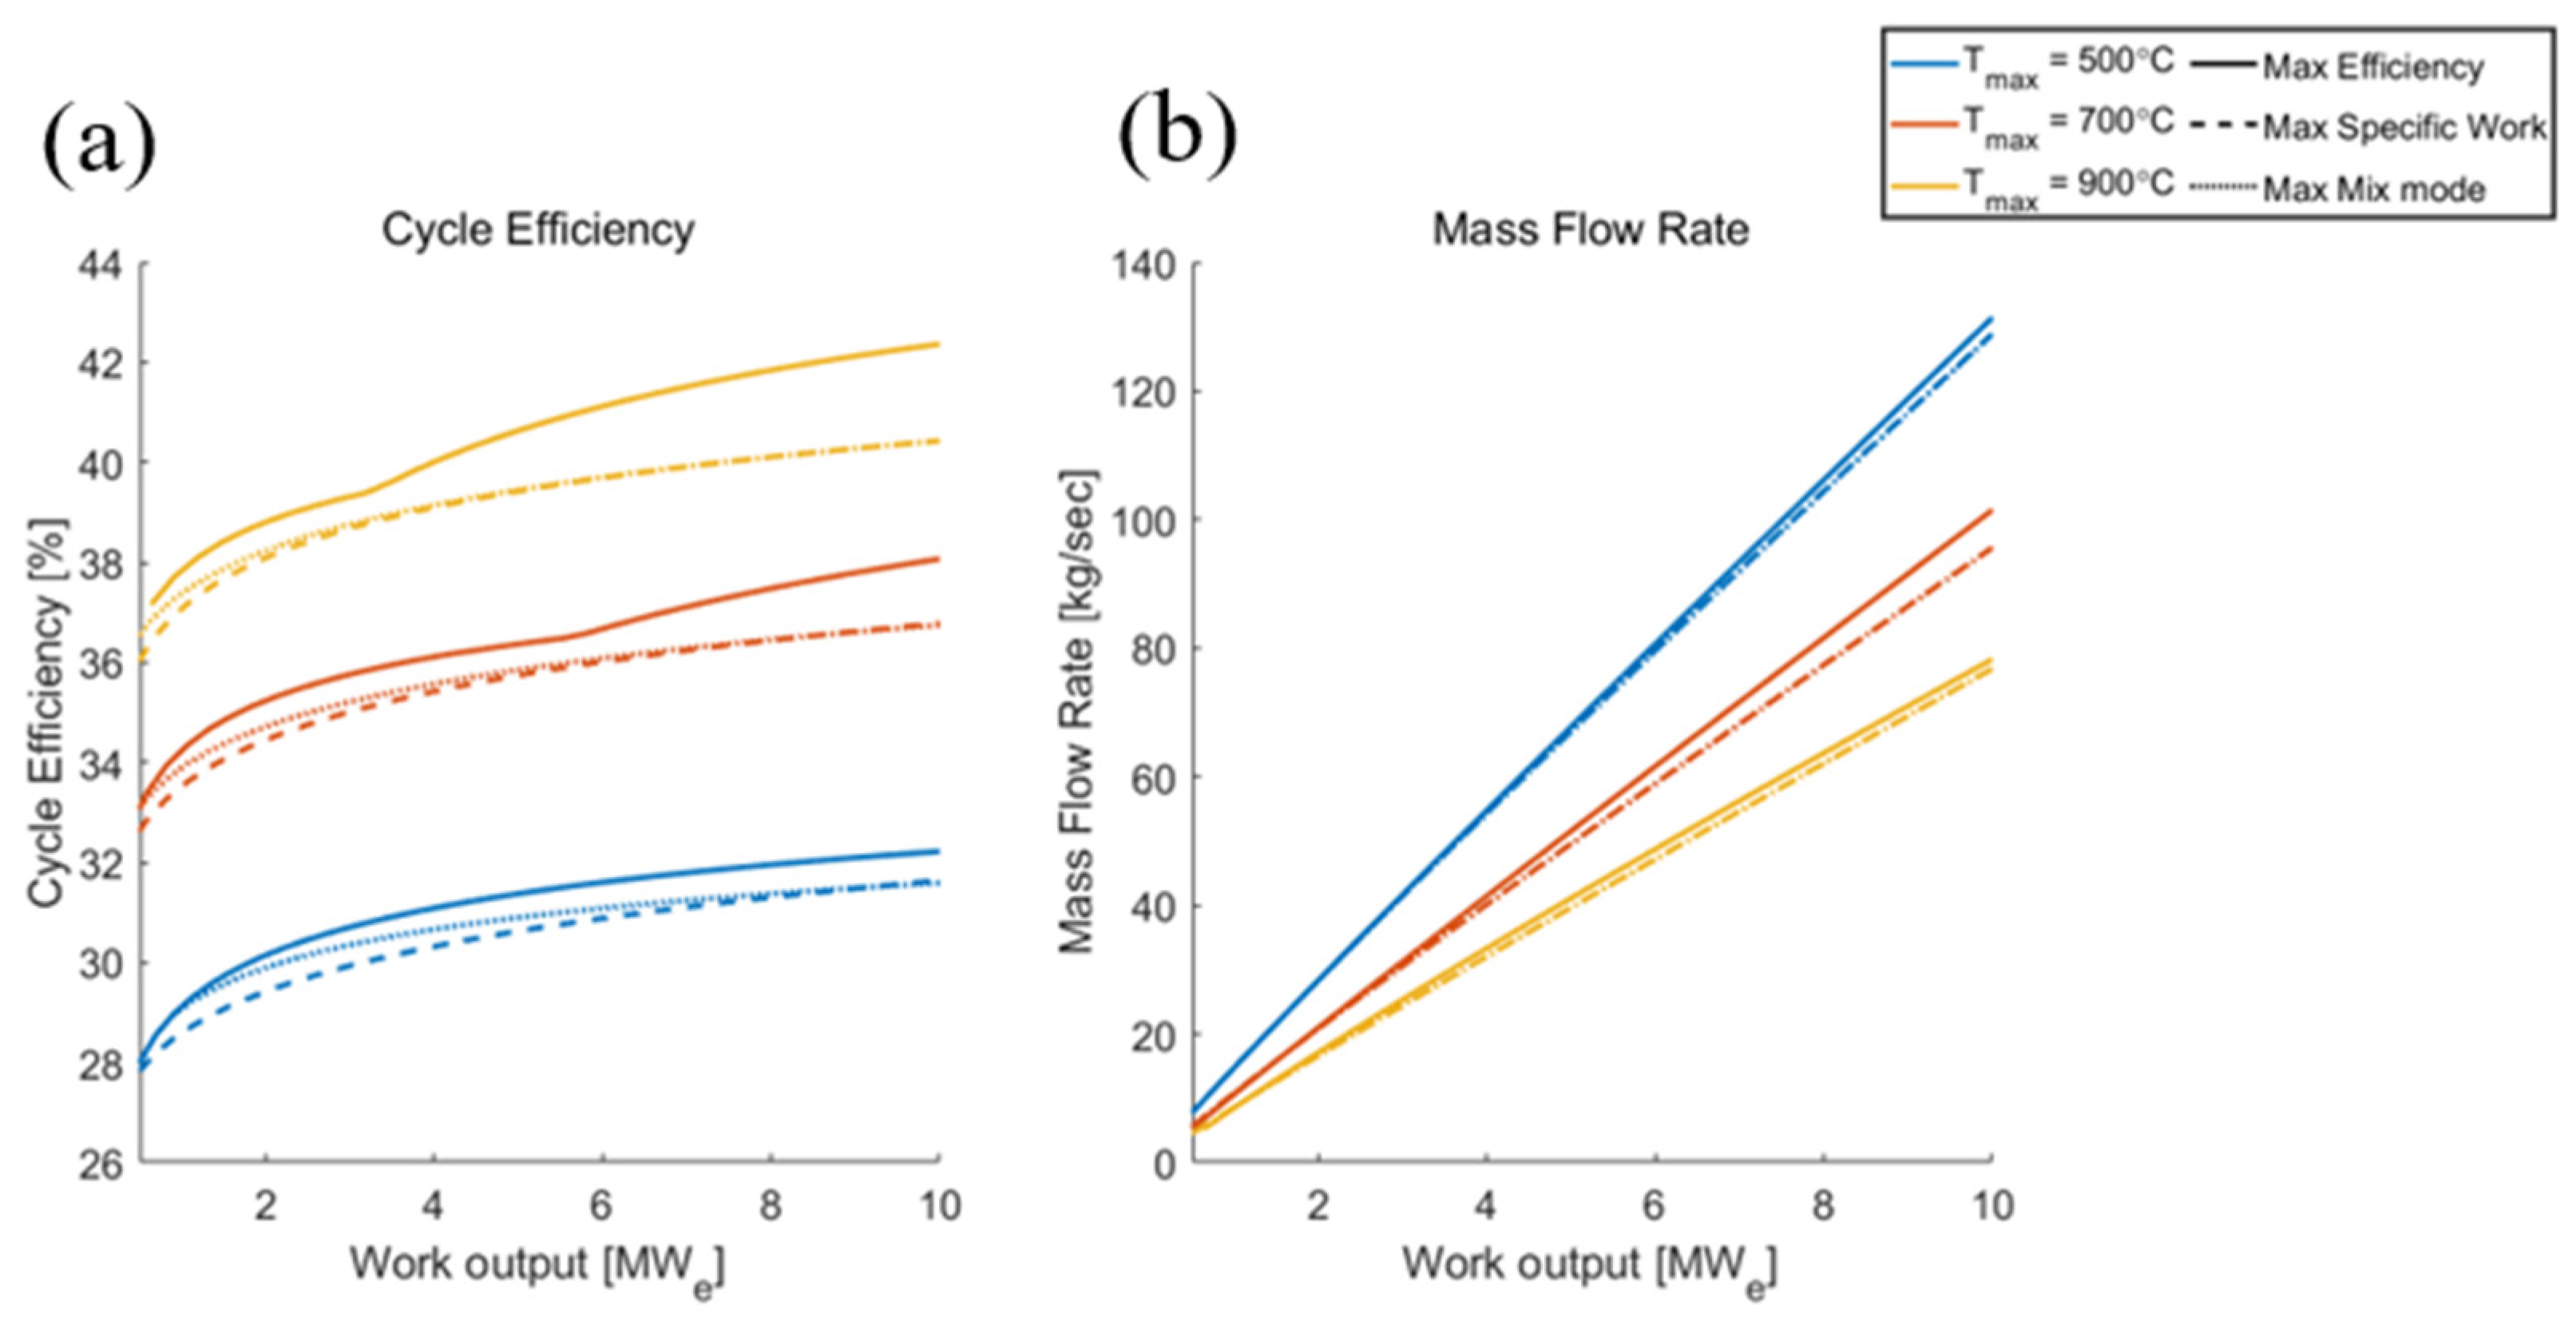
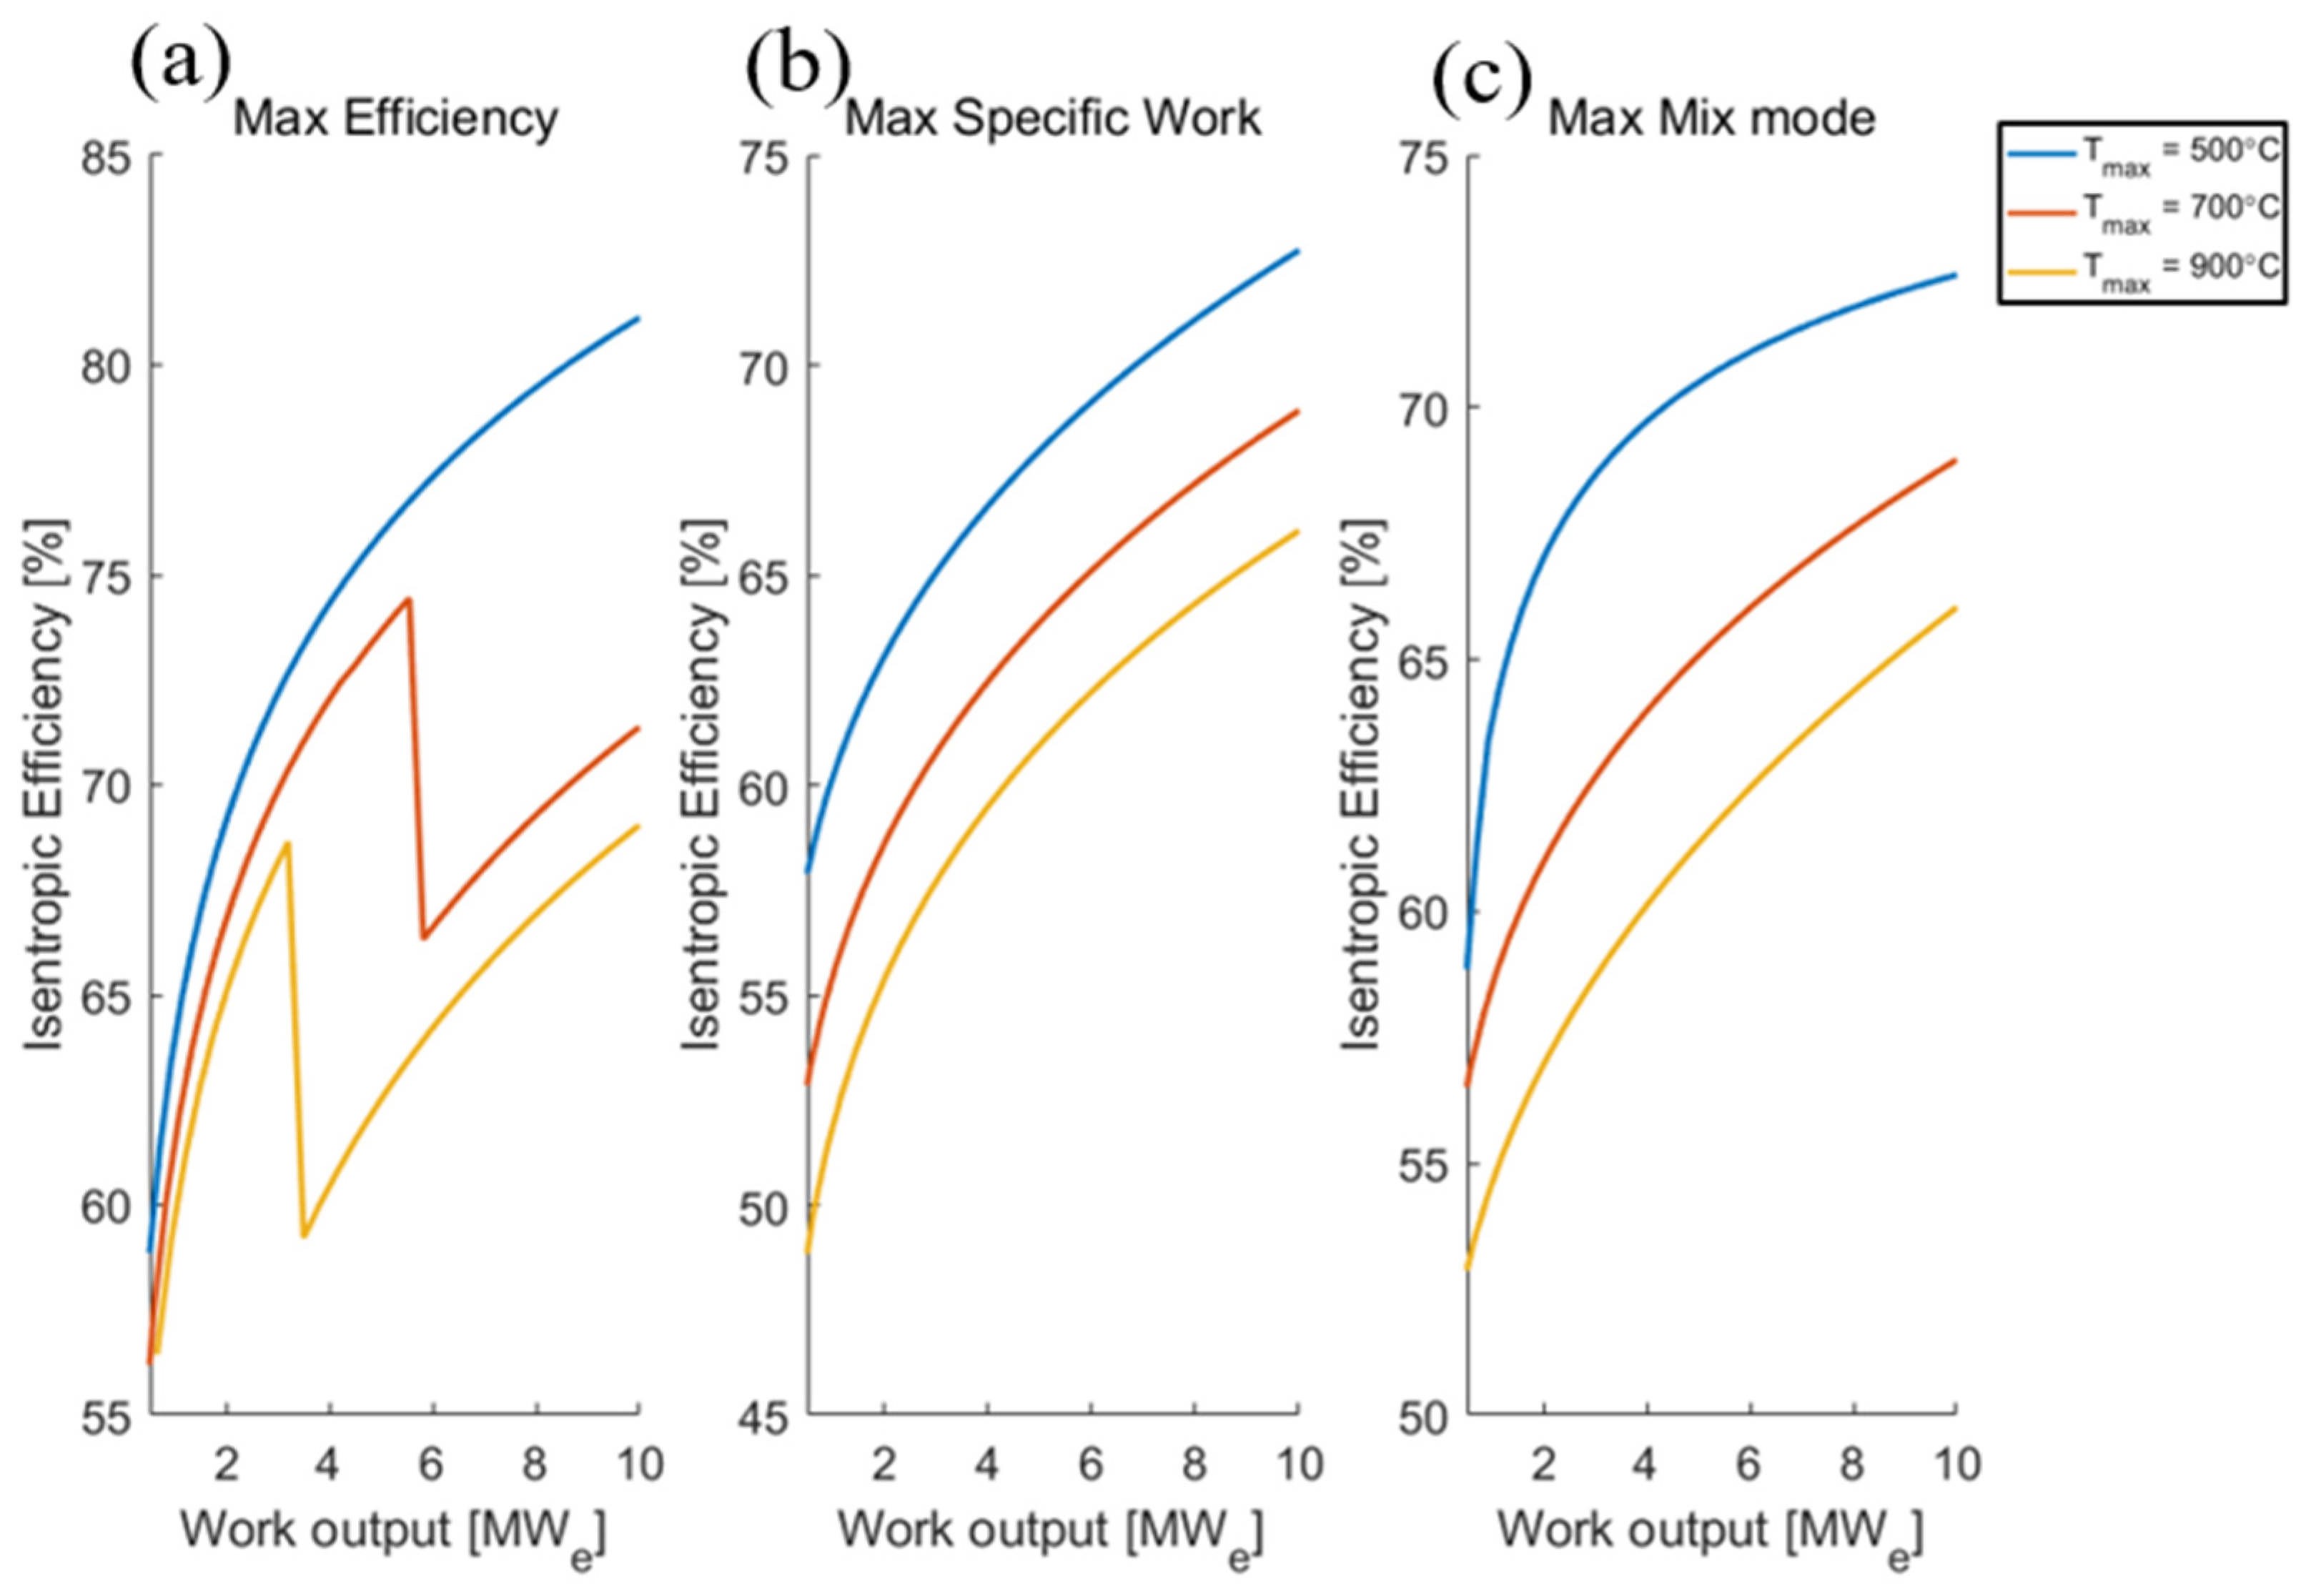
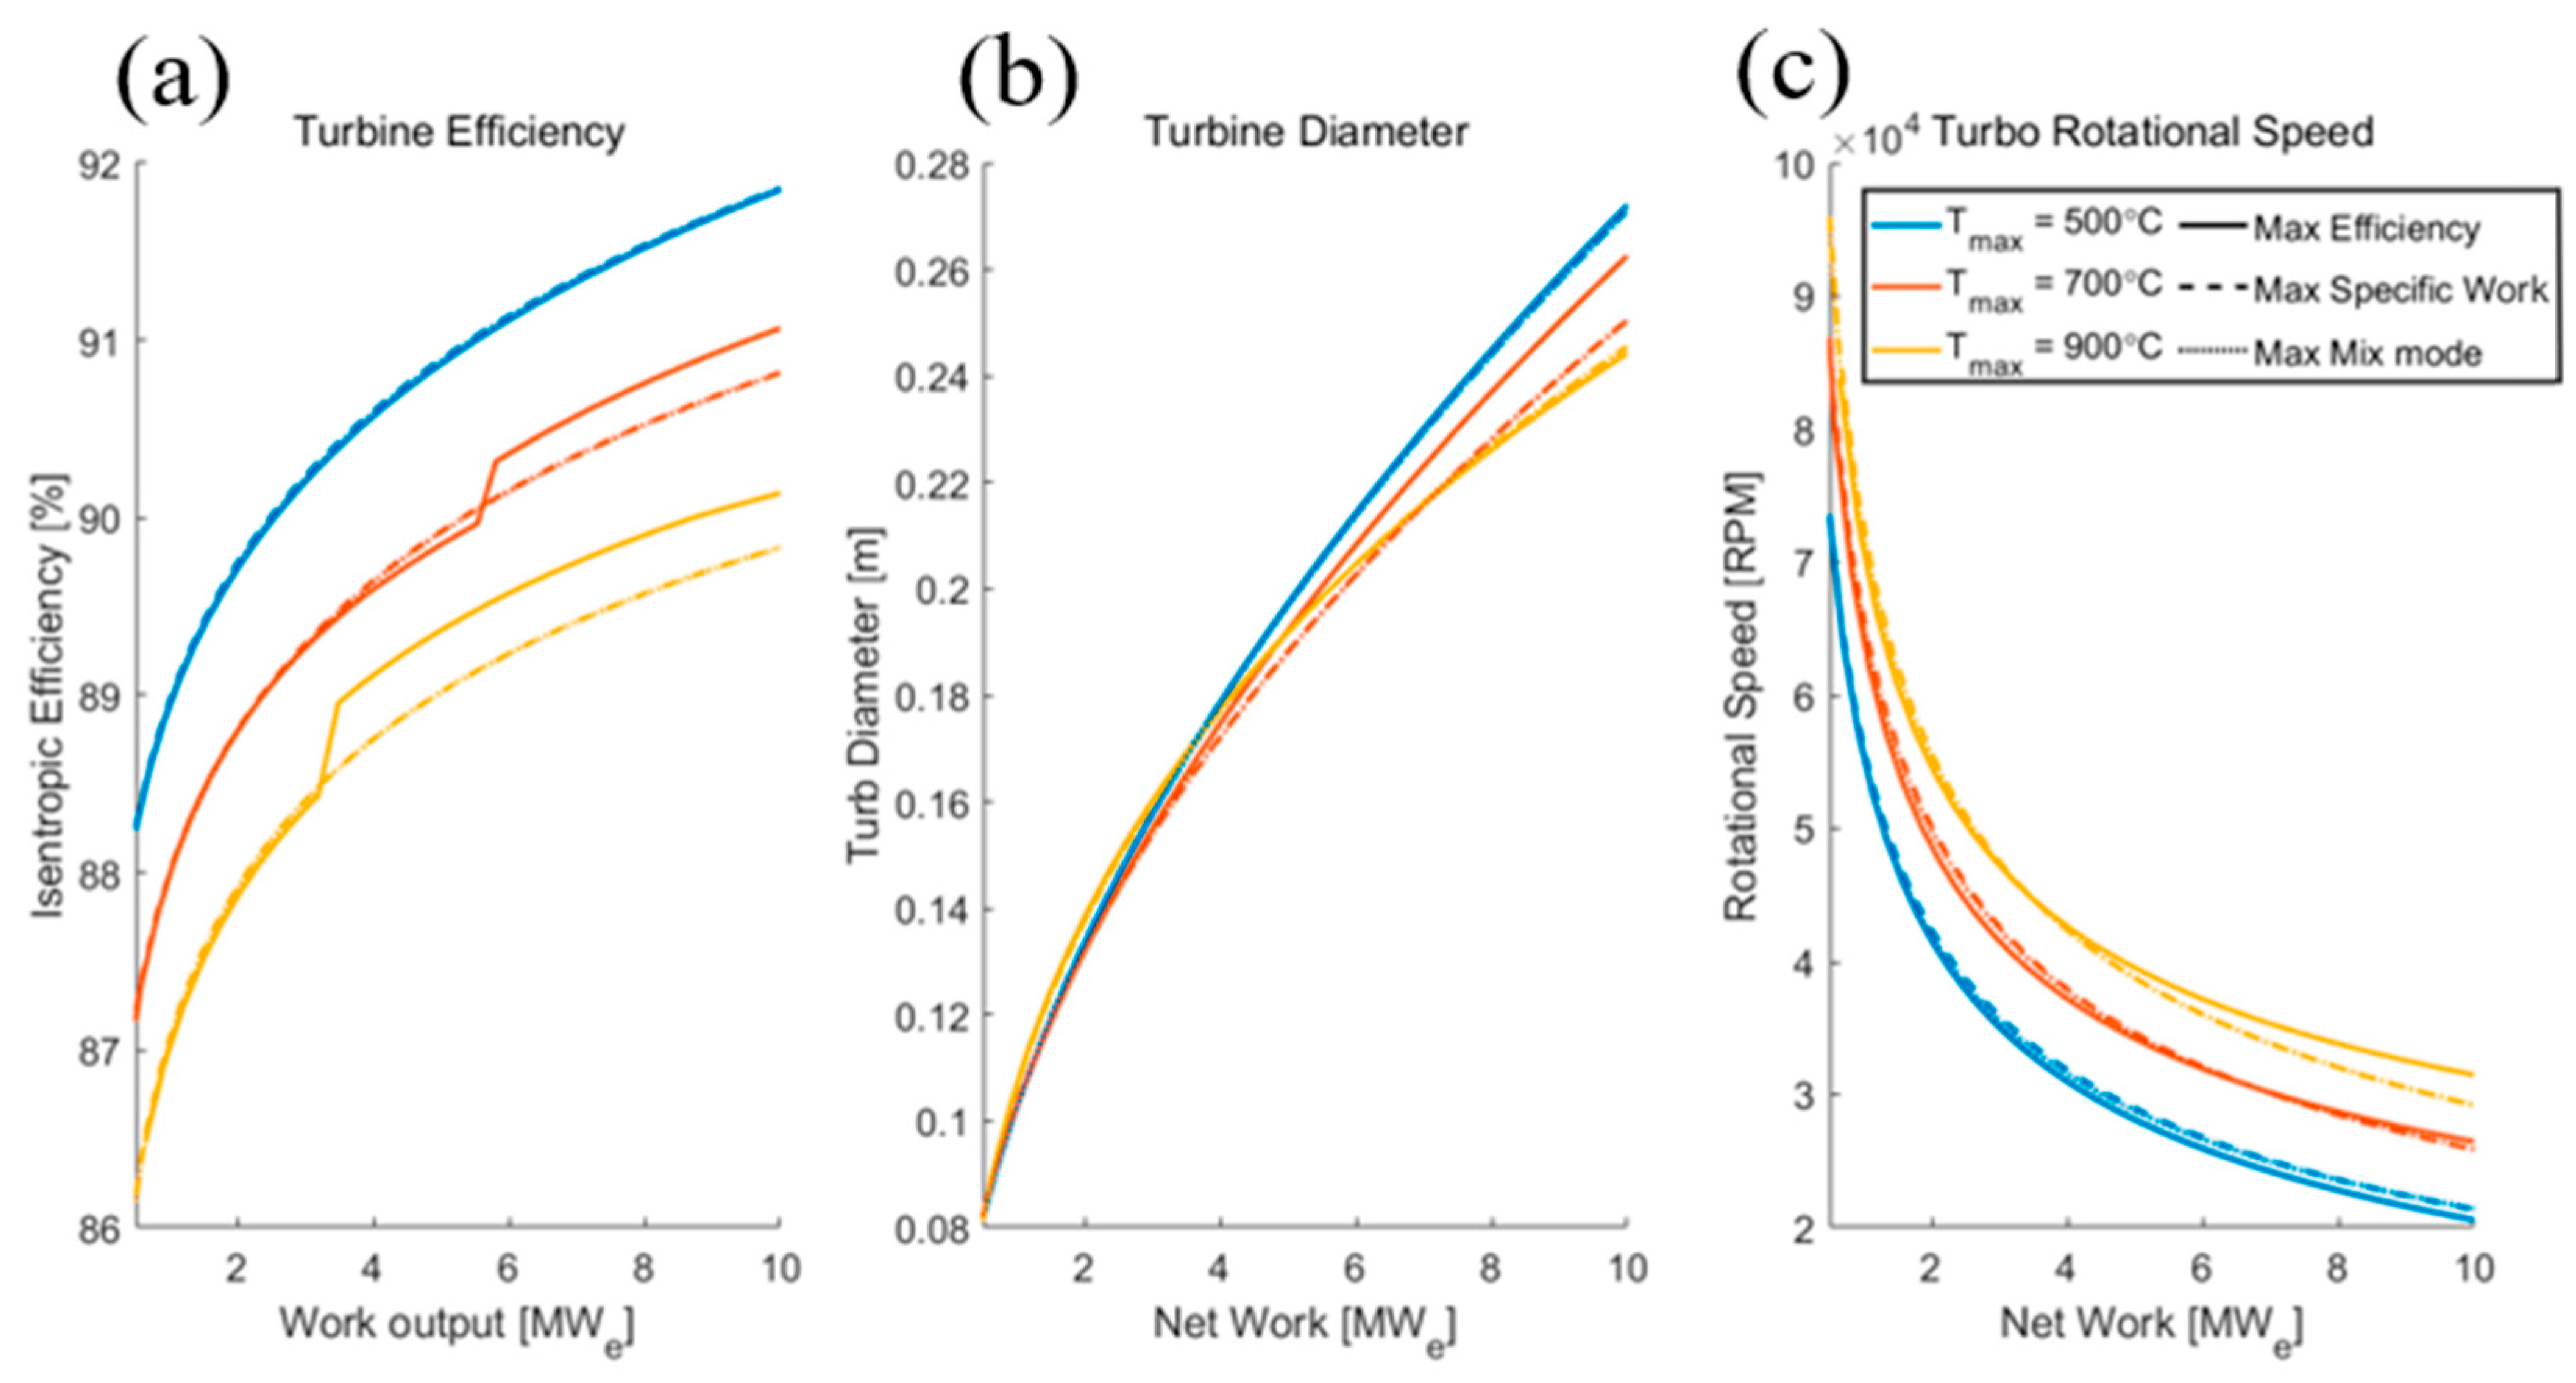
Figure 23a shows the S-CO2 simple recuperated Brayton cycle efficiency over various power output levels. At the cycle maximum temperature of 500 °C with optimization at the maximum efficiency, the cycle efficiency showed a smooth curve. However, at the cycle maximum temperature of 700 °C and 900 °C, the cycle efficiencies with maximum efficiency mode had inflection points at 5.54 MWe and 3.19 MWe, respectively. The reason for the rapid change in the cycle efficiency is the abrupt change in the optimized turbine pressure ratio. At 5.54 MWe, the cycle was optimized at the turbine pressure ratio of 2.15. However, at 5.81 MWe, the cycle was optimized at the turbine pressure ratio of 2.53, as shown in Figure 26. This abrupt change in the optimized turbine pressure ratio causes the inflection in the cycle efficiency curve for the maximum cycle temperature of 700 °C and 900 °C.
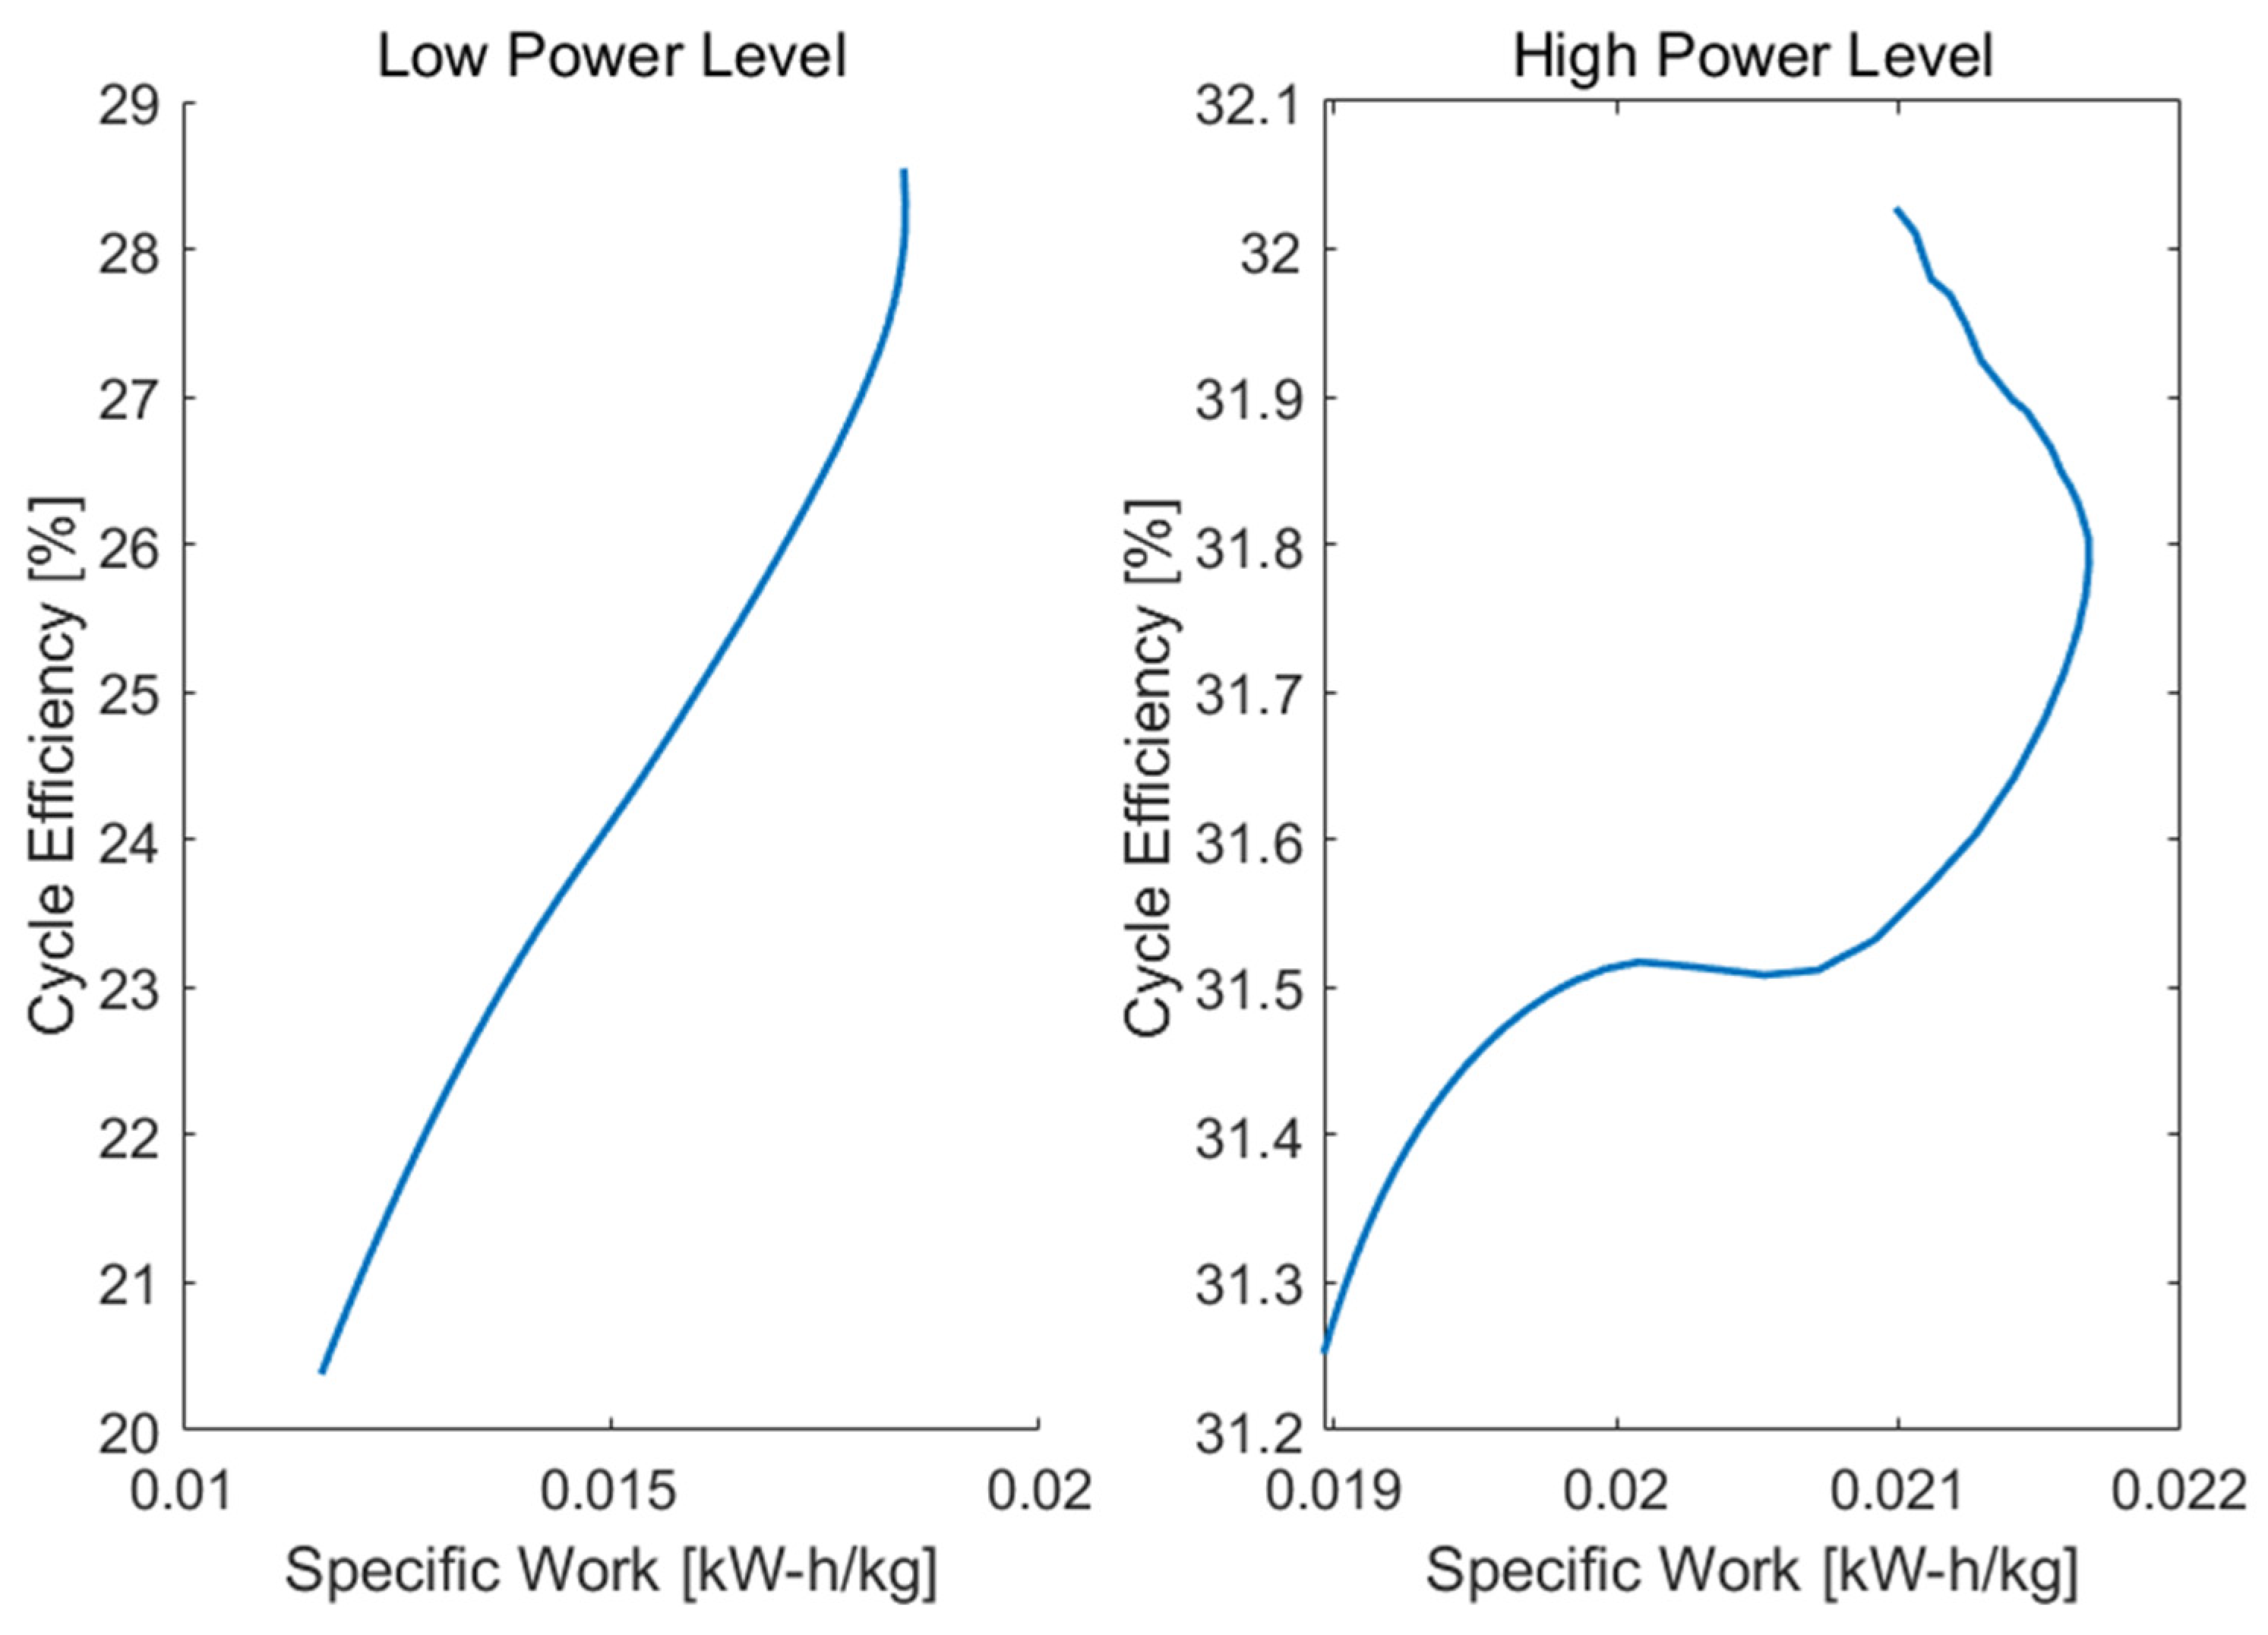
The S-CO2 cycle efficiency at the mixed optimization mode is mainly dominated by either efficiency or cycle specific work depending on the power levels. At the maximum temperature of 500 °C and 700 °C, the cycle efficiencies of the mix mode followed the cycle efficiency of the maximum efficiency mode for power output less than 2 MWe. As the power output increased, the cycle optimized with the mixed mode now coincided with the maximum cycle specific work. The main reason for such a phenomenon can be explained with Figure 27.
Figure 27 shows the cycle efficiency of the S-CO2 cycle along its cycle specific work. At the low power level, the point of the maximum efficiency occurs at the maximum specific work. Thus, the mix mode, where the efficiency and the specific work of the cycle are considered simultaneously, is mostly dominated by the maximum efficiency conditions. On the other hand, at the high power level, which is closer to commercial-scale application, the points of the maximum efficiency and the maximum specific work are obviously distinguishable. However, the change in the cycle efficiency is relatively smaller than the change in the specific work, causing the mix mode to coincide with the maximum specific work. Hence, for larger-scale commercial application, the S-CO2 cycle’s best performing conditions are the maximum specific work conditions.

5.3. Comparison of Air and S-CO2 Brayton Cycles

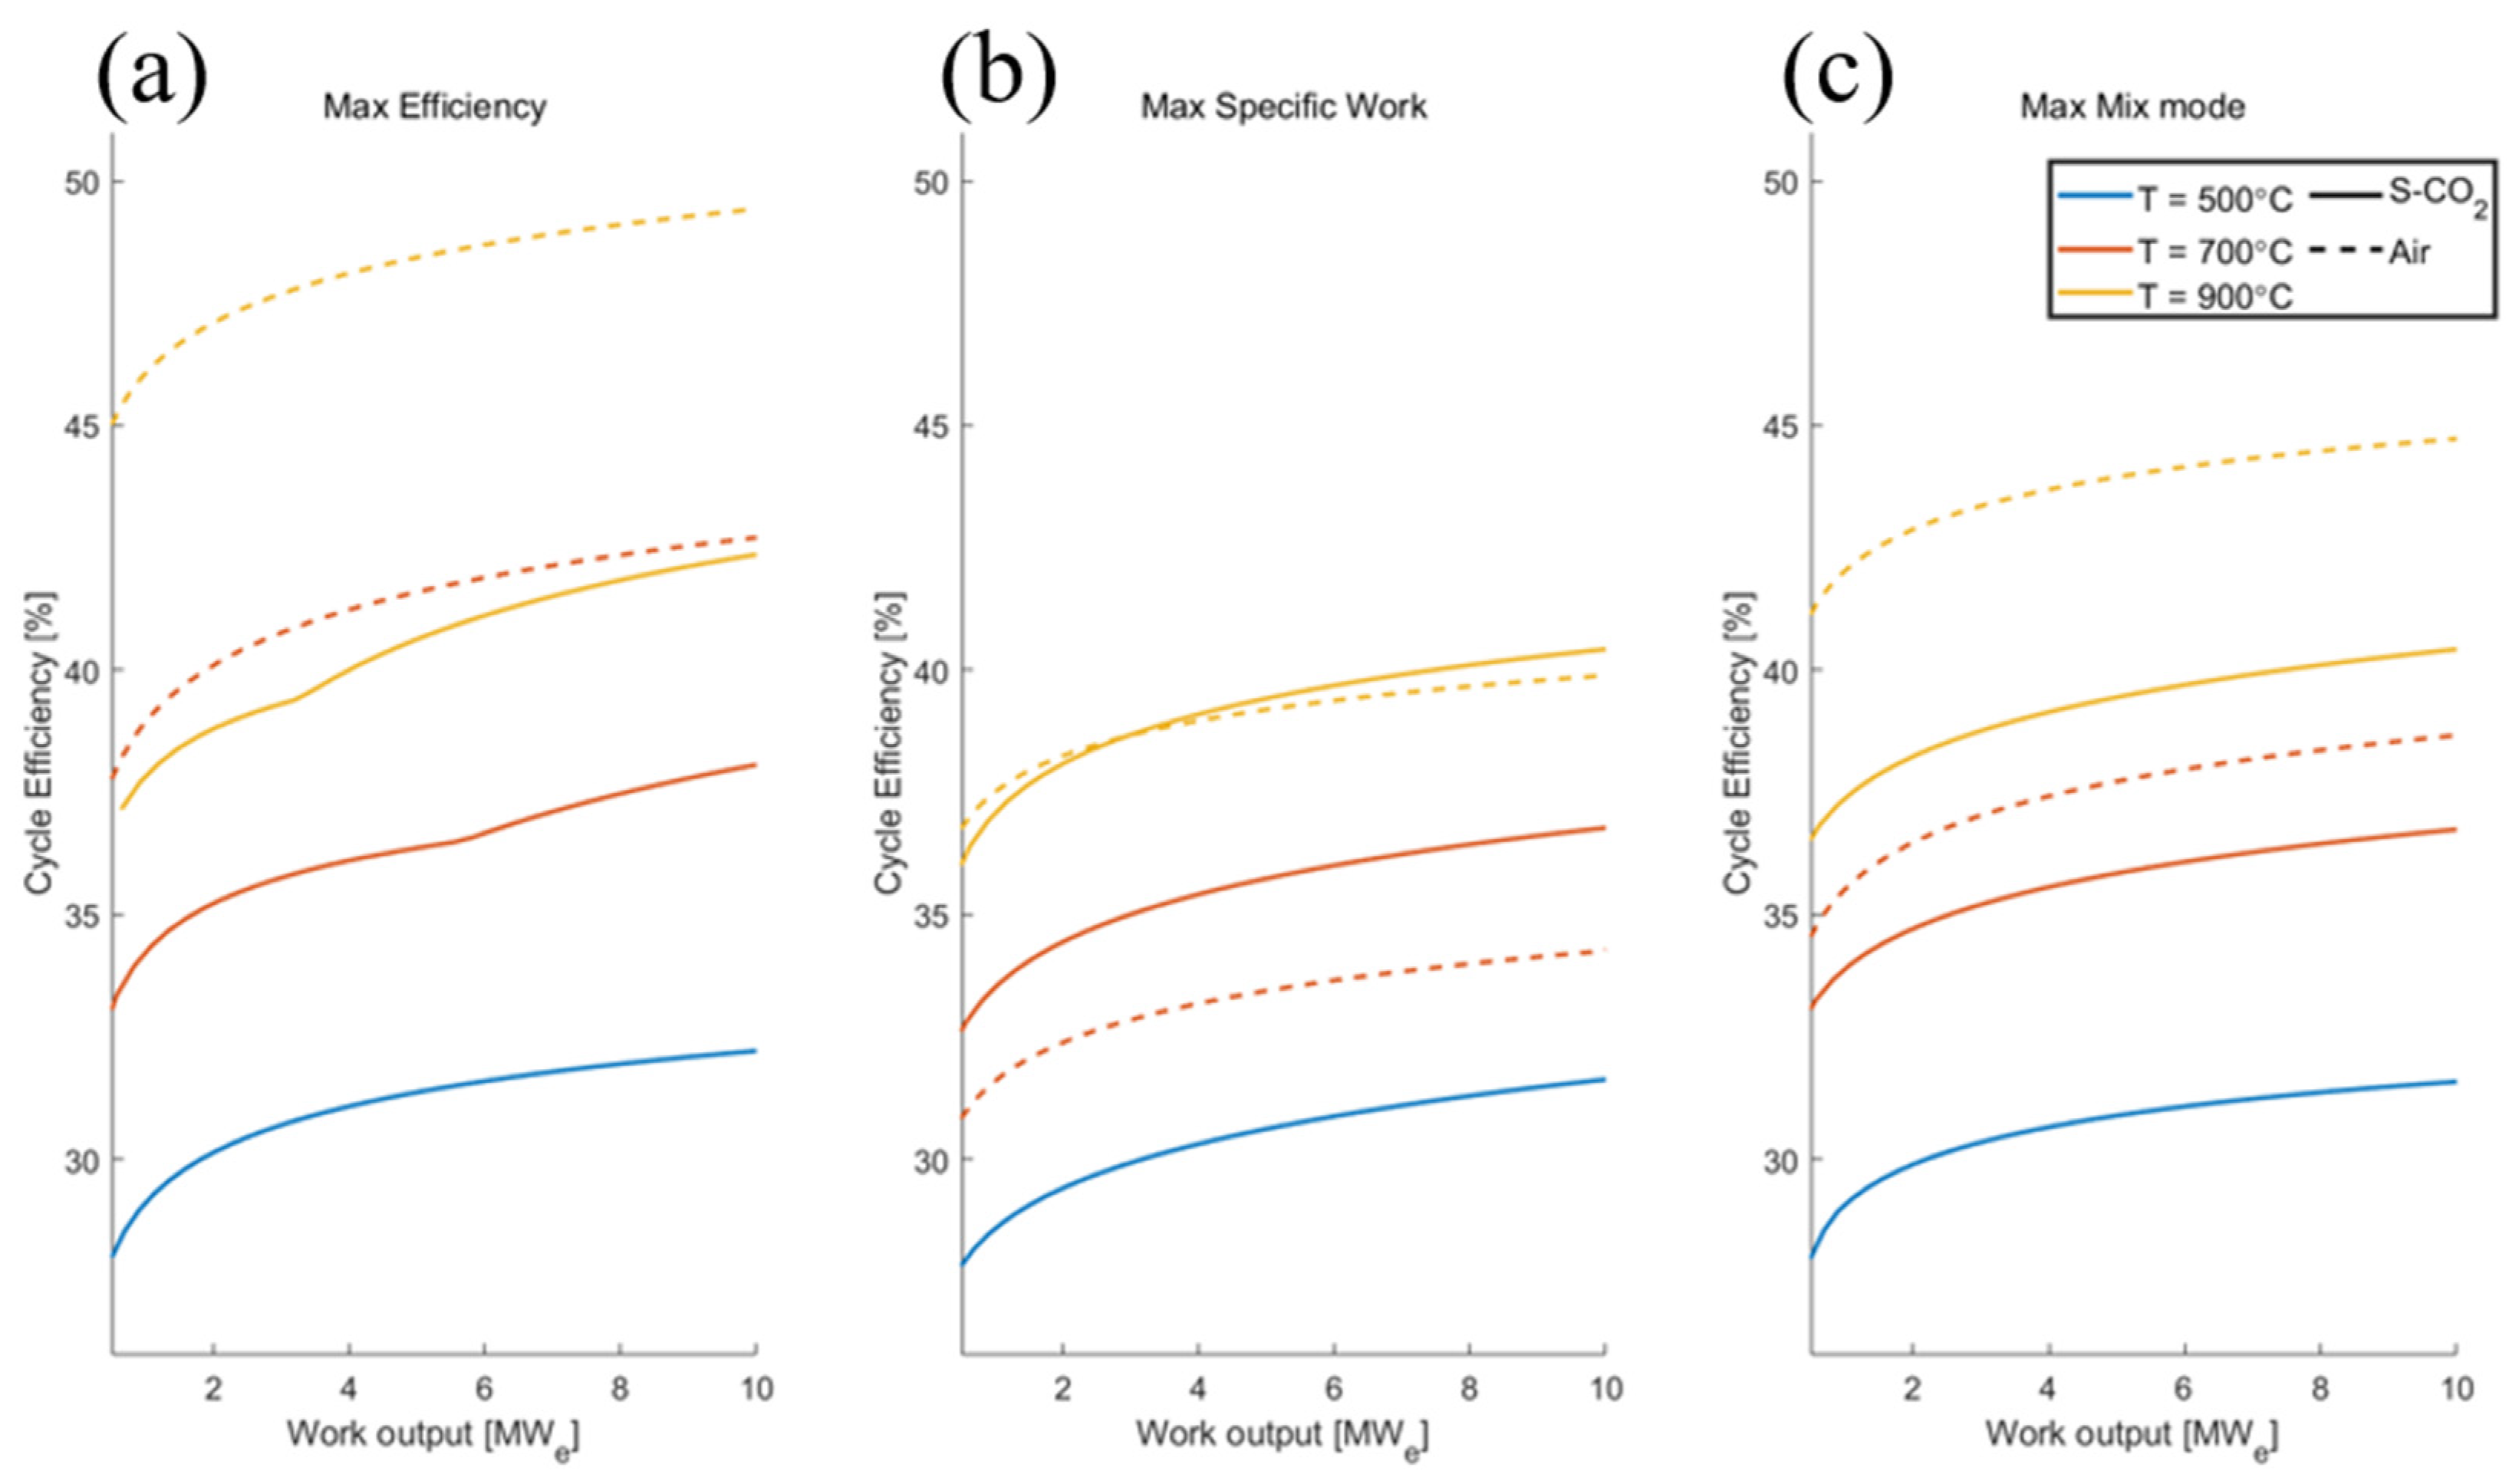
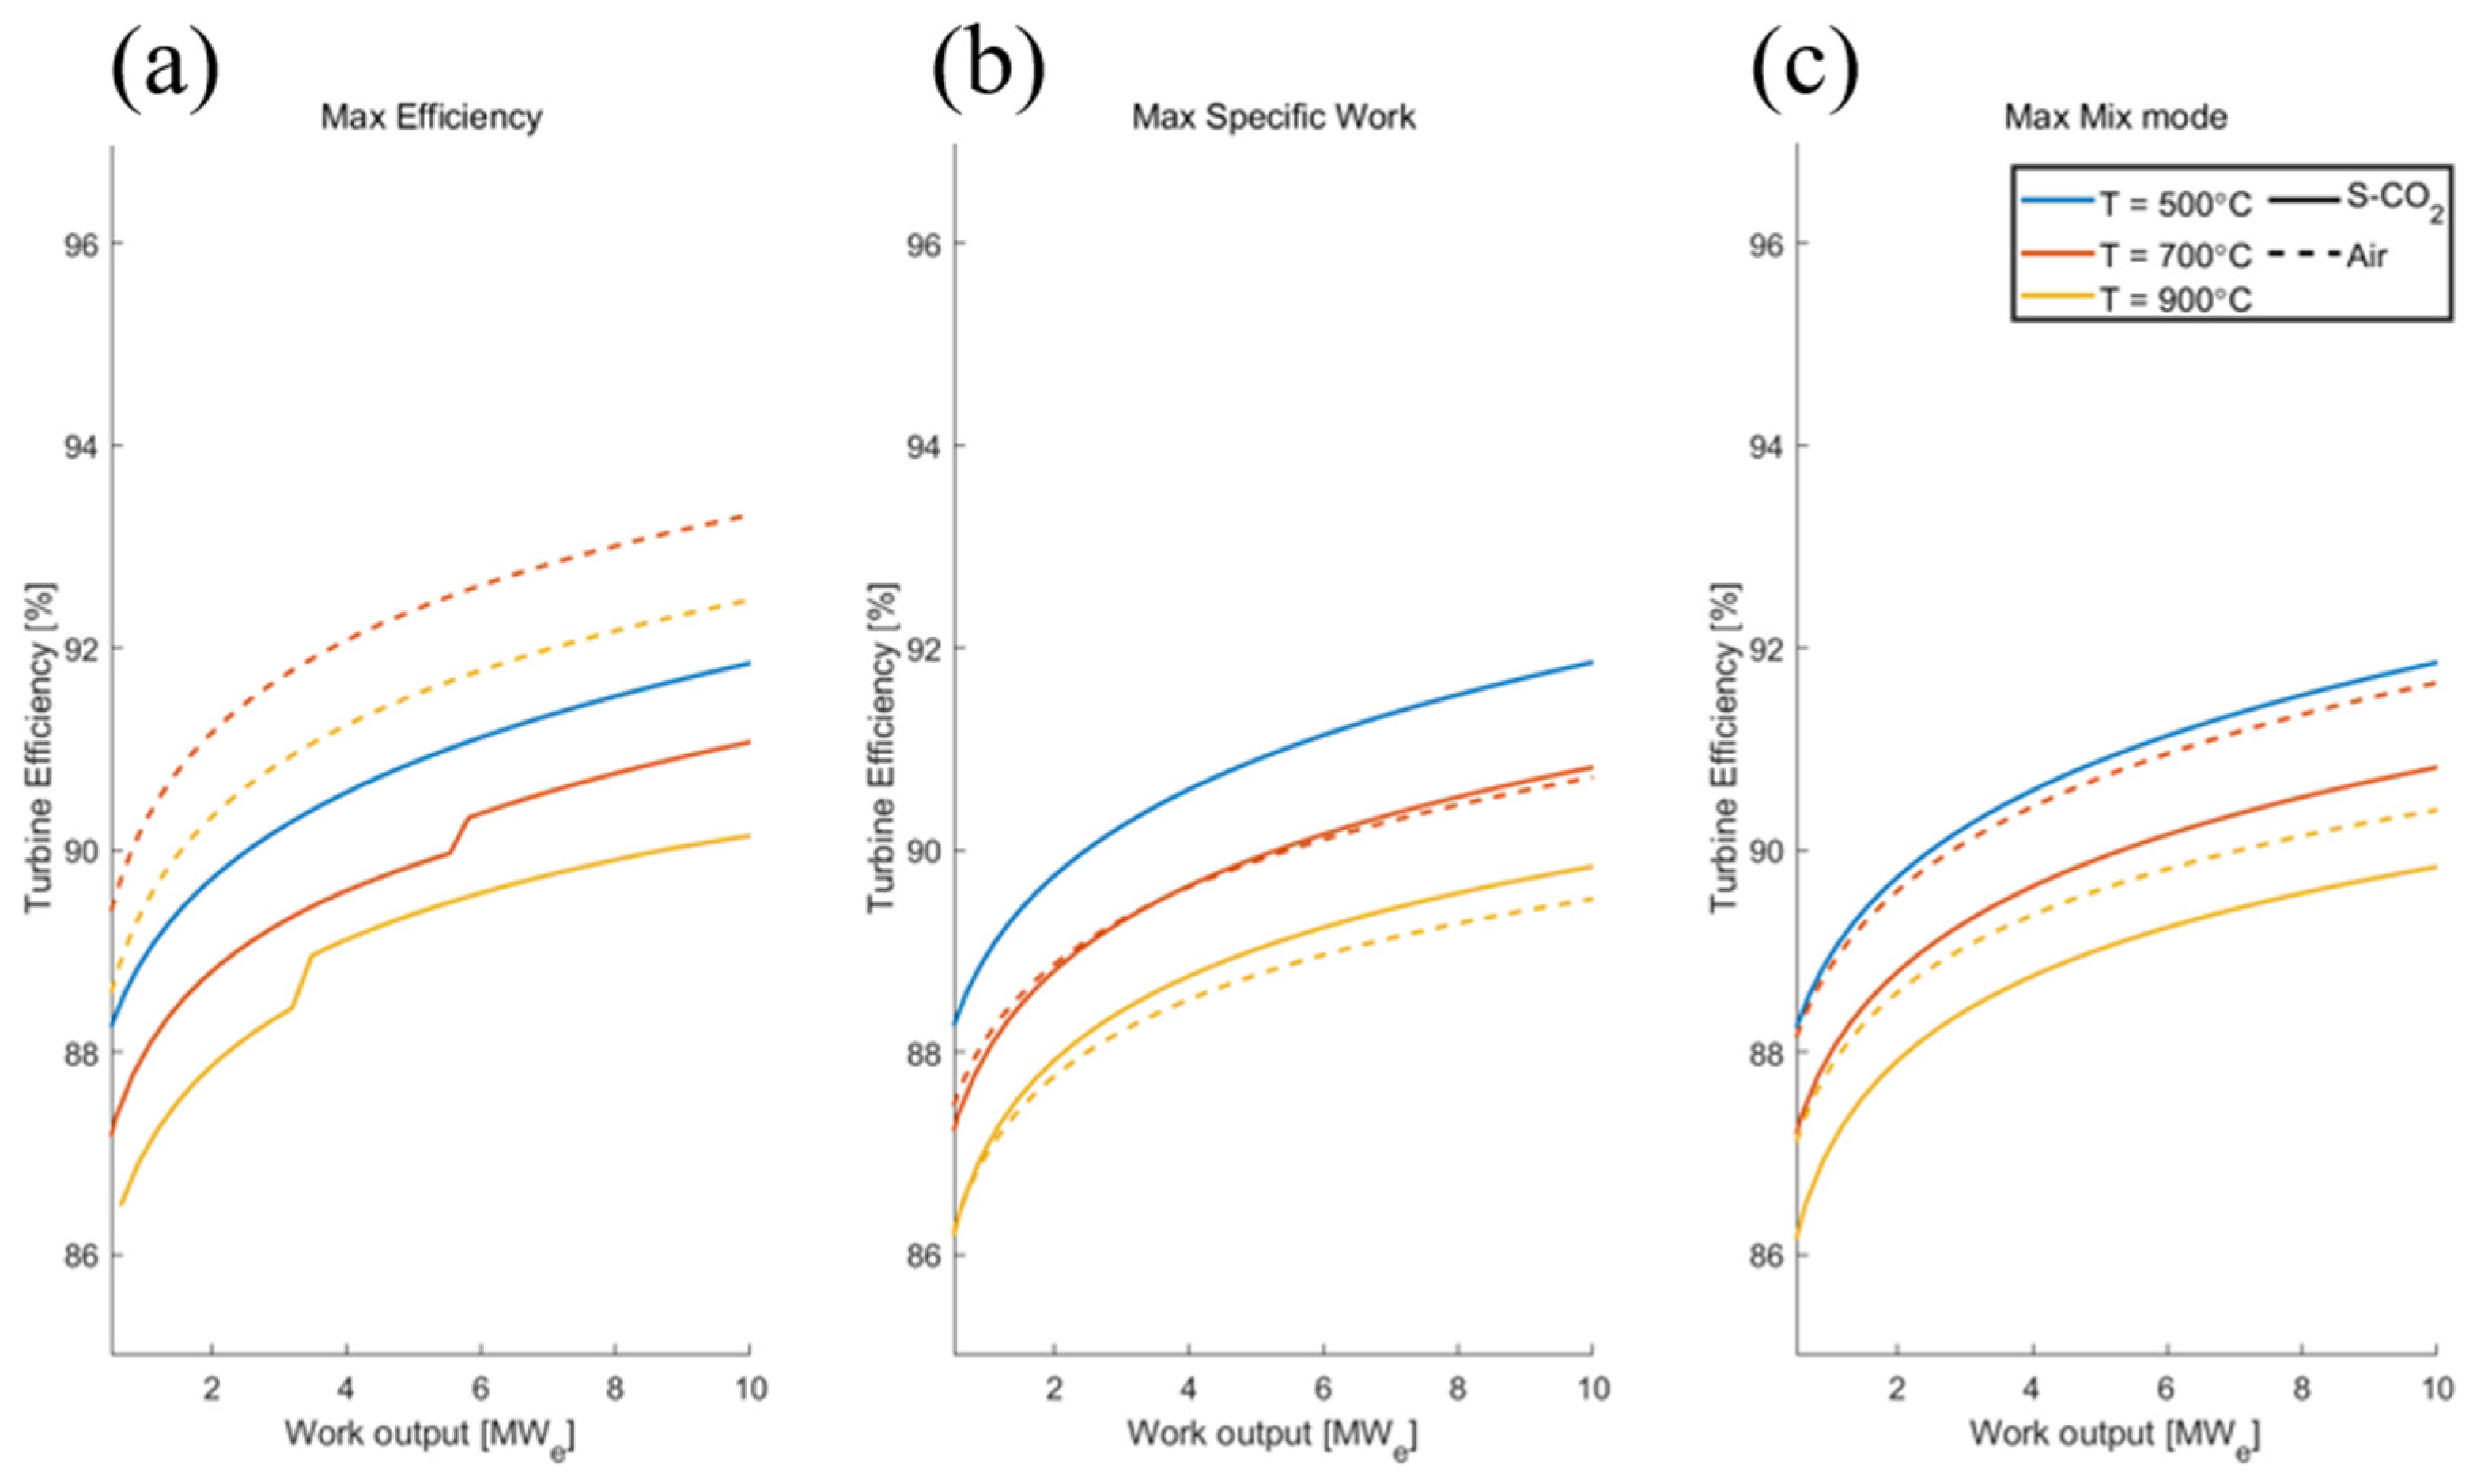
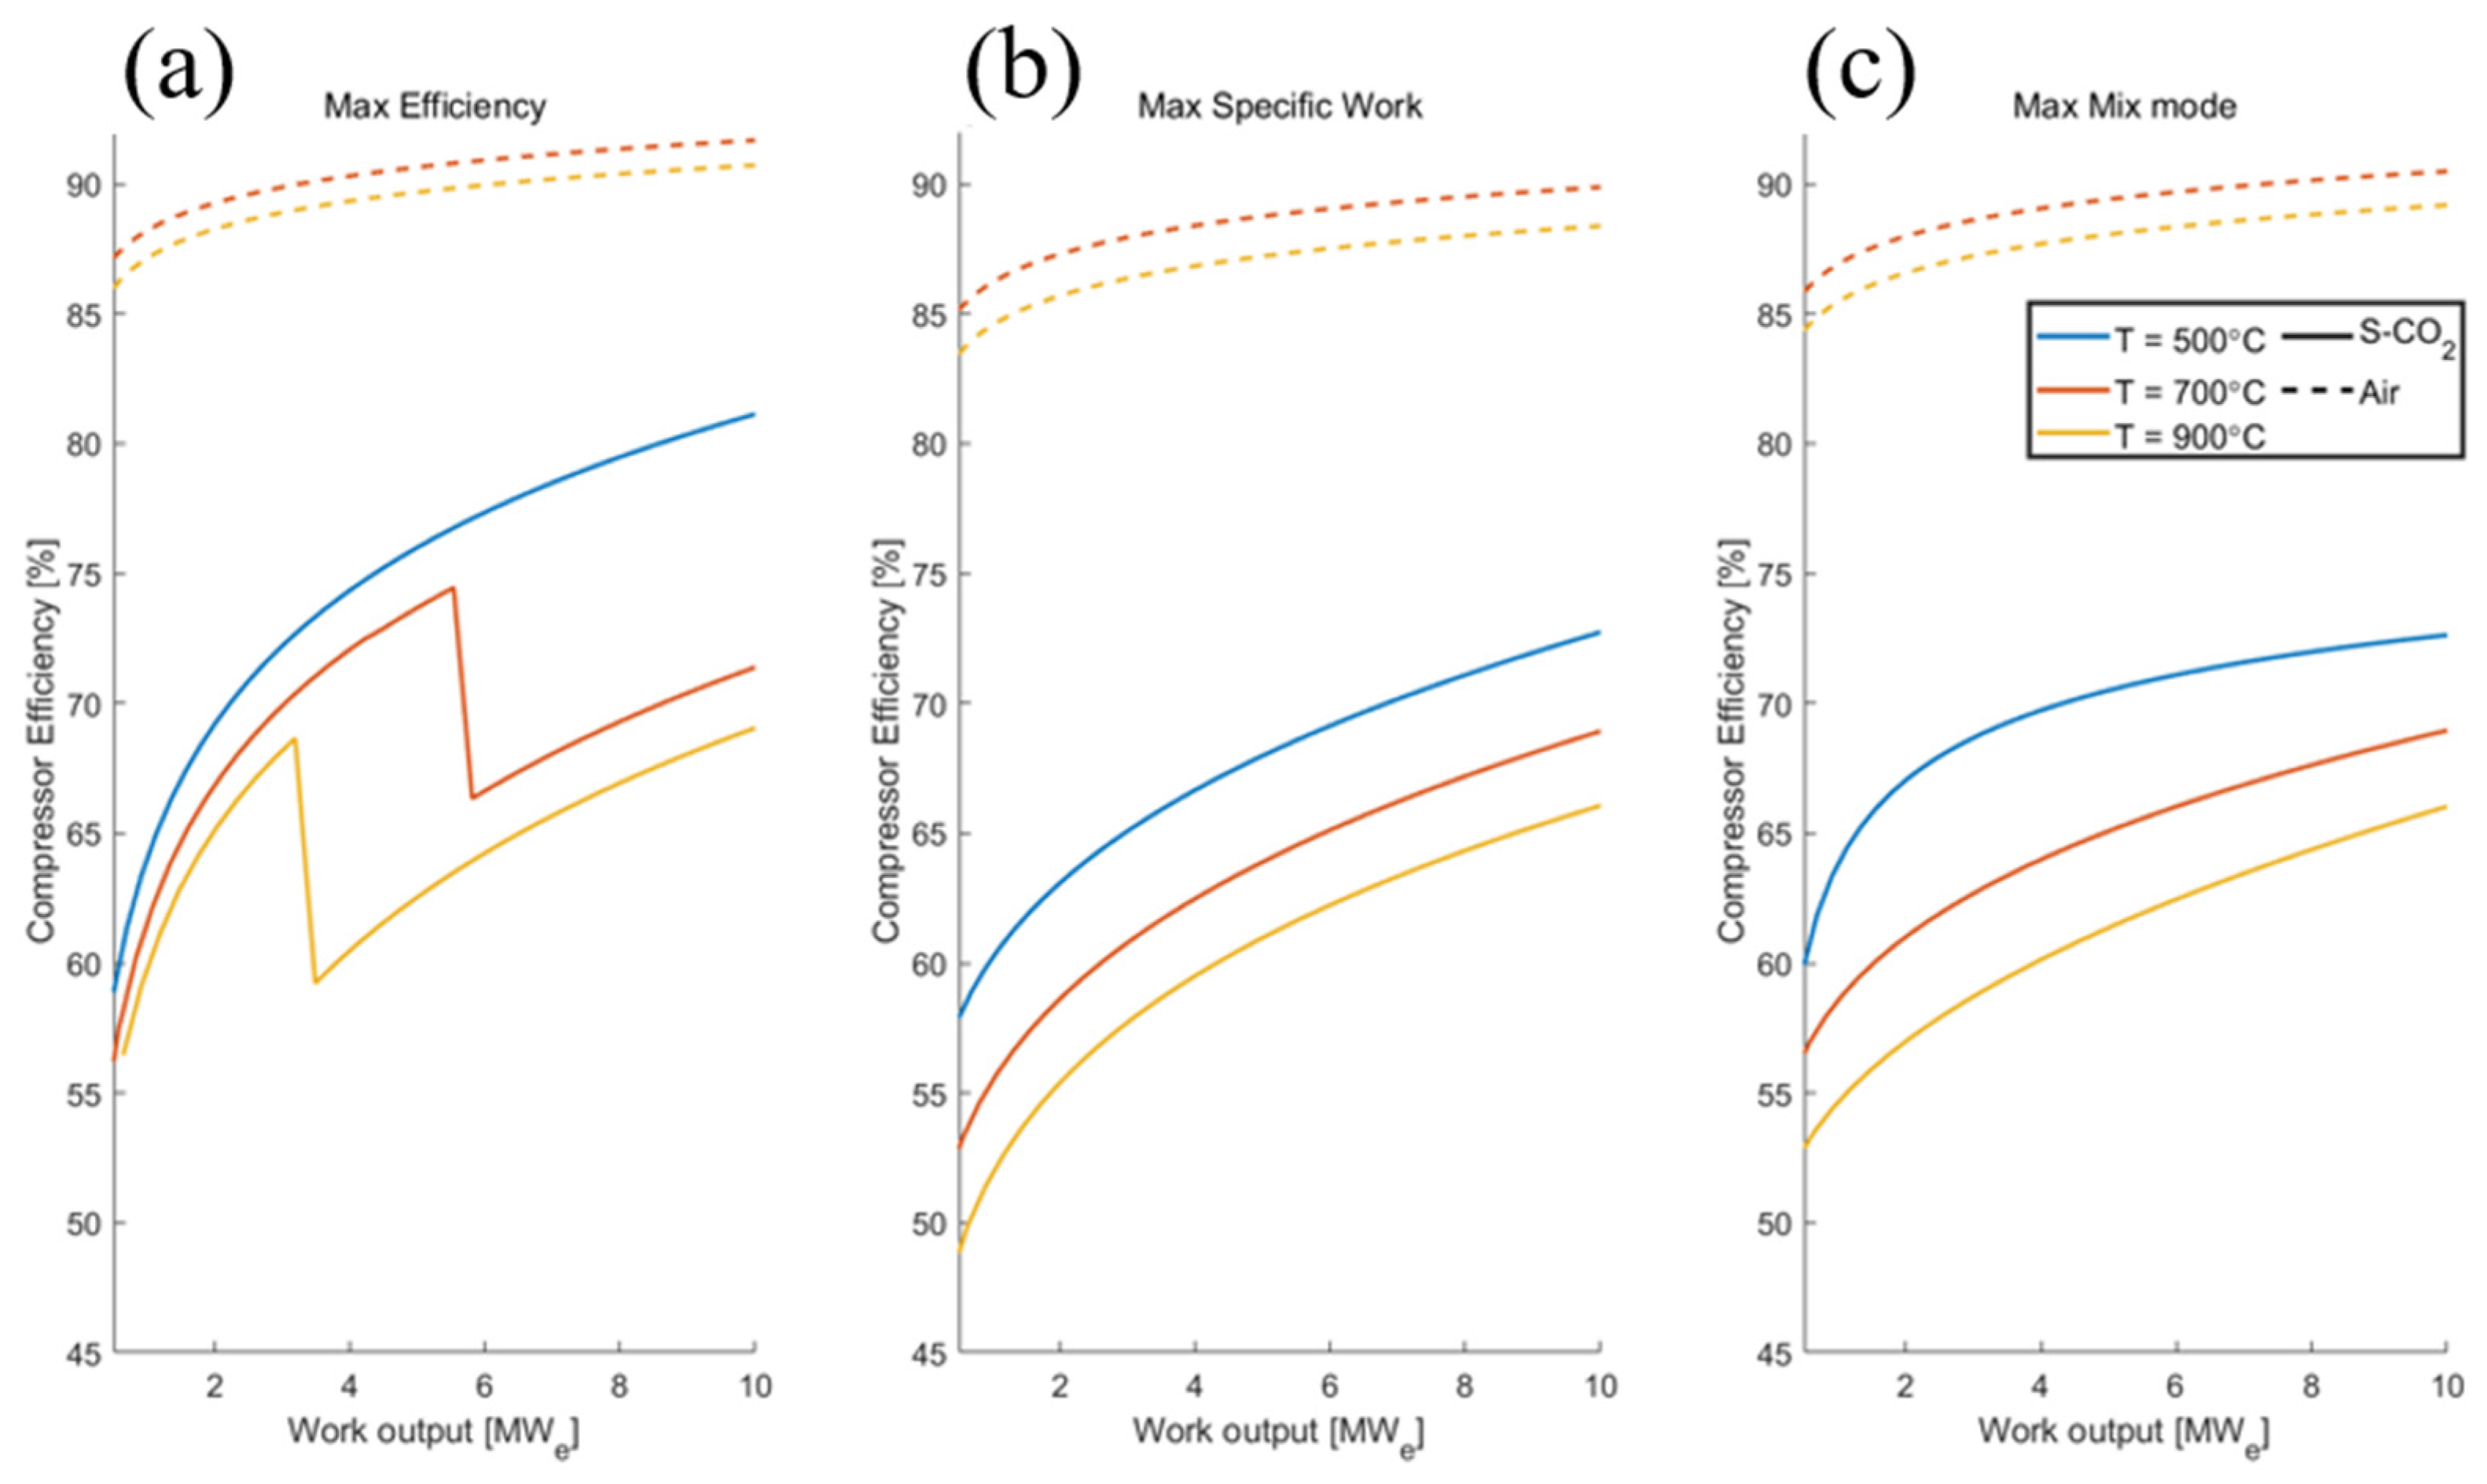
Figure 28, Figure 29 and Figure 30 compare the cycle efficiency and turbomachinery efficiencies of air and S-CO2 simple recuperated cycles. It is again noted that 500 °C TIT is not shown for the air Brayton cycle case, since the net work is negative for the low-TIT condition. Therefore, only the S-CO2 cycle is shown for the 500 °C TIT condition. For the maximum-efficiency mode, the air Brayton cycle had higher cycle efficiency than the S-CO2 Brayton cycle. As shown in Figure 30, the compressor efficiencies used in the air cycle were much higher than those used in the S-CO2 cycle. If Equation (6) is updated with more S-CO2 compressor data, the cycle efficiency with the maximum efficiency mode could be improved. Contrary to the maximum efficiency mode, the cycle efficiencies of the S-CO2 cycle with the maximum specific work mode have higher than those of the air Brayton cycle, which suggests that the S-CO2 cycle can generate more power per unit mass flow rate than the air Brayton cycle. For the maximum mix mode, both the cycle efficiency and the cycle specific work were considered during the optimization process. As Figure 28c represents, the cycle efficiency of the air Brayton cycle for the maximum mix mode was in between the cycle efficiency calculated using the maximum efficiency and the maximum specific work mode. However, for the S-CO2 cycle, the maximum mix mode preliminarily follows the maximum efficiency mode at the low power level and follows the maximum specific work mode at the high power levels. Therefore, when designing an S-CO2 power cycle for commercial application, optimizing with the cycle specific work is recommended, whereas the mix mode is recommended for the air Brayton cycle.

6. Conclusions

In this study, the comparative performance of the open-air and closed S-CO2 simple recuperated Brayton cycle were compared using the turbomachinery’s polytropic efficiency. For the open-air Brayton cycle, the polytropic efficiencies were calculated using Equations (4) and (5). However, the compressor polytropic efficiency calculated from the equation actually deviated from the S-CO2 compressor facility design values. Therefore, a new compressor polytropic equation was developed with the S-CO2 compressor experimental facility data as shown in Equation (6).
Using the modified KAIST CCD and OCD codes, the cycle performances were compared with three different optimization modes: maximum efficiency; maximum cycle specific work; and maximum mix mode, which considers both efficiency and specific work in the optimization process. The cycle efficiencies of the air Brayton cycle were higher for TIT above 700 °C than those of the S-CO2 Brayton cycle when the cycles were optimized for maximum efficiency. However, when the cycles were compared with the maximum cycle specific work optimization mode, the S-CO2 cycle outperformed the air cycle. Since the S-CO2 compressor efficiency was fitted with experimental data mostly obtained at lab scale, the S-CO2 compressor efficiency was generally lower than the air compressor efficiency.
The results also show that the air Brayton cycle can achieve near 45% efficiency when it can couple with a microreactor with a core outlet temperature higher than 700 °C. Nevertheless, since the reduction in compression work is quite substantial for the S-CO2 cycle, still it can perform better than the air cycle when specific work is maximized. For instance, the S-CO2 power cycle can still achieve above 30% efficiency when it is coupled with a microreactor with a core outlet temperature higher than 500 °C, while the air Brayton cycle cannot even reach breakeven condition. If more S-CO2 compressor experiment data become available, better cycle performance is also expected for the S-CO2 cycle with improved compressor performance prediction.
For the open-air Brayton cycle, the maximum mix mode allowed to obtain balanced cycle operating conditions, whereas the maximum mix mode actually followed the maximum specific work mode for the closed S-CO2 Brayton cycle for higher power output application. Therefore, the mix mode should be used when designing the air Brayton cycle to include the effect of both the maximum efficiency and specific work. On the other hand, for the S-CO2 cycle, the specific work should be maximized when the cycle is designed for commercial-scale high power output systems.

Author Contributions

Conceptualization, S.C. and J.I.L.; methodology, S.C.; software, I.W.S.; formal analysis, I.W.S.; writing—original draft preparation, S.C.; writing—review and editing, S.C. and J.I.L.; project administration, J.I.L. All authors have read and agreed to the published version of the manuscript.

Funding

This research received no external funding.

Acknowledgments

This research was supported by the Civil-Military Technology Cooperation Program (iCMTC) funded by the Agency for Defense Development—South Korea (17-CM-EN-04).

Conflicts of Interest

The authors declare no conflict of interest.

Nomenclature

SymbolDescriptionUnit
η Efficiency%
Δ h Enthalpy change J kg
m ˙ Mass Flow Rate kg s
P R Pressure Ratio-
d sh Rotor shroud Diametermm
n s Specific Speed-
d s Specific diameter-
T Temperature°C
P PressureMPa
γ Isentropic Coefficient-
nPolytropic Coefficient-
ZCompressibility Factor-
DRotor Diameterm
ω Rotational Speed s 1
VVolumetric Flow Rate m 3 s
gGravitational Acceleration m s 2
H a d Adiabatic Headm
Subscripts
PolyPolytropic-
SStage-
IsenIsentropic-
t, turbTurbine-
c, compCompressor-

Appendix A

For an ideal process,
P V γ = c o n s t .
P V = Z R T   V = Z R T P ,   w h e r e   Z = c o m p r e s s i b i l i t y   f a c t o r
P Z R T P γ = P 1 γ Z γ T γ = 1 γ ln P + γ ln Z + γ ln T = c o n s t .
Differentiating,
1 γ d P P + γ d Z Z + γ d T T = 0
Since Z = f P , T ,
d Z = Z T P d T + Z P T d P
γ 1 d P P + γ Z Z T P d T + Z P T d P + γ d T T = 0
γ d T T = γ 1 d P P γ Z Z T P d T + Z P T d P = γ 1 d P P γ Z Z T P d T γ Z   Z P T d P
d T = γ 1 γ T P d P T Z Z T P d T T Z   Z P T d P
1 + T Z Z T P d T = γ 1 γ T P T Z   Z P T d P
d T = γ 1 γ T P T Z   Z P T 1 + T Z Z T P d P = γ 1 γ 1 P 1 Z   Z P T 1 T + 1 Z Z T P   d P
Let d T = γ 1 γ 1 P 1 Z   Z P T 1 T + 1 Z Z T P   d P for the ideal process.
Similarly, for a polytropic process,
d T = n 1 n 1 P 1 Z   Z P T 1 T + 1 Z Z T P   d P
Converting turbine polytropic efficiency to the isentropic efficiency.
η P o l y , t u r b = P o l y t r o p i c   w o r k   o u t p u t I s e n t r o p i c   W o r k   o u t p u t = d h d h i d e a l = h T P d T + h P T d P h T P d T + h P T d P
η P o l y , t u r b = h T P n 1 n 1 P 1 Z   Z P T 1 T + 1 Z Z T P   d P + h P T d P h T P γ 1 γ 1 P 1 Z   Z P T 1 T + 1 Z Z T P   d P + h P T d P
η P o l y , t u r b h T P γ 1 γ 1 P 1 Z   Z P T 1 T + 1 Z Z T P + η P o l y , t u r b h P T = h T P n 1 n 1 P 1 Z   Z P T 1 T + 1 Z Z T P + h P T
η P o l y , t u r b h T P γ 1 γ 1 P 1 Z   Z P T 1 T + 1 Z Z T P + η P o l y , t u r b 1 h P T = h T P n 1 n 1 P 1 Z   Z P T 1 T + 1 Z Z T P
η P o l y , t u r b γ 1 γ 1 P 1 Z   Z P T 1 T + 1 Z Z T P   + η P o l y , t u r b 1 h P T h T P = n 1 n 1 P 1 Z   Z P T 1 T + 1 Z Z T P
η P o l y , t u r b γ 1 γ 1 P 1 Z   Z P T + η P o l y , t u r b 1 1 T + 1 Z Z T P h P T h T P = n 1 n 1 P 1 Z   Z P T
n 1 n = η P o l y , t u r b γ 1 γ P Z   Z P T + P η P o l y , t u r b 1 1 T + 1 Z Z T P h P T h T P + P Z   Z P T
n 1 n = η P o l y , t u r b γ 1 γ η P o l y , t u r b P Z   Z P T + P Z   Z P T + P η P o l y , t u r b 1 1 T + 1 Z Z T P h P T h T P
n 1 n = η P o l y , t u r b γ 1 γ + 1 η P o l y , t u r b P Z Z P T + P η P o l y , t u r b 1 1 T + 1 Z Z T P h P T h T P
n 1 n = η P o l y , t u r b γ 1 γ + 1 η P o l y , t u r b P Z Z P T P 1 η P o l y , t u r b 1 T + 1 Z Z T P h P T h T P
n 1 n = η P o l y , t u r b γ 1 γ + P Z Z P T P 1 T + 1 Z Z T P h P T h T P 1 η P o l y , t u r b
n 1 n = η P o l y , t u r b γ 1 γ + 1 P β T P β P h P T h T P 1 η P o l y , t u r b
where
β P = 1 T + 1 Z Z T P   a n d   β T = 1 P 1 Z Z P T
Converting compressor polytropic efficiency to the isentropic efficiency.
η P o l y , c o m p = I s e n t r o p i c   w o r k   o u t p u t P o l y t r o p i c   W o r k   o u t p u t = d h i d e a l d h = h T P d T + h P T d P   h T P d T + h P T d P
η P o l y , c o m p = h T P γ 1 γ 1 P 1 Z   Z P T 1 T + 1 Z Z T P   d P + h P T d P   h T P n 1 n 1 P 1 Z   Z P T 1 T + 1 Z Z T P   d P + h P T d P
η P o l y , c o m p h T P n 1 n 1 P 1 Z   Z P T 1 T + 1 Z Z T P   + η P o l y , c o m p h P T = h T P γ 1 γ 1 P 1 Z   Z P T 1 T + 1 Z Z T P + h P T
η P o l y , c o m p h T P n 1 n 1 P 1 Z   Z P T 1 T + 1 Z Z T P   + η P o l y , c o m p h P T h P T = h T P γ 1 γ 1 P 1 Z   Z P T 1 T + 1 Z Z T P
η P o l y , c o m p h T P n 1 n 1 P 1 Z   Z P T 1 T + 1 Z Z T P   + η P o l y , c o m p 1 h P T = h T P γ 1 γ 1 P 1 Z   Z P T 1 T + 1 Z Z T P
η P o l y , c o m p h T P n 1 n 1 P 1 Z   Z P T 1 T + 1 Z Z T P   = h T P γ 1 γ 1 P 1 Z   Z P T 1 T + 1 Z Z T P η P o l y , c o m p 1 h P T
n 1 n 1 P 1 Z   Z P T = 1 η P o l y , c o m p γ 1 γ 1 P 1 Z   Z P T η P o l y , c o m p 1 η P o l y , c o m p 1 T + 1 Z Z T P h P T h T P
n 1 n 1 P = 1 η P o l y , c o m p γ 1 γ 1 P + 1 Z   Z P T 1 η P o l y , c o m p 1 Z   Z P T η P o l y , c o m p 1 η P o l y , c o m p 1 T + 1 Z Z T P h P T h T P
n 1 n = 1 η P o l y , c o m p γ 1 γ + P Z   Z P T 1 η P o l y , c o m p P Z   Z P T η P o l y , c o m p 1 η P o l y , c o m p P 1 T + 1 Z Z T P h P T h T P
n 1 n = 1 η P o l y , c o m p γ 1 γ + 1 1 η P o l y , c o m p P Z Z P T 1 1 η P o l y , c o m p P 1 T + 1 Z Z T P h P T h T P
n 1 n = 1 η P o l y , c o m p γ 1 γ + P 1 1 η P o l y , c o m p 1 Z Z P T 1 T + 1 Z Z T P h P T h T P
β P = 1 T + 1 Z Z T P   a n d   β T = 1 P 1 Z Z P T
where
n 1 n = 1 η P o l y , c o m p γ 1 γ + P 1 1 η P o l y , c o m p 1 P β T β P h P T h T P

References

  1. Fleming, D.; Holschuh, T.; Conboy, T.; Rochau, G.; Fuller, R. Scaling Considerations for a Multi-Megawatt Class Supercritical CO2 Brayton Cycle and Path Forward for Commercialization. In Turbo Expo: Power for Land, Sea, and Air; American Society of Mechanical Engineers: New York, NY, USA, 2012; Volume 44717. [Google Scholar] [CrossRef]
  2. Testoni, R.; Bersano, A.; Segantin, S. Review of nuclear microreactors: Status, potentialities and challenges. Prog. Nucl. Energy 2021, 138, 103822. [Google Scholar] [CrossRef]
  3. Swartz, M.M.; Byers, W.A.; Lojek, J.; Blunt, R. Westinghouse eVinci™ Heat Pipe Micro Reactor Technology Development. In International Conference on Nuclear Engineering; American Society of Mechanical Engineers: New York, NY, USA, 2021; Volume 85246. [Google Scholar] [CrossRef]
  4. Xu, J.; Liu, C.; Sun, E.; Xie, J.; Li, M.; Yang, Y.; Liu, J. Perspective of S−CO2 power cycles. Energy 2019, 186, 115831. [Google Scholar] [CrossRef]
  5. Rogalev, N.; Rogalev, A.; Kindra, V.; Zlyvko, O.; Bryzgunov, P. Review of Closed SCO2 and Semi-Closed Oxy–Fuel Combustion Power Cycles for Multi-Scale Power Generation in Terms of Energy, Ecology and Economic Efficiency. Energies 2022, 15, 9226. [Google Scholar] [CrossRef]
  6. Rogalev, N.; Rogalev, A.; Kindra, V.; Komarov, I.; Zlyvko, O. Structural and Parametric Optimization of S–CO2 Nuclear Power Plants. Entropy 2021, 23, 1079. [Google Scholar] [CrossRef] [PubMed]
  7. Persichilli, M.; Kacludis, A.; Zdankiewicz, E.; Held, T. Supercritical CO2 Power Cycle Developments and Commercialization: Why sCO2 can Displace Steam Ste; Power-Gen India & Central Asia: New Delhi, India, 2012; pp. 19–21. [Google Scholar]
  8. Dostal, V.; Driscoll, M.; Hejzlar, P. A Supercritical Carbon Dioxide Cycle for Next Generation Nuclear Reactor; Massachusetts Institute of Technology: Cambridge, MA, USA, 2004; Volume MIT-ANP-TR-100. [Google Scholar]
  9. Buongiorno, J.; Carmichael, B.; Dunkin, B.; Parsons, J.; Smit, D. Can Nuclear Batteries Be Economically Competitive in Large Markets? Energies 2021, 14, 4385. [Google Scholar] [CrossRef]
  10. Dimitrakopoulos, P. A Generalized Method for the Comparable and Rigorous Calculation of the Polytropic Efficiencies of Turbocompressors. Int. J. Turbo Jet-Engines 2018, 35, 35–47. [Google Scholar] [CrossRef]
  11. Atkins, A.G.; Atkins, T.; Escudier, M. A Dictionary of Mechanical Engineering; Oxford University Press: Oxford, UK, 2013. [Google Scholar]
  12. Pandey, V.; Kumar, P.; Dutta, P. Thermo-hydraulic analysis of compact heat exchanger for a simple recuperated sCO2 Brayton cycle. Renew. Sustain. Energy Rev. 2020, 134, 110091. [Google Scholar] [CrossRef]
  13. Marion, J.; Lariviere, B.; McClung, A.; Mortzheim, J. The STEP 10 MWe CO2 Pilot Demonstration Status Update. In Turbo Expo: Power for Land, Sea, and Air; American Society of Mechanical Engineers: New York, NY, USA, 2021; Volume 85048. [Google Scholar]
  14. Cha, J.E.; Bae, S.W.; Lee, J.; Cho, S.K.; Lee, J.I.; Park, J.H. Operation results of a closed supercritical CO2 simple Brayton cycle. In Proceedings of the 5th International Symposium-Supercritical CO2 Power Cycles, San Antonio, TX, USA, 28–31 March 2016. [Google Scholar]
  15. Wright, S.A.; Radel, R.F.; Vernon, M.E.; Pickard, P.S.; Rochau, G.E. Operation and Analysis of a Supercritical CO2 Brayton Cycle; No. SAND2010-0171; Sandia National Laboratories (SNL): Albuquerque, NM, USA; Livermore, CA, USA, 2010. [CrossRef] [Green Version]
  16. Ahn, Y.; Bae, S.J.; Kim, M.; Cho, S.K.; Baik, S.; Lee, J.I.; Cha, J.E. Review of supercritical CO2 power cycle technology and current status of research and development. Nucl. Eng. Technol. 2015, 47, 647–661. [Google Scholar] [CrossRef] [Green Version]
  17. Guillen, D.; McDaniel, P. An evaluation of power conversion systems for land-based nuclear microreactors: Can aeroderivative engines facilitate near-term deployment? Nucl. Eng. Technol. 2022, 54, 1482–1494. [Google Scholar] [CrossRef]
  18. Litrel, J.; Guillen, D.; McKellar, M. Evaluation of Organic Rankine Cycles in an Air-Brayton Combined Cycle for Microreactor Applications; No. INL/CON-18-45753-Rev000; Idaho National Lab. (INL): Idaho Falls, ID, USA, 2018.
  19. Lee, G.T.; Sudhoff, F.A. Fuel Cell/Gas Turbine System Performance Studies; No. DOE/METC/C-97/7278; CONF-9608152-3; USDOE Morgantown Energy Technology Center (METC): Morgantown, WV, USA, 1996.
  20. Sterbentz, J.W.; Werner, J.E.; McKellar, M.G.; Hummel, A.J.; Kennedy, J.C.; Wright, R.N.; Biersdorf, J.M. Special Purpose Nuclear Reactor (5 MW) for Reliable Power at Remote Sites Assessment Report; No. INL/EXT-16-40741; Idaho National Lab. (INL): Idaho Falls, ID, USA, 2017. [CrossRef]
  21. Wilson, D.G.; Korakianitis, T. The Design of High-Efficiency Turbomachinery and Gas Turbines; MIT Press: Cambridge, MA, USA, 2014. [Google Scholar] [CrossRef] [Green Version]
  22. Lee, J.; Kim, S.G.; Cha, J.E.; Lee, J.I. Uncertainty on performance measurement of S-CO2 compressor operating near the critical point. In Proceedings of the 4th International Supercritical CO2 Power Cycles, Pittsburgh, PA, USA, 9–10 September 2014. [Google Scholar]
  23. Clementoni, E.M.; Cox, T.L.; Sprague, C.P. Startup and Operation of a Supercritical Carbon Dioxide Brayton Cycle. J. Eng. Gas Turbines Power 2014, 136, 071701. [Google Scholar] [CrossRef]
  24. Kimball, K.J.; Clementoni, E.M. Supercritical Carbon Dioxide Brayton Power Cycle Development Overview. In Turbo Expo: Power for Land, Sea, and Air; American Society of Mechanical Engineers: New York, NY, USA, 2012; Volume 44717. [Google Scholar] [CrossRef]
  25. Cho, S.K.; Son, S.; Lee, J.; Lee, S.-W.; Jeong, Y.; Oh, B.S.; Lee, J.I. Optimum loss models for performance prediction of supercritical CO2 centrifugal compressor. Appl. Therm. Eng. 2021, 184, 116255. [Google Scholar] [CrossRef]
  26. White, M.T.; Bianchi, G.; Chai, L.; Tassou, S.A.; Sayma, A.I. Review of supercritical CO2 technologies and systems for power generation. Appl. Therm. Eng. 2021, 185, 116447. [Google Scholar] [CrossRef]
  27. Cameron, A.C.; Windmeijer, F.A.G. An R-squared measure of goodness of fit for some common nonlinear regression models. J. Econ. 1997, 77, 329–342. [Google Scholar] [CrossRef]
  28. Son, I.W.; Jeong, Y.H.; Choi, Y.J.; Lee, J.I. Feasibility study of solar-nuclear hybrid system for distributed power source. Energy Convers. Manag. 2021, 230, 113808. [Google Scholar] [CrossRef]
  29. Son, I.W.; Choi, S.; Kimb, S.J.; Leea, J.I. Thermal-Sizing of the Molten Salt Reactor System with Gas Brayton Cycle. System 2021, 12, 14. [Google Scholar]
  30. Lemmon, E.; Huber, M.L.; Mclinden, M.O. NIST Standard Reference Database 23: Reference Fluid Thermodynamic and Transport Properties-REFPROP, Version 8.0; National Institute of Standards and Technology: Gaithersburg, MD, USA, 2007.
  31. Son, S.; Heo, J.Y.; Lee, J.I. Prediction of inner pinch for supercritical CO2 heat exchanger using Artificial Neural Network and evaluation of its impact on cycle design. Energy Convers. Manag. 2018, 163, 66–73. [Google Scholar] [CrossRef]
  32. Baljé, O.E. A Study on Design Criteria and Matching of Turbomachines: Part A—Similarity Relations and Design Criteria of Turbines. J. Eng. Power 1962, 84, 83–102. [Google Scholar] [CrossRef]
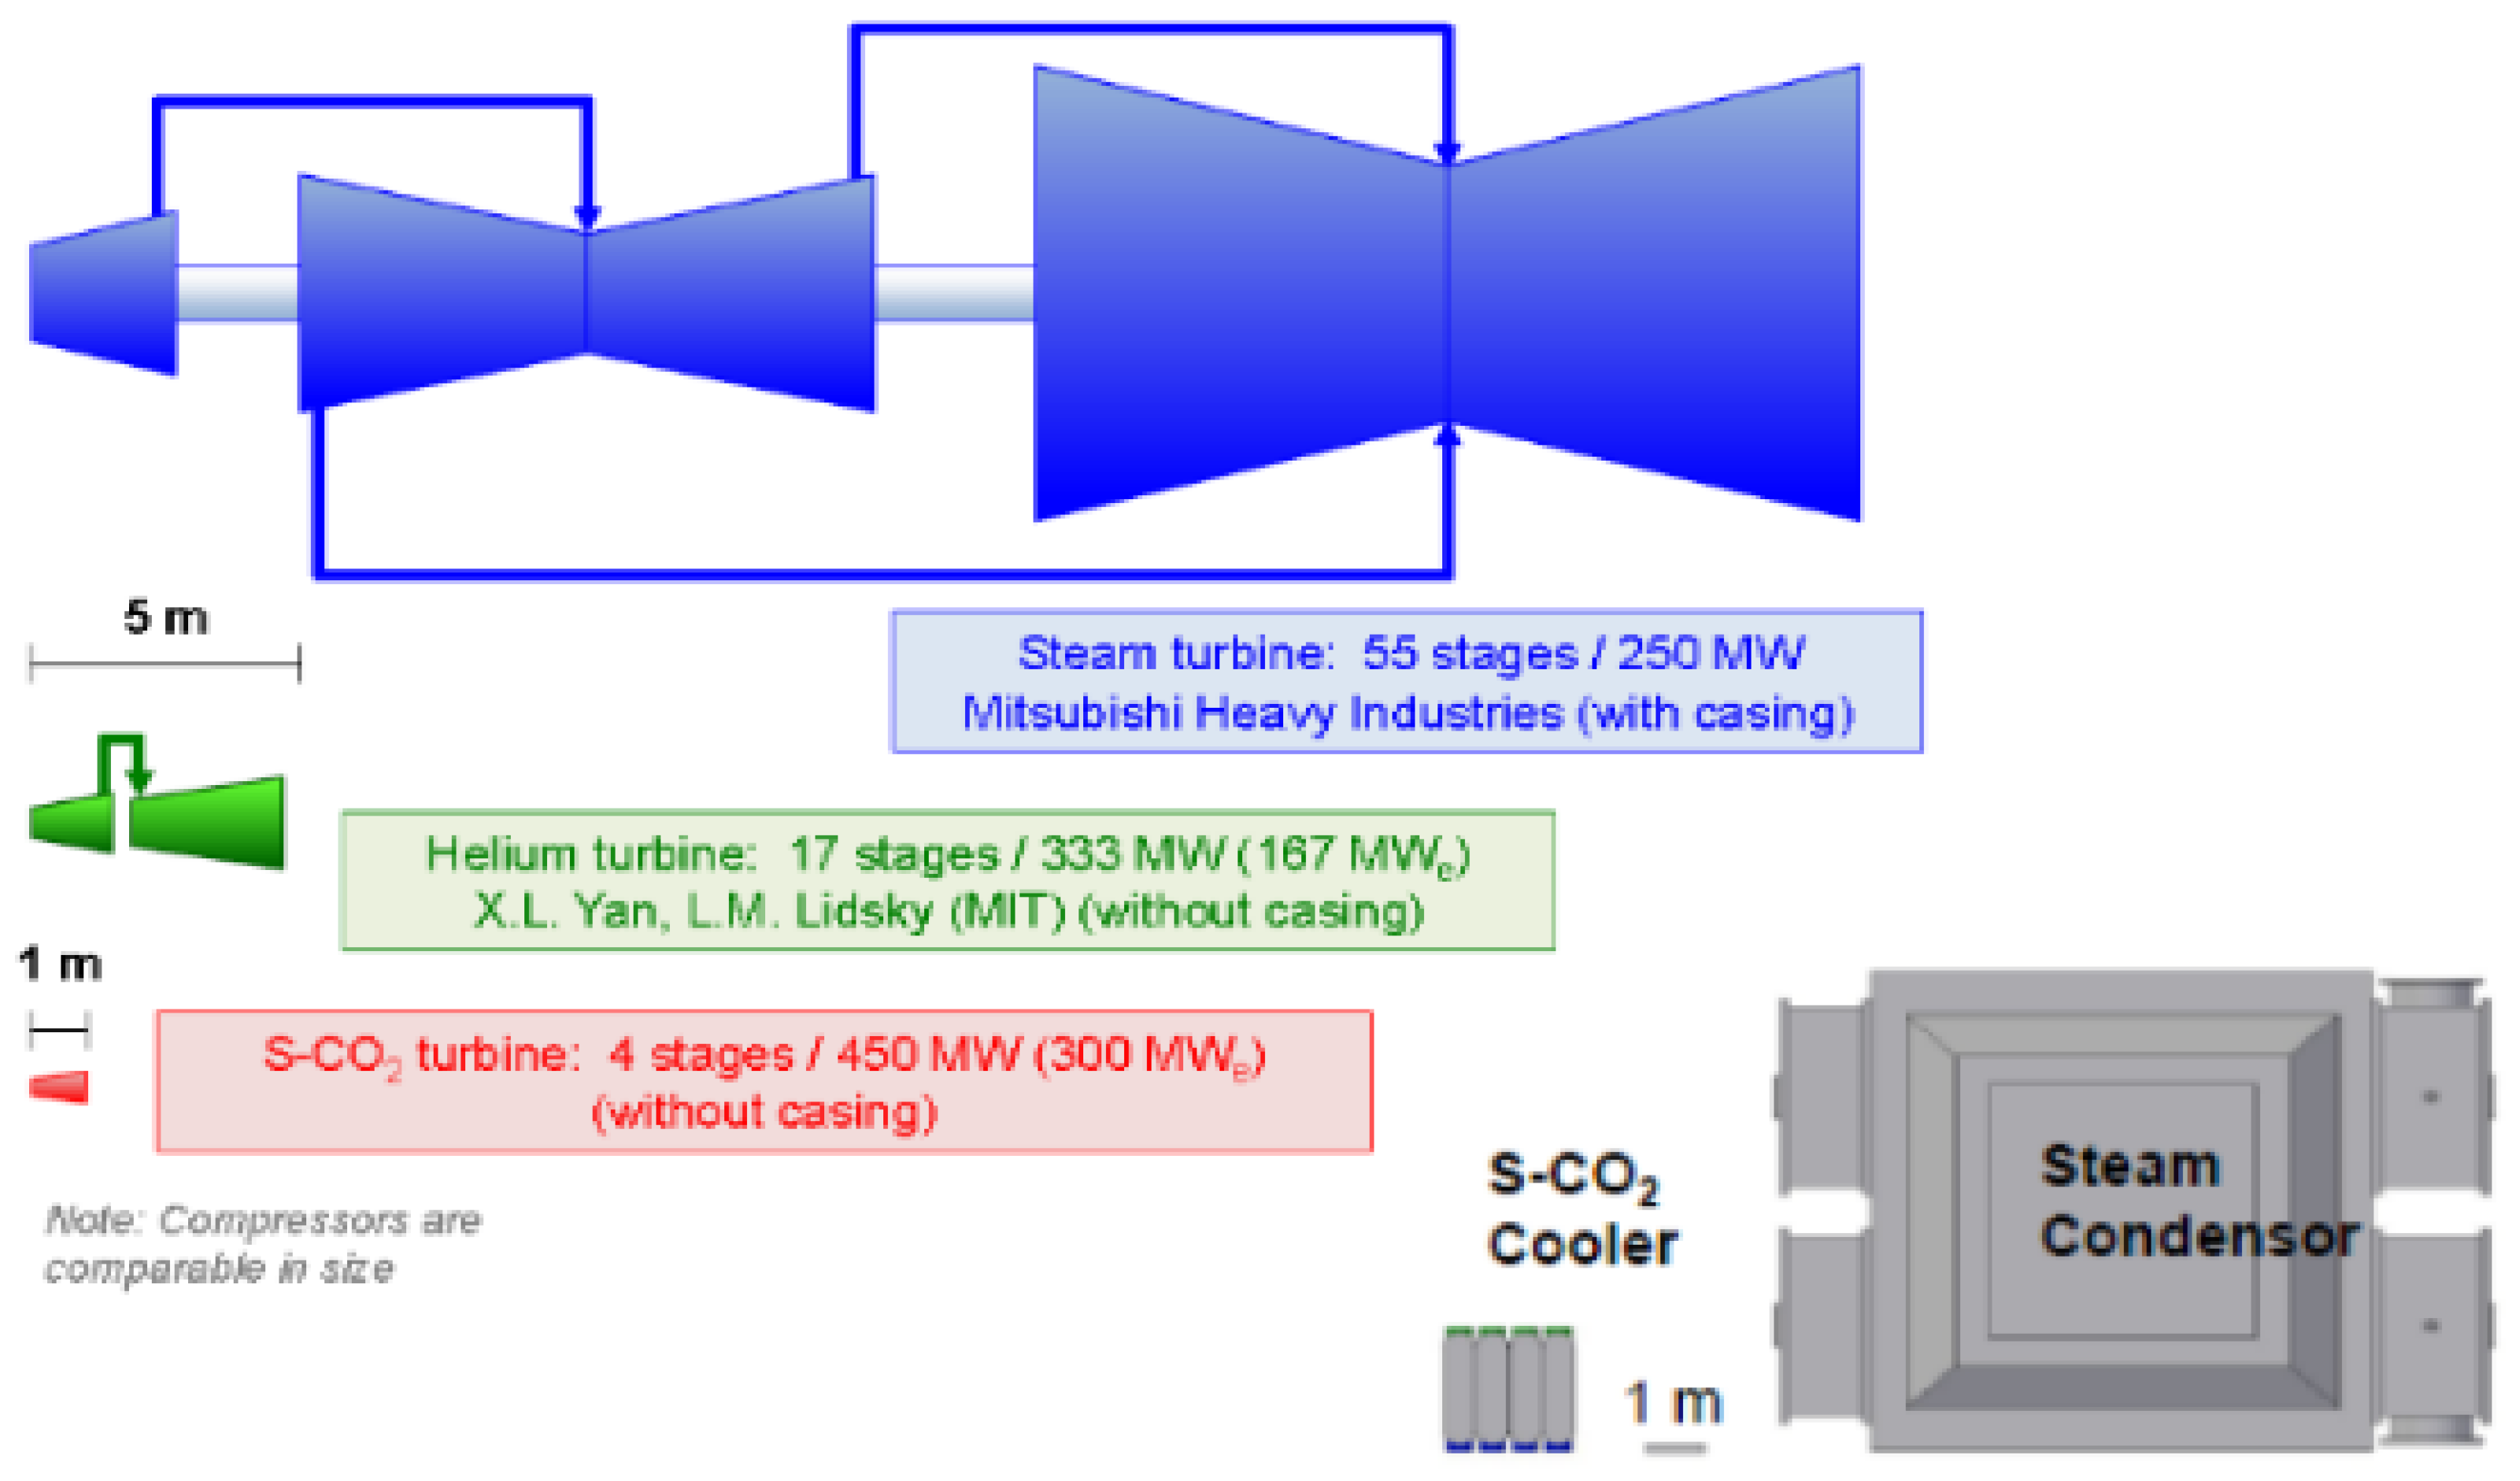
Figure 1. Turbine and Cooler Size comparison for Gas Brayton and steam Rankine cycle.
Energies 16 02065 g001
Figure 2. Cycle layout for (a) open-air Brayton and (b) closed S-CO2 Brayton cycle.
Energies 16 02065 g002
Figure 3. Definition of polytropic efficiency.
Energies 16 02065 g003
Figure 4. Compressor Polytropic Efficiency calculated using Equation (4).
Energies 16 02065 g004
Figure 5. Turbine Polytropic Efficiency calculated using Equation (5).
Energies 16 02065 g005
Figure 6. CO2 Thermal Properties: (a) near critical point and (b) near turbine operating condition.
Energies 16 02065 g006aEnergies 16 02065 g006b
Figure 7. Comparison of compressor polytropic efficiency with S-CO2 compressor experimental facility.
Energies 16 02065 g007
Figure 8. Comparison of turbine polytropic efficiency with S-CO2 compressor experimental facility.
Energies 16 02065 g008
Figure 9. Comparison for new S-CO2 compressor polytropic efficiency equation.
Energies 16 02065 g009
Figure 10. Flowchart for (a) KAIST-CCD and (b) KAIST-OCD.
Energies 16 02065 g010
Figure 11. KAIST-CCD Optimization Result for S-CO2 Brayton Cycle.
Energies 16 02065 g011
Figure 12. KAIST-OCD Optimization Result for Open-air Brayton Cycle.
Energies 16 02065 g012
Figure 13. Flowchart for the cycle optimization.
Energies 16 02065 g013
Figure 14. Isentropic efficiency of turbine and compressor of open-air Brayton Cycle.
Energies 16 02065 g014
Figure 15. (a) Cycle Efficiency, (b) Cycle Specific Work, and (c) the mix mode along the turbine pressure ratio of open-air Brayton cycle.
Energies 16 02065 g015
Figure 16. Cycle Efficiency along the cycle Specific Work of open-air Brayton cycle.
Energies 16 02065 g016
Figure 17. (a) Cycle efficiency and (b) cycle mass flow rate of open-air Brayton Cycle.
Energies 16 02065 g017
Figure 18. (a) Compressor and (b) Turbine isentropic efficiency of open-air Brayton Cycle.
Energies 16 02065 g018
Figure 19. (a) Turbine rotor diameter and (b) turbomachinery rotational speed of open-air Brayton Cycle.
Energies 16 02065 g019
Figure 20. Isentropic efficiency of turbine and compressor of S-CO2 Brayton cycle.
Energies 16 02065 g020
Figure 21. (a) Cycle Efficiency, (b) Cycle Specific Work, and (c) the mix mode along the turbine pressure ratio of S-CO2 Brayton cycle.
Energies 16 02065 g021
Figure 22. Cycle Efficiency along the cycle Specific Work of S-CO2 Brayton cycle.
Energies 16 02065 g022
Figure 23. (a) Cycle efficiency and (b) cycle mass flow rate of S-CO2 Brayton Cycle.
Energies 16 02065 g023
Figure 24. Compressor Isentropic Efficiency of S-CO2 Brayton cycle for (a) max efficiency, (b) max specific work and (c) max mix mode.
Energies 16 02065 g024
Figure 25. (a) Turbine isentropic efficiency, (b) Turbine rotor diameter, and (c) Rotational speed of S-CO2 Brayton cycle.
Energies 16 02065 g025
Figure 26. Optimized point at different power level.
Energies 16 02065 g026
Figure 27. Cycle Efficiency along the cycle Specific Work at low and high power levels.
Energies 16 02065 g027
Figure 28. Cycle Efficiency for (a) maximum efficiency, (b) maximum specific work, and (c) maximum mix mode.
Energies 16 02065 g028
Figure 29. Turbine Efficiency for (a) maximum efficiency, (b) maximum specific work, and (c) maximum mix mode.
Energies 16 02065 g029
Figure 30. Compressor Efficiency for (a) maximum efficiency, (b) maximum specific work, and (c) maximum mix mode.
Energies 16 02065 g030
Table 1. Design Value for S-CO2 Brayton Cycle.
Design ParameterValue
Maximum Pressure20 MPa
Maximum Temperature500, 700, 900 °C
Minimum Temperature35 °C
IHX Pressure Drop2.01%
Recuperator Hot-side Pressure Drop1.71%
Recuperator Cold-side Pressure Drop0.5%
Cooler Pressure Drop2.39%
Table 2. Design Value for air Brayton Cycle.
Design ParameterValue
Minimum Pressure101.325 kPa
Maximum Temperature700, 900 °C
Minimum Temperature35 °C
IHX Pressure Drop4.00%
Recuperator Hot-side Pressure Drop2.00%
Recuperator Cold-side Pressure Drop2.00%
Disclaimer/Publisher’s Note: The statements, opinions and data contained in all publications are solely those of the individual author(s) and contributor(s) and not of MDPI and/or the editor(s). MDPI and/or the editor(s) disclaim responsibility for any injury to people or property resulting from any ideas, methods, instructions or products referred to in the content.