
CO2 Emissions—Evidence from Internal Combustion and Electric Engine Vehicles from Car-Sharing Systems


(This article belongs to the Section E: Electric Vehicles)
Abstract
1. Introduction
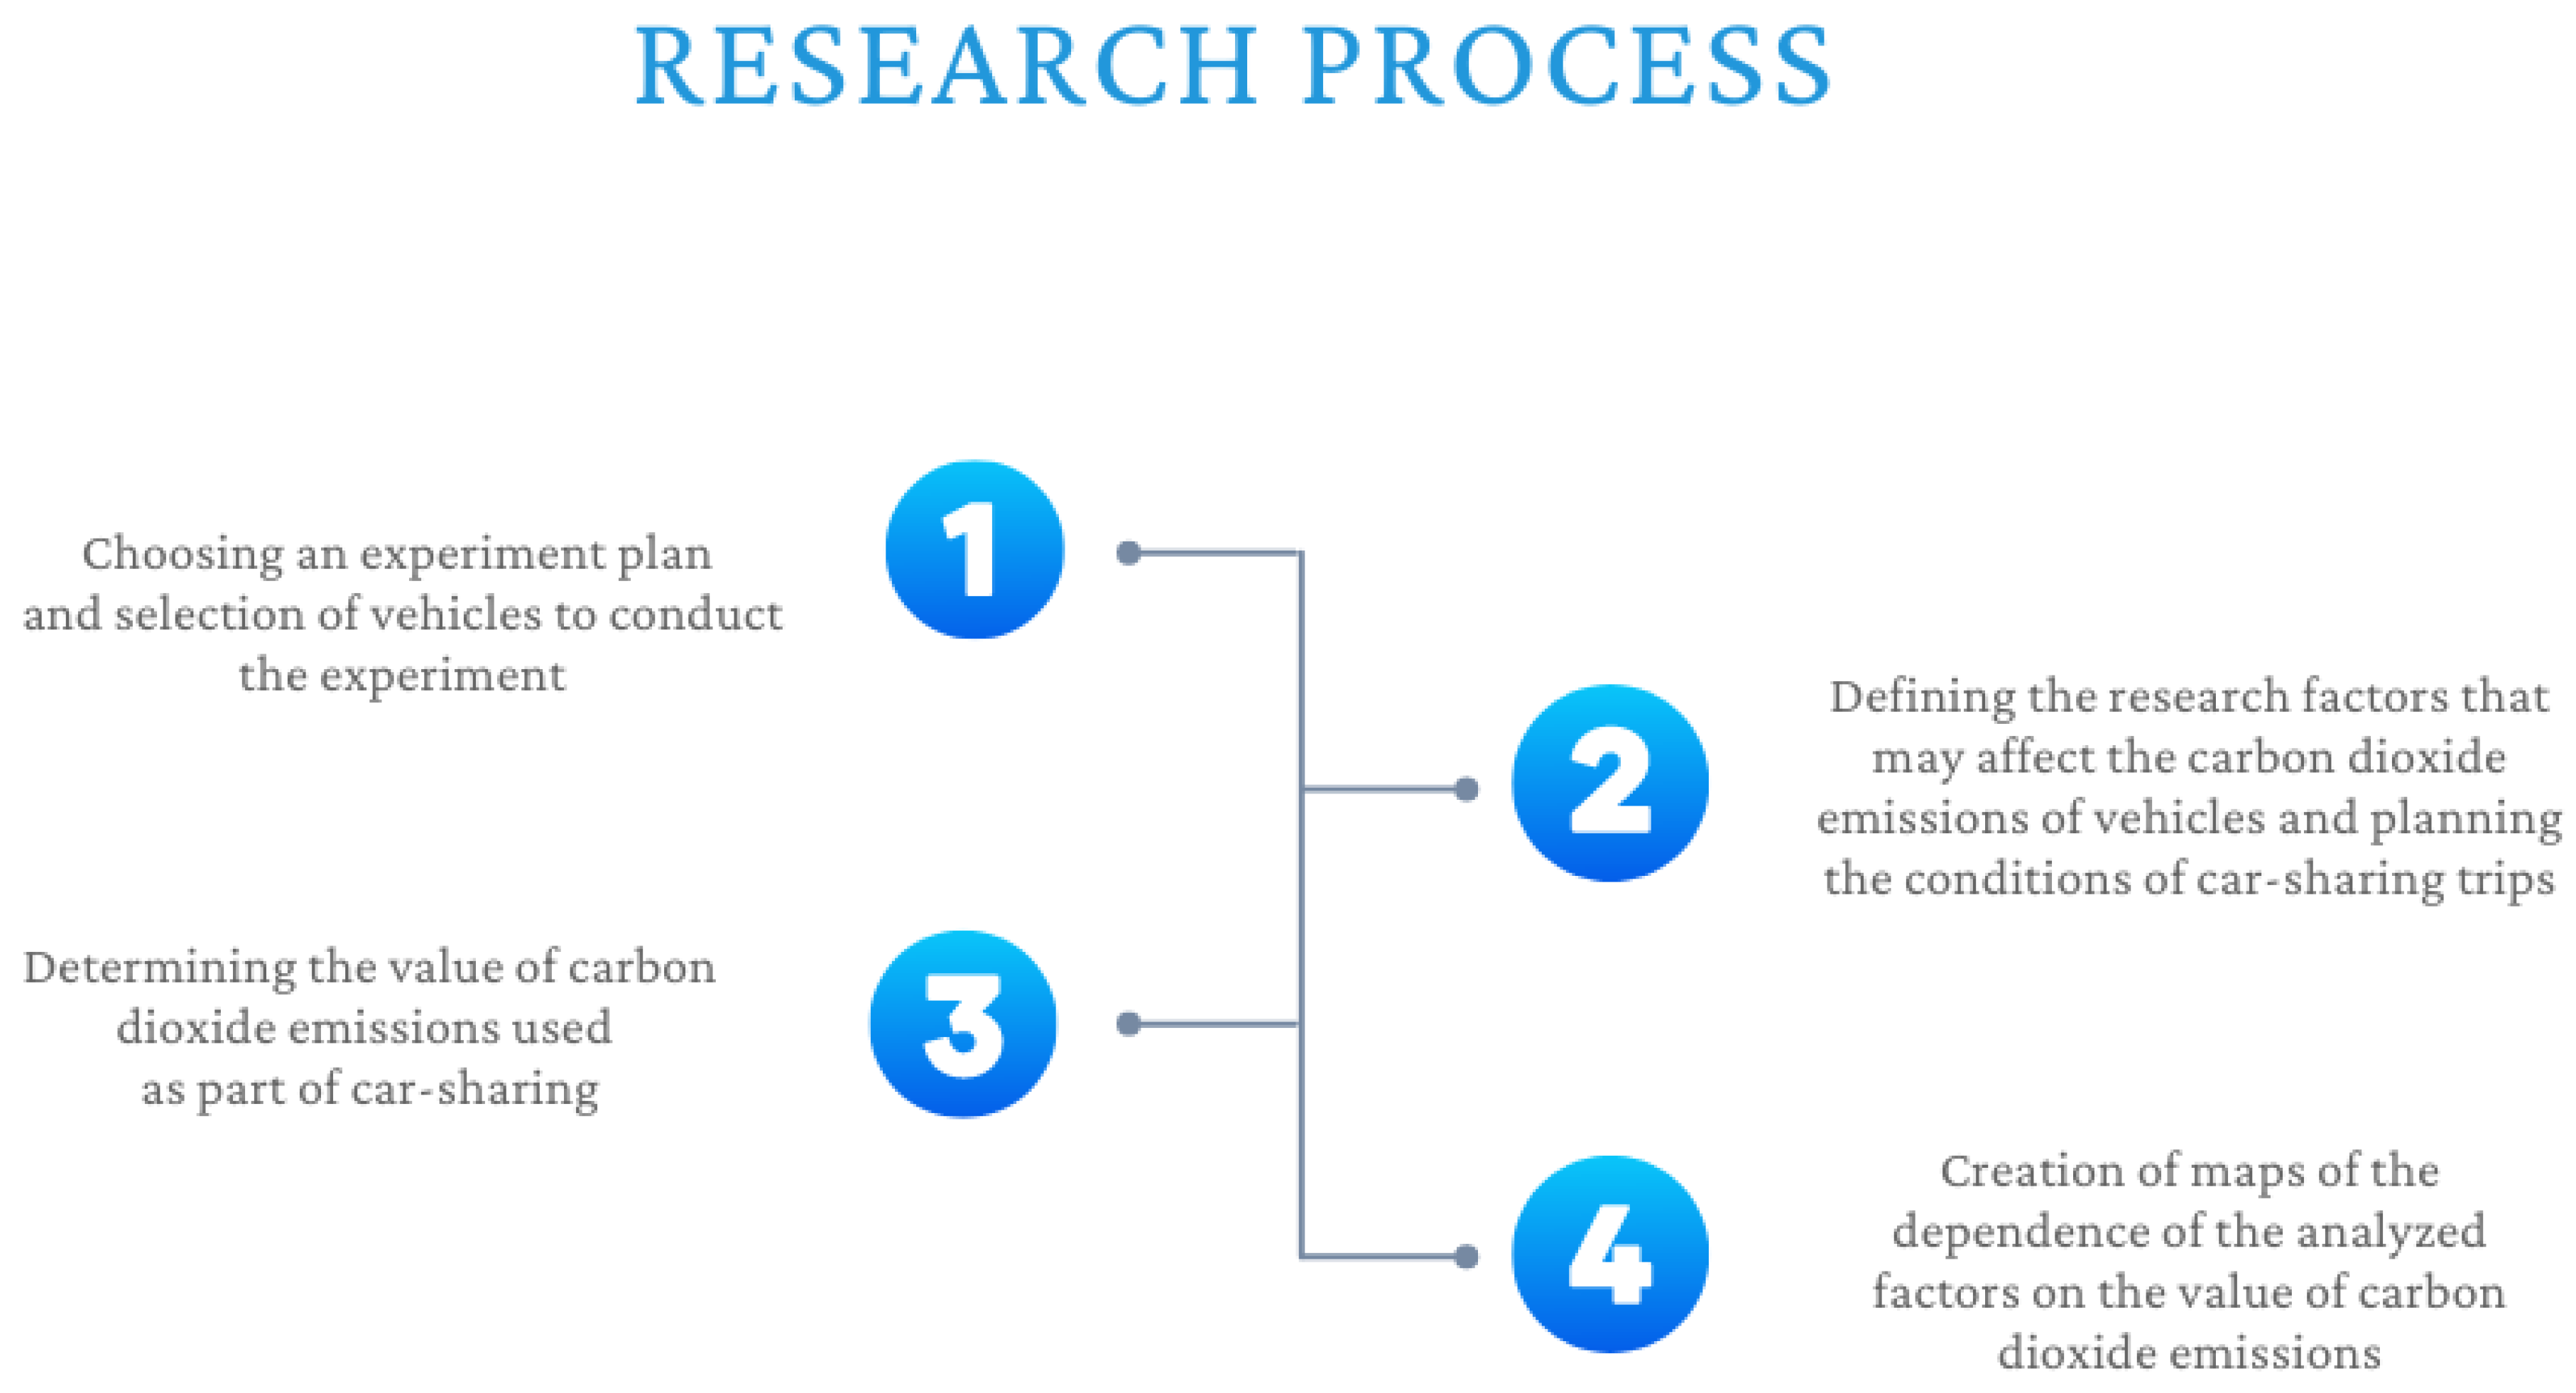
2. Methodology
3. Results
3.1. Road Test Results for a Vehicle with an ICE
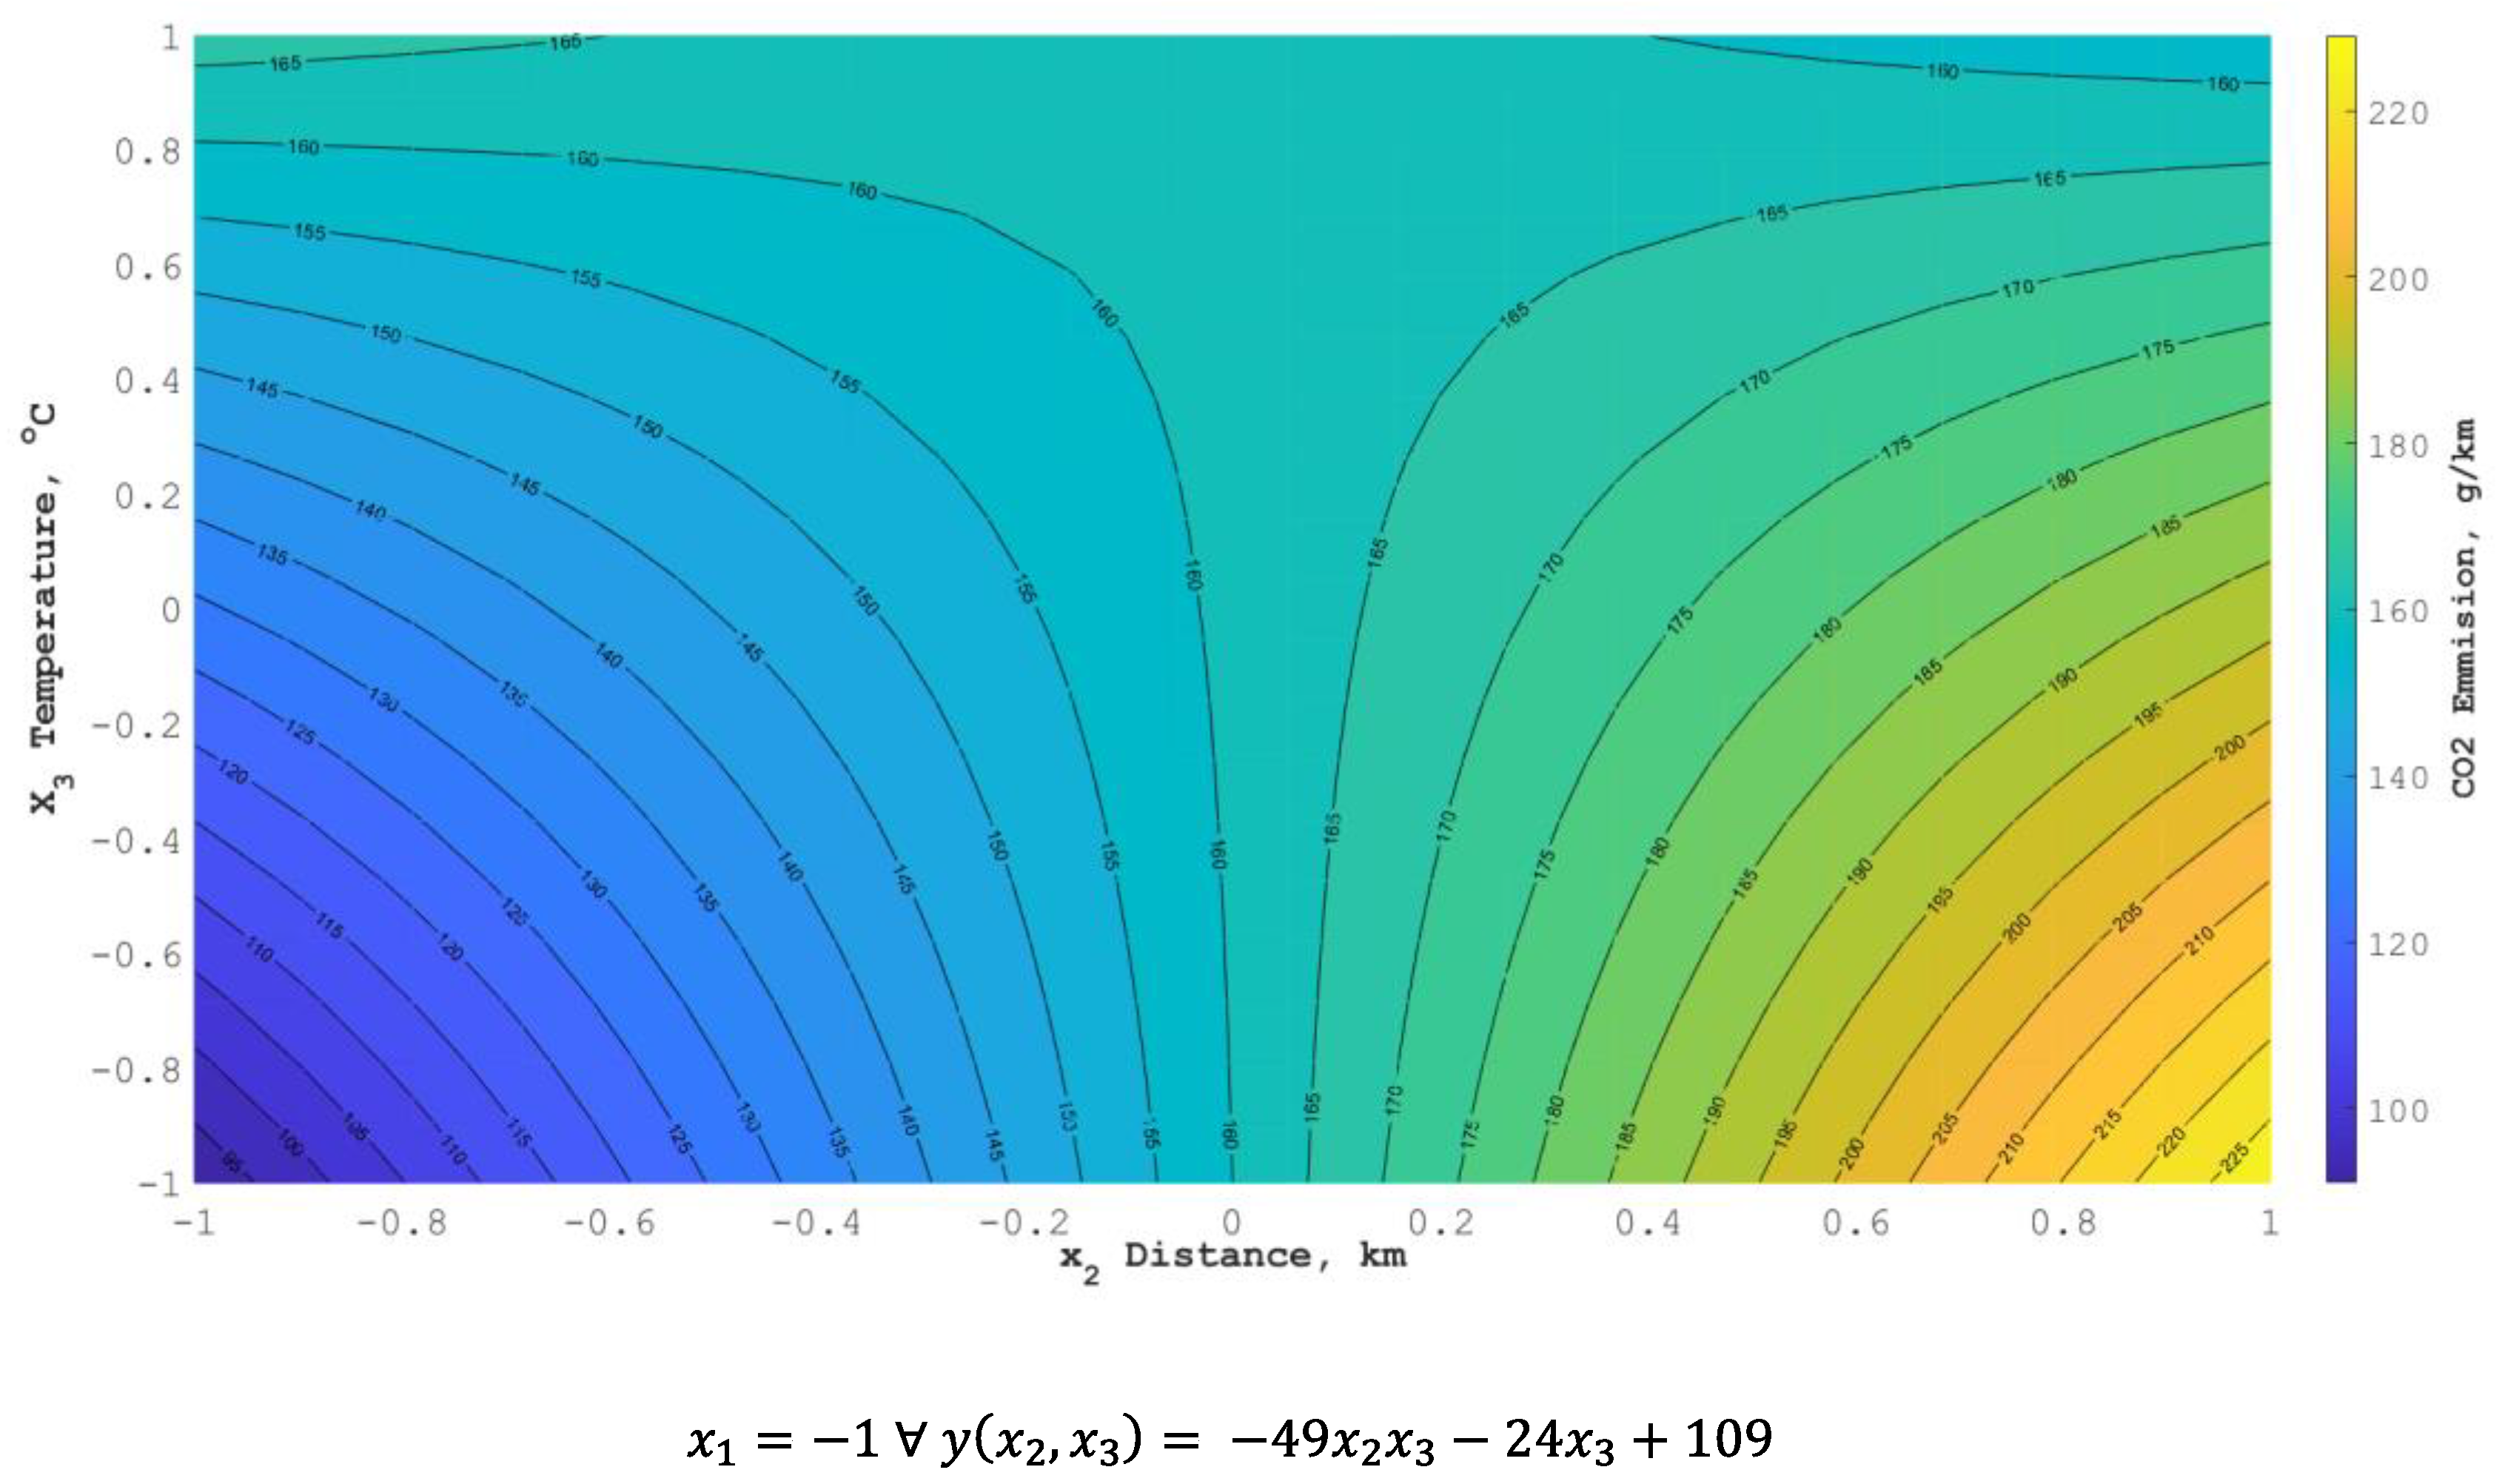
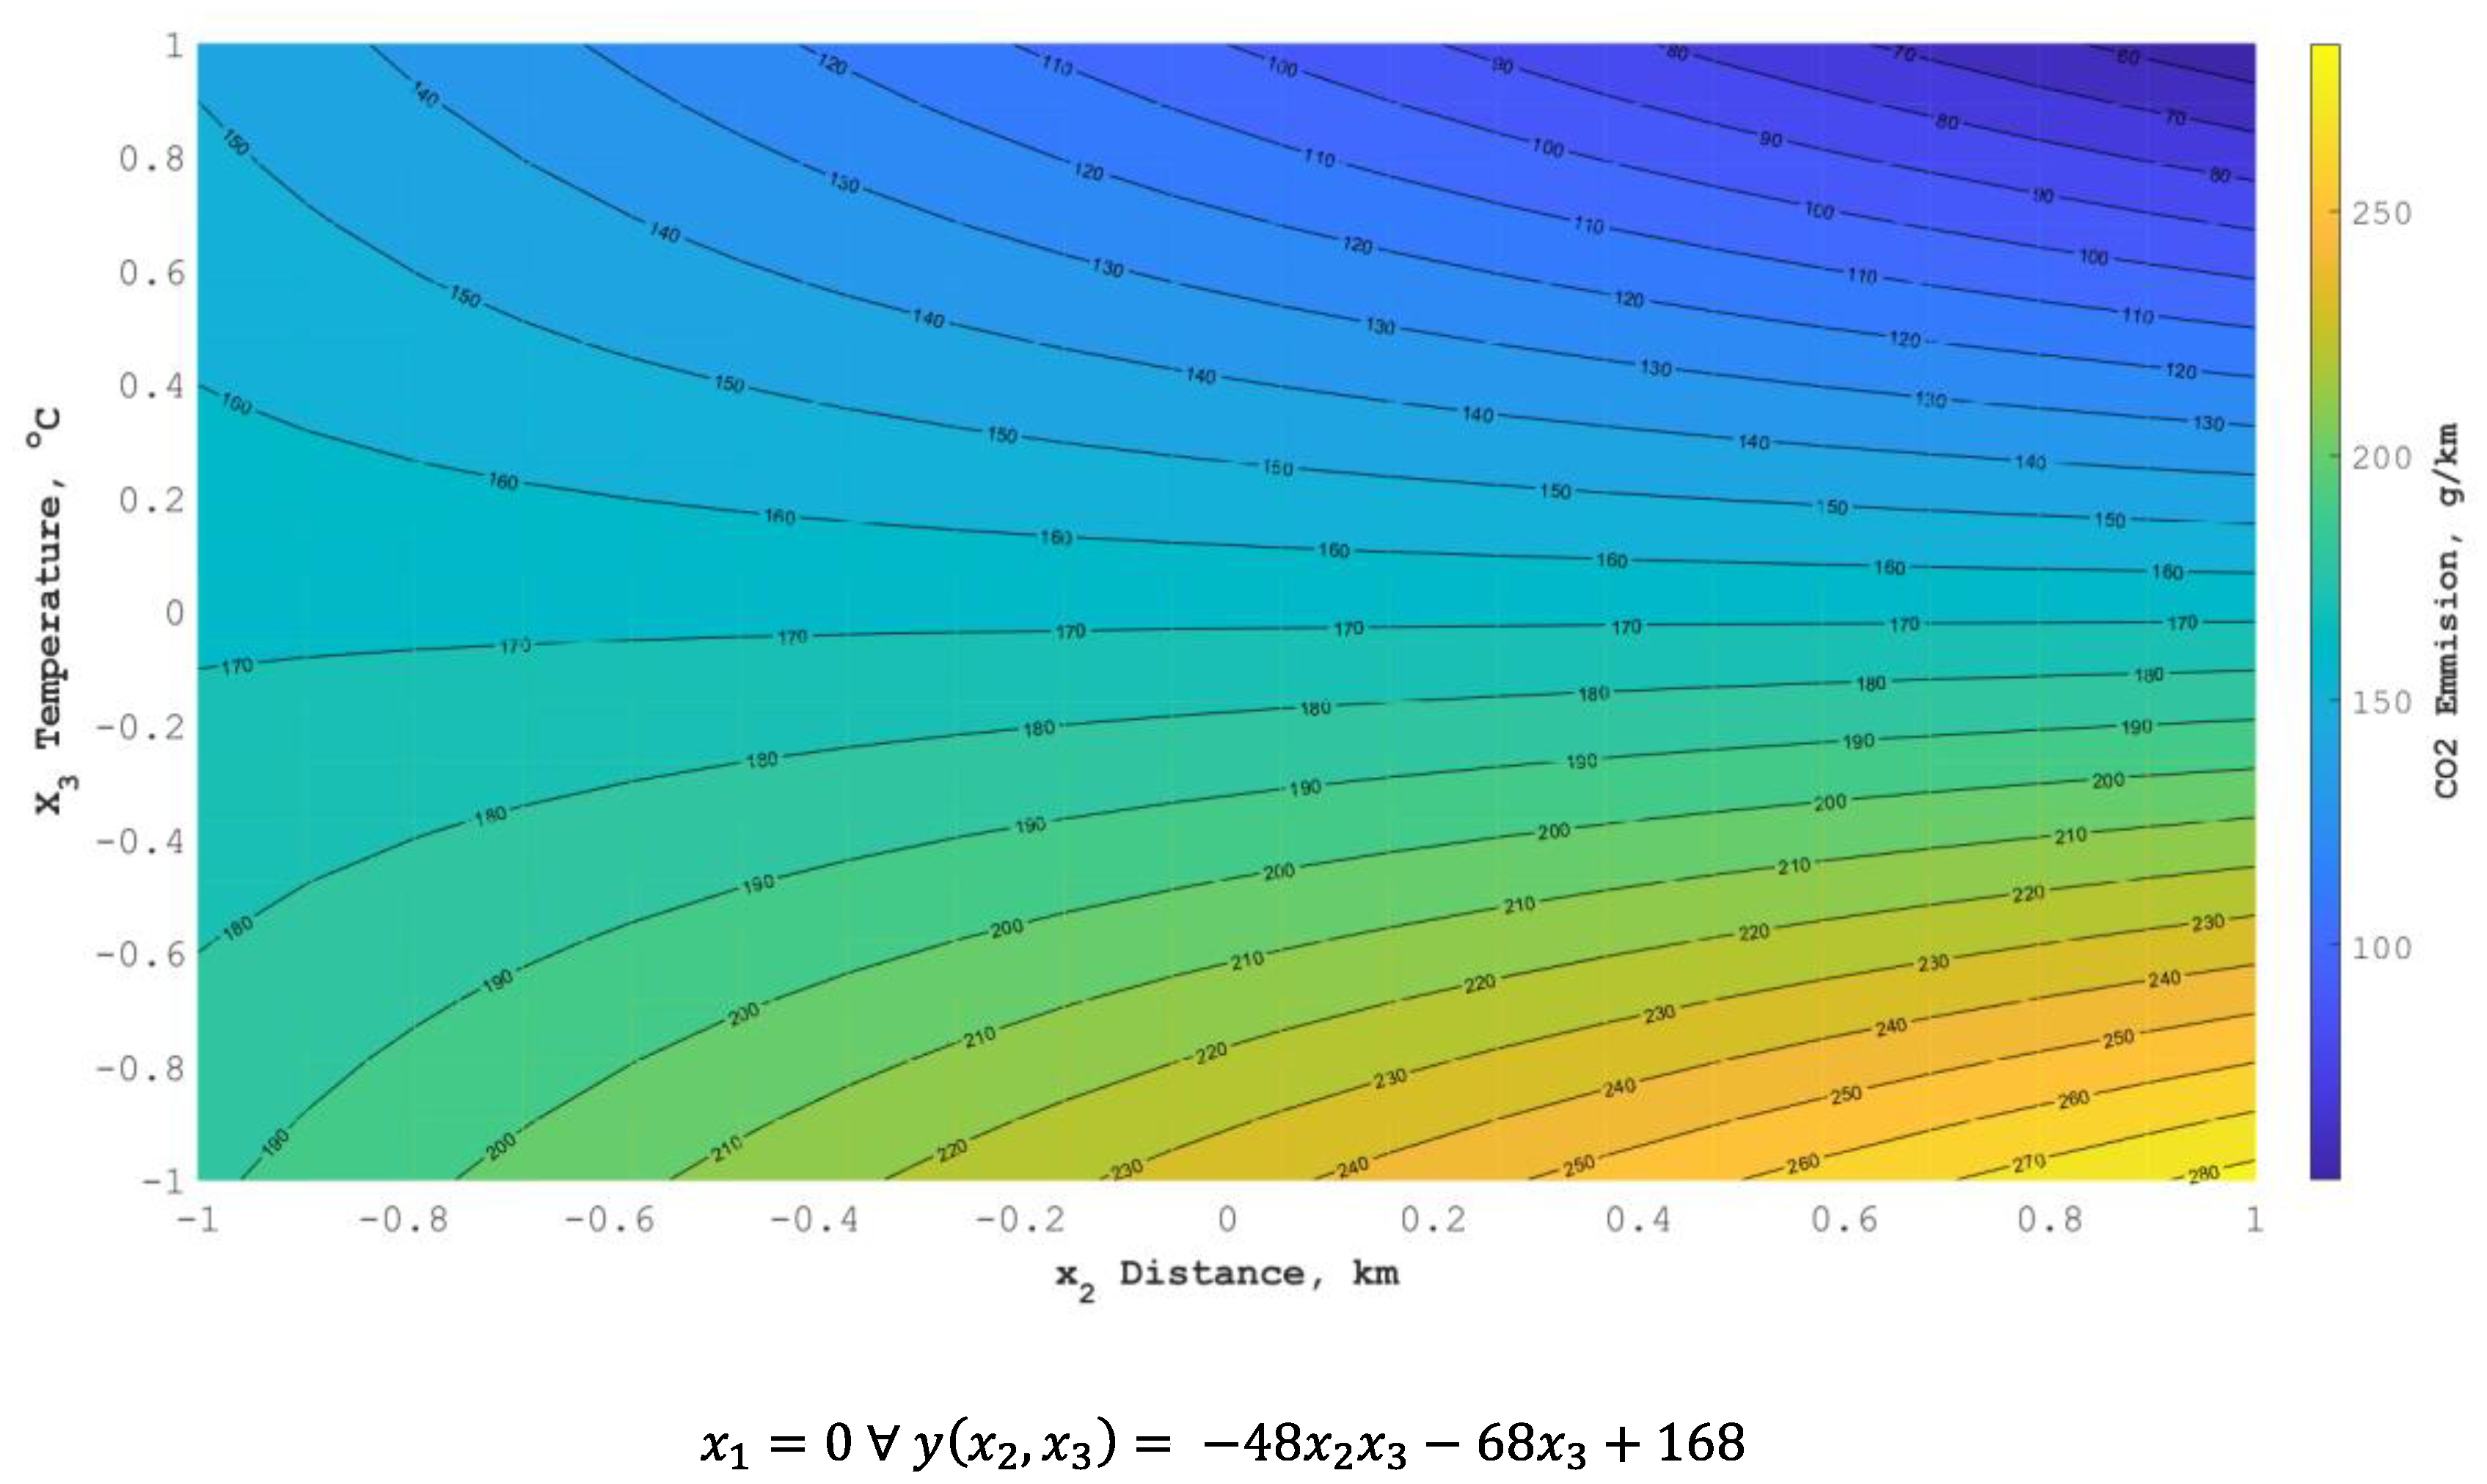
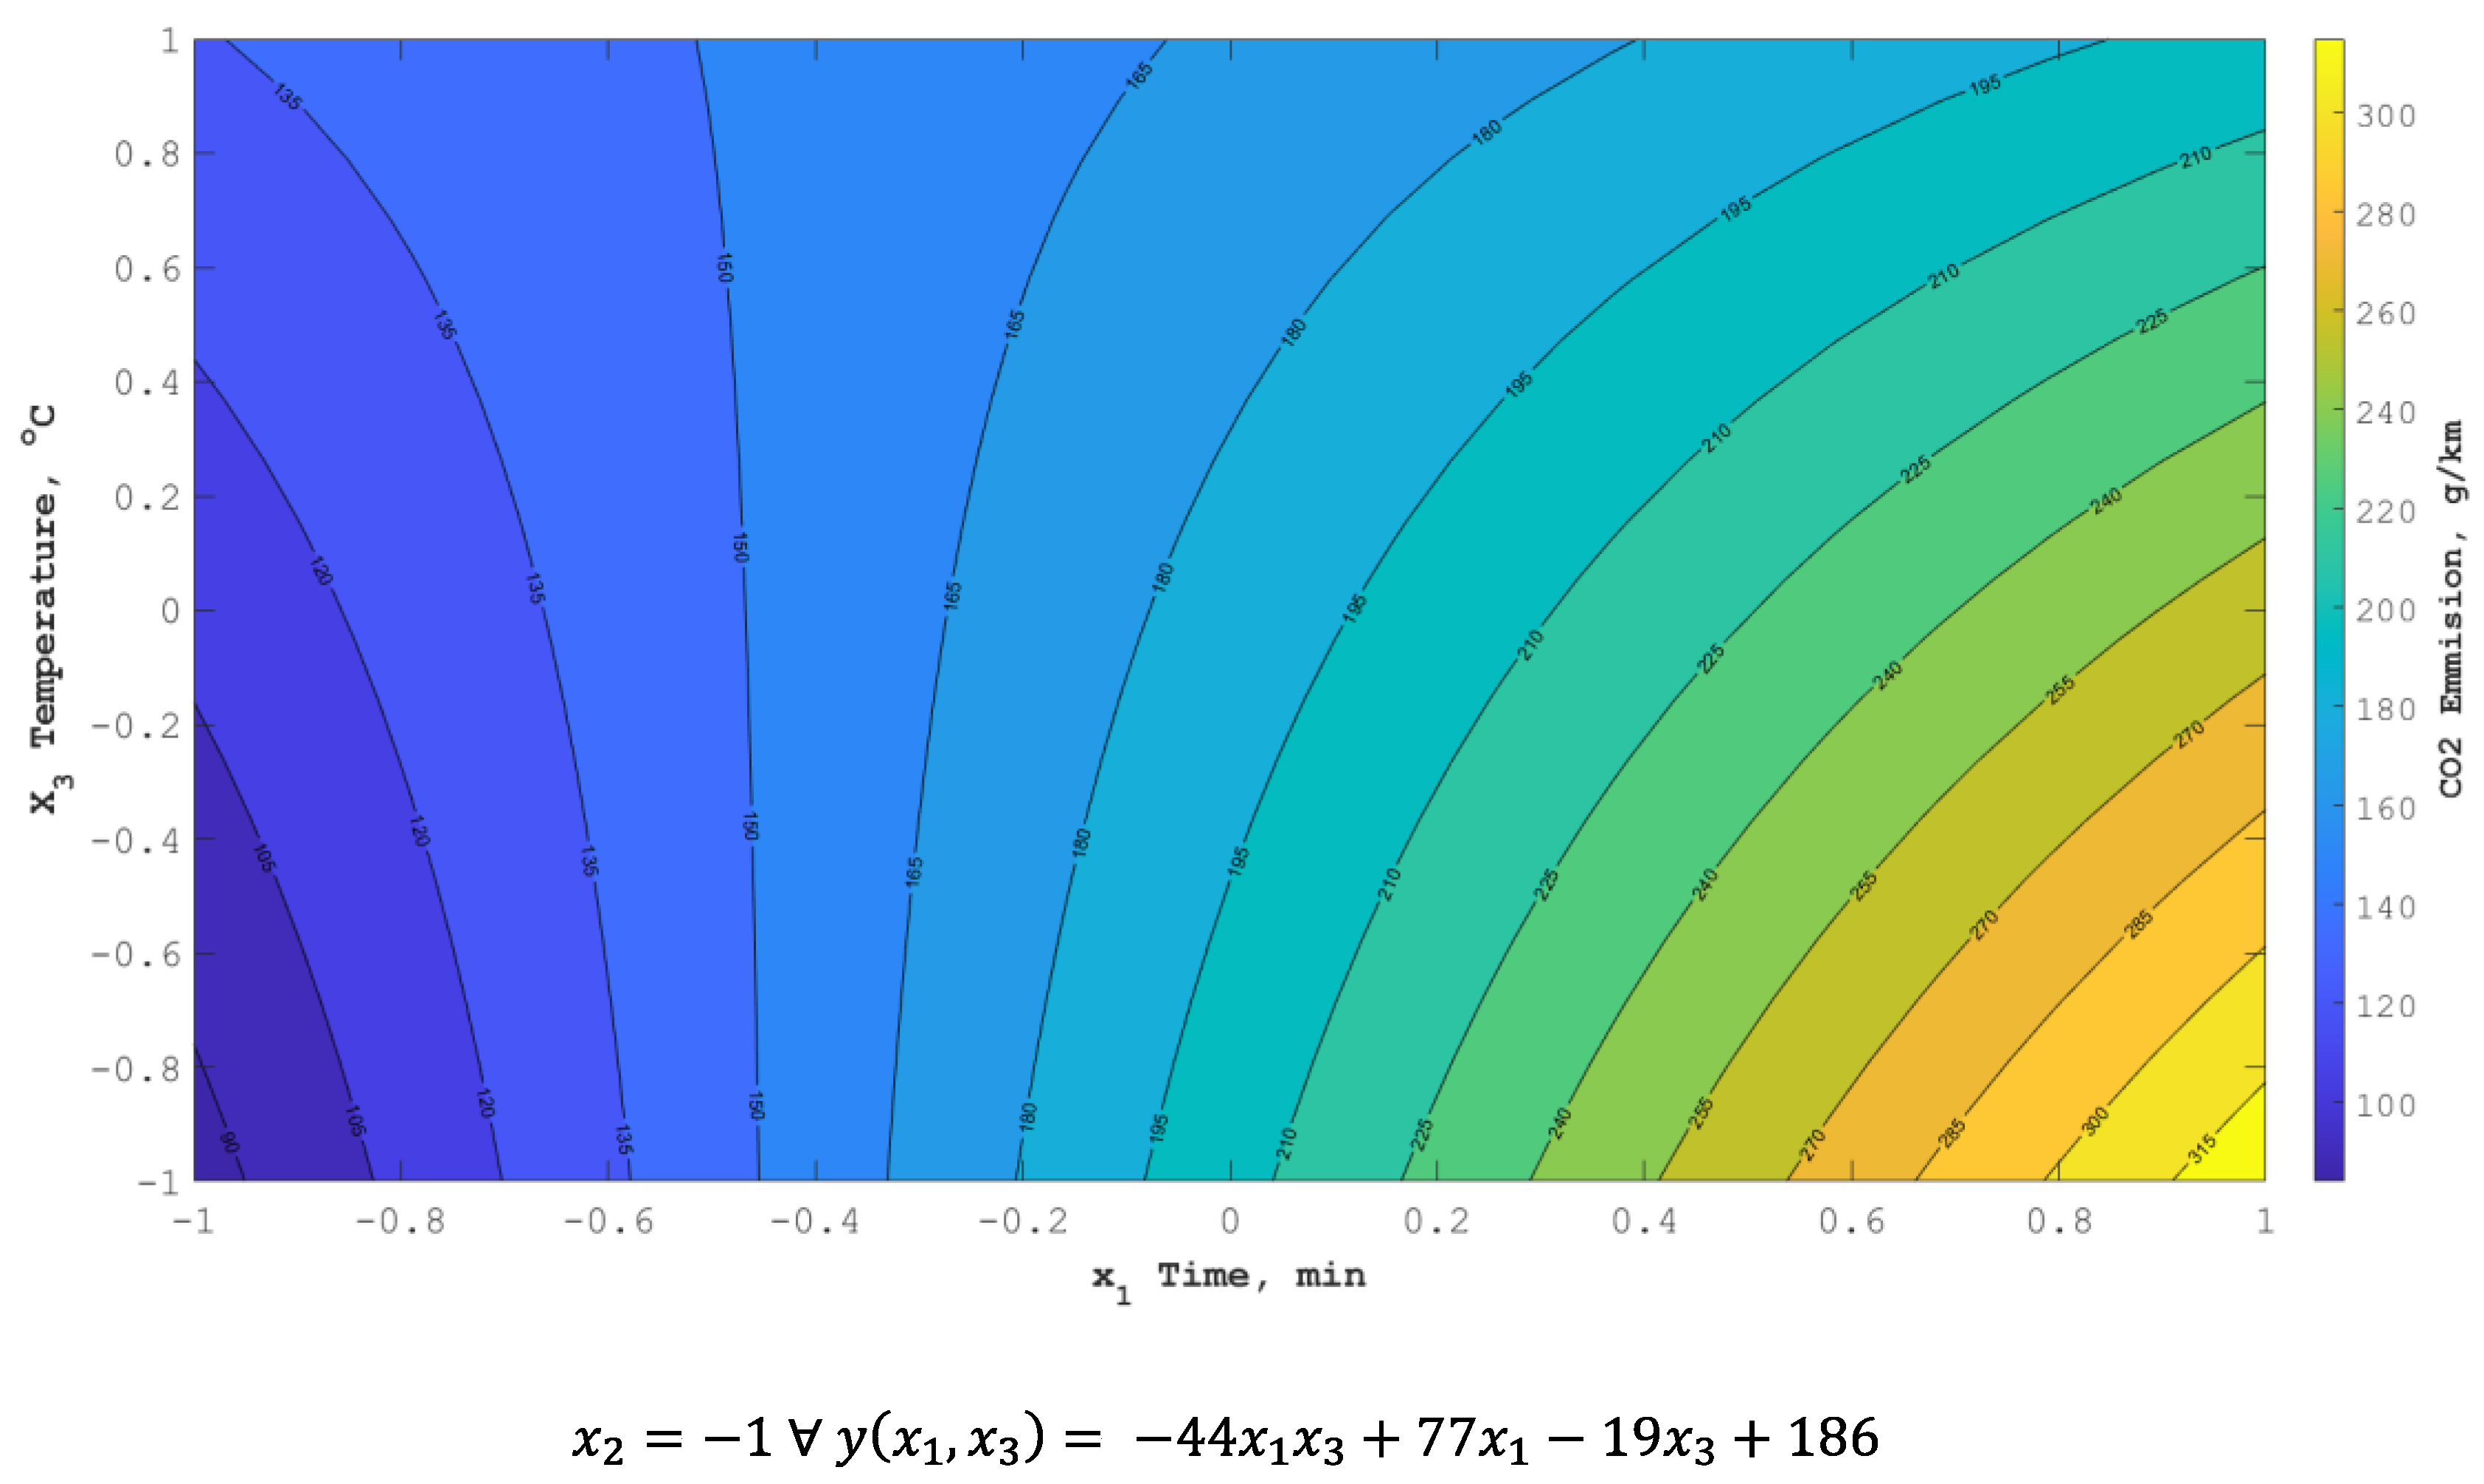
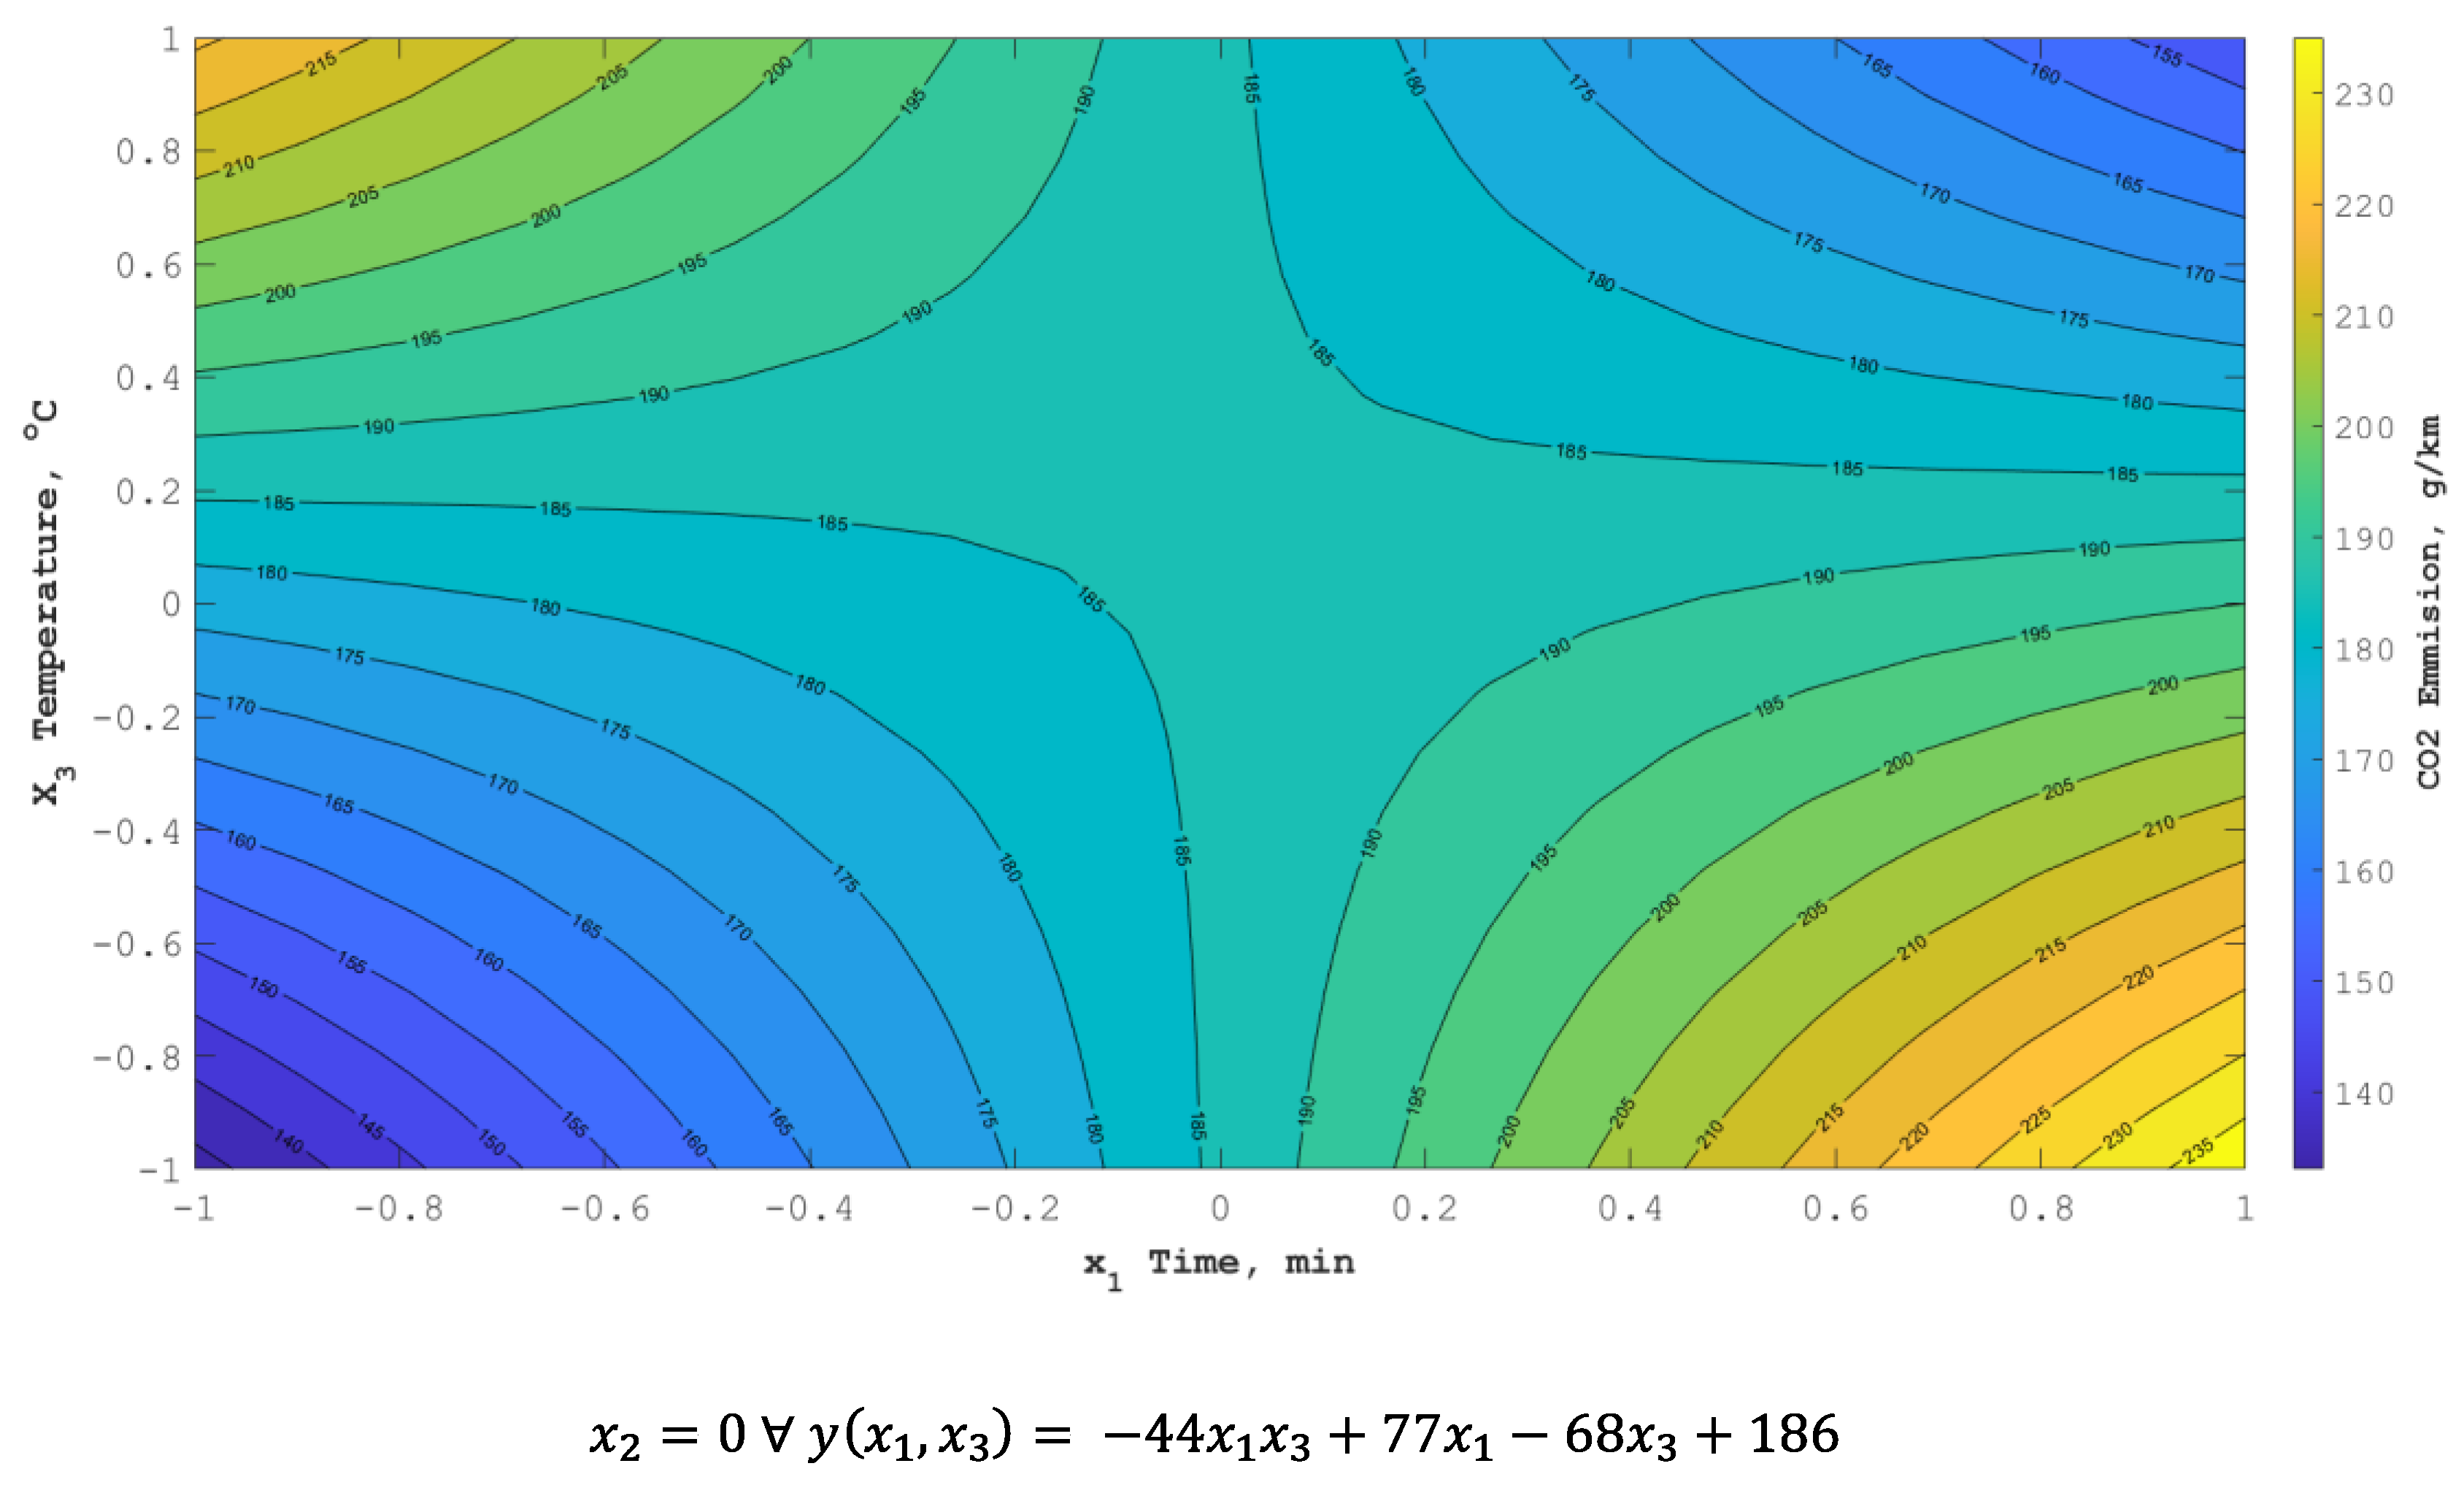
3.2. Road Test Results for a Vehicle with an Electric Engine (EE)
4. Discussion
5. Conclusions
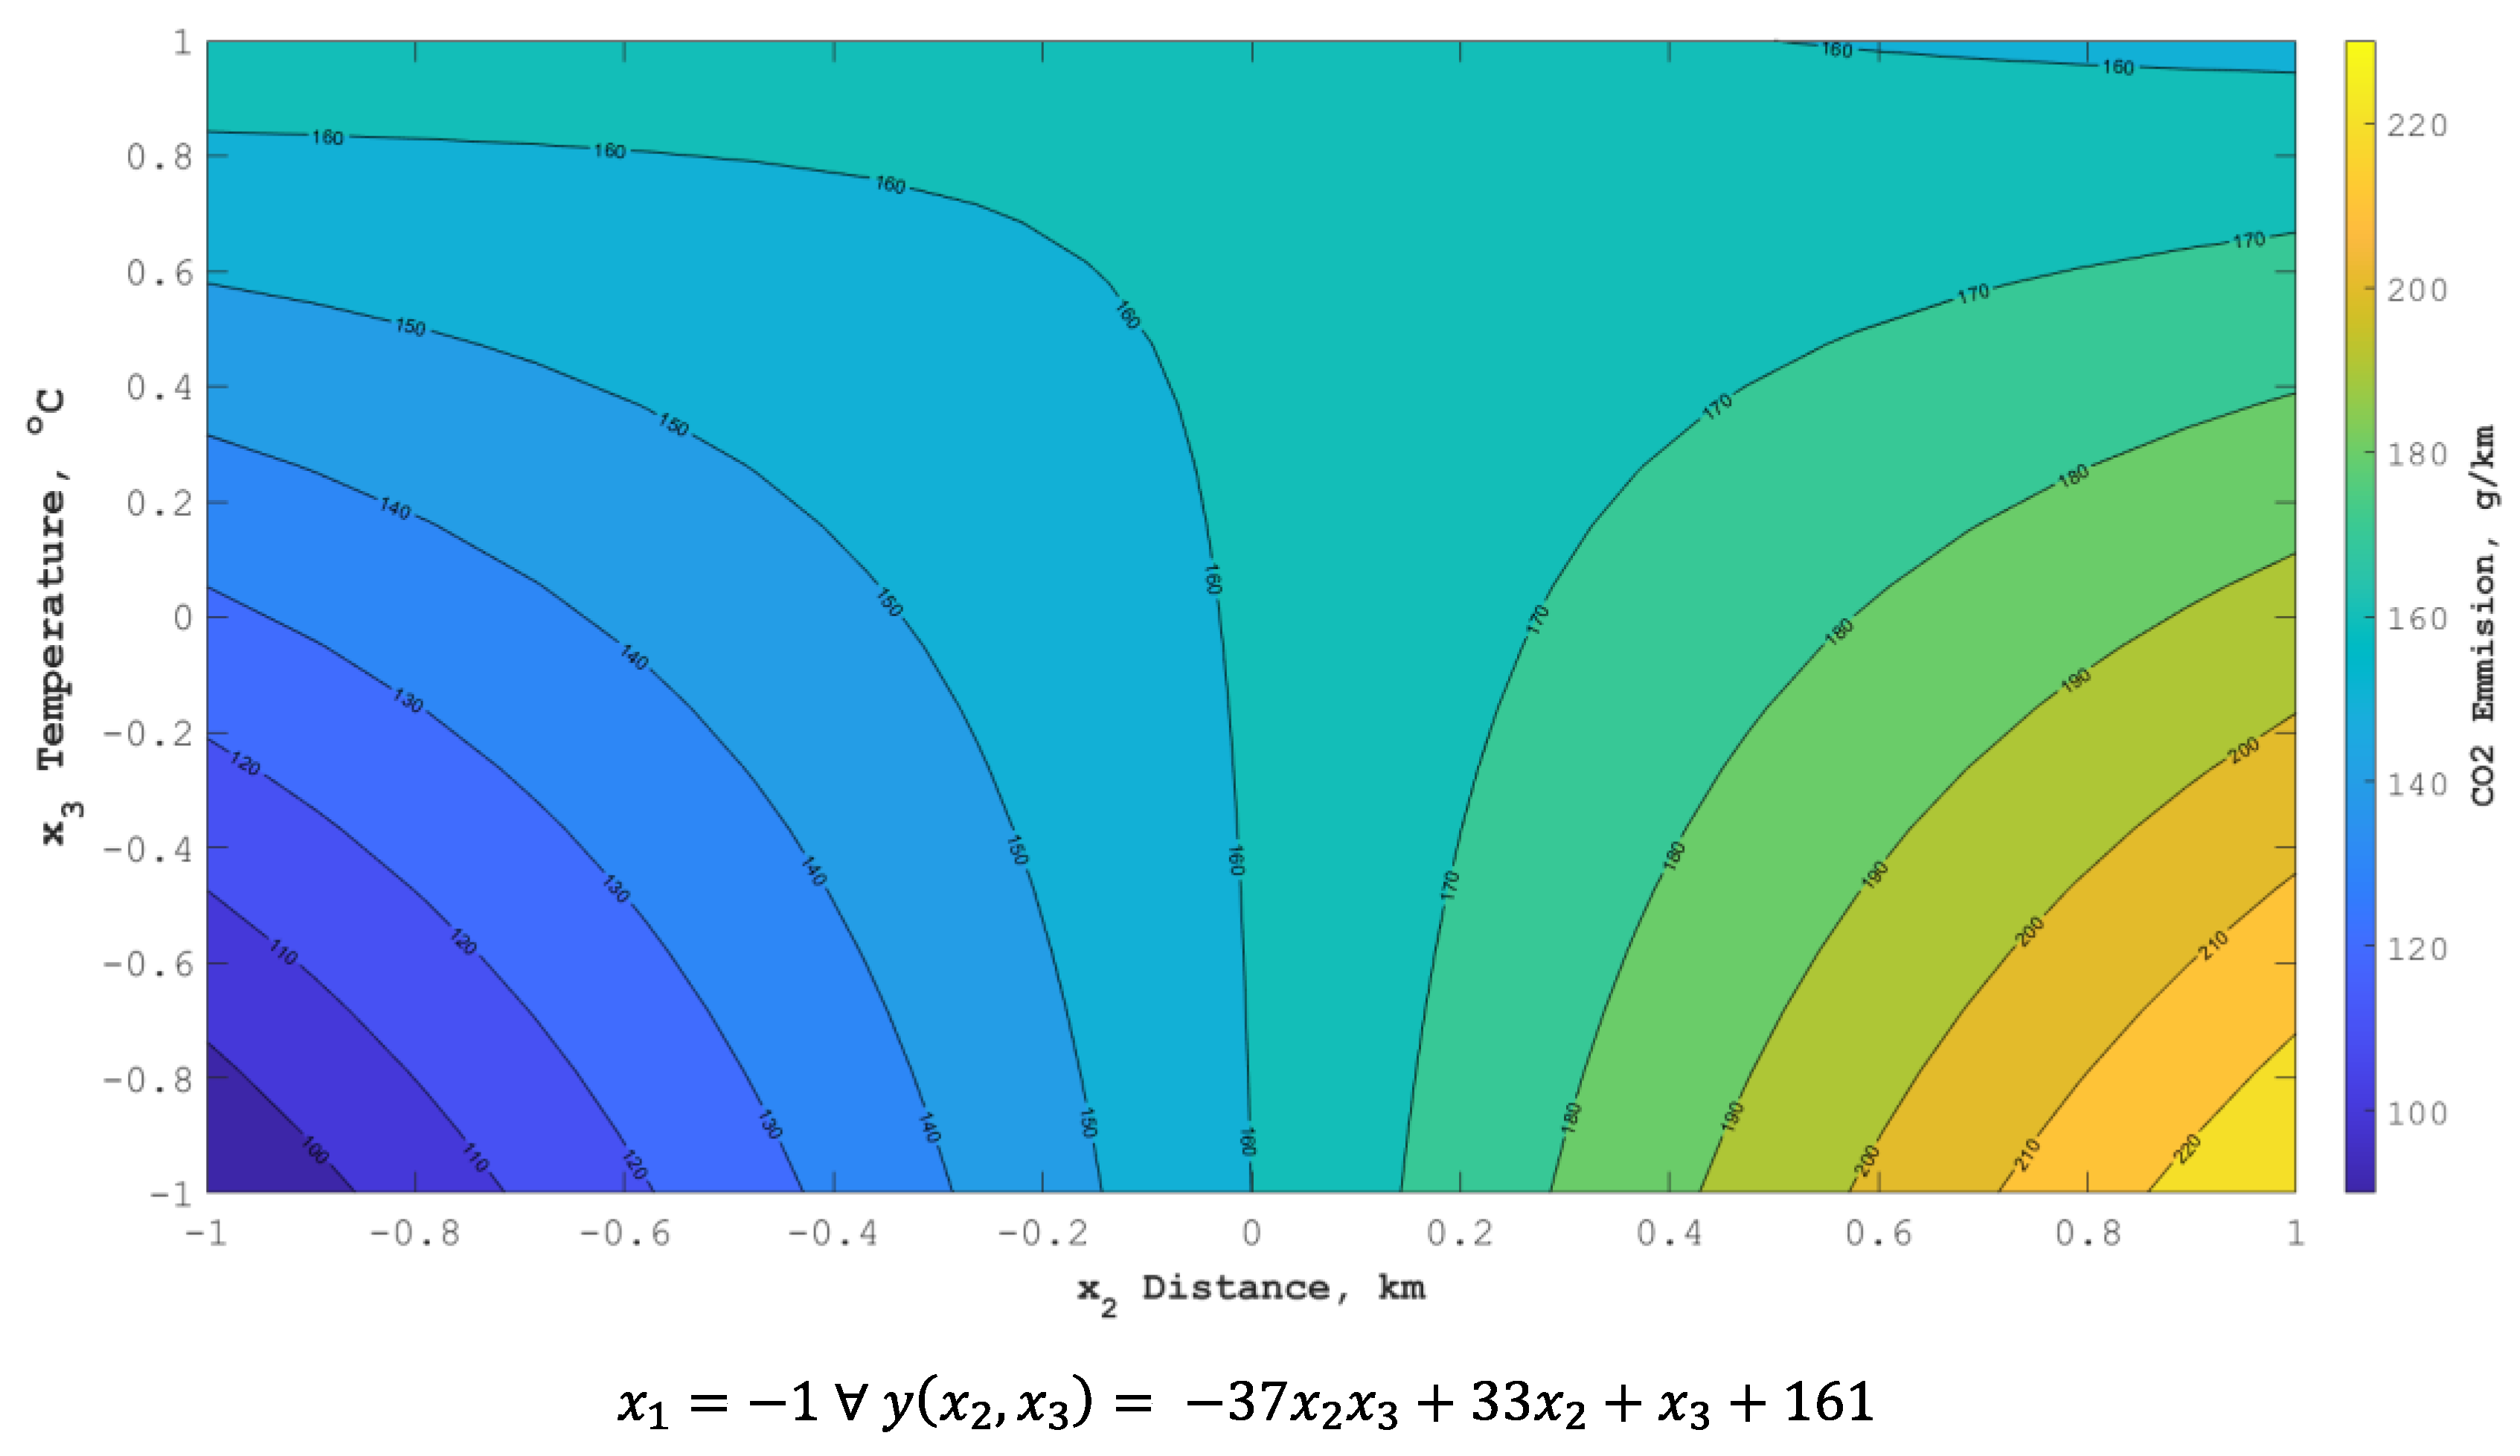
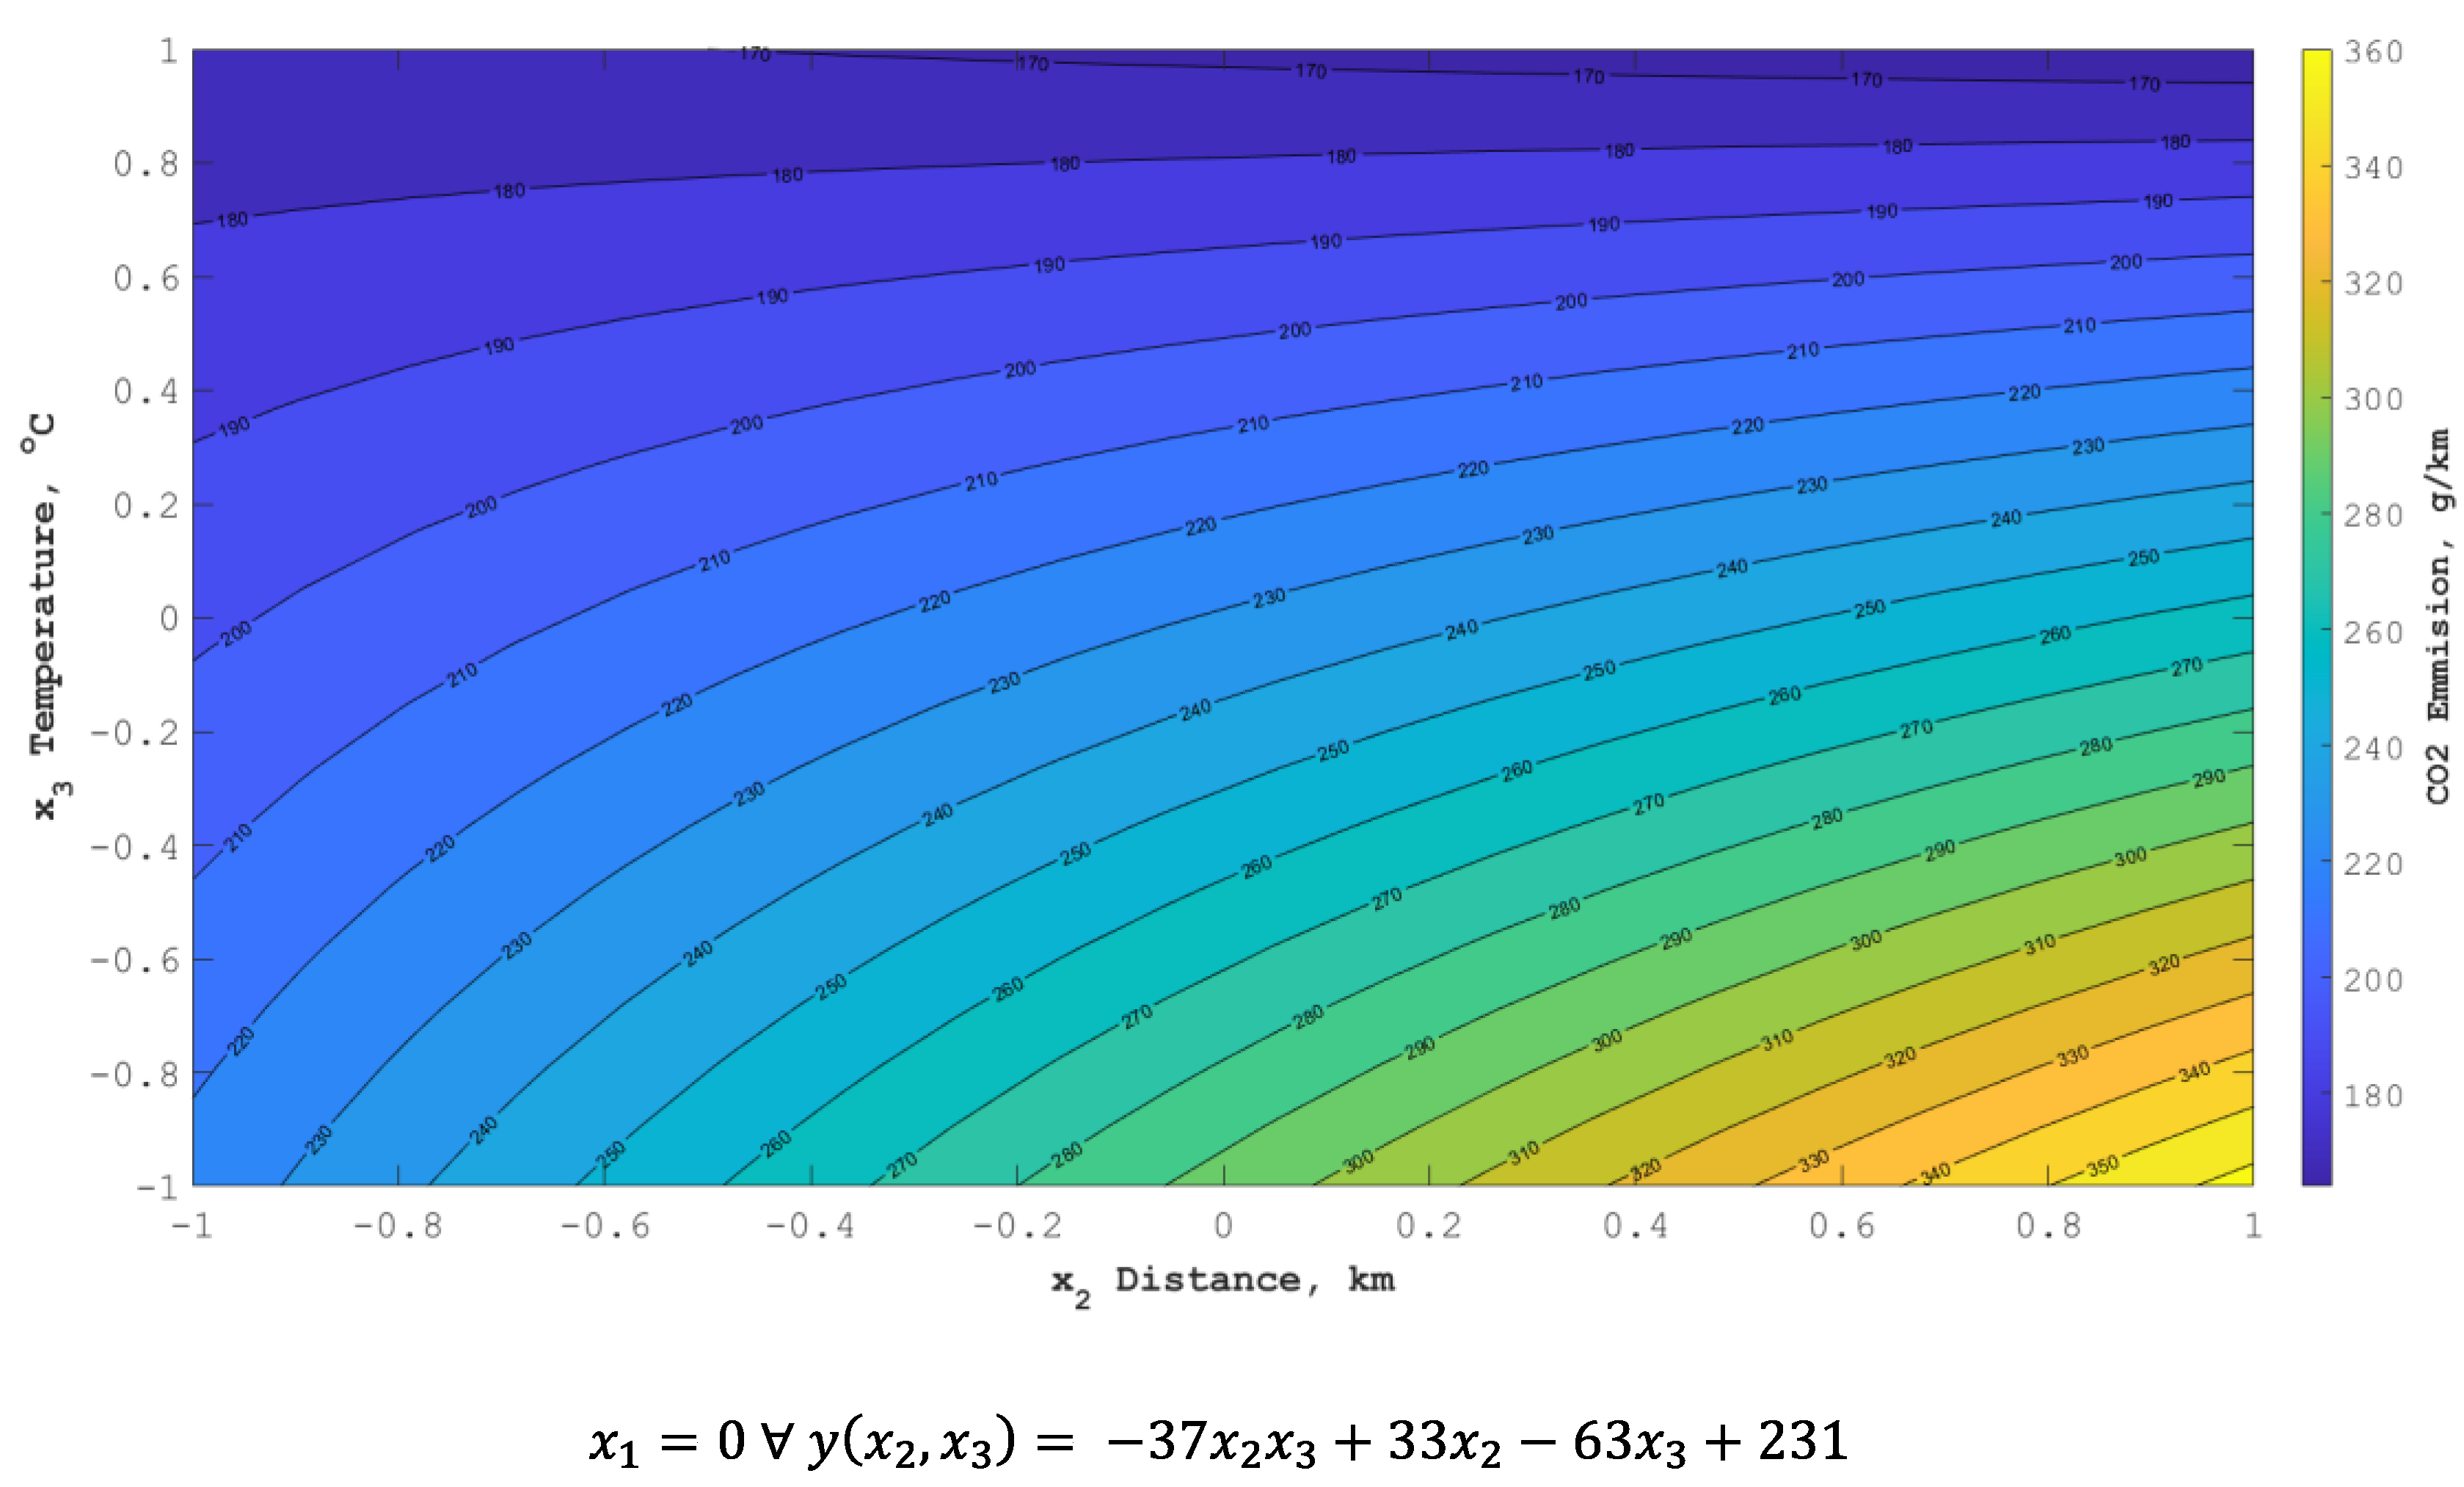
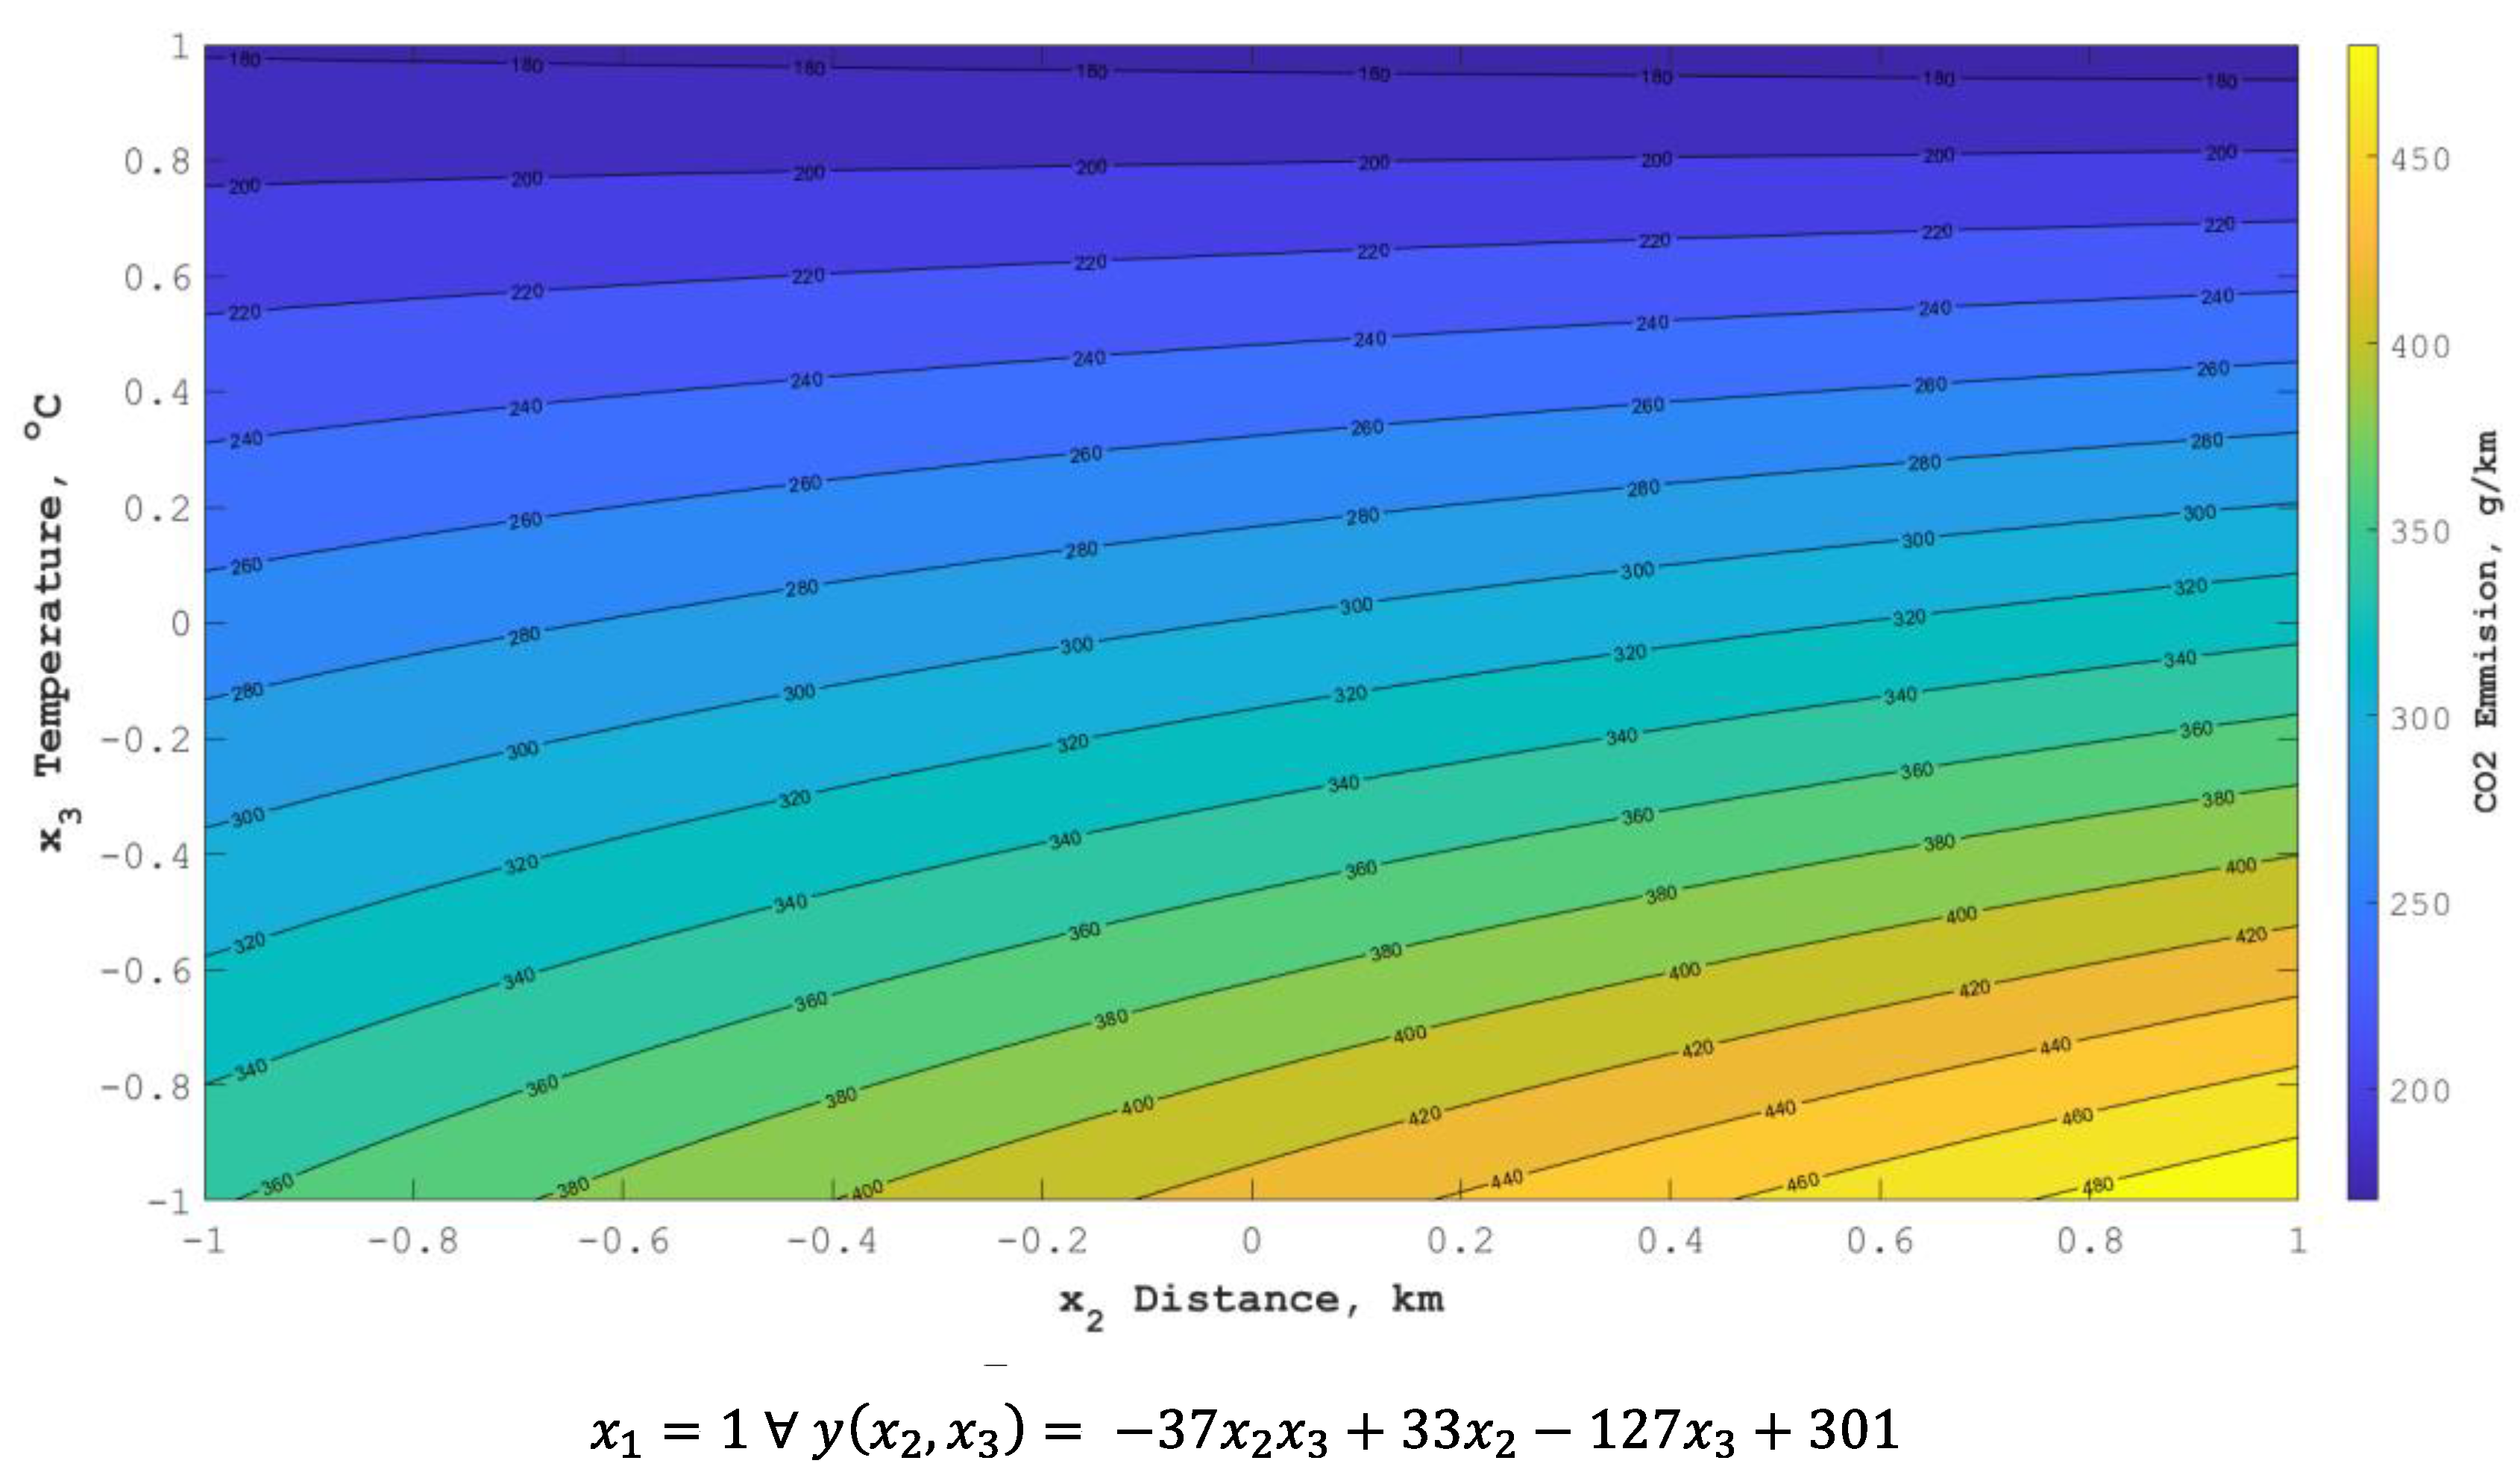
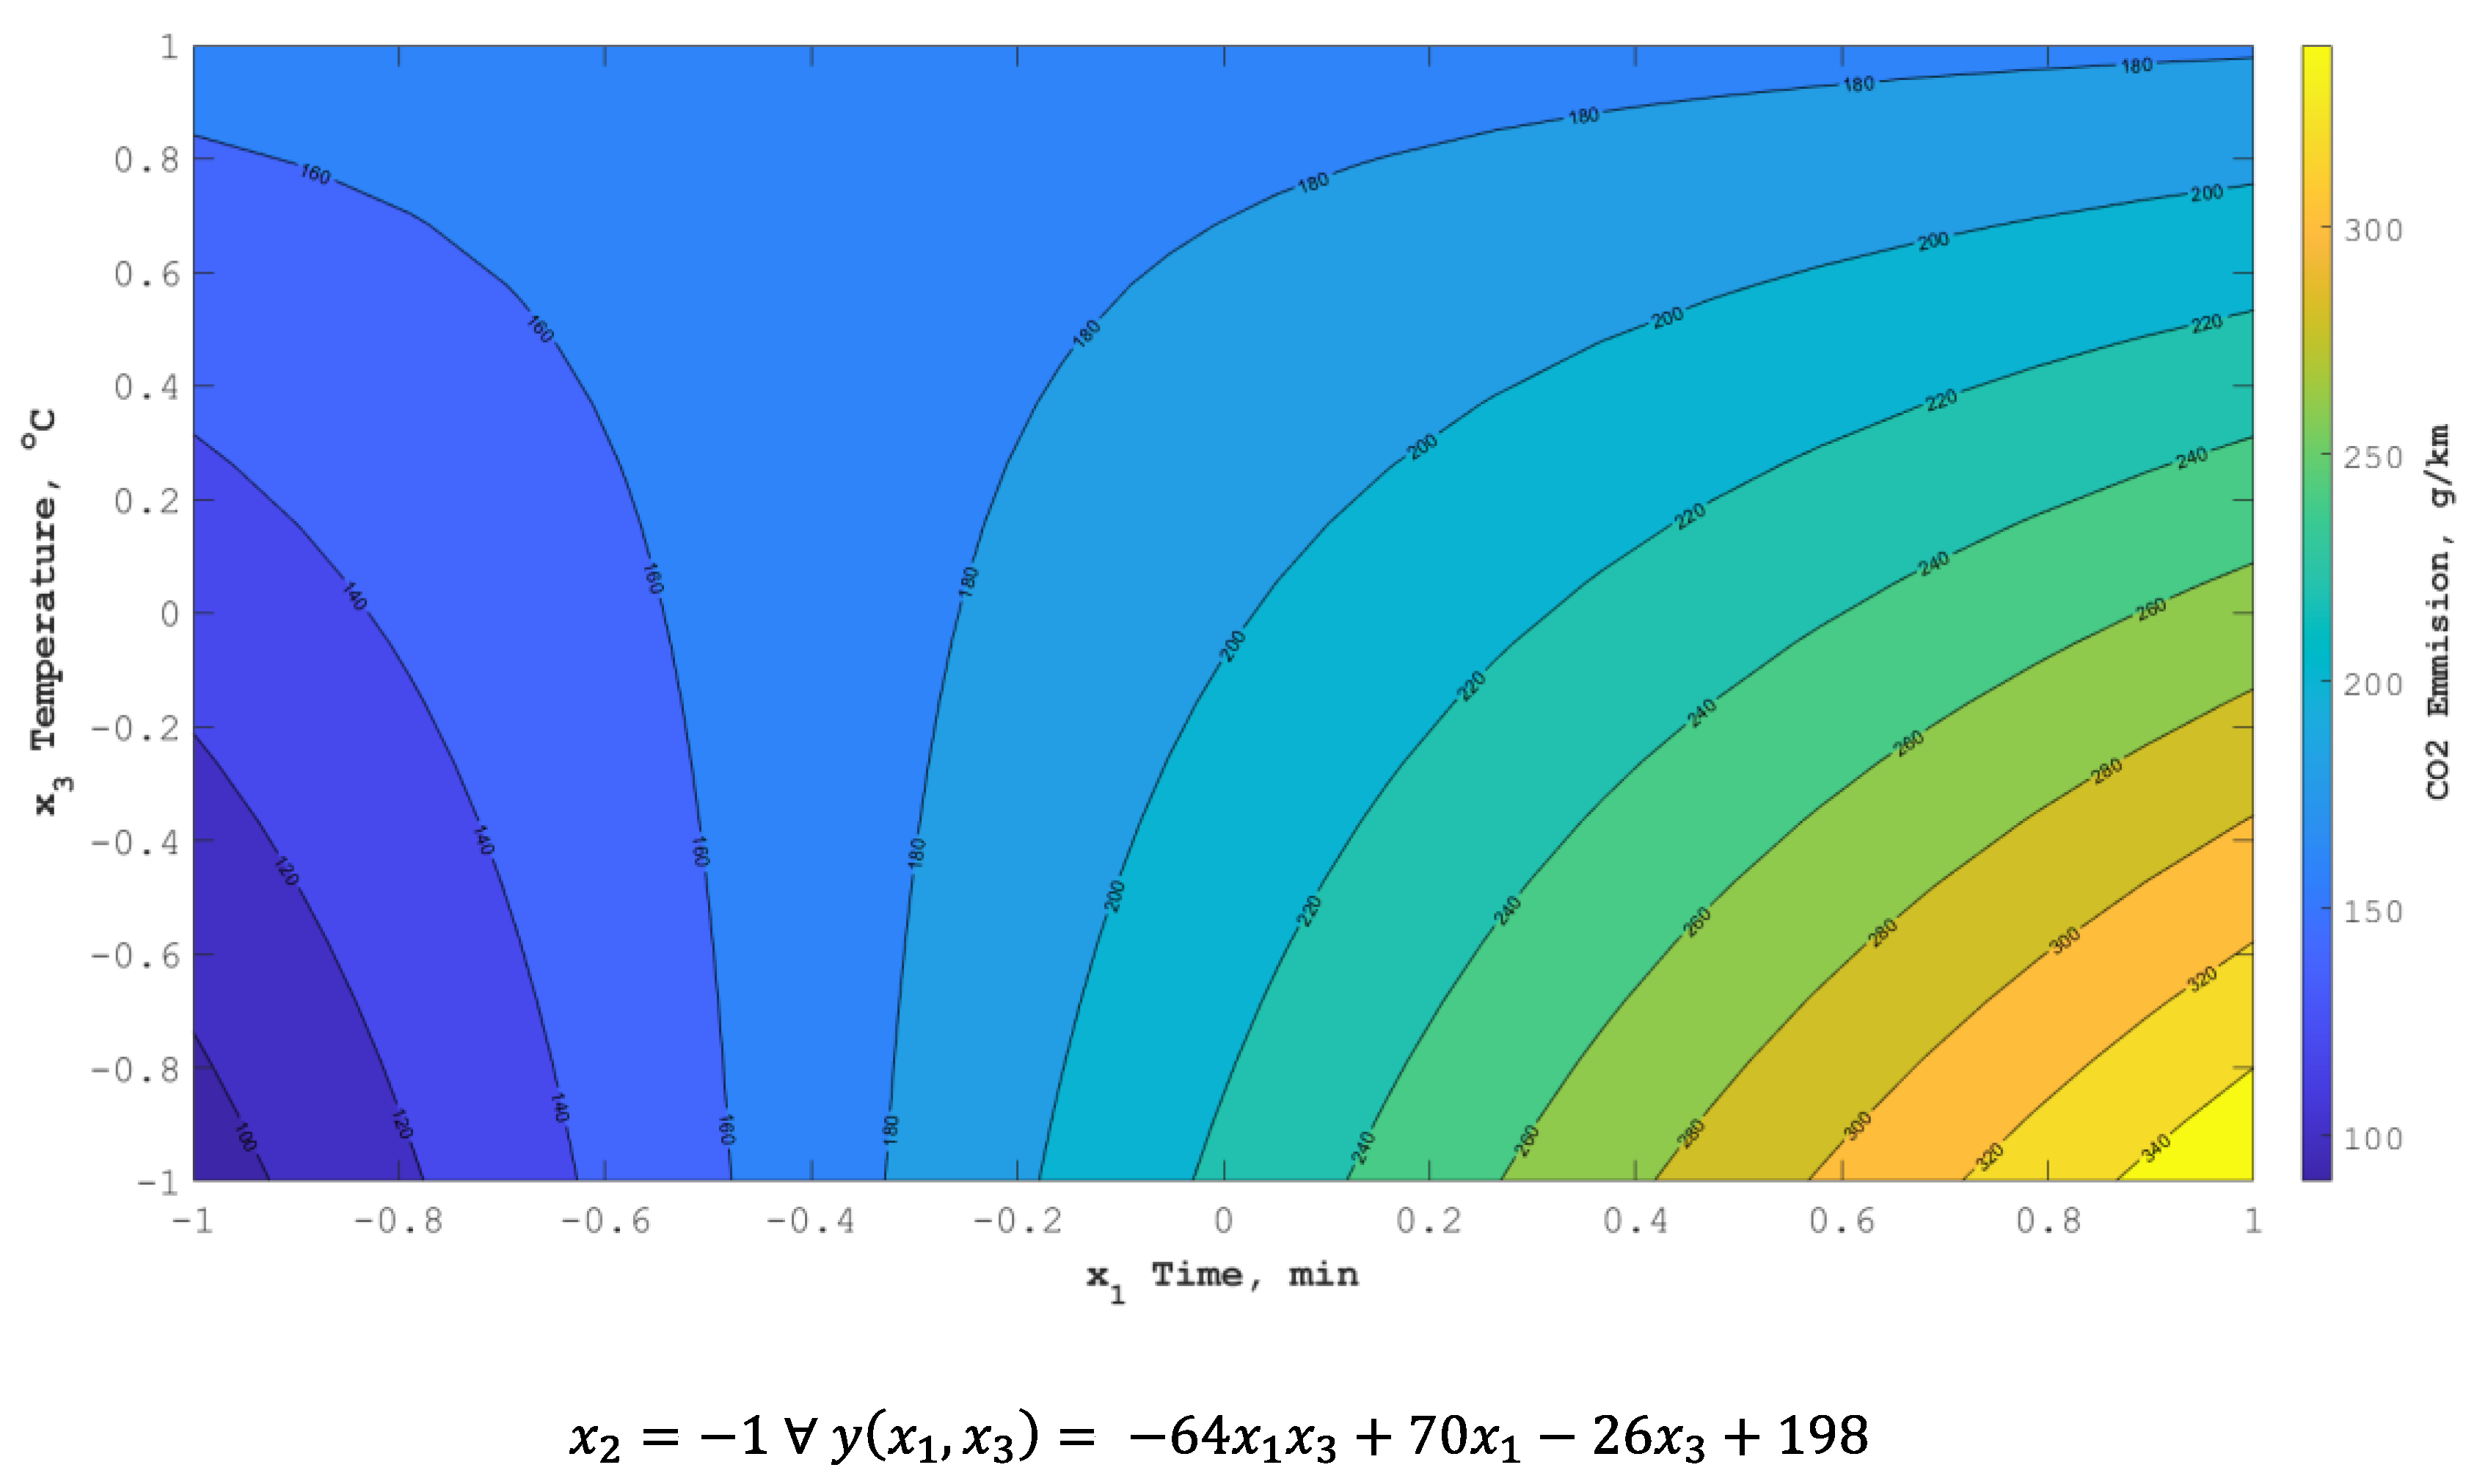
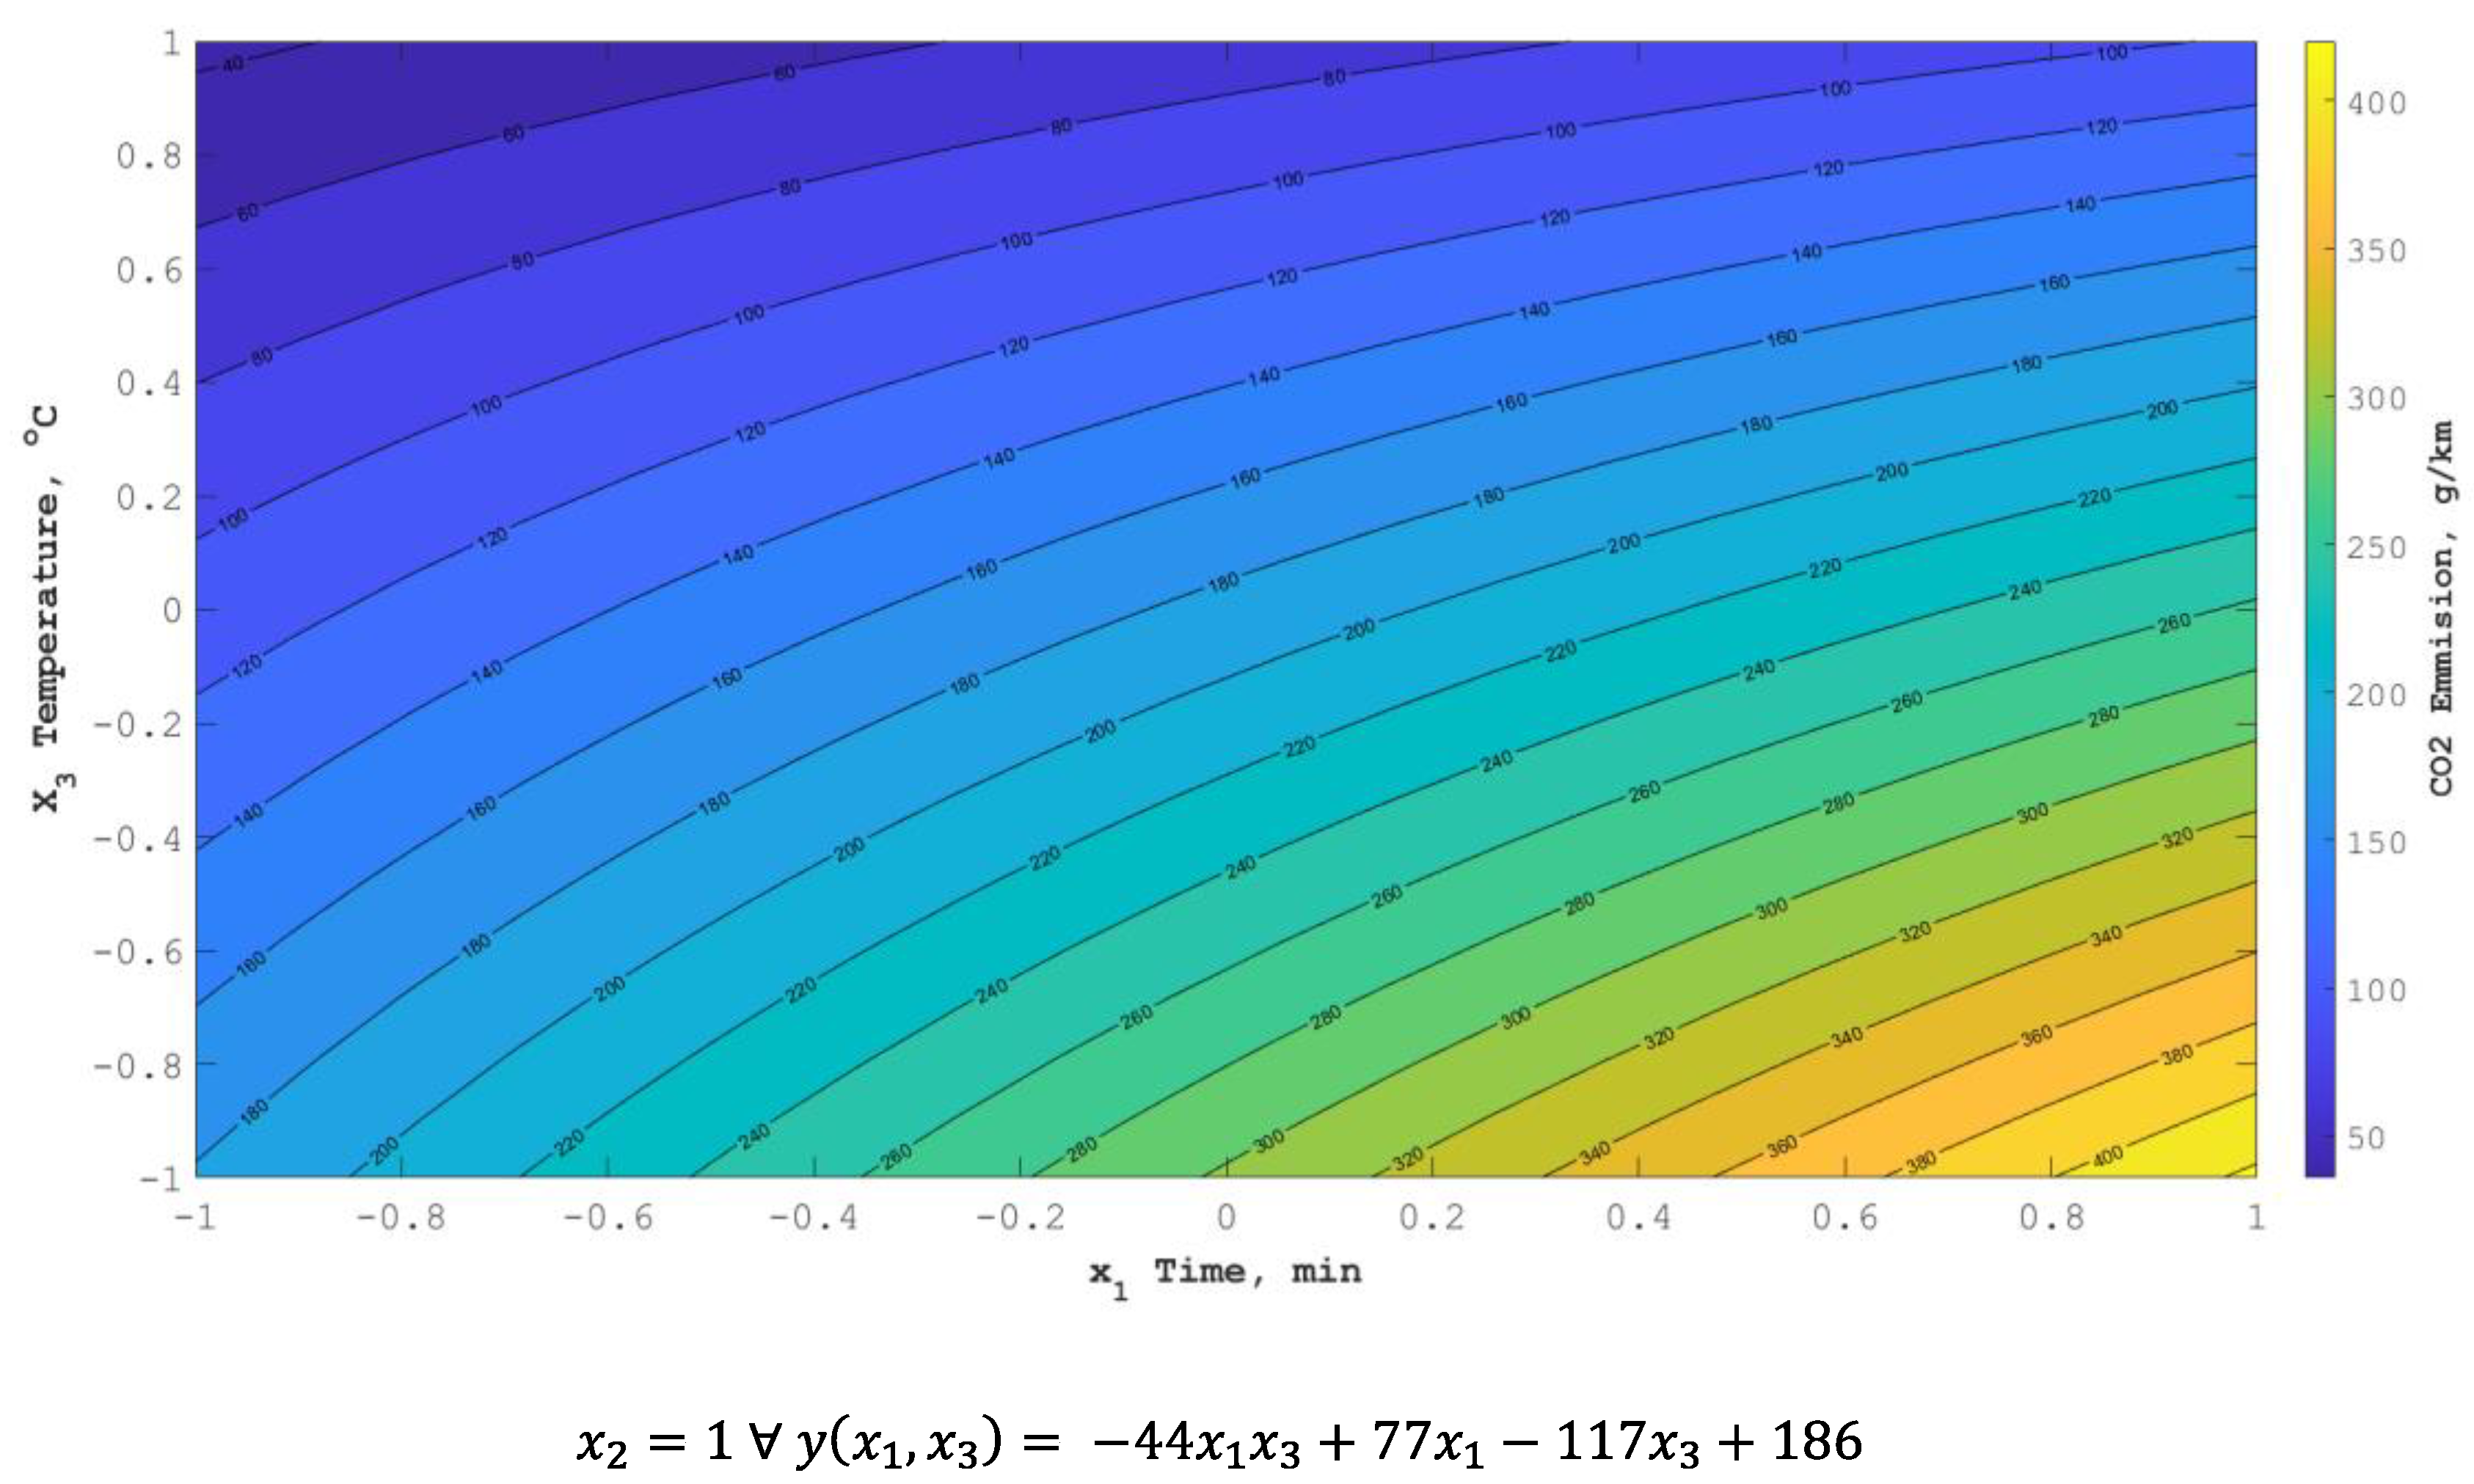
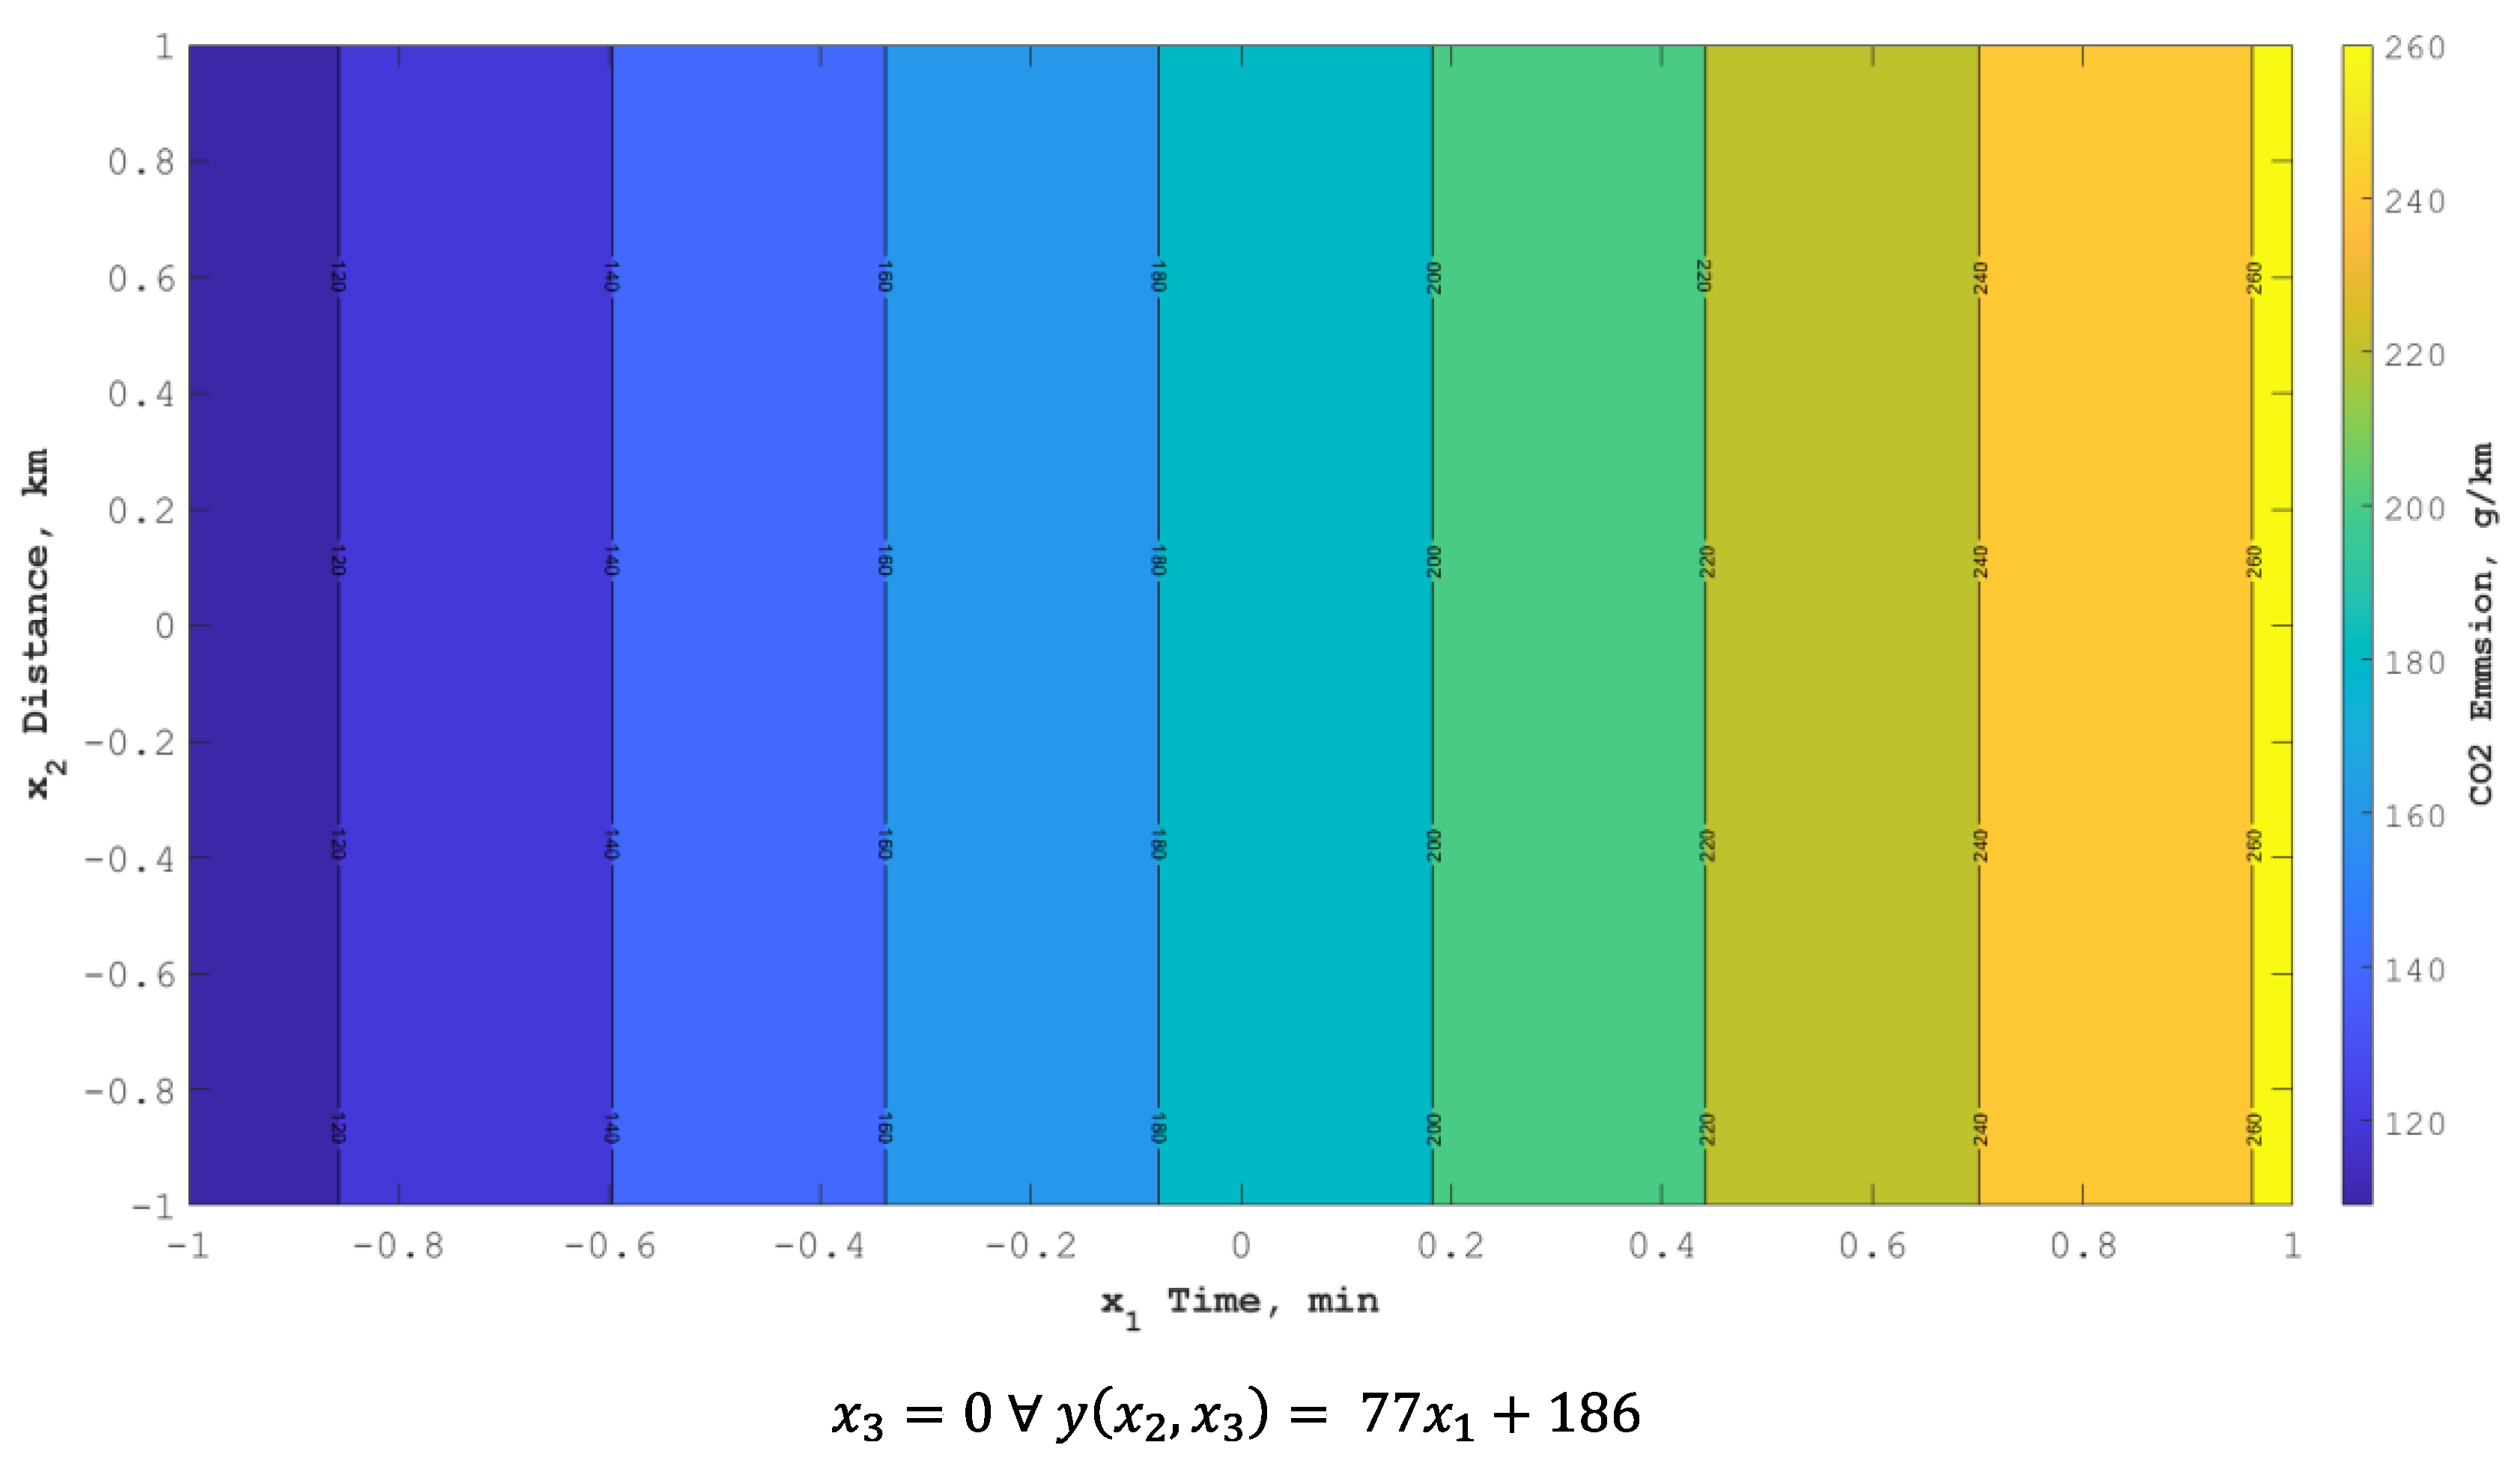
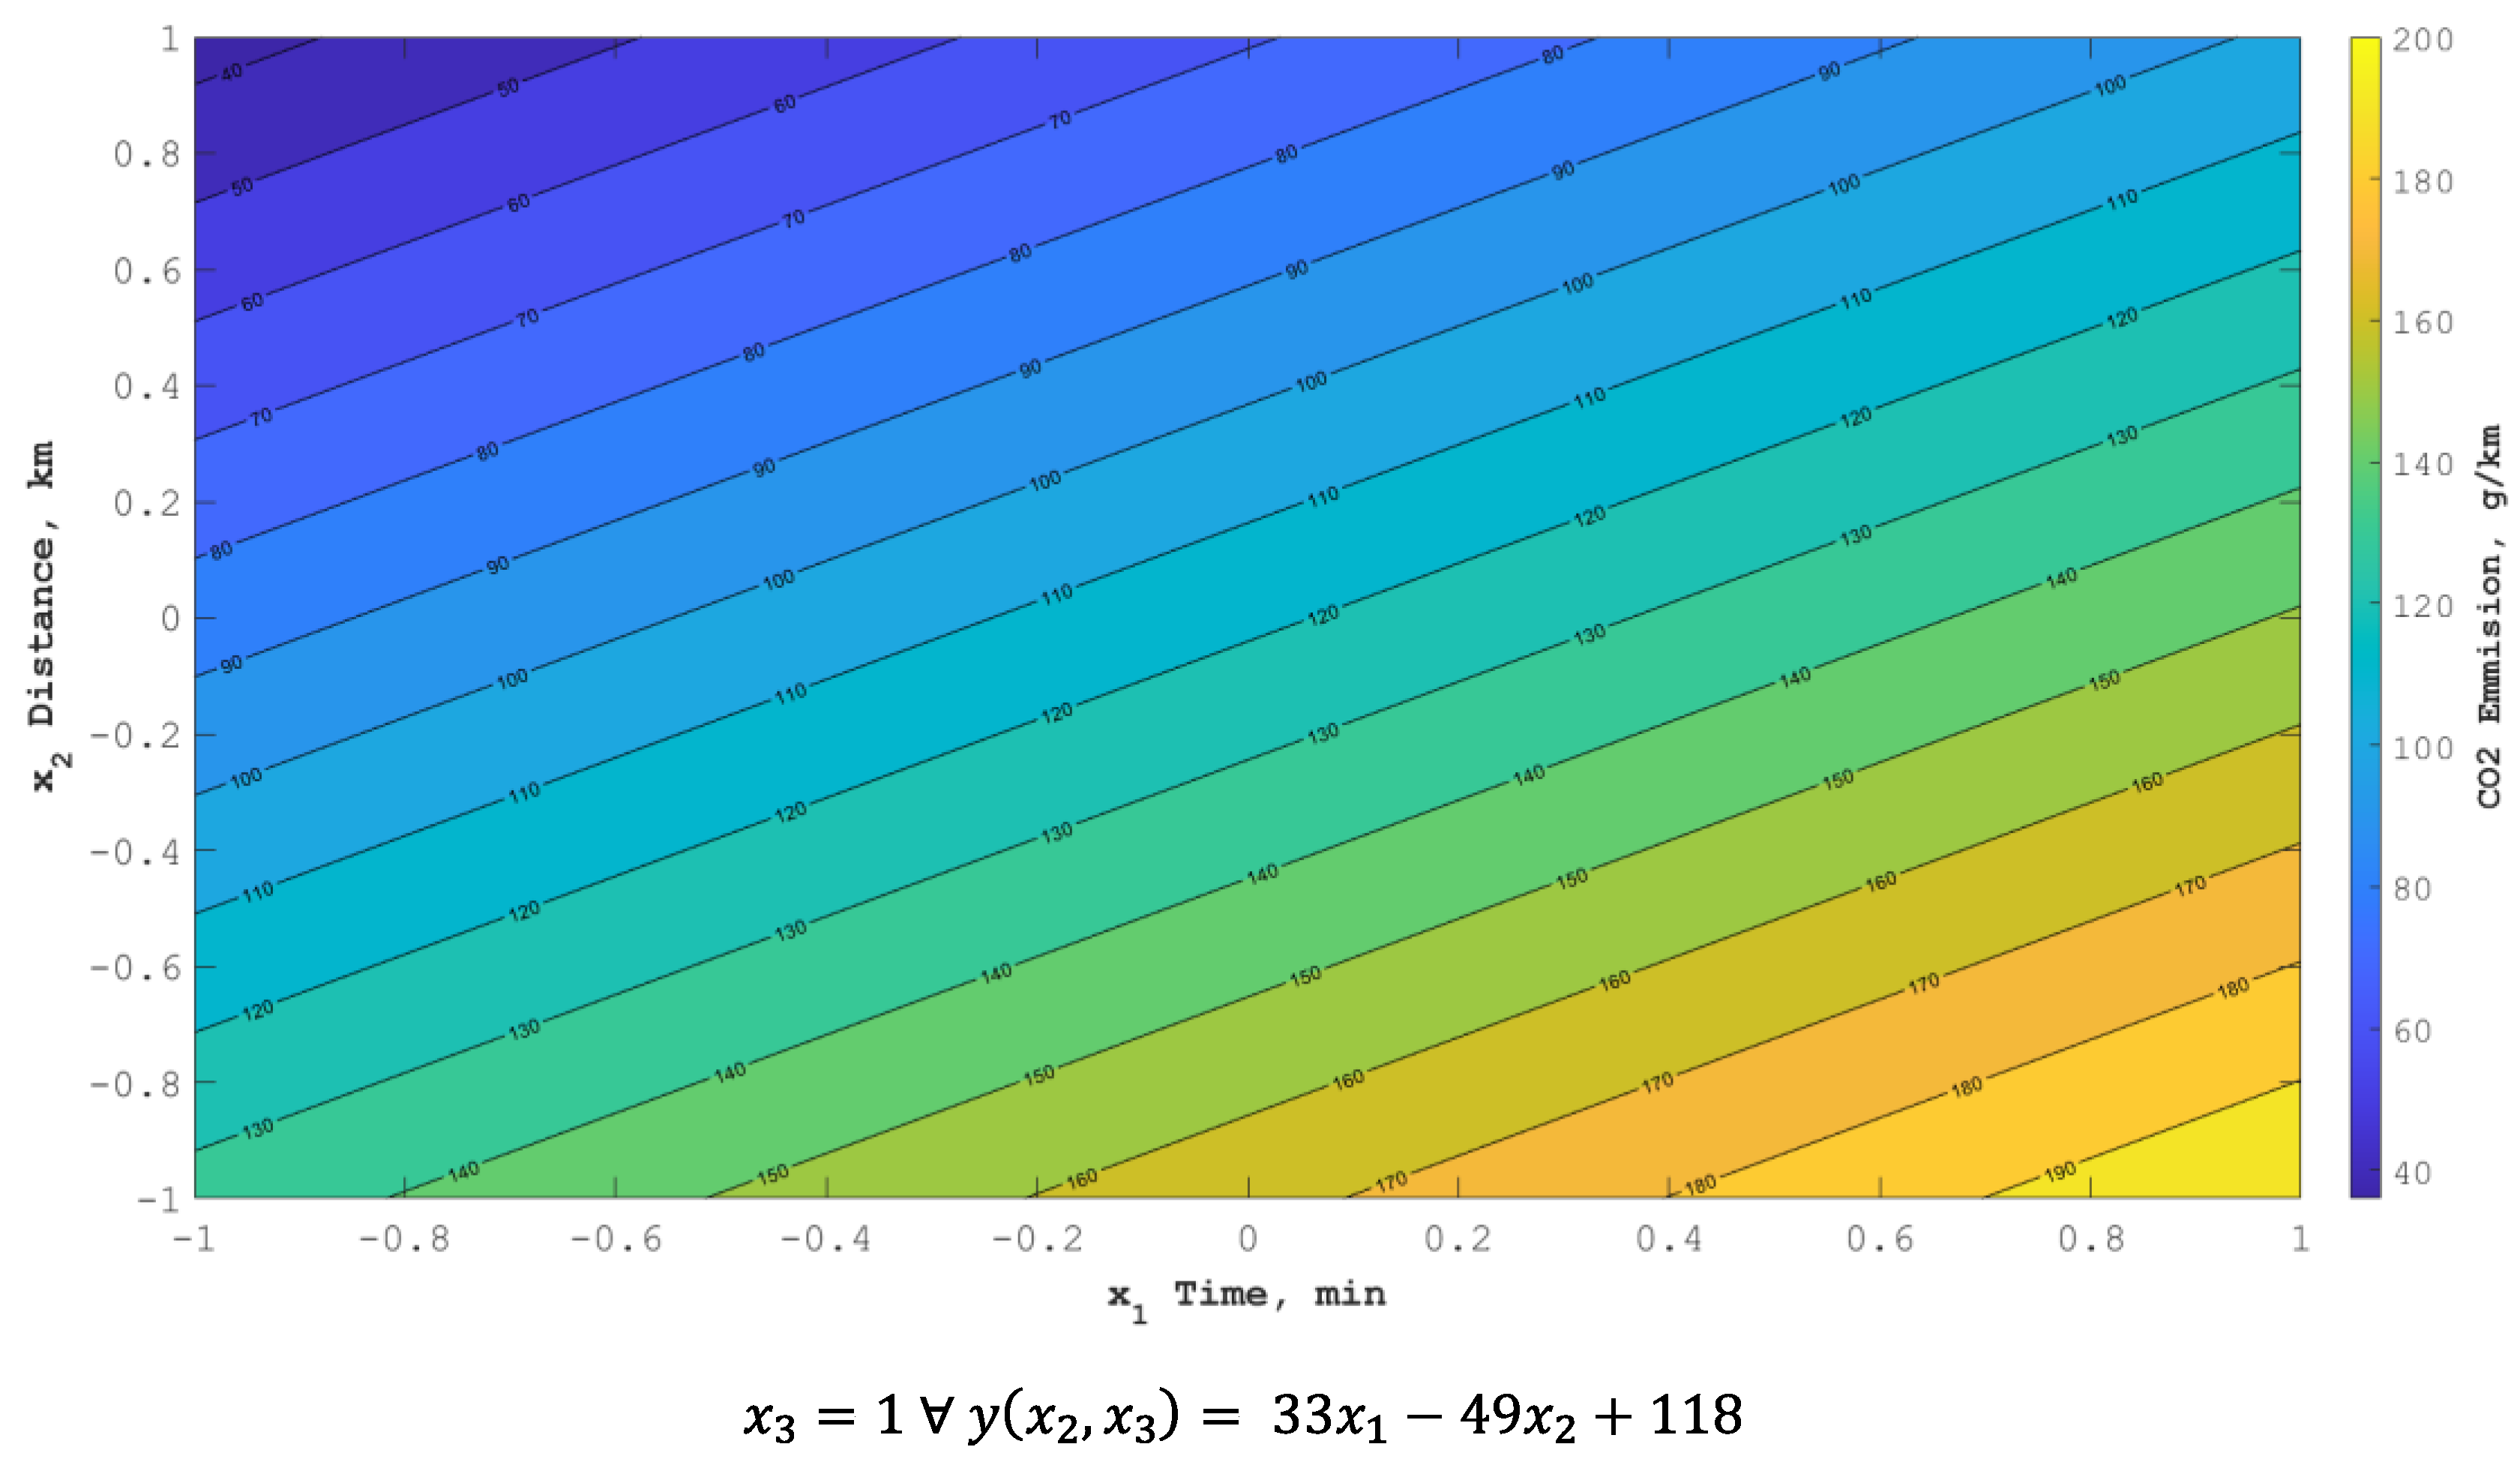
- factor x1—time of travel—can reduce carbon dioxide emissions in the range of 16–63%,
- the second of the examined factors x2,—distance—can reduce emissions in the range of 14–28%,
- factor x3—temperature—can reduce emissivity in the range of 16–65%.
- Implementation of appropriate rewards for the manner of driving the vehicle. For example, the remuneration for proper car-sharing journeys could be discounts for subsequent journeys or providing the possibility of traveling in premium or higher class cars (available only to customers meeting the conditions of eco-friendly driving). Furthermore, it is also possible to offer this kind of benefit in the form of gamification, which could increase the interest of users.
- Implementation of a kilometer fee not minute fee for vehicle rental.
Author Contributions
Funding
Institutional Review Board Statement
Informed Consent Statement
Data Availability Statement
Conflicts of Interest
References
- Commission of the European Communities. Communication from the Commission to the Council, the European Parliament, the European Economic and Social Committee and the Committee of the Regions. Towards a Thematic Strategy on the Urban Environment. Brussels, 11.02.2004 COM(2004)60 Final. Available online: https://www.europarl.europa.eu/meetdocs/committees/rett/20040316/com_com(2004)0060en.pdf (accessed on 12 February 2023).
- Directorate-General for Climate Action (European Commission). Going Climate-Neutral by 2050. A Strategic Long-Term Vision for a Prosperous, Modern, Competitive and Climate-Neutral EU. Available online: https://op.europa.eu/en/publication-detail/-/publication/92f6d5bc-76bc-11e9-9f05-01aa75ed71a1 (accessed on 5 July 2022).
- United Nations. 17 Goals to Transform Our World. Available online: https://www.un.org/sustainabledevelopment/ (accessed on 12 February 2023).
- United Nations. 13 Goal. Climate Action. Available online: https://unstats.un.org/sdgs/report/2021/goal-13/ (accessed on 5 July 2022).
- Cavallaro, F.; Danielis, R.; Nocera, S.; Rotaris, L. Should BEVs be subsidized or taxed? A European perspective based on the economic value of CO2 emissions. Transp. Res. Part D Transp. Environ. 2018, 64, 70–89. [Google Scholar] [CrossRef]
- Nocera, S.; Cavallaro, F. The competitiveness of alternative transport fuels for CO2 emissions. Transp. Policy 2016, 50, 1–14. [Google Scholar] [CrossRef]
- Harms, S.; Truffer, B. The Emergence of a Nationwide Carsharing Co-Operative in Switzerland, Research Report; EAWAG: Dübendorf, Switzerland, 1998. [Google Scholar]
- Kuhnert, F.; Stürmer, C.; Koster, A. Five trends transforming the Automotive Industry. Available online: https://www.pwc.at/de/publikationen/branchen-und-wirtschaftsstudien/eascy-five-trends-transforming-the-automotive-industry_2018.pdf (accessed on 5 June 2022).
- Shaheen, S. Carsharing Trends and Research Highlights. Available online: https://www.epa.gov/sites/production/files/2017-06/documents/05312017-shaheen.pdf (accessed on 5 June 2021).
- Shaheen, S. Peer-To-Peer (P2P) Carsharing: Understanding Early Markets, Social Dynamics, and Behavioral Impacts; Berkeley Institute of Transportation Studies: Berkeley, CA, USA, 2018. [Google Scholar] [CrossRef]
- Chen, T.D.; Kockelman, K.M. Carsharing’s life-cycle impacts on energy use and greenhouse gas emissions. Transp. Res. Part D Transp. Environ. 2016, 47, 276–284. [Google Scholar] [CrossRef]
- Amatuni, L.; Ottelin, J.; Steubing, B.; Mogollón, J.M. Does car sharing reduce greenhouse gas emissions? Assessing the modal shift and lifetime shift rebound effects from a life cycle perspective. J. Clean. Prod. 2020, 266, 121869. [Google Scholar] [CrossRef]
- Grischkat, S.; Hunecke, M.; Böhler, S.; Haustein, S. Potential for the reduction of greenhouse gas emissions through the use of mobility services. Transp. Policy 2014, 35, 295–303. [Google Scholar] [CrossRef]
- Giordano, D.; Vassio, L.; Cagliero, L. A multi-faceted characterization of free-floating car sharing service usage. Transp. Res. Part C Emerg. Technol. 2021, 125, 102966. [Google Scholar] [CrossRef]
- Karoń, G. Energy in Smart Urban Transportation with Systemic Use of Electric Vehicles. Energies 2022, 15, 5751. [Google Scholar] [CrossRef]
- Shaheen, S.; Martin, E.; Totte, H. Zero-emission vehicle exposure within U.S. carsharing fleets and impacts on sentiment toward electric-drive vehicles. Transp. Policy 2020, 85, A23–A32. [Google Scholar] [CrossRef]
- Luna, T.F.; Uriona-Maldonado, M.; Silva, M.E.; Vaz, C.R. The influence of e-carsharing schemes on electric vehicle adoption and carbon emissions: An emerging economy study. Transp. Res. Part D Transp. Environ. 2020, 79, 102226. [Google Scholar] [CrossRef]
- Vanheusden, W.; van Dalen, J.; Mingardo, G. Governance and business policy impact on carsharing diffusion in European cities. Transp. Res. Part D Transp. Environ. 2022, 108, 103312. [Google Scholar] [CrossRef]
- von Wieding, S.; Sprei, F.; Hult, C.; Hult, Å.; Roth, A.; Persson, M. Drivers and barriers to business-to-business carsharing for work trips—A case study of Gothenburg, Sweden. Case Stud. Transp. Policy 2022, 10, 2330–2336. [Google Scholar] [CrossRef]
- Arbeláez Vélez, A.M.; Plepys, A. Car Sharing as a Strategy to Address GHG Emissions in the Transport System: Evaluation of Effects of Car Sharing in Amsterdam. Sustainability 2021, 13, 2418. [Google Scholar] [CrossRef]
- Society of Motor Manufacturers and Traders. New Car CO2 Report 2018. Available online: https://www.smmt.co.uk/wp-content/uploads/sites/2/SMMT-New-Car-Co2-Report-2018-artwork.pdf (accessed on 6 June 2022).
- Baptista, P.; Melo, S.; Rolim, C. Energy, Environmental and Mobility Impacts of Car-sharing Systems. Empirical Results from Lisbon, Portugal. Procedia-Soc. Behav. Sci. 2014, 111, 28–37. [Google Scholar] [CrossRef]
- Nijland, H.; van Meerkerk, J.; Hoen, A. Impact of Car Sharing on Mobility and CO2 Emissions. PBL Notes 2015, 1842, 1–12. [Google Scholar]
- Lee, J.-B.; Byun, W.; Lee, S.H.; Do, M. Correlation between optimal carsharing locations and carbon dioxide emissions in urban areas. Int. J. Environ. Sci. Technol. 2014, 11, 2319–2328. [Google Scholar] [CrossRef]
- Ghosh, A. Electric Vehicles—Solution toward Zero Emission from the Transport Sector. World Electr. Veh. J. 2021, 12, 262. [Google Scholar] [CrossRef]
- Eurostat. Air Pollutants by Source Sector (Source: EEA). Available online: https://appsso.eurostat.ec.europa.eu/nui/show.do?dataset=env_air_emis&lang=en (accessed on 19 October 2021).
- Polish Electricity Committee. Contribution of the Polish energy sector in the implementation of global climate policy. Available online: https://pkee.pl/wp-content/uploads/2021/01/RAPORT_COP24_PL_3_12_final_1-1.pdf (accessed on 12 February 2023).
- Publications Office of the European Union. Directive 96/92/EC of the European Parliament and of the Council of 19 December 1996 Concerning Common Rules for the Internal Market in Electricity; Publications Office of the European Union: Brussels, Belgium, 1996. [Google Scholar]
- Rzeczpostpolita Portal. The Long Road of the Polish Energy Sector. Available online: https://www.rp.pl/biznes/art1645431-dluga-droga-polskiej-energetyki (accessed on 12 February 2023).
- Delloite. Shared Mobility in Poland. Overview. Available online: https://www.teraz-srodowisko.pl/media/pdf/aktualnosci/6982-mobility-in-poland-2019.pdf (accessed on 5 June 2022).
- Research and Market Portal. Shared Mobility Market Size, Share & Trends Analysis Report by Service Model (Ride Hailing, Bike Sharing, Ride Sharing), by Vehicle Type (Cars, Two-Wheelers), by Region (North America, Europe, APAC, Latin America), and Segment Forecasts, 2022–2030. Available online: https://www.researchandmarkets.com/reports/5595792/shared-mobility-market-size-share-and-trends?utm_source=BW&utm_medium=PressRelease&utm_code=qr3qtb&utm_campaign=1704132+-+World+Shared+Mobility+Market+Analysis+Report+2022-2030+Featuring+Car2Go%2c+Deutsche+Bahn+Connect%2c+Didi+Chuxing%2c+Drive+Now%2c+Evcard%2c+Flinkster%2c+Grab%2c+Greengo%2c+Lyft%2c+Uber%2c+%26+Zipcar&utm_exec=chdo54prd (accessed on 5 June 2022).
- Statista. Forecast Revenues from Carsharing Services in Poland from 2019 to 2025. Available online: https://www.statista.com/statistics/1059362/poland-carsharing-revenues/ (accessed on 5 June 2022).
- Turoń, K.; Kubik, A.; Chen, F. Operational Aspects of Electric Vehicles from Car-Sharing Systems. Energies 2019, 12, 4614. [Google Scholar] [CrossRef]
- Polański, Z. Modern Methods of Experimental Research; Common Knowledge: Warsaw, Poland, 1978. [Google Scholar]
- Turoń, K.; Kubik, A.; Chen, F. What Car for Car-Sharing? Conventional, Electric, Hybrid or Hydrogen Fleet? Analysis of the Vehicle Selection Criteria for Car-Sharing Systems. Energies 2022, 15, 4344. [Google Scholar] [CrossRef]
- Rob, T. Automotive Technology. A Systems Approach; Cengage Learning, Inc.: Boston, MA, USA, 2014; ISBN 9781133612315. [Google Scholar]
- Monitor Polish Official Journal of The Republic of Poland. Announcement of the Minister of Climate and Environment of October 7, 2022 on the rates of fees for the use of the environment for 2023. Available online: https://isap.sejm.gov.pl/isap.nsf/download.xsp/WMP20220001009/O/M20221009.pdf (accessed on 23 January 2023).
- Wang, Y.; Zhao, H.; Yin, H.; Yang, Z.; Hao, L.; Tan, J.; Wang, X.; Zhang, M.; Li, J.; Lyu, L.; et al. Quantitative study of vehicle CO2 emission at various temperatures and road loads. Fuel 2022, 320, 123911. [Google Scholar] [CrossRef]
- Buberger, J.; Kersten, A.; Kuder, M.; Eckerle, R.; Weyh, T.; Thiringer, T. Total CO2-equivalent life-cycle emissions from commercially available passenger cars. Renew. Sustain. Energy Rev. 2022, 159, 112158. [Google Scholar] [CrossRef]
- Krajowy Plan Odbudowy. Available online: https://www.gov.pl/web/planodbudowy (accessed on 13 February 2023).


| Electric Engine (EE) | Internal Combustion Engine (ICE) | |
|---|---|---|
| Engine power [kW] | 80 | 48 |
| Maximum torque [Nm] | 225 | 95 |
| Vehicle length [mm] | 4085 | 4050 |
| Vehicle width [mm] | 1787 | 1798 |
| Vehicle weight [kg] | 1502 | 1190 |
| Top speed [km/h] | 135 | 178 |
| Number of seats [-] | 5 | 5 |
| Range [km] | 395 | 970 |
| Sample No. | Standardized Scale Input Factors | Real Scale Input Factors | Results | ||||
|---|---|---|---|---|---|---|---|
| x1 Time (min) | x2 Distance (km) | x3 Temperature (°C) | x1 Time (min) | x2 Distance (km) | x3 Temperature (°C) | CO2 emission (g/km) | |
| 1 | –1 | –1 | 1 | 30 | 2 | 25 | 167.1 |
| 2 | 1 | –1 | –1 | 10 | 2 | 15 | 306.3 |
| 3 | –1 | 1 | –1 | 30 | 4 | 15 | 177.4 |
| 4 | 1 | 1 | 1 | 10 | 4 | 25 | 169.9 |
| 5 | –α | 0 | 0 | 30 | 3 | 20 | 153.3 |
| 6 | α | 0 | 0 | 10 | 3 | 20 | 294.6 |
| 7 | 0 | –α | 0 | 20 | 2 | 20 | 194.6 |
| 8 | 0 | α | 0 | 20 | 4 | 20 | 260.7 |
| 9 | 0 | 0 | –α | 20 | 3 | 15 | 275.4 |
| 10 | 0 | 0 | α | 20 | 3 | 25 | 149.8 |
| 11 | 0 | 0 | 0 | 20 | 3 | 20 | 236.2 |
| Sample No. | Input Factors on a Standardized Scale | Real Scale Input Factors | Results | ||||
|---|---|---|---|---|---|---|---|
| x1 | x2 | x3 | x1 Time (min) | x2 Distance (km) | x3 Temperature (°C) | CO2 Emission (g/km) | |
| 1 | –1 | –1 | 1 | 30 | 2 | 25 | 102.0 |
| 2 | 1 | –1 | –1 | 10 | 2 | 15 | 272.3 |
| 3 | –1 | 1 | –1 | 30 | 4 | 15 | 161.3 |
| 4 | 1 | 1 | 1 | 10 | 4 | 25 | 102.0 |
| 5 | –α | 0 | 0 | 30 | 3 | 20 | 93.8 |
| 6 | α | 0 | 0 | 10 | 3 | 20 | 249.0 |
| 7 | 0 | –α | 0 | 20 | 2 | 20 | 170.3 |
| 8 | 0 | α | 0 | 20 | 4 | 20 | 204.0 |
| 9 | 0 | 0 | –α | 20 | 3 | 15 | 226.5 |
| 10 | 0 | 0 | α | 20 | 3 | 25 | 90.8 |
| 11 | 0 | 0 | 0 | 20 | 3 | 20 | 204.0 |
| Sample No. | Results ICE | Results EV | ||
|---|---|---|---|---|
| ICE CO2 Emission (g/km) | EV CO2 Emission (g/km) | ∆ = ICE-EV CO2 Emission (g/km) | ∆ = ICE-EV CO2 Emission % | |
| 1 | 167.1 | 102.0 | 65 | 64% |
| 2 | 306.3 | 272.3 | 34 | 12% |
| 3 | 177.4 | 161.3 | 16 | 10% |
| 4 | 169.9 | 102.0 | 68 | 67% |
| 5 | 153.3 | 93.8 | 60 | 63% |
| 6 | 294.6 | 249.0 | 46 | 18% |
| 7 | 194.6 | 170.3 | 24 | 14% |
| 8 | 260.7 | 204.0 | 57 | 28% |
| 9 | 275.4 | 226.5 | 49 | 22% |
| 10 | 149.8 | 90.8 | 59 | 65% |
| 11 | 236.2 | 204.0 | 32 | 16% |
Disclaimer/Publisher’s Note: The statements, opinions and data contained in all publications are solely those of the individual author(s) and contributor(s) and not of MDPI and/or the editor(s). MDPI and/or the editor(s) disclaim responsibility for any injury to people or property resulting from any ideas, methods, instructions or products referred to in the content. |
© 2023 by the authors. Licensee MDPI, Basel, Switzerland. This article is an open access article distributed under the terms and conditions of the Creative Commons Attribution (CC BY) license (https://creativecommons.org/licenses/by/4.0/).
Share and Cite
Kubik, A.; Turoń, K.; Folęga, P.; Chen, F. CO2 Emissions—Evidence from Internal Combustion and Electric Engine Vehicles from Car-Sharing Systems. Energies 2023, 16, 2185. https://doi.org/10.3390/en16052185
Kubik A, Turoń K, Folęga P, Chen F. CO2 Emissions—Evidence from Internal Combustion and Electric Engine Vehicles from Car-Sharing Systems. Energies. 2023; 16(5):2185. https://doi.org/10.3390/en16052185
Chicago/Turabian StyleKubik, Andrzej, Katarzyna Turoń, Piotr Folęga, and Feng Chen. 2023. "CO2 Emissions—Evidence from Internal Combustion and Electric Engine Vehicles from Car-Sharing Systems" Energies 16, no. 5: 2185. https://doi.org/10.3390/en16052185
APA StyleKubik, A., Turoń, K., Folęga, P., & Chen, F. (2023). CO2 Emissions—Evidence from Internal Combustion and Electric Engine Vehicles from Car-Sharing Systems. Energies, 16(5), 2185. https://doi.org/10.3390/en16052185