Review

A Decade Review of the Art of Inspection and Monitoring Technologies for Long-Distance Oil and Gas Pipelines in Permafrost Areas

1
Pipechina Research Institute, Langfang 065000, China
2
Pipechina Northern Pipeline Company, Langfang 065000, China
3
National Engineering Laboratory for Pipeline Safety/MOE Key Laboratory of Petroleum Engineering/Beijing Key Laboratory of Urban Oil and Gas Distribution Technology, China University of Petroleum-Beijing, Beijing 102249, China
*
Author to whom correspondence should be addressed.
Energies 2023, 16(4), 1751; https://doi.org/10.3390/en16041751
Submission received: 3 January 2023 / Revised: 3 February 2023 / Accepted: 6 February 2023 / Published: 9 February 2023

Abstract

:
Long-distance oil and gas pipelines buried in permafrost areas will inevitably encounter typical geological disasters, such as frost heave and thaw settlement and sliding, which easily cause pipeline displacement, bending, or deformation. When there are certain defects in the pipeline, additional complex, external stress will further lead to the failure of the pipeline or weld and can even lead to serious accidents such as pipeline leakage, pipe burst, or fracture. This paper introduces in detail the typical defects and risks of buried pipelines in permafrost areas and summarizes the in-line inspection technologies, off-line inspection technologies, and integrated monitoring systems for pipelines in the pipeline industry. Regarding pipelines in permafrost areas, in-line inspection methods may be employed. These include magnetic flux leakage, electromagnetic eddy current, ultrasonic, IMU, and electromagnetic acoustic transducer inspections. Off-line inspection is also one of the important means of inspecting a pipeline in a permafrost area. Indirect inspection is combined with verification by direct inspection to check and evaluate the integrity of the anticorrosive coating and the effectiveness of the cathodic protection for the pipeline. Meanwhile, considering the external environment of a pipeline in a permafrost area, a monitoring system should be developed and established. This paper discusses and projects the future development of related technologies, which provides reference for the construction and operation of pipelines in permafrost areas.

1. Introduction

The continuous development of society and the economy entails the fast, efficient, and safe transportation of energy, which becomes a significant factor restricting economic growth and social development [1,2]. Gradually, long-distance pipelines have developed into the main method of transporting petroleum and natural gas. Due to their extensiveness, long-distance pipelines inevitably traverse areas exposed to a variety of geological hazards, including permafrost areas [3,4,5]. As the country with the largest permafrost area in the world, the Soviet Union (including now Russia) has extensive experience in the construction of permafrost pipelines [6,7,8]. In 1960, the Soviet Union began paving an oil and gas pipeline across a permafrost area. In 1963, the Soviet Union completed the Friendship Oil Pipeline. With a diameter ranging from 1020 mm to 426 mm and a total length of 4665 km, the Friendship Oil Pipeline transported crude oil to Eastern European countries. At the time [9,10], the upsurge of pipeline construction in the Soviet Union coincided with the great discovery and development of oil and gas in West Siberia. The first oil fields began to produce oil in 1965, and the total length of the Soviet Union’s main oil routes reached 32,344 km by 1971. In 1977, the Alaska pipeline, extending nearly 1289 km, was put into operation. In 1985, the Norman Wells pipeline in Canada was successfully completed and put into service [3,4,5]. Beginning in 1972, the Medvezhye–Nadym–Punga gas pipeline was constructed in the Medvezhye field, which is located in the tundra, for the transportation of natural gas. Only a 1420 mm diameter pipeline was used. In the early 1980s, Russia completed a natural gas export pipeline connecting West Siberia to Europe. Gas entered France through the Soviet Union, Czechoslovakia, Austria, and Germany [11].
In 2011 and 2018, the Mohe–Daqing Lines 1 and 2 of the China–Russia Crude Oil Pipeline were put into production and operation, respectively, in China. Among them, the Mohe–Daqing pipeline traverses the permafrost and seasonal frozen soil areas in the Greater Khingan Mountains. From its initial station in Mohe to Dayangshu Town, the pipeline extends through a permafrost area 441 km long, including areas of continuous, discontinuous, and segregated permafrost [12,13,14,15]. These permafrost areas are interspersed with marshes, riverbeds, floodplains, and steep slopes. The buried pipelines in permafrost areas inevitably encounter geological hazards such as frost heave, thaw settlement, and thaw sliding, which can easily lead to the deformation and displacement of the pipeline, threatening its safe operation. In view of this, this paper investigates and summarizes different techniques and methods to obtain some conclusions.
In-line inspection (ILI) has such advantages as a high inspection efficiency, low cost, and a high recognition rate; it is therefore a common inspection method for long-distance oil and gas pipelines worldwide. These technologies use a pipeline inspection tool (PIG) in combination with different types of sensors, which are driven by a medium inside the pipeline to inspect and record pipeline deformation during operation, including the pit and ellipse, metal loss, stress and strain, and cracking. The ILI allows for the identification of pipeline defects and their hazard severity without excavation. However, inspection data are often affected by different conditions during internal geometry inspection. It is necessary to analyze and determine the inspection tool and technology for different circumstances.
The techniques and measuring equipment used for aboveground coating inspections are well established. These include the close interval potential survey (CIPS), direct current voltage gradient (DCVG), alternating current voltage gradient (ACVG), and aboveground survey techniques, which combine indirect inspections and direct dig verifications to evaluate the pipeline coating condition and cathodic protection system. Non-contact inspection is employed above ground to locate defects in the pipeline coating. Meanwhile, the disturbance from stray current is also tested and evaluated. Excavation is carried out to verify the actual dimensions of defects, soil electric conductivity, etc. Finally, repair and maintenance advice is put forward based on the inspection and evaluation.
The main effect of permafrost on a pipeline is the vertical uplift or settlement of the pipeline; therefore, monitoring the vertical displacement of a pipeline can vividly reflect the safety statement of the pipeline and the development of permafrost hazards. At present, many technologies have been developed to monitor ground displacement. However, it is very difficult to monitor surface displacement in the vicinity of a pipeline using common methods, as permafrost areas are often covered by ice and snow in the winter, causing a very low ambient temperature (as low as −50 °C). They are also easily turned into marsh and wetlands in summer, making it difficult for staff to enter. Pipeline displacement monitoring is more complicated than surface displacement monitoring. At present, a mechanical displacement monitoring technology is mainly adopted.
When a pipeline in a permafrost area is in operation, the overall safety and reliability of the pipeline system depends on the control over the pipeline and soil conditions, apart from metal loss, pit, and other pipeline defects. Among these parameters, the temperature of the medium during transportation, the temperature field of the soil around pipeline, and the deformation and displacement of the pipeline are the direct and significant parameters that reflect the state of pipeline [14,15]. It is possible to learn about the state, ambient temperature, pipeline stress, strain, displacement, and other important parameters of pipeline in a timely and effective manner by performing in-line and off-line inspections and establishing an integrated monitoring system for pipelines in permafrost areas. It is of great value and significance to guarantee the safety and long-term stability of pipelines, the economic reasonableness of maintenance measures, and to facilitate engineering and scientific research on pipelines in permafrost areas. In summary, this paper discusses and predicts the future development of related technologies, providing reference for the construction and operation of pipelines in permafrost areas.

2. Defects and Risks of Pipelines in Permafrost Areas

At present, the completed, under-construction, and planned pipelines in permafrost areas around the world include the Roman Wells oil pipeline in discontinuous permafrost in Canada, the Siberian pipeline above permafrost in the Russian Far East, the Alaska oil pipeline, of which 70% is across permafrost in North America, and the pipeline network in the cold regions of China [16,17,18,19,20] (including the Northeast China Oil Pipeline, Geermu–Lhasa Oil Pipeline, China–Kazakhstan Gas Pipeline, China–Russia Crude Oil Pipeline, and the China–Myanmar Oil and Gas Pipeline), which was initiated in the 1970s and has been shaped gradually. The pipelines in permafrost areas often face very cold weather, complex hydrological and meteorological conditions, and engineering geological conditions, which inevitably disturb and even destroy the permafrost environment in the process of construction and operation. On the contrary, pipelines may also warp, sink, flatten, crack, or even break under the influence of the changing permafrost environment. The heat transfer between the pipeline and permafrost may affect the migration and ice formation of water in the permafrost, which further speeds up the change of the surrounding permafrost. Hence, a pipeline in a permafrost area also faces the problems of thaw sliding, frost heave, thaw settlement, and pipeline warping in addition to defects such as metal loss and geometry deformation.
Thaw sliding is a serious geological problem encountered in the operation of the pipeline in a permafrost area. The heat balance of the permafrost is severely affected by pipeline trench excavation and vegetation destruction. For some ice-containing slopes (especially in ice-rich regions), construction is often carried out in the winter. After the pipeline is backfilled, the permafrost in the pipeline trench easily causes a thaw slope collapse because of the operating temperature change of the pipeline, damage to vegetation and trees along the pipeline route, climate warming, and other factors. For this reason, a stress concentration occurs in the relevant bottom areas of the slope and leads to yield bending.
When pipelines are buried in a permafrost area, water molecules in the permafrost migrate from a relatively warm region to a relatively cold region in the form of a water membrane. After water is frozen, its significantly increasing volume leads to the expansion of the soil volume, which pushes the pipeline away from its original laying path and makes it move upward, resulting in bending deformation. Ice cones and frost heave mounds are two typical adverse phenomena of frost heave and may cause two types of hazards. One such hazard is the warping deformation of the pipeline, effected when the ice cone and frost heave mound intrude into the pipeline foundation and cause its uplift. If the deformation exceeds the design’s allowable value, the pipeline will be damaged or even ruptured. The other hazard is the settlement displacement of and even damage to pipelines that can be caused when ice cones and frost heave mounds thaw in warm summer weather.
While pipeline warping is caused by the frost heave of soil, the thermal stress relief (ΔT) arising from the temperature difference of pipelines under construction and during operation in alpine areas exerts a significant effect. The construction of a pipeline in a permafrost area is normally conducted in the winter, with the ambient temperature of nearly −40 °C; however, the temperature may be positive when the pipeline is in operation. This extreme temperature difference imposes tremendous stress on pipelines and causes their thermal expansion. In addition to the uplift caused by frost heave, pipelines are very prone to warping. During the construction of the Norman Wells pipeline, the pipelines required heating before being lowered into the trench. However, warping was often encountered [21]. The Geermu–Lhasa pipeline in China has been in operation for three decades and has experienced more than 30 leakage and perforation accidents [22]. Most of these accidents were caused by pipeline warping due to frost heave in low temperatures and thermal stress relief.

3. In-Line Inspection Technologies

In-line inspection (ILI) has advantages, such as its high inspection efficiency, low cost, and high recognition rate. It is therefore a common inspection method for long-distance oil and gas pipelines worldwide [23,24]. These technologies use a pipeline inspection tool (PIG) in combination with different types of sensors, which are driven by a medium inside the pipeline to inspect and record pipeline deformation during operation, including pit and ellipse, metal loss, stress and strain, and cracking. After inspection, the PIG can analyze the collected data and indicate the location of these defects for excavation and repair [25,26]. Most oil and gas pipelines are buried in the ground, and ILI allows for the identification of defects and their severity of hazard without excavation. By virtue of applicability evaluation, integrity evaluation, and other techniques, excavation can be conducted first to repair the defective parts of a pipeline, so as to prevent and effectively reduce accidents and reduce the expenses of pipeline repair. Therefore, this offers a significant way to guarantee the safety of a pipeline.

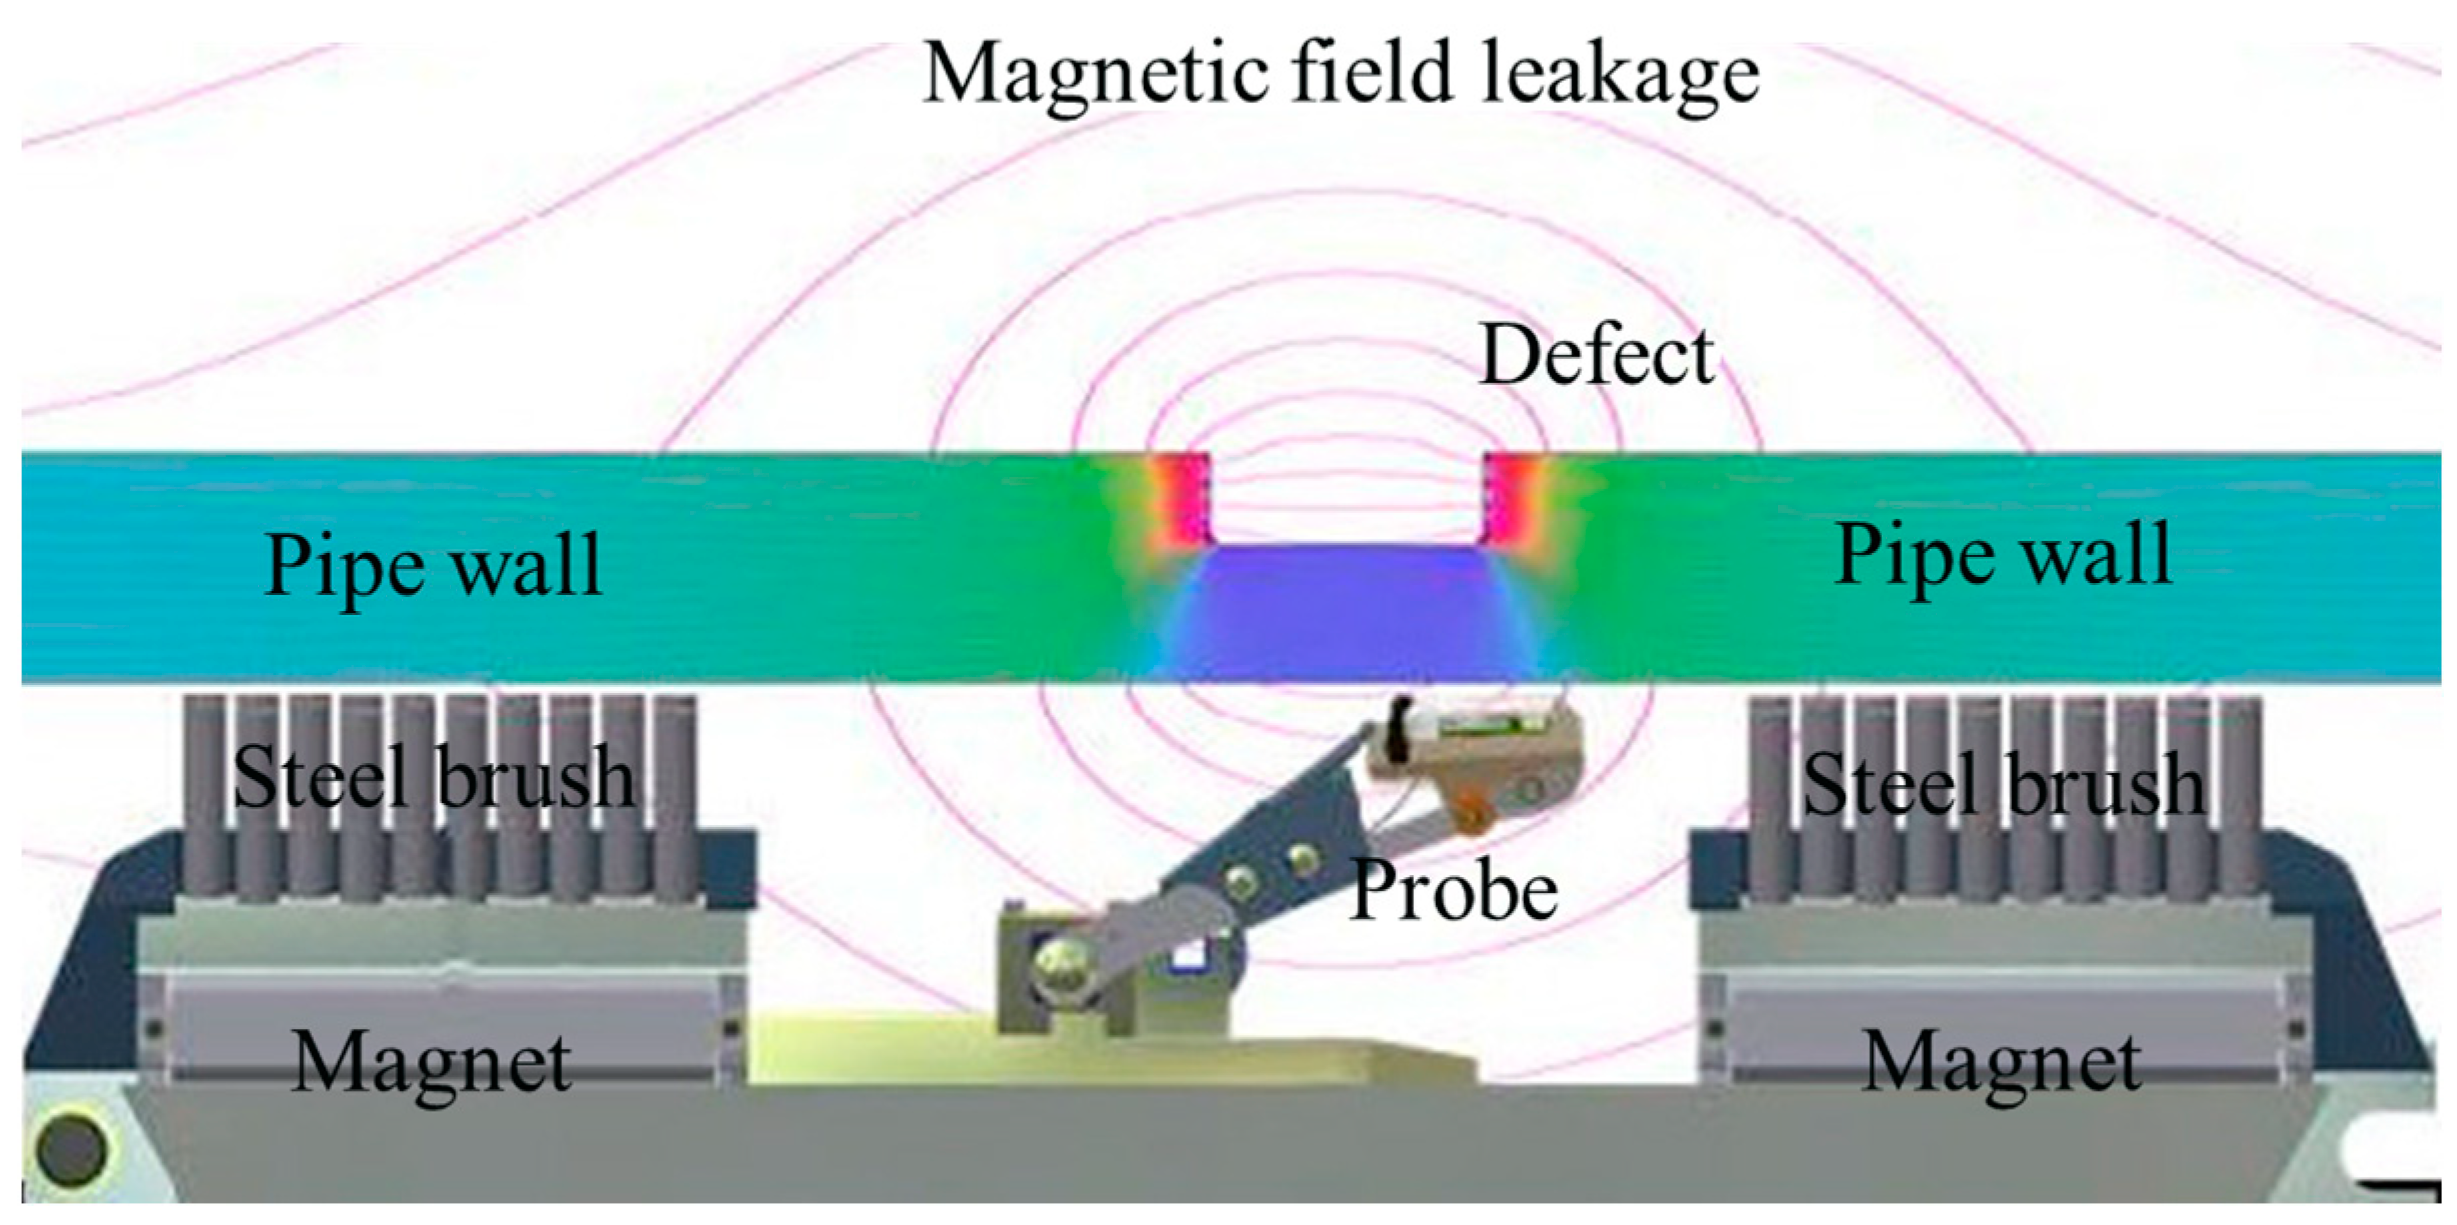
3.1. High-Resolution Pipeline Magnetic Flux Leakage Inspection

Magnetic flux leakage inspection is the most widely used and most mature technology for inspecting pipeline defects through ferromagnetic inspection [27], as is shown in Figure 1. After ferromagnetic pipeline walls are magnetized, magnetic field leakage is caused at any defective position of the pipeline wall. The leaked magnetic lines of force will deviate from the original direction of magnetic field after refraction, experiencing the corresponding component intensity distribution variation in three-dimensional directions. They are then converted by a Hall element into induced voltage signals [28,29]. When the other conditions for the Hall element are given, the Hall voltage directly indicates the magnitude of the magnetic induction intensity in parallel with the normal direction of the Hall element. At present, varieties of magnetic flux leakage inspection technology include three-axis, high-resolution magnetic flux leakage inspection technology, circumferential excitation magnetic flux leakage in-line inspection technology, three-dimensional pulse magnetic flux [30,31,32] leakage in-line inspection technology, and rotating magnetic flux leakage in-line inspection technology. Among these methods, three-axis, high-resolution magnetic flux leakage inspection requires sensors placed in three directions, in addition to the existing probes, to detect the intensity of magnetic field leakage at any defective pipeline wall by virtue of the three-axial orthogonal sensors. This technology can use the sensor axially perpendicular to the pipeline to measure the variation in the axial magnetic field intensity, the sensor radially perpendicular to the pipeline surface to measure the variation in the radial magnetic field intensity, and the sensor circumferentially perpendicular to the pipeline [33,34,35] to measure the variation in the circumferential magnetic field intensity, thereby improving the accuracy of defect inspection.
Magnetic flux leakage PIG mainly employs three types of excitations, including axial excitation, circumferential excitation, and spiral excitation. Axial excitation uses permanent magnets for maturation magnetization on the inspected pipeline wall in the axial direction, and the magnetic lines of force are parallel to the axial direction of the pipeline [36,37,38]. Therefore, it can achieve very good results in detecting the defects subject to non-axial distribution. The ROSEN Company uses axial excitation for its in-line inspection tool; its inspection accuracy for different types of defects is provided in Table 1.
Circumferential excitation utilizes permanent magnets for saturation magnetization on the inspected pipeline wall in the circumferential direction, generating a magnetic field around the circumference of pipeline [39,40]. The magnetic lines of force are vertical to the axial direction of the pipeline, so that axial defects can significantly change the distribution of the magnetic field and thus be easily detected. For instance, the ROSEN Company’s circumferential magnetic flux leakage tool employs circumferential excitation, and its inspection accuracy for different types of defects is shown in Table 2.
In order to resolve the problem of the tool, which is insensitivity to narrow and long metal loss and cracking parallel to the magnetic lines of force, the spiral excitation generates the magnetic field distribution, spiraling around the pipeline, by spirally arranging permanent magnets. Typically, the TDW Company develops the spiral magnetic flux leakage tool based on spiral magnetization to inspect and measure the cracks and the narrow and long defects in all directions.
Compared to other nondestructive testing methods (e.g., ray and ultrasonic), magnetic flux leakage inspection has the following advantages: (1) it can simultaneously inspect the defects on the inner and external walls of pipeline; (2) it is highly reliable and accurate, lowering the influence of human factors; (3) it can inspect oil and gas pipelines without a coupling agent; and (4) it can perform axial, circumferential, and radial inspections of a pipeline. However, this inspection method is limited in the following aspects: (1) it is applicable to the inspection of ferromagnetic materials but is not suitable for the inspection of nonmetallic and composite materials; and (2) in practice, the shape of defects do not correspond with the inspection signal. Therefore, the theory of defect quantification should be further explored.

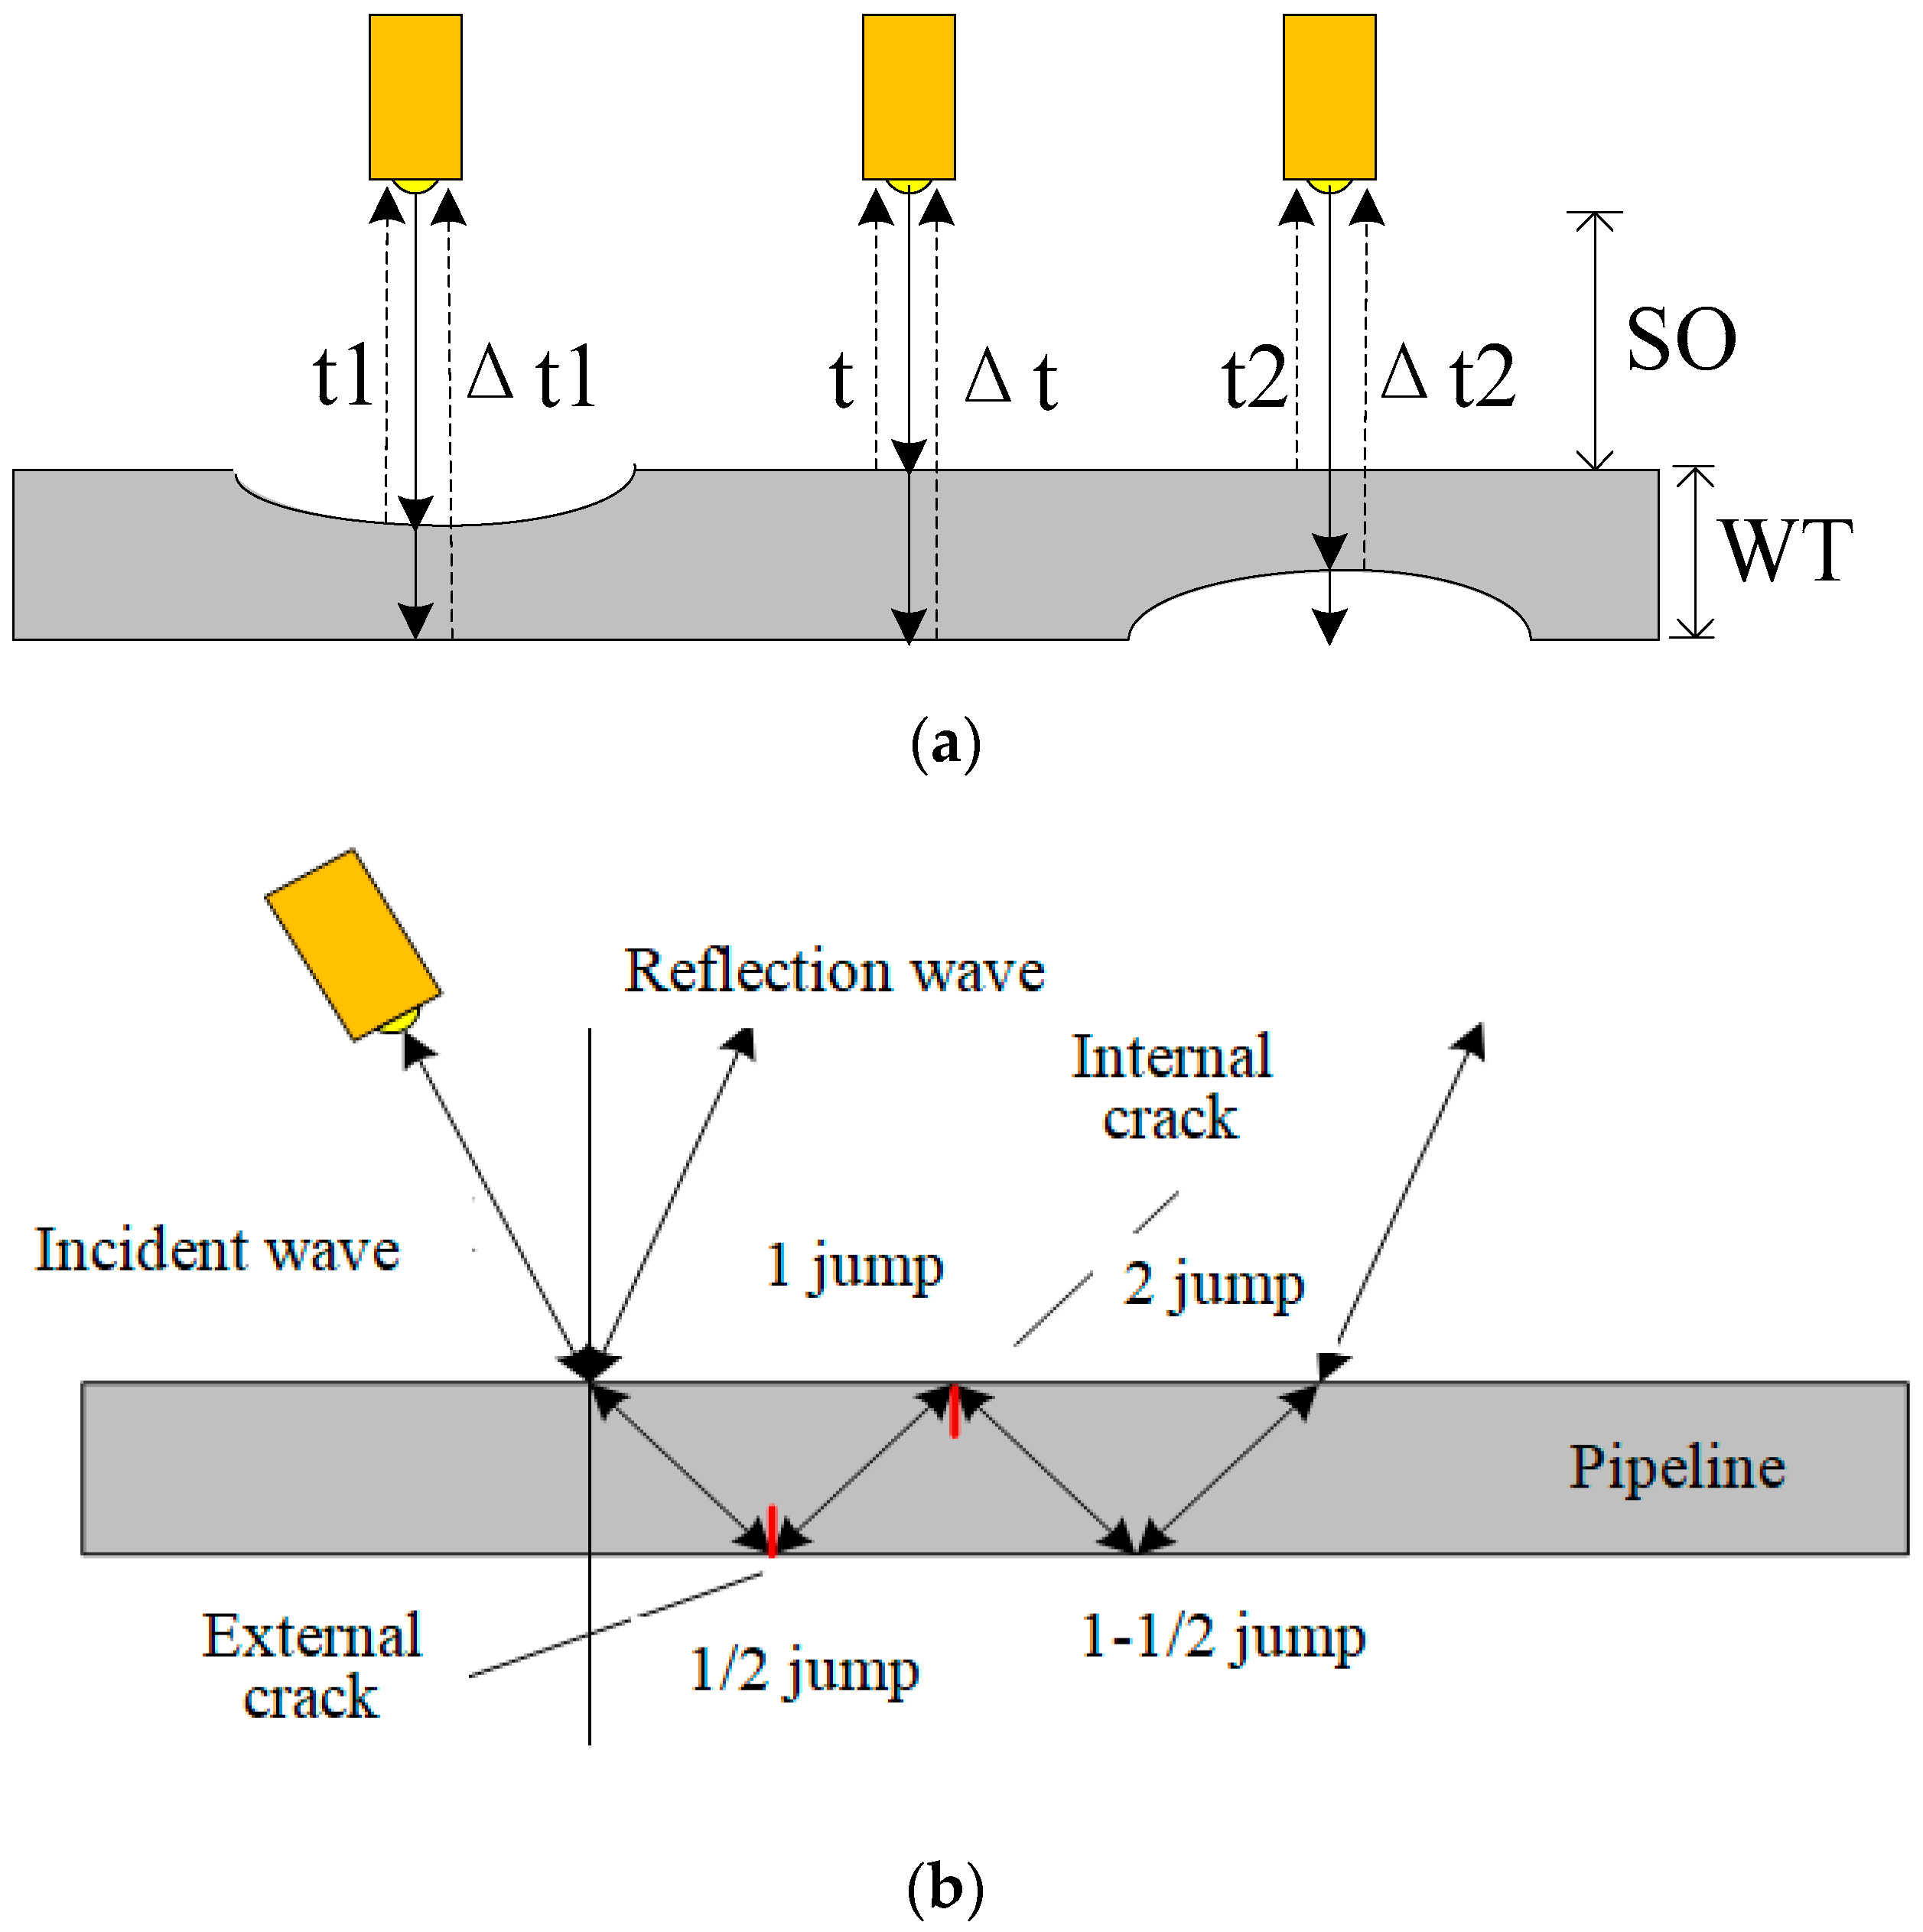
3.2. Ultrasonic In-Line Inspection

Ultrasonic in-line inspection is based on the principles of ultrasonic measurement for pulse echo time. An ultrasonic probe transmits an ultrasonic pulse to the pipeline wall, and the ultrasonic pulse is reflected when it reaches the edge or defect of pipeline wall [25,41]. The reflected ultrasonic waves are then received by the receiver. The reflection time of the echo signal and the characteristics of the signals are evaluated to predict their position and size. There are two types of ultrasonic in-line inspection technology: one is the transmission of an ultrasonic pulse in the direction perpendicular to the pipeline wall, as is shown in Figure 2a. The ultrasonic pulse is reflected twice by the inner and outer surfaces of the pipeline wall. The time at which the receiver receives the pulse twice is used to calculate the distance from the receiver to the inner wall of pipeline as well as the pipeline wall thickness, so as to identify and quantify the volumetric defects. The second method involves the transmission of a 45° shear wave to the pipeline wall, which is reflected at any defect, as is shown in Figure 2b. The defects, such as a stress corrosion crack (SCC) or circumferential crack, can be detected by the ultrasonic technology [42,43,44,45].
At present, the ultrasonic in-line inspection of a pipeline is mainly achieved by using a phased array ultrasonic inspection tool which consists of closely arranged probes. Several neighboring probes form a probe group. In a probe group, probes can transmit ultrasonic pulse signals at different directions and angles in a time sequence, realizing a higher resolution and inspection accuracy. Hence, this method can not only inspect metal corrosion and crack but can also detect different types of defects, such as stress corrosion cracking, fatigue cracking, and welding cracking [46,47,48]. The NDT Company develops an EVO SERIES 1.0 UC ultrasonic inspection tool, which is mainly used in crack inspection. In the gauge, an ultrasonic probe can be used as both the transmitter and receiver. The tool transmits a 45° shear wave to pipeline wall and utilizes a pulse echo technique. Therefore, it can greatly detect tiny cracks with a depth of more than 1 mm. The specific inspection accuracy is given in Table 3. Additionally, the NDT Company also develops an EVO SERIES 1.0 UMp inspection tool for corrosion inspection. For defects with a diameter of more than 5 mm and a depth of more than 0.8 mm, the tool’s probability of detection (POD) is greater than or equal to 90%, and the defect depth measurement accuracy is up to ±0.4 mm.
Compared with other in-line inspection technologies, ultrasonic in-line inspection has the following advantages: (1) ultrasonic waves propagate along a straight line in the medium, so they are greatly directional; (2) ultrasonic waves have strong penetration, so this technology is suitable for pipelines of any wall thickness; (3) it is highly sensitive and greatly capable of detecting corrosion and crack defects; and (4) it can identify internal defects from external defects. However, it has very high requirements for the cleanness of the pipeline surface. Ultrasonic waves can propagate through liquid for coupling, so this technology can be only used for liquid transportation pipelines.

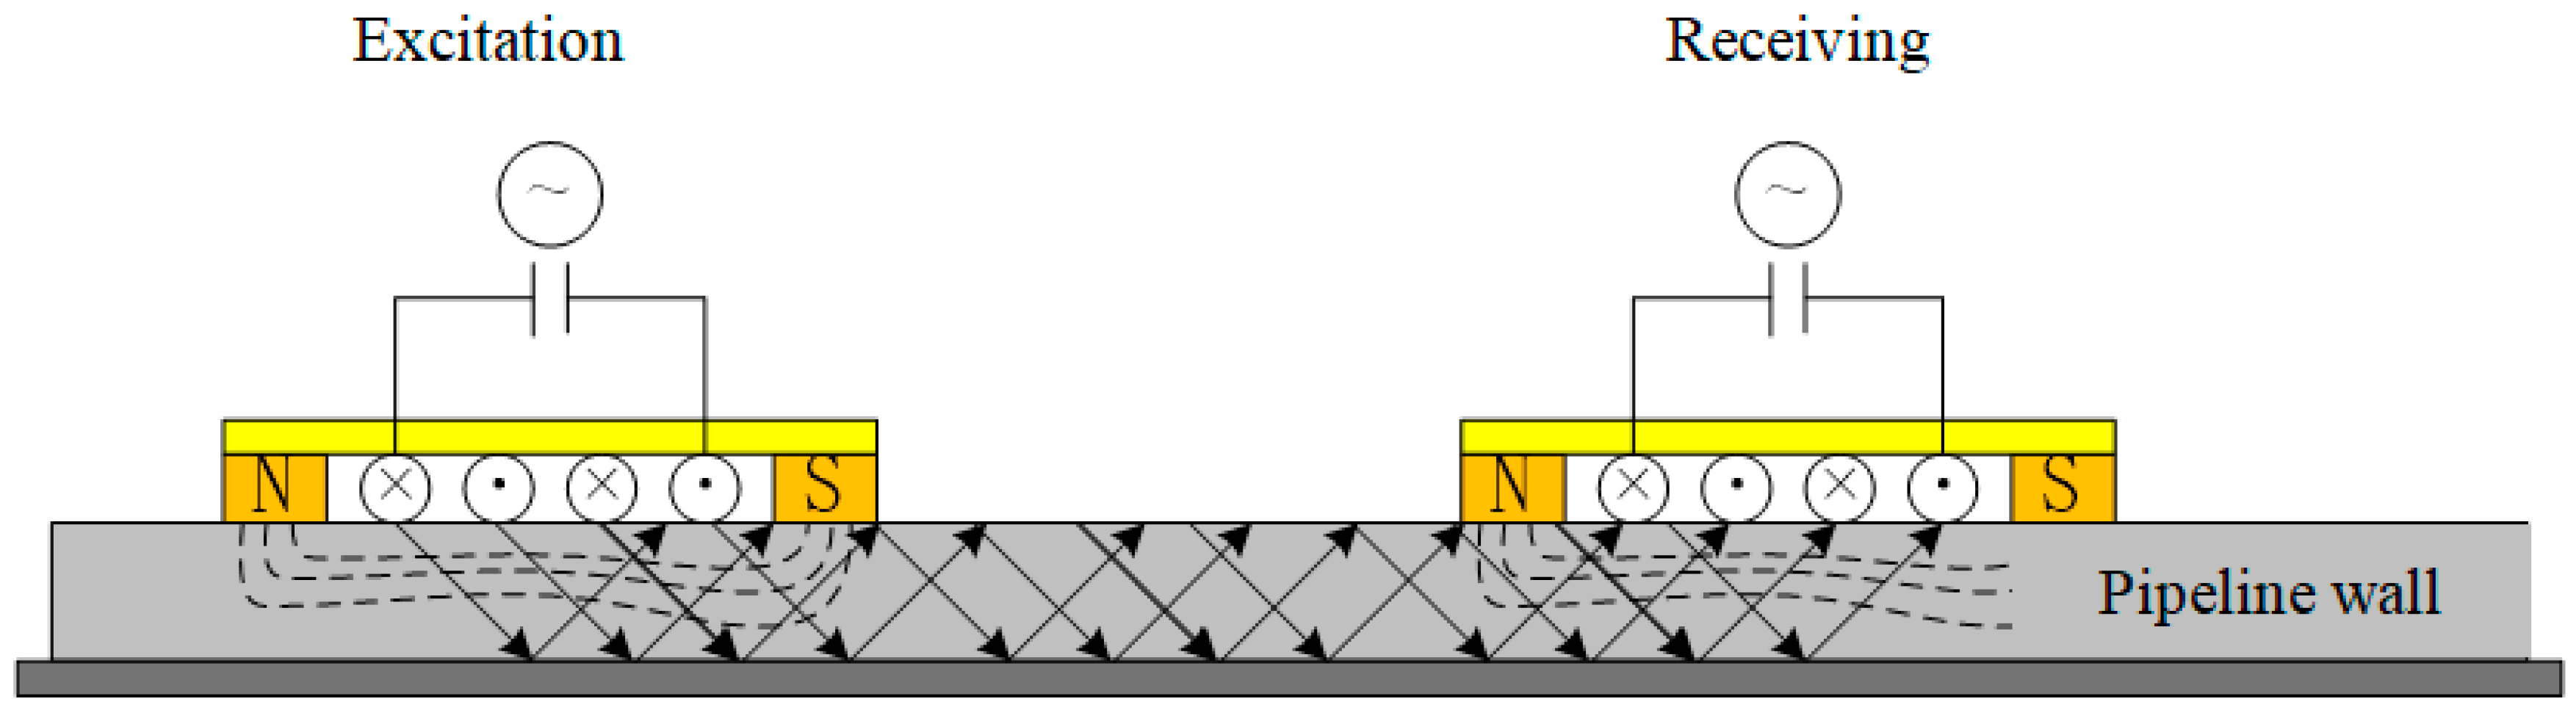
3.3. Electromagnetic Acoustic Transducer Inspection

Electromagnetic acoustic transducer (EMAT) inspection technology uses permanent magnets to create a magnetic field on the pipeline wall. It employs an alternating current coil, oriented vertically to the magnetic field, to generate an eddy current in the pipeline wall [49,50]. The eddy current imposes a force perpendicular to pipeline wall, and the ultrasonic waves are generated to propagate along the pipeline wall. The electromagnetic and ultrasonic waves spread along the pipeline wall and will attenuate if no defects exist. They will be disturbed to generate a reflection signal if any defects exist. This method is used to detect and quantify the type and size of the defect. As is shown in Figure 3, the EMAT inspection system consists of excitation, transmitting, and receiving parts: an exciter for generating the bias magnetic field, an inspected test piece, and a coil for receiving the inspection signal [51,52].
After its research and development for nearly half a century, EMAT inspection technology has gradually become mature. The U.S. PII Company develops an EmatScan CD pipeline inspection tool for liquid and gas pipelines. For narrow and long cracks with a length of more than 50 mm and a depth of more than 2 mm, its POD is greater than 90%. The tool can detect smaller SCCs and coating stripping. It can also be employed to inspect and measure any other type of longitudinal cracking, including fatigue cracking, weld toe cracking, configuration cracking, long cracking in or around a joint, and lack-of-fusion cracking. Additionally, it can accurately detect depressions and cracks caused by mechanical damage.
The EMAT inspection tool keeps all the advantages of a traditional ultrasonic testing tool. Additionally, EMAT inspection is non-contact and does not require a coupling agent. It is applicable to both liquid and gas transmission pipelines. EMAT does not require special cleaning of the surface of pipeline and can directly inspect any rough surface. EMAT can be used in high-temperature inspection, mobile inspection, and phased-array inspection since it can trigger all types of ultrasonic waveforms [53,54,55]. However, it has a lower transduction efficiency and a weak inspection signal.

3.4. Electromagnetic Eddy Current Inspection

Electromagnetic eddy current in-line inspection is a technology based on the principles of electromagnetic induction. As is shown in Figure 4, when the alternating excitation of a certain frequency is applied to the surface of the conductor, an alternating eddy current will be generated. A constant secondary magnetic field is then generated in a certain range [56,57,58]. When the conductor is discontinuous, the alternating eddy current is blocked. This changes the secondary magnetic field caused by eddy current: that is, there is an abrupt change in the secondary magnetic field. The inspection coil is placed with a certain distance from the excitation coil to effectively receive the change in magnetic field after the eddy current passes through the pipeline wall and returns. In this way, any defect on the inner wall of the pipeline can be detected. Eddy current inspection requires an alternating excitation device [59], and its output signal has a high frequency. The inspection probe should not be made of metal, or it will shield the eddy current effect resulting from the alternating excitation [60,61]. The advantage of electromagnetic eddy current inspection is its high inspection sensitivity for the defects on the surface and near the surface of the pipeline. The electromagnetic eddy current method is unable to identify characteristics of defects on the outer pipeline wall [62,63], but it can be combined with magnetic flux leakage inspection technology to distinguish internal and external defects.
The JENTEK Sensor Company develops an electromagnetic eddy current technology based on a winding magnetometer array to inspect the corrosion defects in oil and gas pipelines. Moreover, it can also inspect the axial cracks caused by stress corrosion.
Compared with other in-line inspection technologies, the eddy current inspection tool has the following advantages: (1) it offers non-contact inspection without a coupling agent, so that it is not necessary to clean the surface of the inspected pipeline and the coating on the surface of the pipeline does not affect the inspection results; (2) the eddy current moves on the metallic conductor, which is subjected to the skin effect, so it can detect defects on the internal surface and near the surface of pipeline; (3) the tool is easy to operate and has a lower cost. Moreover, it has a very high inspection accuracy since it is less affected by human factors; and (4) the inspection uses a voltage signal, making it convenient to store and process data and facilitating the imaging and characteristic analysis of defects. The disadvantages of eddy current inspection technology are as follows: (1) it is applicable only to conductive materials; (2) it is unable to detect defects on the external surface of the pipeline; and (3) it is unable to accurately measure the size of defects.

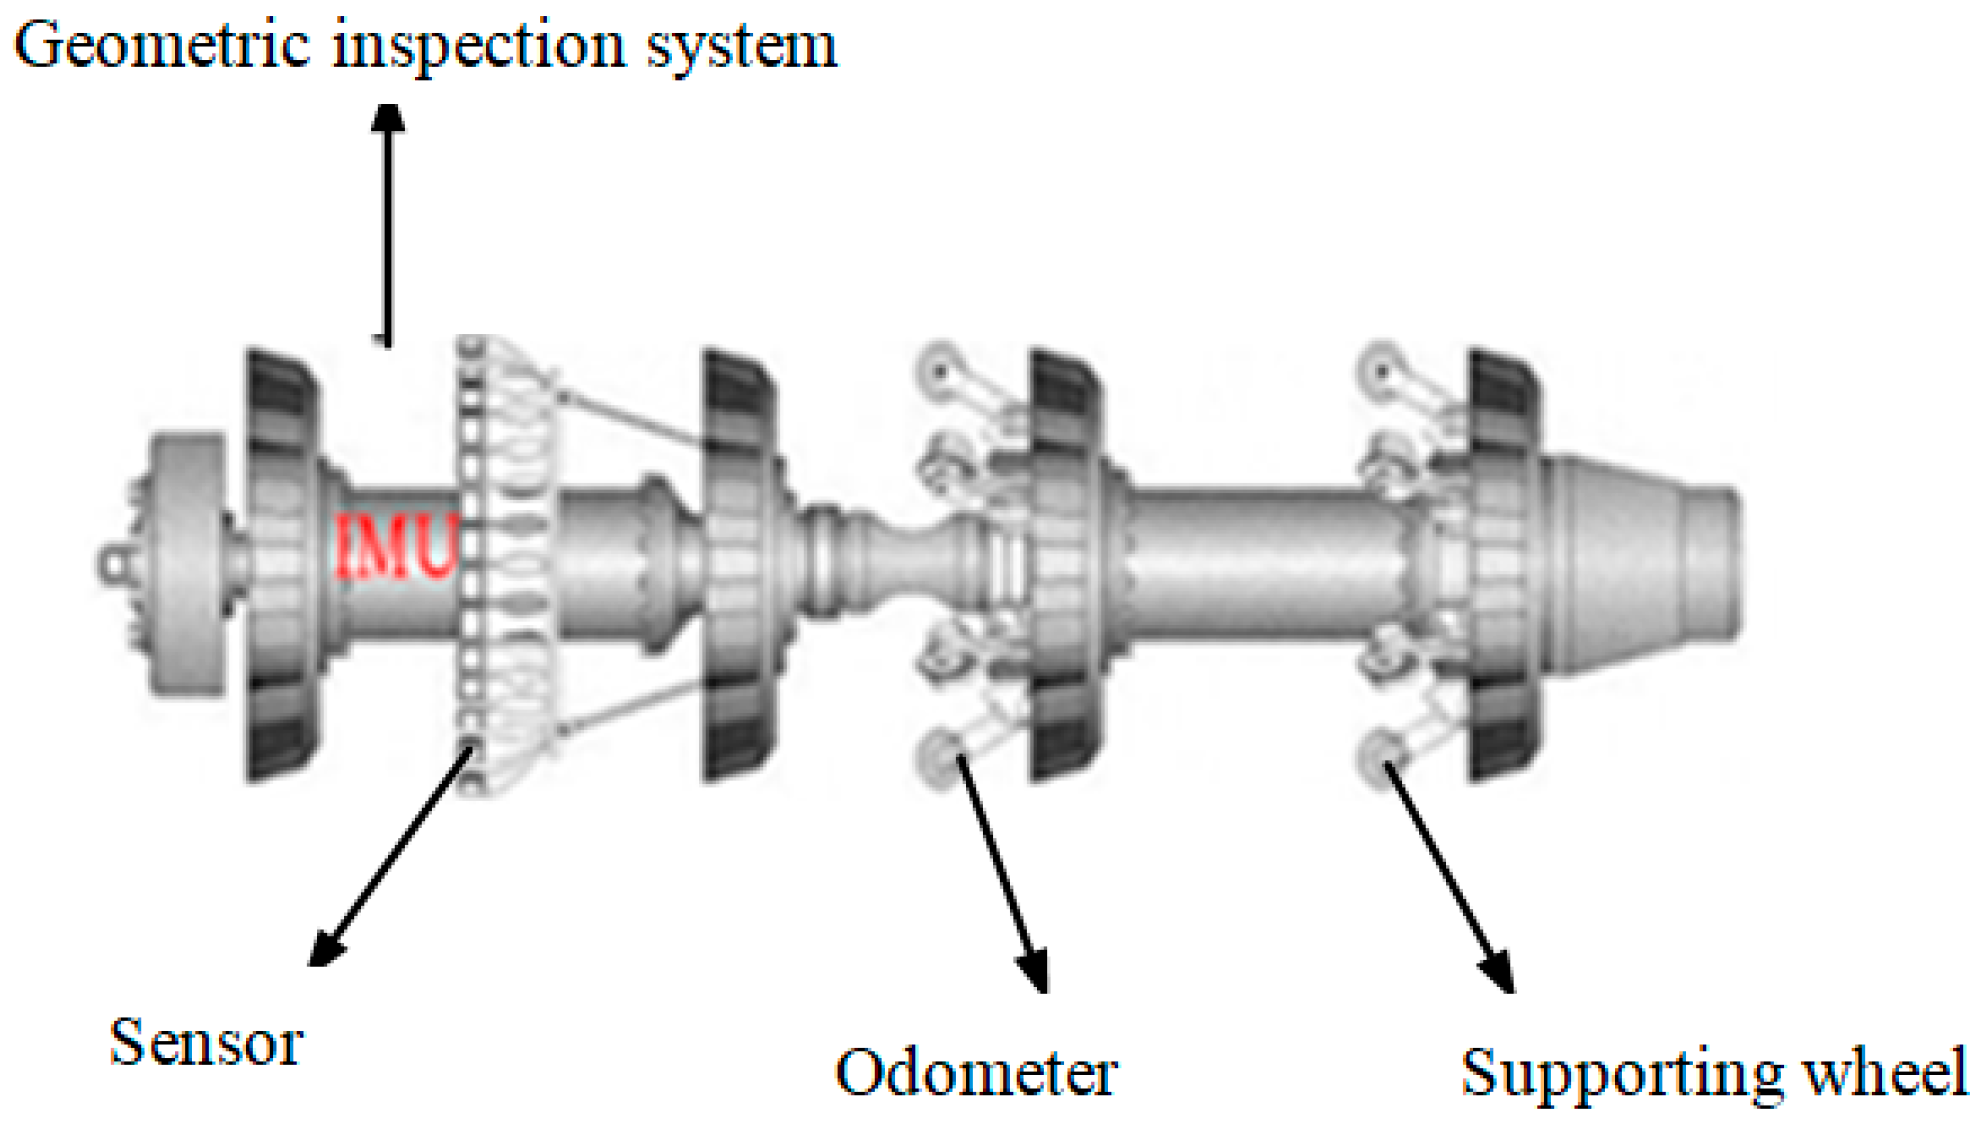
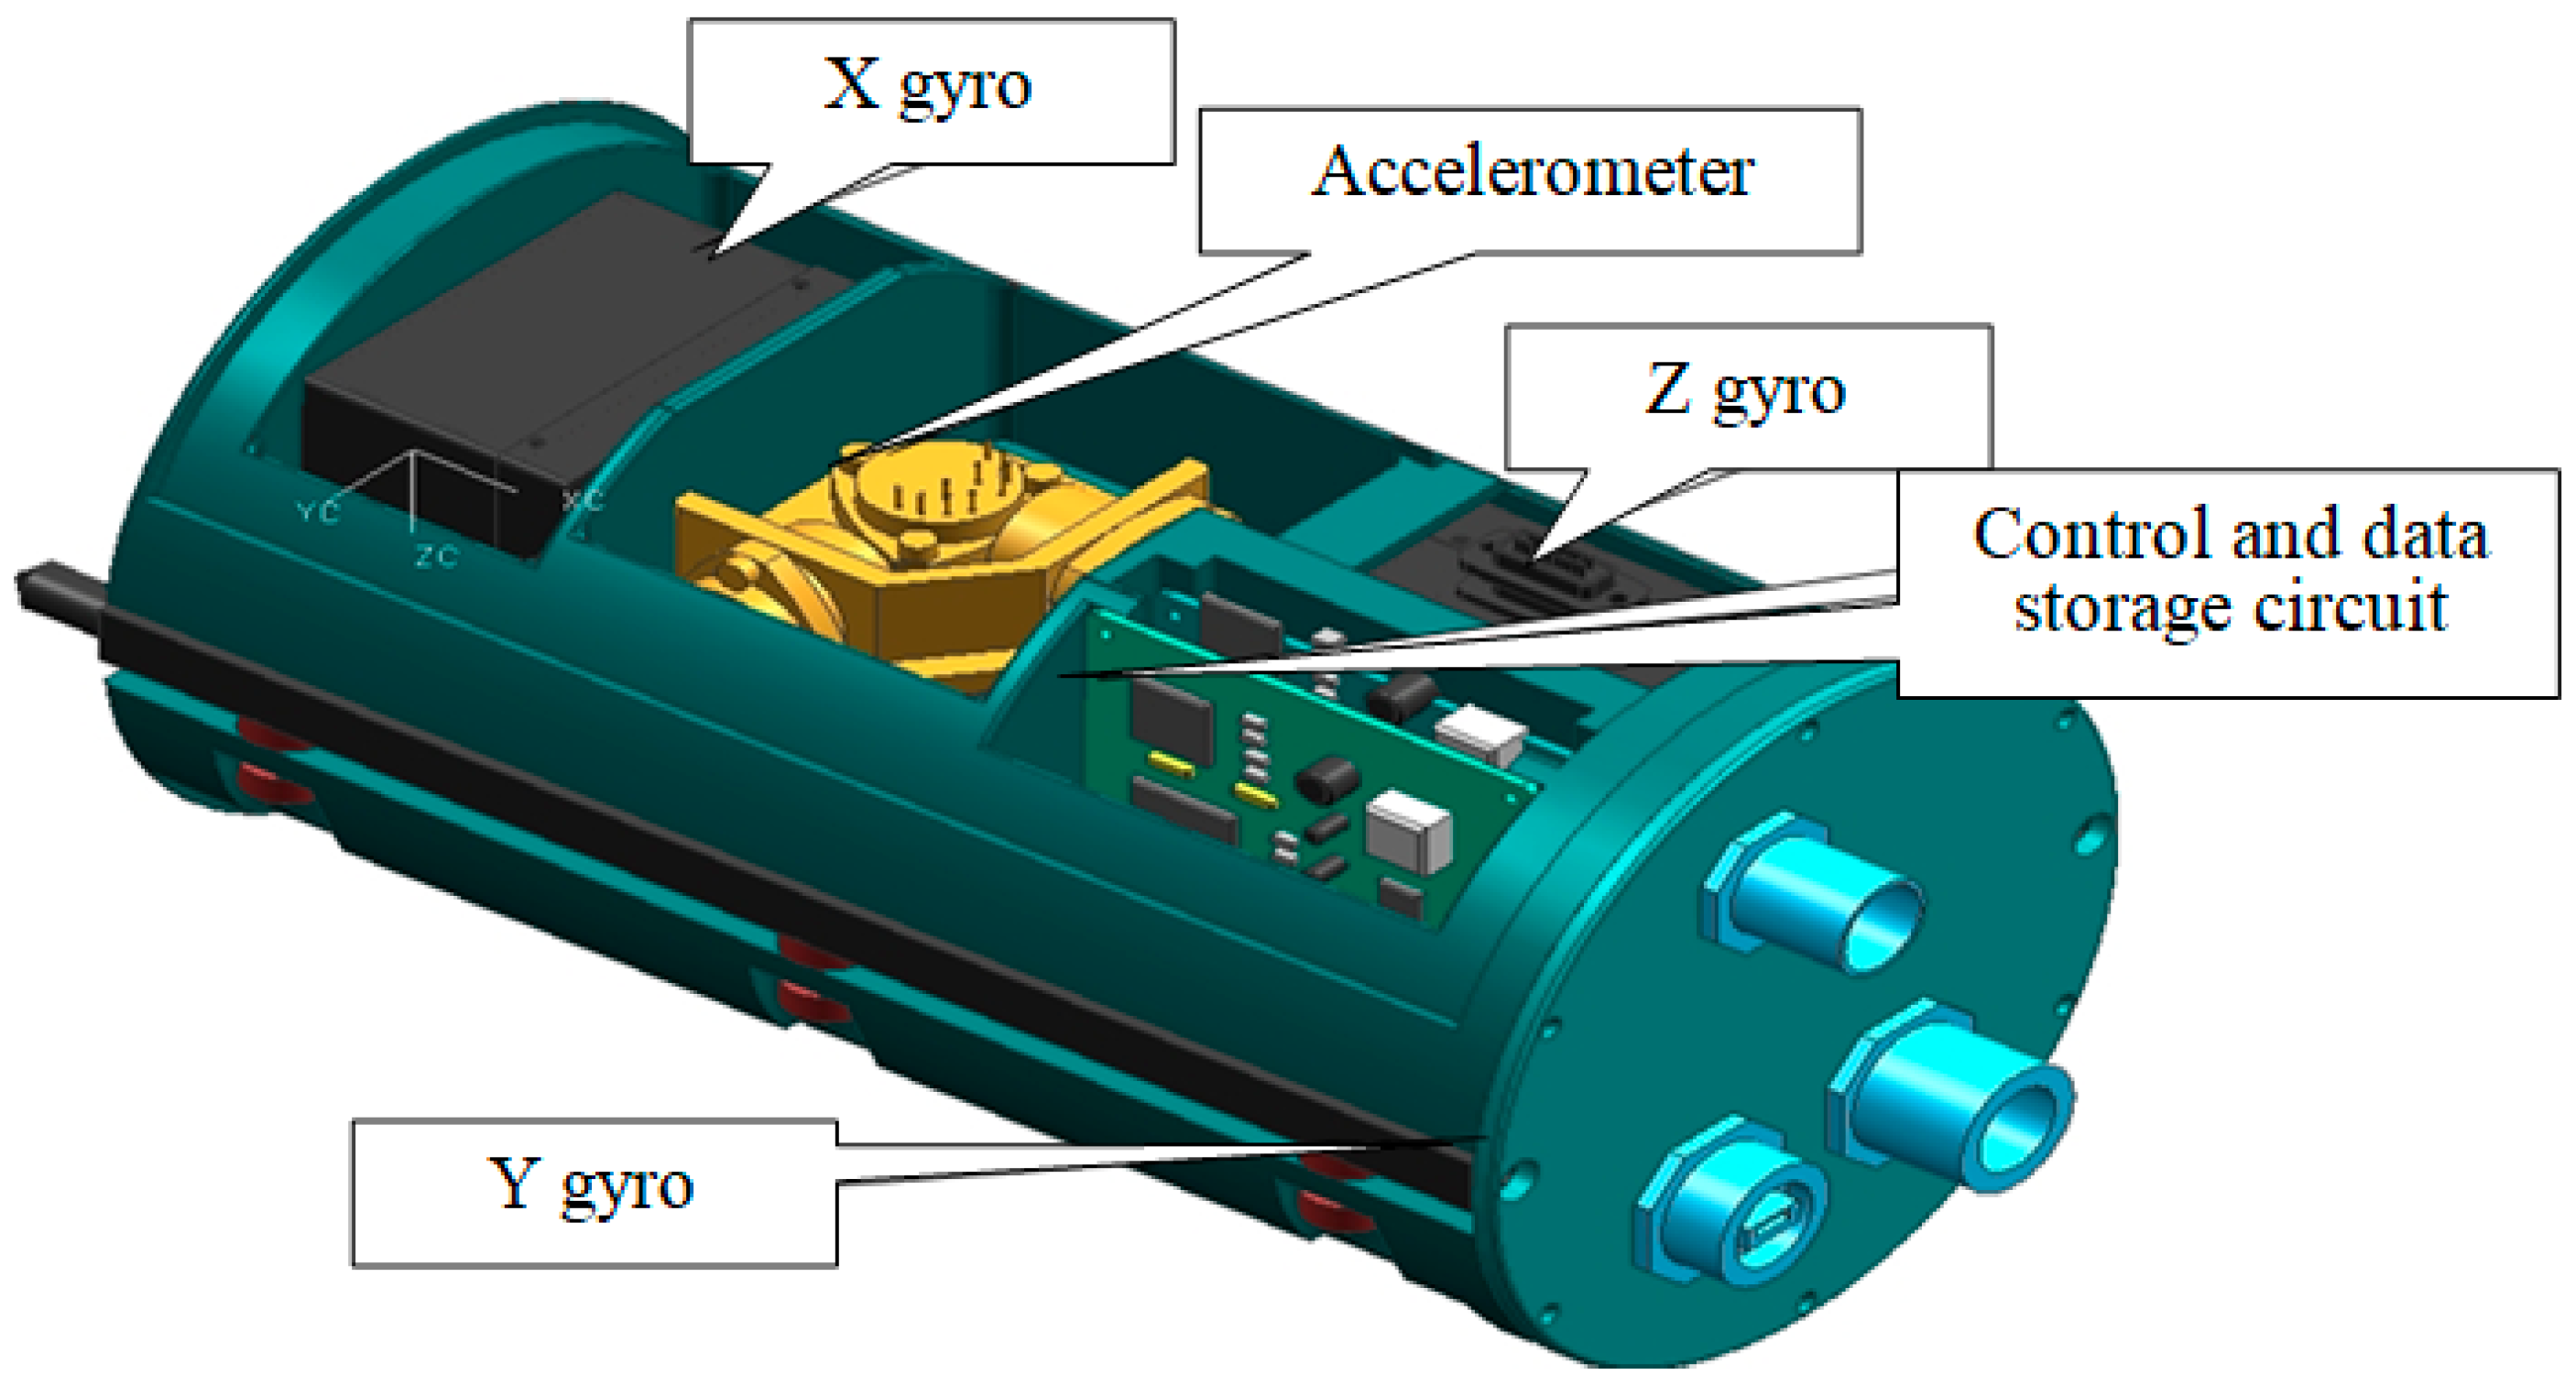
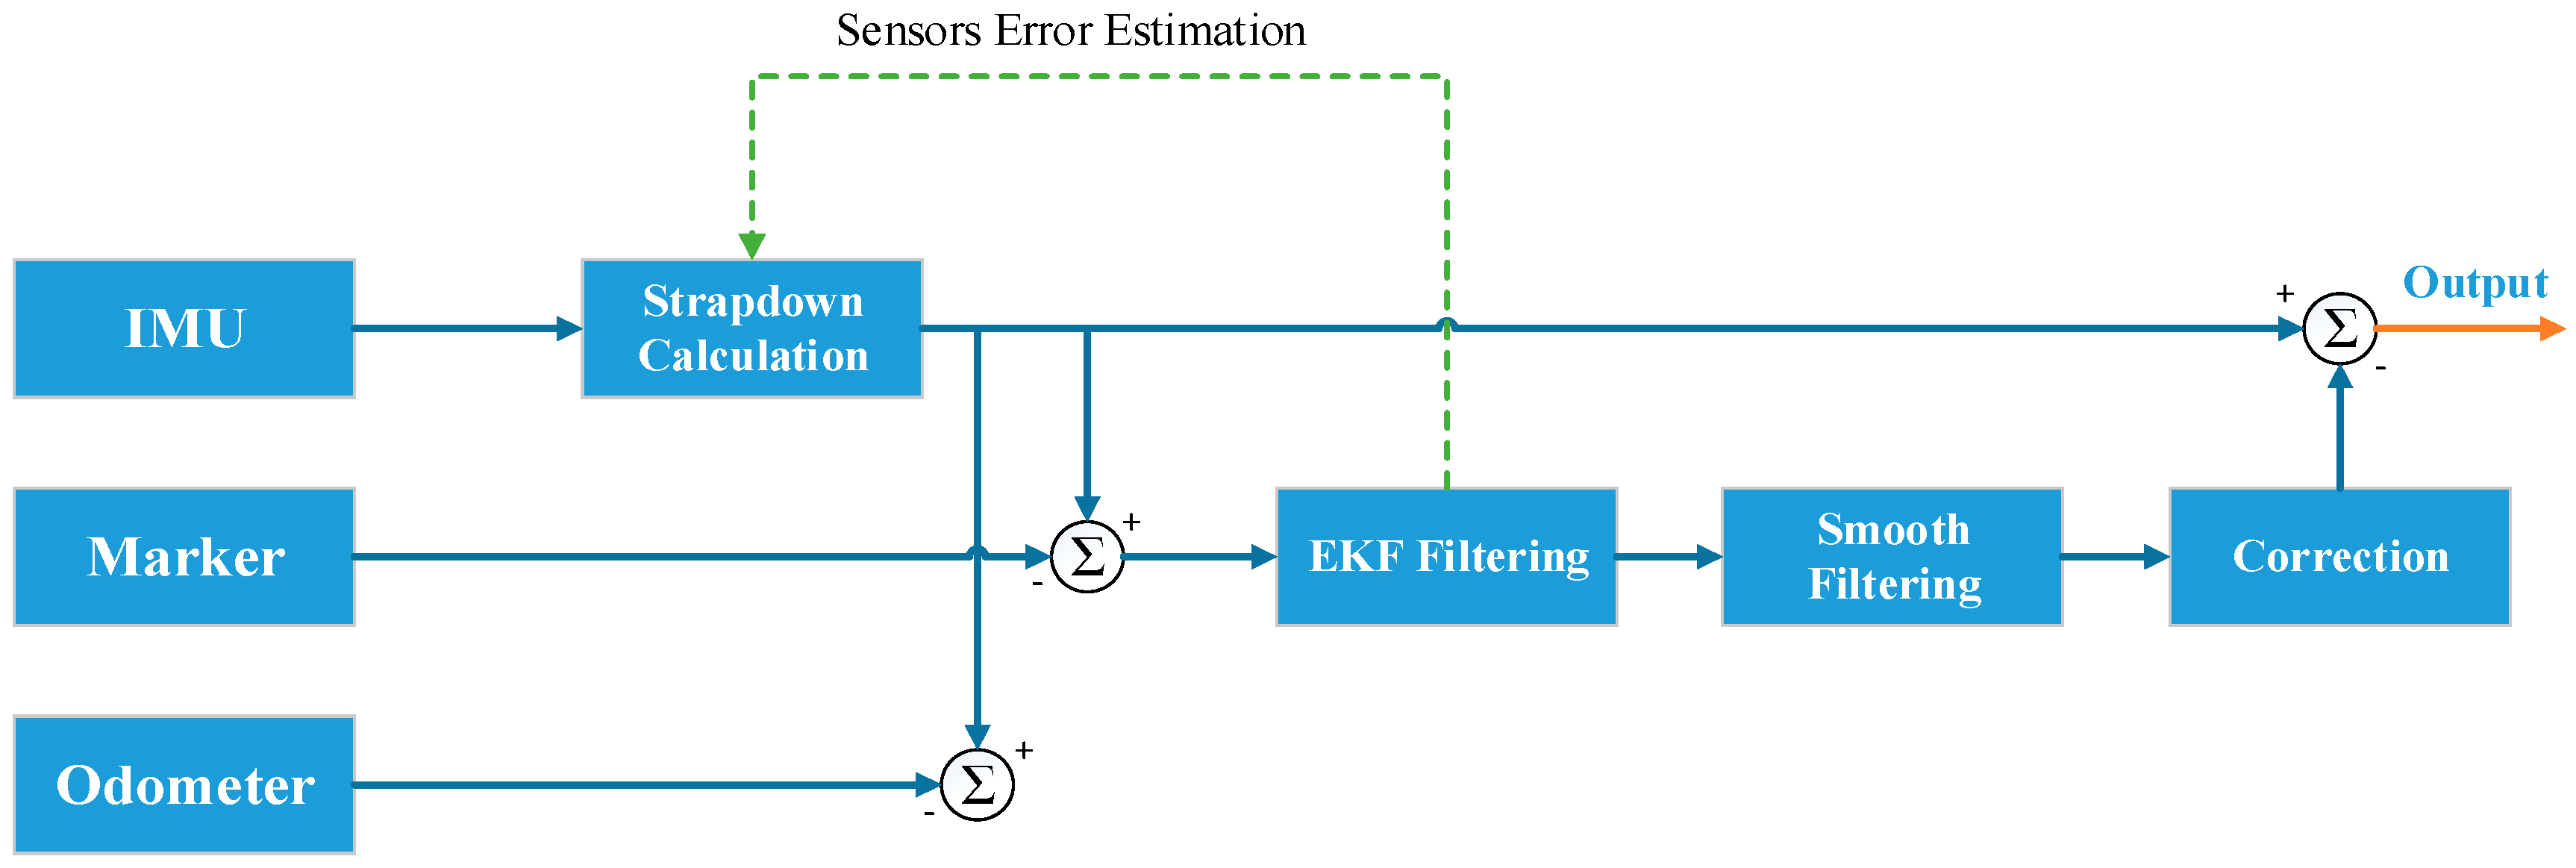
3.5. IMU Centerline and Bending Strain Inspection

The pipelines in permafrost areas are easily affected by natural disasters, such as thawing settlement and frost heave, which cause the displacement, bending, and deformation of pipelines and results in excessive bending stress. At present, domestic and overseas pipeline operators mainly employ an inertial measurement unit (IMU) in-line inspection tool to inspect the position and bending strain of pipelines [64,65,66]. The IMU in-line inspection can firstly provide accurate surveying and mapping for the specific position of a pipeline. Subsequently, the inertial navigation unit is utilized to solve the bending strain of a long-distance oil pipeline using the collected data [67,68]. For instance, GE PII, ROSEN, and the PetroChina Pipeline Company have developed an IMU in-line inspection system based on inertial measurement. The system consists of an in-line inspection tool (as shown in Figure 5), an aboveground marker, and data processing software.
The IMU module in PIG, as shown in Figure 6, can perform the independent surveying and mapping of a pipeline centerline based on a strap-down, inertial navigation system. The inertial surveying and mapping unit of the IMU module can synchronize the time with the master clock of an in-line inspection tool; collect data from three gyroscopes, three accelerometers, and an odometer at any fixed time; and store the data in its system memory. After inspection, the data can be gathered artificially.
In the inspection tool, multi-sensors are utilized to obtain the position parameters and the pipeline-centerline trajectory of the entire pipeline. The multi-sensor data fusion of an IMU inspection system is shown in Figure 7. The accurate pipeline-centerline coordinates are used to calculate the bending strain on the pipeline. The inspection is carried out as follows:
  • The gyroscopes and accelerometers in the inspection tool obtain the angular velocity of rotation and the displacement acceleration of the inspection tool. These data are processed to gather the information on the position attitude of the inspection tool at any time;
  • The drifting of inertial components may cause an increase in the measurement error as time goes by. Inspection data can be rectified by using the GPS coordinates of the aboveground marker, odometer, pipeline characteristics (weld and bend), and other parameters;
  • After pipeline inspection, the data stored in the inspection tool are imported into computer. They are then processed in a specialized software to obtain the distribution track and position parameters of the pipeline centerline.
An IMU in-line inspection system can provide bending characteristics and their variation along the entire pipeline. During a single operation of an IMU, the accuracy of its strain inspection is 0.125%. During repeated operation, the accuracy of strain inspection is 0.02% [69,70,71]. As revealed in the field inspection results of each inspection tool, this inspection system features a high inspection accuracy, accurate positioning, and comprehensive data, meeting the requirements for the inspection of a long-distance pipeline in a permafrost area. Additionally, safety evaluations and early warnings are provided by considering the results of in-line inspections such as magnetic flux leakage, ultrasonic, and geometry deformation. In any unstable area, pipelines can be monitored continuously for a long time to prevent their failure.

3.6. Geometry Deformation In-Line Inspection

Geometry in-line inspection means performing a geometry inspection by virtue of an intelligent PIG inside a pipeline. At present, these technologies, both at home and abroad, are mainly classified into mechanical inspection and physical electromagnetic inspection [72,73,74].
In mechanical inspection, an intelligent PIG is equipped with several mechanical tensioning arms with pulleys: these can enter pipelines. If any deformation occurs inside a pipeline, a mechanical tensioning arm can stretch automatically to trigger a signal to the sensor on the arm. The signal passes through the transmission system to the data storage system of the intelligent PIG. After completing the pipeline inspection and collecting the intelligent PIG, data can be downloaded into a computer for analysis [75]. The geometry deformation of the pipeline can then be determined using analysis software.
Physical electromagnetic inspection technology follows the principles of an inducted eddy current, i.e., an intelligent PIG is equipped with a magnetic induction line generation device and enters the pipeline. After entering the pipeline, the device generates magnetic induction lines, which are captured by the sensor and stored by a data transmission system into the data storage system of the intelligent PIG. The steel pipeline wall provides a natural shield against magnetic induction lines. Therefore, the magnetic induction lines generated by the device are entirely shielded by the pipeline wall, and the sensor can capture the loss of magnetic induction lines. After being downloaded, the stored magnetic induction line data can be analyzed using software. The geometry diagram of the pipeline wall can then be vividly observed and revealed by the decrease in magnetic induction lines in the recorded data.
Technically, electromagnetic inspection seems better than mechanical inspection for the following reasons:
  • Mechanical inspection technology employs mechanical tensioning arms; it is therefore not suitable for 360° pipeline-wall inspection;
  • Mechanical inspection technology is, in principle, tension inspection. The pulley at the top of each tensioning arm is in contact with the impurities on pipeline wall (e.g., salt crystals), so the undulating surface of the pipeline wall caused by such impurities cannot be identified;
  • Electromagnetic inspection technology can overcome the influence of nonmetallic impurities on the pipeline wall to realize a satisfactory inspection.
Nevertheless, inspection data are often affected by different conditions during an internal geometry inspection. When a pipeline is under poor conditions, e.g., low pressure and fast speed, an electromagnetic inspection tool will be affected by multiple factors, while a mechanical inspection tool will perform much better. Therefore, it is necessary to analyze and determine the inspection tool and technology for different circumstances.

4. External Corrosion Direct Assessment Technologies

External corrosion direct assessment technologies are intended to evaluate the pipeline coating condition, identify coating defect locations, and estimate the corrosion activity of the pipeline [76]. The techniques and measuring equipment for aboveground coating inspections are well established. They include techniques such as the close interval potential survey (CIPS), direct current voltage gradient (DCVG) [77], alternating current voltage gradient (ACVG) [78], and aboveground survey techniques, which combine indirect inspections and direct dig verifications to evaluate the pipeline coating condition and cathodic protection system [79]. Firstly, non-contact inspection is employed above ground to locate the defects in the pipeline coating. Meanwhile, the disturbance by stray current is tested and evaluated. Subsequently, excavation is carried out to verify the actual dimensions of defects, soil electric conductivity, etc. At last, repair and maintenance advice is put forward based on the inspection and evaluation.

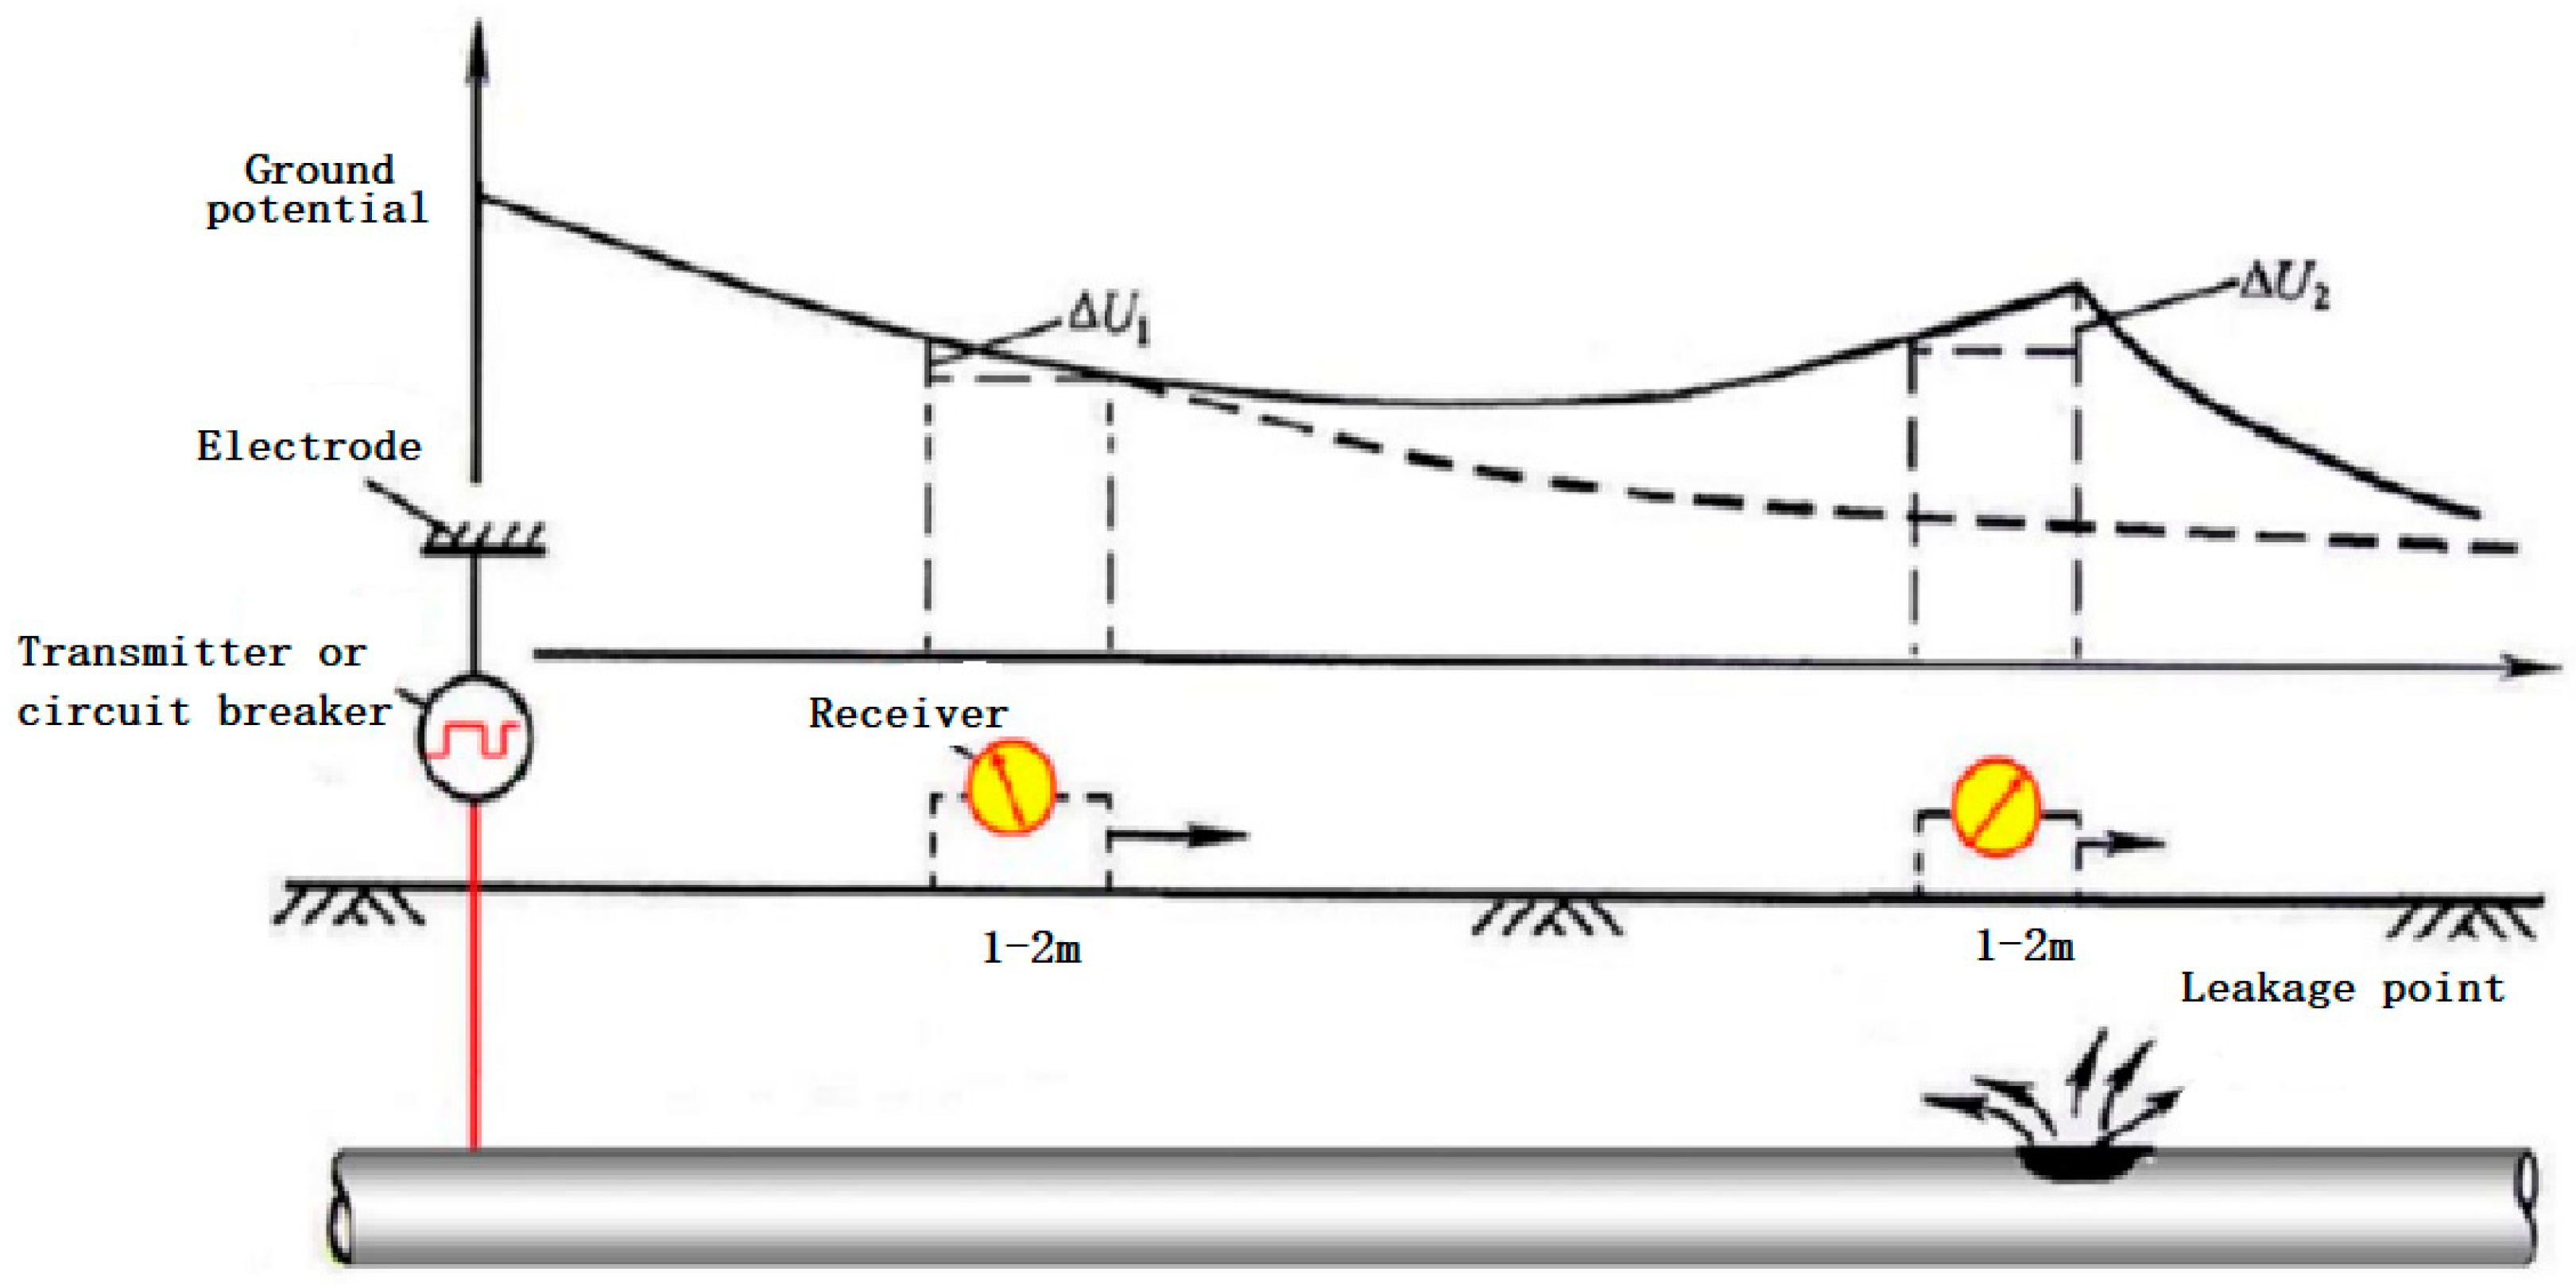
4.1. Direct Current Voltage Gradient

As is shown in Figure 8, the direct current voltage gradient (DCVG) inspection tool is actually a highly sensitive millivoltmeter which measures the output of two Cu/CuSO4 electrodes (or pole probes) inserted into the ground surface under the potential gradient equilibrium at surface level. If the distance between the two electrodes exceeds 0.5 m, and one electrode has a higher potential than the other, it can measure the direction of current on the ground and above the pipeline as well as the potential gradient (voltage) between the two electrodes.
To eliminate the electric interference of other factors, such as the pipeline, earth current, and the cathodic protection system, and better distinguish other DC power signals during inspection, asymmetrical DC signals are applied to the pipeline for DCVG inspection. Moreover, the cathodic protection current on the pipeline should be turned on and off in a regular cycle (for example, 0.45 s on and 0.8 s off). A DCVG inspection assesses the size of the damaged points and qualitatively classifies them in terms of severity according to the standard NACE RP0502 Pipeline External Corrosion Direct Assessment Methodology.
Due to its high sensitivity and accuracy, DCVG technology can accurately locate pipeline coating damage. It can estimate the severity of the pipeline coating damage (by calculating %IR) to provide basic data for a coating condition evaluation [80]. Combined with appropriate dig verification, it is possible to determine whether corrosion defects on the pipeline body will continue to develop. DCVG has a good anti-environmental interference ability and is not affected by surrounding companion pipelines.

4.2. Alternating Current Voltage Gradient

Alternating current voltage gradient (ACVG) is an aboveground measurement method that locates the defects in pipeline coating by measuring the ground potential gradient change caused by the alternating current that leaks from the damaged point of coating along or on both sides of the pipeline. As is shown in Figure 9, ACVG employs a pipeline current mapping (PCM) device together with an AC ground potential measurement gauge to measure the variation of ACVG in the soil for the identification and accurately positioning of defects on the outer coating of a buried pipeline [81].
During measurement, an operator inserts electrodes into the ground at certain intervals along pipeline route. On the device’s panel, an arrow indicates the position of any damage on the pipeline coating. The arrow will move while the device moving. When the damage is approached, the arrow will become stable. Meanwhile, the electric field intensity value appears to indicate the size of the leakage point. When the operator moves away from the damage, the value of the electric field intensity decreases. After repeated measurement and careful tracking, the operator can locate the coating damage point, which is right in the middle of the two electrodes.
The accuracy of this measurement method’s results may be affected in the following cases: the pipeline is inside sleeve, which is not flooded by electrolytes; the A-frame is too close to the transmitter; the region is not reachable during measurement, e.g., crossing a river; or the pipeline section has a very poor conductivity of the external coating, e.g., gravel pavement, frozen soil, asphalt pavement, or massive rock backfilling [82].

4.3. Pipeline Current Mapper

The pipeline current mapper (PCM) method applies a certain alternating voltage between the pipeline and the earth, detects the intensity and variation of the alternating voltage along the pipeline on the ground, and converts it into the variation of current in the pipeline so as to determine the location of the pipeline coating damage [83]. During measurement, a current decay curve is drawn using the current at each measurement point and the distance between measurement points. The slope of the current decay curve represents the quality of the pipeline coating. The steeper the curve, the greater the current decay rate and the worse the quality of the pipeline outer coating. If the current suddenly decays at a certain point, the pipeline outer coating is damaged or there are branch pipelines, overlaps, etc. [84].
This method can provide accurate information on the burial depth, location, branch, external metal structure, and large coating damage of a buried pipeline. It can qualitatively identify the coating quality difference between pipeline sections according to the slope of the current decay [85].
The common criteria for judgment are as follows:
  • If the coating of a pipeline is in good condition, the reading of the current often decreases slightly [86];
  • If the coating of a pipeline is entirely aged, the reading of the current drops dramatically [87];
  • If the coating of a pipeline has some sections in poor condition, the current at the aged sections decreases significantly;
  • The pipeline is overlapped with other metal structures;
  • The sleeve of pipeline has a poor coating which overlaps the pipeline;
  • On the buried route of the pipeline, the pipeline outer coating is in good condition, but there are dry or sandy areas [88].

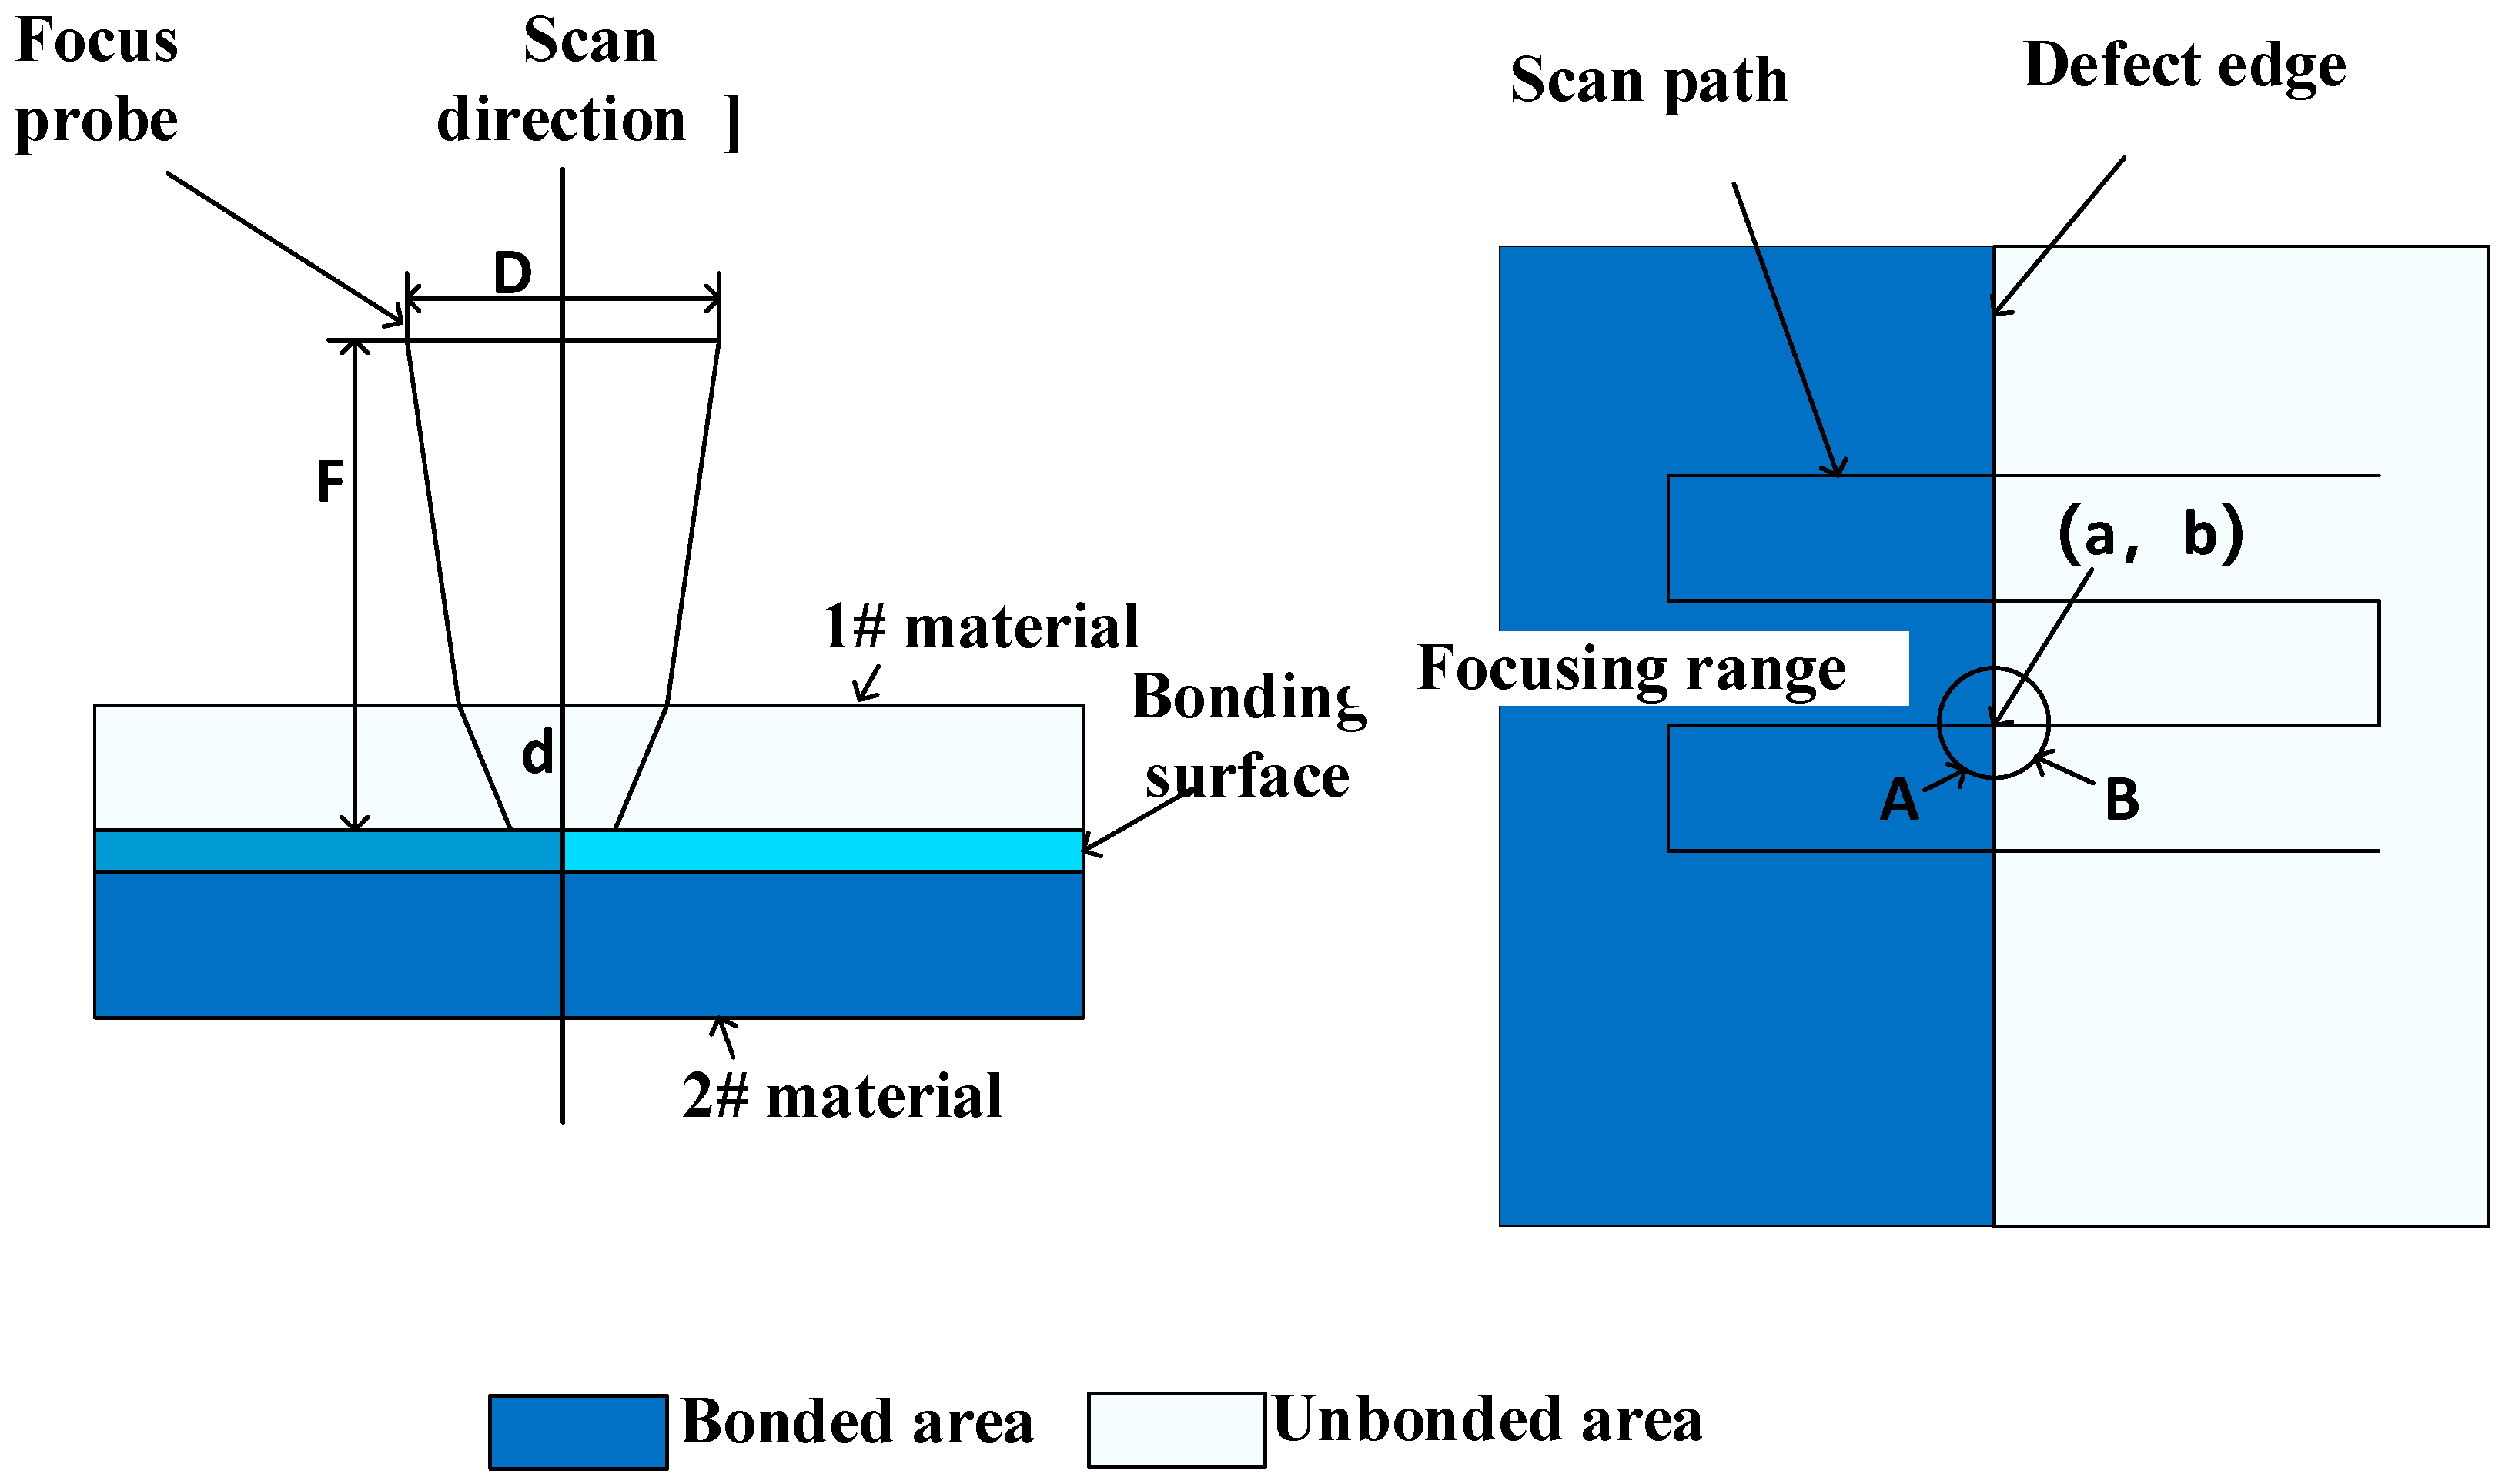
4.4. Direct Inspection: Ultrasonic Testing

Ultrasonic testing is a direct inspection method for pipeline excavation [89]. As shown in Figure 10, it mainly utilizes the reflection of ultrasonic pulses to measure the pipeline wall thickness [90]. During inspection, a probe vertically transmits ultrasonic pulse waves to the outer wall of pipeline. The probe receives the reflected pulse from the outer surface of pipeline wall, and the ultrasonic probe receives the reflected pulse from the outer surface of pipeline wall. The gap between them indicates the pipeline wall thickness. On this basis, the depth and position of pipeline defects can be detected. This method follows simple principles of inspection and has a lower sensitivity to the pipeline material. It is therefore not affected by impurities in pipeline material during inspection [91]. For this reason, it can carry out an accurate inspection of pipelines with thick walls and large diameters, and it can overcome the difficulty or restriction of pipeline wall thickness during inspection [92]. However, it has limitations, including the fast attenuation of ultrasonic waves in the air and the need for a coupling agent during inspection. This is normally the medium that allows for the propagation of sound waves, e.g., oil or water [93].
Traditional ultrasonic testing uses a single or double crystal probe to generate beams and assesses the dimensions of defects based on the attenuation of waves. In phased-array technology, the probe is composed of multiple chips, which is different from traditional ultrasonic testing.
In phased-array technology, the probe triggers the chips with a slight time interval to generate beams with an effective interference phase [94]. These chips are controlled with a delay to excite multiple wafers. Through the delay control of multiple wafers, acoustic beam deflection control is achieved. In order to achieve a good interference or superposition effect in the inspected area, each independent chip of the phased-array multiple probe apertures needs to be controlled by a computer according to the focusing principle. The time interval from each wafer to the virtual focus is calculated according to the focusing rule on the virtual focus, and the trigger delay time of each wafer is adjusted so that the emitted ultrasonic waves reach the virtual focus at the same time. If there is no defect at the virtual focus position, the ultrasound will continue to propagate forward; if there is a real defect at the virtual focus position, the ultrasonic waves excited from the various wafers are superimposed here. Its energy is the strongest, forming a large, reflected echo.
Ultrasound C-scan imaging technology is a non-destructive inspection technology [95,96,97,98,99] that displays the shape of defects inside materials in the form of grayscale images, as shown in Figure 11. According to the principles of the focus probe, the energy of the ultrasonic waves converges at the focus. However, the focus is not a point, but a circle with a specific diameter. During the process of C-scan imaging, the probe scans through the position (a, b). The focus probe transmits ultrasonic waves, which are reflected at the bonding surface between 1# and 2# materials. The energy of the reflected waves is received by the focus probe and converted into a voltage signal. Data processing is performed for the amplitude of the voltage signal to obtain the gray scale of the image at the position (a, b). After the probe scans along a specific route, the gray scale of each point is obtained. The energy of the reflected waves at each point on the scanning route determines the gray scale of the point in the C-scan image [100].

4.5. Direct Inspection: Soil Resistivity

The resistivity of the soil around a buried pipeline is an important parameter for judging the effectiveness of the pipeline’s cathodic protection system and the risk status of the damage point of the pipeline coating [101,102]. Soil resistivity detection methods mainly include the Wenner 4-pin method [103], single-probe method [104], soil box [105], and the electromagnetic induction method [106].
The most commonly used method is Wenner 4-pin method. It involves the use of four pins driven into the ground. A current is applied to the outer pins, and the voltage between the inner pins is measured. The resistivity is a function of the current, voltage, and the spacing of the electrodes (which is equal to the depth of the test). The average soil resistivity is a function of the voltage drop between the center pair of pins, with current flowing between the two outside pins. It is necessary to avoid placing pins over underground structures, either metallic or non-metallic. In circumstances where this cannot be avoided, pin should be placed perpendicular rather than parallel to pipelines or cables. The probe-type device consists of a metal probe rod, pushed into the ground to the desired depth. For the single-probe method, the tip of the rod is typically isolated from the remainder of the rod so that the resistance between the rod tip and rod body can be measured. The resistance measured is a function of the soil resistivity [107].
When using a soil box, a soil sample is put in the soil box and the soil box electrodes are connected to a power source and voltage-measuring device. The resistance of the soil between two potential electrodes is measured [108]. There are various standards or test procedures used in the preparation of the soil for testing.
In the practice of carrying out the electromagnetic induction method, it has been found that a very high-resistivity environment may prevent effective cathodic protection (e.g., dry or frozen soils) [109]. Therefore, for a pipeline in a permafrost area, the main difficulty is to accurately measure the resistivity of the soil around each section of the pipeline, evaluate its impact on the cathodic protection effect, and reasonably formulate the operating rules for the cathodic protection system.

5. Integrated Monitoring Systems for Pipelines in Permafrost Areas

5.1. Displacement Monitoring of the Pipeline and Soil

The main effect of permafrost on a pipeline is the vertical uplift or settlement of the pipeline. Therefore, monitoring the vertical displacement of a pipeline can vividly reflect the safety statement of the pipeline and the development of permafrost hazards [110,111,112]. At present, many technologies exist to monitor ground displacement. However, it is very difficult to monitor the surface displacement in the vicinity of a pipeline using common methods. This is because permafrost areas are often covered by ice and snow in the winter, which causes a very low ambient temperature (as low as −50 °C) and are also easily turned into marsh and wetlands in summer, making it difficult for staff to enter [113]. Pipeline displacement monitoring is more complicated than surface displacement monitoring. At present, mechanical displacement monitoring technology is mainly adopted.

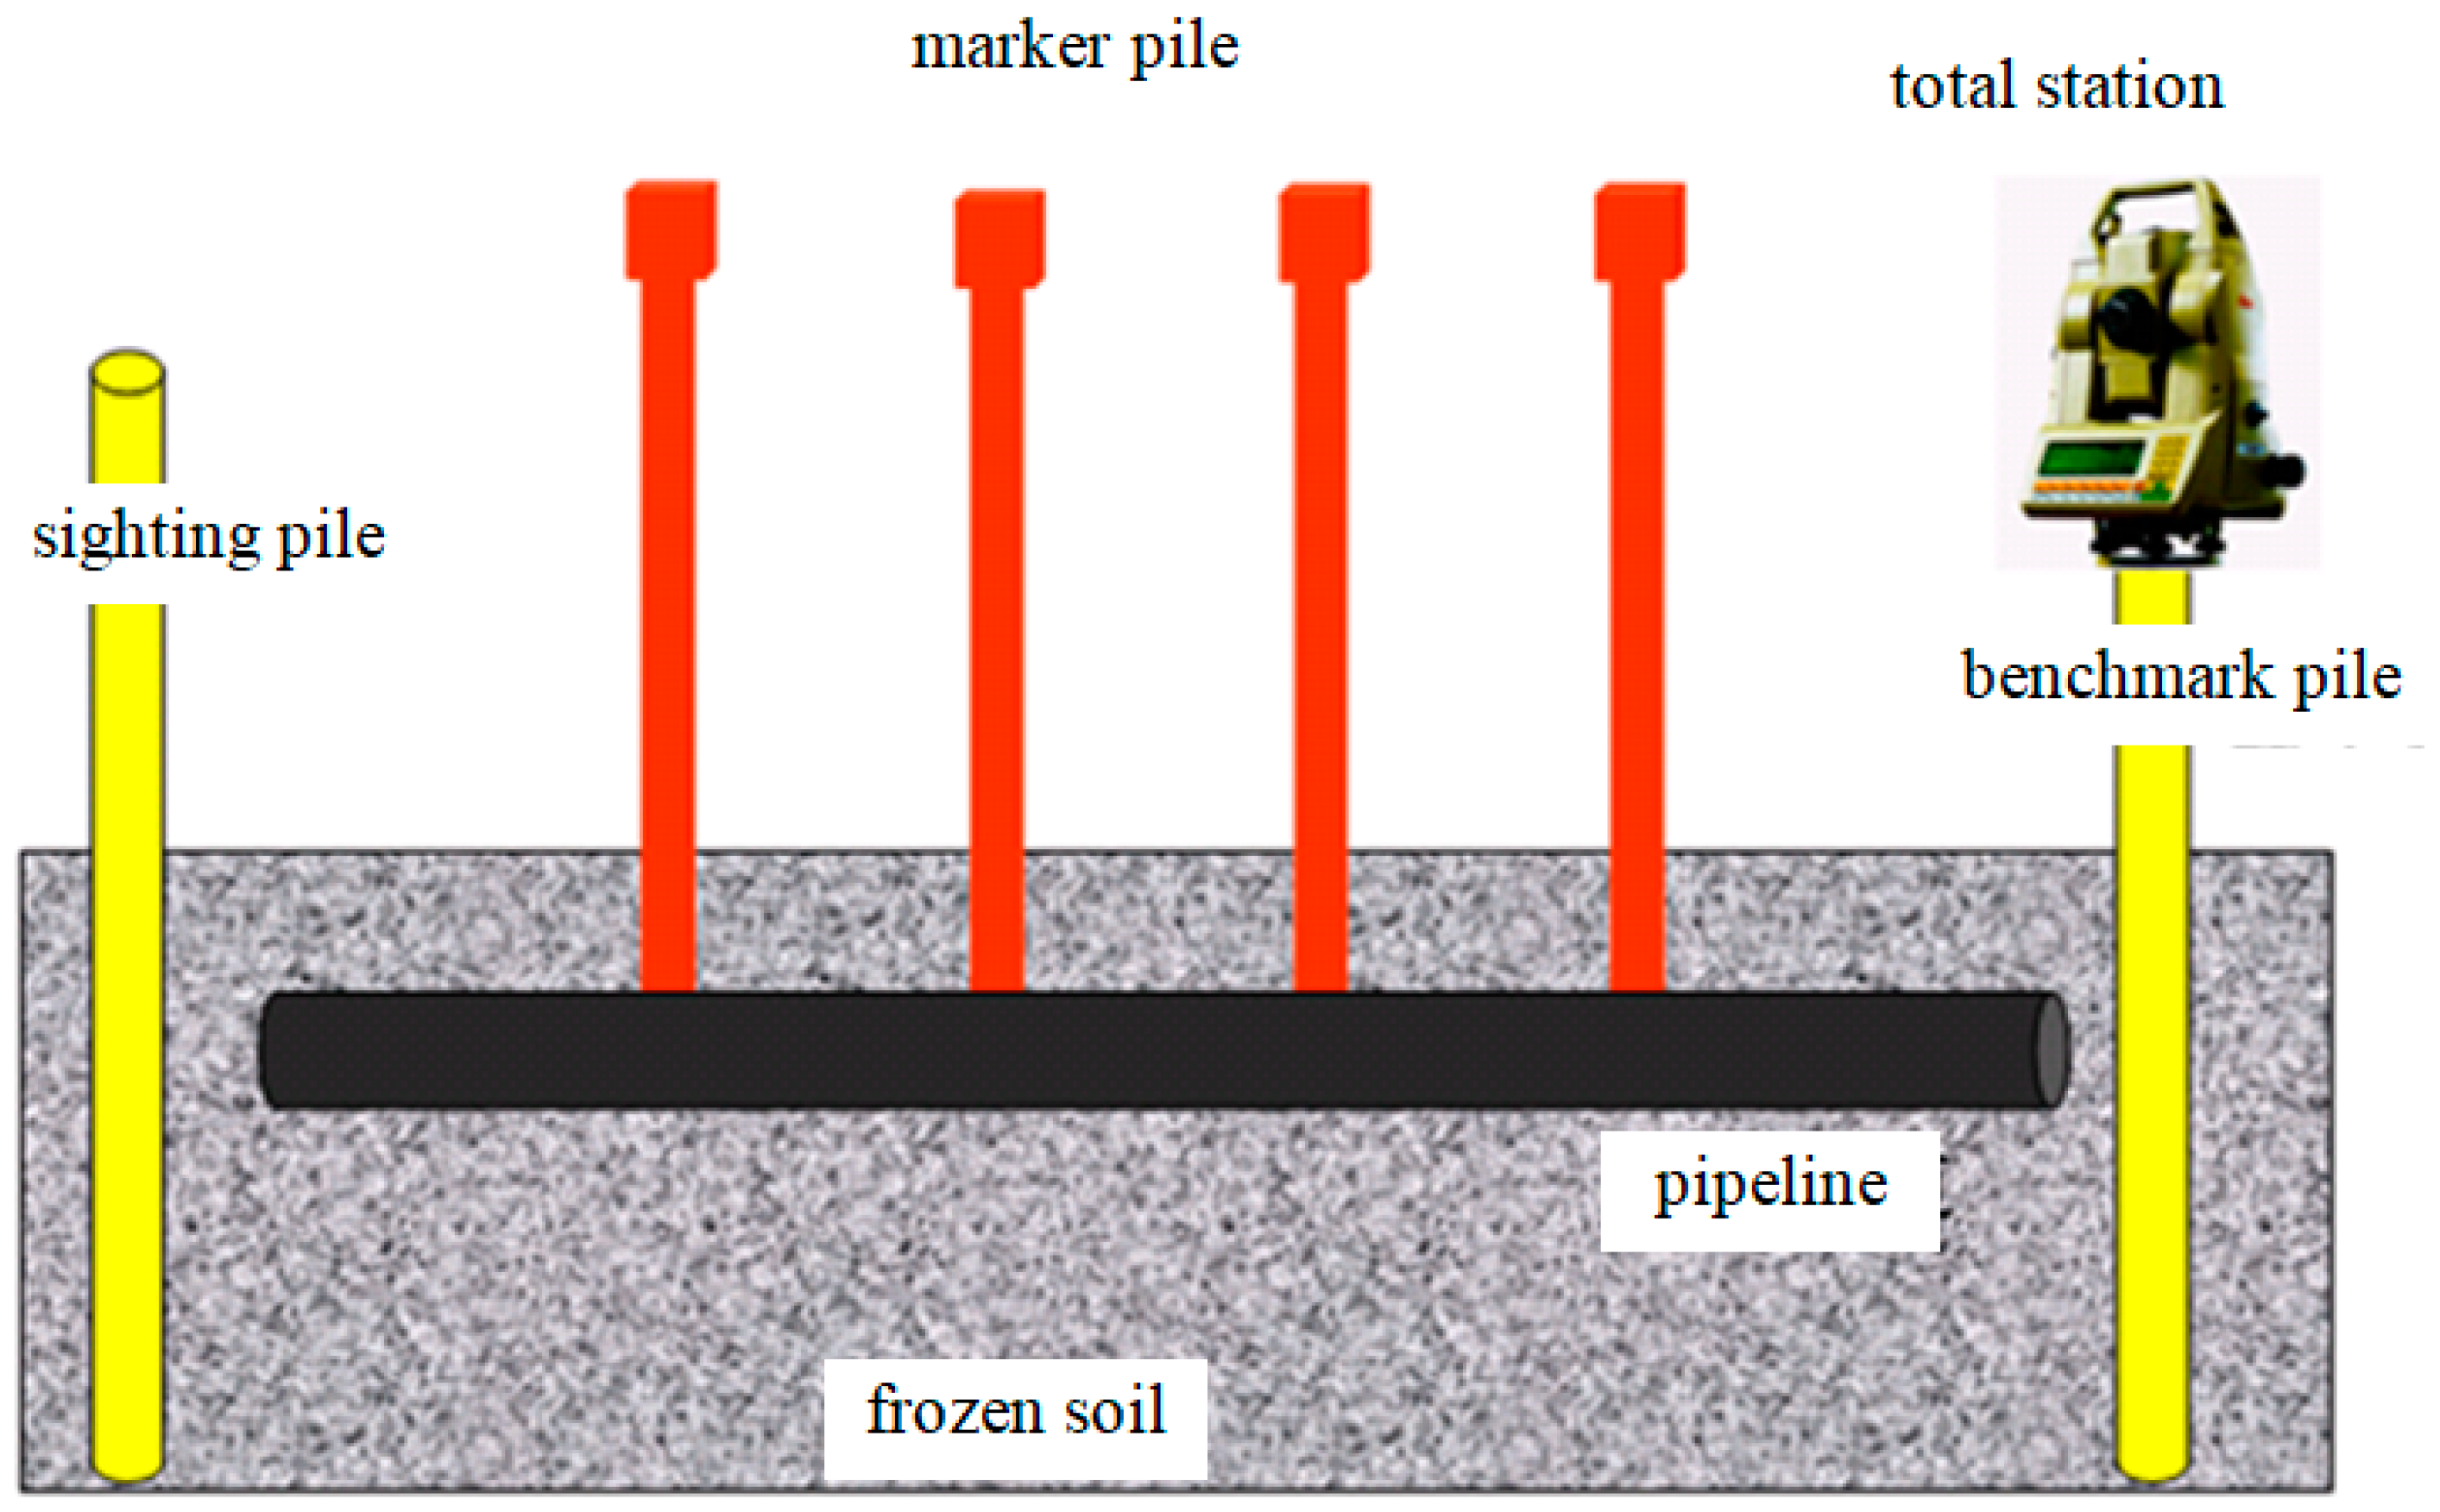
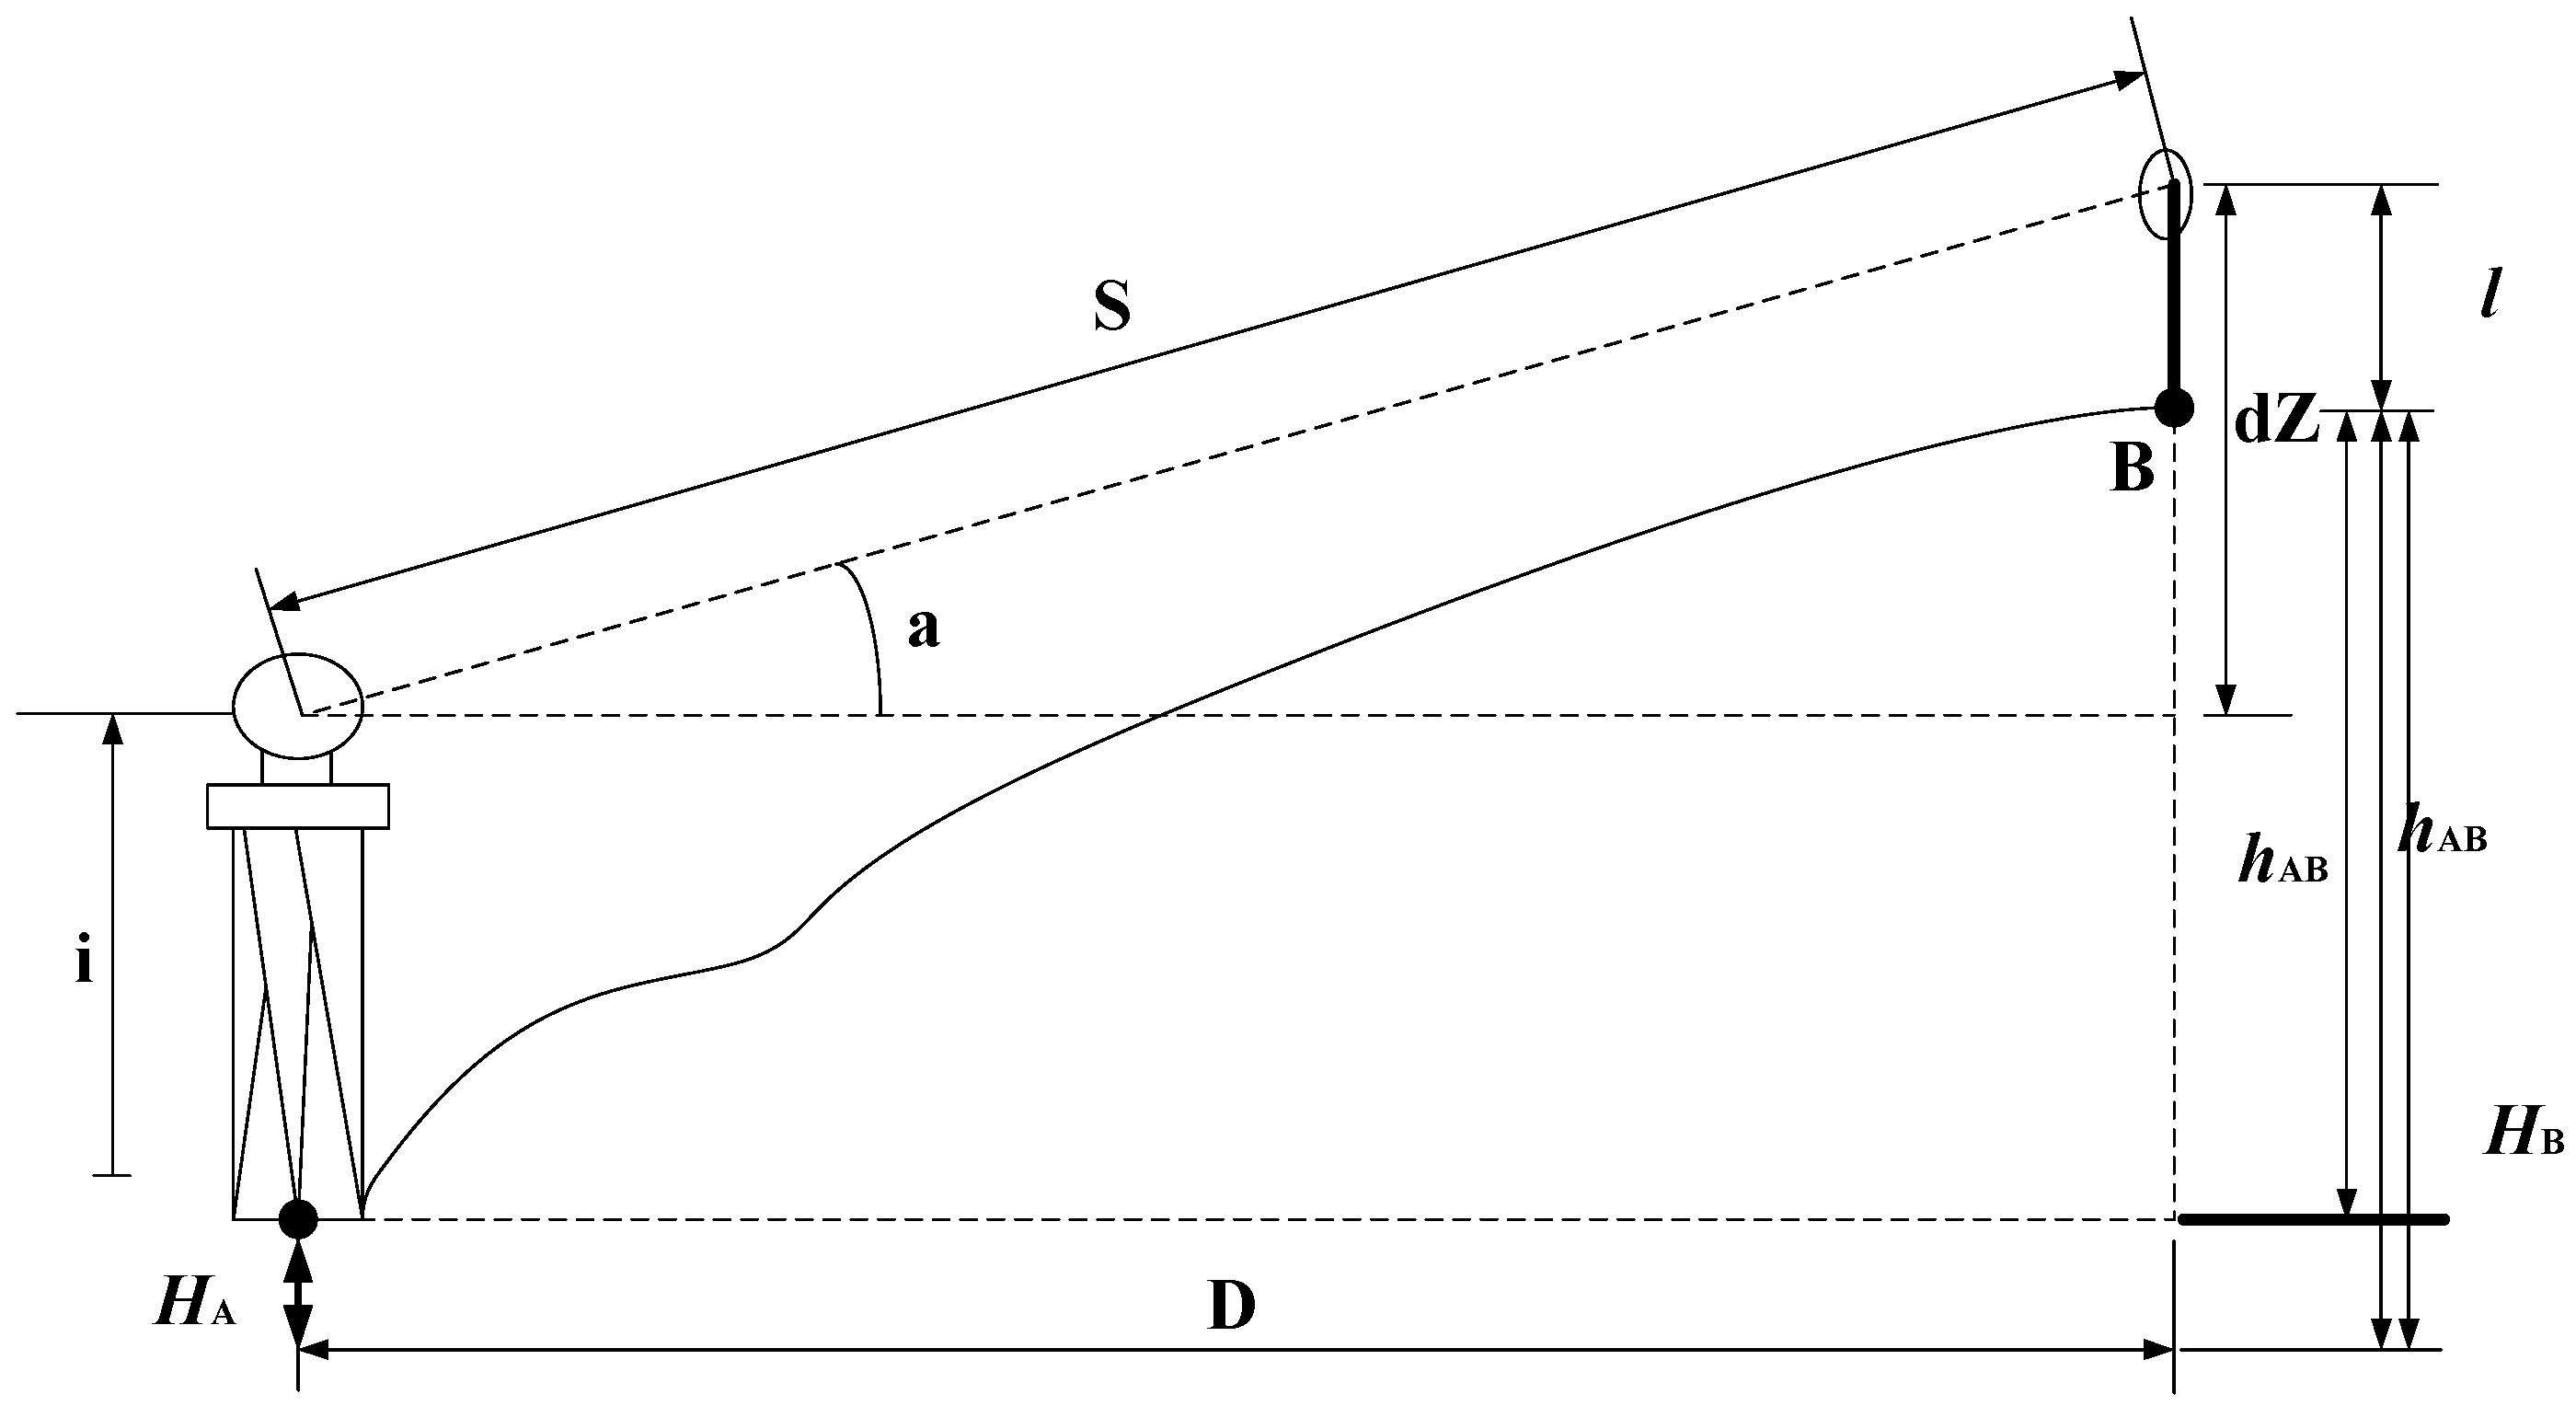
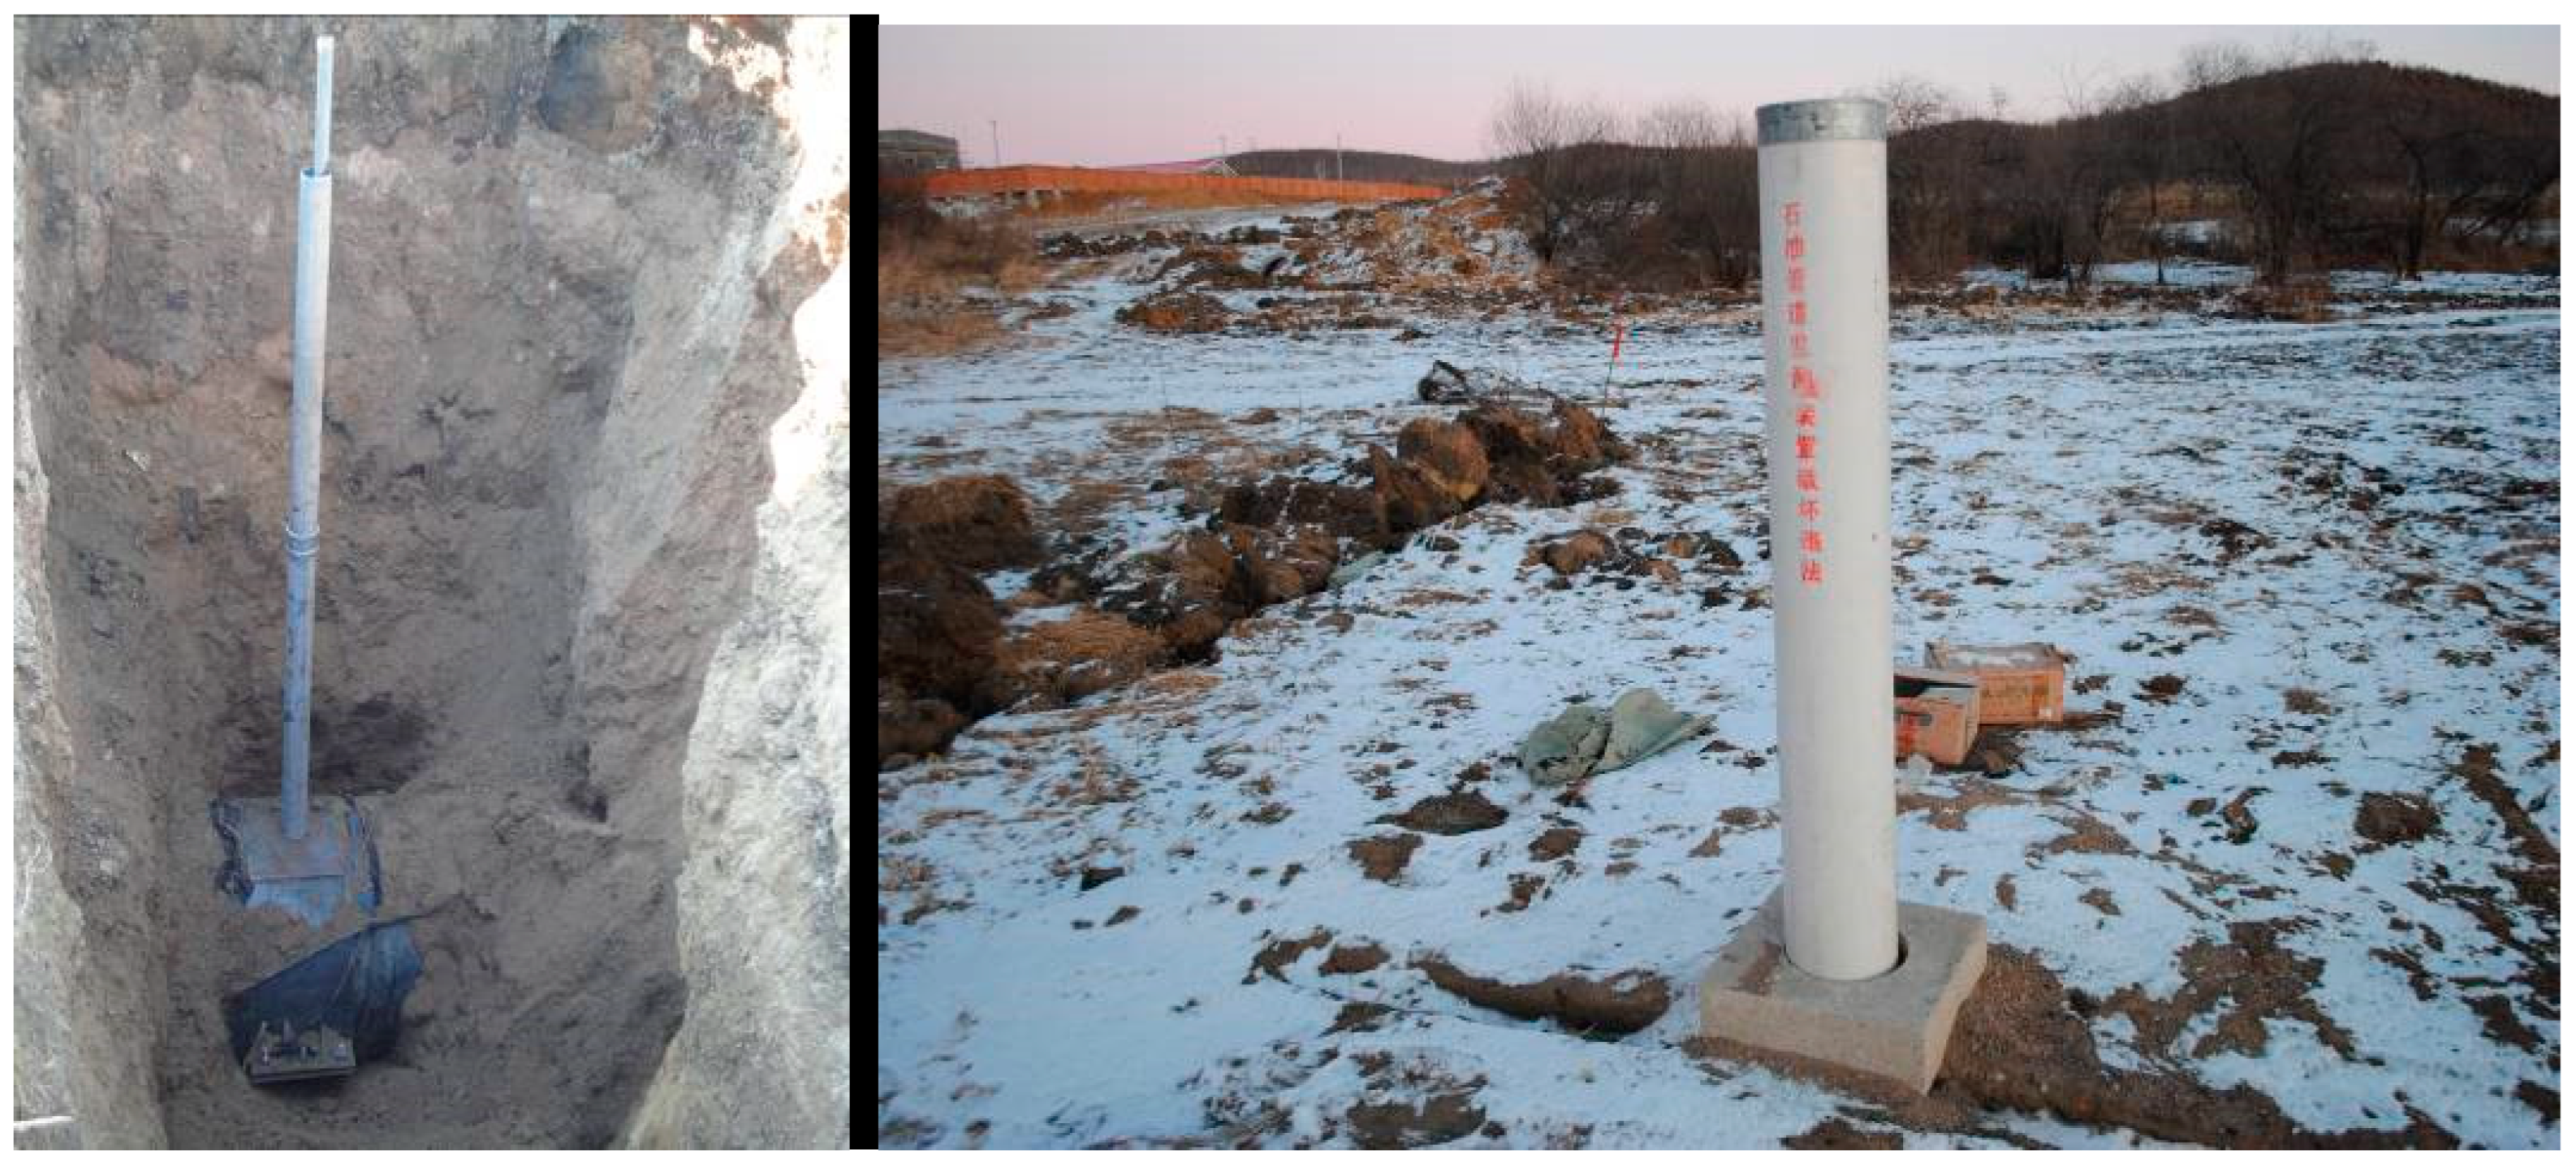
5.1.1. Mechanical Displacement Monitoring Technology

The principle of mechanical displacement monitoring technology for oil and gas pipelines in frozen soil areas is shown in Figure 12. These include installing benchmark and sighting piles in the monitoring area and installing marker piles on the pipelines to be monitored. A local coordinate system is established with the benchmark pile and the sighting pile, and the coordinates of each marker pile are measured regularly. If the pipeline is displaced, the coordinates of the marker pile change. The coordinate change between two time intervals is the displacement of the pipeline within that time interval.
Displacement due to frost heave and thaw subsidence is mainly caused by the vertical, that is, the elevation. Therefore, the measurement coordinates are mainly elevation coordinates. The principle of total station height measurement is shown in Figure 13. The total station is set up at point A (the height of point A is known H A ), the reflection prism is placed at the point to be sought, B, and the total station is aligned with the center of the prism to measure the slope, S, and the vertical angle, a, for the elevation of point B, H B . The formula is as follows:
H B = H A + h A B = H A + S * sin a + i l
where i is the height of total station and l is the height of prism.
In this method, a technician is required to carry an electronic total station or other monitoring device to the site for data collection. This method features a long cycle of monitoring and is significantly affected by environmental factors. Moreover, monitoring cannot be automatically achieved. In other sectors, vertical displacement is monitored using a hydrostatic level, which must be on the same horizontal plane as the monitored point and must have a small scale (no more than 1 m). The height difference of the pipeline monitoring sections may be up to 3–5 m, and the vertical displacement may reach 1–2 m within 1–2 years. Therefore, an ordinary hydrostatic level cannot meet the requirements for monitoring the vertical displacement of a pipeline in a permafrost area. In a harsh environment, a hydrostatic level also cannot be installed at the site.

5.1.2. Automatic Monitoring System

Obviously, common methods face many difficulties in monitoring surface dis-placement in the vicinity of pipeline as well as the pipeline displacement. For this reason, a monitoring system is required to ensure the real-time, remote, and automatic monitoring of vertical pipeline displacement under the influence of frost heave and thaw settlement in the extremely cold environment of a permafrost area. The system should realize a higher accuracy of pipeline displacement monitoring, have stable and reliable data collection and transmission equipment, have a long service life, and be convenient to install, inspect, and maintain. Additionally, the winter environment is harsh in a permafrost area, bringing higher requirements for and challenges to monitoring methods, instruments, and equipment [114,115].
The principles of an automatic monitoring system are as shown in Figure 14. The piezometer (9) mounted on the reference pile (8) and the piezometer (6) mounted at the pipeline monitoring point are connected to the liquid tank (15) through a liquid connecting tube (11). All piezometers are part of the same hydraulic system. The displacement of the reference pile (8) remains unchanged for a long time, and the elevation of the fixed piezometer (9) is constantly stable (which is regarded as a constant value). During the settlement or uplift of pipeline, the elevation of the piezometer fixed on the pipeline changes and causes the variation of its elevation difference with reference point. The new elevation can be calculated using the measured liquid pressure to obtain the variation in the pipeline elevation. Therefore, the piezometers (9 and 6) are used to periodically measure the liquid pressure at each monitoring point. The elevation variation of the pipeline at each monitoring point can then be obtained, i.e., the vertical displacement can be obtained.
All piezometers are connected to a data collection device (13) for real-time data collection and rely on a remote data transmission device (12) to transmit the data in a real-time manner to a remote data transmission device (19) in a room (21) through a mobile phone signal (GPRS) (17) or satellite (18). After the data are processed by the server (20), an early warning based on the monitoring is sent to the user.
The data collection device (13), remote data transmission module (12), battery (14), and liquid tank (15) are placed in a sealed and buried box (16), which is buried in the ground with all the other devices at the site to prevent the influence of an adverse atmospheric environment (1). Therefore, this method can be applied in alpine permafrost areas. The influence range of the pipe temperature varies with different monitoring sections. The installation depth of the above instrument can be 4–8 m, 5–10 m away from the circumference of the tube. The installation depth depends on the type and stability of the frozen soil in the pipeline. Markers and benchmarks of the pipeline-displacement monitoring system are shown in Figure 15.
  • Characteristics of Monitoring System
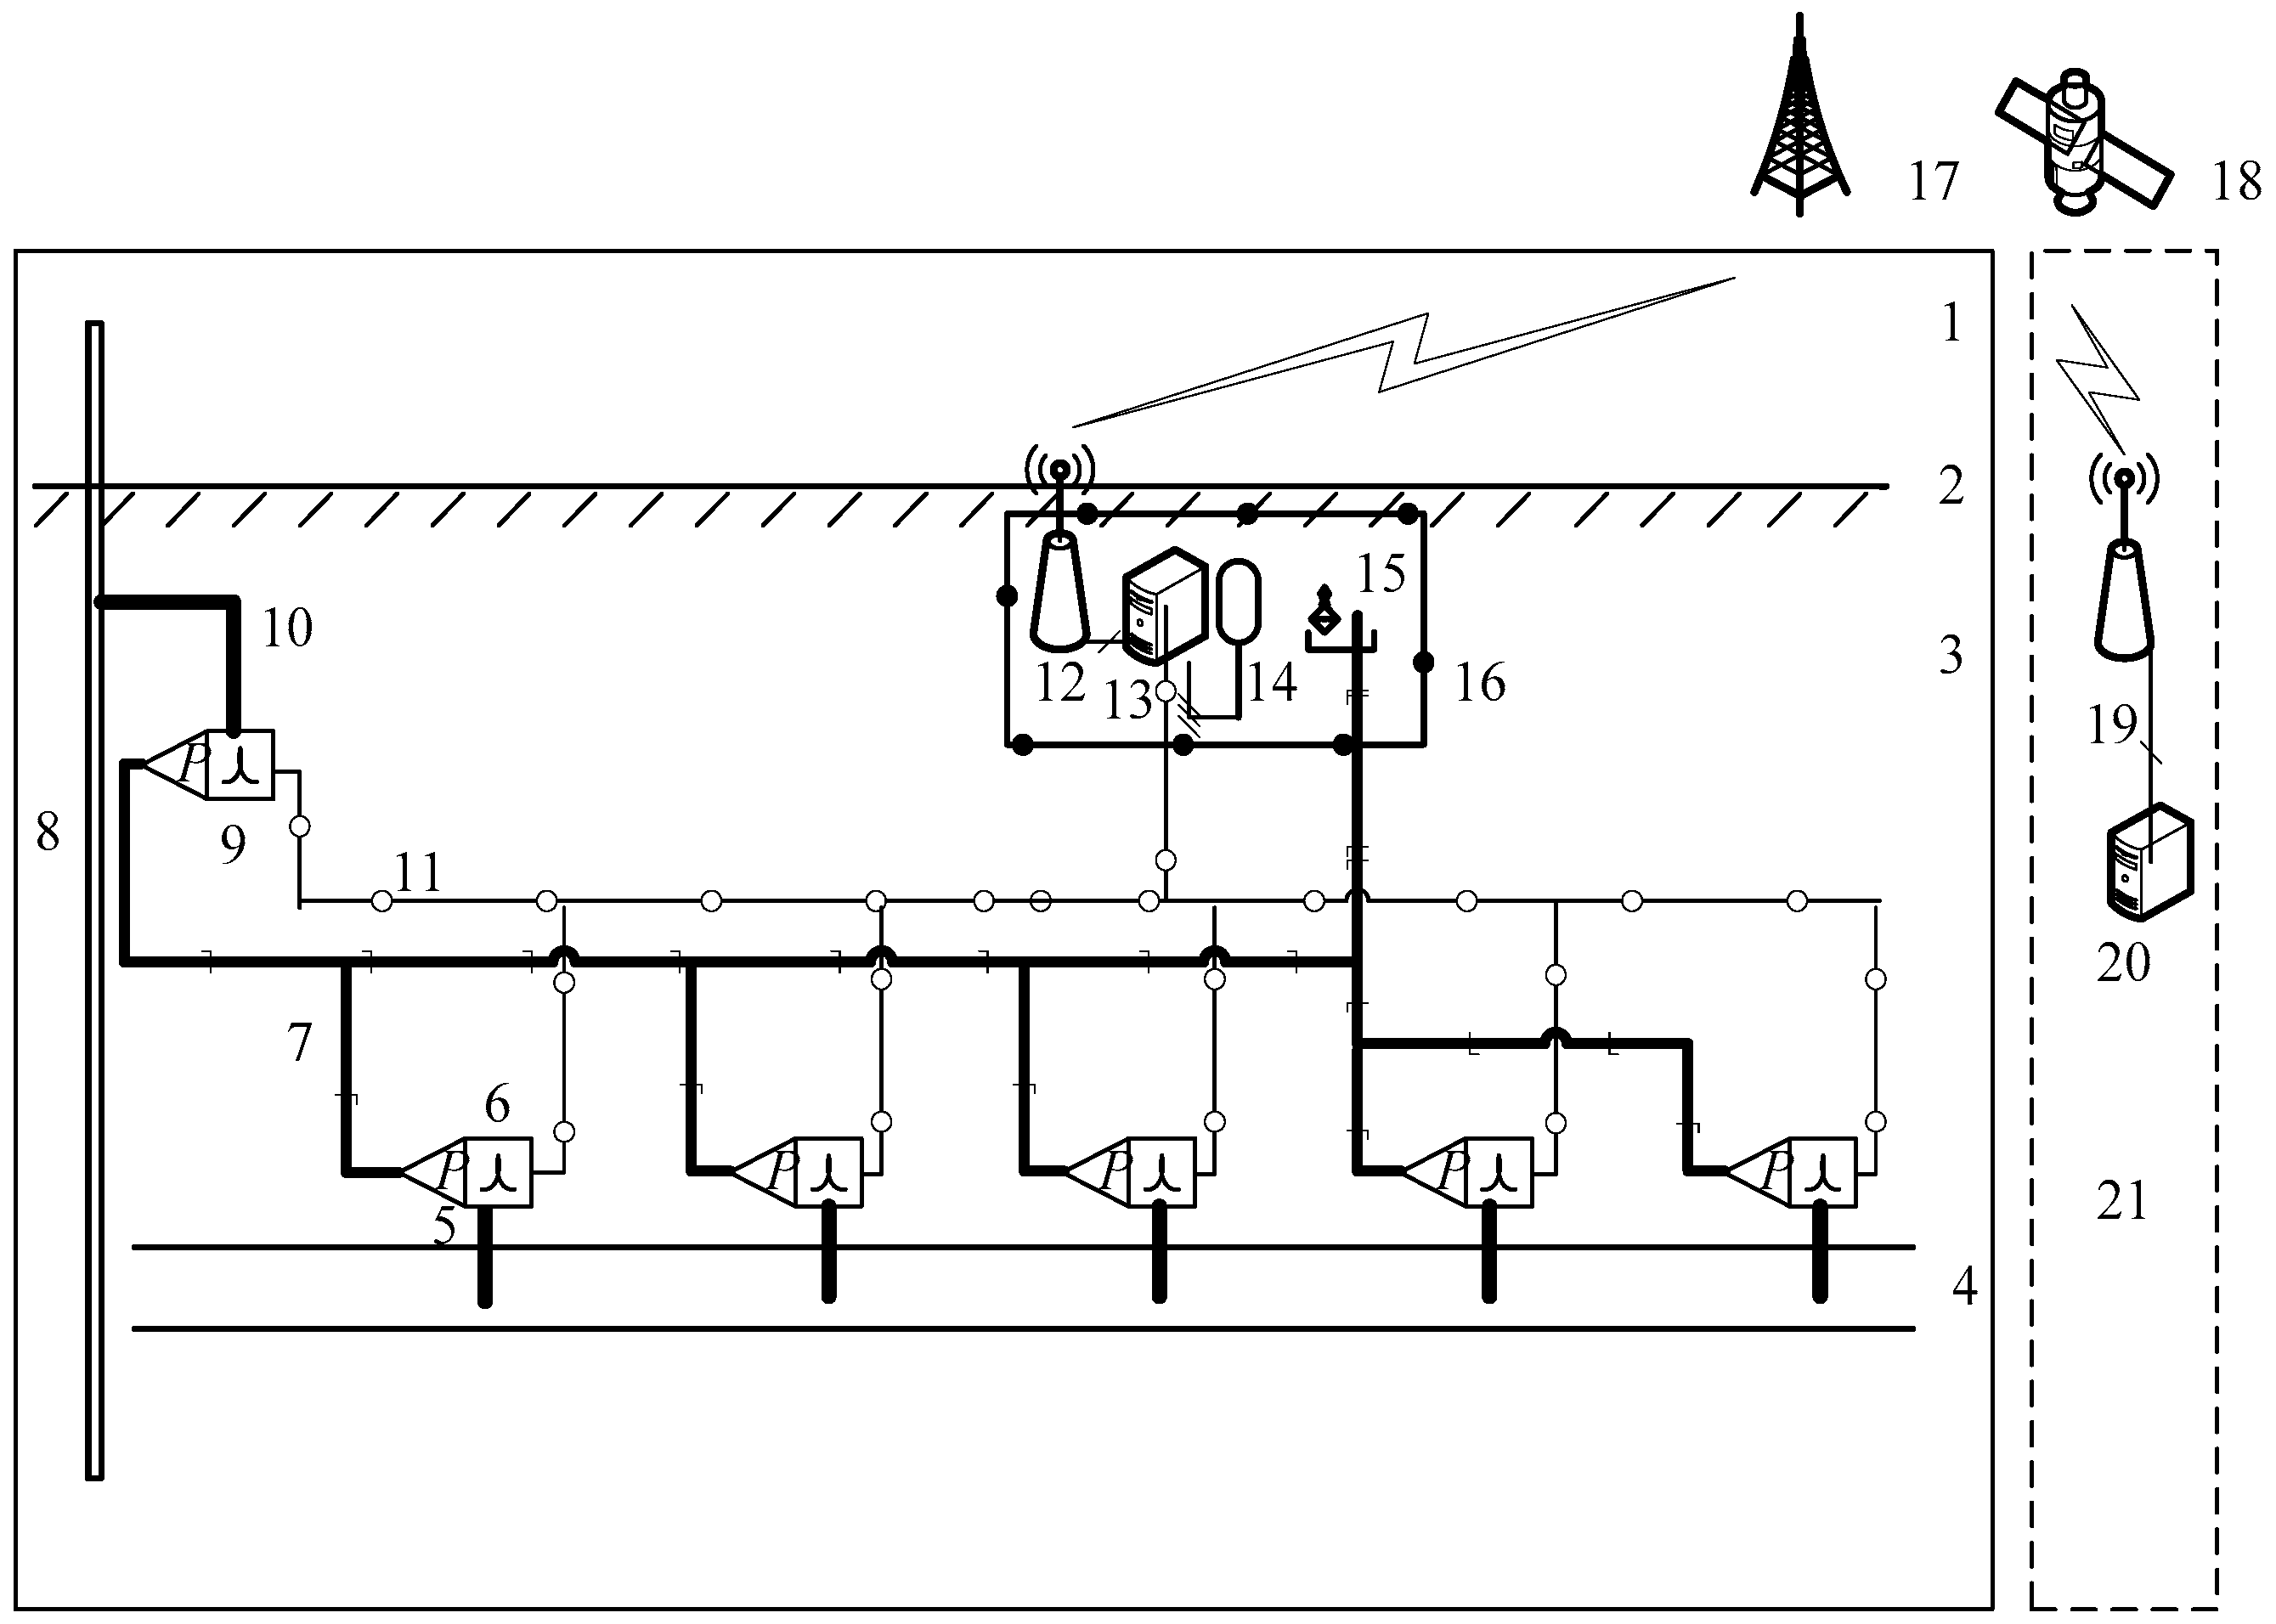
    • An automatic monitoring system for the vertical displacement of a pipeline based on liquid pressure is put forward The system can automatically monitor the vertical displacement of a pipeline in a permafrost area;
    • The vertical displacement monitoring equipment for a pipeline is different from the common liquid pressure monitoring method with a static-level settlement measurement device. It places piezometers at reference points and monitoring points to measure the liquid pressure of the hydraulic system at these points to calculate the elevation difference between these points. Piezometers have a larger measuring range (70 kPa); therefore, this method can be used for monitoring with a large measuring range (2 m) in regions with a large elevation difference (3–5 m). Meanwhile, it is not affected by a variation in atmospheric pressure or a variation in the level of a liquid tank (which is caused by liquid leakage and container expansion or shrinkage). Hence, monitoring accuracy is guaranteed (better than 7 mm);
    • All devices at the site are buried underground to guarantee their normal operation in the harsh climate environment of alpine regions (which are covered by snow and ice in the winter, with an extreme ambient temperature of −50 °C, and turn into marsh and wetlands due to thawing in the summer).

5.2. Soil Temperature Monitoring

5.2.1. Principles of Monitoring System

The temperature distribution of soil around the pipeline is one of the key parameters that reflects the environment in which the pipeline is located. The temperature field can be monitored to determine out the temperature distribution and the freeze–thaw cycle and its varying state in the vicinity of pipeline, providing an important basis for judging whether a pipeline is exposed to the freeze–thaw cycle or other potential hazards. Therefore, it can help identify the activity regularity of permafrost and seasonal frozen soil [116,117,118].
A temperature field monitoring system consists of a temperature sensor, signal cable, collection memory, battery, concrete well, and an in-well instrument frame. A data reader–recorder is used to read and transfer the data from the collection memory artificially and regularly. It is universal to the temperature monitoring system in all sections.
As is shown in Figure 16, the temperature sensors on each monitoring section are divided into six groups in the case. A group is provided for the monitoring points on the outer surface of pipeline wall (or thermal insulation coating) and above the pipeline, while five groups A, B, C, D, and E, are arranged as monitoring points in the vertical direction. Among them, group E is used to monitor the temperature distribution of the soil in its natural state. The monitoring place should be in a typical permafrost area, e.g., sections with a higher ice content and special geologic conditions and typical permafrost development zones, so as to monitor the transition of permafrost conditions. To learn about the temperature distribution regularity of permafrost along the entire route, it is recommended to cover the permafrost area along the entire route as much as possible [119,120].

5.2.2. Characteristics of Monitoring System

Based on the soil temperature monitoring and environmental factors in permafrost areas, the monitoring system should meet the requirements as follows:
  • The temperature measurement accuracy is 0.1 °C, and the error of vertical distance between temperature sensors is <1 cm, measured at the site prior to burial;
  • The signal cable of sensors is protected by a plastic tube and buried at a depth of 30 cm;
  • The temperature collection secondary meter (the data collection and storage system) meets the “GB3836.1-2000 General Requirements for Electrical Equipment”, and can operate normally under a temperature of −30 °C;
  • The concrete well is provided with thermal insulation and protection against frost heave, groundwater penetration, and rainwater. The cable holes are sealed after cabling. The upper edge of the well is 20 cm above the ground surface;
  • The battery (dedicated power supply) has a capacity ≥ 100 AH and can withstand low temperatures (offering normal service under −30 °C);
  • The data collected for 10 consecutive days are taken as the basis to judge whether the temperature monitoring system functions normally.

5.3. Stress and Strain Monitoring

5.3.1. Fiber Bragg Grating (FBG)

FBG is widely applied in the fiber-sensing field. It can be used to measure a variety of physical quantities, such as temperature, strain, stress, displacement, pressure, and acceleration [121]. Based on wavelength modulation, the FBG sensor has a strong resistance to electromagnetic interference and a long service life, making it particularly suitable for long-distance transmission or a harsh engineering environment.
The FBG will produce period strain when it is subjected to a vibration perturbation, so the central wavelength of the fiber Bragg grating will produce periodic drift. The vibration information can be obtained by detecting this periodic drift signal. The grating period or the fiber core refractive index will change when the temperature, strain, stress, or other physical quantity to be measured around the grating changes, shifting the central wavelength of the fiber Bragg grating. By detecting the displacement of the grating wavelength, the change in the physical quantity to be measured can be obtained. At present, all available sensors based on the Bragg grating can measure the physical quantities of a tested object by measuring and changing the wavelength at the center of the grating directly or indirectly [122,123,124].
A pipeline in a permafrost area is mainly exposed to axial stress. The stress on a pipeline can be reflected by the axial stress if it is correctly measured. Therefore, the fiber grating strain sensor measures only the axial strain of pipeline. According to the steel flexibility theory, if the radius of a pipeline’s cross section, r, is known, a sensor can be used to measure the single-axis longitudinal strain at three arcs with an interval of 90°, A, B, and C, in order to calculate the longitudinal strain at any point on the circumference (Figure 17). All the longitudinal strains on the circumference are in a plane crossing the pipeline. All longitudinal strains around the circumference are located in a plane passing through the pipe, which is defined as follows:
m x + n y + p z = 1
where x and y are the coordinates of any point on the circumference; z is the longitudinal strain of the point (x, y); and m, n, and p are random constants.
The measured strains A, B, and C give the following boundary conditions:
At the position x = r , y = 0 and z = A ; at the position x = 0 , y = r and z = B ; and at the position x = r , y = 0 and z = C .
The maximum stress of pipeline is calculated as follows:
σ = E { λ 1 + λ 3 2 ϕ + ( λ 1 λ 3 ) 2 2 ϕ 2 λ 1 2 + 2 λ 3 2 + 4 λ 2 2 4 λ 1 λ 2 4 λ 2 λ 3 + ( λ 1 + λ 3 2 λ 2 ) 2 ϕ λ 1 2 + λ 3 2 + 4 λ 2 2 + 2 λ 1 λ 3 4 λ 1 λ 2 4 λ 2 λ 3 2 λ 1 2 + 2 λ 3 2 + 4 λ 2 2 4 λ 1 λ 2 4 λ 2 λ 3 } × 10 6 ( M P a )
where λ 1 , λ 2 , and λ 3 are the wavelength variations of the fiber grating sensor, and ϕ is the strain sensitivity coefficient after the sensor is attached to the pipeline.
A fiber grating sensor features high measurement accuracy and high sensitivity [125,126]. It is not subjected to electromagnetic interference, so is suitable for long-distance and discontinuous monitoring. It is also compact and uses a piece of optical fiber for measurement in multiple channels. However, it is very costly. For a pipeline in service, its installation is conducted in a large range. In particular, it requires excessive excavation for pipelines in permafrost areas. It is recommended to install this type of sensor during the construction of pipeline.

5.3.2. Vibrating Wire Sensor Monitoring

When the stress of a monitored structure varies, a sensor (strain gauge) detects the deformation simultaneously. The deformation is transmitted by front and rear seats to a vibrating wire and causes a variation in its stress, changing the vibration frequency. The electromagnetic coil excites the vibrating wire and measures its vibration frequency. The frequency signal is transmitted to the reading device through the cable, and the internal strain of the monitored structure can then be measured. The temperature at the burial point can also be simultaneously measured [127,128].
This technology has a high resolution, meaning that it can measure the micro strain increment precisely. Moreover, it features good stability and repeatability. It can be used in a harsh environment for a long time due to its good air and water tightness.

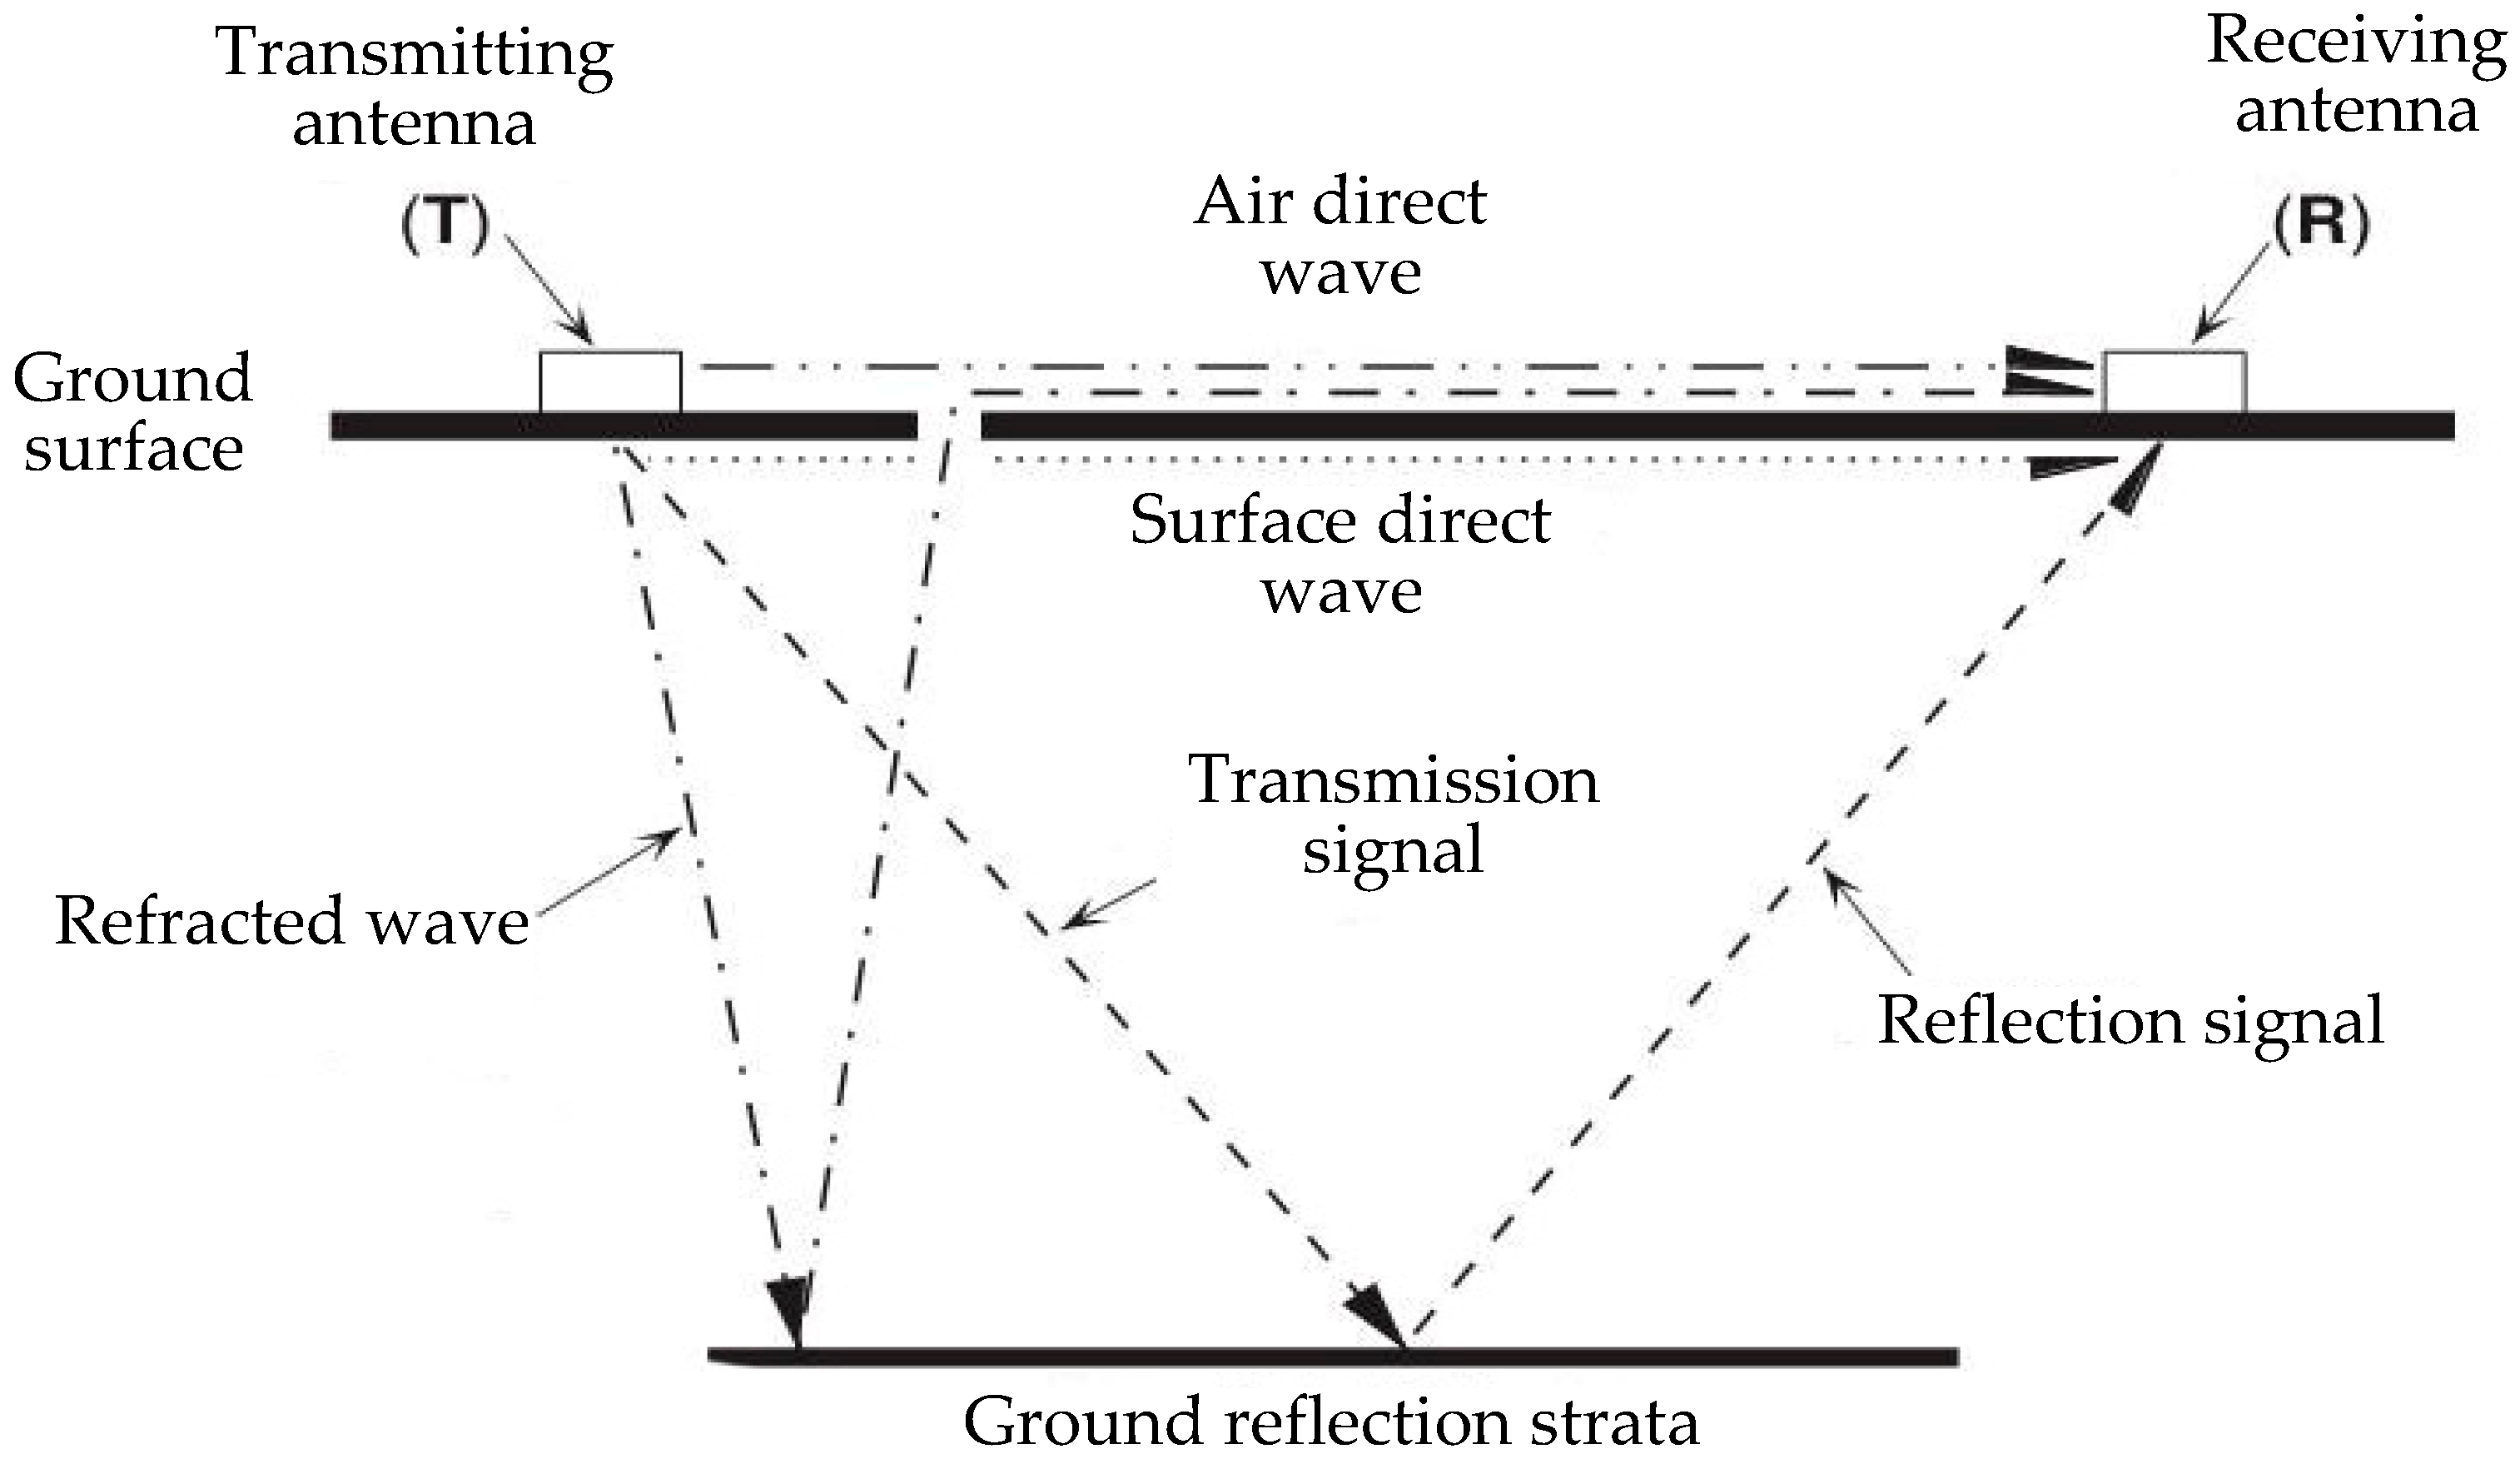
5.4. Ground-Penetrating Radar Measurement

5.4.1. Principles of Monitoring System

Ground-penetrating radar is a broad-spectrum (1 MHz–1 GHz) electromagnetic technology for determining the distribution of a medium in the ground. When an electromagnetic wave propagates in a medium, its path, electromagnetic field intensity, and waveform vary with the electrical properties and geometry of the medium [129,130]. Hence, the structure of a medium can be determined using the travel duration (i.e., two-way travel time), amplitude, and waveform of a received wave. In this technology, there is a very short distance between the transmitting and receiving antennae, which can even be combined. When the dip angle of the strata is small, the entire path of the reflection wave is almost vertical to the ground surface. Hence, the change in the normal reflection time at different positions of the measurement line indicates the formation of underground strata.
Ground-penetrating radar technology has been widely applied in the survey of permafrost areas since the 1980s. In combination with drilling and pitting, ground-penetrating radar can effectively realize the efficient and convenient investigation of the spatial distribution, burial depth, position, and development process of permafrost. Based on the characteristics of the permafrost along the pipeline route in permafrost area, ground-penetrating radar can select some typical permafrost zones and profiles for proper investigation to learn about the permafrost distribution and ice content in these zones, thus determining the thaw settlement of permafrost due to the thermal effect of a pipeline when there are different surface vegetations, different geological locations and landforms, different protective measures (e.g., laying of thermal insulation materials and the burial of heat pipelines), and different average annual ground temperatures [131,132].
As shown in Figure 18, in ground-penetrating radar technology, the receiving antenna does not only receive the reflection waves from the underground reflection strata. The first pulse that arrives is the air direct wave, which is transmitted from the transmitting antenna to the receiving antenna at the velocity of light (0.2998 m/ns). The second pulse to arrive is the surface direct wave, which propagates directly between the transmitting and receiving antennas. The receiving antenna can also receive the reflection wave from the underground reflection strata and the refracted wave, under satisfactory conditions.

5.4.2. Characteristics of Monitoring System

Ground-penetrating radar features a high operating frequency and mainly relies on the displacement current as its geological medium. Therefore, there is actually little dispersion in the transmission of high-frequency wideband electromagnetic waves, and the velocity is basically determined by the electrical properties of the medium [133].
Ground-penetrating radar is a nondestructive inspection method. It is convenient to carry, simple to operate, and fast to measure. Moreover, it is able to accurately determine and greatly analyze the coordinates in the direction of surveying line. However, its penetration depth is affected by the nature and density degree of the medium. Based on the drilling and temperature measurement results, it can determine the permafrost distribution, pipeline and freeze–thaw depth, and the underground ice development in the section.

5.5. Slope Monitoring

5.5.1. Time-Domain Reflectometry

Time-domain reflectometry (TDR) is an electronic measurement technology that has always been used to measure and spatially position the shape features of objects [134,135].
In TDR, a pulse wave (fast step signal) is transmitted into a coaxial cable. A pulse signal can reflect the impedance characteristics of the coaxial cable during its propagation in the cable. Characteristic impedance is an inherent property of the cable and depends on the medium inside the cable and the diameter of the cable. When the cable is twisted, stretched, broken, deformed in any other form, or encounters external substances such as water, its characteristic impedance will change. When a test pulse experiences the characteristic impedance change of cable, it will generate a reflection wave. The incident wave is compared with the reflection wave to determine their difference, which can then be used to judge the state of the coaxial cable (such as its open circuit, short circuit, or deformation status). If the TDR test pulse signal has the propagation velocity in the test cable and the time interval between the transmission signal and reflection signal is, the distance from the cable to the position of deformation, d, is given by:
d   =   V p × T d / 2
where VP is the TDR test pulse signal propagation velocity in the test cable, Td is the time interval between the transmission signal and the reflection signal, and d is the distance from the cable to the position. Therefore, the position at which the state of the coaxial cable changes can be determined.
When a TDR system is used for monitoring, a hole is drilled at a position on the slope as needed, and a TDR coaxial cable is placed in the hole and then connected to the cable tester. As a signal source, the cable tester transmits the step-by-step voltage pulse, which propagates through the cable and reflects the pulse signal reflected from the cable. A data recorder is connected to the cable tester to record and store the pulses reflected from the cable for future analysis.
The coaxial cable in a TDR monitoring system is in direct contact with the slope or landslide; therefore, it can be regarded as a sensor. If any change happens to the earth after the coaxial cable used for testing is placed, the earth’s displacement will cause the deformation of the coaxial cable, which changes the characteristic impedance of the cable. Meanwhile, the TDR landslide-monitoring system on the ground surface can monitor the deformation of the coaxial cable in the hole. In the monitoring process, a test pulse signal is transmitted to the coaxial cable first, while automatic data collection is performed with respect to the reflection signal. The reflection wave data from the cable are read. The large deformation of the cable happens at the position at which the peak pulse reflection signal is generated so that the movement of strata can be monitored. When the reflection wave becomes stronger, it can be used to predict the damage that will be caused to the rock and earth in a region, achieving the dynamic monitoring of the region.

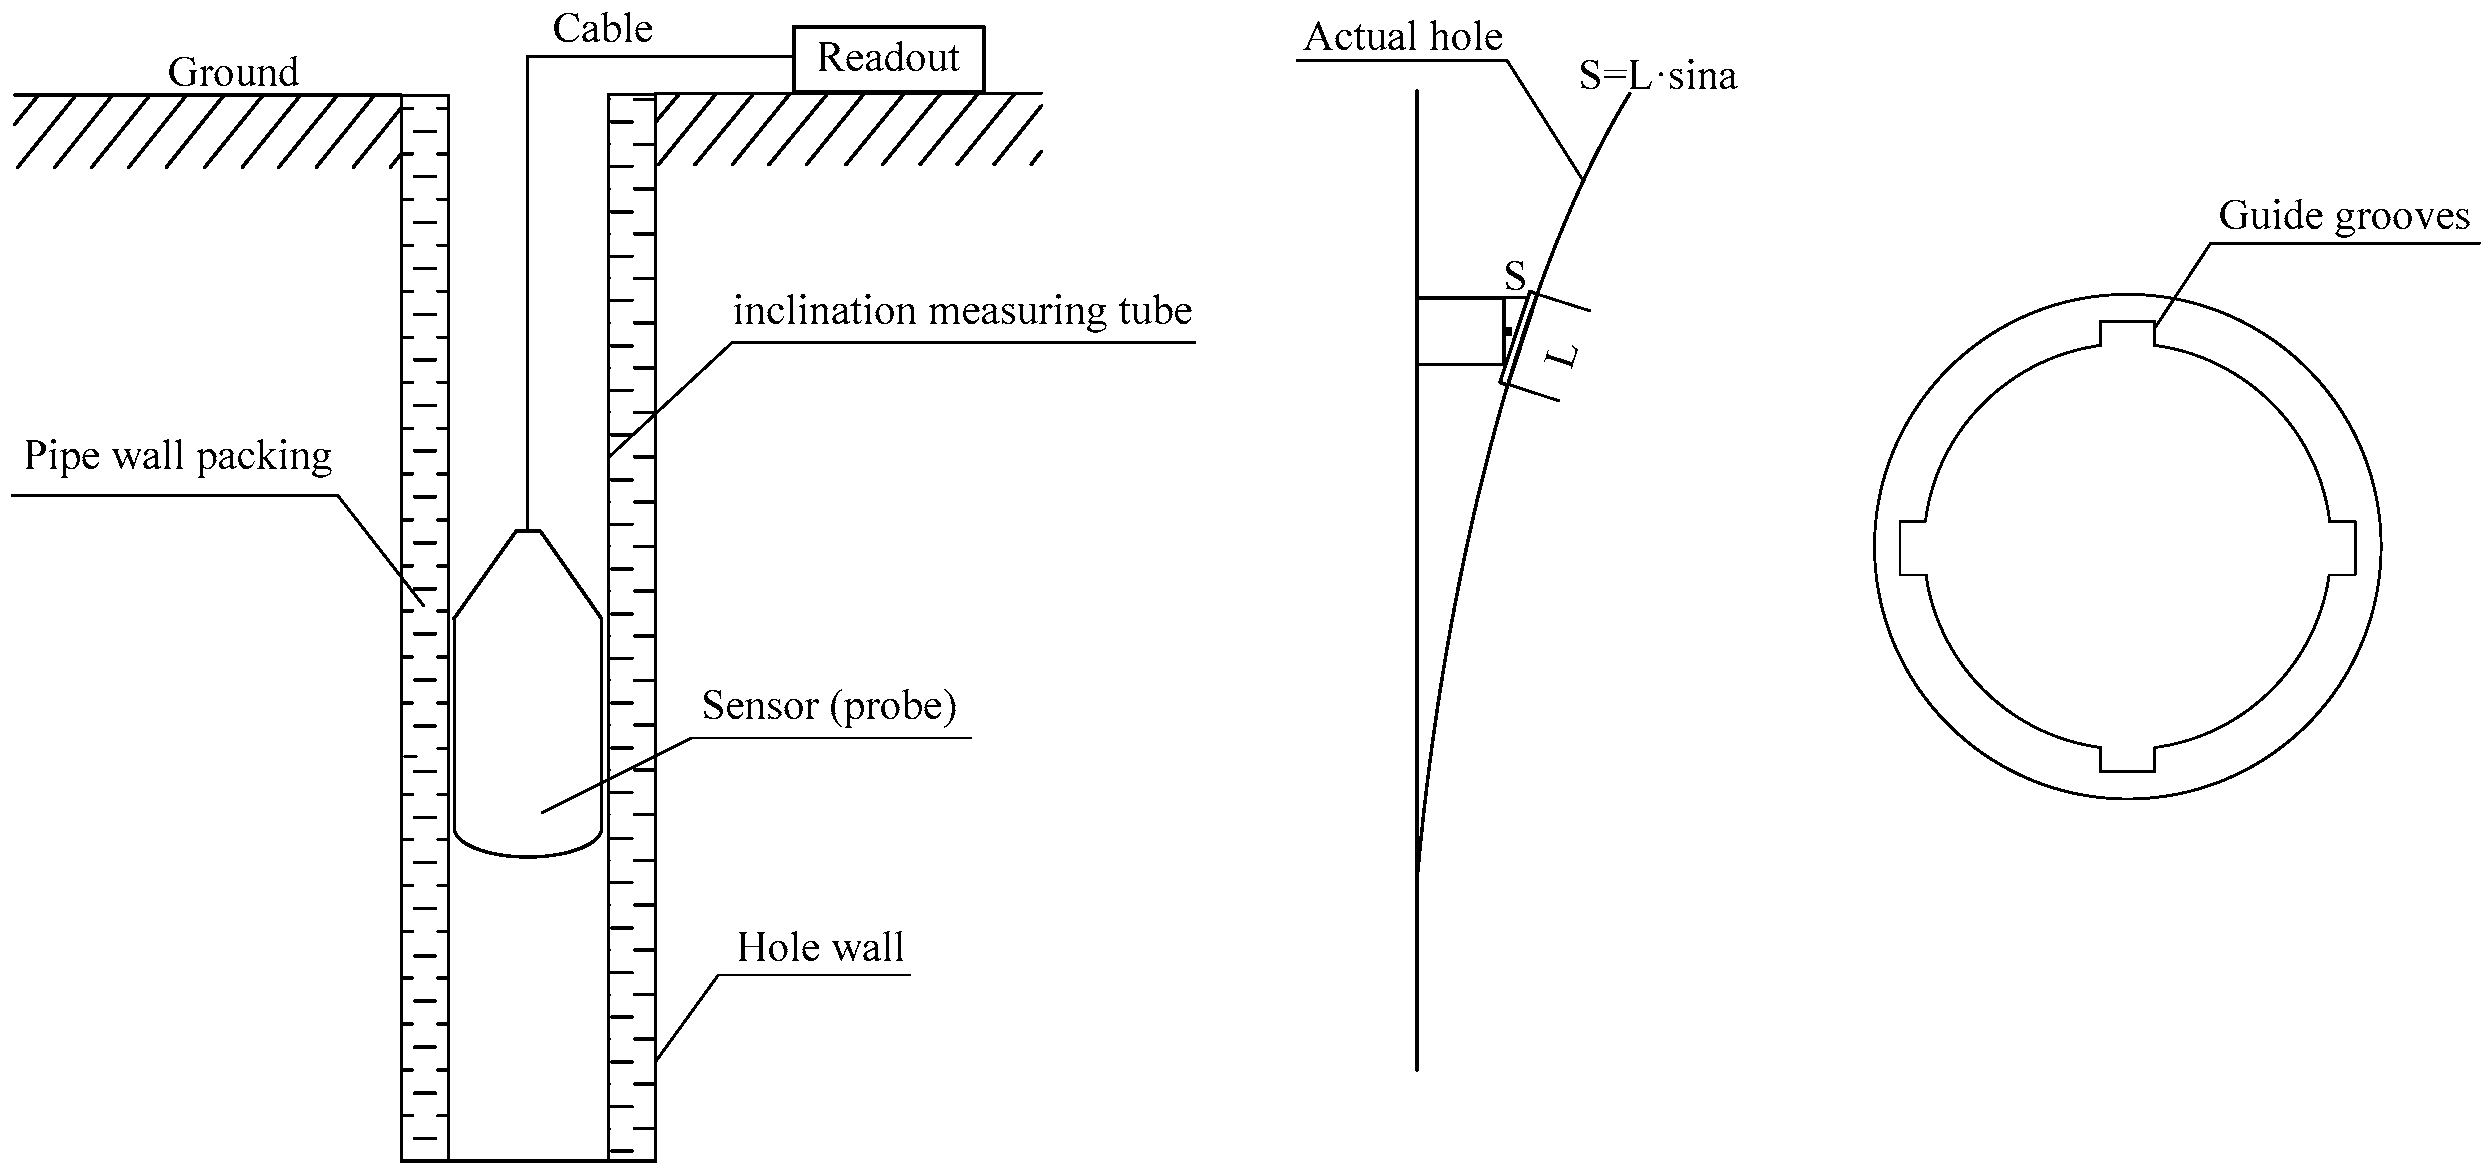
5.5.2. Borehole Inclinometer

A fixed borehole inclinometer has a high sensitivity and accuracy. It can be used to realize automatic and continuous data collection [136]. It is one of the effective monitoring instruments for measuring the deformation direction, quantity, and rate of a landslide along the slip zone, and for judging the deep deformation state of a landslide. The inclinometer consists of an inclination-measuring tube, probe, control cable, and digital recorder [137]. The constitution and operating principles of an inclinometer are shown in Figure 19.
For the principles of operation, an inclinometer measures the change in the angle between its axis and the plumb line to calculate the horizontal displacement of rock and earth at different elevations. A vertical inclination measuring tube with four guide grooves is buried in a suitable way in the rock and earth. When the tube is deformed by force, the inclinometer displays the radian displacement angle, θ i , formed by the axis of the deformed tube and the vertical line section by section. Based on the section length at the measuring point, the horizontal displacement increment at different elevations is calculated as follows:
d i = L sin θ i
After section by section aggregation from the bottom measuring point of the tube, the actual horizontal displacement at any elevation can be obtained:
b i = i = 1 n d i
The diagram of the relevant detection technology is as follows:
In the above equations, d i is the horizontal displacement increment in the measured section; L is the length of the section to which the measuring point belongs; θ i is the angle formed by the axis of the tube and the plumb line in the measured section; b i is the displacement at the point i starting from the bottom of the fixed tube; and n is the number of sections of the measuring borehole.

6. New Technologies for Pipeline Defect In-Line Inspection

Cathodic protection current mapping (CPCM) in-line inspection is a technology developed by U.S. Baker Hughes Inc. As shown in Figure 18, this in-line inspection tool can quickly and accurately record the quantity and direction of the cathodic protection current in a pipeline. Pipeline companies can clearly learn about the current at different positions along the entire pipeline and determine where external pipeline corrosion is most likely to happen. When the tool operates in the pipeline, it obtains data based on the pressure drop caused by the cathodic protection current flowing back to the power supply. It is easy to find out and quantify the source and density change of current, short circuit, and connection. The tool has the following advantages: it resolves the problem of pipeline inspection when crossing railways, rivers, or hills, etc.; it greatly reduces labor costs and data collection time; it realizes a 100% pipeline inspection coverage; and it significantly lowers the influence of the external environment on inspection.
“Illegal Hot Tapping” has been a problem troubling petroleum pipeline enterprises for a long time. Every year, it causes a large number of severe consequences in China and around the world. It brings hazards, such as a direct loss of resources, the indirect cost of emergency repairs, and transfers halts and restarts, irreversible environmental pollution, oil and gas explosion, death, and personal injury. Oil stealing is often not discovered immediately. Oil theft does not happen at a specific place. The valves for oil stealing are often secretly installed on the pipeline or abandoned if discovered, so that they cannot be discovered in a timely manner. During the construction of some new pipelines, valves are even installed for stealing oil when they are put into operation. All these factors become hazards to the operation of pipelines. Considering the features of stealing oil by drilling, the China Pipeline Company has developed a special, in-line inspection tool (see Figure 20) which is different from a high-accuracy, magnetic flux leakage in-line inspection tool. This tool is equipped with a special weak magnetic disturbance probe. During its operation, it achieves very high inspection rate for branches on the pipeline with a diameter of 5 mm and above. Moreover, this tool has a lower operation cost and has no special requirements for the cleanliness of the pipeline, so it can quickly issue an inspection report and accurately locate the illegal hot tapping where oil stealing occurs.
The Halfwave company has developed a new ultrasonic inspection technology and tool. The technology uses a number of widely applied ultrasonic sensors to perform the in-line inspection of a pipeline with regard to metal loss, so as to determine whether there is any metal loss or damage. The tool is different from a common UT tool in the following aspects: (1) it does not need a liquid coupling agent to transmit the ultrasonic signal to pipeline wall, so it can inspect natural gas pipelines; and (2) the acoustic resonance technology (ART) signal can penetrate the coating, loose scraps, and surface deposits (especially wax) more effectively than the traditional UT signal, so it lowers the requirement for pipeline cleaning before inspection. The tool is applicable to all thicknesses of pipeline, and its inspection accuracy can reach +/− 0.2 mm.

7. Conclusions

The influence of geological hazards, including thaw settle and frost heave, brings tremendous challenges to the safe operation of long-distance oil and gas pipelines in permafrost areas. In-line and off-line inspection and focused monitoring provide an effective way to guarantee the intrinsic safety and integrity of long-distance oil and gas pipelines in permafrost areas. This paper summarizes and describes the methods for in-line and off-line inspection and monitoring of pipelines in permafrost areas, and further introduces the latest method for pipeline inspection. Conclusions are drawn as follows:
  • Regarding defects, including the metal loss of a pipeline in a permafrost area, in-line inspection methods may be employed. These include magnetic flux leakage, electromagnetic eddy current, ultrasonic, and electromagnetic acoustic transducer inspections. Regarding geometry deformations such as pit, a high-accuracy geometry inspection tool can be used for inspection. The IMU in-line inspection technology can be employed to indicate bending and variation in a pipeline along the entire route. It features a high inspection accuracy, accurate positioning, and comprehensive data, etc., so it is applicable to the bending strain and displacement inspection of a pipeline in a permafrost area. Different inspection technologies are combined and analyzed comprehensively to fully understand and learn about the state of pipelines in permafrost areas;
  • Off-line inspection is another important way to inspect a pipeline in a permafrost area. Indirect inspection is combined with verification by direct inspection to check and evaluate the integrity of the anticorrosive coating and the effectiveness of the cathodic protection for the pipeline. In the end, a pipeline external corrosion control rectification scheme is put forward based on inspection and evaluation;
  • Regarding the external environment of a pipeline in a permafrost area, a monitoring system should be developed and established. For instance, a temperature-sensing system can effectively detect the influence of surrounding permafrost and the development trend of the thaw cycle after a pipeline is put into operation, providing a technical guarantee for the dynamic observation of the soil temperature field around the buried pipeline. The pipeline-displacement monitoring system, based on the measurement by electronic total station, can monitor the pipeline displacement in a convenient, vivid, and effective way. A grating fiber stress inspection system can provide the absolute and relative load conditions for a pipeline in the monitored area. Due to its high accuracy and confidence level, the system can be taken as an important method for the early warning of pipeline displacement and load safety in the key areas.
In general, it is possible to learn about the state, ambient temperature, pipeline stress, strain, displacement, and other important parameters of a pipeline in a timely and effective manner by performing in-line and off-line inspections and establishing an integrated monitoring system for a pipeline in a permafrost area. The analysis of data from inspection and monitoring is of great significance to the safe operation of a pipeline in a permafrost area.

Funding

This work was supported by the National Key R&D Program of China (Grant No. 2022YFC3070100), the Science and Technology Research Project of PipeChina (No. WZXGL202104), the PetroChina Pipeline Company Program: 20180101, the National Science Foundation of China (Grant No. 52004314), and the Young Elite Scientists Sponsorship Program by Beijing Association for Science and Technology.

Data Availability Statement

Where no new data were created.

Conflicts of Interest

The authors declare no conflict of interest.

References

  1. Rui, Z.; Li, C.; Peng, F.; Ling, K.; Chen, G.; Zhou, X.; Chang, H. Development of industry performance metrics for offshore oil and gas project. J. Nat. Gas Sci. Eng. 2017, 39, 44–53. [Google Scholar] [CrossRef]
  2. Ting, W.; Hui, Y.; Feng, Q.S.; Zhou, L.J.; Wang, F.X.; Xu, X.Q. Current status and prospect of inline inspection technologies for defects in girth weld of oil and gas pipeline. Oil Gas Storage Transp. 2015, 34, 694–698. [Google Scholar]
  3. Kim, K.; Zhou, W.; Huang, S.L. Frost heave predictions of buried chilled gas pipelines with the effect of permafrost. Cold Reg. Sci. Technol. 2008, 53, 384–396. [Google Scholar] [CrossRef]
  4. Feng, S.G.; Zhang, X.; Ma, T. Thaw settlement prevention and temperature monitor of Mohe-Daqing Crude Oil Pipeline in permafrost. Oil Gas Storage Transp. 2014, 33, 478–483. [Google Scholar]
  5. Oswell, J.M.; Skibinsky, D. Discussion of Frost heave and pipeline upheaval buckling. Can. Geotech. J. 2005, 42, 321–322. [Google Scholar] [CrossRef]
  6. Vladimirov, A.I.; Kershenbaum, V.Y. Industrial Safety and Reliability of Main Pipelines; Vladimirov, I., Kershenbaum, V., Eds.; National Institute of Oil and Gas: Moscow, Russia, 2009. [Google Scholar]
  7. Ivantsov, O.M.; Kharionovskiy, V.I. Main Pipeline Reliability; Nedra: Moscow, Russia, 1978. [Google Scholar]
  8. Naumov, O.V. Simulation of Main pipeline SSS in permafrost soil condition. In Proceedings of the MIKMUS 30: Collected Papers, Moscow, Russia, 4–6 December 2019; pp. 153–155. [Google Scholar]
  9. Naumov, O.V.; Moskvitin, G.V.; Polyakov, A.N.; Pugachev, M.S. Particularities in operation of pipelines of underground routing in kryolith (permafrost soil) conditions. In Proceedings of the MIKMUS 29 Conference: Collected Papers, Moscow, Russia, 7–9 December 2016; pp. 97–99. [Google Scholar]
  10. Zonn, I.S.; Kostianoy, A.G.; Semenov, A.V.; Joksimović, A.; Đurović, M. Friendship-Adria Oil Pipeline. In The Adriatic Sea Encyclopedia. Encyclopedia of Seas; Springer: Cham, Switzerland, 2021. [Google Scholar] [CrossRef]
  11. Khrenov, N.N. Reliability of chilled gas pipelines in permafrost. Soil Mech. Found. Eng. 2010, 47, 26–31. [Google Scholar] [CrossRef]
  12. Ma, Y.B.; Tan, D.J.; Jing, H.; Xue, Q.; Zhang, Z.C. Permafrost Hazard of Mohe-Daqing Crude Oil Pipeline. Adv. Mater. Res. 2013, 13, 2659–2663. [Google Scholar] [CrossRef]
  13. Dong, P.; Zheng, D.H.; Hang, J.Z.; Lu, J.J. Monitoring of temperature field around buried oil pipeline in Mo-Da permafrost region. Oil Gas Storage Transp. 2018, 37, 58–65. [Google Scholar]
  14. Yu, X.F.; Wang, G.P.; Zou, Y.C.; Wang, Q.; Zhao, H.M.; Lu, X.G. Effects of Pipeline Construction on Wetland Ecosystems: Russia–China Oil Pipeline Project (Mohe-Daqing Section). AMBIO 2010, 39, 447–450. [Google Scholar] [CrossRef]
  15. Li, Y.G.; Jing, H.J.; Sheng, Y. Recent Advances in Frozen Ground Engineering Geology Survey along the China-Russia Crude Oil Pipeline Route (Mohe-Daqing Section). J. Glaciol. Geocryol. 2008, 30, 170–175. [Google Scholar]
  16. Chen, P.C.; Yang, B.L.; Wang, M. Geological hazard risk of moda pipeline and its permafrost region. Oil Gas Storage Transp. 2011, 30, 621–623. [Google Scholar]
  17. Fan, S.Z.; Li, G.Y.; Mu, Y.H. Study on Thermal Hazards Assessment at a Typical Site along MoHe-Daqing Section of China-Russia Crude Oil Pipeline. J. Disaste Prev. Mitig. Eng. 2017, 37, 456–461. [Google Scholar]
  18. Oswell, J.M. Pipelines in permafrost: Geotechnical issues and lessons. Can. Geotech. J. 2011, 48, 1412–1431. [Google Scholar] [CrossRef]
  19. Wang, F.; Li, G.Y.; Ma, W.; Wu, Q.B.; Jiang, N.S.; Wang, P. Pipeline–permafrost interaction monitoring system along the China–Russia crude oil pipeline. Eng. Geol. 2019, 254, 113–125. [Google Scholar] [CrossRef]
  20. Dadfar, B.; El Naggar, M.H.; Nastev, M. Vulnerability of buried energy pipelines subject to earthquake-triggered transverse landslides in permafrost thawing slopes. J. Pipeline Syst. Eng. Pract. 2018, 9, 04018015. [Google Scholar] [CrossRef]
  21. Wang, F.; Li, G.Y.; Ma, W.; Mu, Y.H.; Mao, Y.C.; Wang, B. Influence of Warm Oil Pipeline on Underlying Permafrost and Cooling Effect of Thermosyphon Based on Field Observations. In Proceedings of the China-Europe Conference on Geotechnical Engineering, Vienna, Austria, 13–16 August 2016; Springer: Cham, Switzerland, 2018; pp. 1424–1428. [Google Scholar]
  22. An, Y. Application of EPC Management Model in Construction of Long-distance Pipeline Project. In Proceedings of the Advances in Materials, Machinery, Electrical Engineering (AMMEE 2017), Tianjin, China, 10–11 June 2017; Atlantis Press: Amsterdam, The Netherlands, 2017. [Google Scholar]
  23. Vanaei, H.R.; Eslami, A.; Egbewande, A. A review on pipeline corrosion, in-line inspection (ILI), and corrosion growth rate models. Int. J. Press. Vessels Pip. 2017, 149, 43–54. [Google Scholar] [CrossRef]
  24. Feng, Q.; Li, R.; Nie, B.; Liu, S.; Zhao, L.; Zhang, H. Literature review: Theory and application of in-line inspection technologies for oil and gas pipeline girth weld defection. Sensors 2017, 17, 50. [Google Scholar] [CrossRef]
  25. Xie, M.; Tian, Z. A review on pipeline integrity management utilizing in-line inspection data. Eng. Fail. Anal. 2018, 92, 222–239. [Google Scholar] [CrossRef]
  26. Siraj, T.; Zhou, W. Quantification of Measurement Errors in the Lengths of Metal-Loss Corrosion Defects Reported by Inline Inspection Tools. J. Press. Vessels Technol. 2019, 141, 061402. [Google Scholar] [CrossRef]
  27. Desjardins, G.; Nickle, R.; Skibinsky, D.; Yip, J. Comparison of In-Line Inspection Service Provider Magnetic Flux Leakage (MFL) Technology and Analytical Performance Based on Multiple Runs on Pipeline Segments. In Proceedings of the 2012 9th International Pipeline Conference, IPC2012-90251, Calgary, AB, Canada, 24–28 September 2012. [Google Scholar]
  28. Ding, Z.W.; He, R.Y.; Liu, Z. The simulation analysis and quantity model of pipeline defect signals in magnetic flux leakage testing. Nondestruct. Test. 2013, 35, 30–33. [Google Scholar]
  29. Amineh, R.K.; Natalia, K.; Nikolova, J.; Reilly, P. Characterization of Surface-Br-eaking Cracks Using One Tangential Component of Magnetic Leakage Field Measurements. IEEE Trans. Magn. 2008, 44, 516–524. [Google Scholar] [CrossRef]
  30. Feng, Q.S. Three-axis high-resolution MFL internal inspection technology for in-service pipeline. Oil Gas Storage Transp. 2009, 28, 72–75. [Google Scholar]
  31. Wang, F.X.; Feng, Q.S.; Wang, X.L.; Yan, B.C.; Chu, W.W. Signal analysis and application of tri-axial MFL sensors for pipeline in-line inspection. Oil Gas Storage Transp. 2010, 29, 815–817. [Google Scholar]
  32. Co, V.; Ironside, S.; Ellis, C.; Wilkie, G. Characterization of Mechanical Damage Through Use of the Tri-Axial Magnetic Flux Leakage Technology. In Proceedings of the 2006 6th International Pipeline Conference, IPC2006-10454, Calgary, AB, Canada, 25–29 September 2006. [Google Scholar]
  33. Azizzadeh, T.; Safizadeh, M.S. Identification and Sizing of Neighboring Pits Using Three-Axis Magnetic Flux Leakage Technique. J. Test. Eval. 2019, 49, 1837–1852. [Google Scholar] [CrossRef]
  34. Pham, H.Q.; Trinh, Q.T.; Doan, D.T.; Tran, Q.H. Importance of magnetizing field on magnetic flux leakage signal of defects. IEEE Trans. Magn. 2018, 54, 1–6. [Google Scholar] [CrossRef]
  35. Song, Q.; Ding, W.; Peng, H.; Shuai, J.; Wang, B. A new magnetic testing technology based on magnetic gradient tensor theory. Insight Non-Destr. Test. Cond. Monit. 2017, 59, 325–329. [Google Scholar] [CrossRef]
  36. Azizzadeh, T.; Safizadeh, M.S. Estimation of the diameters, depths and separation distances of the closely-spaced pitting defects using combination of three axial MFL components. Measurement 2019, 138, 341–349. [Google Scholar] [CrossRef]
  37. Peng, X.; Zhang, C.; Anyaoha, U.; Siggers, K.; Liu, Z. Parameterizing Magnetic Flux Leakage Data for Pipeline Corrosion Defect Retrieval. In Proceedings of the 2019 IEEE 28th International Symposium on Industrial Electronics (ISIE), Vancouver, BC, Canada, 12–14 June 2019; IEEE: New York, NY, USA, 2019; pp. 2665–2670. [Google Scholar]
  38. Chen, J. Three-axial MFL inspection in pipelines for defect imaging using a hybrid inversion procedure. Insight Non-Destr. Test. Cond. Monit. 2016, 58, 302–307. [Google Scholar] [CrossRef]
  39. Nikolova, N.K.; Cronin, D.; Pasha, S.M.; Amineh, R.K.; Smith, I.; Thompson, R.; Hare, J.R. Electric Resistance Welded Seam Inspection Using Circumferential Flux. In Proceedings of the 2008 7th International Pipeline Conference, IPC2008-64376, Calgary, AB, Canada, 29 September–3 October 2008. [Google Scholar]
  40. Ireland, R.C.; Torres, C.R. Challenges in Circumferential Magnetisation II: A FEA Point of View. In Proceedings of the 2006 6th International Pipeline Conference, IPC2006-10093, Calgary, AB, Canada, 25–29 September 2006. [Google Scholar]
  41. Willems, H. Advanced Ultrasonic In-Line Inspection for the Assessment of Pipelines Affected by Pitting and Pinhole Corrosion. In Proceedings of the ASME 2017 India Oil and Gas Pipeline Conference, Mumbai, India, 20–22 April 2017; American Society of Mechanical Engineers Digital Collection: New York, NY, USA, 2017. [Google Scholar]
  42. Sha, S.; Xiang, X.; Wu, X.; Wang, Q.; Feng, Q.; Zhao, G.; Zhang, H. Signal identification technology of oil transmission pipeline girth weld based on Ultrasonic ILI. Oil Gas Storage Transp. 2018, 37, 022053. [Google Scholar]
  43. Peter, T.; Wang, X.J. A new method based on ultrasonic guided wave inspection and matching pursuit for evaluating the axial severity of pipeline defect. In Proceedings of the Meetings on Acoustics 2014, Indianapolis, IN, USA, 27–31 October 2014; Volume 15, pp. 1–6. [Google Scholar]
  44. Slaughter, M.; Huss, M.; Zakharov, Y. A pipeline inspection case study: Design improvements on a new generation ut in-line inspection crack tool. Pipeline Gas J. 2013, 240, 100–101. [Google Scholar]
  45. Steinhubl, S.M.; Mann, D.R. Engineering and ultrasonic tool run in a natural gas pipeline to detect SCC. In Proceedings of the 2006 6th International Pipeline Conference, IPC2008-64510, Calgary, AB, Canada, 29 September–3 October 2008; Volume 7, pp. 100–103. [Google Scholar]
  46. Miao, C.; Guo, W.; Du, X.; Ling, Z. Ultrasonic Inspection Technique for Inside Pressurized Pipeline Elbows. In Proceedings of the ASME 2017 Pressure Vessels and Piping Conference, Waikoloa, HI, USA, 16–20 July 2017; American Society of Mechanical Engineers Digital Collection: New York, NY, USA, 2017. [Google Scholar]
  47. Sampath, S.; Bhattacharya, B.; Aryan, P.; Sohn, H. A Real-Time, Non-Contact Method for In-Line Inspection of Oil and Gas Pipelines Using Optical Sensor Array. Sensors 2019, 19, 3615. [Google Scholar] [CrossRef]
  48. Amaya-Gomez, R.; Sánchez-Silva, M.; Muñoz, F. Pattern recognition techniques implementation on data from In-Line Inspection (ILI). J. Loss Prev. Process Ind. 2016, 44, 735–747. [Google Scholar] [CrossRef]
  49. Ren, B.; Xin, J. In-line inspection of unpiggable buried live gas pipelines using circumferential EMAT guided waves. AIP Conf. Proc. 2018, 1949, 020019. [Google Scholar]
  50. Palmer, M.; Davies, C.; Ginten, M.; Palmer-Jones, R. Detection of Crack Initiation Based on Repeat In-Line Inspection. In Proceedings of the 2016 11th International Pipeline Conference, Calgary, AB, Canada, 26–30 September 2016; American Society of Mechanical Engineers Digital Collection: New York, NY, USA, 2016. [Google Scholar]
  51. Huang, S.; Ye, C.; Wang, K.; Zhao, W. and Dong, J. Development of Oil and Gas Pipeline Crack Detector Based on EMAT. Nondestruct. Test. 2009, 31, 827–829. [Google Scholar]
  52. Li, Z. Development and Application of Electromagnetic Ultrasonic (EMAT) Technology. NDT 2006, 30, 13–14. [Google Scholar]
  53. Hilvert, M.; Beuker, T. High-Resolution EMAT as a Diagnostic Tool for Analysis of SCC and Crack-Like Pipelines Defects. In Proceedings of the 2015 India International Oil and Gas Pipeline Conference, IOGPC2015-7940, New Delhi, India, 17–18 April 2015. [Google Scholar]
  54. Kania, R.; Weber, R.; Klein, S. Investigation and Assessment of Low-Frequency ERW Seam Imperfections by EMAT and CMFL ILI. In Proceedings of the 2014 10th International Pipeline Conference, IPC2014-33294, Calgary, AB, Canada, 29 September–3 October 2014. [Google Scholar]
  55. García-Gómez, J.; Gil-Pita, R.; Rosa-Zurera, M.; Romero-Camacho, A.; Jiménez-Garrido, J.A.; García-Benavides, V. Smart sound processing for defect sizing in pipelines using EMAT actuator based multi-frequency lamb waves. Sensors 2018, 18, 802. [Google Scholar] [CrossRef] [PubMed]
  56. Piao, G.; Guo, J.; Hu, T.; Deng, Y.; Leung, H. A novel pulsed eddy current method for high-speed pipeline inline inspection. Sens. Actuators A Phys. 2019, 295, 244–258. [Google Scholar] [CrossRef]
  57. Camerini, C.; Rebello, J.M.A.; Braga, L.; Santos, R.; Chady, T.; Psuj, G.; Pereira, G. Eddy Current System for Complex Geometry Inspection in High Speed Application. Bad. Nieniszcz. Diagn. 2018, 2, 6–10. [Google Scholar]
  58. Camerini, C.; Rebello, J.M.A.; Braga, L.; Santos, R.; Chady, T.; Psuj, G.; Pereira, G. In-Line Inspection Tool with Eddy Current Instrumentation for Fatigue Crack Detection. Sensors 2018, 18, 2161. [Google Scholar] [CrossRef]
  59. Piao, G.; Guo, J.; Hu, T.; Deng, Y. High-Speed Inspection Method Fusing Pulsed Eddy Current and Magnetic Flux Leakage. In Proceedings of the 2019 IEEE International Instrumentation and Measurement Technology Conference (I2MTC), Auckland, New Zealand, 20–23 May 2019; IEEE: New York, NY, USA, 2019; pp. 1–6. [Google Scholar]
  60. Song, H.; Yang, L.; Liu, G.; Tian, G.; Ona, D.; Song, Y.; Li, S. Comparative Analysis of In-line Inspection Equipments and Technologies. IOP Conf. Ser. Mater. Sci. Eng. 2018, 382, 032021. [Google Scholar] [CrossRef]
  61. Xie, L.; Gao, B.; Yun Tian, G.; Xiao, X.; Wu, S.; Yin, Y.; Mao, D. Investigation of Remote Field Eddy Current Defect Detection for Pipeline Welds. In Proceedings of the 2018 IEEE Far East NDT New Technology & Application Forum (FENDT), Xiamen, China, 6–8 July 2018; IEEE: New York, NY, USA, 2018; pp. 137–141. [Google Scholar]
  62. Kosasih, A.S.; Bakri, F.; Sujatmiko, M. Low Cost-Low Risk Intelligent Pig: Sharing Experience of Running Eddy Current Pig for Subsea Pipeline Inspection. In Proceedings of the Indonesian Petroleum Association, Jakarta, Indonesia, 4–6 September 2019. [Google Scholar]
  63. Xue, Z.; Fan, M.; Cao, B.; Wen, D. A fast numerical method for the analytical model of pulsed eddy current for pipelines. Insight Non-Destr. Test. Cond. Monit. 2020, 62, 27–33. [Google Scholar] [CrossRef]
  64. Li, R.; Zhang, L.; Zhang, X.L. Long-term Strain and Displacement Monitoring of Long-distance Oil-gas Pipeline. China Pet. Mach. 2016, 44, 118–122. [Google Scholar]
  65. Li, R.; Liu, H.Z.; Cheng, P.C. Bending strain and displacement monitoring method for pipelines in permafrost zones. Oil Gas Storage Transp. 2017, 36, 393–408. [Google Scholar]
  66. Li, R.; Cai, M.; Shi, Y.; Feng, Q.; Liu, S.; Zhao, X. Pipeline bending strain measurement and compensation technology based on wavelet neural network. J. Sens. 2016, 2016, 8363242. [Google Scholar] [CrossRef]
  67. Liu, S.; Zheng, D.; Dai, M.; Chen, P. A Compensation Method for Spiral Error of Pipeline Bending Strain In-Line Inspection. J. Test. Eval. 2018, 47, 3372–3386. [Google Scholar] [CrossRef]
  68. Liu, S.; Zheng, D.; Wang, T.; Dai, M.; Li, R.; Feng, Q. A novel algorithm for pipeline displacement and bending strain of in-line inspection based on inertia measurement technology. Adv. Mech. Eng. 2018, 10, 1687814018816755. [Google Scholar] [CrossRef]
  69. Feng, Q.; Li, R.; Zhang, H. Modeling and calculation of dent based on pipeline bending strain. J. Sens. 2016, 2016, 8126214. [Google Scholar] [CrossRef]
  70. Liu, S.; Zheng, D.; Li, R. Compensation Method for Pipeline Centerline Measurement of in-Line Inspection during Odometer Slips Based on Multi-Sensor Fusion and LSTM Network. Sensors 2019, 19, 3740. [Google Scholar] [CrossRef] [PubMed]
  71. Li, R.; Cai, M.; Shi, Y.; Feng, Q.; Chen, P. Technologies and application of pipeline centerline and bending strain of In-line inspection based on inertial navigation. Trans. Inst. Meas. Control 2018, 40, 1554–1567. [Google Scholar] [CrossRef]
  72. Ameh, E.S.; Lawal, L.S. Dent and gouge defects assessment: A case study of gas pipeline. Eur. J. Eng. Technol. 2018, 6, 26–35. [Google Scholar]
  73. Westwood, S.; Jungwirth, D.; Nickle, R.; Dewar, D.; Martens, M. In Line Inspection of Geotechnical Hazards. In Proceedings of the 2014 10th International Pipeline Conference, Calgary, AB, Canada, 29 September–3 October 2014; American Society of Mechanical Engineers Digital Collection: New York, NY, USA, 2014. [Google Scholar]
  74. Wang, R.Y.; Kania, R.; Arumugam, U.; Gao, M. A Combined Approach to Characterization of Dent with Metal Loss. In Proceedings of the 2012 9th International Pipeline Conference, Calgary, AB, Canada, 24–28 September 2012; American Society of Mechanical Engineers Digital Collection: New York, NY, USA, 2012; pp. 209–216. [Google Scholar]
  75. Warman, D.J.; Johnston, D.; Mackenzie, J.D.; Rapp, S.; Travers, B. Management of pipeline dents and mechanical damage in gas pipelines. In Proceedings of the 2006 International Pipeline Conference, Calgary, AB, Canada, 25–29 September 2006; American Society of Mechanical Engineers Digital Collection: New York, NY, USA, 2006; pp. 551–560. [Google Scholar]
  76. Kishawy, H.A.; Gabbar, H.A. Review of pipeline integrity management practices. Int. J. Press. Vessels Pip. 2010, 87, 373–380. [Google Scholar] [CrossRef]
  77. Segall, S.M.; Reid, R.G.; Gummow, R. Use of an Integrated CIPS/DCVG Survey in the ECDA Process. In Proceedings of the NACE International. Corrosion 2006, San Diego, CA, USA, 12–16 March 2006; pp. 12–16. [Google Scholar]
  78. Lin, R.; Li, H. Combinational Application of ACVG and CIPS to Anti-Corrosion Assessment of Buried Pipeline. Corros. Prot. 2010, 6, 475–477. [Google Scholar]
  79. Shawki, S. Above ground coating integrity assessment: Experience with SUMED pipelines. In Integrity of Pipelines Transporting Hydrocarbons; Springer: Berlin/Heidelberg, Germany, 2011; pp. 311–322. [Google Scholar]
  80. Yu, K. Making use of external corrosion defect assessment (ECDA) data to predict DCVG% IR drop and coating defect area. Mater. Corros. 2018, 69, 1237–1256. [Google Scholar] [CrossRef]
  81. Yu, J.; Zhang, P.; He, S.; Wang, W. PCM inspection technology study for external anticorrosive coatings of oil and gas pipelines. China Meas. Test. Technol. 2008, 7, 1–3. [Google Scholar]
  82. He, H. Analysis on Influence Factors of PCM and ACVG Coating Detection Technology. Gas Heat 2016, 36, 5. [Google Scholar]
  83. Liu, Z.; Zhang, P.; Peng, X.; Sun, D. PCM Technology Application to the Lan-Cheng-Yu Oil Pipeline. Pipeline Tech. Equip. 2009, 5, 47–48. [Google Scholar]
  84. Teng, Y.; Han, S.; Jiang, G.; Cai, P.; Kong, C. Application of PCM on Buried Steel Pipelines. Pipeline Tech. Equip. 2010, 4, 18–20. [Google Scholar]
  85. Qiu, H.Y.; Yang, X. The Application of PCM Measurement Technique in Gas Pipeline Anticorrosive Coating. Total Corros. Control. 2009, 23, 1–13. [Google Scholar]
  86. Luo, H.; Zhang, Z.; Sun, F. Inspection and analysis of anticorrosion coatings of surface transport pipeline in Changqing gas field. Chem. Eng. Oil Gas 2012, 41, 325–326. [Google Scholar]
  87. Wu, C.; Li, R.; Xue, Z.; Liu, L. The Cathodic Protection System Testing and Evaluation of Renqiu Pipeline Station. In Proceedings of the ICPTT 2009: Advances and Experiences with Pipelines and Trenchless Technology for Water, Sewer, Gas, and Oil Applications, Shanghai, China, 18–21 October 2009; pp. 1689–1693. [Google Scholar]
  88. Bo, G.; Yu, Y. PCM System for Testing the Protection Coating of Buried Pipelines. Petrochem. Corros. Prot. 2001, 4. [Google Scholar]
  89. Huang, J.; Que, P. The Application of Wavelet Analysis in Ultrasonic Testing of Pipeline Defect. J. Transcluction Technol. 2003, 3, 130–132. [Google Scholar]
  90. Ryou, Y.D.; Lee, J.H.; Jung, S.W.; Park, K.W. A Study on the Development and the Verification Experiment of ECDA Equipment. J. Korean Inst. Gas 2016, 20, 72–81. [Google Scholar] [CrossRef]
  91. Abels, T.; Bich, N. ICDA Case Study: 43 Year Old Sour Gas Pipeline. In Proceedings of the 2006 International Pipeline Conference, Calgary, AB, Canada, 25–29 September 2006; American Society of Mechanical Engineers Digital Collection: New York, NY, USA, 2006; pp. 597–611. [Google Scholar]
  92. Alobaidi, W.M.; Alkuam, E.A.; Al-Rizzo, H.M.; Sandgren, E. Applications of ultrasonic techniques in oil and gas pipeline industries: A review. Am. J. Oper. Res. 2015, 5, 274. [Google Scholar] [CrossRef]
  93. Su, J.; Long, Y. Status quo of External Inspection Technique for Pipeline Wall Thickness and Defects. Oil Gas Storage Transp. 2009, 28, 56–58. [Google Scholar]
  94. Moles, M.; Ginzel, E. Pipeline girth weld inspections using ultrasonic phased arrays. In Proceedings of the 2002 4th International Pipeline Conference, Calgary, AB, Canada, 29 September–3 October 2002; American Society of Mechanical Engineers Digital Collection: New York, NY, USA, 2002; pp. 629–636. [Google Scholar]
  95. Wang, Z.; Cao, Q.; Luan, N.; Zhang, L. Development of new pipeline maintenance system for repairing early-built offshore oil pipelines. In Proceedings of the 2008 IEEE International Conference on Industrial Technology, Chengdu, China, 21–24 April 2008; IEEE: New York, NY, USA, 2008; pp. 1–6. [Google Scholar]
  96. Willems, H.H.; Barbian, O.A.; Uzelac, N.I. Internal Inspection Device for Detection of Longitudinal Cracks in Oil and Gas Pipelines: Results from an Operational Experience. In Proceedings of the 1996 1st International Pipeline Conference, Calgary, AB, Canada, 9–13 June 1996; American Society of Mechanical Engineers Digital Collection: New York, NY, USA, 1996; pp. 345–352. [Google Scholar]
  97. Dobmann, G.; Barbian, O.A.; Willems, H. State of the art of in-line nondestructive weld inspection of pipelines by ultrasonics. Russ. J. Nondestruct. Test. 2007, 43, 755–761. [Google Scholar] [CrossRef]
  98. Zhang, H.; Cao, Z. Applications of Finish Construction Surveying to Underground Pipelines by RIS-K2 Ground Penetrating Radar. Chin. J. Eng. Geophys. 2007, 4, 395–399. [Google Scholar]
  99. Ashworth, B.; Uzelac, N.; Willems, H.; Barbian, O.A. Detection and Verification of SCC in a Gas Transmission Pipeline. In Proceedings of the 2000 3rd International Pipeline Conference, Calgary, AB, Canada, 1–5 October 2000; American Society of Mechanical Engineers Digital Collection: New York, NY, USA, 2000. [Google Scholar]
  100. Vargas-Arista, B.; Balvantin, A.; Baltazar, A.; García-Vázquez, F. On the use of ultrasonic spectral analysis for the characterization of artificially degraded API 5L X52 steel pipeline welded joints. Mater. Sci. Eng. A 2012, 550, 227–234. [Google Scholar] [CrossRef]
  101. Palmer, J.D. Soil resistivity-measurement and analysis. Mater. Prot. Perform. 1974, 13, 41–46. [Google Scholar]
  102. Cosentino, P.F.; Rio, S.N. Electromagnetic Ground Conductivity Survey Technique in pipeline Integrity.
  103. Marušić, K.; Kekez, K.; Martinez, S. Comparison of soil properties measurements in pipeline corrosion estimation. Mater. Corros. 2019, 70, 1700–1707. [Google Scholar] [CrossRef]
  104. Wilmott, M.J.; Jack, T.R.; Geerligs, J.; Dupuis, B.; Sutherby, R.L.; Diakow, D. Soil probe measures several properties to predict corrosion. Oil Gas J. 1995, 93, 28038. [Google Scholar]
  105. Shamsuri, S.R. The Effect of Soil Resistivity on Corrosion Behaviour of Coated and Uncoated Low Carbon Steel. Master’s Thesis, Universiti Teknologi Malaysia, Johor Bahru, Malaysia, 2010. [Google Scholar]
  106. Sawma, E.; Zeitoun, B.; Harmouche, N.; Georges, S.; Hamad, M.; Slaoui, F.H. Electromagnetic induction in pipelines due to overhead high voltage power lines. In Proceedings of the 2010 International Conference on Power System Technology, Zhejiang, China, 24–28 October 2010; IEEE: New York, NY, USA, 2010; pp. 1–6. [Google Scholar]
  107. Scott, G.N. Process and Means for Measuring Soil Resistivity and Certain Electrical Characteristics Associated with a Buried Pipeline Line. U.S. Patent 2,378,440, 19 June 1945. [Google Scholar]
  108. Ayako, Y.; Wang, H.; Liang, R.Y.; Castaneda, H. A clustering based method to evaluate soil corrosivity for pipeline external integrity management. Int. J. Press. Vessels Pip. 2015, 126, 37–47. [Google Scholar]
  109. Osella, A.; Favetto, A. Effects of soil resistivity on currents induced on pipelines. J. Appl. Geophys. 2000, 44, 303–312. [Google Scholar] [CrossRef]
  110. Liu, D.R.; Wang, P.F.; Wang, X.; Hu, Y. The mechanism of pipe-trench thaw collapse of buried oil and gas pipelines in permafrost regions. Oil Gas Storage Transp. 2019, 38, 788–792. [Google Scholar]
  111. Hu, Y.; Xu, Z.; Wang, P.F.; Wang, X.; Shi, R.; Zhao, J.; Zhang, D. Field monitoring for frost heaving and thawing-settlement of soil around gas pipelines in permafrost region. J. Eng. Geol. 2018, 26, 1035–1042. [Google Scholar]
  112. Jin, H.; Yu, W.; Chen, Y.; Gao, X.; Li, F.; Yao, Z. (Differential) Frost heave and thaw settlement in the engineering design and construction of oil pipelines in permafrost regions: A review. J. Glaciol. Geocryol. 2005, 27, 454–464. [Google Scholar]
  113. Lyu, L.Z.; Jin, H.J.; Chang, X.L. Interannual variations of the air temperature, surface temperature and shallow ground temperature along the China-Russia crude oil pipeline. J. Glaciol. Geocryol. 2010, 32, 794–802. [Google Scholar]
  114. Zhang, S.; Wang, X.; Sha, S.; Zhang, A.G.; Wu, G.S.; Ma, Y.B.; Wang, Q. Monitoring of frost heaving and thaw settlement of Mohe-Daqing Crude Oil Pipeline. Oil Gas Storage Transp. 2014, 33, 488–491. [Google Scholar]
  115. Jing, H.; Ma, Y.; Han, B.; Li, L.; Tan, D.; Feng, Q.; Chen, P.; Wu, Z.; Hao, J.; Liu, J. Automatic Monitoring Method and System for Vertical Displacement of Oil and Gas Pipeline in Frozen Soil Area: Beijing. CN 2011104554614, 16 October 2013. [Google Scholar]
  116. Qian, Z. Numerical Simulation and Application of Soil Temperature Field around Buried Thermal Pipeline; Xi’an Shiyou University: Xi’an, China, 2017; pp. 15–19. [Google Scholar]
  117. Gao, S.H.; Jin, H.J.; He, R.X. Influence factors on the groundtemperature recovery process of an open-pit coal mine backfillin the permafrost area of northeastern China. Hydrogeol. Eng. Geol. 2017, 44, 137–143. [Google Scholar]
  118. Lyu, H.Q.; Li, J.F.; Tang, Y.L. Several key technical issues of permafrost pipeline. Nat. Gas Oil 2009, 27, 1–4. [Google Scholar]
  119. Dai, H.Y.; Chen, S.H.; Wu, Y.J. Analysis of the warm andcool season’s climate variations in the ecological function sites inthe Great Khingan, Inner Mongolia. J. Glaciol. Geocryol. 2016, 38, 645–652. [Google Scholar]
  120. Wang, Y.P. Formation Mechanisms and Mitigative Measures for Frost Hazards of Foundation Soils in Permafrost Areas along the China-Russia Crude Oil Pipeline Route; Cold and Arid Regions Environmental and Engineering Research Institute: Lanzhou, China; Chinese Academy of Sciences: Beijing, China, 2016; pp. 1–13. [Google Scholar]
  121. Ma, Y.B.; Hu, Z.X.; Yang, J. Oil pipeline security monitoring system based on fiber Bragg grating sensor. J. Appl. Opt. 2009, 30, 505–509. [Google Scholar]
  122. Zhang, Y.; Chen, L.; Kang, R.; Li, J. Fiber bragg grating sensing technology in landside monitoring. Opt. Commun. Technol. 2010, 2, 39–41. [Google Scholar]
  123. Chen, L. Fiber Bragg Grating Sensing Technology in Landside Monitoring; Yan Shan University: Qin Huangdao, China, 2010; pp. 7–12. [Google Scholar]
  124. Jiang, T. Pipeline Leakage Monitoring Research Based on Fiber Bragg Grating Sensing Technology; Dalian University of Technology: Dalian, China, 2013; pp. 19–20. [Google Scholar]
  125. Lin, L.; Chen, W.M.; Zhang, P.; Xie, Y.Y. Distributed optic fiber sensor with a sub-ring. Acta Photonica Sin. 2009, 38, 1118–1121. [Google Scholar]
  126. Zhang, Z.W. Design of Sagnac Optic-Fiber Pipeline Prealarm System; Tianjin University: Tianjin, China, 2010; pp. 7–13. [Google Scholar]
  127. Xu, X.; Shuai, J.; Xiao, W. The Installation Method of Strain Gage Used to Monitor Pipeline Strain in Landslide-prone Areas. Oil Gas Storage Transp. 2010, 29, 780–782. [Google Scholar]
  128. Du, J.; Chen, C.; Jian, W. Stress-strain Monitoring Technique for Relaying Pipe Section over Lanzhou-Chengdu-Chongqing Oil Product Pipeline. Oil Gas Storage Transp. 2009, 28, 69–71. [Google Scholar]
  129. Wang, X.; Liu, X.; Wang, B.; Tian, S.; Lin, C.; Sha, S.; Wang, B. PCP Company GPR technology for Mohe-Daqing Crude Oil Pipeline. Oil Gas Storage Transp. 2014, 33, 829–833. [Google Scholar]
  130. Wu, X.-P.; Wei, Y.L.; Zhang, J.P. Study on the application effect of ground-penetrating radar in permafrost engineering geological investigation. China Earthq. Eng. J. 2013, 35, 23–25. [Google Scholar]
  131. Fan, Z.; Zhang, L.; Lu, X. Application study on ground penetrating radar for highway engineering exploration in permafrost region. Geotech. Investig. Surv. 2010, 38, 46–50. [Google Scholar]
  132. Bing, B.; Jian, Z. Advanced and Applications of ground penetrating radar measuring technology. Chin. J. Rock Mech. Eng. 2001, 20, 26–30. [Google Scholar]
  133. Chen, L.; Yu, W.B.; Yi, X.; Wu, Y.; Ma, Y. Application of ground penetration radar to permafrost survey in Mohe County, Heilongjiang Province. J. Glaciol. Geocryol. 2015, 37, 723–730. [Google Scholar]
  134. Shi, Y.; Zhang, Q. Application of TDR technique in yaan xiakou landslide monitoring. Site Investig. Sci. Technol. 2005, 1, 55–57. [Google Scholar]
  135. Sun, J.; Li, S.; Liu, K.; Xu, M. Current status of security pre-warning technologies for oil and gas pipelines. Oil Gas Storage Transp. 2016, 35, 1023. [Google Scholar]
  136. Ma, Q.; Zhang, B. Theory and application of borehole inclinometer in slope monitoring. GuiZhou Sci. 2008, 26, 84–86. [Google Scholar]
  137. Wei, S.W. New technologies and development trends of geological disaster monitoring in linear engineering. Railw. Eng. 2019, 59, 57–63. [Google Scholar]
Figure 1. Principles of magnetic flux leakage in-line inspection.
Energies 16 01751 g001
Figure 2. Principles of ultrasonic inspection: (a) principles of ultrasonic inspection for corrosion; (b) principles of ultrasonic inspection for cracking.
Energies 16 01751 g002
Figure 3. Principles of EMAT inspection.
Energies 16 01751 g003
Figure 4. Principles of electromagnetic eddy current inspection.
Energies 16 01751 g004
Figure 5. IMU in-line inspection tool.
Energies 16 01751 g005
Figure 6. Formation of IMU module.
Energies 16 01751 g006
Figure 7. Multi-sensor data fusion of IMU inspection system.
Energies 16 01751 g007
Figure 8. Principles of DCVG measurement.
Energies 16 01751 g008
Figure 9. Principles of A-frame gauge for damage detection.
Energies 16 01751 g009
Figure 10. Principles of phased-array ultrasonic testing.
Energies 16 01751 g010
Figure 11. Schematic diagram of ultrasonic C-scan imaging.
Energies 16 01751 g011
Figure 12. Principles of displacement monitoring method.
Energies 16 01751 g012
Figure 13. Principles of measurement method.
Energies 16 01751 g013
Figure 14. Principles of monitoring method of automatic monitoring system.
Energies 16 01751 g014
Figure 15. Markers and benchmarks of pipeline-displacement monitoring system.
Energies 16 01751 g015
Figure 16. Site installation of temperature field monitoring system.
Energies 16 01751 g016
Figure 17. Layout plan of pipeline strain sensor.
Energies 16 01751 g017
Figure 18. Propagation principles of radar waves in ground medium.
Energies 16 01751 g018
Figure 19. Constitution and operating principle of inclinometer.
Energies 16 01751 g019
Figure 20. Illegal Hot Tapping in-line inspection tool.
Energies 16 01751 g020
Table 1. Inspection accuracy of axial magnetic flux leakage tool.
GeneralPittingAxial GroovingAxial Slotting
Depth at POD = 90%0.1 t0.12 t0.2 t±0.12 t
Depth sizing accuracy at 80% certainty±0.1 t±0.1 t±0.15 t±0.1 t
Length sizing accuracy at 80% certainty±15 mm±10 mm±10 mm±10 mm
Width sizing accuracy at 80% certainty±15 mm±12 mm±12 mm±12 mm
Abbreviations: POD—probability of detection; t—wall thickness.
Table 2. Inspection accuracy of circumferential magnetic flux leakage tool.
GeneralPittingAxial GroovingAxial Slotting
Depth at POD = 90%0.15 t0.15 t0.1 t±0.20 t
Depth sizing accuracy at 80% certainty±0.15 t±0.19 t±0.15 t±0.15 t
Length sizing accuracy at 80% certainty±15 mm±12 mm±15 mm±15 mm
Width sizing accuracy at 80% certainty±15 mm±15 mm±15 mm±15 mm
Abbreviations: POD—probability of detection; t—wall thickness.
Table 3. Inspection accuracy of EVO SERIES 1.0 UC inspection tool.
POD for Axial Cracks, Crack-Like Anomalies and Liner Indications ≥ 90%
Min. Depth of Crack with L ≥ 20 mm (0.79 in)
Base material and at weld1 mm0.04 in
In weld2 mm0.08 in
Depth sizing accuracy at 80% certainty
1…<4 mm (0.04…<0.16 in)±1 mm±0.04 in
≥4 mm (0.16 in)±1.3 mm±0.05 in
Length sizing accuracy at 90% certainty±10 mm±0.39 in
Location in pipeline wall
Internal/externalYesYes
Disclaimer/Publisher’s Note: The statements, opinions and data contained in all publications are solely those of the individual author(s) and contributor(s) and not of MDPI and/or the editor(s). MDPI and/or the editor(s) disclaim responsibility for any injury to people or property resulting from any ideas, methods, instructions or products referred to in the content.

