1. Introduction
The main driver of the current energy transition is the need to reduce global warming caused by the burning of fossil fuels and the associated emission of greenhouse gasses. In contrast to fossil fuels, emissions from renewable energy sources, such as wind or solar, are mainly linked to the materials and processes required to produce the conversion systems. Once installed, the emissions of these systems are only minimal, which reduces their global warming impact to only a fraction of that of systems burning fossil fuels [
1]. Airborne wind energy (AWE) systems are a radical redesign of conventional wind energy systems through the usage of tethered aircraft or kites [
2]. A key principle is the significant reduction of heavy structural components, such as the tower and large parts of the foundations of conventional systems, by replacing these with lightweight flying components and control algorithms [
3,
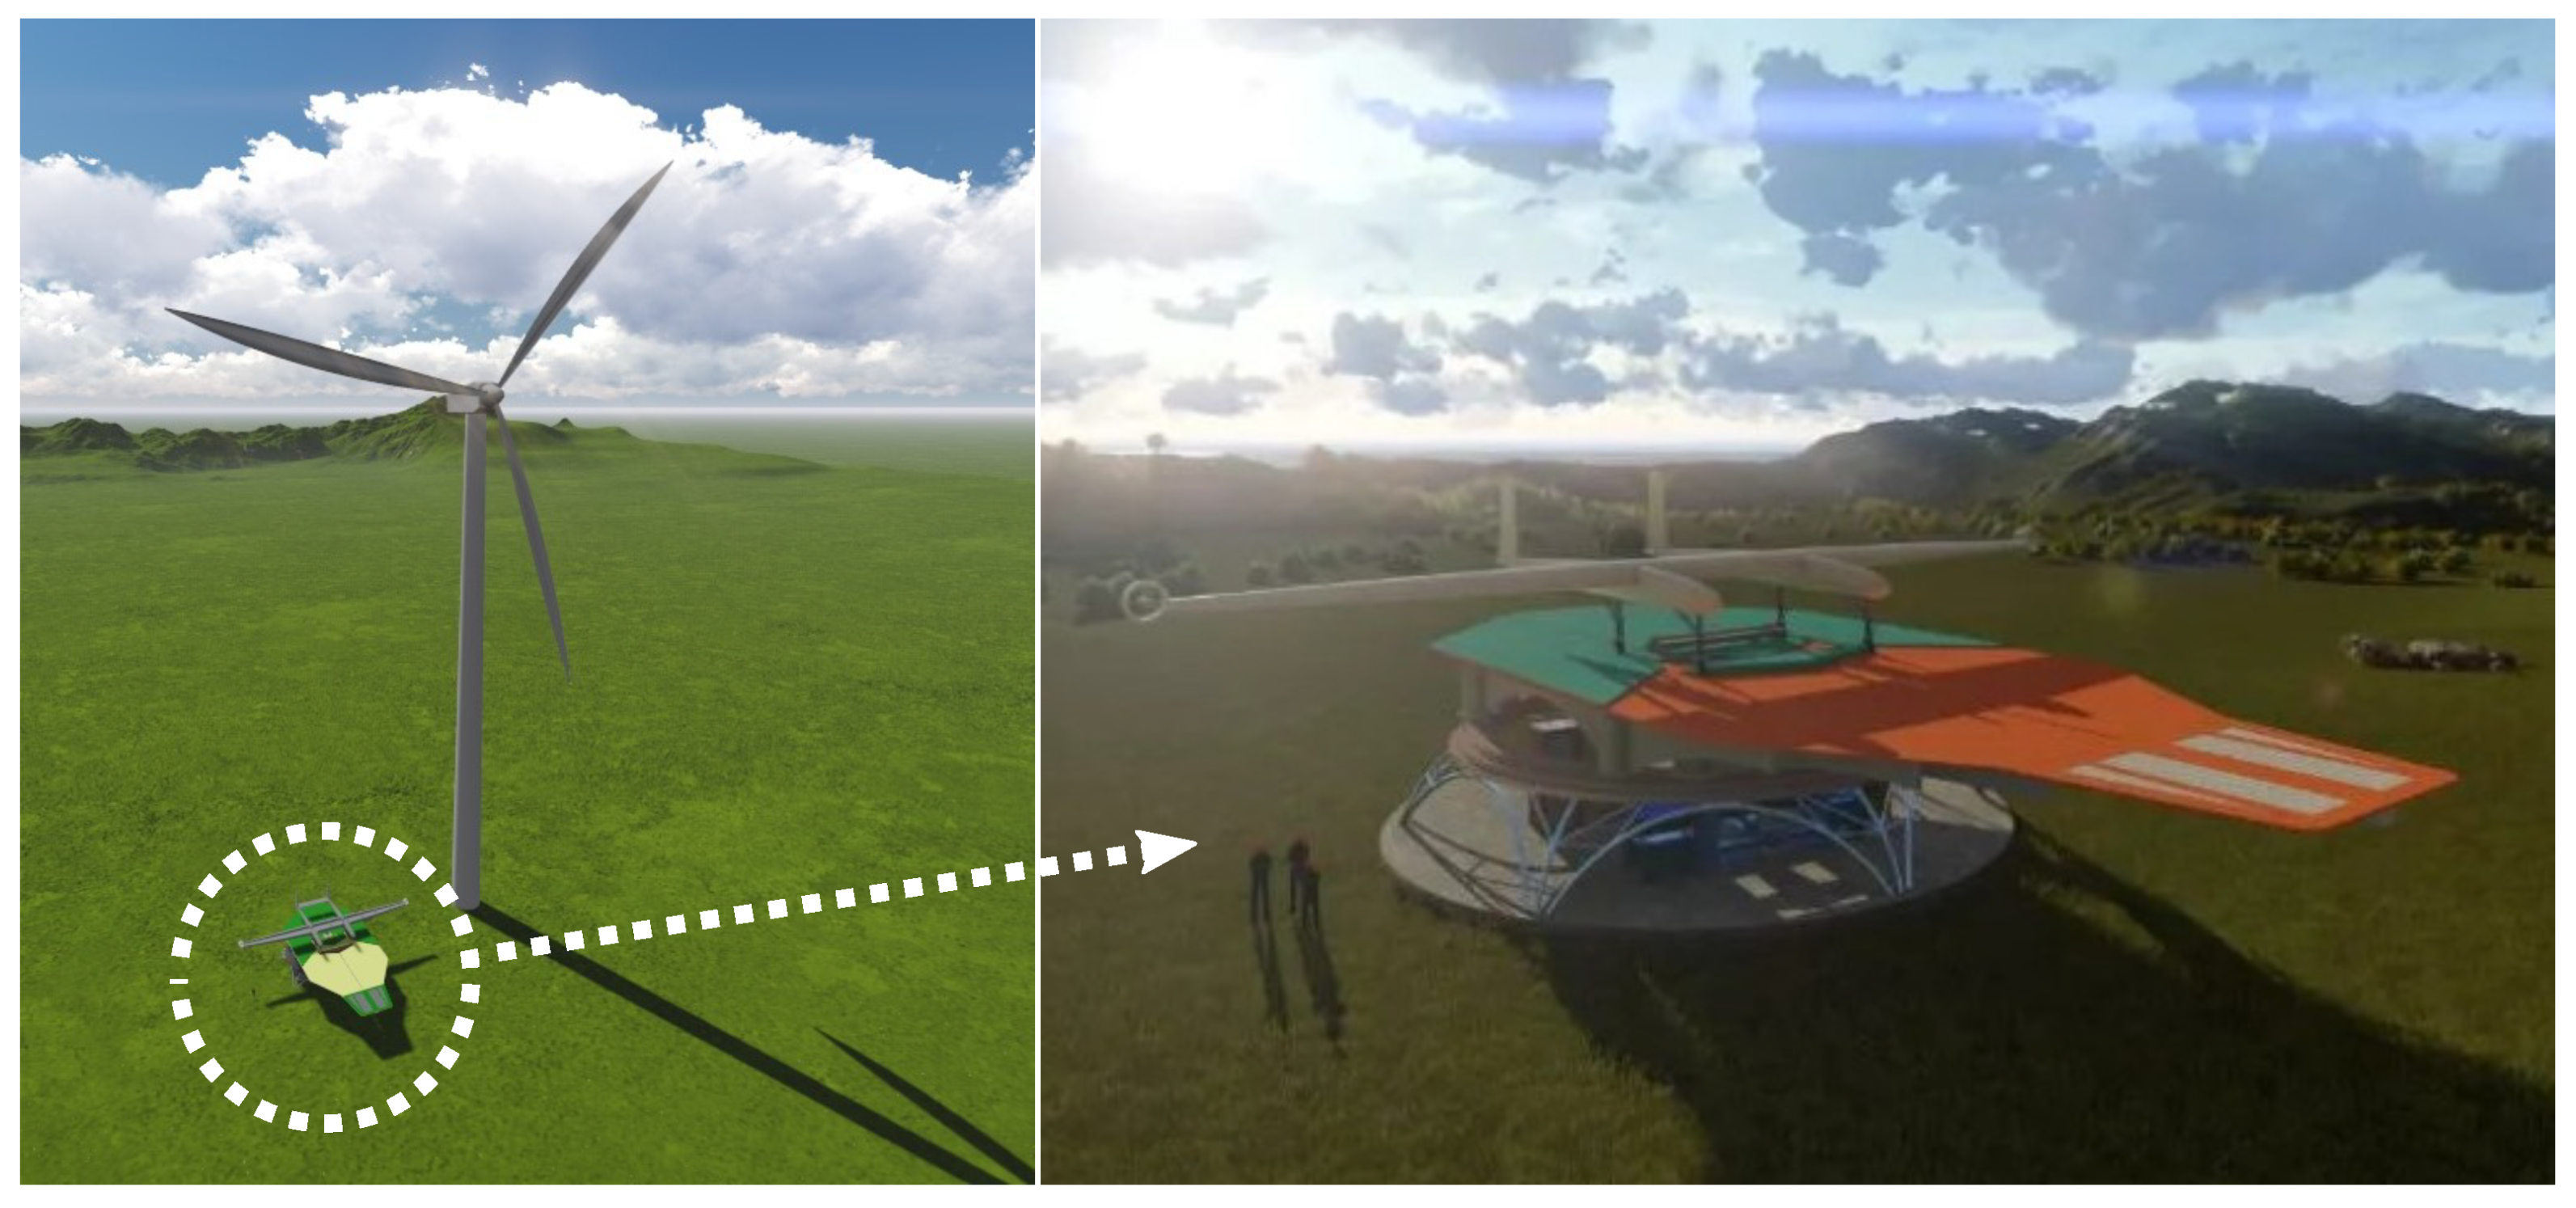
4]. This concept is illustrated in
Figure 1 with the example of the 2 MW Ampyx Power design of a future large-scale fixed-wing AWE system with a horizontal launch and land platform. During wind energy harvesting, the tethered aircraft is operated in pumping cycles with alternating traction and retraction phases [
5].
A reduction in mass does, however, not necessarily translate into a more sustainable product. The environmental impacts of the different materials and production processes can vary substantially. For example, the fibres in carbon-fibre-reinforced polymers (CFRPs) used for the AWE aircraft are currently 21 times more pollutive than the fibres in glass-fibre-reinforced polymers (GFRPs) used for wind turbine blades [
7]. Similarly, while the reinforcement bar only accounts for 5% of the mass of the designed foundation of the AWE system, it is responsible for more than half of all impacts of the materials in the foundation. To create the optimal sustainable energy generation system, sustainability must be included as a criterion early on in the design process.
The only published life-cycle assessment (LCA) of an AWE system known to the authors was conducted by the third author of the present study [
8,
9]. It was based on a design study before the one illustrated in
Figure 1, and it investigated a farm of 1.8 MW AWE systems. The study concluded that the farm emitted only 55% of the global warming potential (GWP) and cumulative energy demand (CED) impacts of the compared HAWT farm.
In the present study, the environmental impact of a potential farm of future 5 MW AWE systems was assessed and compared to that of a farm of conventional wind turbines. For this purpose, a standardised LCA was applied to both technologies to determine the GWP and CED. From these, the energy payback time (EPBT) and energy return on investment (EROI) were determined. As a result of the study, hot spots with high impacts were identified. Even though an LCA is a standardised method, the specific implementation can vary significantly depending on several factors, such as data availability and specific (boundary selection) choices. For that reason, LCA results are highly dependent on the scope and methods used. Accordingly, the results of different studies cannot be directly compared without additional investigations.
Because a comparison of AWE and HAWT technologies was considered a valuable contribution of the present study, implementations of both technologies were modelled in parallel from the ground up. The HAWT system was based primarily on specifications of the standardised NREL 5 MW turbine [
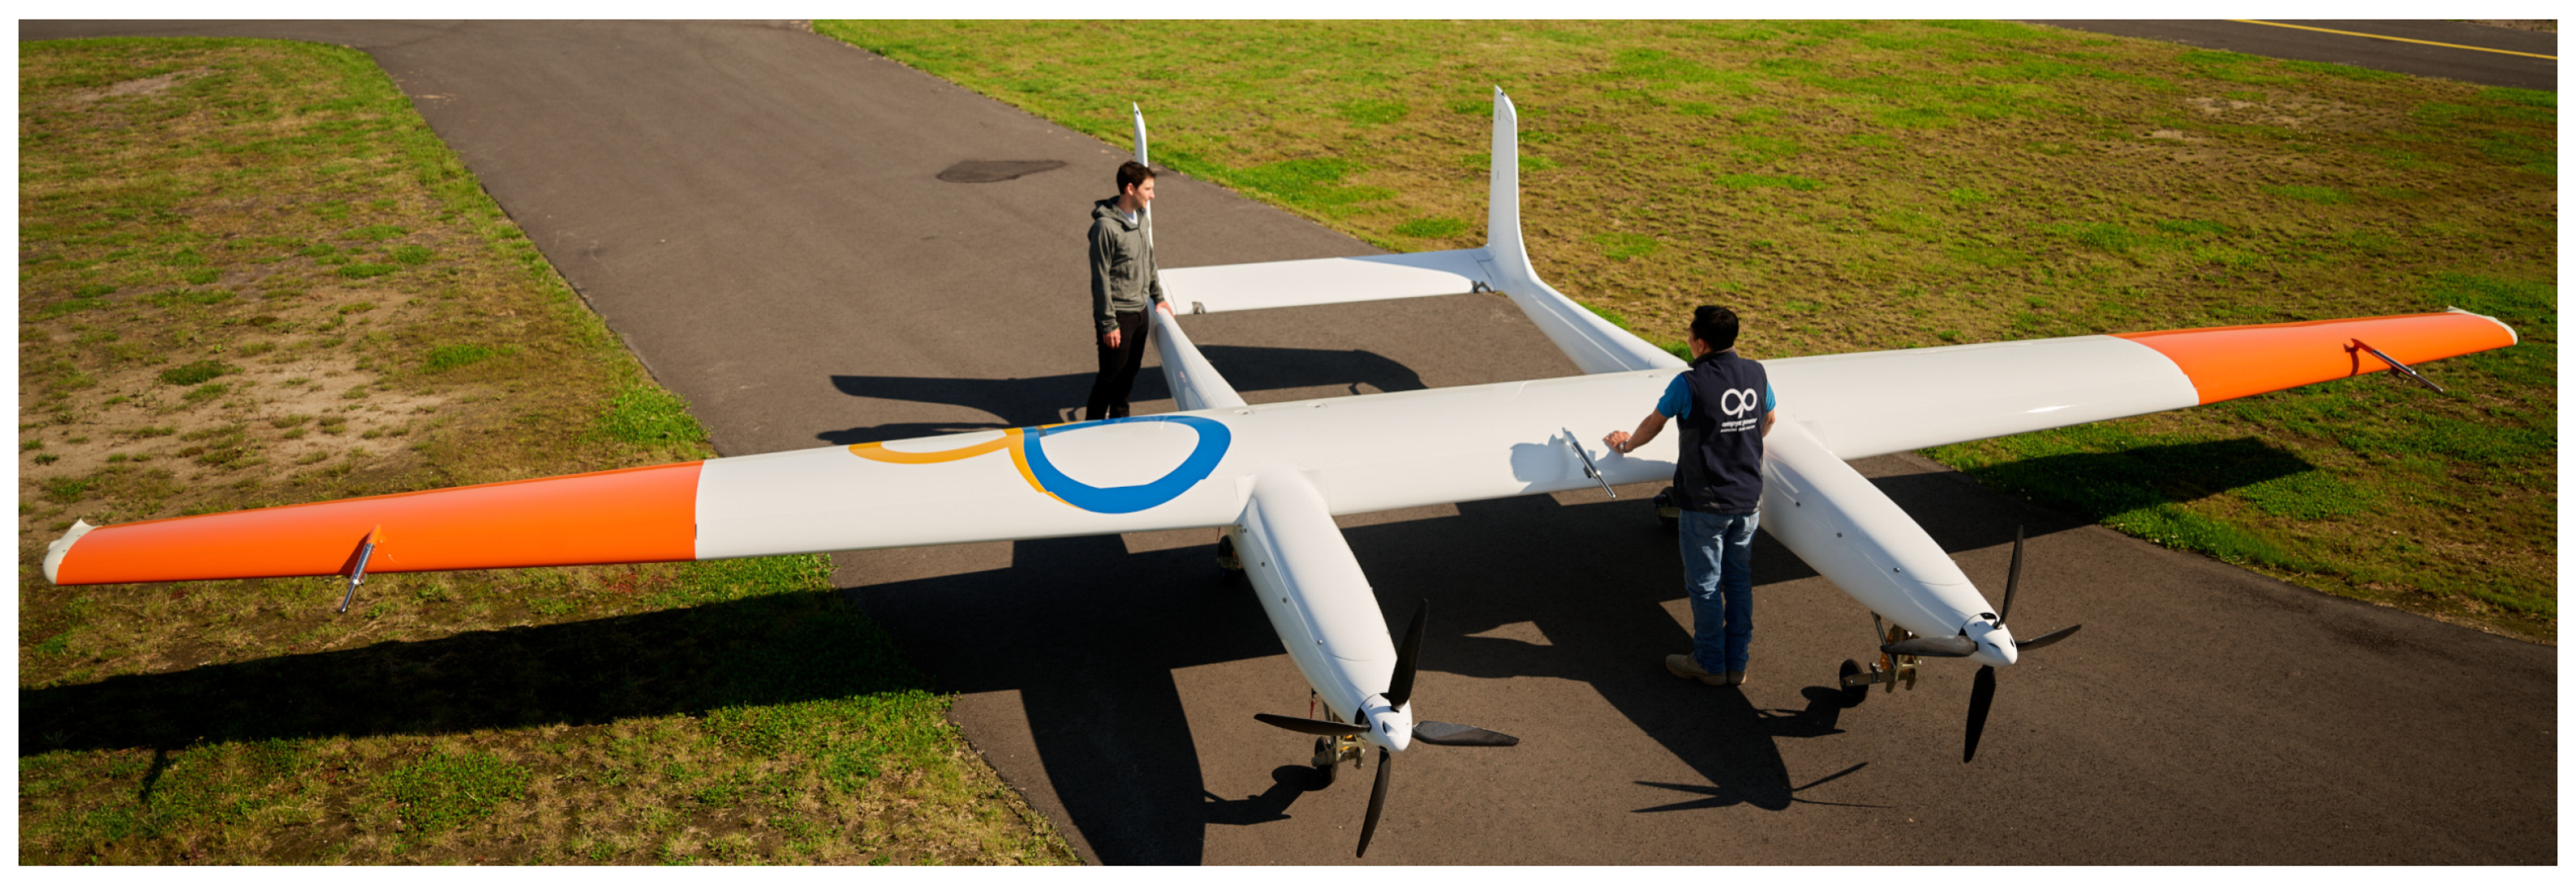
10]. An AWE system of that rated power did, however, not exist yet. Consequently, this system was designed based on the best available data from Ampyx Power at the time. The company had been testing the 0.15 MW system AP3, as depicted in
Figure 2. This prototype was primarily used to gain further knowledge to eventually build large systems for utility-scale operation [
5,
6]. The 1 MW commercial system was available only as a feasibility study by the end of the present LCA (Ampyx Power filed for insolvency in May 2022; part of the staff and the hardware, including the two built AP3 systems, were taken over by the newly established company Fuchszeug B.V. with the goal of demonstrating the flight operation of the concept [
11]).
In a parallel study, the power generation characteristics of a scaled-up 3 MW version of the Ampyx Power product line were investigated by using a dynamic modelling framework [
12,
13]. As a first approximation, the tractive power scales linearly with the wing surface area [
2], which renders the assessed future 5 MW system 33.3 times larger than the AP3 in terms of wing surface area. In reality, the proportionality is less than linear because of the square–cube law [
14]. A future design might, thus, differ significantly, requiring more aggressive weight savings and/or a larger wing surface area to achieve the targeted power output; see
Section 2.3 for more details. The comparative LCAs were performed for various deployment scenarios to assess the advantages and disadvantages of both technologies for operation at specific locations and under different environmental conditions.
This article is structured as follows. In
Section 2, the methodology, the boundary conditions, and the design details of the AWE system are described. In
Section 3, the results are presented and discussed; first, the mass composition resulting from the inventory stage is analysed, followed by the base-case environmental impact results obtained in the impact assessment stage and, finally, with various sensitivity studies. In
Section 4, the conclusions are drawn.
2. Methodology and Model Definition
An LCA is a standardised methodological approach to assessing and comparing the environmental impacts of products and services. The present study followed the ISO 14040 [
15] and ISO 14044 [
16] standards, which were primarily interpreted by using the handbook on Life Cycle Assessment, Theory and Practice [
17]. The present paper is a condensed derivative of the Master’s thesis of the first author [
18], which was undertaken in the frame of the Interreg North-West Europe MegaAWE project [
19] in collaboration with the project partners Airborne Wind Europe and Ampyx Power. More in-depth information, such as the detailed designs of the AWE and HAWT systems, more elaborate reasoning behind various assumptions, additional sources, and more detailed results, can be found in the original thesis [
18].
2.1. Methodology
An LCA is conducted in four distinct stages: (1) the definition of the goal and scope, (2) the life-cycle inventory (LCI), (3) the life-cycle impact assessment (LCIA), and (4) the interpretation. For the present study, the goal and scope were defined by an LCA practitioner (Delft University of Technology) in joint consultation with Airborne Wind Europe and Ampyx Power. The subsequent LCI and LCIA stages represented the actual data collection and modelling. In the final interpretation stage, the results were discussed and conclusions were drawn.
In the LCI stage, models for AWE and HAWT designs were defined down to the unit flows of materials and processes. The system boundaries included all life-cycle stages from raw materials up to and including the end of life. Assumptions were made for everything from transport methods and servicing frequencies to capacity factors and environmental conditions. Models of both systems were, thereby, built with assumptions based on sources from the literature, environmental product declarations, and expert consultations. The 5 MW AWE system was designed based on future concepts and past designs of Ampyx Power, accompanied by data from various well-known suppliers and wind turbine manufacturers, such as ABB, SKF, Liebherr, Bosch Rexroth, and Vestas.
Each material and process was assigned its own individual specific environmental impacts. The impacts of the complete systems were determined in the following LCIA stage by linking the materials and processes in the models to their specific impacts. The actual LCI and LCIA models were programmed in MS Excel and are available in open access from [
20]. The majority of the specific impacts were obtained from the EcoInvent database (V3.6) and extracted by using the SimaPro LCA software (version 9.2).
2.2. Scope and Assumptions
The 5 MW AWE and HAWT systems were assessed and compared according to their operation on 50 MW wind farms built at identical onshore locations. A schematic illustration of these farms and the boundaries used for the LCA is shown in
Figure 3. Differences in environmental conditions resulting from the different operating heights and available wind resources were taken into account when evaluating the performance of both technologies. Since an actual AWE system of multi-megawatt size was not available at the time when this study was performed and the HAWT was specifically designed for component-by-component comparison with this AWE system, the key challenges were the many design decisions and associated uncertainties. The systems were, therefore, first assessed for a base-case scenario, which was then complemented by sensitivity studies to assess the effects of design and scenario variables.
The high-level base-case specifications of the wind farms with fixed-wing ground-generation AWE systems and HAWTs are listed in
Table 1. The spacing of the AWE systems is a conservative estimate adapted from [
5]. It is expected that the surface area requirement can be significantly reduced by synchronising the control of multiple AWE systems operating in a wind farm [
21,
22]. A decisive feature of the AWE systems is the hydraulic drivetrain design.
Section 2.3 provides further details on key assumptions and design considerations.
The reference case wind speed was chosen as 10 m/s at the HAWT hub height of 117 m, which matches the environmental conditions for which the NREL 5 MW turbine was designed. The wind speed experienced by the AWE system at an average operating height of 250 m was estimated by using the common logarithmic law, with a surface roughness of
for onshore conditions [
23]. The capacity factor of the HAWT system was estimated based on the literature, while the capacity factor of the AWE system was provided by Ampyx Power based on simulation results.
2.2.1. Impact Categories
The impact categories chosen for the assessment were the GWP and the CED. The CED quantifies the amount of energy required as an input to the systems, which is subsequently also used to determine the EROI and the EPBT. The EROI specifies how many times the invested energy is returned as output. The EPBT quantifies the period of time that passes before the invested energy is fully recovered as output. The GWP was assessed using the CML (IA baseline EU25) method developed at the Institute for Environmental Sciences (CML) of Leiden University and the CED with the single-issue CED V1.11 method. The impacts of both systems were normalised to the functional unit of one MWh of electricity from wind delivered to the grid. This led to the units of kgCOeq/MWh for the GWP and MJ/MWh for the CED.
2.2.2. Boundaries
The cradle-to-grave condition was used as a boundary condition, which included the impacts from (1) materials and manufacturing, (2) installation, (3) operation and maintenance, and (4) end of life. The elements included within each of these four life-cycle stages are presented in
Table 2. The assessment was performed by using the cut-off method from SimaPro, which cuts off recycling at the end of life. The method does, therefore, not allocate the avoided impacts at the end of life to the assessed systems. Instead, it appoints credits for the fraction of recycled content in the original materials used.
As indicated in
Figure 3, the system boundaries included all components required to generate electricity and transport the energy up to but not including the grid connection. The farms were modelled without a transformer substation. The transmission voltage to the grid was, therefore, at the medium voltage of 33 kV. Additionally, no more than 1% of the mass, energy, or impact was knowingly excluded unless specifically stated. However, since this study was not based on any direct data from an implemented system, the modelled system will certainly differ from an actual future product. Materials and processes were also often represented by other datasets that were assumed to be the most representative. Elements that are known to be excluded are the switchgear and climate control in both technologies and the nacelle-based crane in the HAWT.
2.3. Airborne Wind Energy System Design
The design of the AWE system was divided into the five subsystems and the associated components listed in
Table 3. Each subsystem was modelled by using the best available data. However, the level of data availability varied significantly. The most important design choices for the subsystems are detailed in the following.
2.3.1. Aircraft
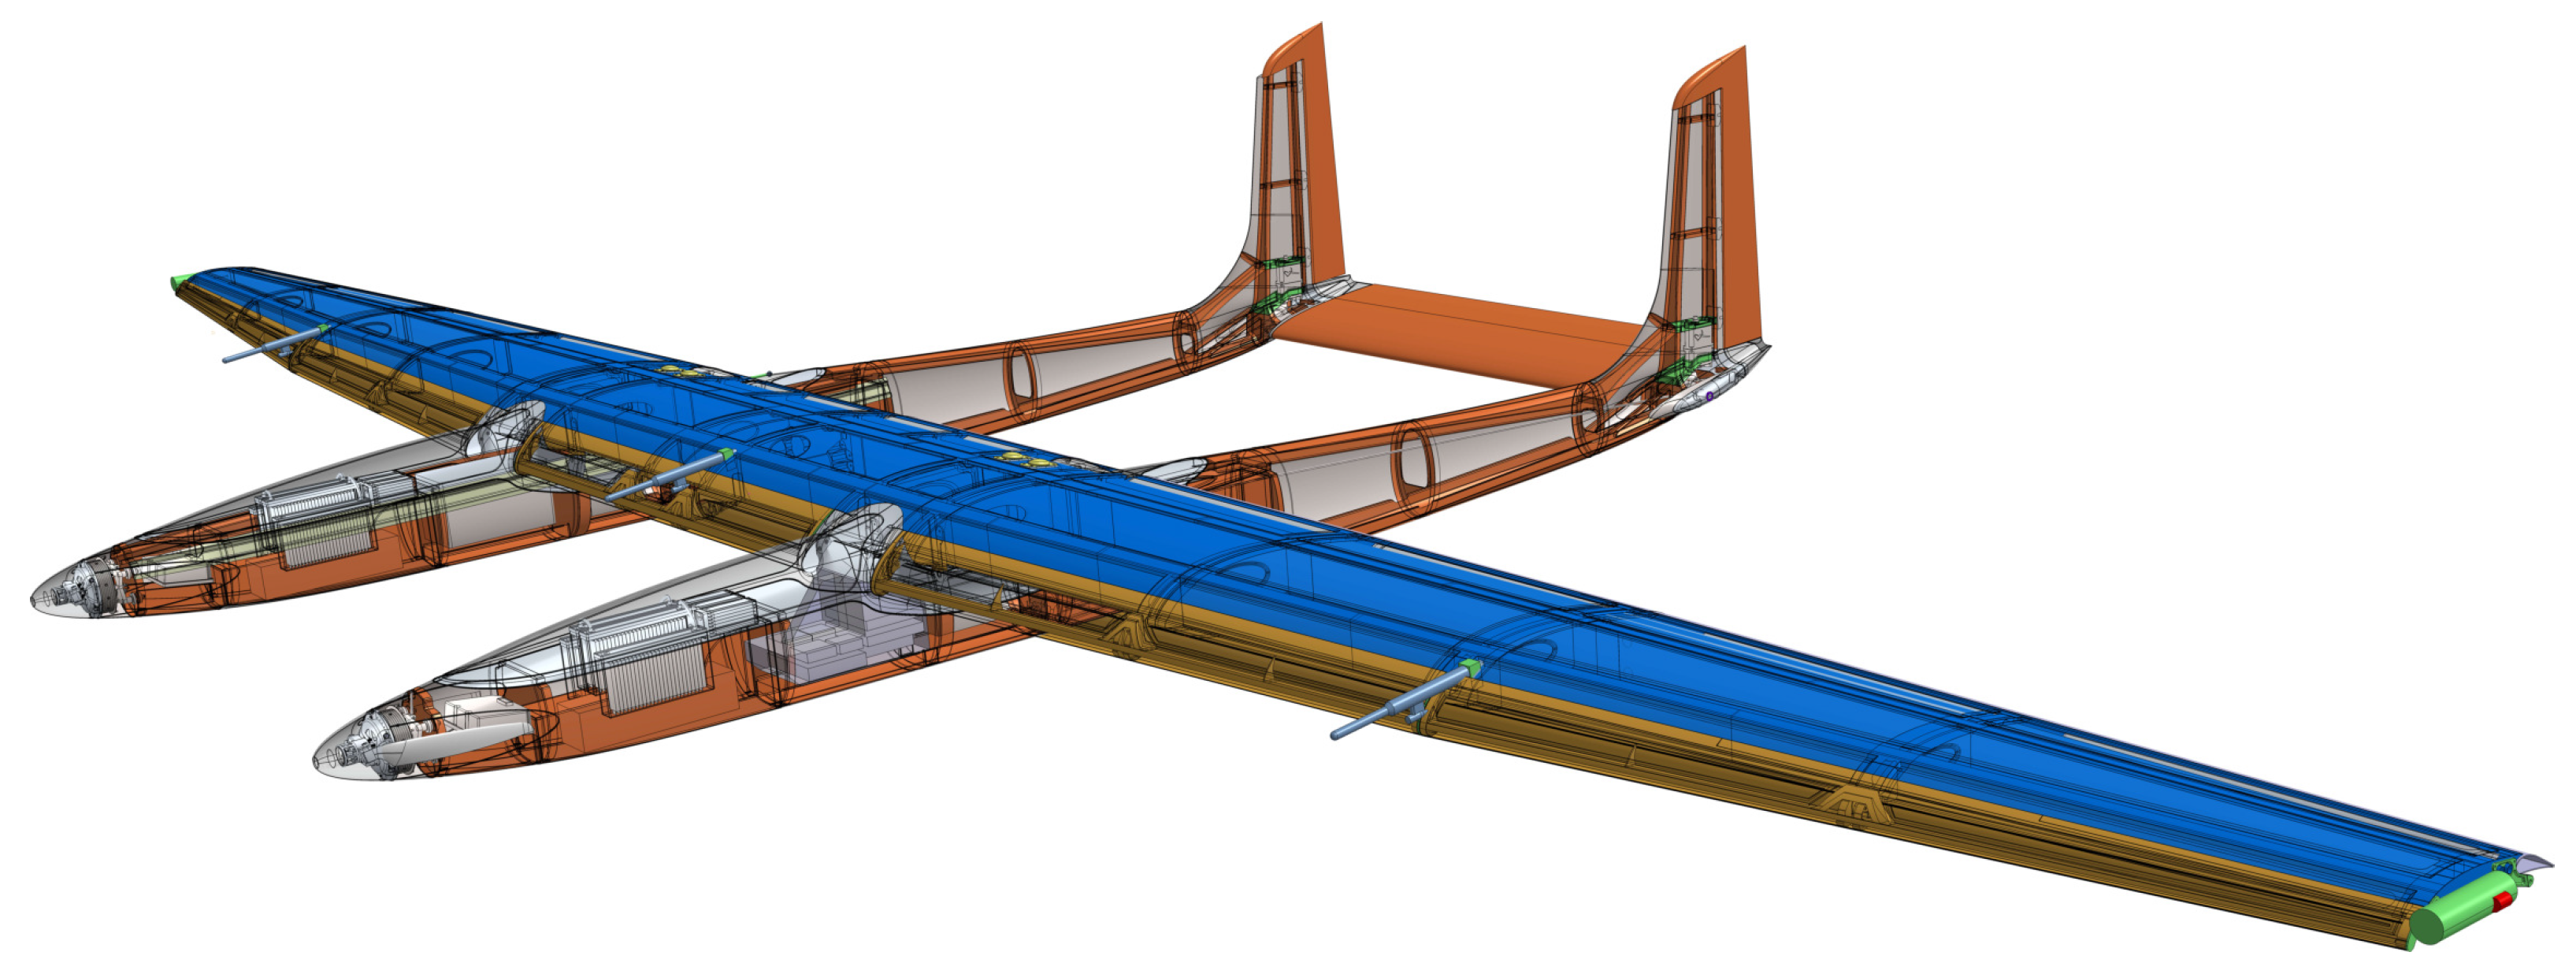
While conducting the present study, Ampyx Power was investigating several utility-scale designs of tethered aircraft. The best option for obtaining in-depth design information was to scale the built AP3, as detailed in
Figure 4, from its mass of 475 kg and rated power of 0.15 MW [
5] up to 5 MW.
This would have led to a total aircraft mass of 34 t. The scaling technique does, however, not take expected future design and technological improvements into account. Alternative aircraft designs developed by Ampyx Power with different levels of improvements lead to varying total masses. These aggressive design studies did, however, not provide a specification of the material compositions used. For that reason, it was assumed that the mass reduction from technological improvements would be distributed equally over all components of the aircraft. The aircraft was, therefore, modelled with the mass distribution of the AP3 given in
Table 4 by using a reduced total mass of 20 t. The wingspan was estimated to be 53.7 m, and the wing surface area was 300 m
. Comparing this with the mass scaling overview of current and future AWE systems presented in [
25], 20 t was a rather conservative mass estimate with a scaling exponent in the range of
.
Even though this lowering of the aircraft mass already requires significant improvements, the company foresaw that further mass savings would be feasible—for example, by changing from an electric propulsion system to a hydrogen combustion system or by changing the current retractable landing system into a permanent, non-retractable one. However, at the time of the present study, it was not possible to define such larger concept changes in sufficient detail. This would have led to considerable uncertainties in the material composition of the aircraft, and it was, therefore, decided to follow the more conservative approach of the scaled-up AP3 design.
The CFRP was assumed to have a mass ratio of 60/40 of carbon fibres to epoxy mixture. The CFRP mass fraction presented in the table, however, also includes the core material, glue, and coating used to form the FRP structures and components within the aircraft.
Additionally, the motor dataset represents both the propulsion motors and the many actuators—for example, for the flaps. This was all modelled with data for automotive electric motors. Similarly, the battery dataset also represents both the propulsion and the actuator batteries, which were also modelled with what could be found in electric cars.
2.3.2. Tether
The tether was assumed to be made of Dyneema® UHMWPE fibres with a 12% silicone polymer coating. The tether was divided into two sections, each optimised for different requirements regarding wear factors and system efficiencies. The top section that attached to the aircraft had a length of 900 m and a diameter of 5 cm, while the bottom section that was reeled off and on the drum had a length of 300 m and a diameter of 7.4 cm. The larger diameter of this bottom tether section supported a maximum tether force of 1170 kN during the traction phase, aiming for a reasonable 312 MPA stress in the braided fibres to minimise the wear due to the cyclic bending [
26]. The top section was modelled with a service life of 7 years, while the winding bottom section needed to be replaced every year. A value of 970 kg/m
was used for the line density of both the UHMWPE and the coating.
Dyneema® is a high-tech material with no publicly available impact data. The manufacturer DSM provided the figures listed in
Table 5, stating that the material was produced with a high share in renewable energy sources [
27]. Accordingly, the figures are not representative of generic UHMWPE fibres, which can have a GWP that is four times higher.
Although the DSM provided no information about the method or the boundary conditions, the data were still considered to be the most accurate impact indication available at the time. The most conservative GWP value of 8.5 kgCOeq/kg was used in this study. Additional processes considered in the production of the final tether were 3% material losses and manufacturing processes for fibre spinning, braiding, and coating. The coating was modelled with an average silicone product production dataset that included silicone polymer materials.
2.3.3. Ground Station/Power Generation Apparatus (PGA)
The ground station, also denoted as the PGA, converts the tether-reeling power into medium-voltage electricity. Its main functional components are the drum, the drivetrain, the generator, various control systems, and the transformers. The optimal drivetrain technology for large-scale AWE systems has not yet been determined and is subject to current and future research [
28,
29]. The presently implemented small- and mid-scale systems generally use a mechanical gearbox to couple the drum with the generator. Geared drivetrain systems are, however, expected to present several challenges for usage in larger systems [
30]. The drivetrain of the modelled 5 MW system was, therefore, designed as a hydraulic system by using information from product catalogues of industrial manufacturers.
The proposed power take-off (PTO) method is illustrated in
Figure 5. The torque of the drum is transferred to eight hydraulic piston pumps arranged in pairs of two along the drum’s circumference. During the traction phases of the pumping cycles, these pumps pressurise a hydraulic cycle that includes compressed nitrogen accumulators. An example solution marketed for hydropower applications is described in [
31]. On the grid side, the hydraulic pressure is converted back into shaft power by eight hydraulic piston motors, which, in pairs of two, drive four electrical generators. During the retraction phases, a fraction of the energy stored in the compressed gas is used to drive both the hydraulic motors coupled to the generators and the hydraulic piston pumps in the drum, but now, this takes place in the motor mode to rewind the tether. The hydro-pneumatic accumulator is dimensioned to buffer sufficient energy to ensure a continuous power output of 5 MW. It uses eight 1000 L piston accumulators coupled to 284 pressure cylinders of 75 L each. All selected components are rated for operation at a peak pressure of 35 MPa, and the piston accumulators are assumed to use their entire working volume in each pumping cycle. The accumulator system can store an estimated 185 MJ of energy, which equals 37 s of 5 MW power output. This is deemed more than sufficient to guarantee constant power output over the retraction phase while leaving plenty of energy to account for losses and to drive other energy-consuming processes, such as drum rotation reversal.
Because the tether lifetime increases with the drum-to-tether diameter ratio [
26], a commercially viable multi-MW AWE system with reasonable tether replacement intervals will require a large drum diameter. Additionally, to support the increased force levels, the entire structure has to be heavier, which results in higher inertial losses when inverting the rotation of the drum. For this reason, the modelled 5 MW system used a drum design that relocates a large portion of the structural mass of the drum from a rotational to a static location to mitigate the negative effect on the efficiency of the system.
This design consists of a lightweight cylindrical CFRP shell with slew bearings supported by a static frame. An approximate optimisation of tether wear resulted in a drum-to-tether diameter ratio of 55, making the drum 4 m in diameter and 2 m in width in order to reel the entire bottom section of the tether on the first layer of the drum. The top section of the tether, which is only reeled in to land the aircraft, is assumed to be rolled up on additional layers.
2.3.4. Launching and Landing Apparatus (LLA)
Ampyx Power pursues a horizontal take-off and landing (HTOL) concept. The LLA illustrated in
Figure 1 comprises the landing deck, the launch catapult, the shifter to decelerate the aircraft, and the yaw system to rotate the deck with the wind and structural elements for support. The length and size of the deck strongly depend on the mass of the aircraft and the control strategy used for the landing and launching operations. The tested AP3 and its deck were designed as a functional demonstrator that did not account for economic viability, and they were, therefore, not suitable to be used as a starting base for upscaling. For this reason, the LLA was modelled primarily based on an estimation model provided by Ampyx Power.
For an aircraft with a mass of 20 t, the deck was estimated to be 34.2 m long and 18.7 m wide. The mass of the whole LLA was estimated at 228.1 t, of which the deck and its support structure were 128 t, the yaw system was 22.7 t, the catapult was 32.8 t, and the shifter (decelerator) was 44.6 t.
2.3.5. Foundation
The foundation of the launching and landing platform transfers the moments and forces resulting from the operation of the AWE system to the ground. Because the foundation concept was not defined at the time that the present study was conducted, assumptions and values from residential construction were used to determine the material used. The foundation was assumed to be circular with a total diameter of 24 m, and it was divided into three zones of different depths to accommodate different loadings. The inner and outer zones, which supported the high loads from the deck, were modelled with a concrete depth of 1 m. The area in between, which only supported static machinery, was modelled as a slab that was only 0.15 m thick. The total volume of the foundation added up to 146 m, only 20% of that of the HAWT system.
2.4. HAWT Design
The HAWT system was specifically designed to be the most representative comparison with the AWE system given the limited data availability and large variability within HAWT system types. The design of the comparable HAWT system was primarily based on the design of the NREL 5 MW reference wind turbine. Because the original design [
10] was no longer up to date with the current state of wind turbine technology, a further optimised design was used as a starting point [
32]. This was then further detailed by using various additional sources for the blades [
33], the tower [
34,
35], the drivetrain [
36], and additional elements [
37]. With these updates on the subsystem level, the HAWT system, as modelled, became the most up-to-date version for which sufficient data could be obtained for an informative comparison with AWE. HAWT technology would definitely have developed further by the time AWE systems of this scale would actually be deployed in larger numbers. AWE technology is, however, expected to improve even more as it matures into a commercially available technology. To compare with the AWE system, the HAWT system was divided into subsections that matched the subsystems of the AWE system, namely, the rotor corresponding to the aircraft, the tower to the tether, the nacelle to the PGA, and the foundation. The LLA of the AWE system could, in principle, also be associated with the tower of the HAWT system, as it was a structure with a similar support function. In this study, however, the LLA was considered as a separate subsystem. The specific design of this subsystem was highly dependent on the pursued launching and landing process. Its separate evaluation, therefore, allowed for the most effective interpretation of the results.
The turbine had a rotor diameter of 126 m and a hub height of 117 m. The latter deviated from the NREL standard because the assessed system was for onshore operation, while the NREL standard was for offshore operation. The 117 m corresponded to the hub height of the onshore version of the turbine on which the NREL 5 MW standard was based, the Repower M5.
2.5. Balance of System (BOS)
Arranging the individual AWE and HAWT systems in 50 MW wind farms required additional cabling. This farm-level subsystem was denoted as BOS, which, in the frame of the present study, included the inter-array and the export cabling. All cables operated at 33 kV and had three aluminium cores, XPLE insulation, copper wire screens, and PVC sheaths. Both farms were modelled with two export cables with a conductor cross-section of 600 mm, adding up to 30 km of export cable to connect the farm. The inter-array cabling was selected at a constant 240 mm conductor cross-section, with a total length of 10.8 km over the AWE farm and 7.94 km over the HAWT farm.
2.6. Installation
Most major components of both the AWE and the HAWT systems were assumed to be manufactured at the same location in Denmark and then transported to the Netherlands for installation. Only the foundations were assumed to be locally supplied. The foundations were modelled with a transport distance of 50 km by a >32 t freight truck. All other components were modelled with 500 km of onshore transport and 2000 km of sea transport by freight ferry. Currently tested AWE systems in the 100 kW range were transported in standard shipping containers [
38,
39], which greatly facilitated the deployment because specialised vehicles, detours to avoid bridges, or support vehicles to guide traffic and prepare the route in advance were not needed. These potential advantages were, however, not taken into account in this assessment because it was still uncertain to what level this advantage would remain for a system of multi-megawatt size.
Given the farm layout specifications listed in
Table 1, onsite construction of the AWE farm was estimated to include 20 h of crane operation, 3302 m
of digging activities for the cables, and 156 m
of digging activities for the foundation. For the HAWT farm, these numbers were 40 h, 2936 m
, and 766 m
. Digging was modelled with the EcoInvent hydraulic digger dataset, and crane operation was modelled with a GWP of 90 kgCO
eq/h from the literature [
40].
2.7. Operation and Maintenance (O&M)
The O&M stage included the replacement components, servicing trips, and actual energy generation of the systems. Simplified replacement assumptions for each AWE system included the tether replacements and various replacements in the aircraft: 4×the actuators, 1×the propulsion batteries, and 3×the actuator batteries. Maintenance for the HAWT systems only included the replacement of the gearbox in each turbine. Additional servicing for both the AWE and the HAWT farm included 14,000 kg of lubrication, 4000 kg of coolant, and an additional 1200 km of 7.5 t transport by a 7.5 to 16 t truck for crew transport to the farm each year.
2.8. End of Life (EOL)
At the end of life, the farm location was returned to its original condition. All components were disassembled and removed. Assumptions were made on current EOL processing rates for all materials that were recovered. The impacts of disassembly, transportation, landfilling, and incineration activities were included. Recycling was, however, only accounted for through the inclusion of a fraction of recycled materials in the original material input into the systems. Reduced or avoided impacts from the recycling of all materials at the end of life were deemed outside the scope of this study, primarily because recycling methods are still in development for the newer materials that were used in the AWE design.
3. Results and Discussion
The aim of this research was to analyse and quantify the environmental impacts of a future multi-megawatt AWE system by using an LCA method and to compare those impacts with the impacts of a conventional HAWT system. The results of this assessment will be presented and discussed in two stages.
Section 3.1 describes the intermediate LCI stage, where the design is detailed at the subsystem and component levels to determine and compare the mass compositions of the AWE and HAWT systems.
Section 3.2 describes the subsequent LCIA phase, where these material flows were matched with their specific GWP and CED impacts to determine the total impacts for both systems.
3.1. Inventory and Mass Analysis
A key motivation for AWE is the potential of the technology to harvest wind energy with a significantly reduced material footprint. A suitable metric for quantifying this potential is the normalised mass in kg per MWh of electricity delivered to the grid over the 20 year service life of the installation. The 5 MW fixed-wing ground-generation AWE system investigated in this study was found to require 2.0 kg/MWh, which was a 70% reduction from the 6.6 kg/MWh required for the 5 MW HAWT system under base-case conditions.
Figure 6 and
Table 6 summarise the mass compositions of the subsystems of both technologies. It can be concluded that the overall mass reduction was primarily a result of the reduced requirements for structural components. On the subsystem level, this effect was most pronounced in the foundations or when comparing the tower of the HAWT to the tether and LLA of the AWE system, but also when comparing the blades with the aircraft.
Figure 7 further details the mass breakdown of the AWE system from the subsystem to the component level, indicating that the hydraulic drivetrain and the hydro-pneumatic accumulator represent major mass contributions in the PGA subsystem.
Even though the masses of the AWE PGA and the HAWT nacelle are similar, the materials used are not. The nacelle includes a significant fraction of structural elements, whereas the AWE system includes more mass for machinery, such as the accumulator system. The average quality and impact of the materials used in the PGA are, therefore, higher than those used in the nacelle. A similar description holds for the LLA machinery, the tether, and the aircraft.
The larger mass of the machinery in the AWE PGA has several reasons. Because of the cyclic operation of the AWE system, energy is generated only during the reel-out phases, while the reel-in phases consume some of this energy. For a net electrical cycle output of 5 MW, the mechanical power during the reel-out phases needs to be significantly larger, which requires an oversizing of the power take-off components (drum, hydraulic piston pumps/motors) to handle the larger loads. An oversizing of 2.5 times the rated system power was used in this study. This factor was provided by Ampyx Power as an indicative value and is also in line with experimental data of the TU Delft kite power system [
28,
41]. A second substantial mass contribution to the AWE PGA is the hydro-pneumatic accumulator of the hydraulic system, which is required to buffer the energy flows during the cyclic operation and provide a constant electricity output.
3.2. Impact Assessment Results
The key results of the LCA are the GWP and the CED over all stages for 20 years of operation. The values for the base-case scenario presented in
Table 7 indicate that the GWP and CED of the AWE system are only 60.1% and 65.4% of the corresponding impacts of the HAWT system. A similar reduction in EPBT and an increase in EROI can be observed.
A closer look at the GWP and CED build-up of the subsystems within both technologies is presented in
Figure 8. The charts indicate that the majority of all impacts were caused by the materials at the manufacturing stages (hatched patterns), accounting for 81.1% and 78.5% of the total GWP and CED of the AWE system, respectively. For the HAWT system, this stage was responsible for the 85.9% and 87.8% of the impacts. The fractions were larger for the HAWT system because the AWE system had a higher share of impacts in the O&M life-cycle stage due to frequent tether replacements.
The most striking observation can be made regarding the foundations. Even though these subsystems were responsible for by far the largest mass percentages of both technologies, they represented only minimal contributions to the GWP and CED.
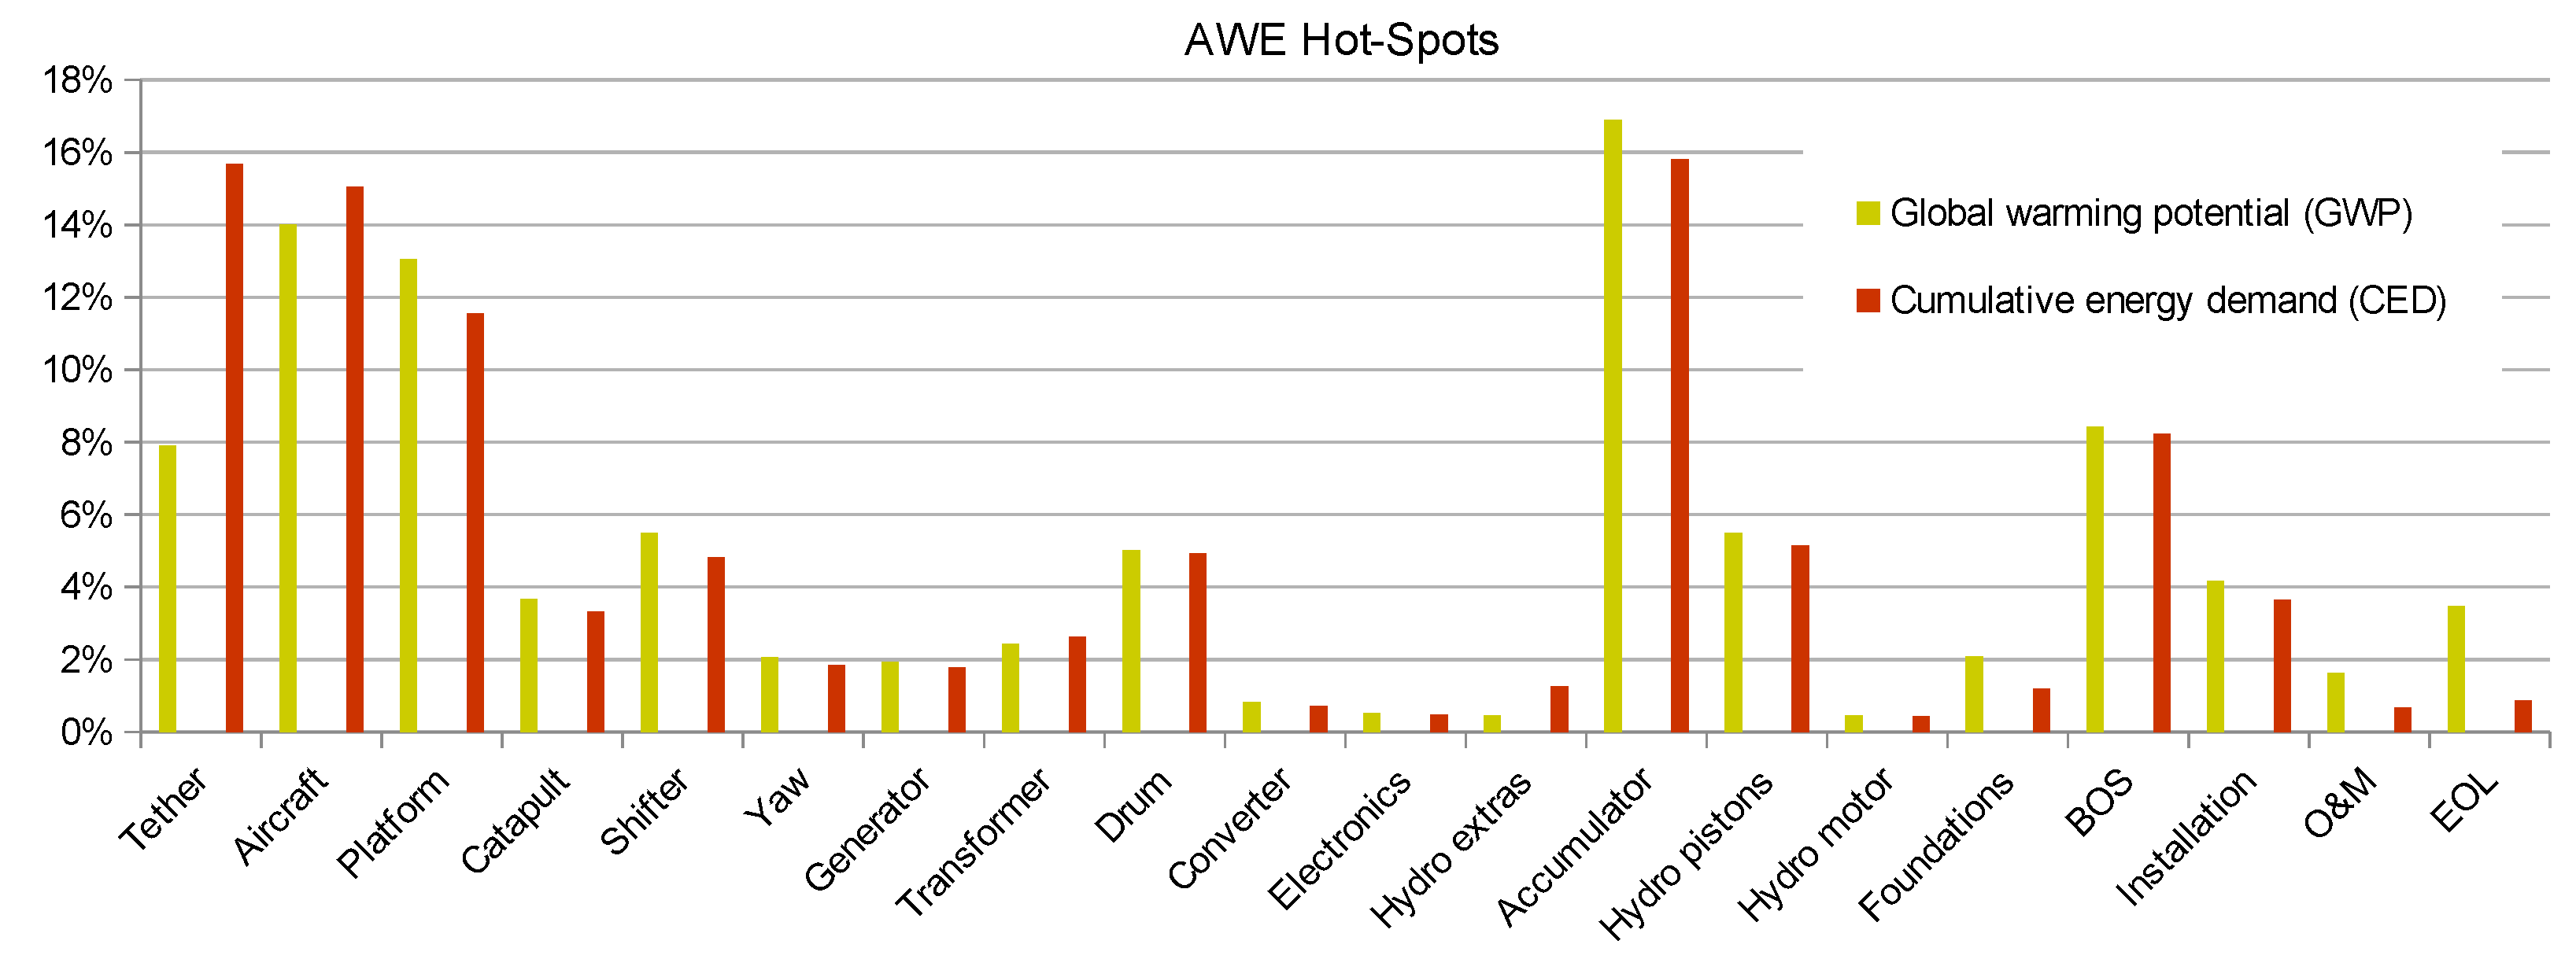
Figure 8, however, does not show the accurate impacts of the tether and the aircraft over the complete service life of the system. The replacements within these components were included in the O&M stage. In
Figure 9, the GWP and CED of the AWE farm over its entire lifetime are broken down even further. This hot-spot graph presents the GWP and CED impacts of specifically selected subsystems and components, identifying four key contributors for the investigated design: the hydro-pneumatic accumulator, the tether, the aircraft, and the platform of the LLA. All four are assessed in more detail in the following.
3.2.1. Hydro-Pneumatic Accumulator
Of all impact categories of the AWE system, the hydro-pneumatic accumulator had the highest environmental impact. The relatively high impact of this subsystem was mainly due to the large masses of the accumulators and the piston-charged nitrogen-pressure cylinders, which were made of chromium steel. Despite this, the use of a hydraulic drivetrain with a hydro-pneumatic accumulator and a 5 MW electric generator was expected to lead to a substantial overall reduction in the environmental impact compared to the use of a mechanical drivetrain with gearbox, oversized generator, and electrical storage capacity. Because of the cyclic operation of the AWE system and the required substantial oversizing of the energy generation and transmission equipment, the cyclic buffering of the energy should occur as far upstream as possible in the transmission chain. This prevents having to oversize all systems that are further downstream, such as the generators, converters, and transformers.
The 5 MW HAWT used a gearbox with a mass of 48.6 t. With the inclusion of the gearbox replacement, this mass added up to 97.3 t over the system’s 20 year service life. The HAWT gearbox mass, thereby, already closely matched the mass of 97.8 t of the hydro-pneumatic accumulator. If a similar mechanical gearbox would be used for the AWE system, it would need to be oversized by a factor of 2.5. The impacts of such a gearbox alone would by far exceed the impacts of the hydraulic drivetrain, while most other PGA components, such as the generator, would also need to increase in size. In addition, super-capacitors with a relatively high environmental impact would be needed to buffer the electrical energy over the cycles.
Other options for buffering the cyclic energy flows upstream of the generator, such as with a fly-wheel, were not assessed in the present study. Each AWE system was equipped with its own hydro-pneumatic accumulator, amounting to 48 t of piston accumulators, 38 t of pressure cylinders, and 7 t of standard structural supports. Substantial savings should be feasible with energy buffering solutions that take the entire wind farm into account—for instance, by pneumatically linking the AWE systems in the farm and using phase-shifted operation to minimise accumulator capacity. The effect of phase-shifted operation of AWE systems on the net energy output of a farm was demonstrated in [
21].
3.2.2. Tether
The tether was responsible for the second-highest impact. At installation, the impacts of the tether were minimal, accounting for only 0.8% of the total GWP and 1.6% of the total CED impacts of the AWE system over the 20 year service life. With frequent replacements, however, these impacts accumulated to a total of 7.9% of all GWP and 15.7% of all CED. The UHMWPE was responsible for the majority of these impacts. The striking deviation between the GWP and CED impacts of the tether was the result of the large share of renewables used by the manufacturer from whom we received the data (see
Table 5).
The tether could have had a significantly higher impact had different choices been made. Without sectioning the tether or without the large share of renewable energy used in the manufacturing of the UHMWPE material, the impacts could easily have been tripled. Lifetime optimisation of the tether and selection of its manufacturer will both be of crucial importance to keep the impacts of AWE low.
A sensitivity analysis over the lifetime of the tether concluded that the total GWP and CED impacts of the AWE system would increase by 9.4% and 15.9%, respectively, if the tether lifetime was halved. At an increased lifetime of 2 years for the winding section and one replacement for the top section, the GWP and CED impacts would be reduced by 4.2% and 7.2%, respectively.
3.2.3. Aircraft
The third-highest impact category was the aircraft. The impact of the aircraft over 20 years added up to 14% of the total system impacts. This included the initial manufacturing impacts, followed by four replacements of all actuators, three propulsion battery replacements, and one actuator battery replacement. The distribution of the GWP impacts of the initially manufactured aircraft is presented in
Figure 10. These were responsible for 82% of the lifetime impacts of the aircraft.
It was assumed that the aircraft would be built with CFRP composites only in order to keep the weight to a minimum. This, however, came with a strong increase in GWP and CED impacts. The production of the carbon fibres in the CFRP is highly energy intensive, and the GWP impact of this process is 21 times higher than that of the production of the glass fibres in GFRP.
Because fibre composite materials are used in many applications with increasing turnover, more sustainable fibre materials are the subject of extensive research and could significantly reduce the impacts in the near future. Examples are recycled carbon fibres and lignin-based (bio) carbon fibres. The latter have been presented to even have a lower impact than that of current glass fibres [
42]. Both of these options, however, produce short-length fibres, which have lower structural qualities. Their usability within the function of AWE would need to be assessed.
Especially because an increased mass of the aircraft also influences the structural requirements of the LLA, this would require a larger landing deck and stronger catapult and shifter machinery to accelerate and decelerate the larger mass in the launching and landing procedures. A 20% increase in the aircraft mass from 20 to 24 t would lead to an additional 16.8% (38 t) mass increase for the LLA. As a result, the GWP and CED of the AWE system would increase by 7.3% and 6.9%, respectively. Similarly, an aircraft mass of 16 t would present a 15.6% mass reduction for the LLA. The system impacts would be reduced by 7.0% and 6.7% for the GWP and CED, respectively.
3.2.4. Platform
The platform comprising the landing deck and its support structure accounted for 14.0% of all GWP and 12.4% of all CED impacts of the AWE system. The relatively high impacts of the platform were a direct result of the large mass, as it was modelled with the same structural steel as the tower of the HAWT system.
The AWE design presented in this study effectively replaced the HAWT tower with the LLA and the tether. In the base-case scenario, the LLA weighed 228 t, while the tower mass was estimated at 600 t. The mass of the HAWT tower was, however, an element of extreme variability and could very well have been much lighter or heavier depending on the location for which the system was designed and the type of tower that was used. This poses both a disadvantage and an advantage for AWE and could be used to determine the best marketplace for AWE systems. The results of a related sensitivity analysis are presented in
Section 3.3.2.
3.3. Sensitivity Analysis
Many uncertainties still remain in the actual design of a future 5 MW AWE system. This study, therefore, had to make numerous assumptions in order to model the AWE and HAWT systems based on the best available sources. The effects of deviations in the most decisive assumptions were assessed with sensitivity analyses, some of which were already presented above, such as deviations in the aircraft mass and the tether lifetime. In the following, the effects of the system lifetime and location of the wind farms are investigated.
3.3.1. Lifetime Extension
The AWE system was assumed to have the same lifetime of 20 years as the HAWT system. However, the newest wind turbines are already predicted to operate even longer, for more than 25 years. Increasing the lifetime of the systems significantly reduces their impacts. The lifetime of a system is determined by the shortest lifetime of one of its irreplaceable components. For an HAWT, this is the tower, while an AWE system does not seem to have any such irreplaceable components. This means that the impacts could potentially be significantly further reduced.
Table 8 lists the environmental impacts of both technologies as functions of the service life of the installation. This sensitivity study considered the normal maintenance and replacement frequency stated for the base-case AWE system and did not include efficiency losses or an additional full system replacement, such as the aircraft. For the HAWT system, it only considered an additional gearbox replacement in the 30 year case, but not yet in the 25 year case. All other maintenance and servicing impacts are scaled with the lifetime.
The data indicate that lifetime extension would likely have a smaller positive effect for AWE than for HAWT. This is because the AWE system requires more frequent component replacements, which makes the fraction of O&M impacts relatively higher than that in the HAWT system. The data also reveal that designing for reparability and lifetime extension could be an interesting strategy for further reducing the impacts of the AWE system, especially if lifetime extension indeed proves to be more feasible for AWE than it is for HAWT.
3.3.2. Location and Foundation
An important difference between AWE and HAWT is their adaptability to different locations and environmental conditions. Not only are AWE systems able to continuously adapt their operation to the present wind field, e.g., by adjusting their height, but they also require only minimal design alterations for deployments in a large variety of locations.
Onshore
For AWE systems, the significant mass contributions of the LLA, PGA, and foundation subsystems remained constant regardless of location and environmental conditions. Only the length of the deployed tether and the aircraft’s aerodynamics might be adjusted for optimal performance at a specific site. For HAWTs, on the other hand, the siting generally had a major effect on the system mass. Two key design parameters for optimising a turbine for a specific site are the hub height and the rotor diameter. The sensitivity analysis only assessed the effect of varying hub height. The wind class of the turbine was kept at IEC 1, corresponding to an average wind speed of 10 m/s at the hub height.
An IEC 1 turbine may only need a hub height of 90 m at a good wind location (typically offshore), while it could require a hub height of 160 m at a bad location. The 5 MW turbine range of turbine the manufacturer GE can be acquired with tower heights of 101 up to 161 m. The material demands will, therefore, be much higher for deployment sites with less favourable wind conditions because of the increased hub heights. The original standardised offshore NREL 5 MW turbine has a hub height of 90 m and a mass of 348 t. When optimised, this mass can be reduced even further to 250 t.
Table 9 summarises the results of two sensitivity analyses. The columns “Heavy” and “Light” describe the sensitivity towards the tower mass, while the columns “Short” and “Short and Light” describe the additional sensitivity towards the hub height, stressing the importance of site selection. For the analysis, it was assumed that the AWE system operated at an average height of 250 m above the platform. A change in the hub height of the HAWT system affected the wind speeds experienced by the AWE system, since the relative difference in height had changed. The average wind speed experienced by an AWE system at a location where the wind speed at 90 m is 10 m/s was recalculated with the logarithmic law. At an average operating height of 250 m, the experienced average wind speed was approximately 11.5 m/s. This higher wind speed increased the AEP of the AWE farm from 231,264 to 238,005 MWh, which corresponded to an energy output increase of 3%. A surface roughness typical for onshore conditions was assumed.
The results show significant changes in the impacts of the HAWT system, while the impacts of the AWE system were only minimally affected. In this assessed case, the HAWT system had an advantage. However, when increased turbine hub heights were required, the advantage shifted to the AWE system.
For the current assessment, the rotor diameter of the turbine was selected for an average wind speed of 10 m/s at the hub height, which corresponded to the IEC1 wind class (see
Table 1). Using the rotor diameter as an additional optimisation parameter, the turbine performance could have been maximised for lower average wind speeds that corresponded to IEC2 or IEC3 wind classes, for example. As a result, the turbine tower would not have to be increased, and the wind speeds experienced by both technologies would be lower. Consequently, the turbine would still operate optimally at these lower average wind speeds, while the operational efficiency of the AWE system may drop low. Although the increased rotor diameter also comes with significant environmental impacts, there may be a limit where the losses in the operational efficiency of AWE make the HAWT system the environmentally friendlier option. The relative advantage of the AWE system will depend on the specific environmental conditions and design considerations employed in the turbine selection for a specific site.
Offshore
Switching to offshore operation comes with substantial design changes for both technologies. Offshore locations can be separated into two groups—deep water and shallow water—where deep-water locations are where HAWT systems require floating foundations. The current thought is that AWE could present the largest advantage over HAWT in deep-water foundation locations, primarily due to its lower overturning moment [
43].
Since the current prototypes are for onshore applications, research and concrete data on floating AWE foundations are scarce. A previous study presented a floating foundation for a 2 MW Ampyx Power system by using a mass of 491 t, but it left many uncertainties [
44]. In the present study, the mass of a 5 MW floating foundation was estimated to be two times the mass of this 2 MW system, although this could deviate significantly. Additional masses for the anchors and the mooring lines were chosen at half that of the assessed floating HAWT foundation (see
Table 10).
This very rough estimate for a floating offshore AWE wind farm was compared against the impacts of different deployment options of an offshore HAWT wind farm. First, it was compared against a system with a shallow-water foundation depth of 40 m, which is the deepest at which a 5 MW turbine would typically be installed, followed by a system with a more reasonable depth of 12.8 m and, finally, against the Hywind floating wind farm [
45]. These assessments did not include changes in the BOS or activities in any of the other life-cycle stages, such as transportation and installation, most of which are known to have larger impacts offshore. It would, therefore, not present an accurate comparison between onshore and offshore AWE.
The results indicate that the material consumption of floating foundations was substantially larger compared to that of shallow offshore and onshore deployments. The larger masses, especially in construction steel, steel mooring lines, and ballast concrete, consequently led to higher impacts. However, compared to floating HAWT, the lower overturning moment of the AWE system proved advantageous, as the AWE foundation required significantly fewer structural and ballast materials to counter the lower forces to which the substructure was subjected. This rendered the conceptual floating AWE system substantially less pollutive than the selected floating HAWT system. It should be noted that floating HAWT systems are also still redesigned and improved, although AWE will likely always have a strong advantage for this application case.
The results also show that a floating AWE system might not be all that advantageous in comparison with an HAWT on a monopile. Close to shore, the estimated mass of the floating foundation simply outweighs that of a monopile. On the other hand, the large impacts of the offshore monopile foundations do indicate the large potential value of re-powering end-of-life HAWT foundations. These EOL foundations are generally insufficient to re-power a modern HAWT turbine due to the build-up of fatigue stresses. The foundation could, however, very well be sufficient to serve a second life by supporting an AWE system, which has a significantly lower overturning moment. The additional electrical infrastructure of the farm could, in that case, also be reused for a second life, whereas it would need an upgrade had a higher-rated HAWT turbine been installed.
4. Conclusions
The key objective of this study was to determine the global warming potential and cumulative energy demand of a future multi-megawatt airborne wind energy system and to compare these impacts to those of a conventional horizontal-axis wind turbine. The AWE system was based on the design of Ampyx Power, and it used a fixed-wing double-fuselage aircraft tethered to a generator on the ground and was operated in pumping cycles. The 5 MW system was a scaled-up version of the built AP3, as illustrated in
Figure 2 and
Figure 4, with a wing surface area of the aircraft that was increased by a factor of 33.3.
The closest data available for that scale came from early company-internal feasibility studies of a 1 MW system. The large unknowns meant that the presented system was designed with the best abilities at the time, but many design changes and material improvements may be expected in the future. The insights gathered in this LCA will be used to improve the sustainability of this design.
The results show that the new technology can drastically reduce the environmental impact of wind energy. The onshore AWE system that was modelled achieved a mass reduction of 70% compared to the HAWT system, primarily because of the reduced necessity for structural components. The GWP and CED were 60% and 65% of the respective impacts of the HAWT system. These reductions were less substantial than for the mass because the AWE system required greater amounts of newer, high-end, and high-energy-consumption materials, whereas the mass savings were primarily in conventional construction materials with lower environmental impacts.
The sensitivity analysis further indicated that careful site selection can enhance the advantages of AWE. Using the minimum and maximum tether length as an easily adjustable operational parameter, the design of the AWE system can stay fairly constant, regardless of the location and wind conditions. On the other hand, the design of the HAWT system and its environmental footprint depend strongly on the location and wind conditions. A substantially lower environmental impact can be achieved with AWE systems that are designed specifically for locations that are less optimal for HAWT systems. These include far-offshore deployments, where HAWT systems require floating foundations, and sites with lower wind speeds, where wind turbines need to be built higher with consequentially heavier towers.
The four components of the modelled AWE system with the highest environmental impacts were the hydro-pneumatic accumulator system, the tether, the aircraft, and the landing platform. For the accumulator system and the landing platform, the high impacts resulted primarily from the high masses of these components. For the tether and the aircraft, the high impacts were caused by the use of newer high-end materials. Developments in the design of the system and improvements in material technologies can significantly lower the impacts of these subsystems.
Sustainability is a very diverse field. In general, the results of an LCA strongly depend on the methods used and the system boundaries drawn. For example, a more detailed consideration of recycling could have led to significantly different results, as current recycling options favour conventional materials, such as steel and concrete, for which the recycling methods are already well developed. Furthermore, this study only assessed the systems for two impact categories. Another category of interest is abiotic depletion, which is related to the usage of rare Earth materials. This is a topic that could be of importance when comparing AWE with HAWT systems, but also when comparing ground-generation to in-flight-generation AWE concepts. Finally, AWE can be regarded as a radical redesign of wind energy harvesting with a significant material reduction potential and an important contribution to a circular economy.
This study confirms what we also know from other technologies, namely, that for the optimal product and the lowest environmental impacts, sustainability should already be accounted for in the initial stages of development.


