Article

Impacts of Tariffs on Energy Conscious Behavior with Respect to Household Attributes in Saudi Arabia

by
Kh Md Nahiduzzaman
1,*,
Abdullatif Said Abdallah
2,
Arash Moradzadeh
3,
Amin Mohammadpour Shotorbani
1,
Kasun Hewage
1 and
Rehan Sadiq
1
1
Life Cycle Management Laboratory, School of Engineering, University of British Columbia, 1137 Alumni Avenue, Kelowna, BC V1V 1V7, Canada
2
Faculty of Architecture, Building and Planning, University of Melbourne, Melbourne, VIC 3053, Australia
3
Faculty of Electrical and Computer Engineering, University of Tabriz, Tabriz 5166616471, Iran
*
Author to whom correspondence should be addressed.
Energies 2023, 16(3), 1458; https://doi.org/10.3390/en16031458
Submission received: 5 December 2022 / Revised: 19 January 2023 / Accepted: 26 January 2023 / Published: 1 February 2023
(This article belongs to the Special Issue Data Driven Approaches for Environmental Sustainability 2023)

Abstract

:
Historically, the combination of generous subsidies along with extreme climate has led to unsustainable domestic electricity consumption in Saudi Arabia. The residential sector constitutes a significant portion of this consumption. Amid the economic challenges, the country enforced a new electricity tariff for residential consumers in 2018. This study thus leverages change in 2018–2020 by collecting and analyzing the electricity consumption data of 73 households in the Eastern Province of Saudi Arabia. The energy consumption is modeled based on the households’ attributes (e.g., dwelling type, ownership, number of residents, rooms, ventilation type, etc.) and applied tariffs using a machine learning technique. The extreme learning machine (ELM) is employed in solving the overfitting problem due to low-volume data. The correlation matrix is also constructed to determine the relationship between the household attributes. The ELM model developed in this study extracts the correlation between the input variables in determining energy consumption and also predicts the energy consumption related to low consumption data. The findings indicated that the electricity consumption between the pre-revised tariff year and the revised tariff enforcement year saw a reduction which was consistent in the subsequent years. This was also validated by the paired sample t-test, which showed a significant decrease in electricity consumption for the study period. The analysis also revealed that several household attributes had a relatively high impact on the reduction in the electricity consumption level following the revised tariffs, whereas the majority of the attributes had a moderate impact. In addition to these key findings, the demonstrated pathway adopted in this study is itself a methodological contribution that provides critical information about the sensitivity of the impacts of tariffs on energy consumption with respect to different household attributes. Economic factors being the critical stress need to be blended with existing energy consciousness for positive changes in favor of energy-saving behavior of the household members. The study does not attempt to represent the population of concern, but demonstrates a methodology that would help unleash inherent energy consciousness in favor of sustainable and energy-efficient behavior.

1. Introduction

The per capita electricity energy consumption in the residential sector in Gulf Cooperation Council countries, including Saudi Arabia is rapidly increasing [1]. The volume of consumption is placing significant stress on the current production capacity of electricity while challenging its ability to cope with augmented future demand [2]. Residential energy demand can be attributed to several factors, notably heavy subsidies in conjunction with harsh weather conditions, which are seen as the primary cause, and growth in the country’s population and prosperity, leading to rapid urbanization and contributing to rising energy demand and its volume of consumption [3,4,5,6,7,8]. Of all the sectors in Saudi Arabia, residential buildings take a large share of the country’s energy supply, whereby roughly half of the entire country’s electricity consumption goes to the sector [9]. Buildings increasingly require more energy, particularly in the summer months, due to the demand for heavy air conditioning [6,10]. To address the growth in energy demand and maintain energy security, several energy-efficiency and conservation initiatives have been established by relevant agencies [1,11].
For example, in recent years, public awareness among the Saudi population on achieving energy conservation is on the rise, facilitated by various public campaigns and programs [12]. These include information campaigns aiming to positively influence customer purchasing decisions by ensuring that they are well informed about the energy efficiency levels of appliances available in the market. [3]. Moreover, standards related to the use of insulation material in new commercial construction projects have been formulated to facilitate the drive to conserve energy [11]. However, the effectiveness of such initiatives on actual conservation practice and their behavior is yet to be known. While these efforts have been successful in educating the Saudi public, these initiatives have nonetheless not been targeted at individual household members. In response to this, Nahiduzzaman et al. [2] undertook research aiming at informing household members about the significance of energy conservation and the effective means of achieving it through simple behavioral changes. If applied in conjunction, these measures will serve to raise public awareness on energy conservation, promoting energy- and environment-conscious culture.
The building sector in Saudi Arabia is critical as residential buildings account for more than half of the domestic electricity consumption. The low tariff has been one of the pivotal factors responsible for high residential consumption. However, due to the realization of this fact and mounting economic stress on the national economy, the electricity tariff was raised in December 2015 and January 2018 to reduce the governmental subsidies [13]. In addition, a few sporadic initiatives, notably campaigns, exhibitions, messages for university students, posters, cultural and artistic activities in schools, etc., have been launched to improve energy conservation awareness and address the heightening residential energy demand. Nevertheless, these initiatives have been top-down in nature and have not considered the nature of the relationship between consumer behavior and electricity tariff [2].
Past studies have shown that energy subsidies encourage lavish energy consumption [5,8]. A restructured subsidy system not only has a positive effect on energy consumption and thus the environment, but also significantly impacts the country’s economy [14]. Fewer subsidies will curb the wasteful consumption observed among households by making them more cost-conscious regarding the consequence of their poor decisions. Accordingly, this study examines how a recently revised electricity tariff structure (implemented in 2018) has altered consumption patterns among Saudi Arabian households against the backdrop of the various awareness campaigns launched by the government. This is achieved by retrieving and analyzing electricity consumption data of 73 households. In effect, this change in energy policy, in conjunction with the campaigns, serves as a means of assessing the extent to which economic factors and energy conservation awareness activate the underlying energy consciousness possessed by household members.
Against this backdrop, analyzing the subsequent years after the enforcement of the new tariff structure in 2018, this study attempts to assess the persistence of the behavioral change resulting from the change in electricity tariff. In other words, this study focuses on the nature of the “catalytic” effect of the governmental regulation-based intervention in further enhancing the current energy consciousness among the residents. Thus, the study investigates the effectiveness in addition to the persistence of the behavioral change precipitated by the energy policy intervention imposed by the government. The study also develops a novel machine learning-based model to predict the electricity consumption in Saudi households based on key characteristics such as floor area, number of household members, etc. The employed prediction model is the extreme learning machine (ELM) technique, which is proposed in this study based on its ability to solve problems related to overfitting in certain learning-based techniques that suffer from low-volume data processing. Moreover, the application of a sensitivity analysis approach based on a correlation matrix of input variables that can provide accurate pre-processing of data is another significant contribution of this study. Thus, the study seeks to address the following questions: (i) Did the revised electricity tariff structure lead to a positive or negative change in household consumption patterns? (ii) Did the changes in consumption patterns persist?
This study represents an extension of the study by Nahiduzzaman et al. [2], which investigated the role of the change agent in influencing pro-environmental behavior. However, the present study differs in several key respects. First, whereas the previous study investigated the change in consumer behavior based on direct intervention through change agents, the present study investigates consumer behavior due to increased electricity prices. Second, a scientific attempt is made to understand whether the new tariff structure will positively stimulate the inherent pro-environmental behavior towards conservation. The present study is a novel contribution since no previous study has examined how two factors, i.e., (i) reform in electricity price structure and (ii) the presence of pro-environmental behavior, influence the households’ conservative patterns. Furthermore, the behavioral shift as a consequence of external economic factors explored in the present study provides a unique contribution to the literature, as it represents the first study of its kind to analyze how electricity price changes impact the consumption habits of households in a country situated in the Middle East and North Africa (MENA) region. While a number of past studies have examined the impact of the revised electricity tariff structure on household consumption [15,16], the geographical focus of these was different. Therefore, the findings of this study will help inform sustainable energy-conservative policies.
Extracting the correlation between the input variables in determining the energy consumption and presenting it in the form of a correlation matrix is one of the innovations of this study. In addition, the development of an ELM model that has a high ability to process high-volume data and is able to predict energy consumption related to low-consumption data without over-fitting problems is considered one of the other innovations of this paper.
The remainder of this paper is organized as follows. In Section 2, a detailed literature review is given to highlight economic and non-economic factors impacting energy conscious behavior. Section 3 describes the energy sector of study area (i.e., Saudi Arabia) and the implemented energy efficiency regulations, including efficiency labeling and electricity tariffs. The developed methodology is proposed in Section 4 based on statistical analysis and the ELM. The data gathered are investigated based on the methods proposed in Section 5. In this section, an ELM is trained and used to model the consumption data with respect to the attributes of the households. Moreover, based on the developed ELM model and correlation analysis, sensitivity analysis is carried out in this section to determine the impacts of the attributes on the changes in the electricity consumption by new tariffs. Section 6 provides a comprehensive discussion on the analysis. Section 7 concludes the paper and highlights the findings of the paper.

2. Literature Review

During the past years, research in environmental behavior has identified a vast array of factors that influence energy consciousness [17]. Researchers have highlighted the significance of taking both the internal and external variables into account when explaining energy consciousness attitudes [18,19,20,21]. Internal variables, studied by psychologists, consider factors that are internal to the individual, such as values and attitudes, while external factors, typically examined by economists, consider the environment of the individual and include factors such as income and prices [18,22]. Researchers have regarded energy consciousness as an effective means of achieving ecological sustainability due to its ease of implementation and effectiveness in mitigating environmental impacts [23]. The following sections summarize previous research efforts that have studied the influence of non-economic and economic factors in motivating energy consciousness.

2.1. Non-Economic Factors

Providing households with information about energy consumption can be an effective tool for promoting behaviors aimed at achieving energy savings. It has been established that energy-conscious household members who possess knowledge related to the environment are more likely to achieve household savings [24,25,26]. For example, supplying households with information on achieving energy conservation, also known as antecedent information [27], has proven effective. In [28], the researchers investigated the effectiveness of using “video modeling programs” along with feedback in realizing energy consumption reductions. Researchers have also used feedback information to encourage energy consciousness. For instance, [29] evaluated how customized consumption feedback in conjunction with other information affected energy-related behavior and energy reduction in low-income households. These studies demonstrate the power of tailor-made information in triggering a positive change in consumption behavior among households.
Combining interventions has also been shown to effectively encourage households to conserve energy [30]. For example, [31] investigated the effectiveness of employing incentives and minimal justification techniques towards encouraging energy-conservative behavior of households. Similarly, [30] employed a combination of interventions to examine their effect on direct and indirect energy consumption, energy behavior, and household knowledge. These studies stress the significance of information in conjunction with mixed approaches toward reforming household members’ energy consumption behavior.
Public awareness campaigns are also an effective intervention for encouraging energy-conservative behavior. However, public awareness on matters of energy consumption is low in Saudi Arabia. To study the public appreciation of their electricity bills, [12] developed a questionnaire survey administered among several respondents. The survey result revealed that a majority of the respondents were unaware of the Saudi electricity block tariff system. Further, when asked if they read their electricity bill carefully, nearly half the respondents reported that they did not read their bills (ibid.).

2.2. Economic Factors

While the previous section underscored the importance of information and adopting a combination of approaches to encourage households to conserve energy, this section summarizes past works showing how economic incentives can inspire positive energy conservation behavior among households. Altering behavior is not a straightforward process. According to [32], as most of the energy-related behaviors of individuals are habitual, changing these behaviors can pose a challenge without the action of external factors. The economic incentive is one example of an external factor that can positively alter the behavior of individuals by encouraging them to consume less energy. Numerous past studies support this observation. For example, ([33], p. 2) found economic factors influenced environmental attitudes. Chen et al. [34] found that bill-consciousness positively predicted the intention to conserve energy. Past research has also reported differences in the level of energy consciousness engagement based on gender. For example, [23] found that women were more inclined to behave environmentally than their male counterparts with similar economic status. Silvi and Padilla [35] concluded that individuals with energy consciousness were more prone to respond positively to external factors such as economic constraints. Notably, the study suggests that one approach to limiting excessive consumption is raising block tariffs. In another study by Parzonko et al. [36], it was seen that energy consciousness actions that were either legally imposed or the ones that resulted in financial benefits were more likely to be adopted.
Electricity pricing is one of the most effective tools in influencing the household’s behavior [37,38] that can cap the pace of consumption increase. Studies show that implementing the increasing block tariffs has significantly reduced the residential electricity consumption in the high-income group in China based on regional and household observations [39]. For instance, [15] administered a survey to household members and found that more than half of the households had been encouraged to lower their energy consumption in response to tiered electricity pricing (TEP). Reiss and White [16] found that an unannounced rise in the electricity price was sufficient to prompt a curtailment in the average electricity consumption in households over a short period of time. However, other studies have shown that several factors have to be at play to affect positive change among households. For example, ([40], p. 1) found that greater public awareness of the tiered pricing of household electricity in combination with other factors strongly influenced reforming the inefficient electricity consumption pattern of households. A nationwide study in Nepal showed that the implementation of a peak-demand tariff has a positive impact on rural electrification. It improves the load factor at the system level and the load distribution at the household level [41].
In their review of the different sets of factors influencing electricity consumption in households, [42,43] found that the contextual factor having the most significant impact on household energy consumption was the energy price. Past works have also demonstrated that electricity price reforms can have uneven effects between and within households. For instance, ([44], p. 9) concluded that households at different income levels displayed different attitudes in response to price reforms. In Turkey, ([45], p. 21) found that low-income households found it harder to adapt to electricity price reforms. Price reforms can also have varying impacts among different genders, as illustrated by ([46], p. 1). It was concluded that energy-saving awareness increased more among women than men following the implementation of TEP.

3. Study Area: Saudi Arabia

Two governmental bodies are primarily responsible for the energy sector of the country, including the Ministry of Water and Electricity (MOWE) and the Ministry of Petroleum and Mineral Resources (MOPM) [47]. The responsibility of MOWE includes establishing policies for the electricity sector and overseeing the sector’s private investment. Another agency, the Saudi Electric Company (SEC), has restructured the electricity tariff in a bid to lower energy demand. Further, MOWE, in an attempt to lower peak demand, has established limits for the maximum amount of electricity that can be delivered to large power consumers [48]. The National Energy Efficiency Program (NEEP) introduced a range of programs to curb energy consumption [11]. The notable programs include energy labeling for electrical appliances, energy auditing of various types of facilities, and raising energy efficiency awareness, which are discussed in the following subsections.

3.1. Energy Efficiency Regulations

Saudi Arabia has emphasized the significance of energy efficiency [5,49]; For example, the Saudi Arabian Standards Organization (SASO) developed standards pertaining to the utilization of insulation material in newly built commercial buildings [48]. Moreover, as of 2014, new construction is expected to have wall and roof thermal insulation installed, among other conditions, before electrical service from the electricity provider is connected to the building [5]. Many research studies have highlighted the significant impacts of thermal insulation and high-efficiency AC units on electricity consumption [1].

3.2. Energy Efficient Labeling

In 2010, the Saudi Standards, Metrology and Quality Organization (SASO), a governmental body, launched an “energy-efficient label” regulation aimed at reducing electrical energy consumption [12]. This initiative is effective since a considerable amount of energy can be saved by replacing energy-inefficient appliances with more efficient ones. These energy efficiency labels are affixed to various appliances and provide consumers with useful information about the appliance’s energy consumption. They thus provide a means of distinguishing classes of appliances that demand the largest amount of energy. These labels can display technical information and provide a comparative index to assist consumers in making more informed purchasing decisions. Figure 1 presents a sample energy efficiency label [48].

3.3. Electricity Tariffs/Block Rate Structure

Large subsidies encourage lavish energy consumption [48,50] and serve as a deterrent to investment in energy efficiency [5]. Large subsidies also impose considerable financial strain on governments as the cost of electricity generation increases [44]. While the population of Saudi Arabia has historically enjoyed large subsidies on electricity, reforms to the electricity tariff structure during the past several years have been undertaken to moderate excessive energy consumption. In particular, before 1984, a single flat-rate tariff was applied to residential and industrial customers, amounting to 0.05 SAR/kWh and 0.07 SAR/kWh, respectively. The subsequent decades saw the adjustment of the residential consumption tariff from a single flat-rate tariff to a three-tier tariff, while the industrial consumption tariff remained fixed. In 1995, the industrial consumption tariff was adjusted to a two-tier tariff system, with 0.10 SAR/kWh being charged for consumption exceeding 2000 kWh/month. Simultaneously, the maximum electricity price rate for the residential consumption tariff was increased from 0.15 SAR/kWh to 0.20 SAR/kWh. In 2000, the residential consumption tariff was revised to include 11 tiers, with a minimum and maximum electricity price rate of 0.05 SAR/kWh and 0.38 SAR/kWh, respectively. On the other hand, the industrial consumption tariff was adjusted to the former single flat-rate tariff system with a rate of 0.12 SAR/kWh. After seven months, the maximum rate of residential consumption tariff was lowered to 0.26 SAR/KWh, while maintaining the same number of tiers [48]. Table 1 presents a comparison of the old and current residential tariff of Saudi Arabia.

4. Methodology

The present work is a longitudinal study conducted in Saudi Arabia over four years, beginning in April 2016 and ending in May 2020. The study assessed and compared the electricity consumption in households during three key periods:
  • Pre-revised tariff year (2016 and 2017);
  • Revised tariff enforcement year (2018); and
  • Post-revised tariff year (2019 and 2020).
The main reason for dividing the analysis into these periods was to facilitate the process of analyzing the effectiveness of the newly implemented electricity pricing.
For this study, the unit of analysis was a single household. In total, the researchers managed to secure the energy consumption data of 73 randomly selected households based in the Eastern Province of Saudi Arabia. Generally, four major styles of housing units can be found in Saudi Arabia. These include traditional housing, villas, apartments, and other housing units [52]. For the present study, the primary housing unit type was apartment units. Given that the most frequent type of housing unit in the country is apartment units [53], the present study’s sample constitutes a representative portrayal of a typical Saudi household. The areas of the dwellings ranged from 51 m2 to more than 400 m2. All the dwellings were relatively new construction, with the oldest dwellings being six years. These dwellings incorporated AC units, owing to the hot climate that prevails in the region, with an average temperature ranging from 30 to 47 °C and from 11 to 20 °C in summer and winter seasons, respectively [54]. Various AC-unit configurations were utilized by the housing units occupied by the households, including split units, window-type, and a combination of both.
Electricity consumption data for each household participating in the study were retrieved from a web portal maintained by the electricity provider. Since the original unit of measurement of the retrieved data was in kWh, it was converted to kWh per capita by dividing the total kWh by the corresponding number of household members. This conversion ensured that a uniform measure was employed to compare the households since the household size varied across the sampled population.
A paired sample t-test was performed using IBM SPSS Statistics 22. This statistical method was employed to compute the average change in electricity consumption and the significance of the change between any two given years. A positive or negative value indicates either an increase or decrease in electricity consumption, respectively, between the two years. In addition, a machine learning-based model called ELM was developed to predict the electricity consumption profile based on a household’s attributes.
Various artificial intelligence (AI) techniques can be used to predict usage in power and energy systems. However, the critical point is to choose the ideal method based on the intended application and the type of data used. Given that the performance of AI-based techniques is highly dependent on the type of data used, the method chosen should be such that it does not suffer from data shortages or high data volumes. The data used in this study have a small number of samples, making it challenging to model input variables in the training process. Accordingly, to address this problem, a machine learning-based technique, i.e., the extreme learning machine (ELM), was proposed in this paper for data processing and electricity consumption estimation.
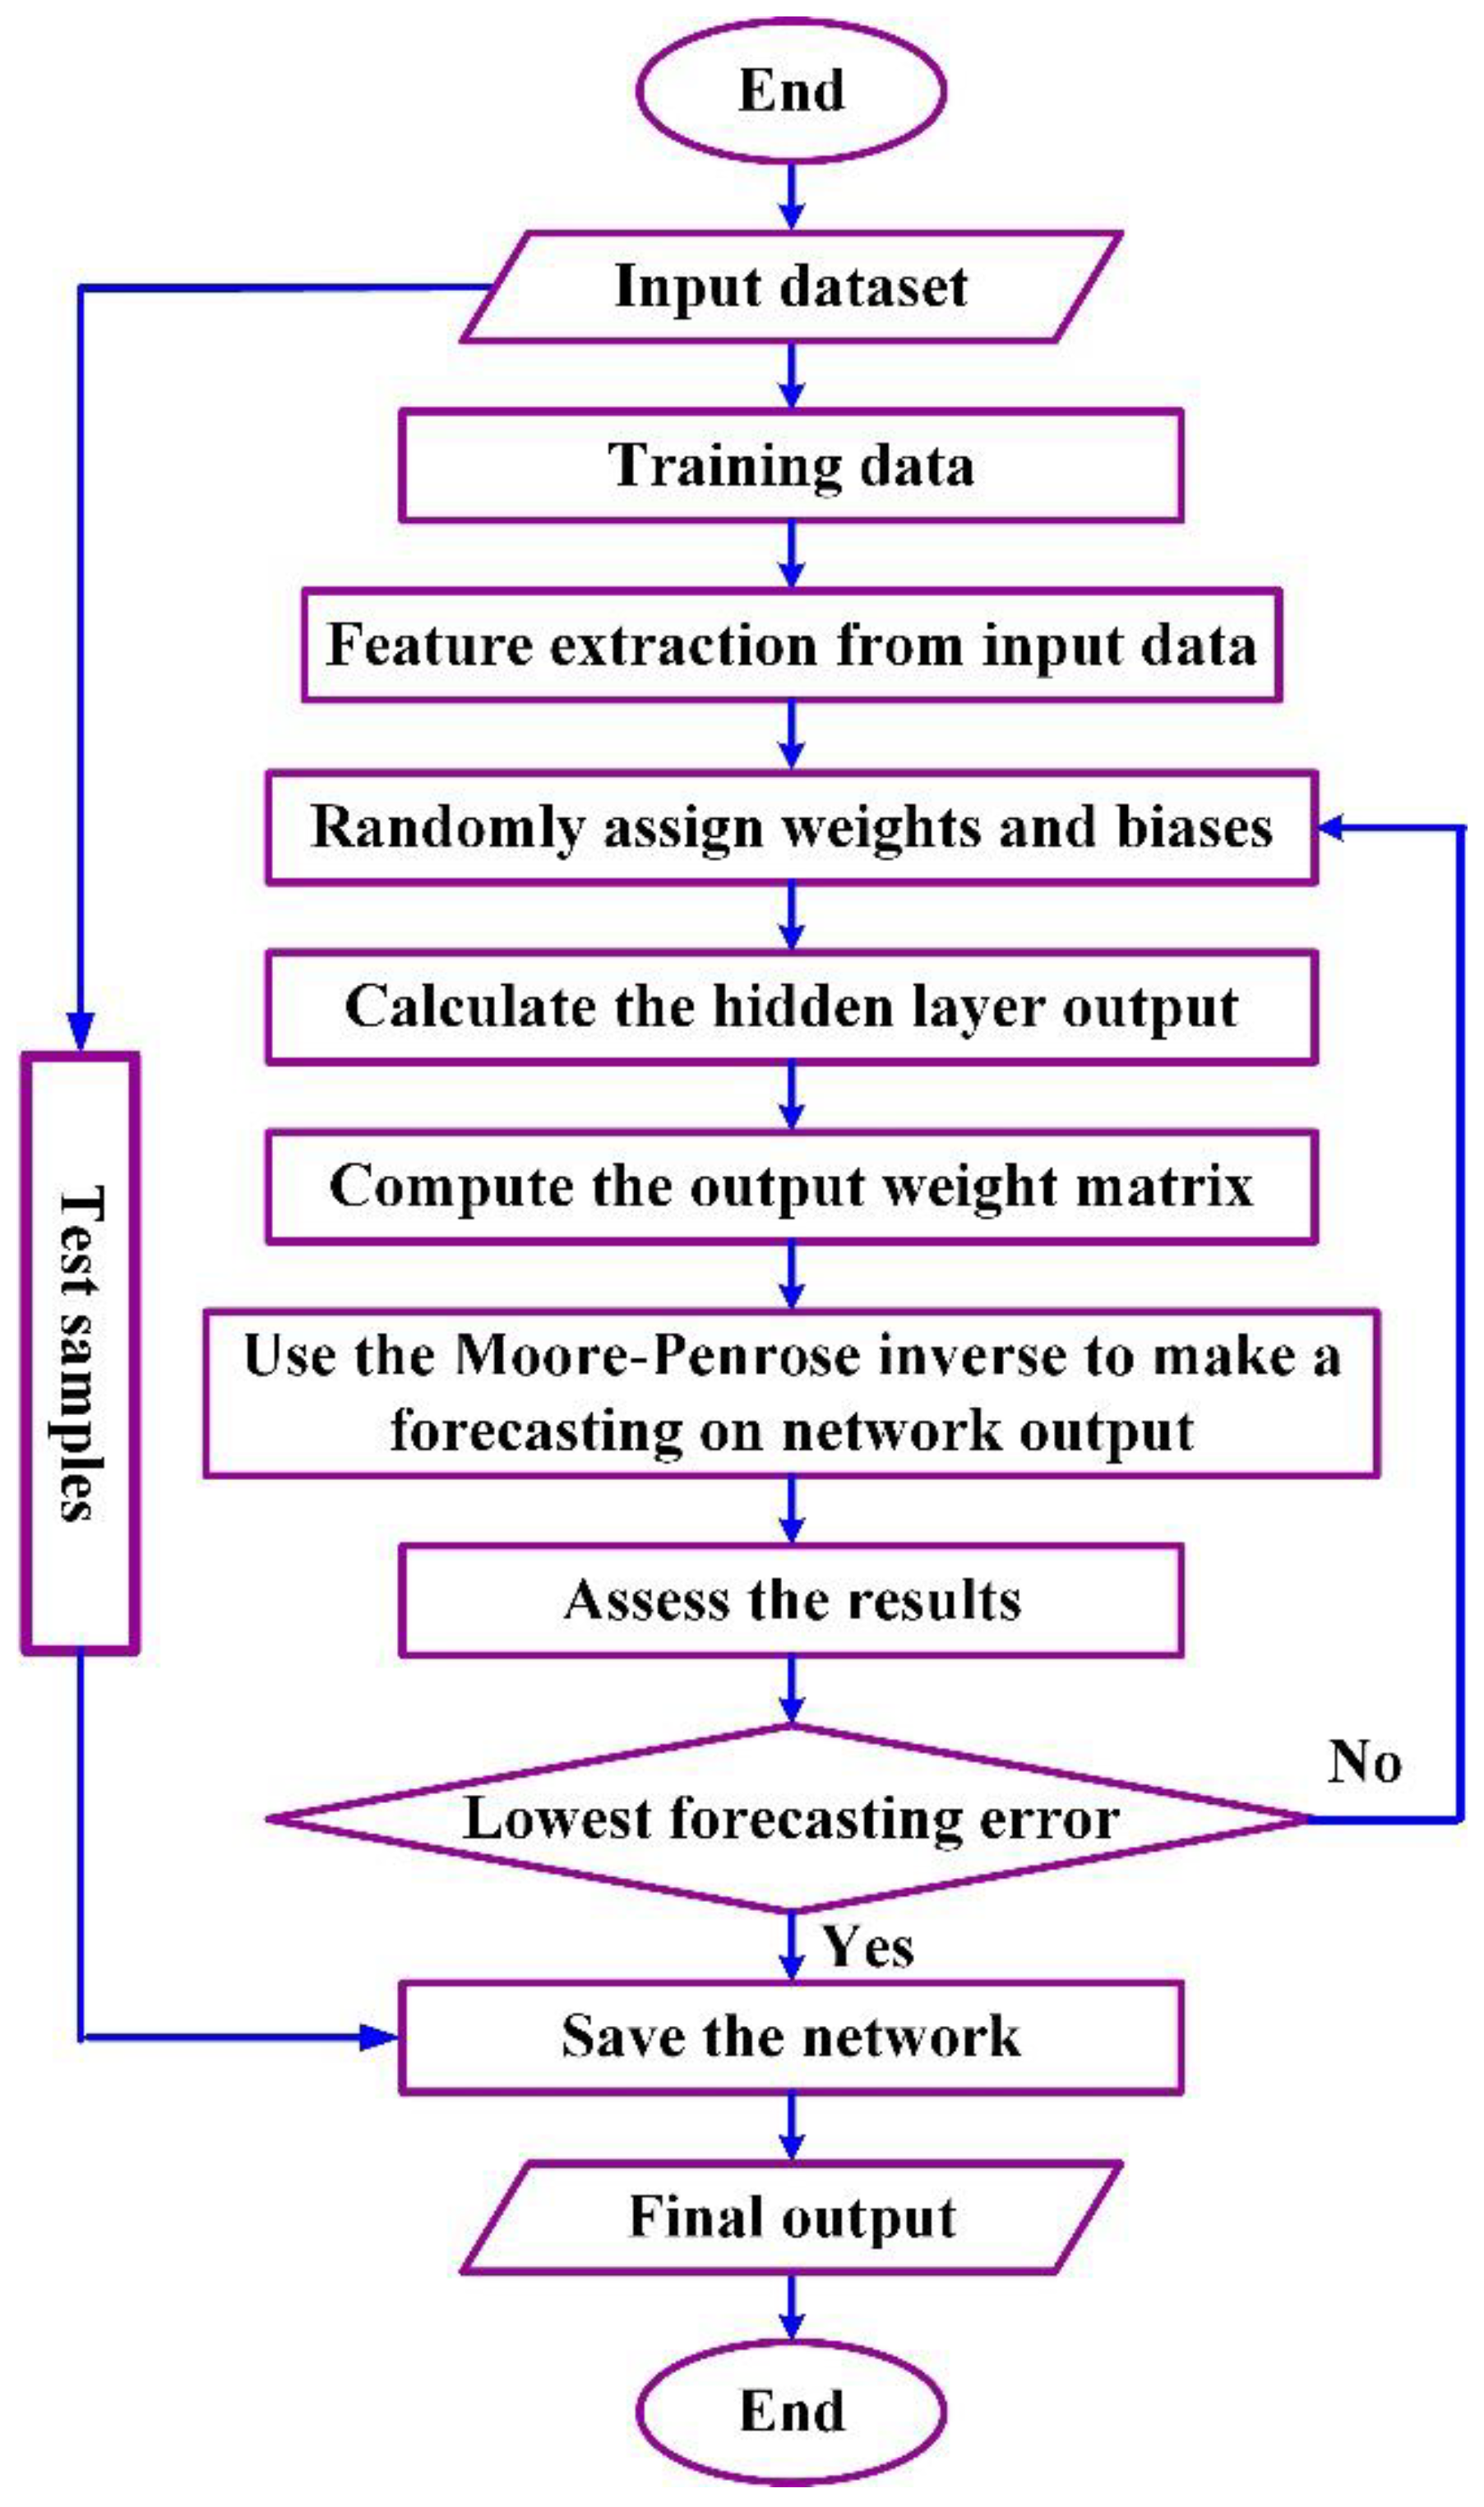
The overall algorithm for analyzing the impacts of tariffs on the changes in energy usage and modeling the consumption data based on the households’ attributes is summarized in Table 2. Each step is discussed in detail in Section 5 and Section 6. Implementation of the extreme learning machine (ELM) techniques to model the data is depicted in the flowchart given in Figure 7.

Extreme Learning Machine (ELM)

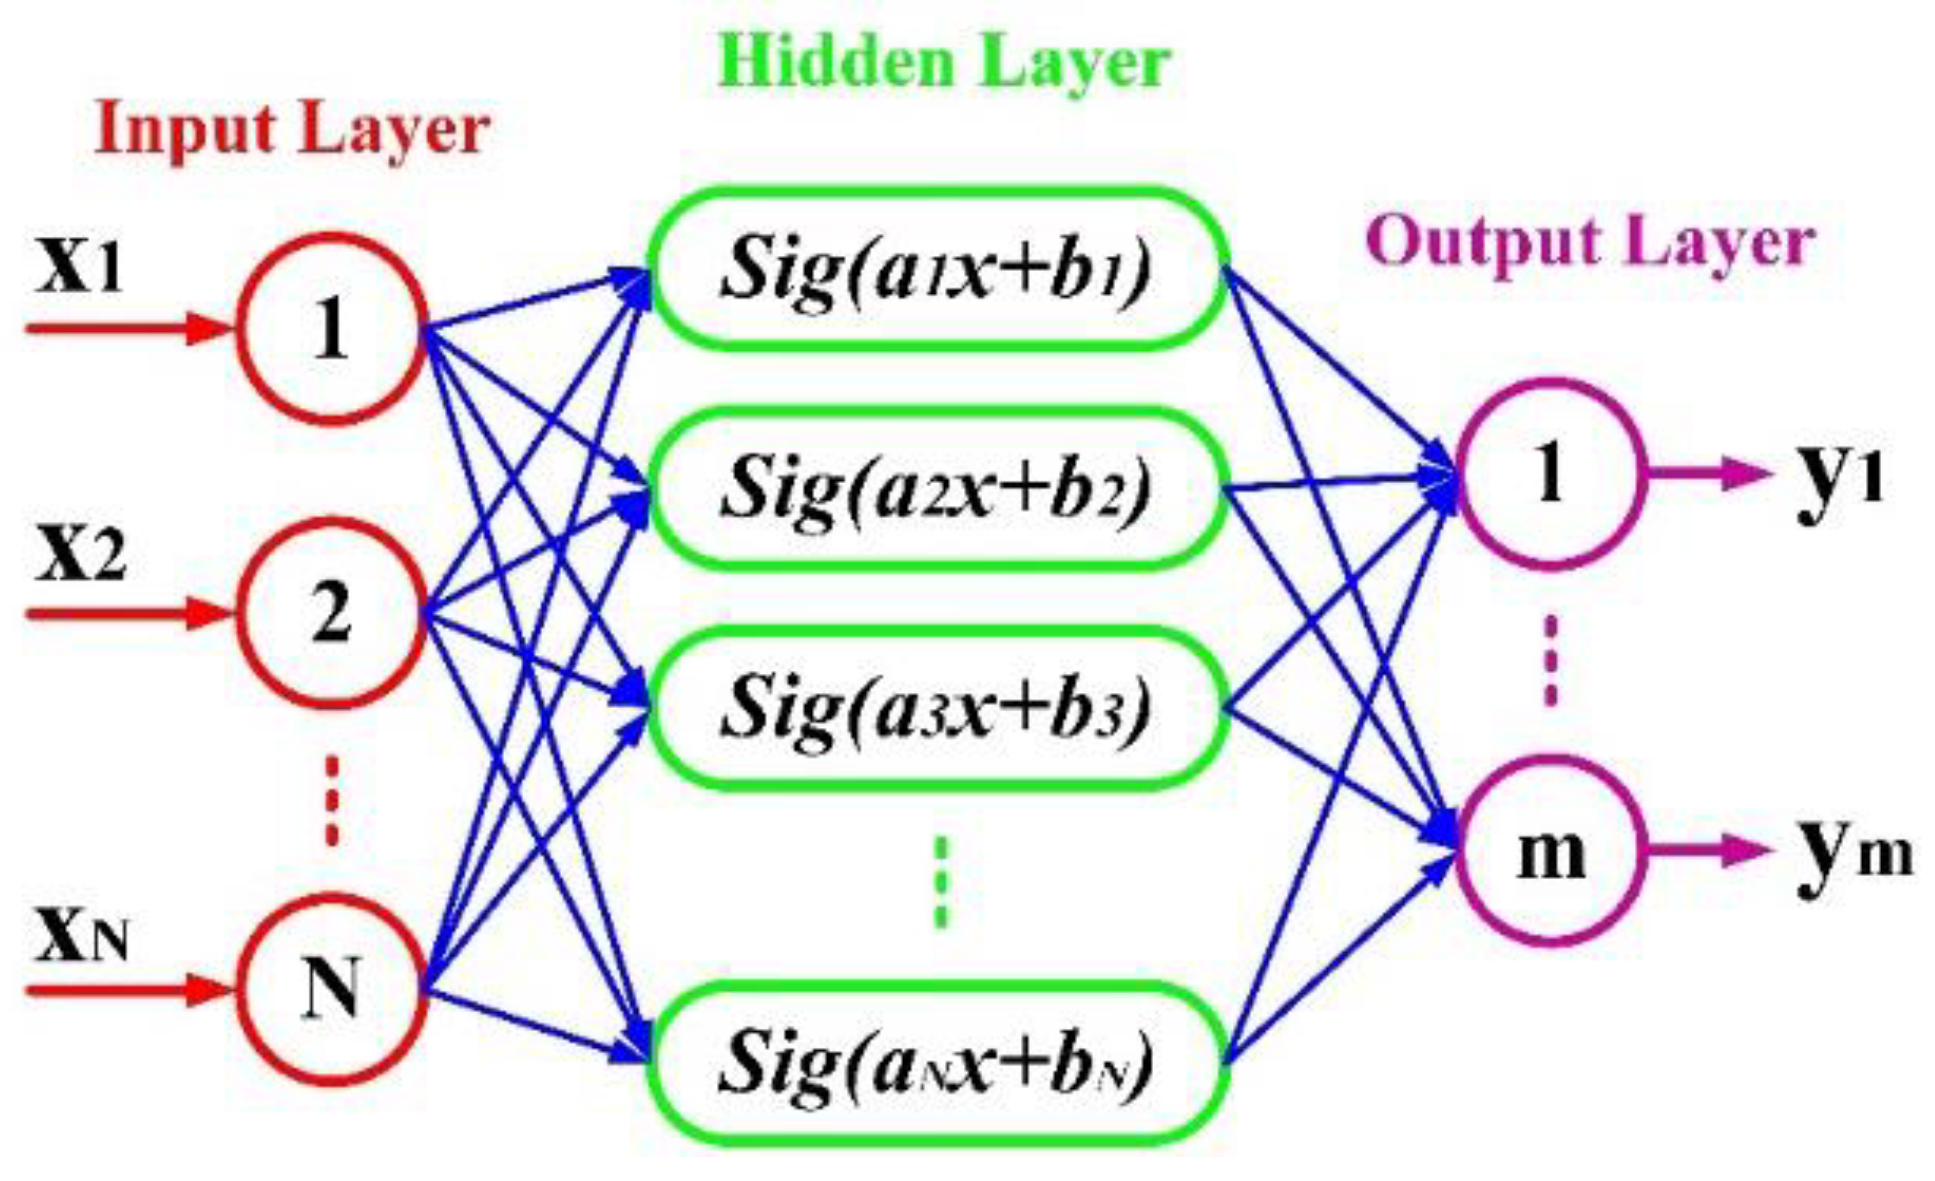
The ELM is one of the machine learning applications first introduced in 2006 and based on modifying the conventional single hidden layer feed-forward neural network [55]. Classification, prediction, and estimating the relationships between input variables and output targets are essential applications of ELM. Unlike some machine learning procedures and artificial neural network algorithms, the ELM training process is fast. In addition, hidden thresholds are randomly selected during the network training course, and the output weight is evaluated without duplicate calculations. As Figure 2 shows, the ELM has a simple structure consisting of input, hidden, and output layers [56]. The high performance of ELM in low-dimensional data processing and non-linear activation are other prominent features of this method. The ELM training process is based on the gradient descent-based back-propagation training algorithm [57].
In the ELM structure, after assigning the network parameters, the output matrix for calculating the hidden layer for the input weight vectors x i = x i 1 , x i 2 , , x i N T is defined as follows [57]:
i = 1 N ˜ β i f i x i = i = 1 N ˜ β i f a i . x j + b j = t j ,               j = 1 , , N
where b i demonstrates the bias of the hidden layer, and i shows the number of hidden layer neurons. The input and the i-th hidden layer nodes are connected by the weight vectors a i = a i 1 , a i 2 , , a i n T . The output layer neurons are also connected to the i-th hidden neuron by the output weight vectors β i = β i 1 , β i 2 , , β i n T . In the ELM architecture, f . represent the activation function and computed as:
f a i . x j + b j = 1 1 + e a i . x j + b j , i = 1 ,   , L , j = 1 ,   ,   N
In this formulation, Equation (1) can also be written in the following form [58]:
H β = T
with
H = f a 1 . X 1 + b 1 f a N ˜ . X 1 + b N ˜ f a 1 . X N + b 1 f a N ˜ . X N + b N ˜ N × N β = β 1 T β N T N × m                 T = t 1 T T N T N × m
where H , β, and T are the hidden layer output matrix, output weight matrix, and the target matrix, respectively. Finally, the output weight can be computed by employing the Moore–Penrose generalized inverse of H , as follows [58,59]:
β = H ϯ T

5. Study Results

The following section presents the findings of the paired sample t-test. The subsequent section provides the details of the ELM model.

5.1. Paired Sample t-Test

For the paired sample t-test, several assumptions have to be met. For the household dataset used in the present study, the electricity consumption represents a continuous variable, the electricity consumption during the different periods are dependent, and the dataset is normally distributed. Table 3 presents the electricity consumption difference between the months of 2016 and 2017, before the revised tariff was enforced (it should be noted that household electricity consumption records for the months prior to April 2016 were not available and were thus omitted from the study). In general, though mostly not significant, it can be observed that there was an average increase in electricity consumption between the years 2016 and 2017 (an average of 47 kWh per capita). Thus, there was a general increasing trend in household electricity consumption before implementing the revised tariff.
Table 4 presents the electricity consumption difference between 2017 (the pre-revised tariff year) and 2018 (the revised tariff enforcement year). Except for March and October, all the months saw a reduction in average electricity among the participating households. Moreover, significant reductions were observed in five months, including May, July, September, November, and December. It represents a dramatic change in household electricity consumption patterns compared to the previous year. More specifically, there was a near consistent reduction in the average electricity consumption across most months (namely, –157 kWh per capita). This finding confirms the impact of the new tariffs on energy consumption reduction. Yet, it is noted that the reduction amount is also influenced by other factors, including tax rates and prices of different energy fuels.
Table 5 presents the electricity consumption difference between 2017 (the pre-revised tariff year) and 2019 (the post-revised tariff year). This analysis provides insights into the extent to which the revised tariffs have effectively promoted conservative behaviors a year after their implementation. As can be observed from the table, a consistent reduction in electricity consumption has been achieved across all the months (an average decrease of 322 kWh per capita). In addition, except for June, October, and December, the reduction in electricity consumption was significant, further reinforcing the argument that financial pressure was an effective strategy for stimulating desirable energy consumption behavior among households.
Figure 3 presents the average per capita electricity consumption trends of the households across the four years. It is evident from the graph that the overall average per capita electricity consumption has been steadily decreasing ever since the new tariff pricing was introduced. The findings indicate positive development in the electricity consumption pattern of households, with mixed results observed between 2017 and 2018 (where statistically significant drops in electricity consumption were seen in 5 of the 12 months) and followed by a substantial reduction in electricity consumption in 2019 compared to 2017. Clearly, a delay is expected to be seen between adopting the new tariffs and the reduction in consumption. Although this gap between the increase in electricity price and conservative behavioral change can be viewed as a learning period, it may also be due to the long-run effects of energy efficiency. While house residents were developing an understanding of the new tariff structure and realizing its effects in financial terms, per capita consumption could also be influenced by the minimum energy efficiency standards mandated by the Saudi Energy Efficiency Center, particularly for thermal insulation and ACs since 2016 [11]. Moreover, the year 2018, when the revised tariff structure was introduced, can be regarded as the observatory year, when the households had begun to make the necessary adjustments for the future. This is particularly visible in the months after summer in the so-called observatory period, when there is a reduction in electricity demand.

5.2. Modeling the Consumption Data

An ELM model was developed based on the households’ electricity consumption data and the households’ attributes (summarized in Table 6) after reducing the size of the available data by means of a machine learning algorithm. For the study period (starting in April 2016 and ending in May 2020), there were 50 monthly electricity consumption records for each household. As noted, the electricity consumption data were divided into three distinct time intervals, namely, (1) pre-revised tariff year (2016 and 2017), (2) revised tariff enforcement year (2018), and (3) post-revised tariff year (2019 and 2020).
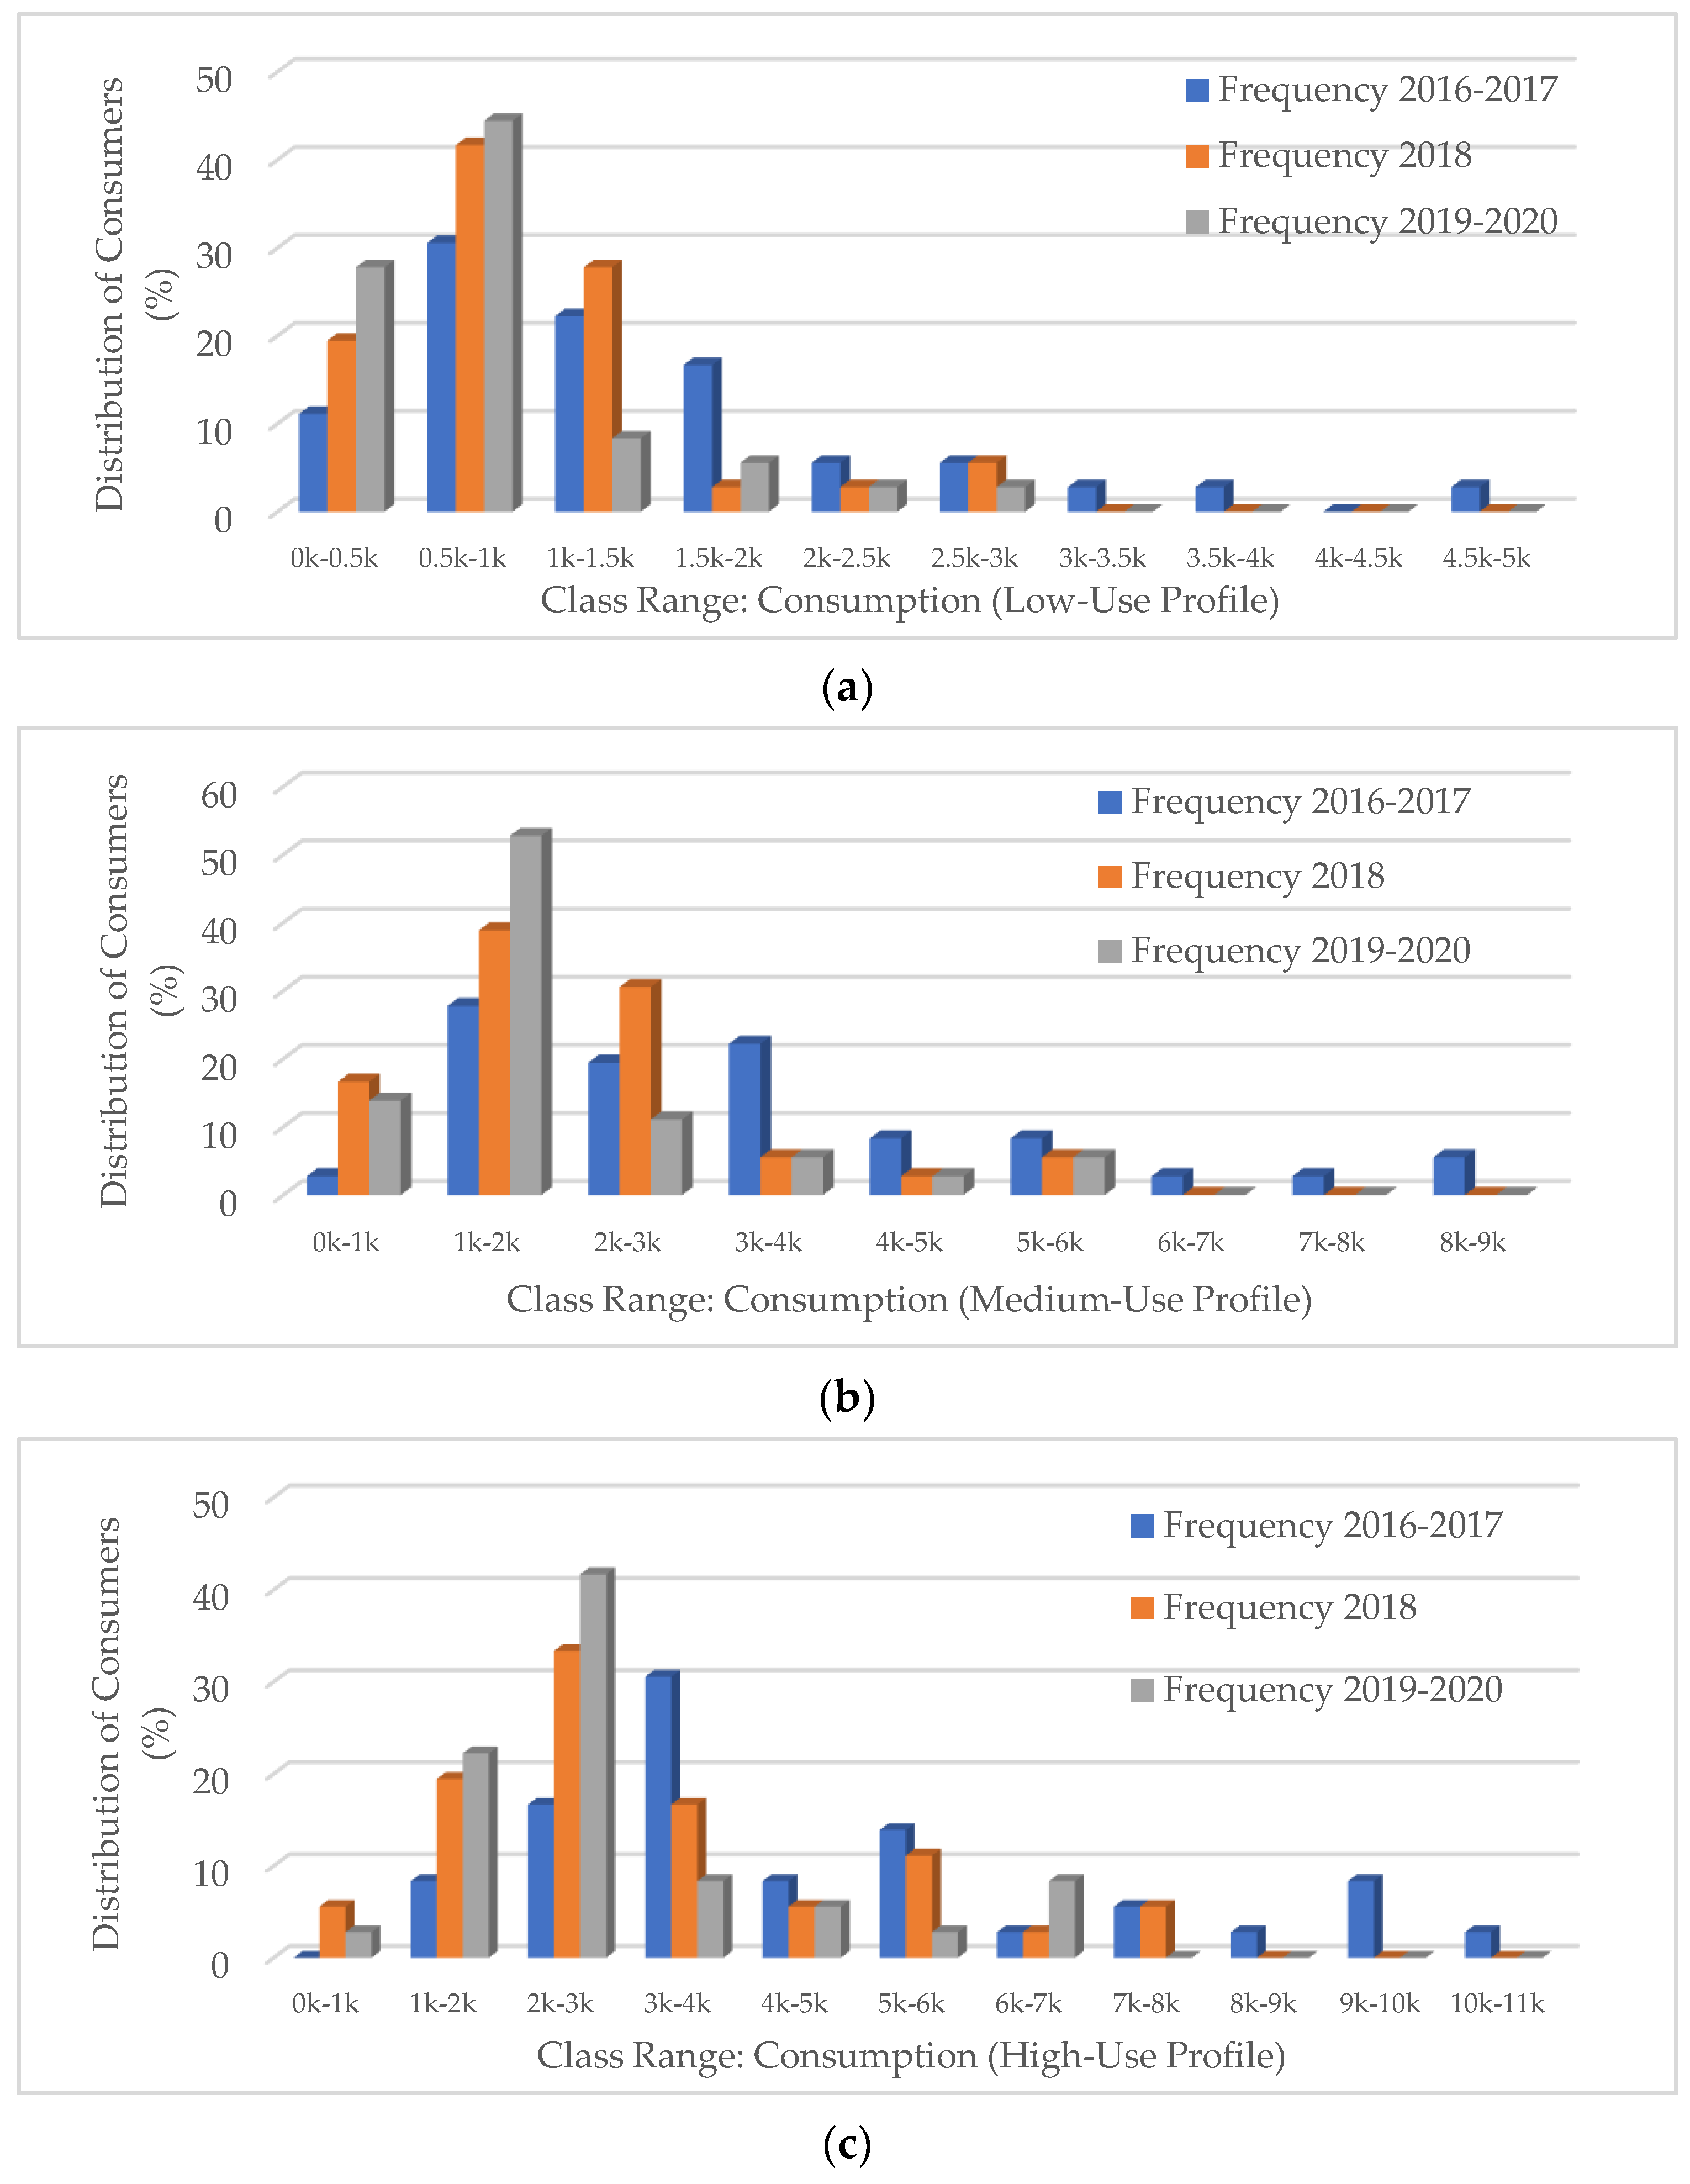
The modeling of the electricity consumption data entailed a sequence of three steps. First, the size of the large dataset was reduced. Then, using Linkage Ward’s method, the hierarchical clustering algorithm was employed to reduce the dataset to representative cluster centroids [60,61]. In particular, for each household, three different clusters were assumed in each of the three different time intervals. These three clusters included low, medium, and high consumption categories. As a result, three representative clusters were computed for each time interval. Hence, each household was associated with nine electricity consumption figures instead of all 50 figures, thereby greatly simplifying the computation. The distribution in the cluster centroids among different class ranges is shown in Figure 4 using histogram presentation for different profiles. Next, the computed clustered electricity consumption figures were modeled using the ELM procedure.
It should be noted that qualitative terms (e.g., ownership type) in the dataset were coded into quantitative values to facilitate the analysis. Table 6 presents a summary of the various attributes of households. Finally, the correlation between the clusters of electricity consumption and the building attributes was computed pairwise to assess the mutual relationship between the variables. The proposed method for modeling the consumptions and the preliminaries are described in detail in the following section.
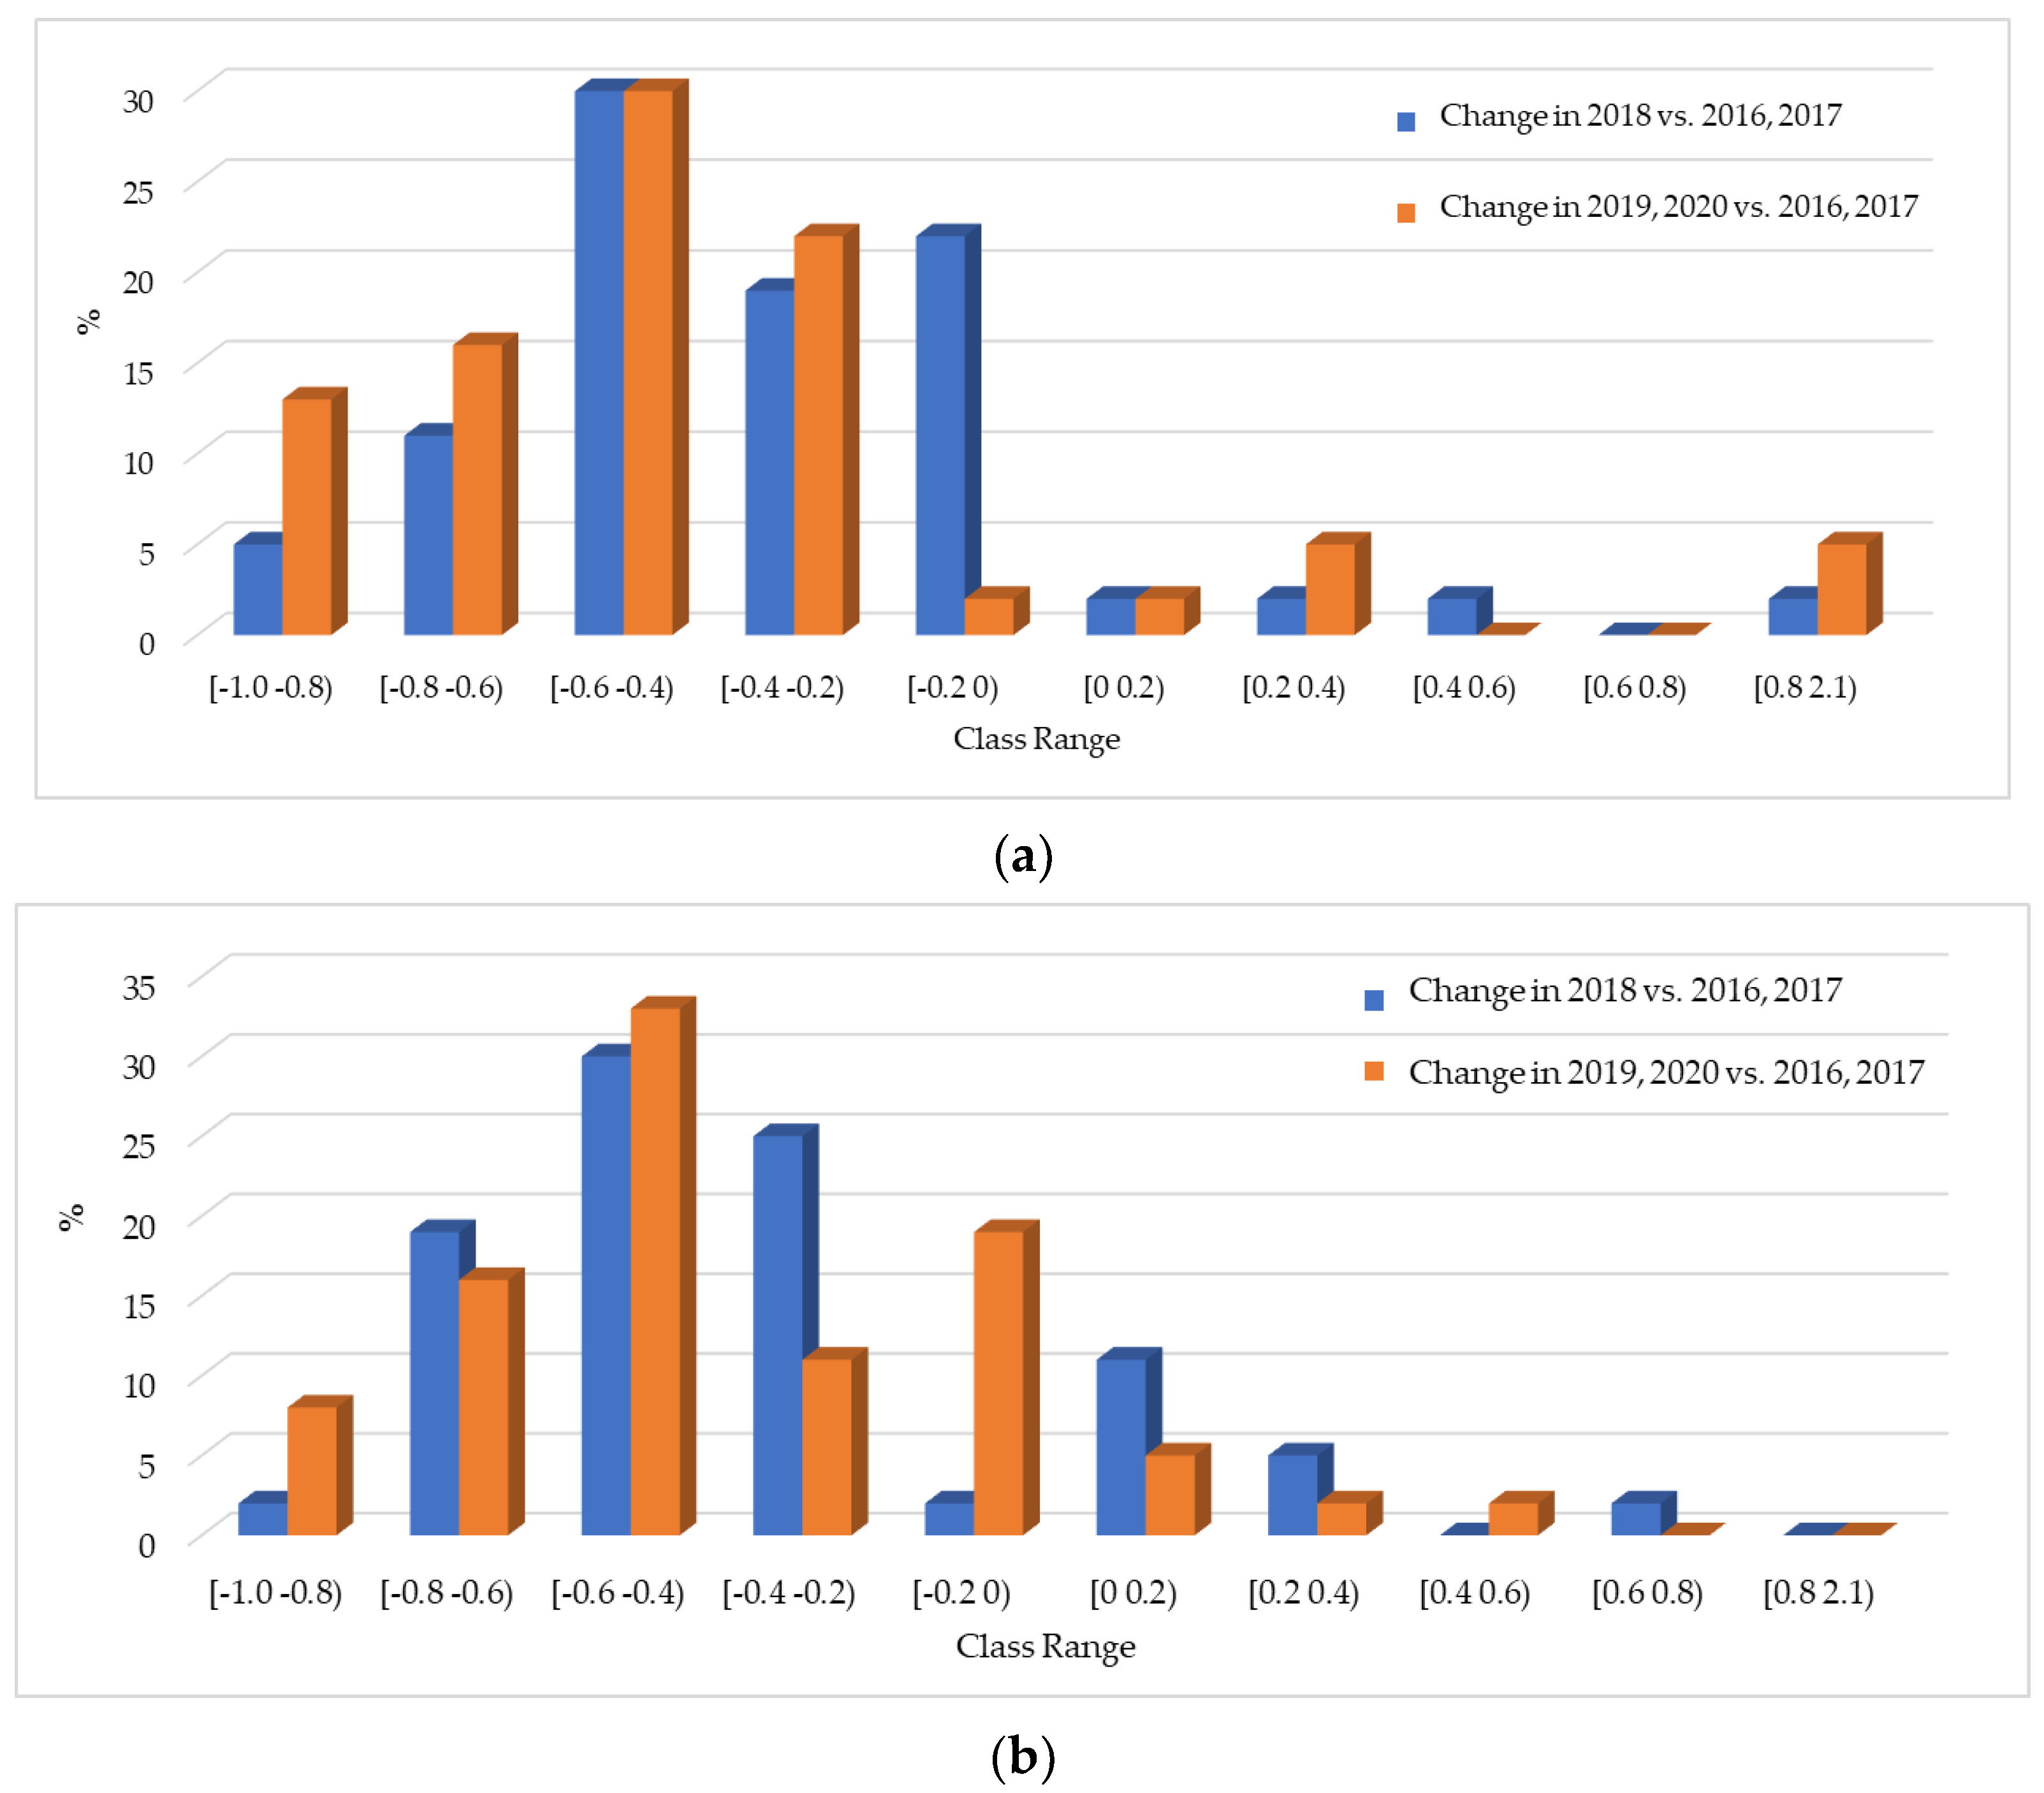
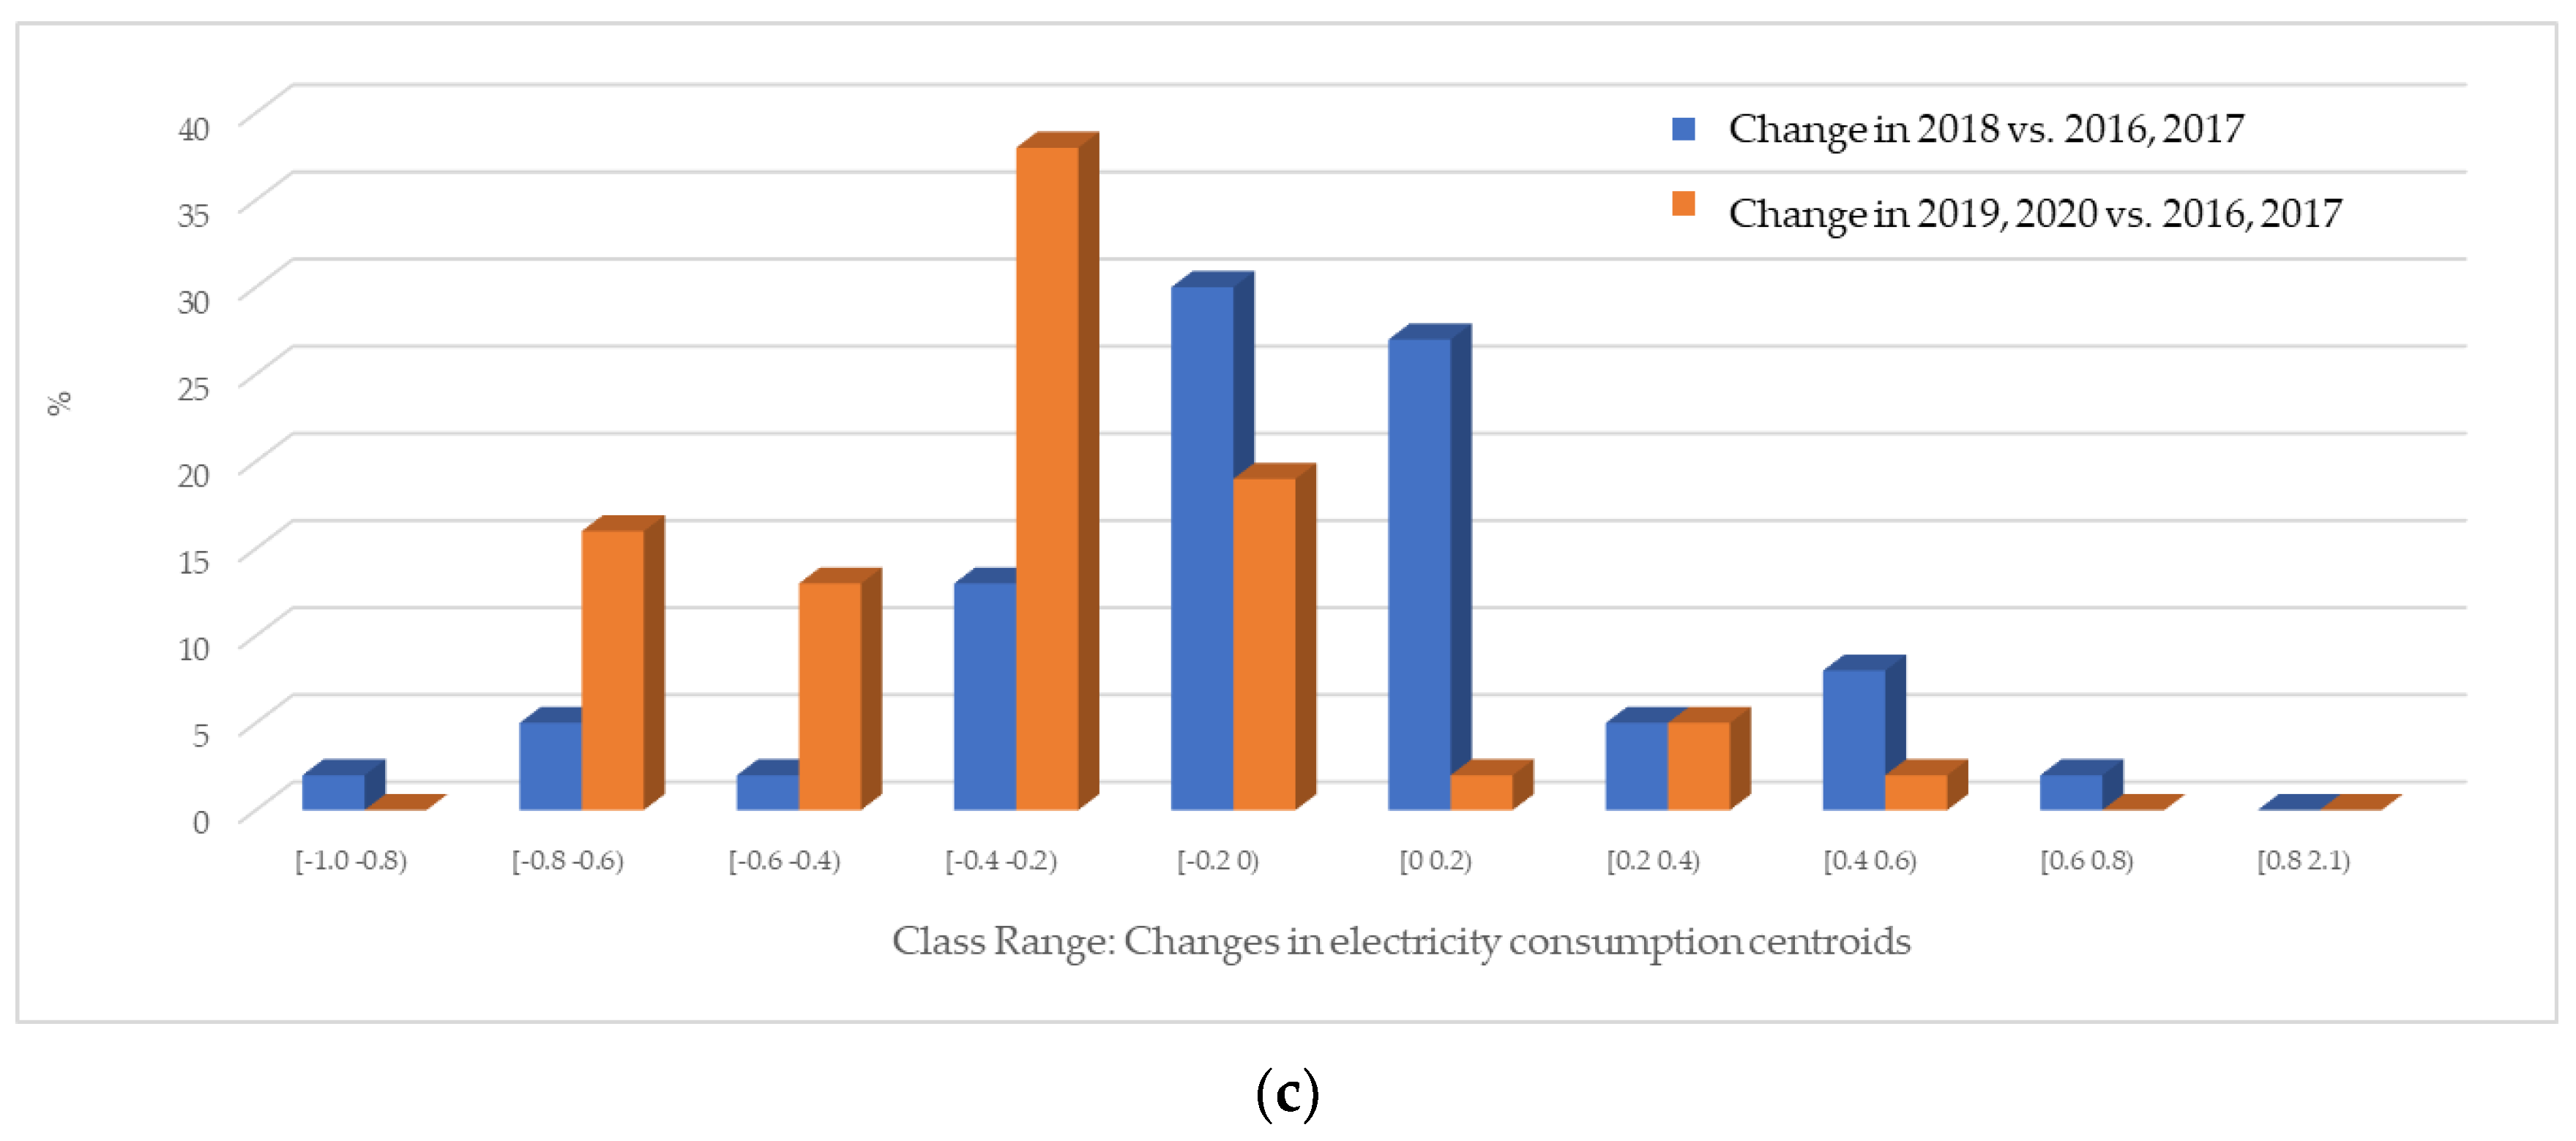
The centroids calculated by clustering provide an overview of the variation in electricity consumption during different periods. The relative deviations can be calculated as E T I 2 E T I 1 / E T I 1 and E T I 3 E T I 1 / E T I 1 , where E T I 1 is the electricity consumption in the first time interval (i.e., years 2016–2017), E T I 2 is the electricity consumption in the second time interval (i.e., the year 2018), and E T I 3 is the electricity consumption in the third time interval (i.e., 2019–2020). The relative changes in the electricity consumption pattern at different time intervals are calculated. Based on that, the distribution in the relative changes is displayed in Figure 5 using histograms.
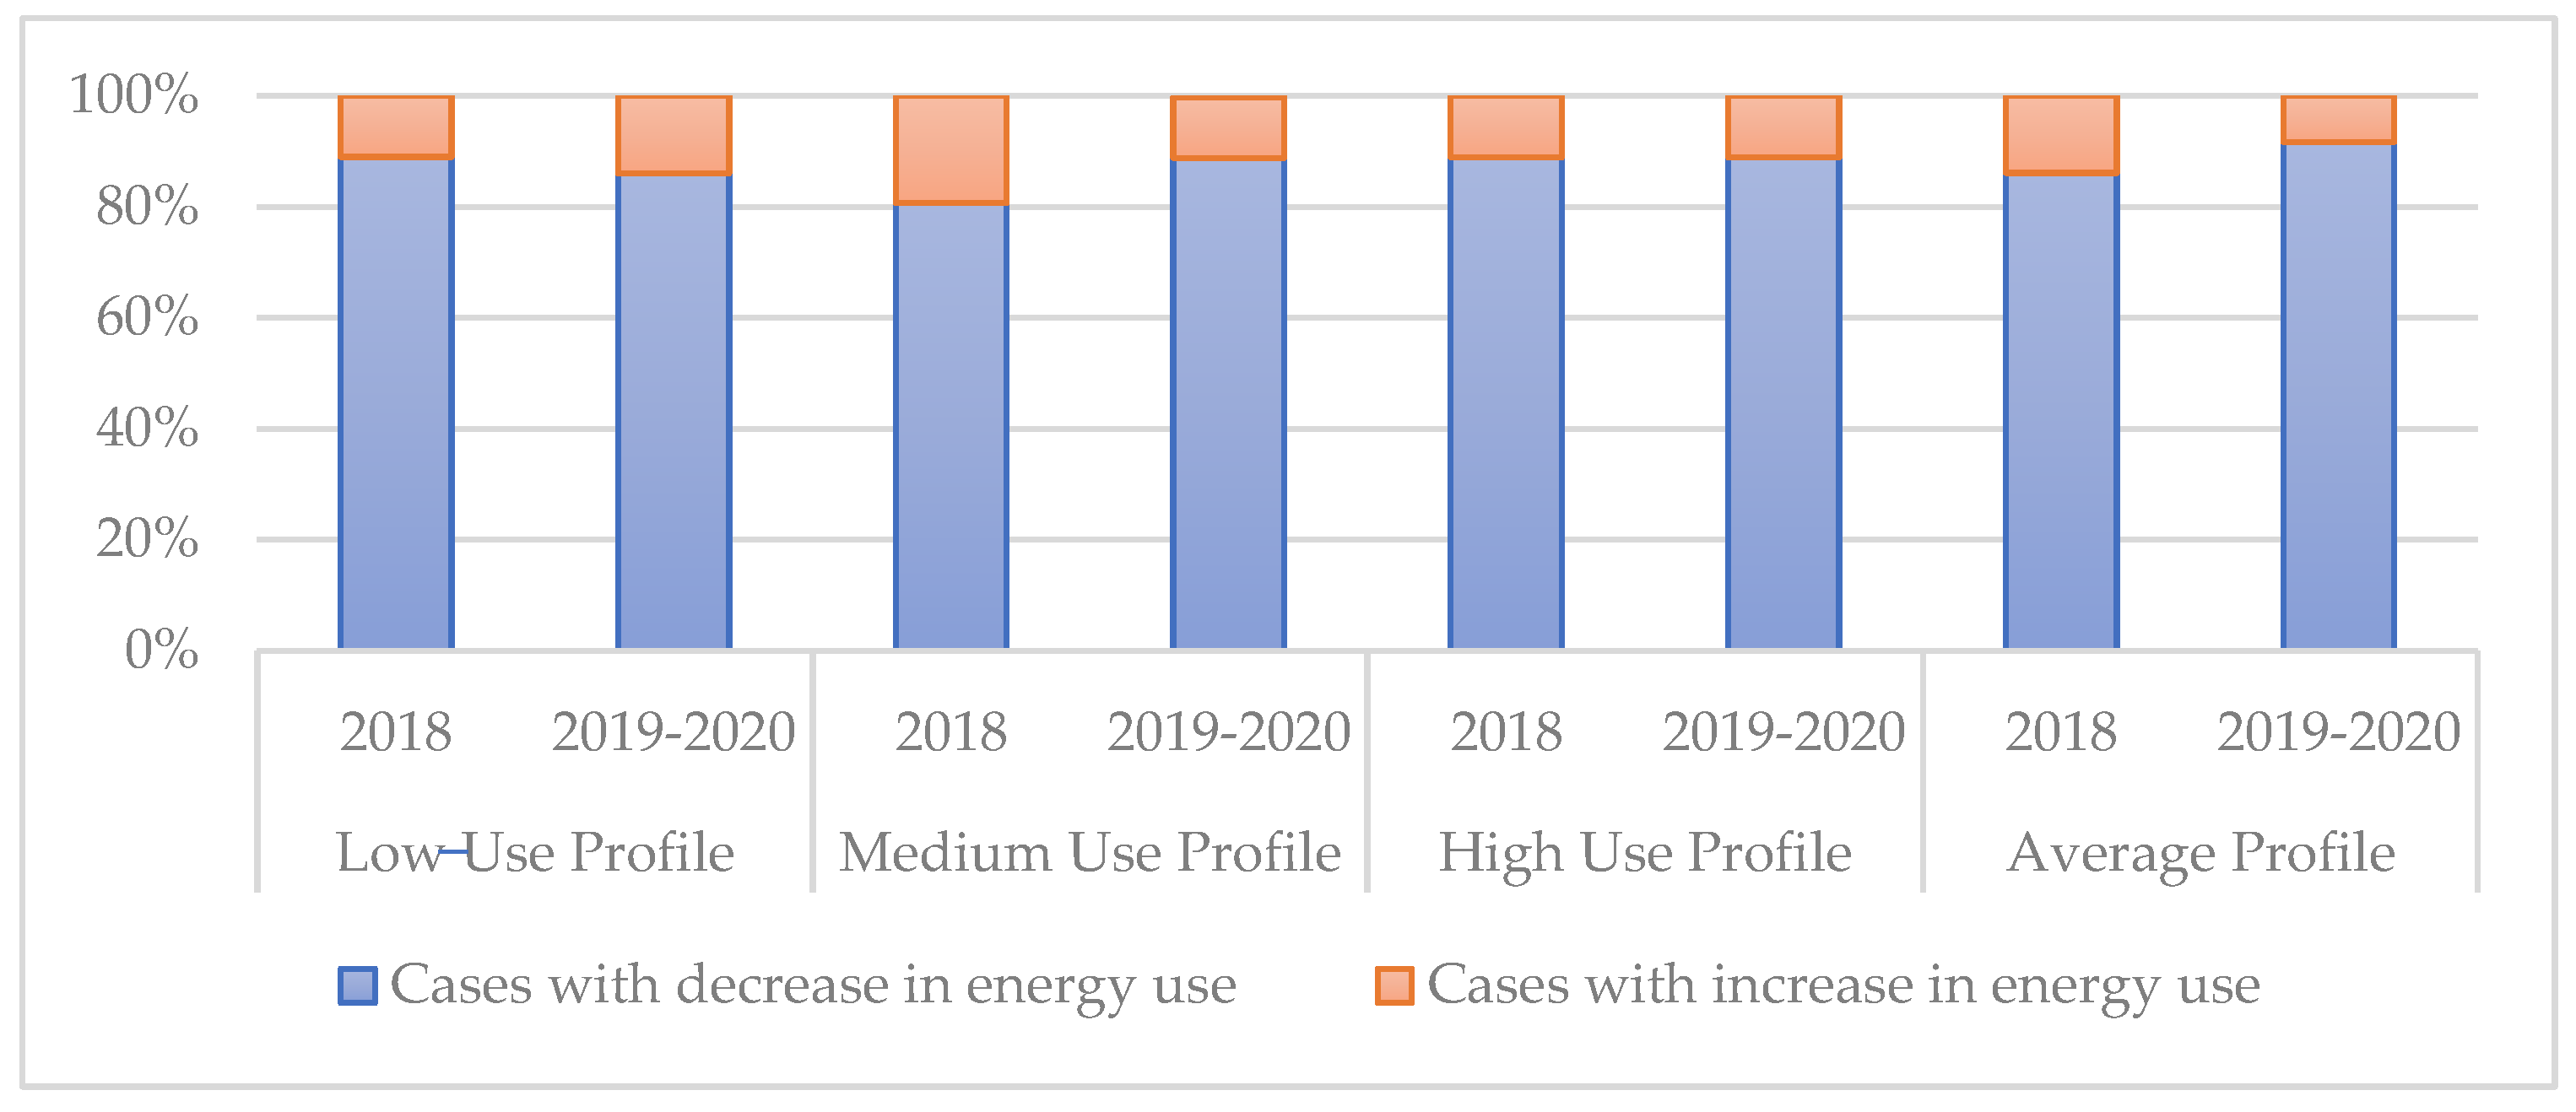
The changes in electricity consumption are computed for the time intervals 2018 and 2019–2020 with respect to the electricity consumption in 2016–2017, based on the variation plots given in Figure 5. The results are also summarized in Table 7. A negative value indicates a drop in electricity consumption between two given intervals. Conversely, a positive value indicates an increase. For example, the low consumption profile of electricity usage was decreased by more than 50% in 2018 compared to the time interval 2016–2017 in 39% of the cases.
Similarly, it can be seen that in almost 36% of the cases, the “medium” electricity consumption profile was decreased by more than 50% in 2018. The change in electricity consumption is summarized in Figure 6 for different time intervals and usage profiles. In at least 80% of the cases, electricity consumption decreased compared to 2016–2017.

5.3. Data Modeling and Sensitivity Analysis Using ELM
Based on the clustered consumption profiles at the three different time intervals (i.e., 2016–2017, 2018, and 2019–2020), a machine learning-based model called ELM [62,63] was developed to estimate the electricity consumption in a household, based on attributes listed in Table 6.
The inputs of the ELM model are the attributes of a household in question, whereas the outputs of the model are the three different electricity consumption levels (i.e., low, medium, and high) for a specific time interval (i.e., 2016–2017, 2018, and 2019–2020). The designed ELM model was trained for different time intervals separately to increase the estimation accuracy. The dataset was divided into two groups: train and test; 70% of the data was utilized for network training and the remainder for testing the network. The developed ELM network was employed to estimate the measured values as the targets. The ELM network performance is evaluated using various indicators such as correlation coefficient (R) in Equation (6), mean square error (MSE) in Equation (7), and root mean square error (RMSE) in Equation (8). The ideal state for network operation is possible with maximum R values and minimum values for prediction error, i.e., MSE and RMSE indicators, defined as follows:
R = i = 1 N X i X ¯ Y i Y ¯ i = 1 N X i X ¯ 2 i = 1 N Y i Y ¯ 2
MSE = 1 N i = 1 N X i Y i 2
RMSE = 1 N i = 1 N X i Y i 2
where X i and Y i are the i-th measured target value and the ELM output, respectively. X ¯ and Y ¯ represent the mean of the measured target values and the ELM outputs, respectively.
After designing the ELM network and completing the training process, the network is saved as a black box containing energy consumption behavioral patterns. Figure 7 shows the step-by-step implementation process of the ELM technique used in this study.
Figure 7. Step-by-step implementation process of the ELM technique.
Energies 16 01458 g007
Figure 8 presents examples of the predicted energy consumption related to the low consumption data by the ELM in the form of regression. The results suggest that the ELM network can forecast the energy consumption values of low consumption profiles with acceptable accuracy. Table 8 evaluates the performance of the proposed ELM in predicting the energy consumption for different usage profiles at different time intervals. These results confirm the accuracy of the developed ELM model for estimating electricity consumption levels based on household attributes. It can be seen that the suggested ELM procedure has high estimation accuracy with low error. Although the developed model can be used to estimate the electricity consumption for similar households, we employed the trained ELM for sensitivity analysis by studying the impacts of different characteristics of the households on their consumption.
Figure 9 shows the energy consumption forecast error for the ELM model at each time interval in the form of an error histogram. It can be seen that the highest prediction error is related to the years 2016–2017, and the lowest prediction error is connected to the predictions made for the years 2019–2020. It should be noted that the trained ELM network predicts energy consumption values based on learning behavior patterns related to the input parameters. The results of the predictions have a very high impact on the correlation between the input variables. Thus, all learning-based methods perform the process of calculating the desired output by extracting correlations between input variables. Accordingly, in this part of the paper, a sensitivity analysis of the correlation between the input variables in determining the energy consumed is presented in Figure 10 as a correlation matrix.
The impact of the household characteristics on the low, medium, and high consumption profiles is calculated using the developed ELM model, and the results for different consumption clusters are shown in Table 9. A higher error shows a significant sensitivity between the electricity consumption level and a particular ELM input (i.e., a specific household attribute). The sensitivities of the energy usage profiles regarding the building attributes are calculated based on the ELM model error mentioned above and are listed in Table 9.
The sensitivity analysis determines how the energy consumption patterns are affected based on the changes in attributes of the building. It helps to find the most effective attributes to be employed as the tools to control and modify energy usage in similar buildings. The results can also determine the best combination of features to effectively reduce the buildings’ energy usage.
The results in Table 9 show that specific attributes have the same impact on the three usage profiles, low, medium, and high, including the number of residents, area of the house, roof unit, AC system, building material (insulation and component), and glazing. In contrast, the other attributes have different impacts on the changes in different usage profiles. It can also be concluded from Table 9 that the number of residents, building material (component), and almost the year of construction (i.e., age of the suite) have a high impact on all the energy usage profiles; i.e., all profiles are susceptible to the abovementioned two attributes. In addition to that, the low usage profile is significantly impacted by the ventilation system and ownership of the suite, and the medium usage profile is susceptible to windows proportion and building’s age, whereas the high usage profile is sensitive to the number of rooms and the building’s age. However, the number of rooms has an insignificant impact on low and medium usage profiles, though the high usage is very sensitive to this attribute.
Among the attributes with identical impacts, the total area of the house, roof unit, AC system, building material (insulation), and glazing have a medium effect on all the energy usage profiles. From another perspective, ownership of the suite and the ventilation system have distinct impacts on different usage profiles; i.e., the low usage profile is highly sensitive to specific attributes such as the ventilation system and the ownership of the suite, whereas the medium- and high-use profiles are affected by the mentioned two attributes to a medium extent.

6. Discussion

The discussion section reflects and is built on the composite results from three analyses (see Table 2): (i) impacts of new tariffs and their changes on household per capita energy consumption through statistical analysis, t-test, and clustering; (ii) impacts of building specifications on the consumption changes; and (iii) sensitivity analysis using the ELM prediction model and correlation analysis. The results suggest that the electricity consumption during the pre-revised tariff year (2016 and 2017) followed an upward trend. In contrast to this initial period, the electricity consumption between the pre-revised tariff year and the revised tariff enforcement year saw a downward trend, indicating the response of the households to the electricity price increase. Further reduction was noted when the pre-revised tariff year was compared to the post-revised tariff year (2019 and 2020), showing the continuing decline in the consumption behavior of the households. This consistent reduction in the subsequent years after the enforcement of the revised TEP confirms that the reductions in electricity consumption among the households were not a chance occurrence. This assessment is also validated by the paired sample t-test, which showed a significant decrease in electricity consumption for the study period. It also demonstrates the longevity effect of the intervention, whereby the household maintains its new conservative habits long after the intervention has been applied. This has implications for policy formulation for high energy per capita countries, particularly the Gulf States, which have historically enjoyed high energy subsidies leading to extravagant energy consumption. In the first instance, energy-conservative campaigns in conjunction with agent intervention (the feasibility of which was demonstrated in [2]) are necessary for realizing energy conservation. However, without an external force in the form of higher electricity prices, the impact of the intervention is not recognized. The analysis also revealed that several household attributes had a relatively high impact on the reduction in the electricity consumption level following the revised tariffs, whereas the majority of the attributes had a moderate impact. Accordingly, governments should target these attributes to yield optimal results.
Based on the sensitivity of different energy usage profiles to the building’s attributes, it can be concluded that all profiles are highly sensitive to the number of residents, building material (component), and the age of the suite. Moreover, all the energy usage profiles are moderately sensitive to the house’s total area, roof unit, AC system, building material (insulation), and glazing. This finding highlights the significance of educating the household members in the proper practices for lowering their daily energy consumption. In addition, the government should strive to remind household members of their critical role in conserving energy through simple environmentally conscious behaviors, thus contributing to the country’s energy security. Furthermore, the low usage profile is significantly sensitive to the ventilation system and ownership of the suite, whereas the medium usage profile is highly impacted by the window proportion and the building’s age. Similarly, the high usage profile is susceptible to the building’s age. Although the number of rooms has an insignificant impact on low and medium usage profiles, high usage is very sensitive to this attribute.
Comparison of the electricity bill with the average household income provided further evidence that the observed reduction was due to energy consciousness and not simply a consequence of the new tariff structure. More specifically, the average monthly income for households in the Eastern Region of Saudi Arabia in 2018 was estimated at SAR 14,902. This represented the highest household income compared to the country’s other administrative regions [64]. A survey of the trends from 2013 indicates that this income has been on the rise since 2013 [64]. The average cost of an electricity bill in 2016 and 2017 amounted to SAR 119.05 (0.05 × 2381 kWh) and SAR 99.95 (0.05 × 1999 kWh), respectively. This accounted for no more than roughly 1% of the average income. Compared to these pre-new tariff years, the cost of an average electricity bill in 2018 and 2019 reached SAR 309.78 (0.18 × 1721 kWh) and SAR 254.7 (0.18 × 1415 kWh), respectively. This accounted for no more than roughly 2% of the average income. While this increase represented a 1% increase from the years before the new tariff structure was imposed, comparing this figure with a percentage share of average expenditure of other household expenses (i.e., housing, water, gas, and fuels), which amount to 22.4%, it is evident that the electricity bill is but a small fraction of the total household expenditure.
Moreover, the size of the households that participated in the study ranged from one to three members. The implication of this analysis strongly suggests that the reduction in consumption was primarily an outcome of latent energy consciousness rather than financial pressure experienced by the households. This finding is supported by [65], who have noted that the position taken by the government to remove electricity subsidies, as represented by the new tariff structure, in this case, has contributed to greater awareness and thus greater efficiency.
The present study’s findings are aligned with the findings of past works [2,12,48] that have explored the impact of TEP on the energy consumption patterns of households. For example, the study by [15] showed that more than half of the households indicated that they had been encouraged to lower their energy consumption in response to TEP. Similarly, in [16], it was found that an unannounced rise in electricity price was sufficient to prompt a curtailment in the average electricity consumption in households during a short period, showing that users are able to adapt to price changes rapidly. The finding of this latter study agrees with the present study, which also saw a consistent and significant reduction in a relatively short period following the enforcement of the revised tariff.
Analysis of the electricity consumption in the households revealed that economic incentive in the form of the enforcement of a revised TEP was effective in prompting residential users to adopt conservative practices, which could be understood as the ”sticks” [66] regulating conservative behavior. The conclusion that economic factors were necessary to trigger underlying conservative behavior is validated when the present study is viewed against the study by [2]. Specifically, this past study was conducted in the same region as the present study (Eastern Province of Saudi Arabia) and aimed at altering the electricity consumption behavior of households through education and in the absence of any economic factor. While the intervention outcome showed an increase in understanding of conservative behavior and the positive impact such practices had on the environment, this increased appreciation was not reflected in household consumption. In the conclusion of the previous paper, it was argued that a multiprong approach would have probably achieved the desired behavior. The present study’s finding supports that a multiprong approach is a path forward when it comes to realizing energy consciousness behavior among households.
The selection of the ELM method for processing the available data and using it in this study is based on the capabilities presented for this method in recent studies. However, we also used the multilayer perceptron (MLP) artificial neural network (ANN) to process the data, and facing the inability of the MLP to process this type of massive data, very unfavorable results were obtained and thus not included in this paper.

7. Conclusions

Concerning the study results, it appears that the increase in monthly electricity bill, despite accounting for a negligible fraction of the overall household cost, was relatively significant enough (1% of the household income pre-new tariff compared to 2% of the household income post-new tariff implementation) to trigger energy consciousness. In other words, it appears that households felt that it was possible to contain their consumption through minor efforts that involved adjustments in their behavior based on the knowledge acquired through their exposure to the public campaigns and change agent interventions, as explored in [2]. These findings illustrate that although the reduction in consumption was observed following the new tariff structure, this reduction cannot be solely attributed to the increase in electricity price. Instead, dormant energy consciousness, in addition to acquired knowledge, played a more significant role in yielding the observed results. This outcome underscores the significance of conveying information on energy conservation to households toward realizing a more energy-conservative society.
The findings of this study can be used to promote energy consciousness. At the individual household level, households can alter their use of the HVAC to manage their electricity consumption. Noteworthy, HVAC systems play a central role in the thermal comfort of Saudi Arabian families, owing to the harsh climatic condition of the region [9]. HVAC thus constitutes a significant portion of the household electricity bill. Therefore, any minor adjustment (e.g., a reasonably straightforward behavior achieved by switching off HVAC units when rooms are unoccupied) to the utilization of the HVAC system will be followed by a significant reduction in the electricity consumption in the households. The fact that most households participating in this study were fitted with window-type units supports the observed significant reduction in electricity consumption.
At the national level, the findings provide compelling evidence for the effectiveness of policy change toward effectuating positive change among pro-environmentally inclined individuals/households. This serves as proof and confirms that knowledge and intention are necessary but not sufficient for positive behavioral change. Instead, the external environment must also be conducive to change in addition to these two factors. In the present case, the external environment takes the form of financial pressure on the household.
Thus, these policy changes can be viewed as a pre-phase to energy consciousness. At this initial stage, household members may not be aware of the environmental benefits (“knowledge” domain) of energy conservation and its implication on the regional climate. Thus, the subsequent stage calls for a planned contextualized intervention to educate household members on the impacts on the environment resulting from their conservative behavior. In other words, this stage can be referred to as the “pay less for the environment,” where they acquire the concept of paying less for electricity for the environment while underscoring the importance of a higher tariff energy structure. The study findings have demonstrated that positive changes in conservative behavior observed can be modeled in other regions with similar climatic conditions through the introduction of sound policy.
Past works have shown that internal and external factors have varying degrees of impact on prompting energy consciousness among households. The present study explored how these factors can stimulate sustainable energy-conservative behaviors among households in Saudi Arabia. The study results found a constant decline in electricity consumption in Saudi households due to the enforcement of a revised TEP scheme. Analysis of the data during the pre-revised tariff period indicated that electricity consumption among households was increasing. This period, therefore, served as a baseline against which to compare the ensuing years. In the following years, electricity consumption followed a notably downward trend. This decrease in electricity consumption was largely attributed to the recently revised TEP. However, it was speculated that the energy conservation campaigns promoted by the government were also influential in affecting change. The data show that the households have been receptive to the change in TEP by altering their energy consumption habits and thereby reflecting their energy consciousness. This is a testimony to the fact that the revised electricity tariff acts as a catalyst to transform the energy consciousness into actual energy-saving behavior. Thus, this study establishes and opens an avenue of opportunity for catalytic intervention in the form of pricing to unleash the energy consciousness in favor of sustainable energy conservation behavior.

Author Contributions

Conceptualization: K.M.N., A.S.A. and A.M.,; methodology: K.M.N., A.S.A. and A.M.S.; software: A.S.A., A.M.S. and A.M.; validation: A.S.A., A.M.S. and A.M.; formal analysis, K.M.N., A.S.A., A.M.S. and A.M.; investigation, A.S.A. and K.M.N.; resources: K.M.N. & A.S.A.; data curation: K.M.N., A.S.A., A.M.S. and A.M.; writing—original draft preparation: K.M.N., A.S.A., A.M.S. and A.M.; writing—review and editing: all authors; visualization: A.S.A., A.M.S. and A.M.; supervision: K.M.N., K.H. and R.S.; project administration: K.M.N., A.S.A., A.M.S. and A.M.; funding acquisition: K.M.N. and A.S.A. All authors have read and agreed to the published version of the manuscript.

Funding

This research received no external funding.

Data Availability Statement

Not applicable.

Acknowledgments

The authors duly acknowledge the generous support by the Life Cycle Management Laboratory (LCML) and Green Construction Research and Training Centre (GCRTC) at the University of British Columbia (UBC) Okanagan.

Conflicts of Interest

The authors declare no conflict of interest.

References

  1. Almasri, R.A.; Alshitawi, M.S. Electricity consumption indicators and energy efficiency in residential buildings in GCC countries: Extensive review. Energy Build. 2021, 255, 111664. [Google Scholar] [CrossRef]
  2. Nahiduzzaman, K.M.; Aldosary, A.S.; Abdallah, A.S.; Asif, M.; Kua, H.W.; Alqadhib, A.M. Households energy conservation in Saudi Arabia: Lessons learnt from change-agents driven interventions program. J. Clean. Prod. 2018, 185, 998–1014. [Google Scholar] [CrossRef]
  3. Alyousef, Y.; Varnham, A. Saudi Arabia’s National Energy Efficiency Programme: Description, achievements and way forward. Int. J. Low-Carbon Technol. 2010, 5, 291–297. [Google Scholar] [CrossRef]
  4. Al-Tamimi, N. A state-of-the-art review of the sustainability and energy efficiency of buildings in Saudi Arabia. Energy Effic. 2017, 10, 1129–1141. [Google Scholar] [CrossRef]
  5. Krarti, M.; Dubey, K.; Howarth, N. Evaluation of building energy efficiency investment options for the Kingdom of Saudi Arabia. Energy 2017, 134, 595–610. [Google Scholar] [CrossRef]
  6. Alaidroos, A.; Krarti, M. Optimal design of residential building envelope systems in the Kingdom of Saudi Arabia. Energy Build. 2015, 86, 104–117. [Google Scholar] [CrossRef]
  7. AlHashmi, M.; Chhipi-Shrestha, G.; Nahiduzzaman, K.M.; Hewage, K.; Sadiq, R. Framework for Developing a Low-Carbon Energy Demand in Residential Buildings Using Community-Government Partnership: An Application in Saudi Arabia. Energies 2021, 14, 4954. [Google Scholar] [CrossRef]
  8. AlHashmi, M.; Chhipi-Shrestha, G.; Ruparathna, R.; Nahiduzzaman, K.M.; Hewage, K.; Sadiq, R. Energy performance assessment framework for residential buildings in Saudi Arabia. Sustainability 2021, 13, 2232. [Google Scholar] [CrossRef]
  9. Alrashed, F.; Asif, M. Trends in Residential Energy Consumption in Saudi Arabia with Particular Reference to the Eastern Province. J. Sustain. Dev. Energy Water Environ. Syst. 2014, 2, 376–387. [Google Scholar] [CrossRef]
  10. Moradzadeh, A.; Mansour-Saatloo, A.; Mohammadi-Ivatloo, B.; Anvari-Moghaddam, A. Performance evaluation of two machine learning techniques in heating and cooling loads forecasting of residential buildings. Appl. Sci. 2020, 10, 3829. [Google Scholar] [CrossRef]
  11. Al-Homoud, M.S.; Krarti, M. Energy efficiency of residential buildings in the kingdom of Saudi Arabia: Review of status and future roadmap. J. Build. Eng. 2021, 36, 102143. [Google Scholar] [CrossRef]
  12. Ouda, O.K.M.; El-Nakla, S.; Yahya, C.B.; Peterson, H.; Ouda, M. Energy Conservation Awareness among Residential Consumers in Saudi Arabia. Int. J. Comput. Digit. Syst. 2017, 6, 349–355. [Google Scholar]
  13. Saudi Electricity Company (SEC). Consumption Tariff; Saudi Electricity Company: Riyadh, Saudi Arabia, 2017. [Google Scholar]
  14. Albatayneh, A.; Juaidi, A.; Abdallah, R.; Peña-Fernández, A.; Manzano-Agugliaro, F. Effect of the subsidised electrical energy tariff on the residential energy consumption in Jordan. Energy Rep. 2022, 8, 893–903. [Google Scholar] [CrossRef]
  15. Zhang, S.; Lin, B. Impact of tiered pricing system on China’s urban residential electricity consumption: Survey evidences from 14 cities in Guangxi Province. J. Clean. Prod. 2018, 170, 1404–1412. [Google Scholar] [CrossRef]
  16. Reiss, P.C.; White, M.W. What changes energy consumption? Prices and public pressures. RAND J. Econ. 2008, 39, 636–663. [Google Scholar] [CrossRef]
  17. Kollmuss, A.; Agyeman, J. Mind the Gap: Why do people act environmentally and what are the barriers to pro-environmental behavior? Environ. Educ. Res. 2002, 8, 239–260. [Google Scholar] [CrossRef]
  18. Clark, C.F.; Kotchen, M.J.; Moore, M.R. Internal and external influences on pro-environmental behavior: Participation in a green electricity program. J. Environ. Psychol. 2003, 23, 237–246. [Google Scholar] [CrossRef]
  19. Liu, Q. A multilevel analysis of determinants of pro-environmental behavior (PEB) in China a case from Tianjin. In Proceedings of the 2010 4th International Conference on Bioinformatics and Biomedical Engineering (iCBBE 2010), Chengdu, China, 18–20 June 2010. [Google Scholar] [CrossRef]
  20. Prabatha, T.; Hager, J.; Carneiro, B.; Hewage, K.; Sadiq, R. Analyzing energy options for small-scale off-grid communities: A Canadian case study. J. Clean. Prod. 2020, 249, 119320. [Google Scholar] [CrossRef]
  21. Du, J.; Pan, W. Examining energy saving behaviors in student dormitories using an expanded theory of planned behavior. Habitat Int. 2021, 107, 102308. [Google Scholar] [CrossRef]
  22. Miao, L.; Wei, W. Consumers’ pro-environmental behavior and the underlying motivations: A comparison between household and hotel settings. Int. J. Hosp. Manag. 2013, 32, 102–112. [Google Scholar] [CrossRef]
  23. Kennedy, E.H.; Kmec, J. Reinterpreting the gender gap in household pro-environmental behaviour. Environ. Sociol. 2018, 4, 299–310. [Google Scholar] [CrossRef]
  24. Musango, J.K. Household electricity access and consumption behaviour in an urban environment: The case of Gauteng in South Africa. Energy Sustain. Dev. 2014, 23, 305–316. [Google Scholar] [CrossRef]
  25. Aldossary, N.A.; Rezgui, Y.; Kwan, A. An investigation into factors influencing domestic energy consumption in an energy subsidized developing economy. Habitat Int. 2015, 47, 41–51. [Google Scholar] [CrossRef]
  26. Pothitou, M.; Hanna, R.F.; Chalvatzis, K.J. Environmental knowledge, pro-environmental behaviour and energy savings in households: An empirical study. Appl. Energy 2016, 184, 1217–1229. [Google Scholar] [CrossRef]
  27. Wood, G.; Newborough, M. Dynamic energy-consumption indicators for domestic appliances: Environment, behaviour and design. Energy Build. 2003, 35, 821–841. [Google Scholar] [CrossRef]
  28. Winett, R.A.; Hatcher, J.W.; Fort, T.R.; Leckliter, I.N.; Love, S.Q.; Riley, A.W.; Fishback, J.F. The effects of videotape modeling and daily feedback on residential electricity conservation, home temperature and humidity, perceived comfort, and clothing worn: Winter and summer. J. Appl. Behav. Anal. 1982, 15, 381–402. [Google Scholar] [CrossRef]
  29. Podgornik, A.; Sucic, B.; Blazic, B. Effects of customized consumption feedback on energy efficient behaviour in low-income households. J. Clean. Prod. 2016, 130, 25–34. [Google Scholar] [CrossRef]
  30. Abrahamse, W.; Steg, L.; Vlek, C.; Rothengatter, T. The effect of tailored information, goal setting, and tailored feedback on household energy use, energy-related behaviors, and behavioral antecedents. J. Environ. Psychol. 2007, 27, 265–276. [Google Scholar] [CrossRef]
  31. Katzev, R.D.; Johnson, T.R. Comparing the Effects of Monetary Incentives and Foot-in-the-Door Strategies in Promoting Residential Electricity Conservation. J. Appl. Soc. Psychol. 1984, 14, 12–27. [Google Scholar] [CrossRef]
  32. Hu, S.; Yan, D.; Azar, E.; Guo, F. A systematic review of occupant behavior in building energy policy. Build. Environ. 2020, 175, 106807. [Google Scholar] [CrossRef]
  33. Kemmelmeier, M.; Król, G.; Kim, Y.H. Values, economics, and proenvironmental attitudes in 22 societies. Cross-Cult. Res. 2002, 36, 256–285. [Google Scholar] [CrossRef]
  34. Chen, C.-F.; Xu, X.; Day, J.K. Thermal comfort or money saving? Exploring intentions to conserve energy among low-income households in the United States. Energy Res. Soc. Sci. 2017, 26, 61–71. [Google Scholar] [CrossRef]
  35. Silvi, M.; Padilla, E. Pro-environmental behavior: Social norms, intrinsic motivation and external conditions. Environ. Policy Gov. 2021, 31, 619–632. [Google Scholar] [CrossRef]
  36. Parzonko, A.J.; Balińska, A.; Sieczko, A. Pro-environmental behaviors of generation z in the context of the concept of homo socio-oeconomicus. Energies 2021, 14, 1597. [Google Scholar] [CrossRef]
  37. Reynolds, T.; Murray, B.T.; Kolodinsky, J.; Howell, J. Contrasting self-reported willingness to pay and demonstrated purchase behavior for energy-saving technologies in a small island developing state. Energy Sustain. Dev. 2015, 27, 18–27. [Google Scholar] [CrossRef]
  38. Moradzadeh, A.; Sadeghian, O.; Pourhossein, K.; Mohammadi-Ivatloo, B.; Anvari-Moghaddam, A. Improving residential load disaggregation for sustainable development of energy via principal component analysis. Sustainability 2020, 12, 3158. [Google Scholar] [CrossRef]
  39. Hu, S.; He, J.; Yang, C. Evaluating the impacts of the increasing block tariffs on residential electricity consumption in China. Sustain. Prod. Consum. 2022, 29, 180–187. [Google Scholar] [CrossRef]
  40. Du, G.; Lin, W.; Sun, C.; Zhang, D. Residential electricity consumption after the reform of tiered pricing for household electricity in China. Appl. Energy 2015, 157, 276–283. [Google Scholar] [CrossRef]
  41. Nafziger, D.L. Field experience with a peak-demand tariff at the Andhi Khola hydel and rural electrification project. Energy Sustain. Dev. 1996, 3, 19–28. [Google Scholar] [CrossRef]
  42. Sebitosi, A.B. Is the South African electricity tariff model conducive to an energy efficient economy? Energy Sustain. Dev. 2010, 14, 315–319. [Google Scholar] [CrossRef]
  43. Krstić, J.; Reljić, M.; Filipović, S. Factors influencing electricity consumption: A review of research methods. Manag. Sustain. Bus. Manag. Solut. Emerg. Econ. 2018, 24, 13–22. [Google Scholar] [CrossRef]
  44. Wang, Z.; Zhang, B.; Zhang, Y. Determinants of public acceptance of tiered electricity price reform in China: Evidence from four urban cities. Appl. Energy 2012, 91, 235–244. [Google Scholar] [CrossRef]
  45. Zhang, F. Energy price reform and household welfare: The case of Turkey. Energy J. 2015, 36, 71–95. [Google Scholar] [CrossRef]
  46. Wu, Y.; Zhang, L. Evaluation of energy saving effects of tiered electricity pricing and investigation of the energy saving willingness of residents. Energy Policy 2017, 109, 208–217. [Google Scholar] [CrossRef]
  47. Abdul Mujeebu, M.; Alshamrani, O.S. Prospects of energy conservation and management in buildings—The Saudi Arabian scenario versus global trends. Renew. Sustain. Energy Rev. 2016, 58, 1647–1663. [Google Scholar] [CrossRef]
  48. Alyousef, Y.; Abu-Ebid, M. Energy efficiency initiatives for Saudi Arabia on supply and demand sides. In Energy Efficiency—A Bridge to Low Carbon Economy; Morvaj, Z., Ed.; IntechOpen: Rijeka, Croatia, 2012. [Google Scholar]
  49. Matar, W. Beyond the end-consumer: How would improvements in residential energy efficiency affect the power sector in Saudi Arabia? Energy Effic. 2016, 9, 771–790. [Google Scholar] [CrossRef]
  50. Moradzadeh, A.; Mohammadi-Ivatloo, B.; Abapour, M.; Anvari-Moghaddam, A.; Gholami Farkoush, S.; Rhee, S.-B. A practical solution based on convolutional neural network for non-intrusive load monitoring. J. Ambient Intell. Humaniz. Comput. 2021, 12, 9775–9789. [Google Scholar] [CrossRef]
  51. Al Ghamdi, A. Data Insight: Electricity Tariff Changes in Saudi Arabia (1974–2018); KAPSARC: Riyadh, Saudi Arabia, 2019. [Google Scholar]
  52. Alqahtany, A.; Bin Mohanna, A. Housing challenges in Saudi Arabia: The shortage of suitable housing units for various socioeconomic segments of Saudi society. Hous. Care Support 2019, 22, 162–178. [Google Scholar] [CrossRef]
  53. Statista. Number of Dwellings in Saudi Arabia in 2018, by Building Type; Statista: Hamburg, Germany, 2020. [Google Scholar]
  54. WS. Average Weather in Dammam, Saudi Arabia; WS: Excelsion, MN, USA, 2020. [Google Scholar]
  55. Huang, G.-B.; Zhu, Q.-Y.; Siew, C.-K. Extreme learning machine: Theory and applications. Neurocomputing 2006, 70, 489–501. [Google Scholar] [CrossRef]
  56. Liu, C.; Sun, B.; Zhang, C.; Li, F. A hybrid prediction model for residential electricity consumption using holt-winters and extreme learning machine. Appl. Energy 2020, 275, 115383. [Google Scholar] [CrossRef]
  57. Wang, L.; Li, X.; Bai, Y. Short-term wind speed prediction using an extreme learning machine model with error correction. Energy Convers. Manag. 2018, 162, 239–250. [Google Scholar] [CrossRef]
  58. Wu, D.; Chen, H.; Huang, Y.; Chen, S. Online Monitoring and Model-Free Adaptive Control of Weld Penetration in VPPAW Based on Extreme Learning Machine. IEEE Trans. Ind. Inform. 2019, 15, 2732–2740. [Google Scholar] [CrossRef]
  59. Hossain Lipu, M.S.; Hannan, M.A.; Hussain, A.; Saad, M.H.; Ayob, A.; Uddin, M.N. Extreme learning machine model for state-of-charge estimation of lithium-ion battery using gravitational search algorithm. IEEE Trans. Ind. Appl. 2019, 55, 4225–4234. [Google Scholar] [CrossRef]
  60. Azizi, E.; Kharrati-Shishavan, H.; Mohammadpour Shotorbani, A.; Mohammadi-Ivatloo, B. Wind speed clustering using linkage-ward method: A case study of Khaaf, Iran. Gazi Univ. J. Sci. 2019, 32, 945–954. [Google Scholar] [CrossRef]
  61. Lorenzoni, L.; Cherubini, P.; Fioriti, D.; Poli, D.; Micangeli, A.; Giglioli, R. Classification and modeling of load profiles of isolated mini-grids in developing countries: A data-driven approach. Energy Sustain. Dev. 2020, 59, 208–225. [Google Scholar] [CrossRef]
  62. Bishop, C.M. Pattern Recognition and Machine Learning; Springer: Berlin/Heidelberg, Germany, 2006. [Google Scholar]
  63. Stefenon, S.F.; Grebogi, R.B.; Freire, R.Z.; Nied, A.; Meyer, L.H. Optimized Ensemble Extreme Learning Machine for Classification of Electrical Insulators Conditions. IEEE Trans. Ind. Electron. 2020, 67, 5170–5178. [Google Scholar] [CrossRef]
  64. GASTAT. Household Income and Expenditure Survey; GASTAT: Riyadh, Saudi Arabia, 2018. [Google Scholar]
  65. Felimban, A.; Prieto, A.; Knaack, U.; Klein, T.; Qaffas, Y. Assessment of Current Energy Consumption in Residential Buildings in Jeddah, Saudi Arabia. Buildings 2019, 9, 163. [Google Scholar] [CrossRef]
  66. Azevedo, I.; Delarue, E.; Meeus, L. Mobilizing cities towards a low-carbon future: Tambourines, carrots and sticks. Energy Policy 2013, 61, 894–900. [Google Scholar] [CrossRef] [Green Version]
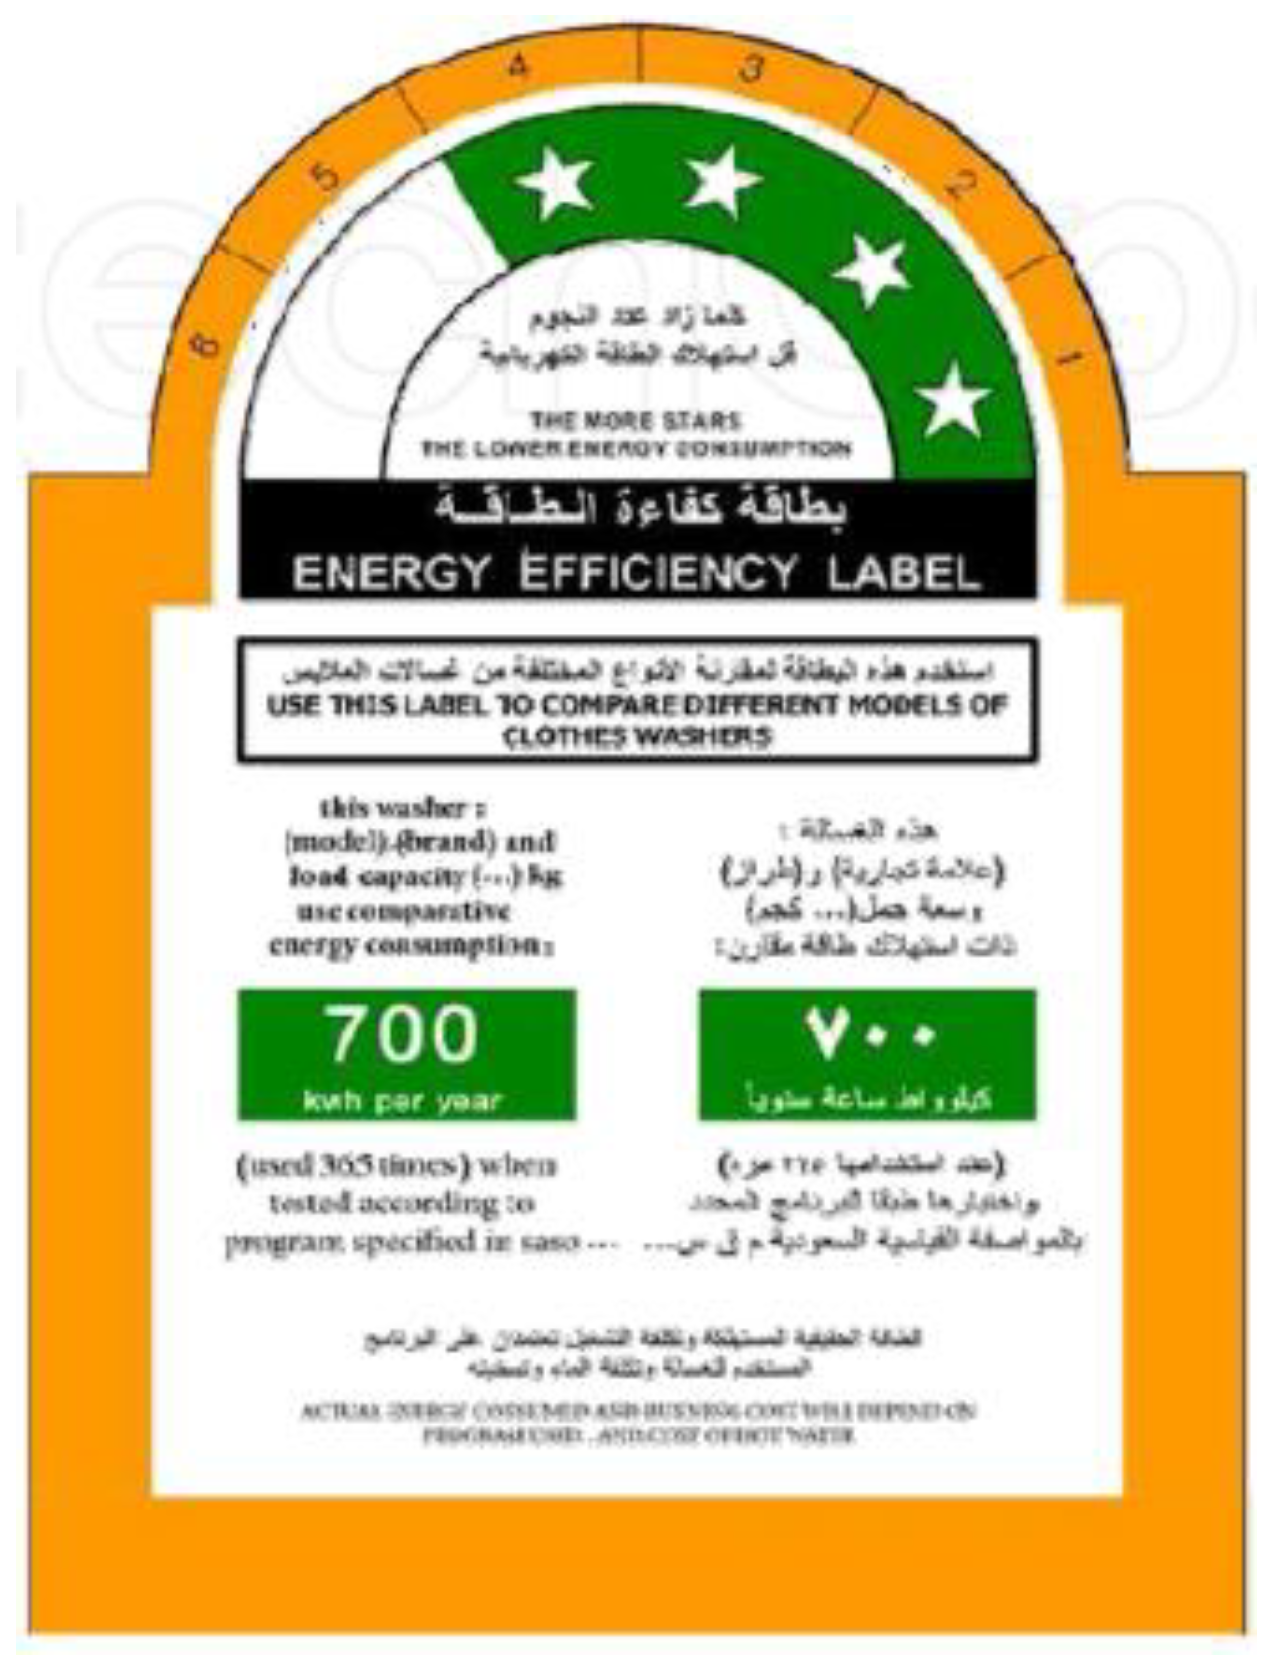
Figure 1. Sample energy efficiency label adapted from [48].
Energies 16 01458 g001
Figure 2. The architecture of the ELM.
Energies 16 01458 g002
Figure 3. Electricity consumption trend: 2016–2020.
Energies 16 01458 g003
Figure 4. Histogram plots of consumer distribution with respect to consumption ranges at different time intervals: (a) low consumption profile; (b) medium consumption profile; (c) high consumption profile.
Energies 16 01458 g004
Figure 5. Histogram plots of the distribution in relative changes in electricity consumption compared to the first time interval (i.e., 2016–2017) in per unit values: (a) low consumption profile; (b) medium consumption profile; (c) high consumption profile.
Energies 16 01458 g005aEnergies 16 01458 g005b
Figure 6. Impacts of changes in electricity rates on different consumption profiles.
Energies 16 01458 g006
Figure 8. Predicted energy consumption for the low-consumption profile in regression format: (a) 2016–2017; (b) 2018; (c) 2019–2020.
Energies 16 01458 g008
Figure 9. Error in predicting energy consumption for the ELM model at each time interval, in the form of an error histogram: (a) 2016–2017; (b) 2018; (c) 2019–2020.
Energies 16 01458 g009
Figure 10. Correlation between input variables in determining the energy consumed in the form of a correlation matrix.
Energies 16 01458 g010
Table 1. Residential tariff [13,51].
Consumption
Categories (kWh)
Residential Tariff (Halalah/kWh)
Before 2016In 2016In 2018
1–10005518
1001–20005518
2001–3000101018
3001–4000101018
4001–5000122018
5001–6000122018
6001–7000153030
7001–8000203030
8001–9000223030
9001–10,000243030
Over 10,000263030
Table 2. Steps to analyze the impacts of tariffs on consumption.
Overall Algorithm
  • Dividing the data into three categories based on the tariffs and pre-processing the usage data
  • Analyzing the impacts of tariff change based on time-series data
  • Calculating the paired sample t-test
  • Clustering the data into low, medium, and high usage profiles
  • Calculating the probability distribution in consumption clusters
  • Calculating the probability distribution in the pairwise changes in usage
  • Modeling the consumption data based on attributes of the households
  • Nonlinear modeling using extreme learning machine (ELM), i.e., Figure 7
Correlation matrix and sensitivity analysis based on households’ attributes
Table 3. Paired sample t-test for months of 2016 and 2017.
MonthJanFebMarAprMayJunJulAugSepOctNovDec
mean−261−28773163352019016−261−287
p-value0.9770.6120.1410.7130.9020.049 *0.8660.032 *0.7670.9770.6120.141
Note: Units are in kWh per capita per month. * Values are statistically significant. Negative values indicate a reduction in electricity usage from one month to the next.
Table 4. Paired sample t-test for months of 2017 and 2018.
MonthJanFebMarAprMayJunJulAugSepOctNovDec
mean−19−13412−2−208−97−544−121−41136−268−133
p-value0.6830.0510.7950.9640.032 *0.5950.004 *0.4110.011 *0.7510.005 *0.008 *
Note: Units are in kWh per capita per month. * Values are statistically significant. Negative values indicate a reduction in electricity usage from one month to the next.
Table 5. Paired sample t-test for months of 2017 and 2019.
MonthJanFebMarAprMayJunJulAugSepOctNovDec
mean−163−198−129−301−533−283−764−428−550−74−299−146
p-value0.003 *0.009 *0.018 *0 *0 *0.1190 *0.007 *0.001 *0.5140.002 *0.15
Note: Units are in kWh per capita per month. * Values are statistically significant. Negative values indicate a reduction in electricity usage from one month to the next.
Table 6. Attributes of the households.
AttributeValues (Classes)
1Dwelling Type(a) Apartment, (b) Apartment (shared electricity), (c) Villa (1 floor), (d) Villa (2 floors)
2Ownership(a) Owner, (b) Tenant
3No. of Residents(a) 1 to 3, (b) 4 to 6, (c) 7 to 10
4Year of Construction(a) 2007 and earlier, (b) 2007 to 2010, (c) 2010 to 2014, (d) 2014 and later
5No. of Rooms(a) 1 or 2, (b) 3 or 4, (c) More than 4
6Areas of Rooms (m2)(a) 15 to 20, (b) 25 or more
7Area of House (m2)(a) 51 to 100, (b) 101 to 150, (c) 151 to 200, (d) 201 to 250, (e) 400+
8Roof Unit(a) Yes, it is a roof unit, (b) No, it is not a roof unit
9AC System(a) Split, (b) Window AC unit, (c) Both Split and Window AC unit
10Building Material (insulation)(a) With insulation, (b) Without insulation
11Building Material (component)(a) 1 component, (b) 2 components
12Windows Proportion(a) 12.5% or less, (b) 12.5% to 25%, (c) 25% to 50%
13Glazing(a) Single, (b) Double
14Ventilation System(a) Mechanical, (b) Natural, (c) No ventilation (N/A)
Table 7. Variations in electricity consumption: pairwise comparison between different time intervals.
Low Consumption
Profile
Medium Consumption
Profile
High Consumption
Profile
Time Interval20182019–202020182019–202020182019–2020
vs.2016–201720182016–201720182016–20172018
Decrease: More than 50%39.0%44.4%14.0%36.3%41.6%8.3%16.7%27.8%8.3%
Decrease: Less than 50%50.0%41.6%50.0%44.4%47.2%47.2%72.2%61.1%50.0%
Increase: Less than 50%8.3%8.5%30.5%16.6%8.3%38.9%11.1%11.1%38.9%
Increase: More than 50%2.7%5.5%5.5%2.7%2.7%5.6%002.8%
Table 8. Evaluating the performance of the ELM network based on various performance evaluation indicators.
YearTypeR (%)MSERMSE
2016–2017Low-use profile99.92868.9329.47
Medium-use profile99.89942.5230.70
High-use profile99.87985.2531.38
2018Low-use profile99.94802.5428.32
Medium-use profile99.91842.1529.01
High-use profile99.88859.0829.31
2019–2020Low-use profile99.96671.0825.90
Medium-use profile99.94714.5826.73
High-use profile99.93784.9528.01
Table 9. Sensitivity analysis using the developed ELM: impacts of building attributes on the low, medium, and high usage clusters.
AttributeAttribute #Impacts of the Attributes on the Changes in the Electricity Consumption by New Tariffs
Low UsageMedium UsageHigh Usage
1Dwelling Type1LowLowLow
2No. of Rooms5LowLowHigh
3Areas of Rooms (m2)6LowMediumLow
4Area of House (m2)7MediumMediumMedium
5Being the Roof Unit8MediumMediumMedium
6AC System9MediumMediumMedium
7Building Material (Insulation)10MediumMediumMedium
8Glazing13MediumMediumMedium
9Windows Proportion12MediumHighMedium
10Year of Construction (Age)4MediumHighHigh
11Ventilation System14HighLowMedium
12Ownership2HighMediumLow
13No. of Residents3HighHighHigh
14Building Material (component)11HighHighHigh
Disclaimer/Publisher’s Note: The statements, opinions and data contained in all publications are solely those of the individual author(s) and contributor(s) and not of MDPI and/or the editor(s). MDPI and/or the editor(s) disclaim responsibility for any injury to people or property resulting from any ideas, methods, instructions or products referred to in the content.