Article

Assessing Different Inoculum Treatments for Improved Production of Hydrogen through Dark Fermentation

by
Saleh Al-Haddad
1,2,*,
Cynthia Kusin Okoro-Shekwaga
1,
Louise Fletcher
1,
Andrew Ross
3 and
Miller Alonso Camargo-Valero
1,4,*
1
BioResource Systems Research Group, School of Civil Engineering, University of Leeds, Leeds LS2 9JT, UK
2
Kuwait Institute for Scientific Research, Al-Jaheth Street, Shuwaikh, Kuwait City 13109, Kuwait
3
School of Chemical and Process Engineering, University of Leeds, Leeds LS2 9JT, UK
4
Departamento de Ingeniería Química, Universidad Nacional de Colombia, Campus La Nubia, Manizales 170003, Colombia
*
Authors to whom correspondence should be addressed.
Energies 2023, 16(3), 1233; https://doi.org/10.3390/en16031233
Submission received: 20 December 2022 / Revised: 8 January 2023 / Accepted: 12 January 2023 / Published: 23 January 2023
(This article belongs to the Special Issue Advances in Hydrogen Production and Hydrogen Separation II)

Abstract

:
Hydrogen gas (H2) is an energy carrier that does not generate carbon dioxide emissions during combustion, but several processes in use for its production demand high energy inputs associated with fossil fuels and greenhouse emissions. Biological processes, such as dark fermentation (DF), have the potential to remove the dependency on fossil fuels in H2 production. DF is a process that encourages fermentative bacteria to ferment organic substrates to produce H2 as a truly clean energy carrier, but its success depends on removing the presence of competing H2−consuming microorganisms in the inoculum consortia. This paper addresses a strategy to enhance H2 production from different types of substrates by testing inoculum pre-treatment processes to inactivate H2−consuming bacteria, including acid-shock (pH 3), basic-shock (pH 10) and heat-shock (115 °C) methods. Digestate from anaerobic digesters processing sewage sludge was used to produce pre-treated inocula, which were subsequently tested in a batch bio-H2 potential (BHP) test using glucose as a substrate. The results show that heat-shock pre-treatment was the best method, reporting a H2 yield of 191.8 mL-H2/gVS added (the untreated inoculum reported 170.91 mL-H2/gVS added). Glucose conversion data show a high concentration of butyric acid in both treated and untreated inocula during BHP tests, which indicate that the butyrate pathway for H2 production was dominant; shifting this to the formate route could further enhance net H2 production. A standardised inoculum-conditioning method can help to consistently assess the biohydrogen potential of suitable feedstock for DF and maximise H2 yields.

1. Introduction

Hydrogen gas (H2) is the major future energy source. There are many reasons why H2 is preferred to other energy sources, such as a high net calorific value (120 MJ/kg), compared with other fuels, including methane (50 MJ/kg), ethanol (26.8 MJ/kg) and methanol (19.6 MJ/kg), which gives H2 a high energy efficiency [1,2]. Hydrogen gas has a positive impact on the environment as its combustion does not produce carbon dioxide; therefore, its use can help in reducing greenhouse gas (GHG) emissions associated with the use of conventional fuels [3].
Despite the advantages of hydrogen gas as an energy carrier, the conventionally used methods for its production, such as steam methane reforming, partial oxidation and coal gasification, have many disadvantages, including high energy demand and hazardous gas emissions. Operating temperatures for these systems are usually >700 °C [4] and the gases emitted mostly contain oxides of nitrogen, sulfur and carbon, along with ashes that contain heavy metals and radioactive substances [5]. Water electrolysis is another available hydrogen gas production method, by splitting the water molecule into hydrogen and oxygen and, therefore, has no carbon dioxide emission, but it still has high energy consumption [6]. For example, a typical electrolyser consumes 39.4–50 kWh per kg of hydrogen produced (142–180 MJ/kg) [7].
The high perspective of hydrogen gas in energy storage, decarbonizing heat and as one of the main energy carriers in the future, and the inefficiencies in current production methods, necessitated the research into other energy-efficient and environmentally friendly methods of hydrogen gas production, such as biological hydrogen production. Biological hydrogen production is a promising method for hydrogen production from different organic wastes (e.g., food, municipal and agricultural waste) through biological reactions carried out by microorganisms under specific operating conditions [8].
Dark fermentation (DF) is a biological hydrogen gas production method, whereby fermentative bacteria are used to ferment organic substrates to produce energy carriers, such as hydrogen gas, formate salts or formic acid. One of the main advantages of this method is that it does not require a light source and can easily be adapted to various organic substrates [9]. DF is sometimes referred to as stressed anaerobic digestion (AD) because the biological reactions that occur during DF are the same as in the hydrolysis/acidogenesis stage of AD [10]. In the past 10 years, the DF method has gained interest for the biological production of hydrogen gas. During DF, hydrogen is produced by the conversion (hydrolyse) of organic substrates (carbohydrates, proteins and lipids) using mixed or pure cultures of microorganisms. This conversion can follow different pathways with the associated production of volatile fatty acids (VFAs), and each pathway of conversion has a specific maximum (theoretically) hydrogen gas production. Therefore, knowing the concentration of VFAs will play a huge role in identifying the pathway and the conversion efficiency toward enhancing hydrogen gas production through DF. Certain operating parameters influence hydrogen production. Temperature, pH, agitation intensity, retention time, organic loading rate (OLR), a balanced presence of nutrients, presence/absence of inhibitors and inoculum type have major influential effects on the whole process; these operating parameters are related to each other such that changing one parameter may affect another [11]. This complexity in the relationship of these influential parameters creates the necessity to identify approaches to optimize DF for hydrogen production.
The analysis of VFAs could be used to monitor the metabolic pathway for such a complex system. For example, 1 mole of glucose (a standard substrate—Figure 1) would theoretically yield 12 moles of hydrogen gas; however, in terms of VFA production, if the reaction follows the propionate pathway, there will be hydrogen consumption and, if it follows the lactate and ethanol pathways, there will be no hydrogen yield [12]. On the contrary, in the acetate pathway, only 4 of 12 moles of hydrogen can be produced, while the butyrate pathway can produce only 2 moles of hydrogen [13]. As such, the concentration of VFAs at the end of a DF process can be an indicator of the maximum theoretical hydrogen production that can be achieved. Therefore, as in the present study, it is important to control the operating conditions to favour the most preferred VFA route for maximum hydrogen gas production from DF.
Inoculum pre-treatment is a very important step in DF that can affect the production of hydrogen. Mixed cultures such as digestate (from AD) can be used as an inoculum in DF because they are easier to handle and control and are highly available [15]. However, mixed cultures contain both hydrogen-consuming bacteria (methanogens and homoacetogens) and hydrogen-producing bacteria (such as Clostridium and Enterobacter). In the DF process, which is operated under anoxic conditions, hydrogen-consuming bacteria can easily consume the hydrogen produced and affect the net hydrogen yield [16,17].
Therefore, to inhibit the methanogen activity, inoculum pre-treatment is a necessary step in DF. Several studies investigated different types of inoculum pre-treatment, which are classified into physical, chemical and biological pre-treatment methods [18,19,20,21]. Physical pre-treatment (heat-shock, freezing–thawing and aeration), chemical pre-treatment (acid shock, basic shock, sodium 2-bromoethanesulfonate or 2-bromoethanesulfonic acid and iodopropane) and combined pre-treatment (e.g., combined heat and basic shock) are the main pre-treatment methods adopted to inhibit methanogenesis. Several studies compared the effect of these pre-treatments on increasing hydrogen gas production but arrived at different conclusions. For example, Zhu and Béland [19] studied heat-shock, basic-shock, acid-shock, iodopropane pre-treatment, 2-bromoethanesulfonic acid pre-treatment and aeration. The operation conditions were the same in the two batch tests, and the results show that iodopropane pre-treatment was the best method for the first batch tests (sucrose + digested sludge), while basic shock was the best in the second batch tests (first batch effluent + sucrose), in terms of inhibiting the methanogens and enriching the hydrogen-producing bacteria. However, Mu and Yu [20] used the same type of inoculum (anaerobic sludge) as [19] and reported that heat shock was the best method to enrich hydrogen-producing bacteria. Further, Cheong and Hansen [22] reported that acid shock was the best method among five pre-treatment methods (dry heat shock, wet heat shock, freezing and thawing, sodium 2-bromoethanesulfonate and acid shock), using cattle manure sludge. Mohan and Babu [21] found that among seven pre-treatments, the sodium 2-bromoethanesulfonate pre-treatment method was the best for hydrogen production, using anaerobic mixed microflora as an inoculum. Using sewage sludge as an inoculum, Hu and Chen [18] demonstrated that among three pre-treatment methods, chloroform, heat shock and acid shock, chloroform was the best method.
All these studies and their conflicting results show that there is a need for more investigation and studies toward determining which pre-treatment is the best for inhibiting hydrogen-consuming bacteria and enriching hydrogen-producing bacteria in a certain type of inoculum. Therefore, the aim of this paper is to address the need for an effective inoculum pre-treatment method for hydrogen gas production and how to assess and select the best pre-treatment for any used inoculum in any future studies.

2. Materials and Methods

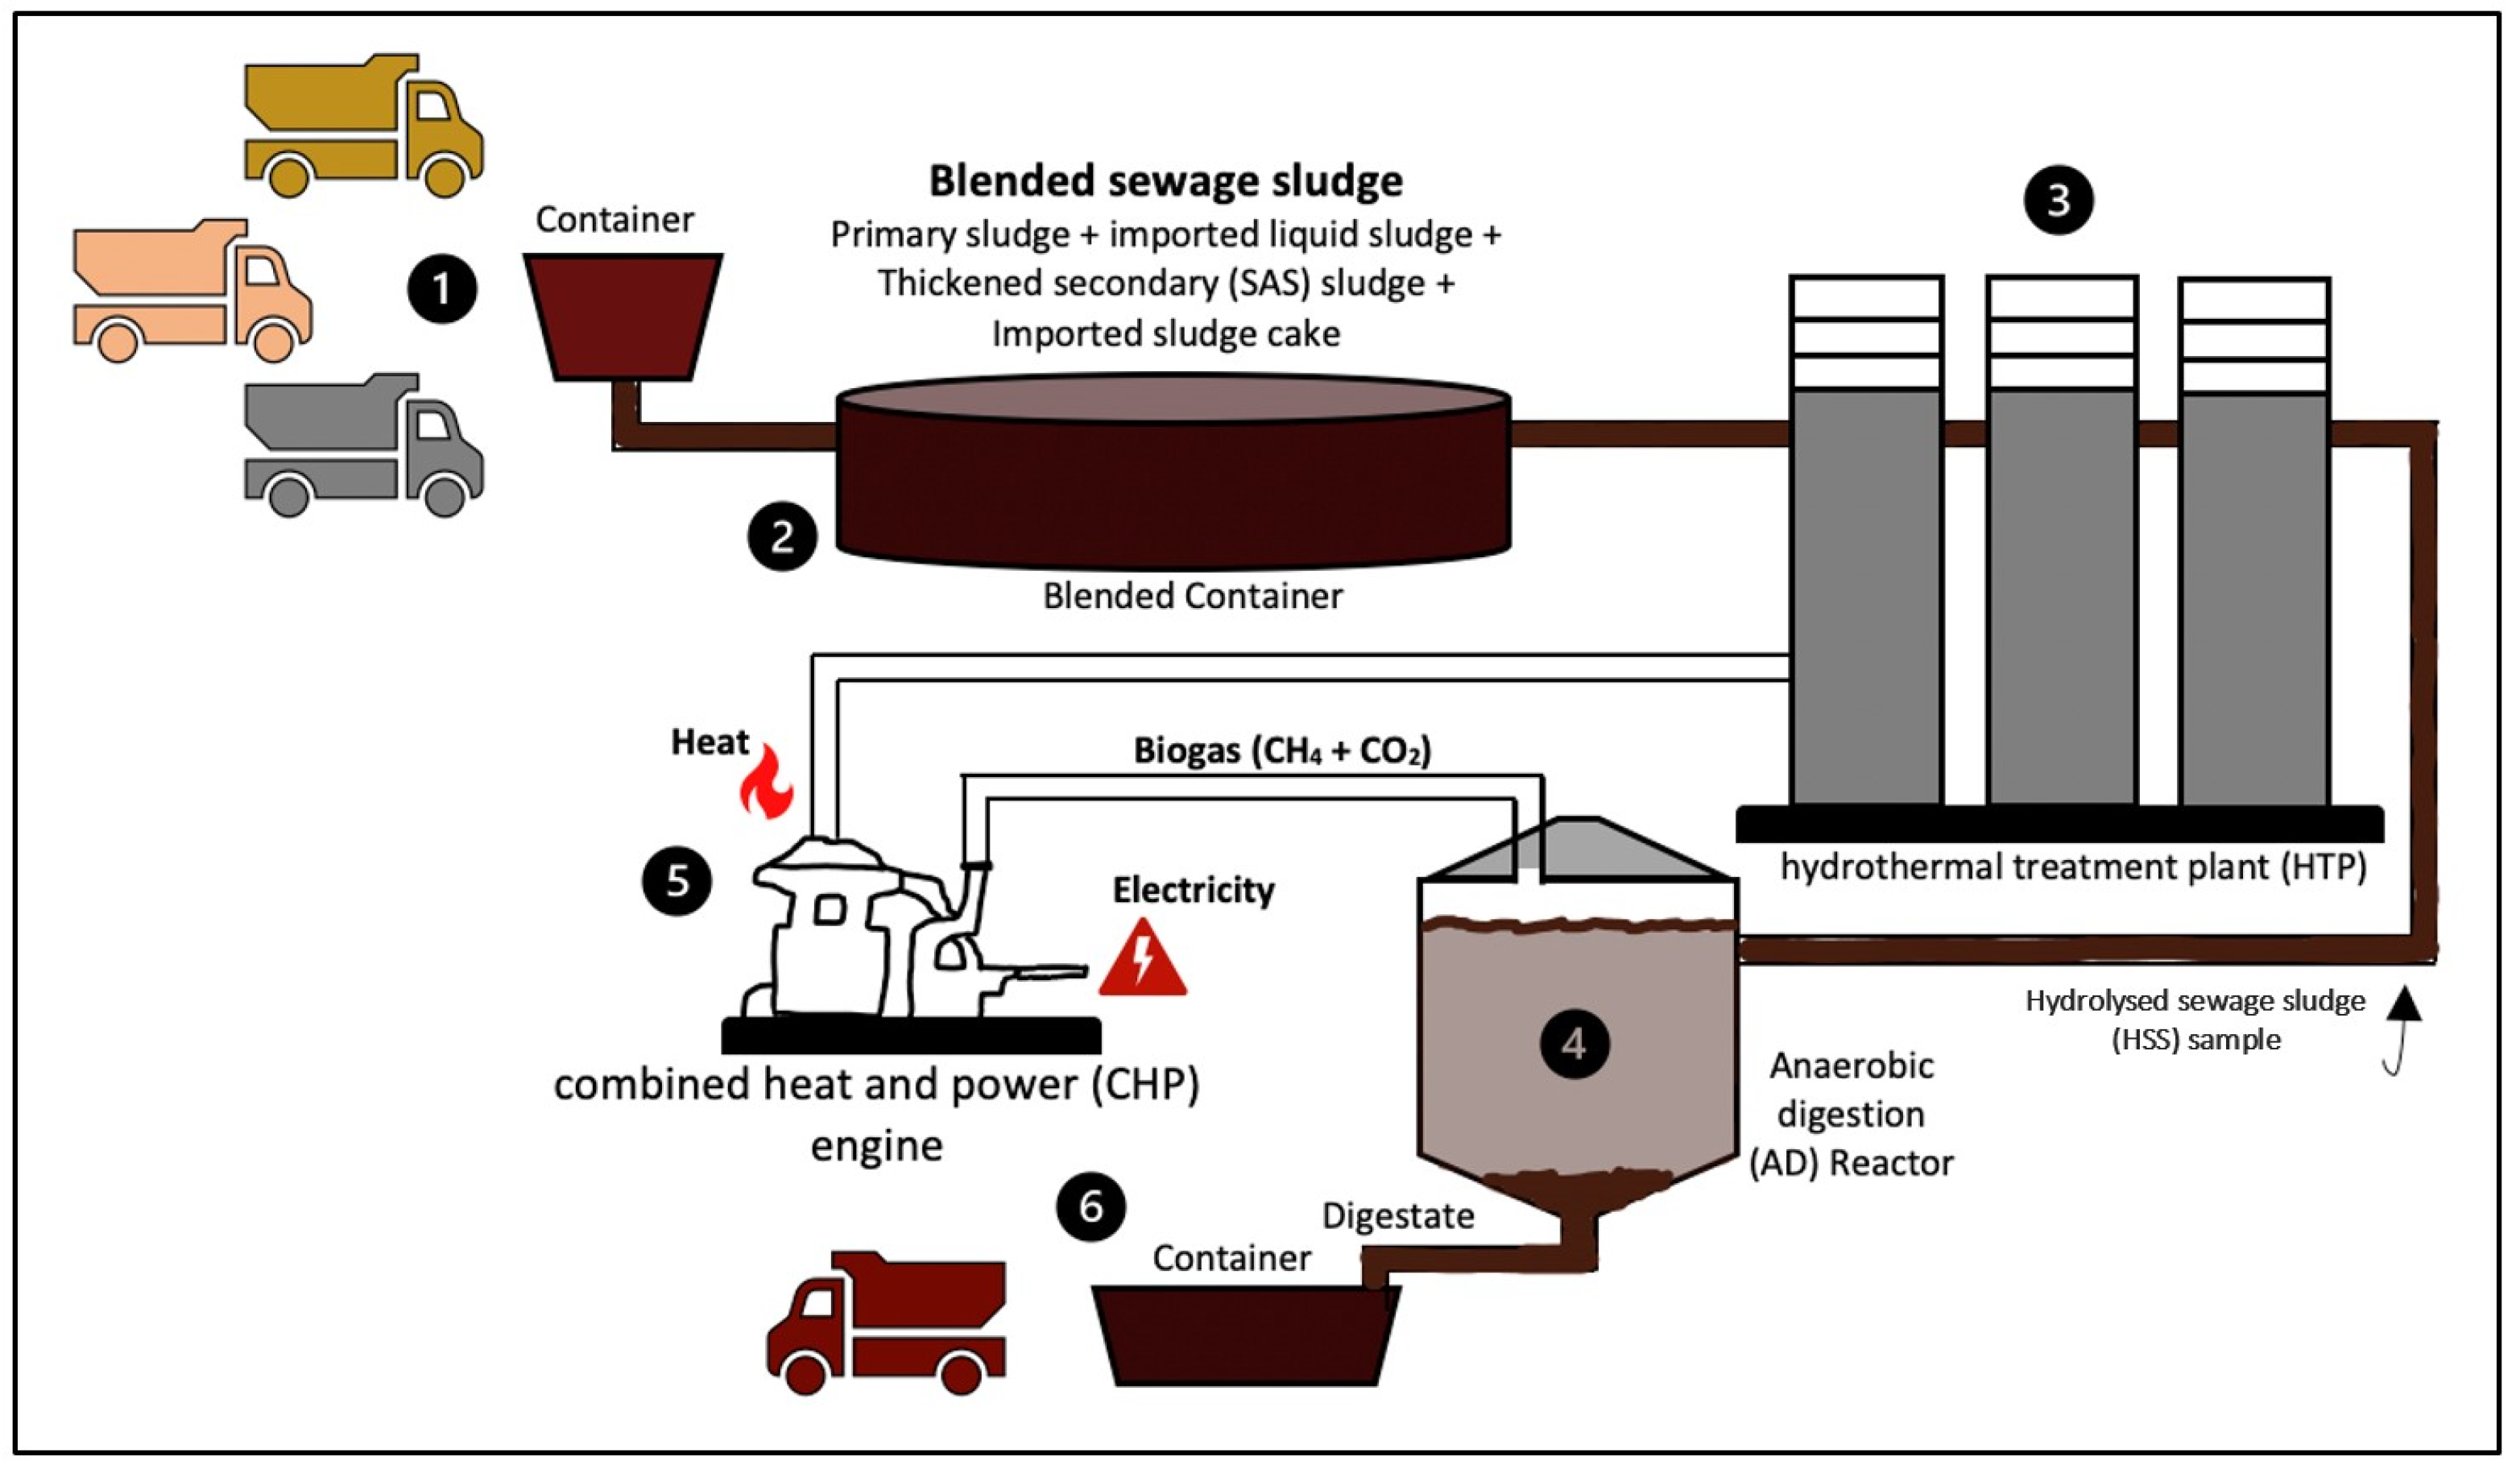
2.1. Inoculum and Substrate

The inoculum used for the batch bio-H2 potential (BHP) tests was prepared from digestate samples collected from an anaerobic digester processing sewage sludge at Yorkshire Water’s Esholt Wastewater Treatment Works (WWTW), Bradford, United Kingdom (UK)—see Step 4 in Figure 2, showing the steps conducted at Esholt WWTW for sewage sludge processing. Digestate samples were incubated at 37 °C and fed with hydrolysed sewage sludge (HSS) once a week to keep the microorganisms active. The hydrothermal pre-treatment process to produce HSS is illustrated in Step 3—Figure 2. Digestate and HSS samples were both collected at Esholt WWTW. D-glucose powder (Sigma-Aldrich, Gillingham, UK; ≥99.5% purity) was used as substrate for BHP tests to assess the quality and suitability of the inoculum for hydrogen gas production.

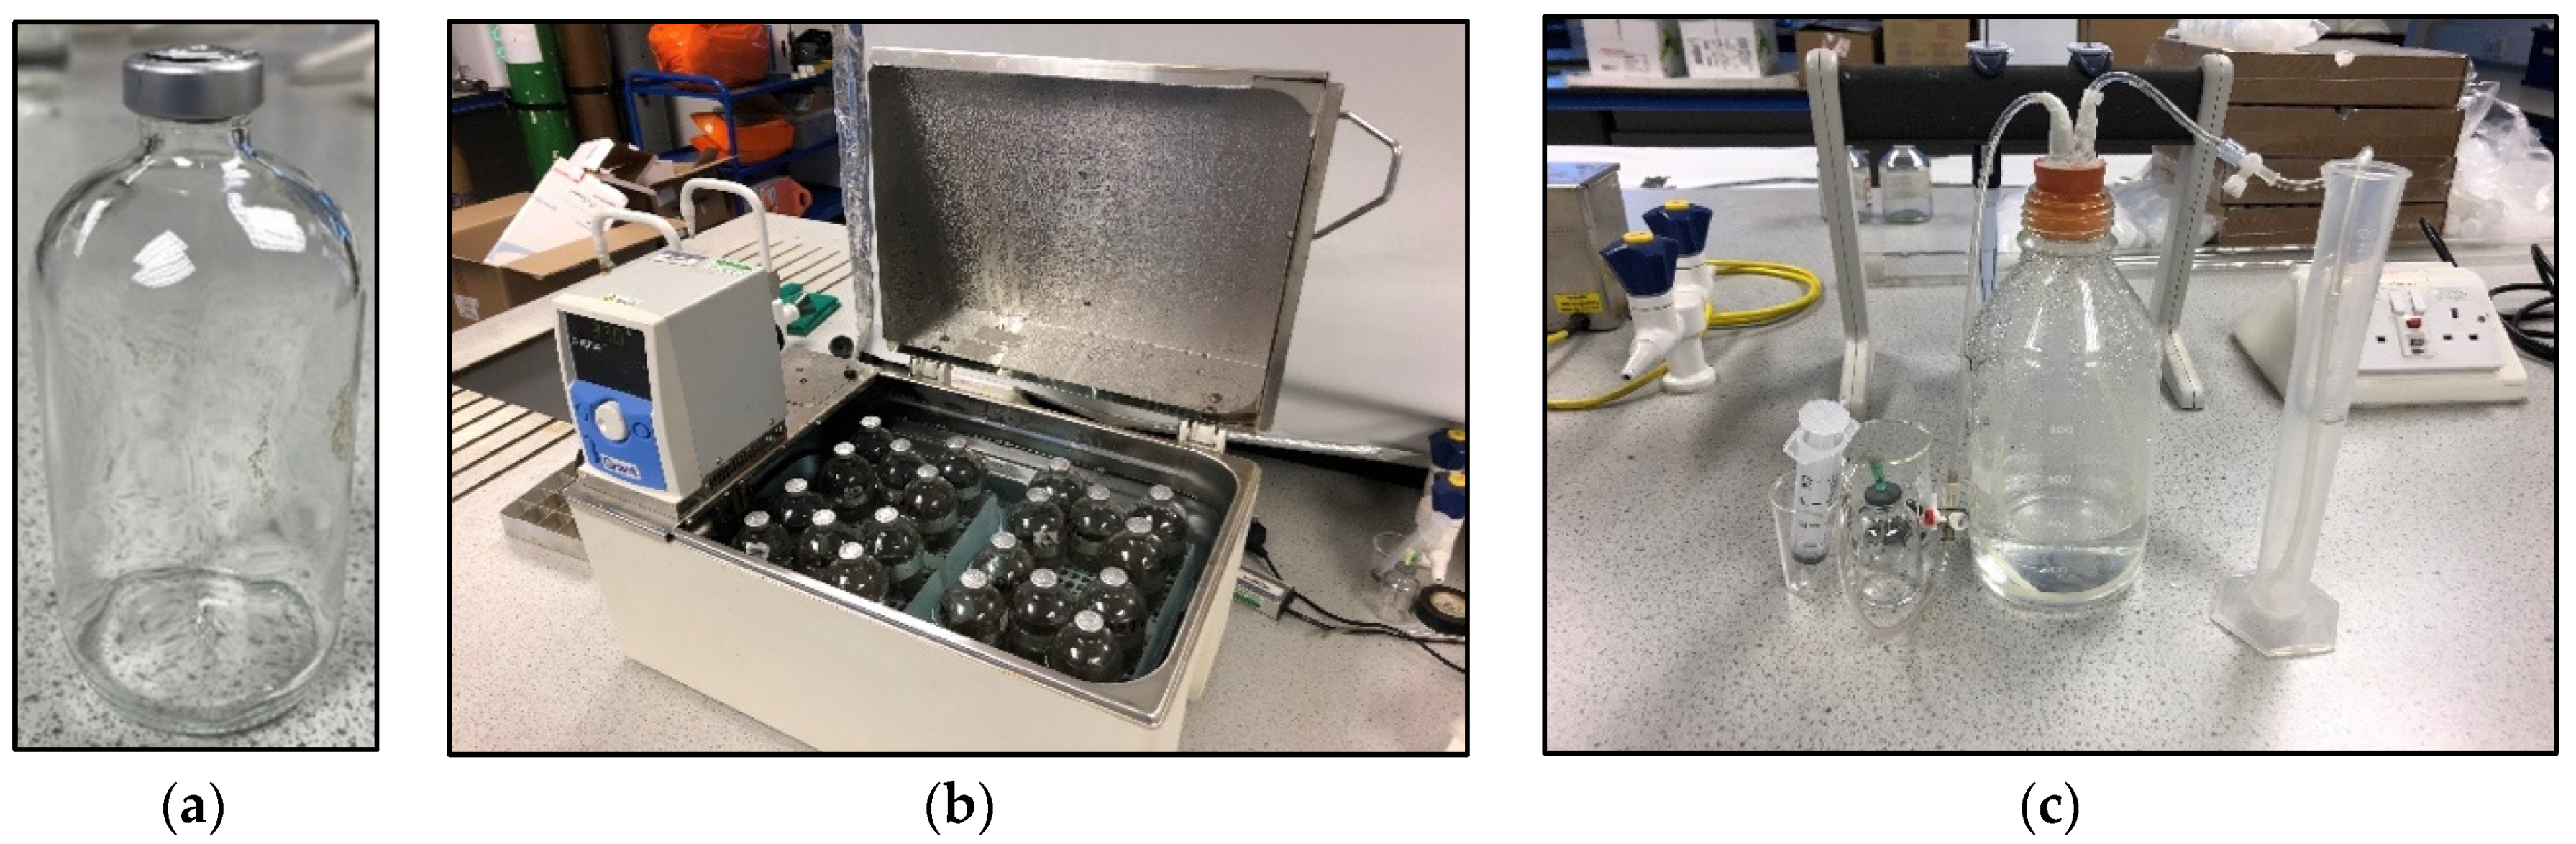
2.2. Inoculum Pre-Treatment and Experimental Setup

There is no universal pre-treatment method to inhibit hydrogen-consuming bacteria; thus, different methods are reported for conducting DF experiments [23,24,25,26,27]. The selection of pre-treatment methods used for this research work considered criteria, such as simplicity, previous reports in the literature (commonly used methods), practical access to reagents and equipment, as well as scale-up potential. Therefore, the three following pre-treatment methods for inactivating hydrogen-consuming bacteria were chosen [28]:
  • Acid-shock pre-treatment (AST) was performed by adjusting the pH of the digestate to pH 3 using 1 M HCl and storing it in a fridge at 4 °C for 24 h. After 24 h, the pH was returned to pH 7 using 1 M NaOH.
  • Basic-shock pre-treatment (BST) was performed by adjusting the pH of the digestate to pH 10 using 1 M NaOH and storing it in a fridge at 4 °C for 24 h. After 24 h, the pH was returned to pH 7 using 1 M HCl.
  • Heat-shock pre-treatment (HST) was conducted by heating the digestate for 20 min at 115 °C using a standard autoclave at approximately 1.5 bar.
The effectiveness of each pre-treatment method was tested by conducting batch BHP tests with the pre-treated digestate as the inoculum and glucose (D-glucose) as the sole carbon source (substrate). The standard substrate, glucose, was chosen for the BHP experiments because it is a simple carbon source, easy to digest and would easily allow for a comparison of the different pre-treatment methods based on the differences in process stability and ultimate H2 yields.
The BHP tests were set up using 160 mL Wheaton bottles as fermentative reactors with 70 mL working volume (Figure 3). The same set-up was previously tested for H2 leakage by Okoro-Shekwaga et al. [29], who confirmed the suitability of this method for achieving quantitative results. The reactors were sparged with nitrogen gas for 1 min and then immediately sealed with a rubber cap and aluminium crimp. The BHP tests included one control (untreated digestate as inoculum and glucose as substrate) and three tests (each pre-treated digestate as inoculum and glucose as substrate); all tests were conducted in triplicate with an inoculum to substrate ratio (ISR) of 1:1 (5 g vs. glucose to 5 g vs. inoculum) at 37 °C and pH 5.5 for 5 days.

2.3. Analytical Methods

2.3.1. Gas Analysis

The volume of gas produced from each BHP test was measured by the water-displacement method. For biogas composition, H2, CO2 and CH4 were measured by gas chromatography (GC—Agilent 7890A; Agilent, Santa Clara, CA, USA) with a thermal conductivity detector (TCD). This GC-TCD was fitted with a Carboxen 1010 PLOT column with the following dimensions: length 30 m, diameter 0.53 mm and film thickness 30 µm. The inlet and oven temperatures were 200 °C and 230 °C, respectively, with Argon used as carrier gas at 3 mL/min. This GC method was calibrated with three standard gas mixtures: (a) 20%-O2:80%-N2; (b) 50%-CH4:3%-H2:47%-N2; and (c) 10%-CO2:90%-N2 at predetermined intervals. Gas samples were manually injected using 200 µL injection volume.

2.3.2. Liquid Analysis

pH was measured by using a digital pH meter (HACH HQ40D; HACH, Loveland, CO, USA) and alkalinity by automatic titration (Mettler-Toledo auto-titrator T50; Mettler-Toledo, Columbus, OH, USA). VFA concentration was measured by gas chromatography (GC—Agilent 7890A, Santa Clara, CA, USA) with a flame ionization detector (FID). The GC-FID was fitted with a DB-FFAP column with the following dimensions: length 30 m, diameter 0.32 mm and film thickness 0.5 µm. The GC-FID was operated at 150 °C Inlet temperature and 200 °C oven temperature with Helium as carrier gas (10 mL/min). Liquid samples were injected by an autosampler at 10 µL injection volume. This GC method was calibrated with a standard Volatile Acid Standard Mix (SUPELCO, Darmstadt, Germany), which includes acetic, propionic, iso-butyric, butyric, iso-valeric, valeric, iso-caproic, caproic and heptanoic acids. The liquid samples for VFA analysis were prepared by lowering the pH to 2.00–2.20 with phosphoric acid and allowing to rest for 30 min. Acidified samples were then centrifuged for 5 min using a Pico 21 Centrifuge at 14,000 rpm for 5 min. The supernatant was then collected and filtered through a 0.2 µm fiberglass filter. Pyruvate, formate and ethanol were measured by high-performance liquid chromatography (HPLC—Thermo Ultimate 3000) with Photodiode-Array Detection (PDA detector) and Supelcogel™ C-610H (6% Crosslinked) column. The HPLC was operated at 0.5 mL/min flow rate, 10 mL sample injection volume, 30 °C column temperature and a mobile phase of 0.1% H3PO4 in distilled water. High-purity standards were used for calibration, including pyruvic acid (98%), formic acid (ACS reagent, ≥96%) and ethanol (BioUltra, ≥99.8%), from Sigma-Aldrich. Table 1 shows the characteristics of all reactors on Day 0.

2.3.3. Statistical Analysis

Minitab 18 statistical software was used to run correlation analyses between hydrogen yield and VFAs (acetate and butyrate) using a confidence level of α = 0.05.

2.3.4. Energy Balance of BHP Tests

Energy consumption (Ec) was calculated according to the energy consumption of heating the inoculum (digestate) (HST pre-treatment) from its initial temperature (37 °C) to the final temperature (115 °C). A water-heating calculator [30] was used to calculate (Ec) with the assumption that the density of the inoculum is equal to the density of water because of the inoculum vs. value (30 g/L). Energy production (Ep) was calculated according to the maximum hydrogen yield (191.8 mL-H2/g glucose-added), as shown in Section 3.1, and the energy production of hydrogen gas (33.6 Kwh/kg of hydrogen, [31]). Net energy was calculated by subtracting Ec from Ep. Note that energy balance of BHP with HST pre-treatment is based on 1 Kg substrate and 1 year of operation.

3. Results and Discussion

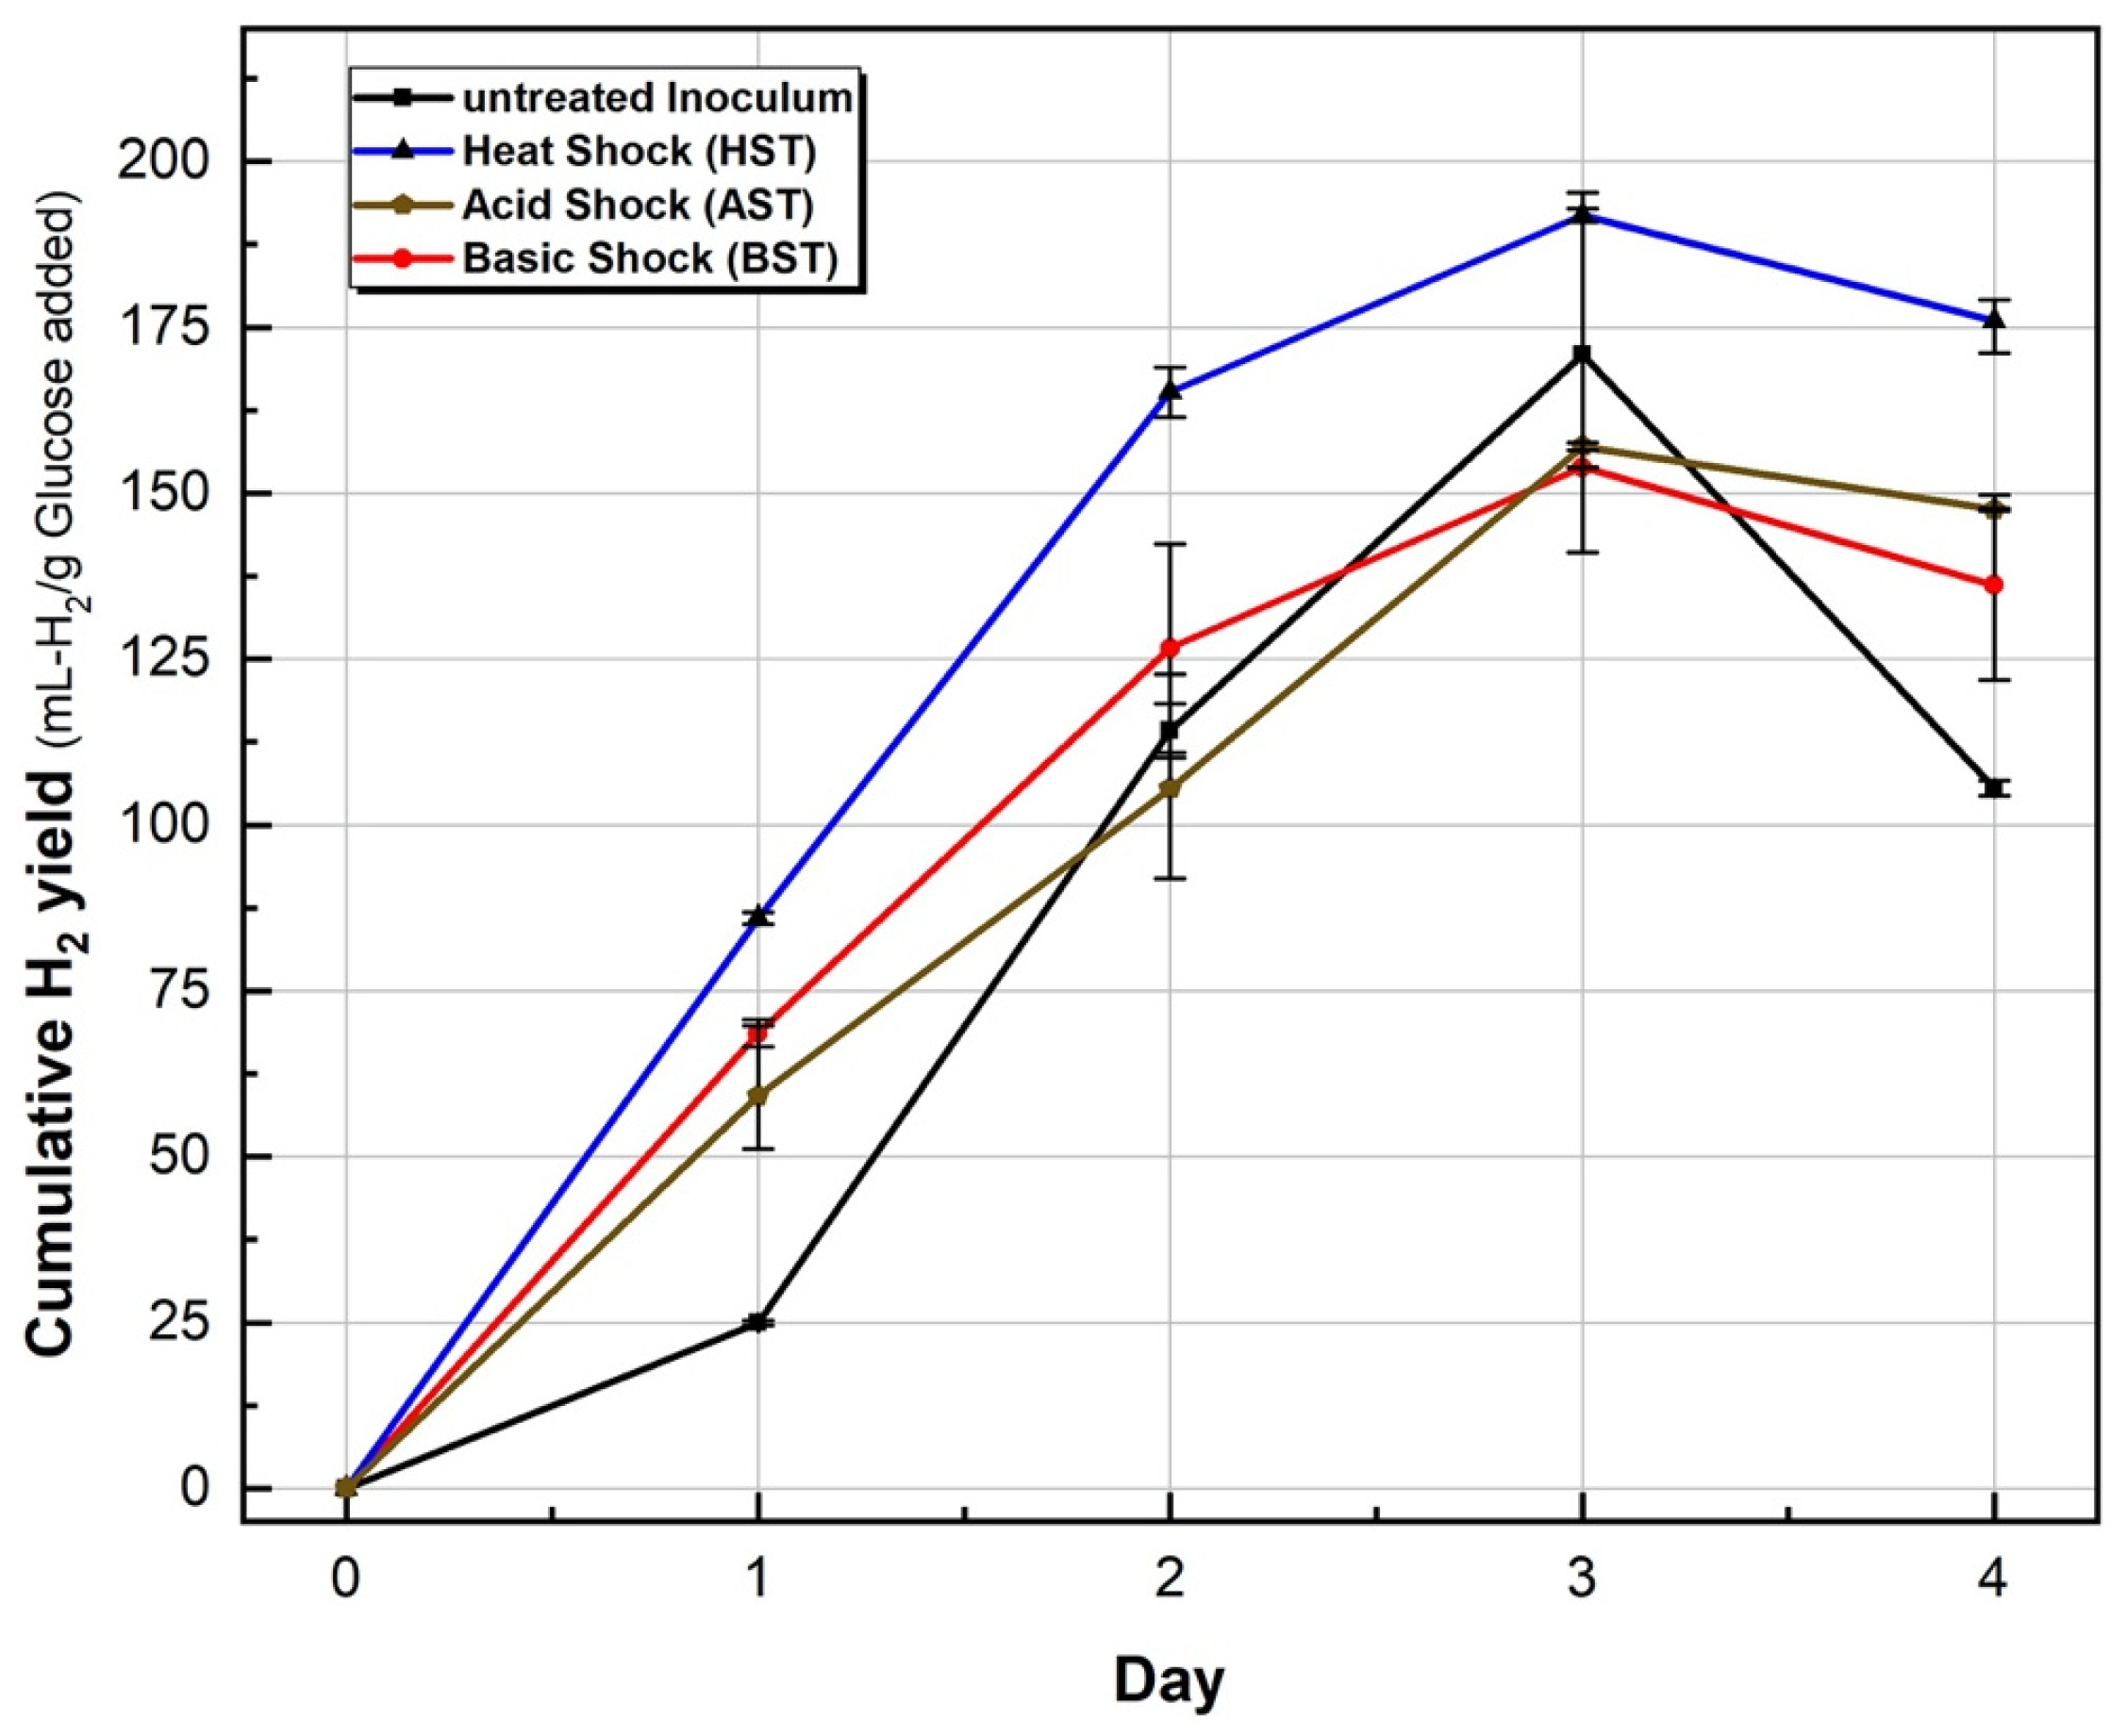
3.1. Hydrogen Yields

Cumulative hydrogen yield for the control and three test conditions is shown in Figure 4. The three test conditions (HST, AST and BST) produced high amounts of hydrogen gas during the 5-day DF process (BHP test), with no methane gas detected in any of the BHP reactors, including the control (untreated inoculum), as shown in Table 2. As the inoculum for this experiment was collected from AD reactors at Esholt WWTW, it might be that fermentative bacteria were dominant in this AD. Wang and Wan [28] reported a similar phenomenon with no methane detected for the untreated inoculum (also digestated sludge) with glucose as the substrate. Further, Luo [32] used the same type of inoculum and substrate and concluded that in addition to inoculum pre-treatment, the fermentation condition (mesophilic and low pH 5.5) also impacts methanogenesis inhibition. Contrariwise, Hu [18] used sewage sludge and methanogenic granules as an inoculum and glucose as a substrate and Chen [33] used sludge collected from a drying bed as the inoculum and glucose as the substrate; both of them reported detectable methane in biogas from the untreated inoculum during DF.
However, among the three pre-treatments and untreated inoculum investigated in the present study, HST achieved the maximum cumulative hydrogen production, 191.8 mL-H2/gVS added, which is slightly lower than [28], who reported that hydrogen production reached (221 mL-H2/gVS added) and higher than [32] (155 mL-H2/gVS added), as shown in Table 3, for HST of similar inoculum type, substrate and operation conditions (batch, temperature and pH).
One possible reason is the different heat-shock temperatures and retention times used in these studies (100 °C for 15 min) [28] and (100 °C for 60 min) [32], while in the present study, the HST was 115 °C for 20 min, which may have influenced some level of suppression of the hydrogen-producing bacteria [18,19]. The control (untreated inoculum) reached 170.91 mL-H2/gVS added, which is higher than 50 mL-H2/gVS added [28] and 156 mL-H2/gVS added [32] and it might imply that the fermentative bacteria were dominant in the inoculum used in the present study. AST and BST had a similar impact on hydrogen production, although BST showed a faster production rate in the first two days and both reached 154–157 mL-H2/gVS added at Day 3.
A comparison between untreated inoculum, HST, AST and BST might imply that the BST and AST did not provide long-term inhibition of hydrogen-consuming bacteria, which led to no additional impact on hydrogen production, in contrast to HST. In agreement with Wang and Wan [28], the BHP test with HST pre-treatment had the highest hydrogen yield and production rate: Day 1 (85.93), Day 2 (79.30), Day 3 (26.61) and Day 4 (−15.85) (negative (−) value because of hydrogen consumption this day) mL-H2/gVS added (on a daily basis), as shown in Figure 4. In all conditions, however, hydrogen production peaked by Day 3, followed by an observed decline in the hydrogen yield by Day 4. This decrease might be because of the bio-conversion of hydrogen gas to acetic acid through homoacetogenesis under anaerobic conditions [34,35], considering that homoacetogenic bacteria are spore-forming bacteria that can survive even after harsh pre-treatments while temporarily de-activated [36]. This reduction in hydrogen gas on Day 4 indicates the time needed to reach maximum hydrogen production for the specific type of inoculum and substrate used in this study: sewage digestate and glucose, respectively.
A simple energy balance was calculated based on the energy consumption of using an autoclave for HST pre-treatment and the estimated energy production from hydrogen yield in BHPHST. Table 4 shows the energy balance for the best inoculum pre-treatments (HST) according to hydrogen yield in Figure 4. The results show that the net energy was positive over 1 year of DF operation, which indicates that using an autoclave for HST is feasible from an energy production perspective. However, more energy can be produced by using the effluent of DF (reached by VFAs) in AD for biogas production, improving the net energy and making the overall process more feasible and attractive. More investigation is needed to optimise the hydrogen production for high/positive net energy production. This can be achieved using another heating instrument, such as a furnace, with lower energy consumption than an autoclave. Further, testing different periods of HST (less than 20 min) may improve the net energy production.

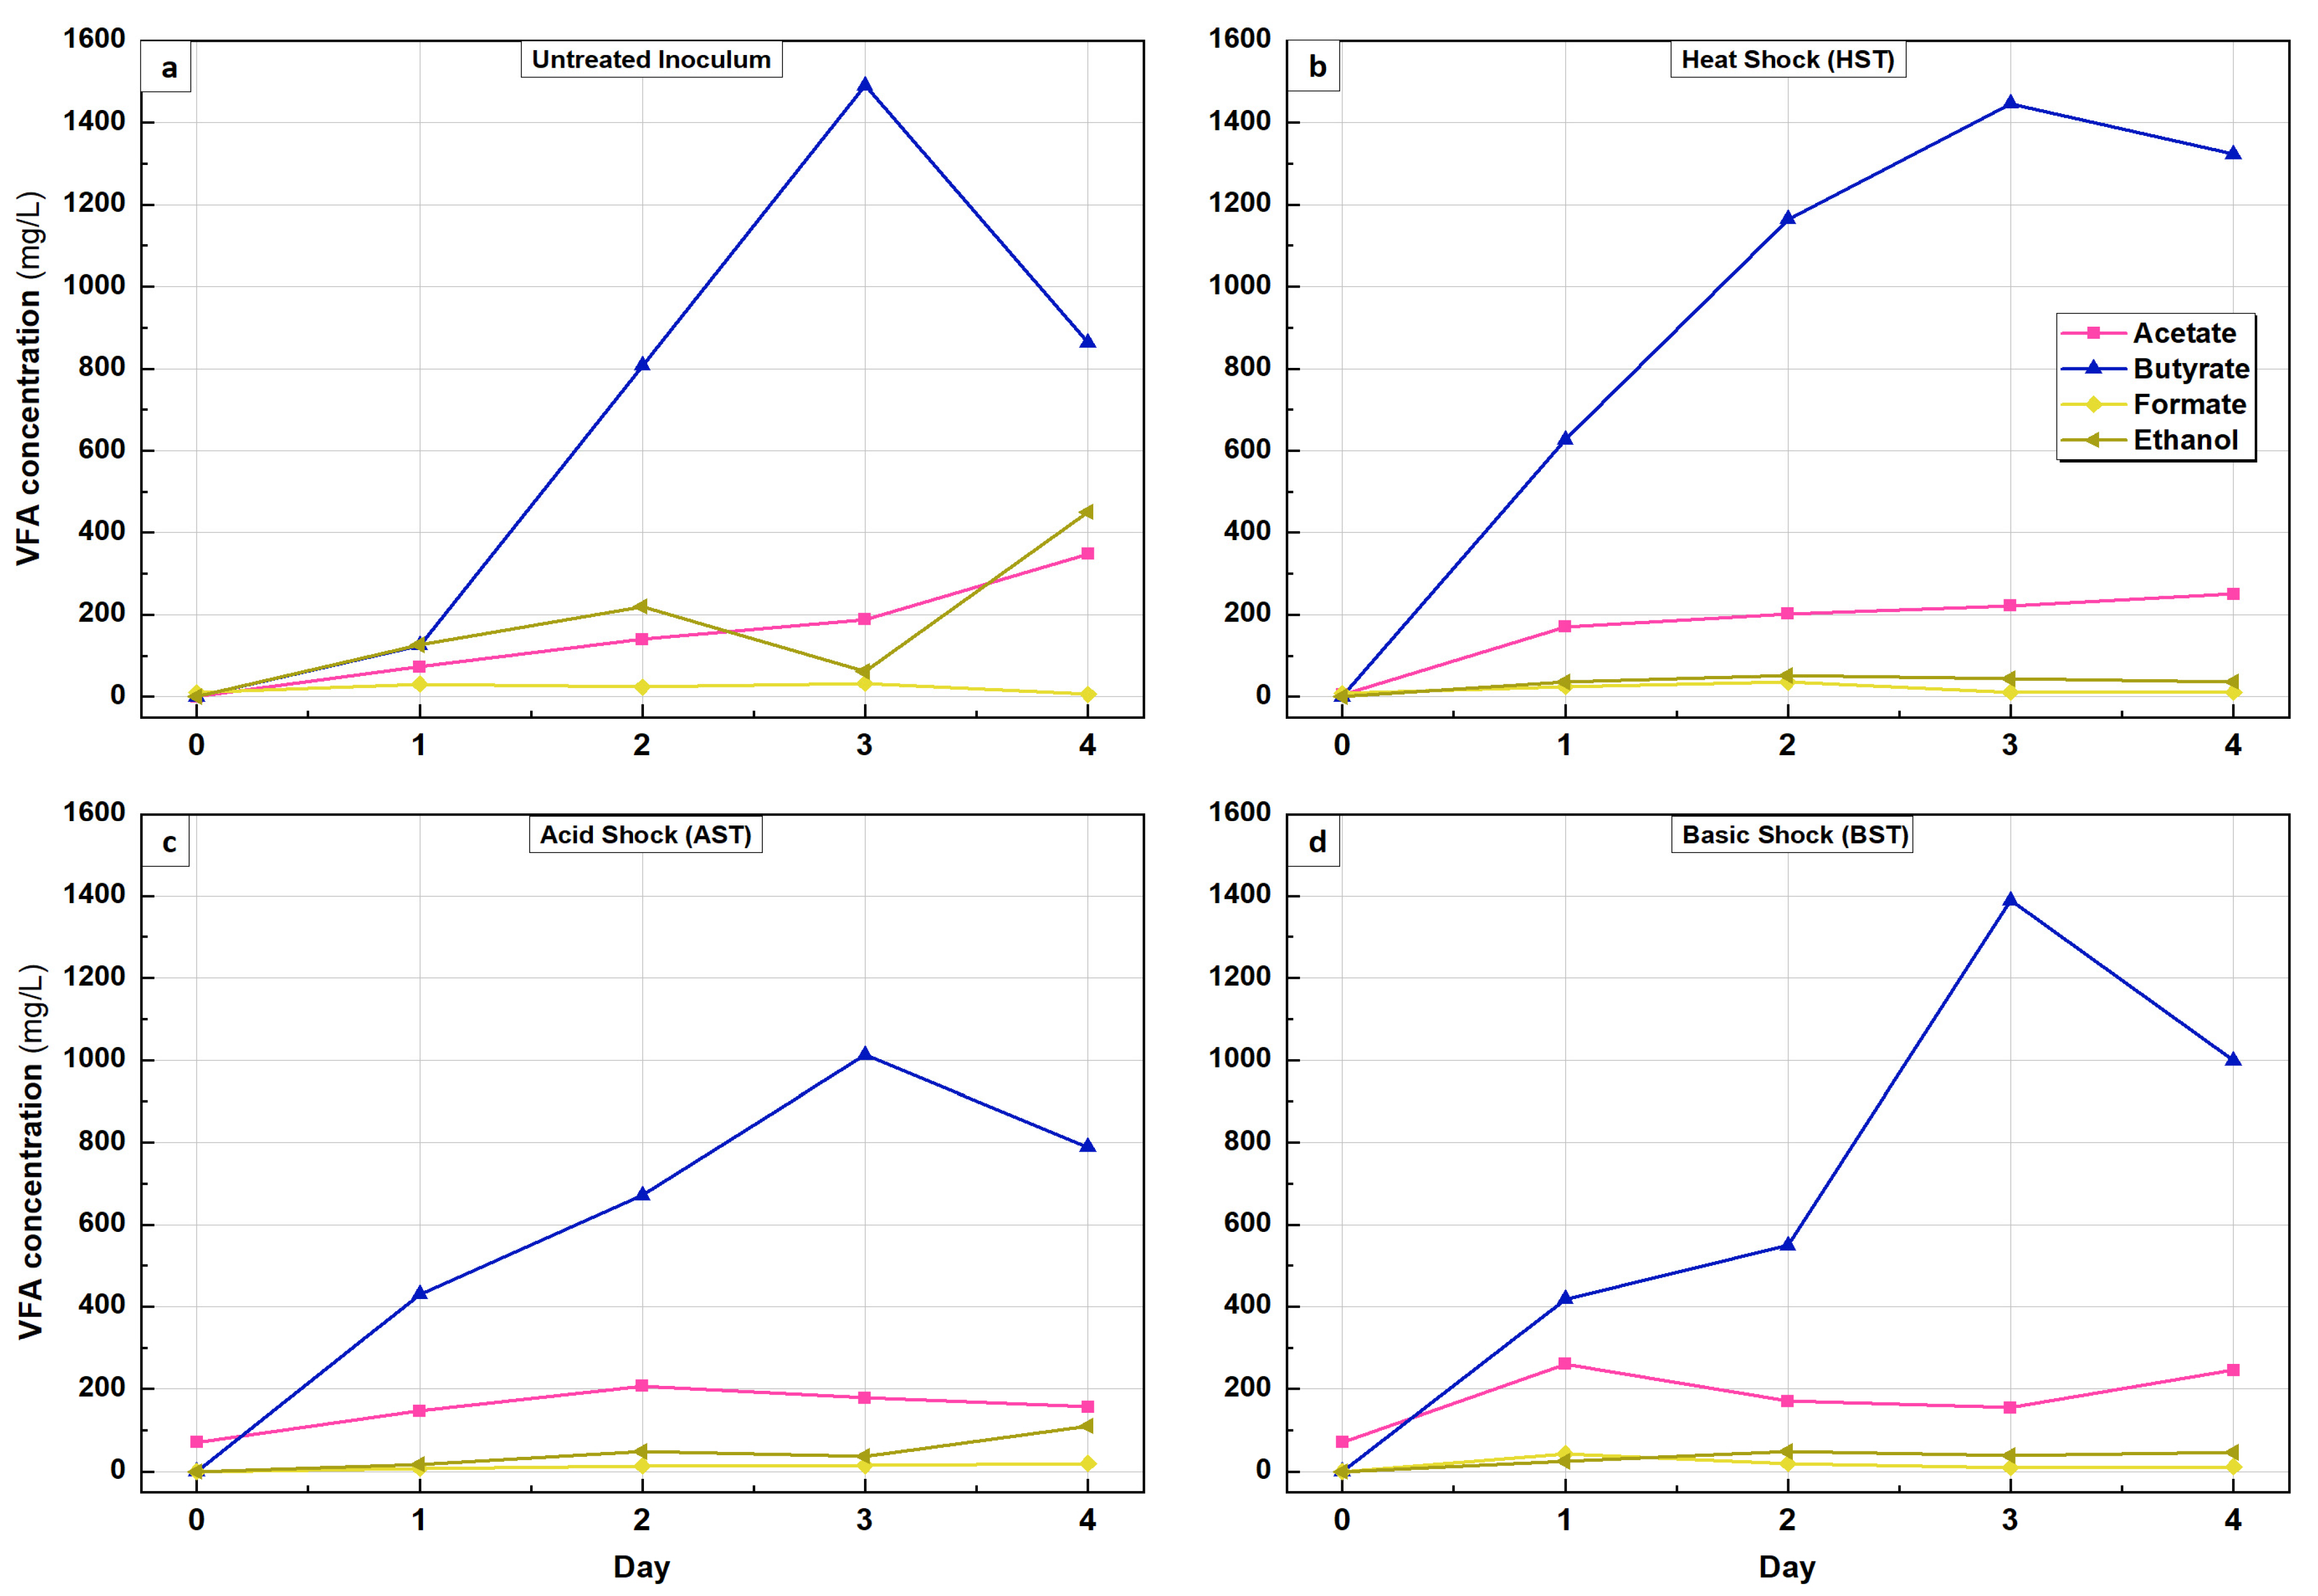
3.2. Volatile Fatty Acids and By-Product from Glucose Transformation

VFA analysis provides an understanding of the predominant glucose conversion pathways in the present study. The conversion pathway can affect the hydrogen yield from the BHP test. For example, 1 mole of glucose could theoretically yield 12 moles of hydrogen via complete oxidation, as shown in Equation (1) [37]; however, in the DF process, if the reaction follows the acetate pathway, only 4 moles of hydrogen would be produced, as shown in Equation (2) [13], while the butyrate pathway can produce only 2 moles of hydrogen.
C 6 H 12 O 6 + 6 H 2 O 12 H 2 + 6 C O 2
C 6 H 12 O 6 + 2 H 2 O 4 H 2 + 6 C O 2 + 2 C H 3 C O O H G 0   =   211   k j / m o l g l u c o s e
C 6 H 12 O 6 2 H 2 + 2 C O 2 + C H 3 C H 2 C H 2 C O O H G 0   =     266 k j / m o l g l u c o s e
Moreover, the lactic and ethanol pathways (as shown in Figure 1) yield no hydrogen, while the propionate pathway consumes hydrogen [12]. Therefore, the concentration of VFAs at the end of a DF process can be used as an indication of the conversion pathway and the maximum theoretical hydrogen production that could be achieved.
In the present study, the butyrate conversion route was the predominant one, followed by acetate accumulation, as shown in Figure 5a–d, in which case, Equations (2) and (3) would best describe the expected hydrogen yield from the BHP. The prevalence of butyrate and acetate production might be due to the low pH ranges (between 4.2 and 4.6) observed for all conditions (see Section 3.3). Several studies reported that the accumulation of butyric acid and acetic acid can be related to low pH ranges between 4.5 and 6.0, while ethanol and propionate can accumulate in DF that has neutral pH 7.0 or higher [14,38,39].
For all conditions, butyrate peaked at Day 3, with a concentration of 1490 mg/L, 1446 mg/L, 1388 mg/L and 1012 mg/L in the untreated, HST, BST and AST reactors, respectively, while acetic acid had a lower accumulation.
The low accumulation of acetic acid in comparison to butyric acid in the treated and untreated inoculum had a negative impact on hydrogen production by reducing and consuming the hydrogen in the reactors between Day 3 and Day 4, as shown in Table 5.
The decline in butyrate between Day 3 and Day 4 might be due to the re-activation of the acetogens and, consequently, the use of butyrate as a substrate for the production of acetic acid and hydrogen [40]. However, the corresponding decline in the hydrogen yield between Day 3 and Day 4 (Section 3.1) indicates a simultaneous bio-conversion of hydrogen gas to acetic acid via the homoacetogenesis reaction, which is a possible hydrogen sink under anaerobic conditions [35]. According to Table 5, there is a relationship between the level of acetate increments and the percentage reduction in hydrogen gas between Day 3 and Day 4. For example, the highest increment in acetate was observed with the untreated inoculum, which also had the highest reduction in hydrogen and AST, which had the lowest acetate increment and the lowest percentage hydrogen reduction. Similar results regarding the negative impact of acetic acid accumulation on hydrogen production were reported by [18,19,28,32].
The decrease in hydrogen production when a pre-treated inoculum was used was lower than when an untreated inoculum was used, indicating the effect of inoculum pre-treatment on sustaining the inactivation of hydrogen consumers during the DF process. Moreover, this drop in hydrogen yield on Day 4 indicates the point at which the pre-treated inoculum should be added to the reactor media (applicable to continuous DF) to sustain the inhibition of the hydrogen-consuming bacteria.

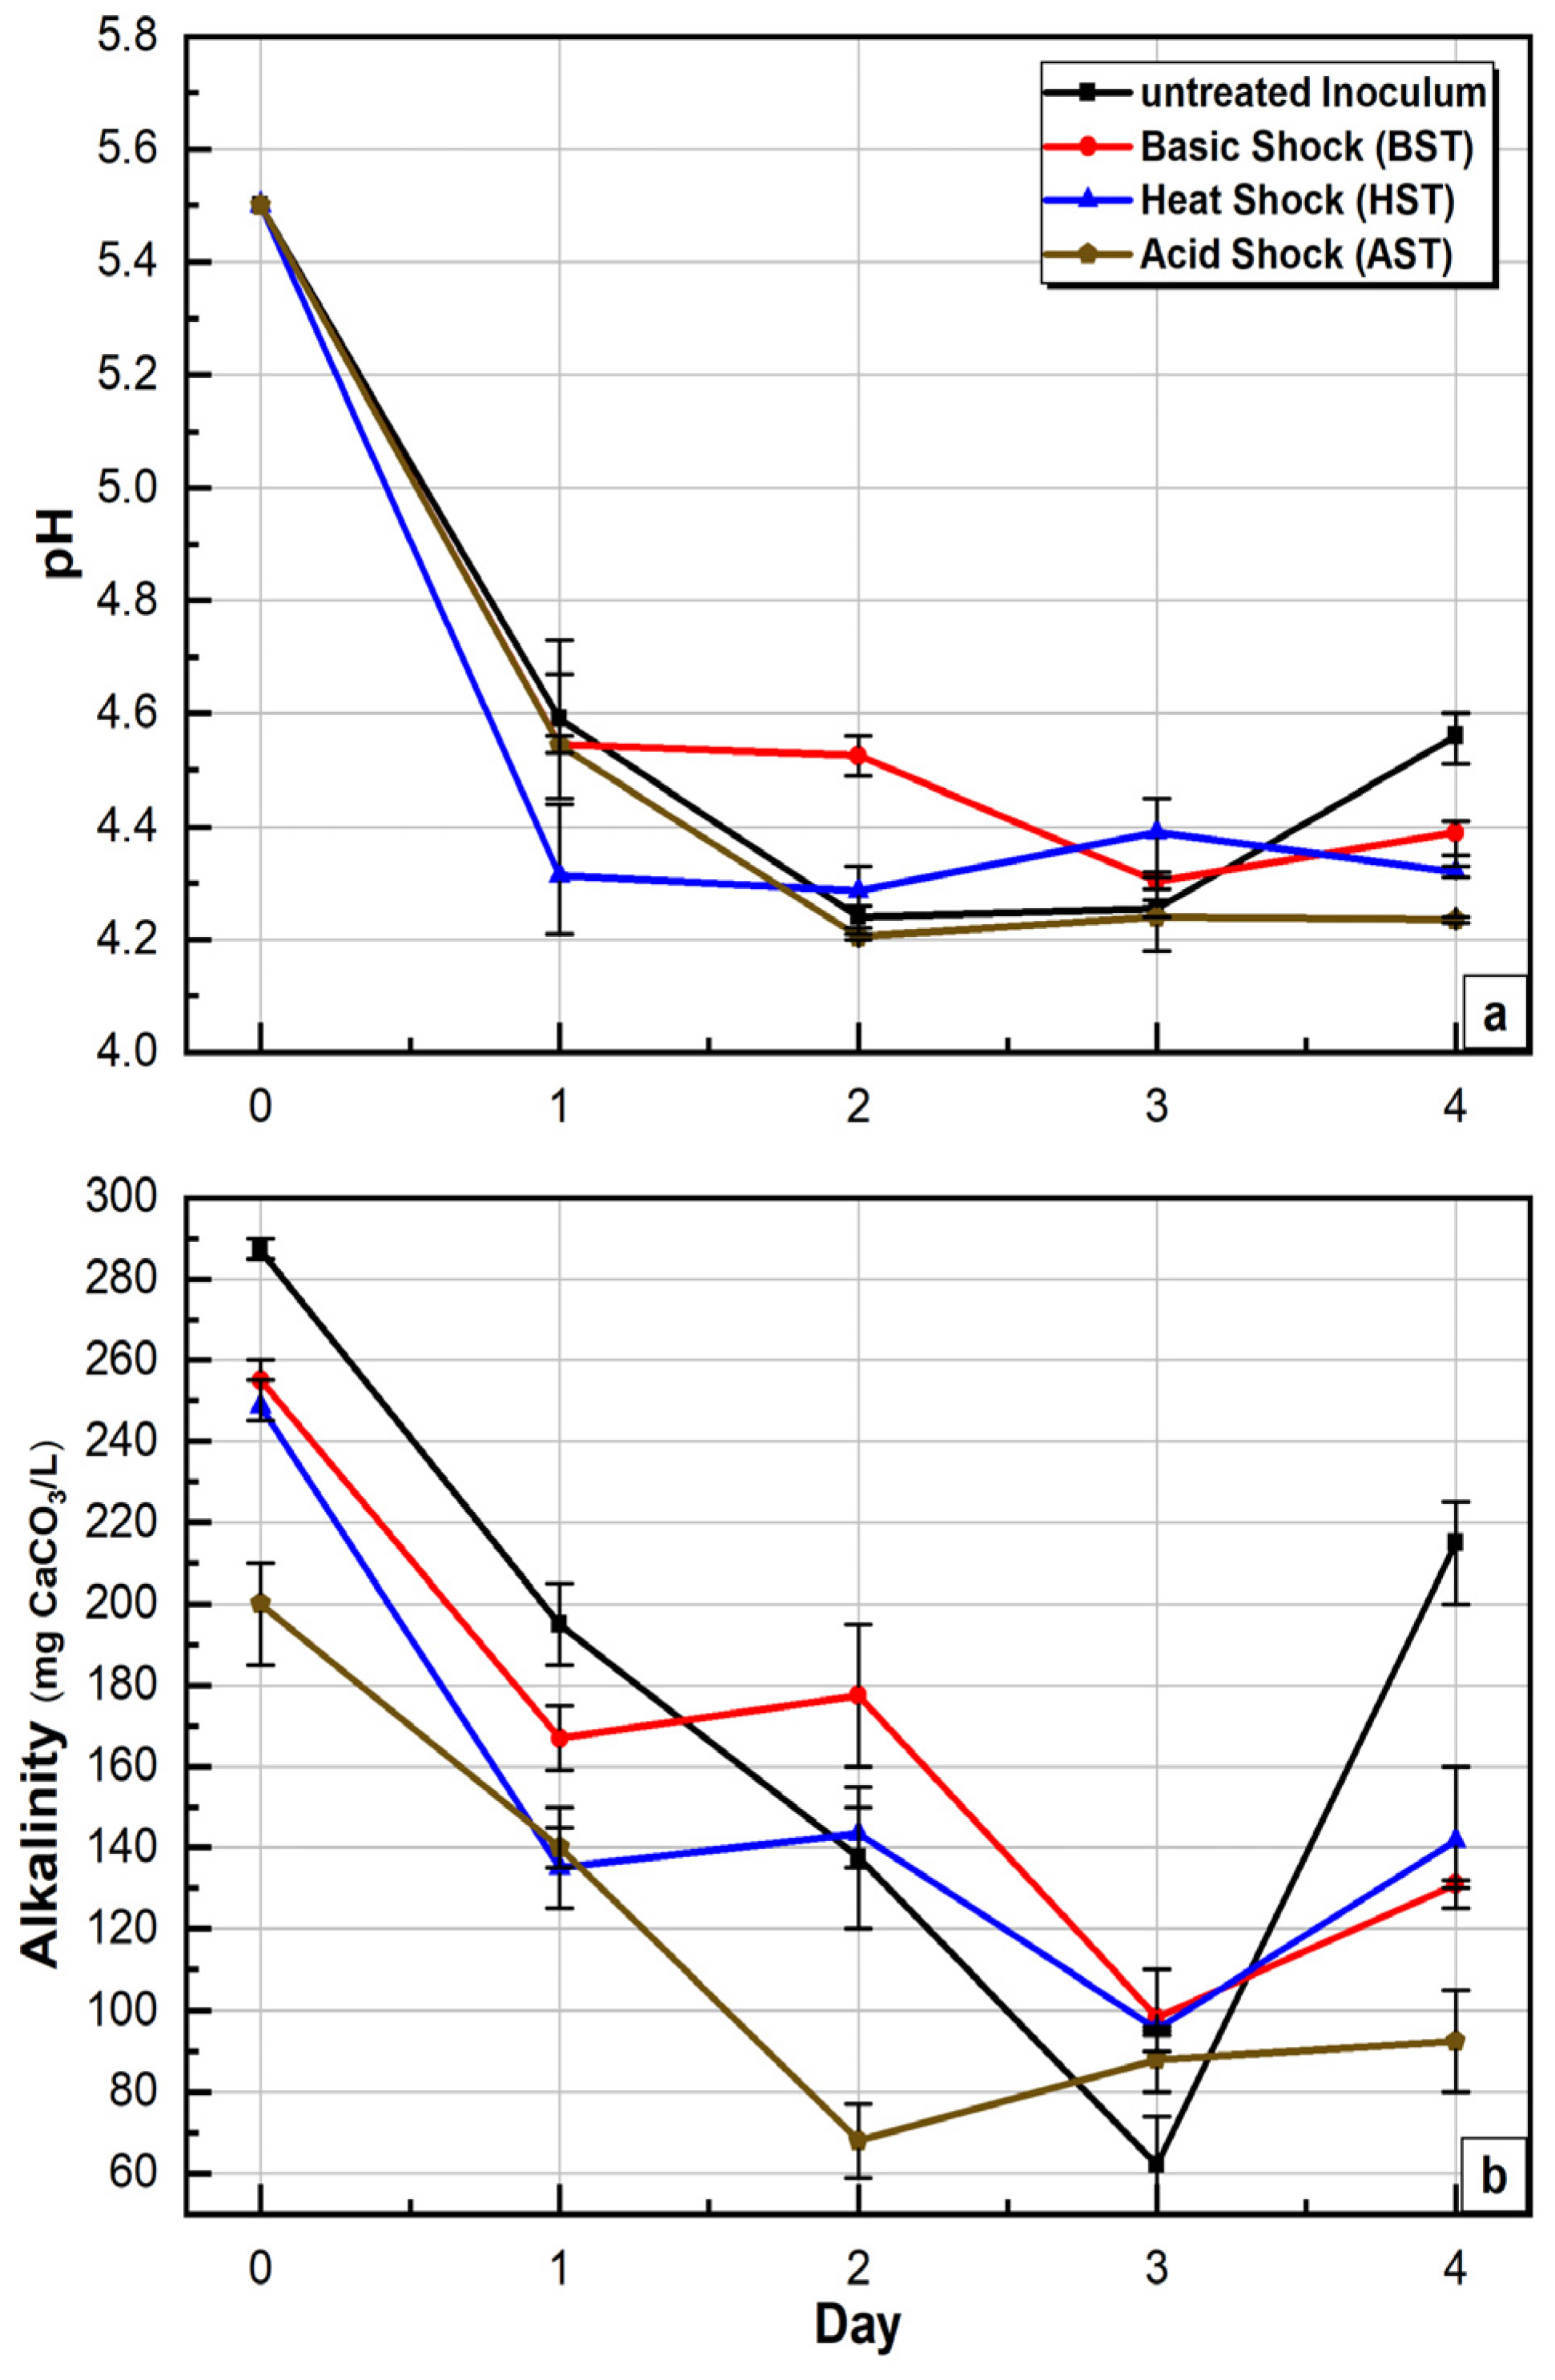
3.3. pH and Alkalinity

The pH and alkalinity have a crucial influence on the reactions occurring during DF. The pH value affects VFA accumulation; lower pH ranges (4.0–6.0) support butyrate and acetate accumulation and higher pH ranges (7.0–9.0) support ethanol and propionate accumulation [38,39]. Conversely, the pH also influences the diversity in the microbial community and, effectively, hydrogen production, i.e., at low pH levels, the dominant species is Clostridium, responsible for the production of butyrate, acetate and hydrogen [38,41]. The optimum pH range, which enhances the hydrogenases (hydrogen producers) in DF, was suggested to be between pH 5.0 and pH 7.0. [15].
Alkalinity also has an effect on hydrogen production in DF as the VFA accumulation results in a drop in pH; alkalinity helps to puffer the pH within the optimal range of hydrogen production in DF. Mtui [42] reported that alkalinity was the most important parameter affecting hydrogen production. Bina and Amin [43] reported that the optimum starting alkalinity for DF that allowed for the highest hydrogen yield (220 mL/d) was 1325 mg/L CaCO3, for initial alkalinity tested between 670 and 2678 mg/L CaCO3.
In this study, the initial pH was adjusted to 5.5 for both control (untreated inoculum) and tests (treated inoculum), which is within the recommended pH level mentioned earlier. The production of VFA by Day 1 resulted in a decline in pH in the control and test reactors (Figure 6a) and HST, which had the highest VFA production at Day 1 (829 mg/L) also had the lowest pH value, 4.3, on Day 1. However, the VFA composition of HST was predominantly butyrate and acetate and, hence, a higher hydrogen yield was obtained from the same (see Section 3.1). Nonetheless, the final pH for the control and all tests was between 4.2 and 4.6. Similarly, a final pH of 4.6 was reported by [44] for batch BHP tests.
The starting alkalinity (Day 0) was between 200 and 287 mg CaCO3/L for control and three tests (Figure 6b). Like the pH, VFA production led to the consumption of the alkalinity (Figure 6b) and as VFA accumulation progressed through time, a continuous decline in the alkalinity was observed for all conditions. However, HST and BST showed better alkalinity recovery potentials, consequently providing pH buffering, which allowed for slightly higher pH levels under these treatment conditions. Although the starting alkalinity levels in this study were lower than levels reported in other studies, the production of hydrogen production for all conditions in this study demonstrates that hydrogen can still be produced during DF under very low alkalinity.

3.4. Process Kinetics

The fitting was run for the period of hydrogen accumulation from Day 0 to Day 3 where hydrogen reached its peak, as this model (MGompertz) is extensively used for batch experiments that have a growth rate without gas consumption [17,45,46]. Theoretical hydrogen potential (BHPth) can be determined either by Equation (2) or (3) (Section 3.2); both equations are based on the butyrate or acetate pathway conversion. Table 6 shows the comparison between experimental hydrogen potential (BHPexp) and BHPth according to the dominant conversion pathway, which is the butyrate pathway, as shown in Figure 5a–d.
As butyrate conversion was dominant from day 0 to day 3, as shown in Table 6, the highest percentage of (BHPexp/BHPth) was for HST (77%), although the others (untreated, AST and BST) were 63%, 62% and 68.5, respectively. The HST is the most suitable pre-treatment for this type of inoculum and substrate in term of maximizing hydrogen production and inhibiting hydrogen-consuming bacteria (homoacetogenic and methanogens).
Table 7 shows the process kinetics for untreated and treated inoculum. HST has the highest hydrogen production potential (P) and maximum hydrogen production rate (Rm). The long lag phase for the untreated inoculum (19.54 h), compared with the treated inoculum (4.25–6.64 h), shows the positive impact of pre-treatment on enhancing a rapid production of hydrogen after setup, hence, shortening the time needed to reach maximum hydrogen during the DF process. The R2 value, as shown in Table 7, ranged from 0.987 to 0.999, which demonstrates that the MGompertz model provided a good fit to the data. These results also show that there is a relationship between lag time and VFA accumulation, especially the dominant VFA, which, in this study, was butyric acid. As shown in Figure 5a, butyrate slowly increased during the first 24 h and reached 125 mg/L, while for the treated inoculum, there was a fast rate of accumulation of butyrate, as shown in Figure 5b–d. The increment was around 3.5-fold for AST and BST and 5-fold for HST.
The statistical analysis presented in Table 8 shows the correlation relationship between hydrogen yield, butyrate and acetate obtained from Minitab 18.
As mentioned earlier, the acetate pathway has higher hydrogen production potential than the butyrate pathway [13]. Table 8 shows that the correlation analysis is consistent with hydrogen yield. HST had the highest hydrogen yield and significant correlation with both acetate and butyrate, while untreated and BST had lower hydrogen yield and significant correlation with butyrate only. However, AST shows that even if the correlation is significant between hydrogen and both VFAs, the hydrogen yield may be reduced. A similar result was reported by [17], as BST had higher hydrogen yield than untreated inoculum because of the conversion type, as there was a significant correlation between hydrogen yield and both acetate and butyrate in BST, while in the untreated inoculum, significant correlation was found only between hydrogen and butyrate.

4. Conclusions

This study demonstrates that an inoculum pre-treatment is an essential step toward enhancing hydrogen production in the DF process. HST was the best pre-treatment for hydrogen production and the stability of DF, while AST and BST made no difference to BHP performance. The highest cumulative hydrogen production was achieved with HST, which could be attributed to the longer inhibition of hydrogen consumers. In terms of VFA analysis, the dominant conversion pathway for glucose in this study was the butyrate pathway for the untreated and treated inoculum. This study also shows that there is a relationship between lag time and VFA accumulation, as lag time of DF processes might be used as an indicator of how efficient the pre-treatment on inhibiting hydrogen-consuming bacteria is.
However, fermentation operation conditions, such as temperature, alkalinity, initial pH and ISR, have a crucial impact. Hence, without selecting the proper conditions for the inoculum and substrate types, a high re-activation of hydrogen-consuming bacteria (acetobacteria or methanogens) will occur. Moreover, this study demonstrated that hydrogen can still be produced during DF under very low alkalinity. Therefore, it is very important to control the operating conditions to ensure the best VFA route to gain maximum hydrogen production from DF.
The hydrogen production values in this study may differ when a different substrate, such as food waste, sewage sludge or agricultural waste, is used. To create a guideline procedure for all DF experiments in future, therefore, the first step is to understand the capability of using an inoculum (sole or complex) for hydrogen production and how it may react with different pre-treatment methods (HST, BST and AST). Moreover, it is necessary to understand which pre-treatments lead to maximum hydrogen production and ensure maximum time for inhibiting the activity of hydrogen-consuming bacteria.

Author Contributions

Conceptualisation: S.A.-H., C.K.O.-S., L.F. and M.A.C.-V.; Methodology: S.A.-H., C.K.O.-S., L.F. and M.A.C.-V.; Experimental work: S.A.-H. and C.K.O.-S.; Validation: S.A.-H., C.K.O.-S., L.F. and M.A.C.-V.; Formal Data Analysis: S.A.-H., C.K.O.-S., L.F. and M.A.C.-V.; Investigation: S.A.-H.; Data Curation: S.A.-H., C.K.O.-S., L.F. and M.A.C.-V.; Writing—original draft preparation: S.A.-H.; Writing—review and editing: S.A.-H., C.K.O.-S., L.F., A.R. and M.A.C.-V.; Visualisation: S.A.-H.; Supervision: C.K.O.-S., L.F., A.R. and M.A.C.-V.; Project Administration: L.F., A.R. and M.A.C.-V.; Resources and Funding Acquisition: S.A.-H. and M.A.C.-V. All authors have read and agreed to the published version of the manuscript.

Funding

This research was funded by the Kuwait Institute for Scientific Research—KISR (Kuwait), through a PhD studentship awarded to S.A.-H, and the School of Civil Engineering, University of Leeds (UK).

Data Availability Statement

No additional data are associated with this article.

Acknowledgments

The authors would like to thank Dr David Elliott, Emma Tidswell and Morgan McGowan, from the Public Health Engineering Laboratory, School of Civil Engineering, University of Leeds, for their technical assistance.

Conflicts of Interest

The authors declare no conflict of interest.

References

  1. Graboski, M.S.; McCormick, R.L. Combustion of fat and vegetable oil derived fuels in diesel engines. Prog. Energy Combust. Sci. 1998, 24, 125–164. [Google Scholar] [CrossRef]
  2. Zajic, J.; Kosaric, N.; Brosseau, J. Microbial production of hydrogen. In Advances in Biochemical Engineering; Springer: Berlin/Heidelberg, Germany, 1978; Volume 9, pp. 57–109. [Google Scholar]
  3. Łukajtis, R.; Hołowacz, I.; Kucharska, K.; Glinka, M.; Rybarczyk, P.; Przyjazny, A.; Kamiński, M. Hydrogen production from biomass using dark fermentation. Renew. Sustain. Energy Rev. 2018, 91, 665–694. [Google Scholar] [CrossRef]
  4. Momirlan, M.; Veziroglu, T. Current status of hydrogen energy. Renew. Sustain. Energy Rev. 2002, 6, 141–179. [Google Scholar] [CrossRef]
  5. Kapdan, I.K.; Kargi, F. Bio-hydrogen production from waste materials. Enzym. Microb. Technol. 2006, 38, 569–582. [Google Scholar] [CrossRef]
  6. Logan, B.E. Peer Reviewed: Extracting Hydrogen and Electricity from Renewable Resources. Environ. Sci. Technol. 2004, 38, 160A–167A. [Google Scholar] [CrossRef] [PubMed] [Green Version]
  7. Bertuccioli, L.; Chan, A.; Hart, D.; Lehner, F.; Madden, B.; Standen, E. Study on Development of Water Electrolysis in the EU. Fuel Cells Hydrogen Joint Undertakings: Lausanne, Switzerland, 2014; pp. 1–160. [Google Scholar]
  8. Ghimire, A.; Frunzo, L.; Pontoni, L.; D’Antonio, G.; Lens, P.N.L.; Esposito, G.; Pirozzi, F. Dark fermentation of complex waste biomass for biohydrogen production by pretreated thermophilic anaerobic digestate. J. Environ. Manag. 2015, 152, 43–48. [Google Scholar] [CrossRef]
  9. Nath, K.; Muthukumar, M.; Kumar, A.; Das, D. Kinetics of two-stage fermentation process for the production of hydrogen. Int. J. Hydrogen Energy 2008, 33, 1195–1203. [Google Scholar] [CrossRef]
  10. Antonopoulou, G.; Ntaikou, I.; Stamatelatou, K.; Lyberatos, G. Biological and Fermentative Production of Hydrogen. In Handbook of Biofuels Production; Woodhead Publishing: Cambridge, UK, 2011; pp. 305–346. [Google Scholar] [CrossRef]
  11. Wang, J.; Wan, W. Factors influencing fermentative hydrogen production: A review. Int. J. Hydrogen Energy 2009, 34, 799–811. [Google Scholar] [CrossRef]
  12. Guo, X.M.; Trably, E.; Latrille, E.; Carrère, H.; Steyer, J.-P. Hydrogen production from agricultural waste by dark fermentation: A review. Int. J. Hydrogen Energy 2010, 35, 10660–10673. [Google Scholar] [CrossRef]
  13. De Gioannis, G.; Muntoni, A.; Polettini, A.; Pomi, R. A review of dark fermentative hydrogen production from biodegradable municipal waste fractions. Waste Manag. 2013, 33, 1345–1361. [Google Scholar] [CrossRef]
  14. Kim, S.-H.; Han, S.-K.; Shin, H.-S. Feasibility of biohydrogen production by anaerobic co-digestion of food waste and sewage sludge. Int. J. Hydrogen Energy 2004, 29, 1607–1616. [Google Scholar] [CrossRef]
  15. Li, C.; Fang, H.H.P. Fermentative Hydrogen Production from Wastewater and Solid Wastes by Mixed Cultures. Crit. Rev. Environ. Sci. Technol. 2007, 37, 1–39. [Google Scholar] [CrossRef]
  16. Oh, S.-E.; Van Ginkel, S.; Logan, B.E. The Relative Effectiveness of pH Control and Heat Treatment for Enhancing Biohydrogen Gas Production. Environ. Sci. Technol. 2003, 37, 5186–5190. [Google Scholar] [CrossRef] [PubMed]
  17. Cai, M.; Liu, J.; Wei, Y. Enhanced Biohydrogen Production from Sewage Sludge with Alkaline Pretreatment. Environ. Sci. Technol. 2004, 38, 3195–3202. [Google Scholar] [CrossRef] [PubMed]
  18. Hu, B.; Chen, S. Pretreatment of methanogenic granules for immobilized hydrogen fermentation. Int. J. Hydrogen Energy 2007, 32, 3266–3273. [Google Scholar] [CrossRef]
  19. Zhu, H.; Béland, M. Evaluation of alternative methods of preparing hydrogen producing seeds from digested wastewater sludge. Int. J. Hydrogen Energy 2006, 31, 1980–1988. [Google Scholar] [CrossRef]
  20. Mu, Y.; Yu, H.-Q.; Wang, G. Evaluation of three methods for enriching H2-producing cultures from anaerobic sludge. Enzym. Microb. Technol. 2007, 40, 947–953. [Google Scholar] [CrossRef]
  21. Mohan, S.V.; Babu, V.L.; Sarma, P. Effect of various pretreatment methods on anaerobic mixed microflora to enhance biohydrogen production utilizing dairy wastewater as substrate. Bioresour. Technol. 2008, 99, 59–67. [Google Scholar] [CrossRef]
  22. Cheong, D.-Y.; Hansen, C.L. Bacterial stress enrichment enhances anaerobic hydrogen production in cattle manure sludge. Appl. Microbiol. Biotechnol. 2006, 72, 635–643. [Google Scholar] [CrossRef]
  23. Chaganti, S.R.; Kim, D.-H.; Lalman, J.A. Dark fermentative hydrogen production by mixed anaerobic cultures: Effect of inoculum treatment methods on hydrogen yield. Renew. Energy 2012, 48, 117–121. [Google Scholar] [CrossRef]
  24. Cai, J.; Wang, G.; Li, Y.; Zhu, D.; Pan, G. Enrichment and hydrogen production by marine anaerobic hydrogen-producing microflora. Chin. Sci. Bull. 2009, 54, 2656–2661. [Google Scholar] [CrossRef] [Green Version]
  25. Liu, H.; Wang, G.; Zhu, D.; Pan, G. Enrichment of the hydrogen-producing microbial community from marine intertidal sludge by different pretreatment methods. Int. J. Hydrogen Energy 2009, 34, 9696–9701. [Google Scholar] [CrossRef]
  26. Pendyala, B.; Chaganti, S.R.; Lalman, J.A.; Shanmugam, S.R.; Heath, D.D.; Lau, P.C. Pretreating mixed anaerobic communities from different sources: Correlating the hydrogen yield with hydrogenase activity and microbial diversity. Int. J. Hydrogen Energy 2012, 37, 12175–12186. [Google Scholar] [CrossRef]
  27. Argun, H.; Kargi, F. Effects of sludge pre-treatment method on bio-hydrogen production by dark fermentation of waste ground wheat. Int. J. Hydrogen Energy 2009, 34, 8543–8548. [Google Scholar] [CrossRef]
  28. Wang, J.; Wan, W. Comparison of different pretreatment methods for enriching hydrogen-producing bacteria from digested sludge. Int. J. Hydrogen Energy 2008, 33, 2934–2941. [Google Scholar] [CrossRef]
  29. Okoro-Shekwaga, C.K. Improving the Biomethane Yield and Biogas Quality of Food Waste during Anaerobic Digestion by Sequential Process Optimisation and Biomethanation; University of Leeds: Leeds, UK, 2019. [Google Scholar]
  30. Darcy, M. Water Heating Calculator. 2022. Available online: https://www.omnicalculator.com/physics/water-heating (accessed on 24 March 2022).
  31. Molloy, P. Run on Less with Hydrogen Fuel Cells. 2019. Available online: https://www.act-news.com/news/fcevs-run-on-less/ (accessed on 24 March 2022).
  32. Luo, G.; Karakashev, D.; Xie, L.; Zhou, Q.; Angelidaki, I. Long-term effect of inoculum pretreatment on fermentative hydrogen production by repeated batch cultivations: Homoacetogenesis and methanogenesis as competitors to hydrogen production. Biotechnol. Bioeng. 2011, 108, 1816–1827. [Google Scholar] [CrossRef]
  33. Chen, C.-C.; Lin, C.-Y.; Lin, M.-C. Acid–base enrichment enhances anaerobic hydrogen production process. Appl. Microbiol. Biotechnol. 2002, 58, 224–228. [Google Scholar] [CrossRef]
  34. Akutsu, Y.; Li, Y.-Y.; Harada, H.; Yu, H.-Q. Effects of temperature and substrate concentration on biological hydrogen production from starch. Int. J. Hydrogen Energy 2009, 34, 2558–2566. [Google Scholar] [CrossRef]
  35. Zhao, Y.; Liang, X.; Mu, H.; Zhang, X. Biohydrogen Production from Sewage Sludge by Sequential Dark and Photo Fermentation. J. Biobased Mater. Bioenergy 2015, 9, 95–100. [Google Scholar] [CrossRef]
  36. Valdez-Vazquez, I.; Ponce-Noyola, M.T.; Poggi-Varaldo, H.M. Nutrients related to spore germination improve H2 production from heat-shock-treated consortia. Int. J. Hydrogen Energy 2009, 34, 4291–4295. [Google Scholar] [CrossRef]
  37. Patel, S.K.; Kumar, P.; Kalia, V.C. Enhancing biological hydrogen production through complementary microbial metabolisms. Int. J. Hydrogen Energy 2012, 37, 10590–10603. [Google Scholar] [CrossRef]
  38. Hawkes, F.R.; Hussy, I.; Kyazze, G.; Dinsdale, R.; Hawkes, D.L. Continuous dark fermentative hydrogen production by mesophilic microflora: Principles and progress. Int. J. Hydrogen Energy 2007, 32, 172–184. [Google Scholar] [CrossRef]
  39. Pakarinen, O.; Lehtomäki, A.; Rintala, J. Batch dark fermentative hydrogen production from grass silage: The effect of inoculum, pH, temperature and VS ratio. Int. J. Hydrogen Energy 2008, 33, 594–601. [Google Scholar] [CrossRef]
  40. Yang, G.; Wang, J. Fermentative hydrogen production from sewage sludge. Crit. Rev. Environ. Sci. Technol. 2017, 47, 1219–1281. [Google Scholar] [CrossRef]
  41. Temudo, M.F.; Muyzer, G.; Kleerebezem, R.; van Loosdrecht, M. Diversity of microbial communities in open mixed culture fermentations: Impact of the pH and carbon source. Appl. Microbiol. Biotechnol. 2008, 80, 1121–1130. [Google Scholar] [CrossRef] [Green Version]
  42. Mtui, G.Y. Recent advances in pretreatment of lignocellulosic wastes and production of value added products. Afr. J. Biotechnol. 2009, 8, 1398–1415. [Google Scholar]
  43. Bina, B.; Amin, M.M.; Pourzamani, H.; Fatehizadeh, A.; Ghasemian, M.; Mahdavi, M.; Taheri, E. Biohydrogen production from alkaline wastewater: The stoichiometric reactions, modeling, and electron equivalent. Methodsx 2019, 6, 1496–1505. [Google Scholar] [CrossRef]
  44. Zhang, Y.; Liu, G.; Shen, J. Hydrogen production in batch culture of mixed bacteria with sucrose under different iron concentrations. Int. J. Hydrogen Energy 2005, 30, 855–860. [Google Scholar] [CrossRef]
  45. Pagliaccia, P.; Gallipoli, A.; Gianico, A.; Montecchio, D.; Braguglia, C. Single stage anaerobic bioconversion of food waste in mono and co-digestion with olive husks: Impact of thermal pretreatment on hydrogen and methane production. Int. J. Hydrogen Energy 2016, 41, 905–915. [Google Scholar] [CrossRef] [Green Version]
  46. Zwietering, M.H.; Jongenburger, I.; Rombouts, F.M.; Van ’T Riet, K. Modeling of the Bacterial Growth Curve. Appl. Environ. Microbiol. 1990, 56, 1875–1881. [Google Scholar] [CrossRef]
Figure 1. Conversion routes for glucose in dark fermentation processes, adapted from [14].
Energies 16 01233 g001
Figure 2. Sewage sludge processing at Esholt wastewater plant, Bradford, UK.
Energies 16 01233 g002
Figure 3. BHP equipment and material. (a) Wheaton bottle (160 mL), (b) water bath 37 °C, (c) water-displacement device.
Energies 16 01233 g003
Figure 4. Cumulative hydrogen production for untreated and treated inoculum during 5-day BHP tests (average value of triplicate with max/min bar).
Energies 16 01233 g004
Figure 5. VFA accumulation during 5-day BHP tests: (a) untreated inoculum, (b) HST, (c) AST and (d) BST.
Energies 16 01233 g005
Figure 6. The behaviour curve of (a) pH and (b) alkalinity during 5-day BHP tests (average value of triplicate with max/min bar).
Energies 16 01233 g006
Table 1. Characterisation results for all reactors on Day 0 for BHP tests.
ParameterUnitControlTest ITest IITest III
Inoculum-Untreated digestateHeat shock treated digestate
(HST)
Acid shock treated digestate
(AST)
Basic shock treated digestate
(BST)
Substrate-GlucoseGlucoseGlucoseGlucose
pH-5.55.55.55.5
Alkalinitymg CaCO3/L287 (±3)249 (±6)200 (±13)255 (±9)
TS%1.23 (±0.09)1.40 (±0.10)1.12 (±0.28)1.15 (±0.11)
VS%0.88 (±0.04)1.00 (±0.06)0.80 (±0.31)0.82 (±0.11)
TS: total solids; VS: volatile solids; Standard deviation from the mean (n = 3) is reported in brackets.
Table 2. Biogas composition of the maximum biogas volume produced during 5-day BHP experiments.
ParameterUnitControlTest ITest IITest III
Inoculum-Untreated digestateHeat shock treated digestate
(HST)
Acid shock treated digestate
(AST)
Basic shock treated digestate
(BST)
Substrate-GlucoseGlucoseGlucoseGlucose
Total biogas a mL207.7203.3192.7198.7
H2mL (%)59.7 (28.7)62.4 (30.7)52.8 (27.4)54.9 (27.6)
CO2mL (%)70.8 (34.1)61.7 (30.3)50.2 (26.1)60.6 (30.5)
N2mL (%)77.1 (37.1)79.3 (39.0)89.7 (46.5)83.2 (41.9)
CH4mL (%)0.0 (0)0.0 (0)0.0 (0)0.0 (0)
O2mL (%)0.0 (0)0.0 (0)0.0 (0)0.0 (0)
a Total biogas volume represents the maximum volume reached for the produced biogas from the Wheaton bottles with 70 mL working volume. The existence of N2 gas is due to the sparged process at the set-up phase of the BHP experiment (for oxygen removal). No methane and oxygen were detected during BHP experiments.
Table 3. Comparison of different inoculum pre-treatment methods in BHP experiments.
Test conditionsPre-TreatmentInitial pHHydrogen Yield
(mL-H2/g Glucose Added)
Reference
Inoculum: Digested sewage sludge


Substrate: Glucose

Temperature: Mesophilic
(35–37 °C)


Operational conditions: Batch reactor


Untreated5.5153a
a
7157
766c
5.5171 (27.5)This study
HST5.5155a
a
7141
6.2120b
7221c
5.5192 (1.4)This study
BST7136c
5.5154 (4.9)This study
AST5.5154a
a
7145
799c
5.5157 (0.8)This study
(a) [32]: hydrogen yield is from the fifth batch, (b) [16] and (c) [28] HST: Heat shock, BST: Basic shock and AST: acid shock (STD: standard deviation from the mean (n = 3)).
Table 4. Energy balance of BHP with HST pre-treatment based on 1 Kg substrate and 1 year of operation.
Energy Consumption (Ec)Energy Production
(Ep)
Net Energy
(Ep–Ec)
Kwh/Kg inoculum.yearKwh/Kg substrate.yearKwh
23.7 a42.3 b+18.64
a Ec was calculated according to the energy consumption of heating the inoculum (digestate) (HST pre-treatment) from its initial temperature (37 °C) to the final temperature (115 °C). A water-heating calculator [30] was used to calculate (Ec) with the assumption that the density of inoculum is equal to the density of water because of the inoculum vs. value (30 g/L). b Ep was calculated according to the maximum hydrogen yield (191.8 mL-H2/g glucose added) and the energy production of hydrogen gas (33.6 Kwh/kg of hydrogen, [31]).
Table 5. The effect of acetic acid on hydrogen production during 5-day BHP tests.
Pre-TreatmentAcetic Acid Concentration
(mg/L)
Maximum Hydrogen YieldHydrogen Reduction (%) at Day 4
Day 3Day 4Increment a(mL-H2/g Glucose Added)
Untreated189 (38.2)348 (43.9)159171 (27.5)38%
HST222 (51.6)251 (7.1)29192 (1.4)8%
AST178 (15.5)157 (17.4)-21154 (0.9)6%
BST155 (22.7)246 (83.7)91157 (4.9)13%
HST: Heat shock; BST: Basic shock; AST: acid shock. a difference between Day 3 and Day 4. (STD: standard deviation from the mean (n = 3)).
Table 6. Comparison between experimental hydrogen potential (BHPexp) and theoretical hydrogen potential (BHPth).
Conversion Pathway TypePre-TreatmentTheoretical Hydrogen Yield Potential
(BHPth)
Experimental
Hydrogen Yield Potential
(BHPexp)
(BHPexp/BHPth)
Mole-H2/Mole Glucose Added%
ButyrateUntreated2.001.37 (0.22)68.5
HST1.54 (0.01)77.0
AST1.26 (0.01)63.0
BST1.24 (0.00)62.0
HST: Heat shock; BST: Basic shock; AST: acid shock. (STD: standard deviation from the mean (n = 3)).
Table 7. Process kinetics for untreated and treated inoculum during 5-day BHP tests.
Pre-TreatmentPRm λ R2
(mL)(mL/h)(h)
untreated178.84.3119.540.997
HST197.24.906.640.999
AST195.52.604.250.987
BST159.83.535.160.998
HST: Heat shock, BST: Basic shock and AST: acid shock.
Table 8. Correlation analysis between hydrogen, butyrate and acetate.
Pre-TreatmentCorrelation
(Hydrogen-Acetate)
Correlation
(Hydrogen-Butyrate)
n
Untreated0.594 *0.939 **14
HST0.936 **0.996 **15
AST0.821 **0.991 **13
BST0.4170.973 **13
HST: Heat shock, BST: Basic shock and AST: acid shock. * significant correlation with 0.05 > p-value > 0.01. ** significant correlation with 0.01 > p-value.
Disclaimer/Publisher’s Note: The statements, opinions and data contained in all publications are solely those of the individual author(s) and contributor(s) and not of MDPI and/or the editor(s). MDPI and/or the editor(s) disclaim responsibility for any injury to people or property resulting from any ideas, methods, instructions or products referred to in the content.

