

3D CFD Modelling of Performance of a Vertical Axis Turbine


Abstract
1. Introduction
2. Background
2.1. Vertical Axis Wind Turbine
2.2. Darrieus Turbine
2.3. Savonius Turbine
2.4. Hybrid Turbines
2.5. Turbulence
2.6. Analysis Parameters
2.7. Simulations
2.7.1. 2D and 3D
2.7.2. Turbulence Models
2.7.3. Convergence
2.7.4. Simulation Analysis
2.8. Experiments
2.9. Previous Work on the VAWT Design
3. Simulation Methodology
- Creating simplified geometry and domain.
- Meshing the domain.
- Setting up the solver and performing the simulation.
- Extracting data.
3.1. Single Blade/Aerofoil
3.2. VAWT
4. Experiment Methodology
4.1. Single Blade/Aerofoil
4.2. VAWT
5. Simulation Results and Discussion
5.1. Single Blade/Aerofoil
5.2. Darrieus Turbine
5.3. Darrieus Turbine Design Optimisation
5.4. Savonius Turbine
5.5. Savonius Turbine Design Optimisation
6. Experimental Results and Discussion
6.1. Single Blade/Aerofoil
6.2. Darrieus
6.3. Savonius
7. Conclusions and Recommendations for Further Research
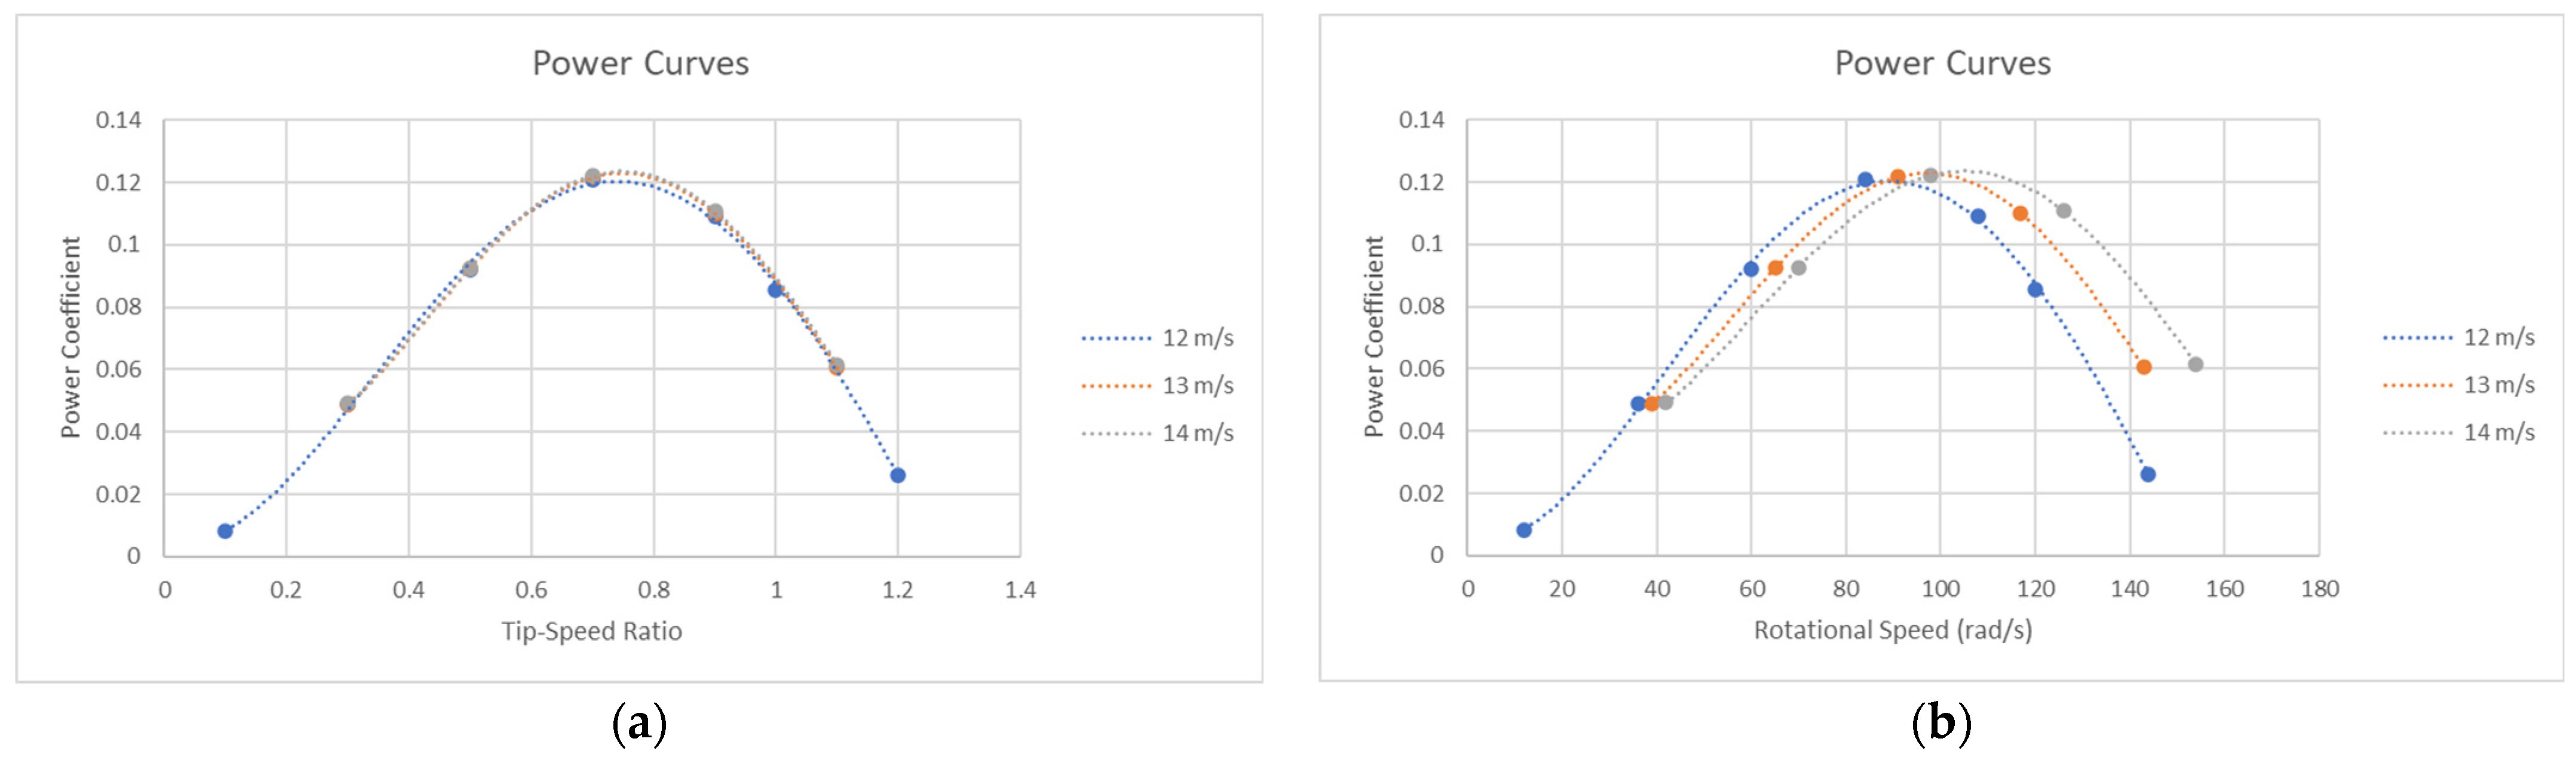
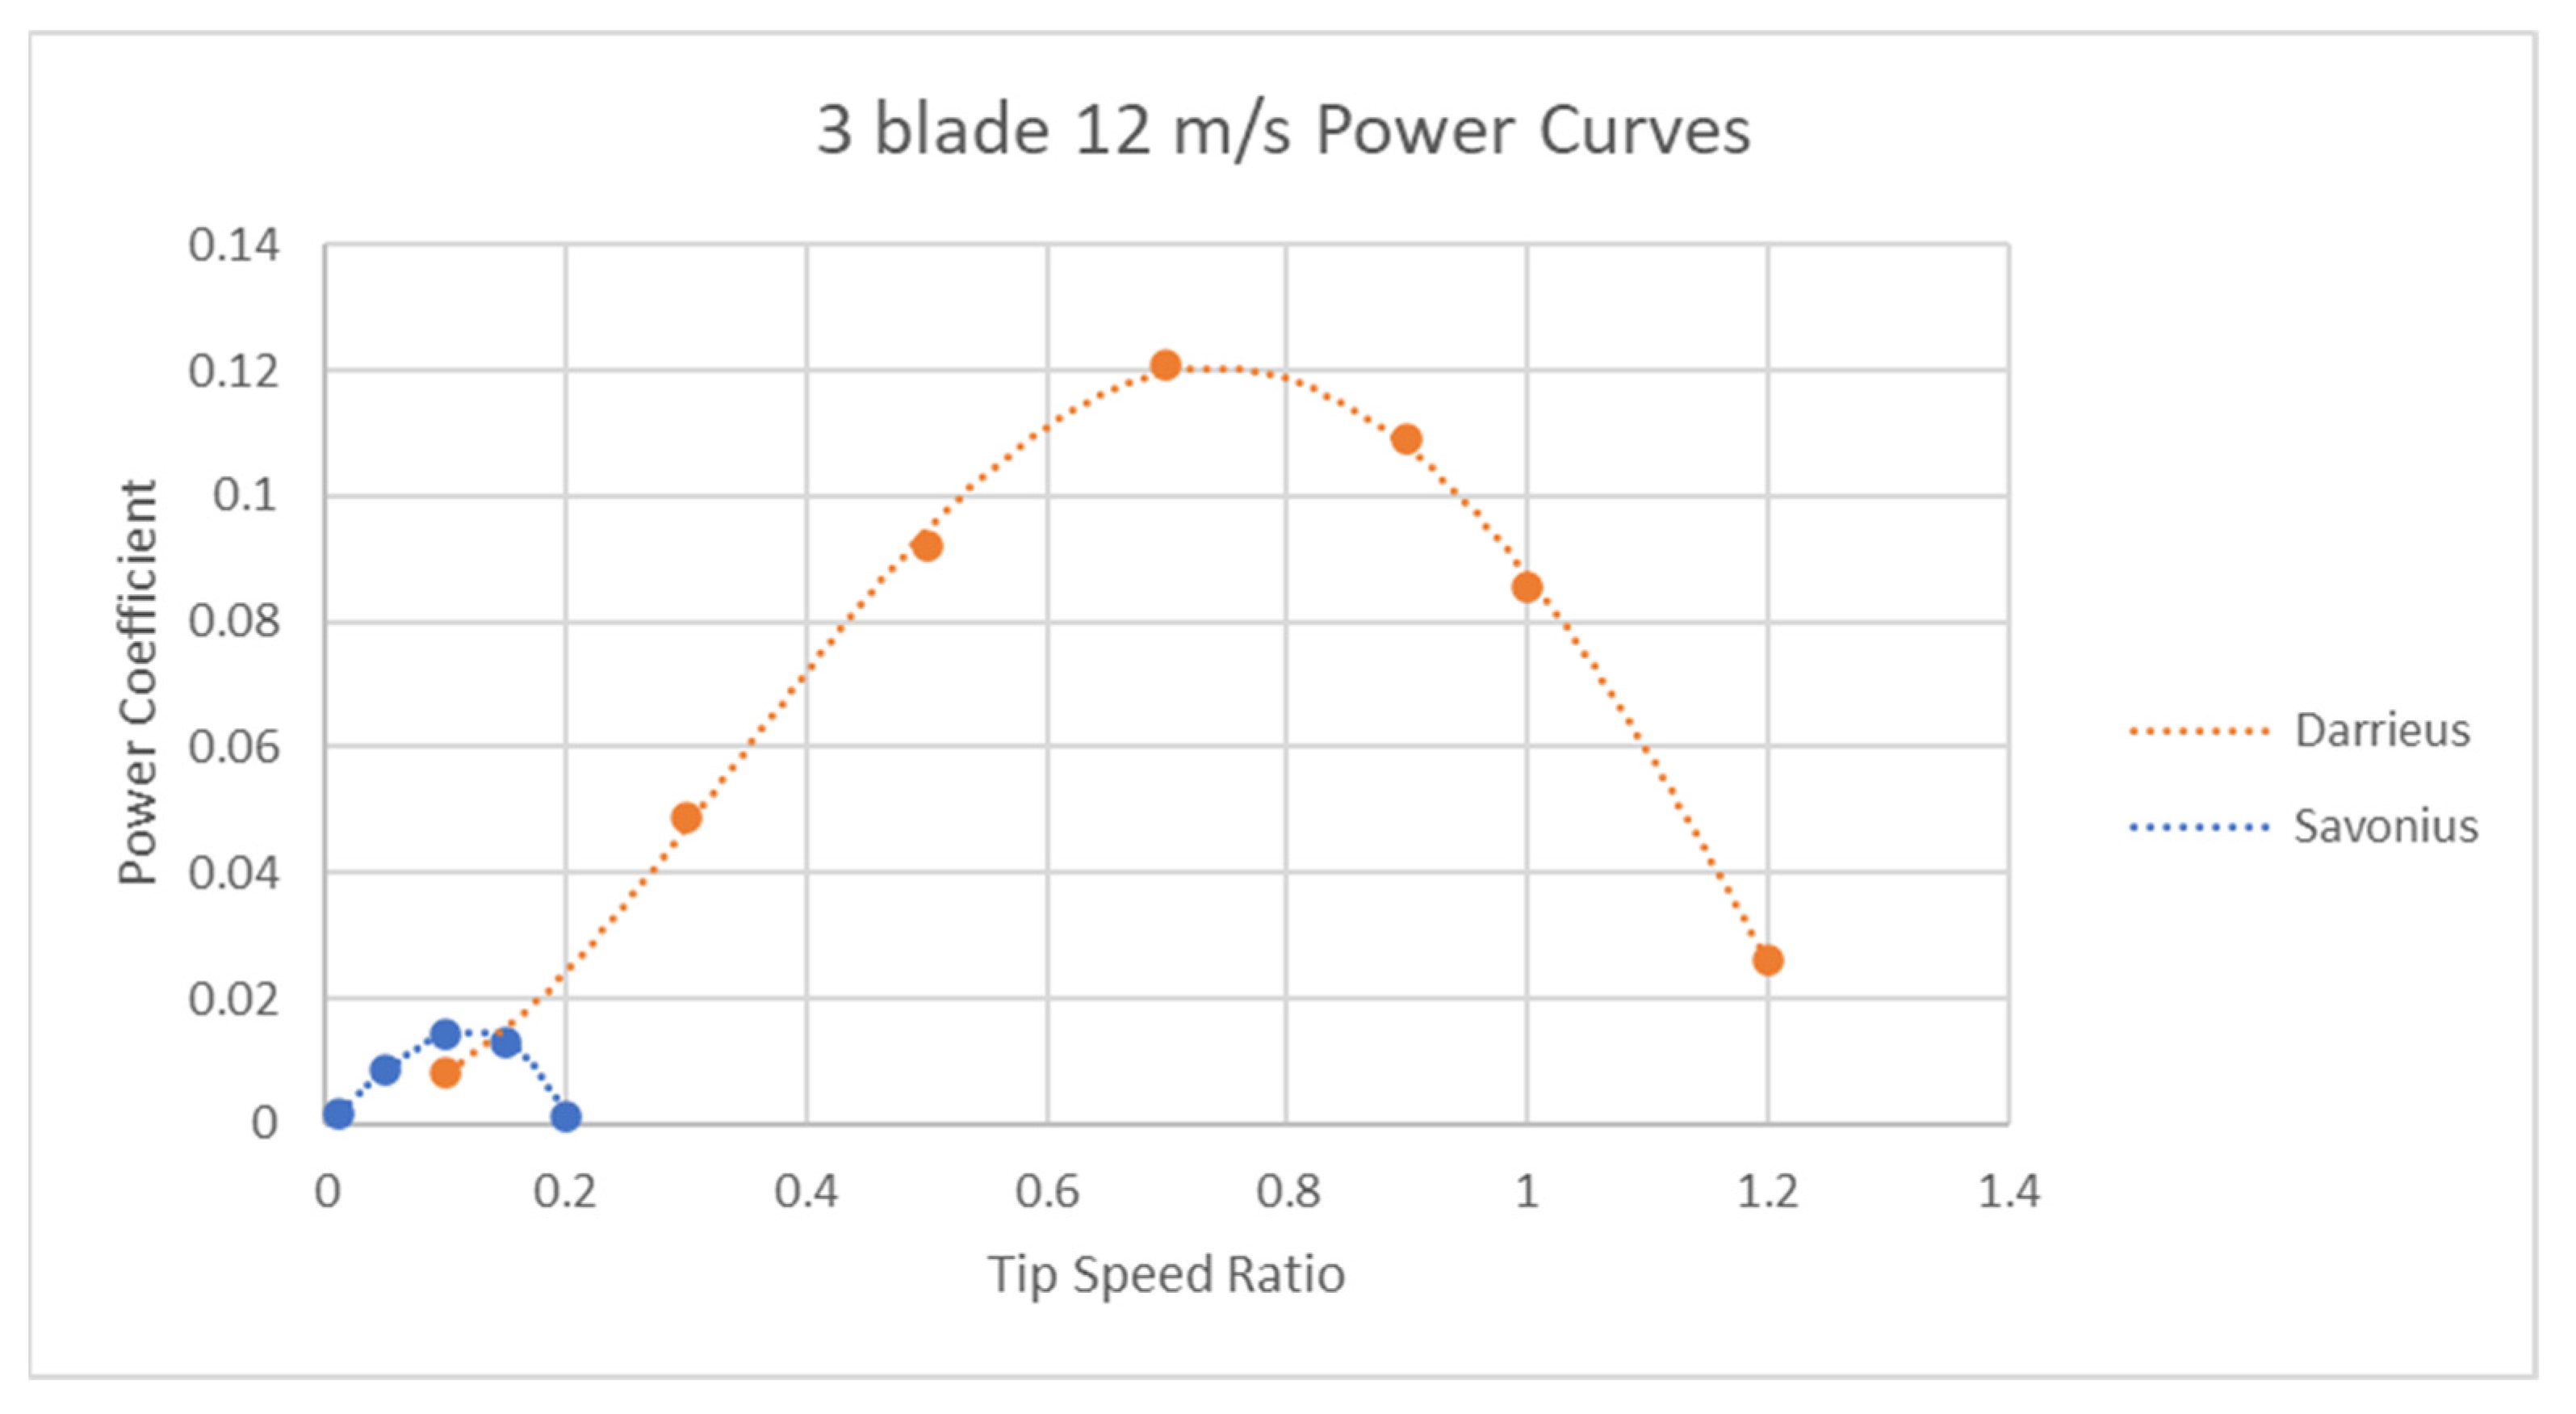
- The best-case scenario efficiency of the VAWT is independent of the wind speed, with the simulation predicting an efficiency of 12.4% at a TSR of 0.7 for the original design.
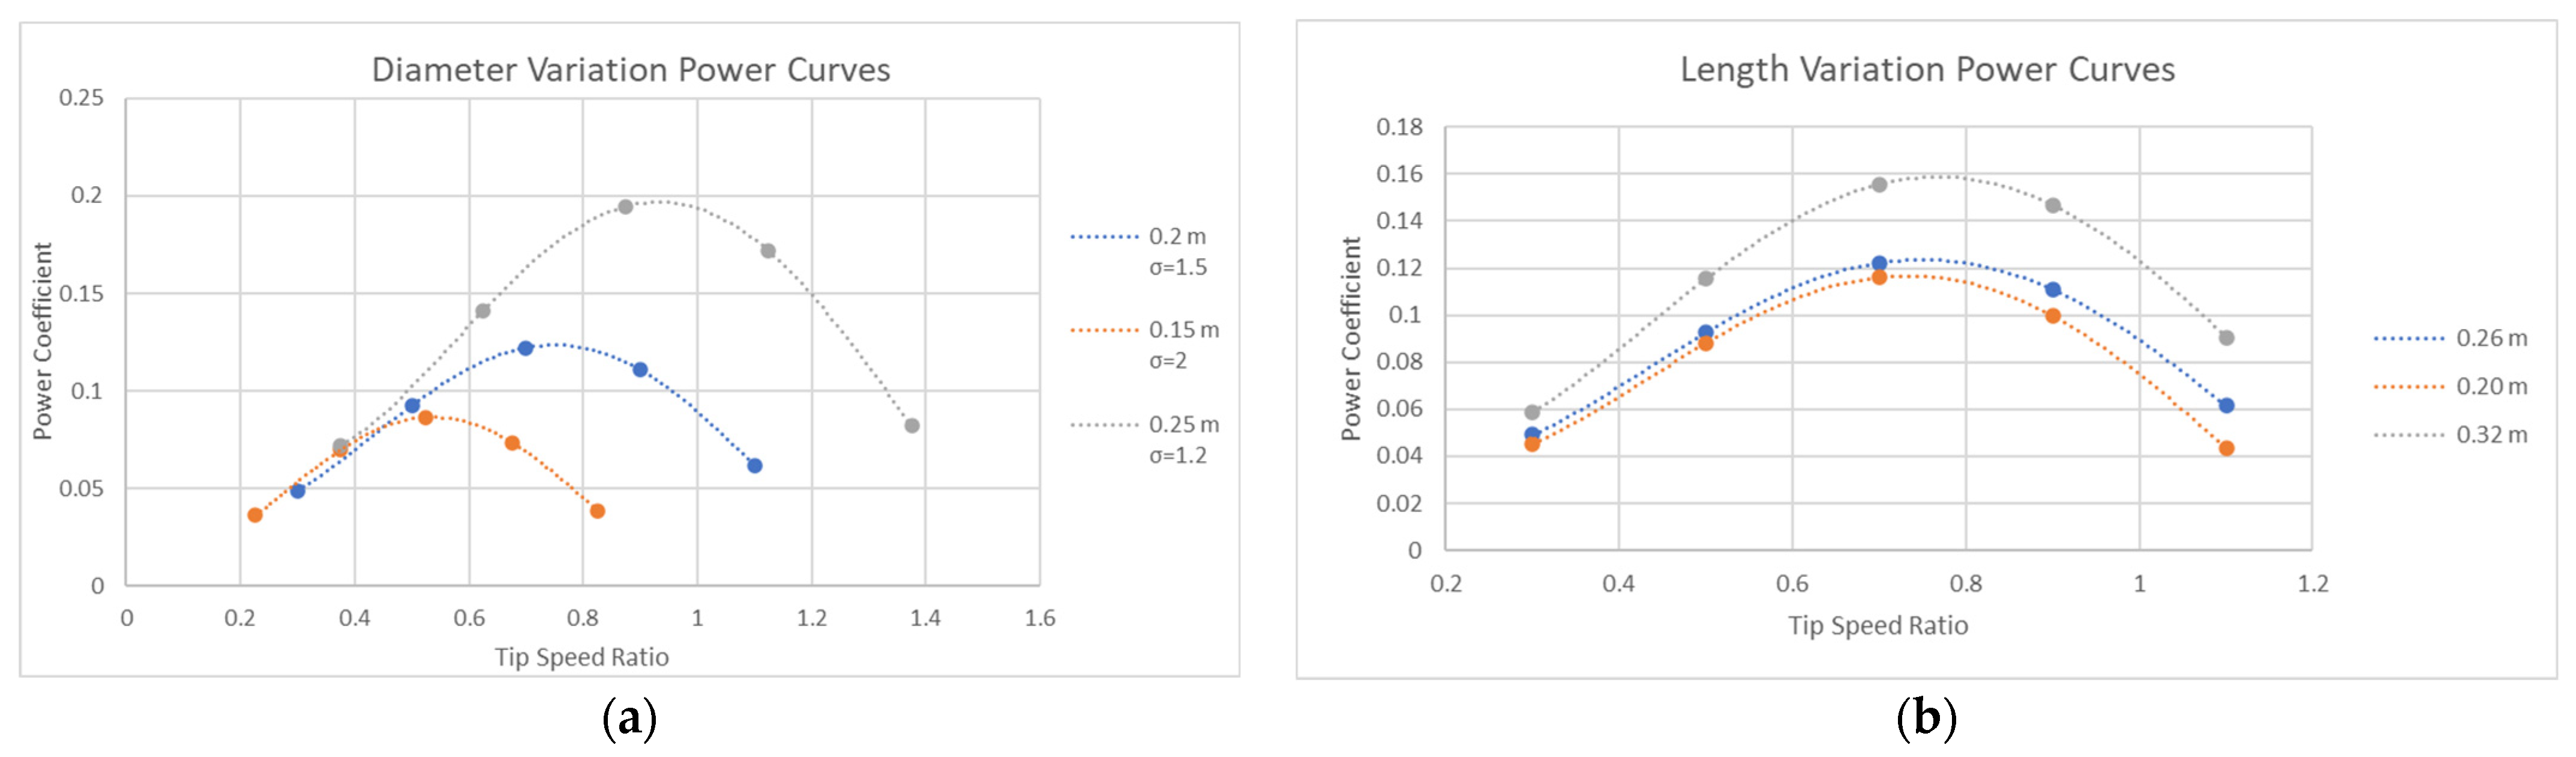
- The current solidity of the design is too high for a Darrieus turbine, with the efficiency increasing as the solidity was lowered by increasing the diameter.
- The design can see an increase in efficiency by increasing the length of the blades.
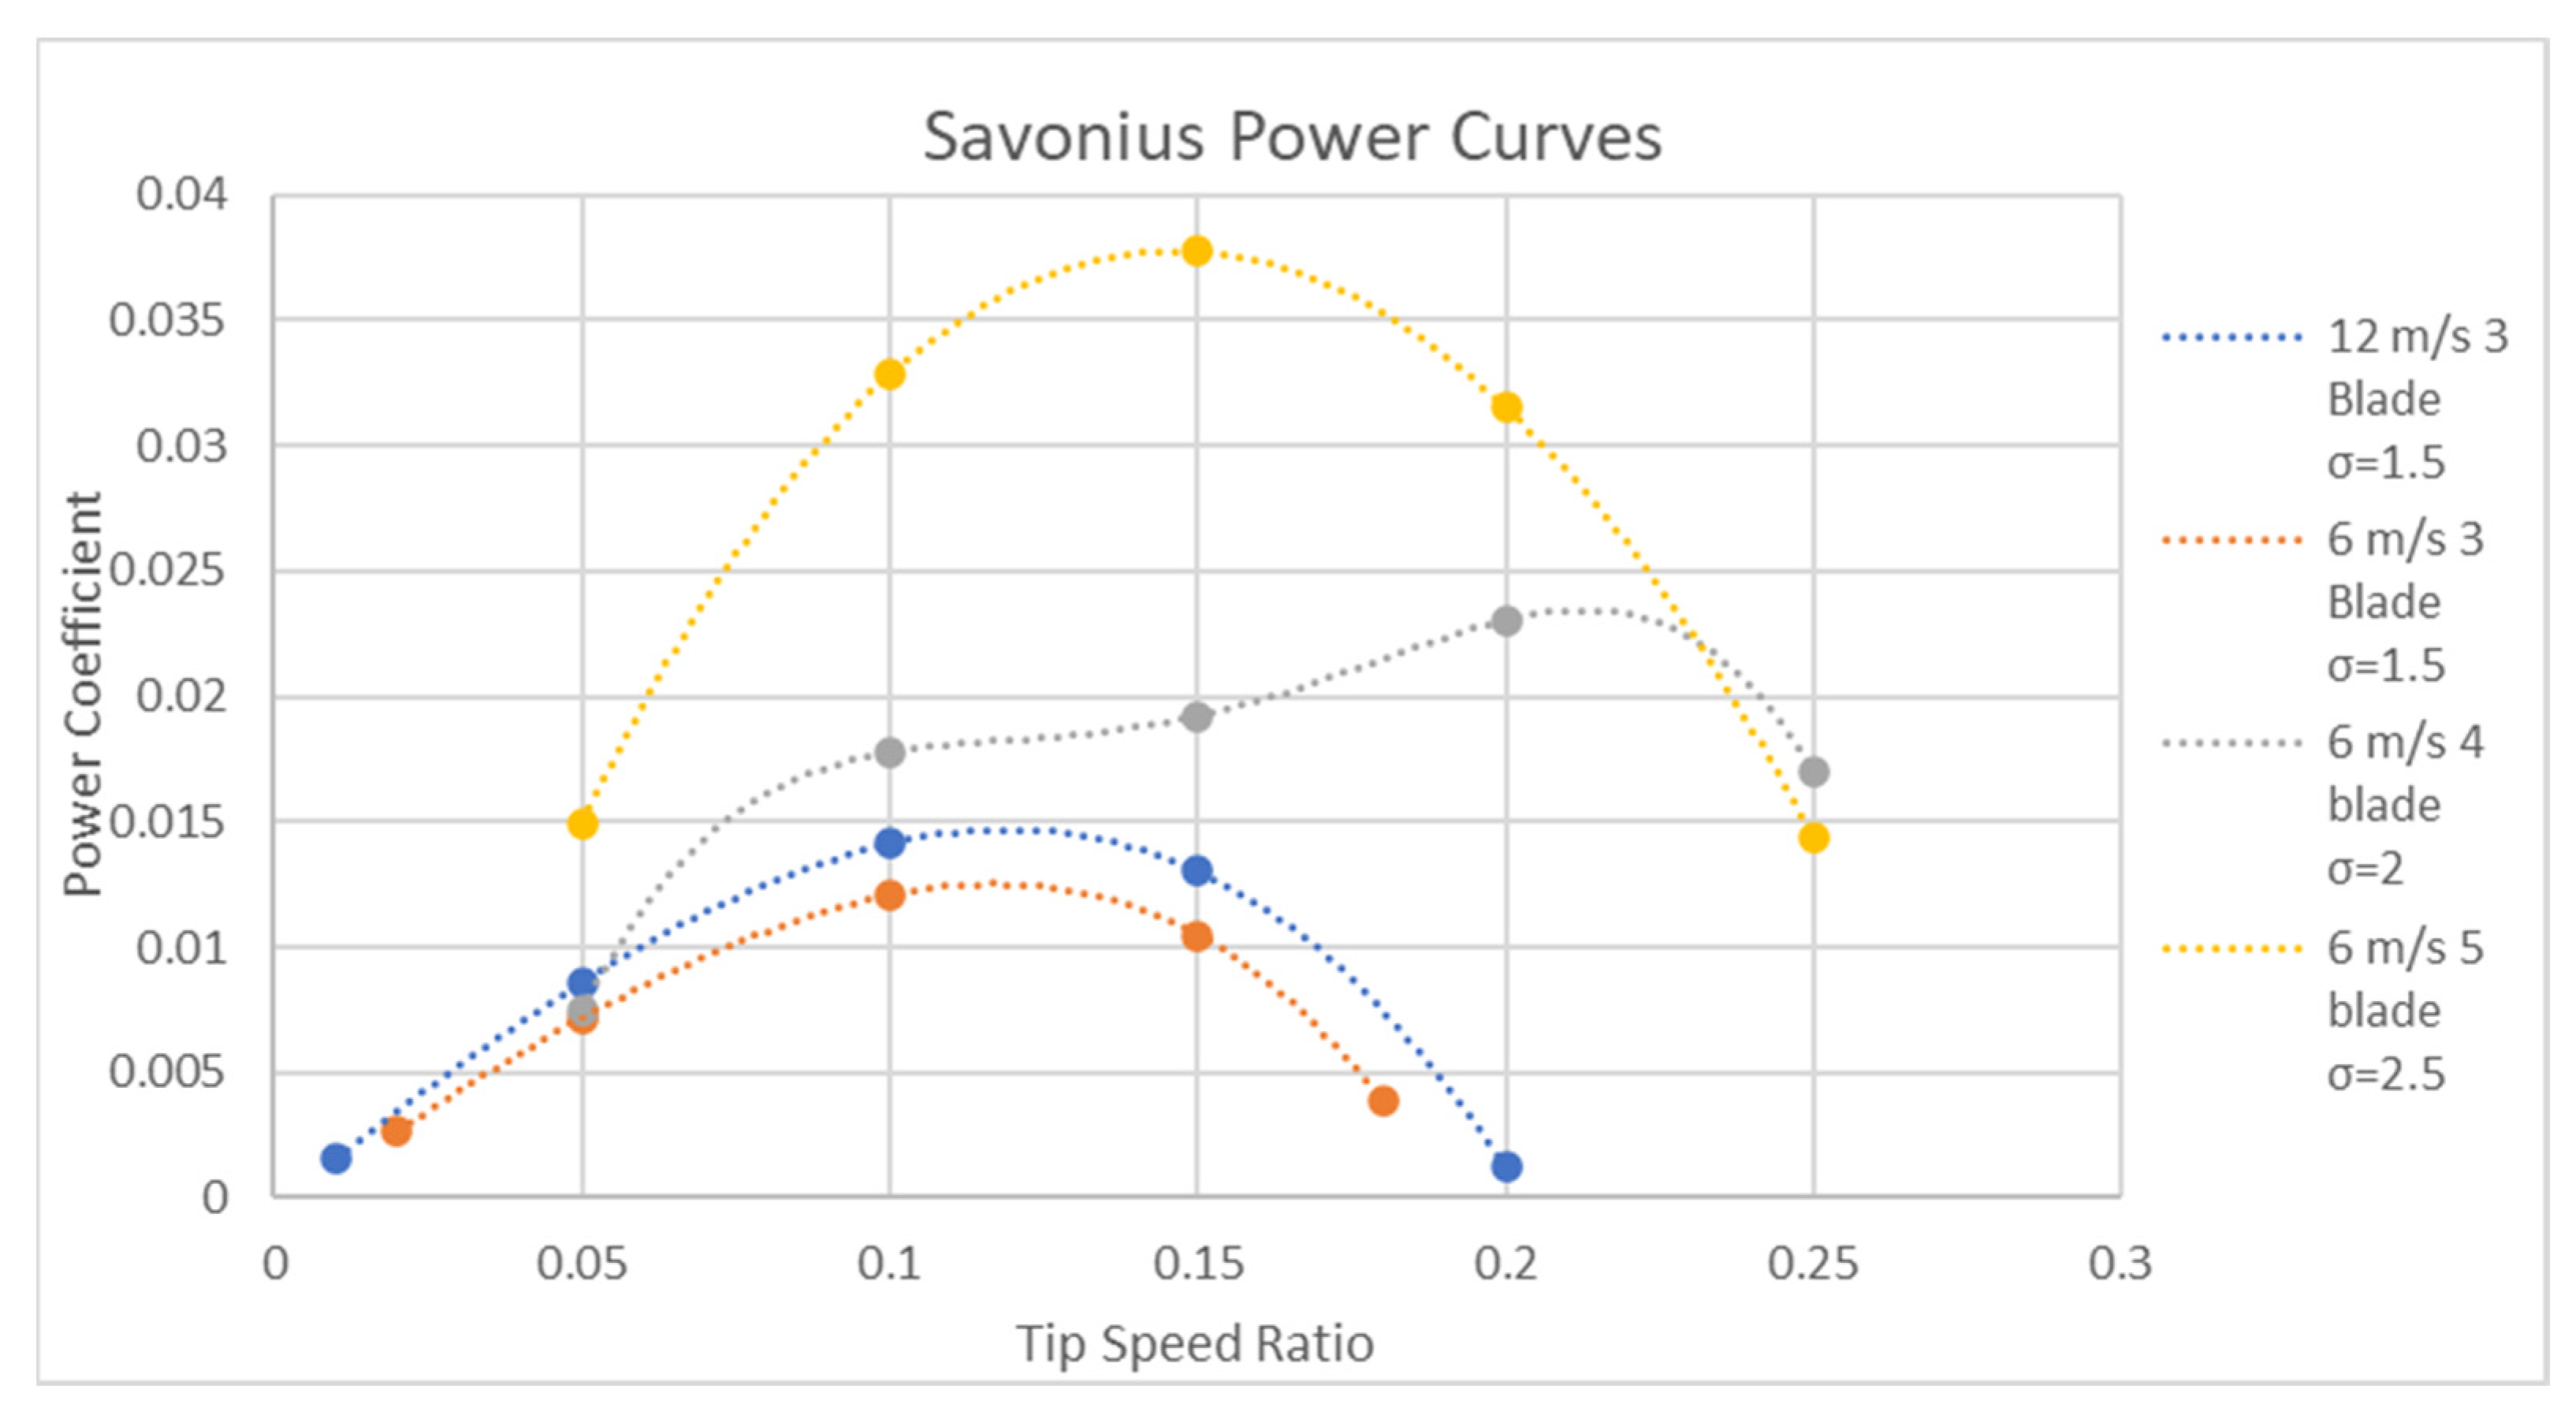
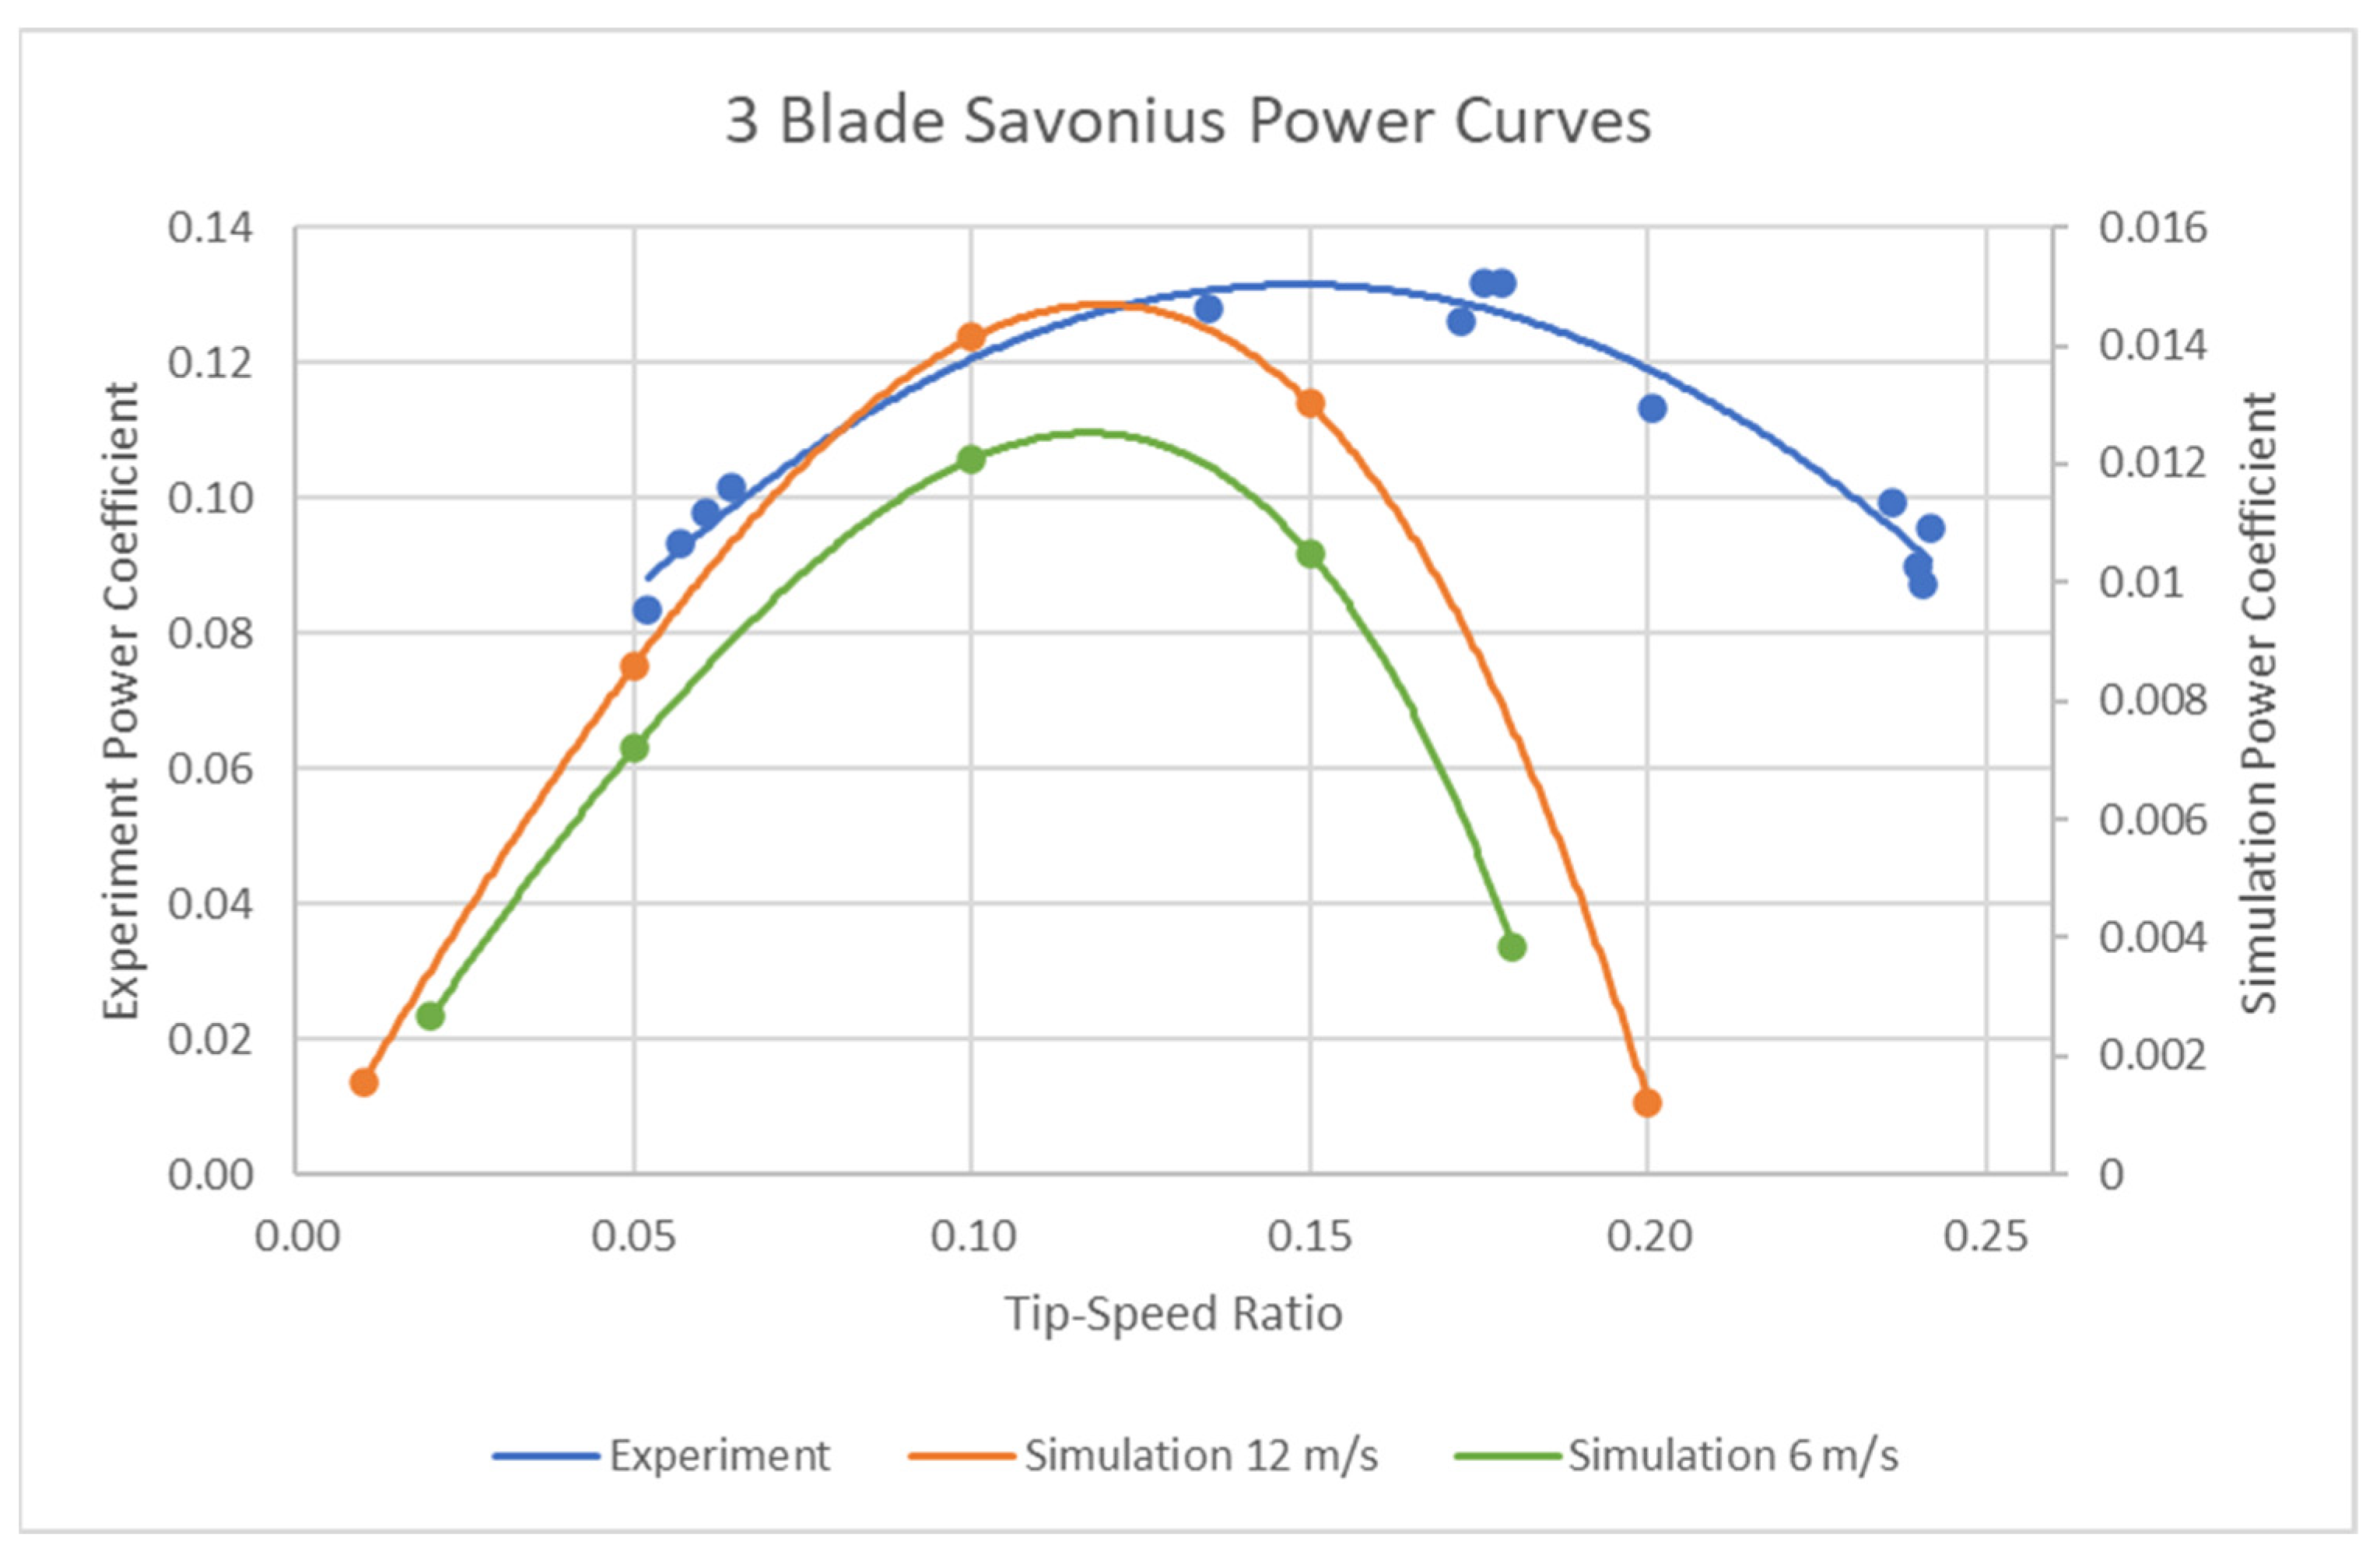
- The simulations showed that the three-blade Savonius design is much less efficient than the Darrieus design for high TSRs; however, the efficiency can be improved by increasing the solidity by increasing the number of blades.
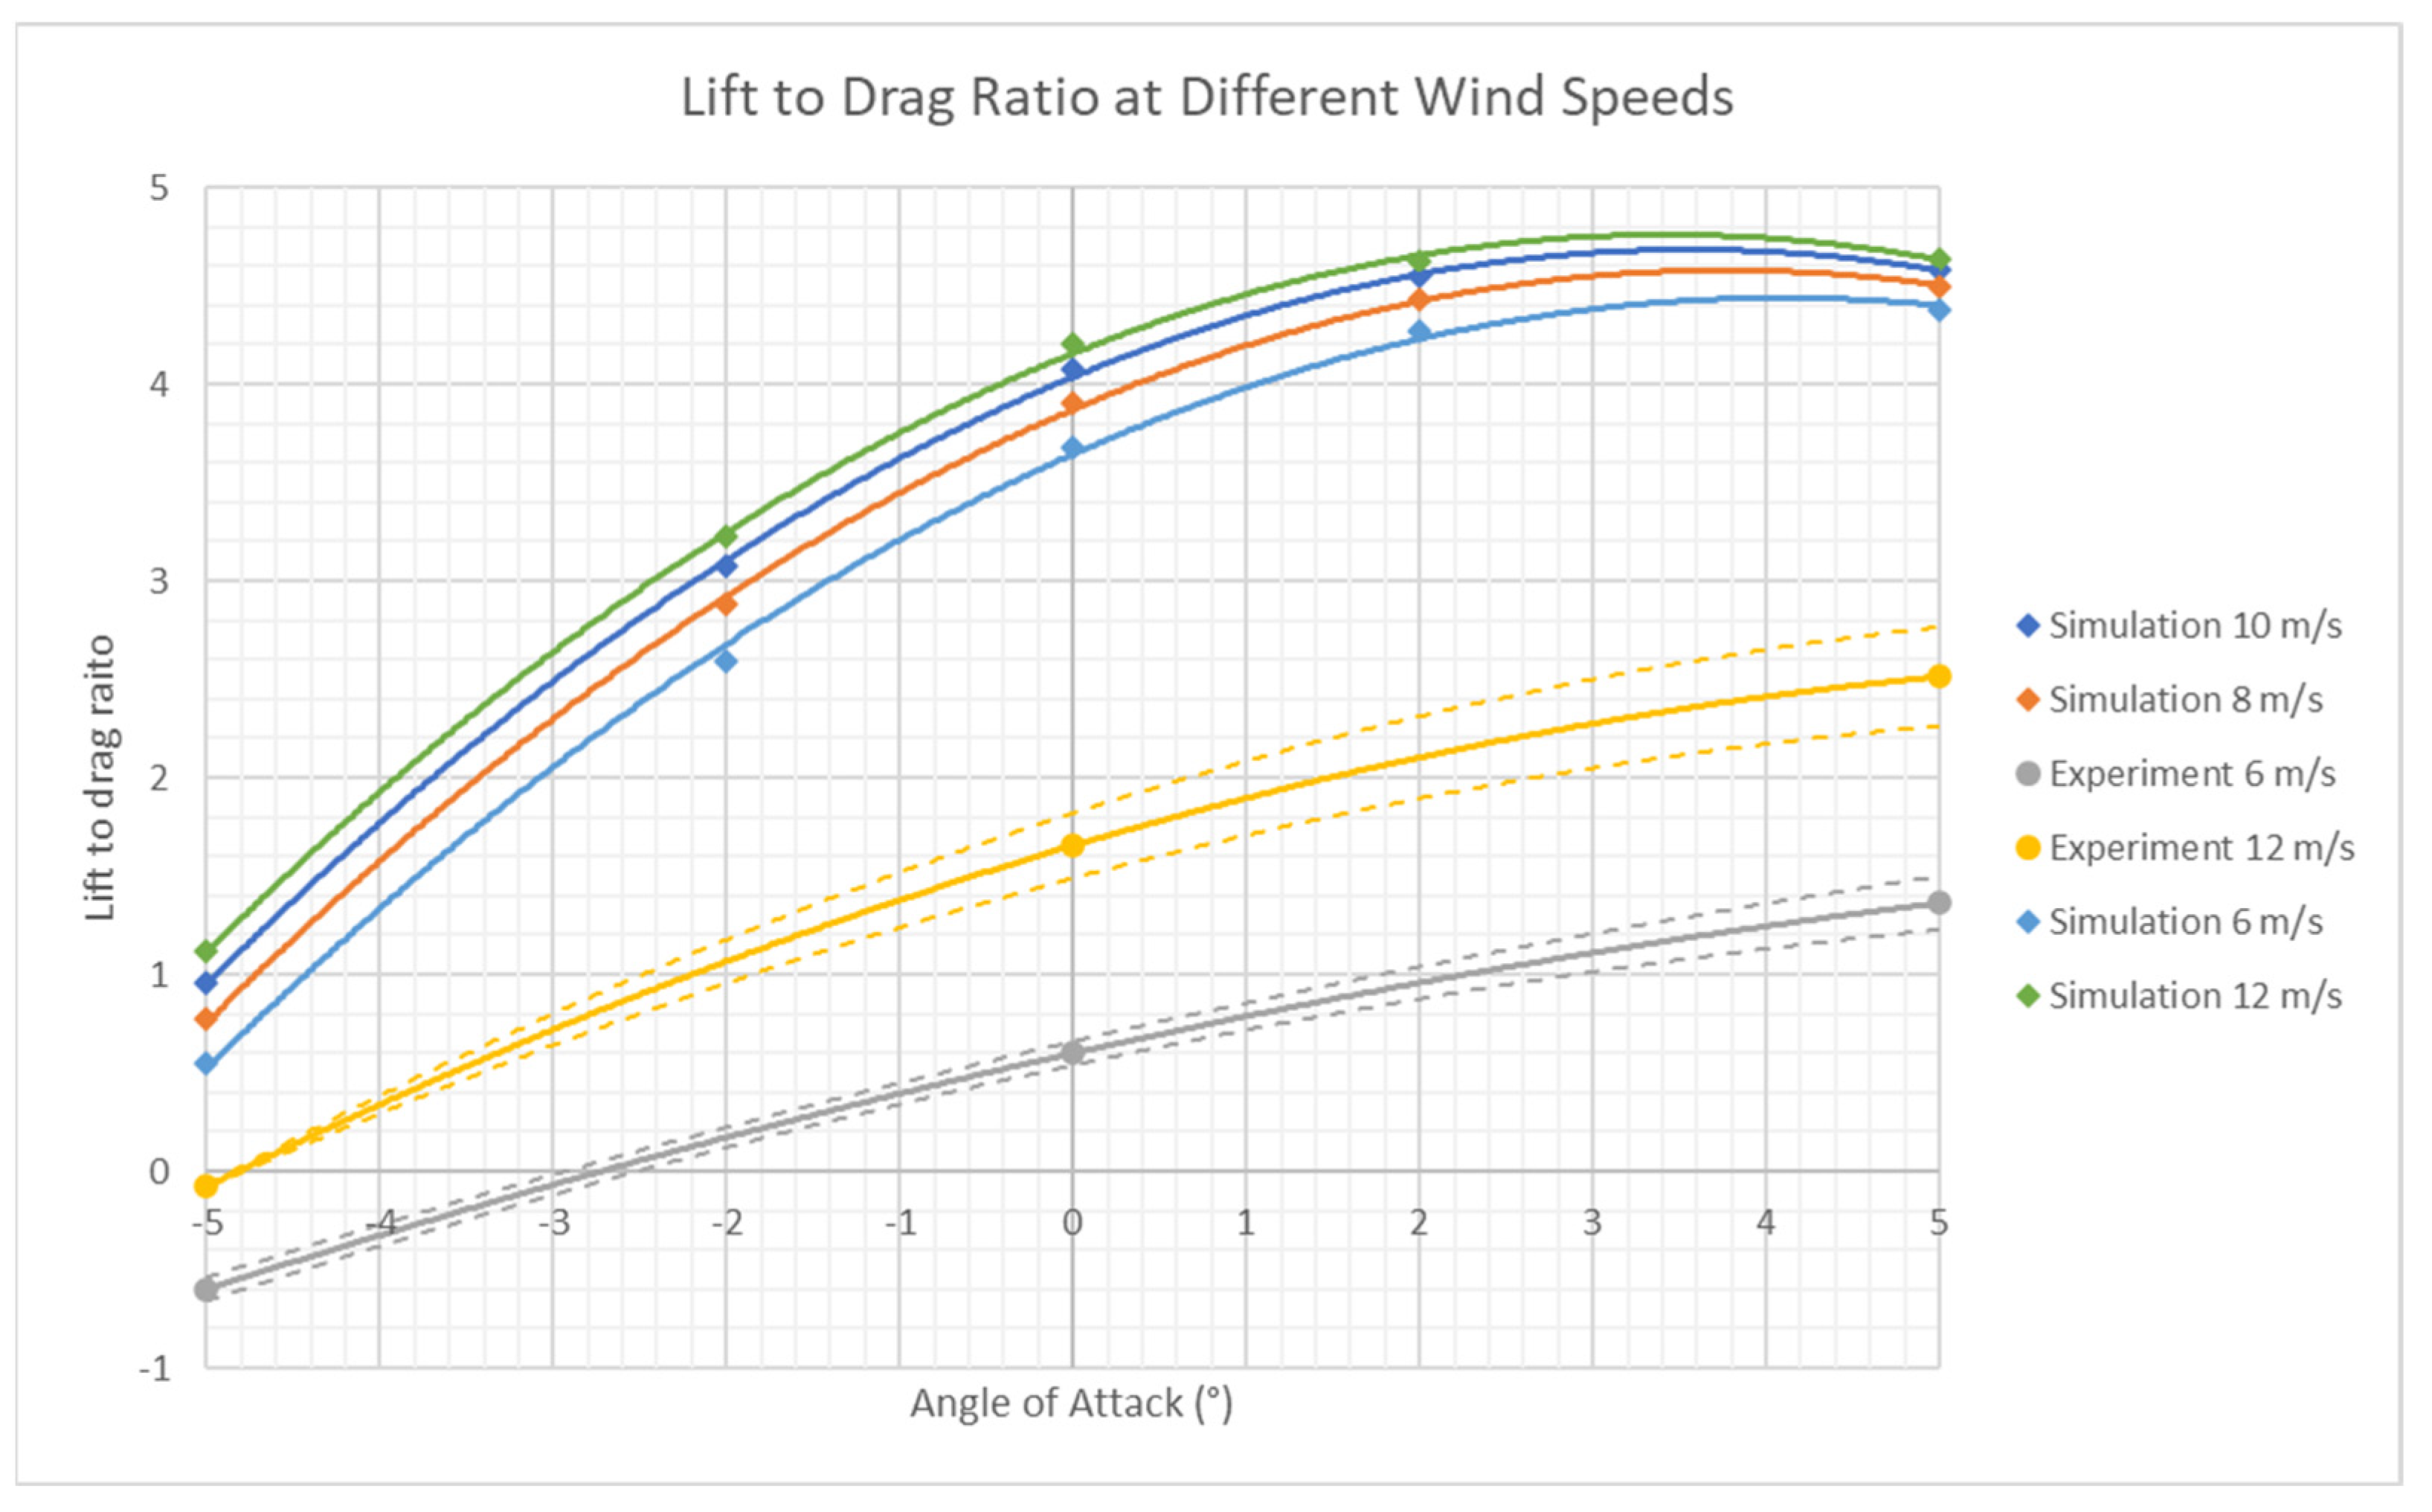
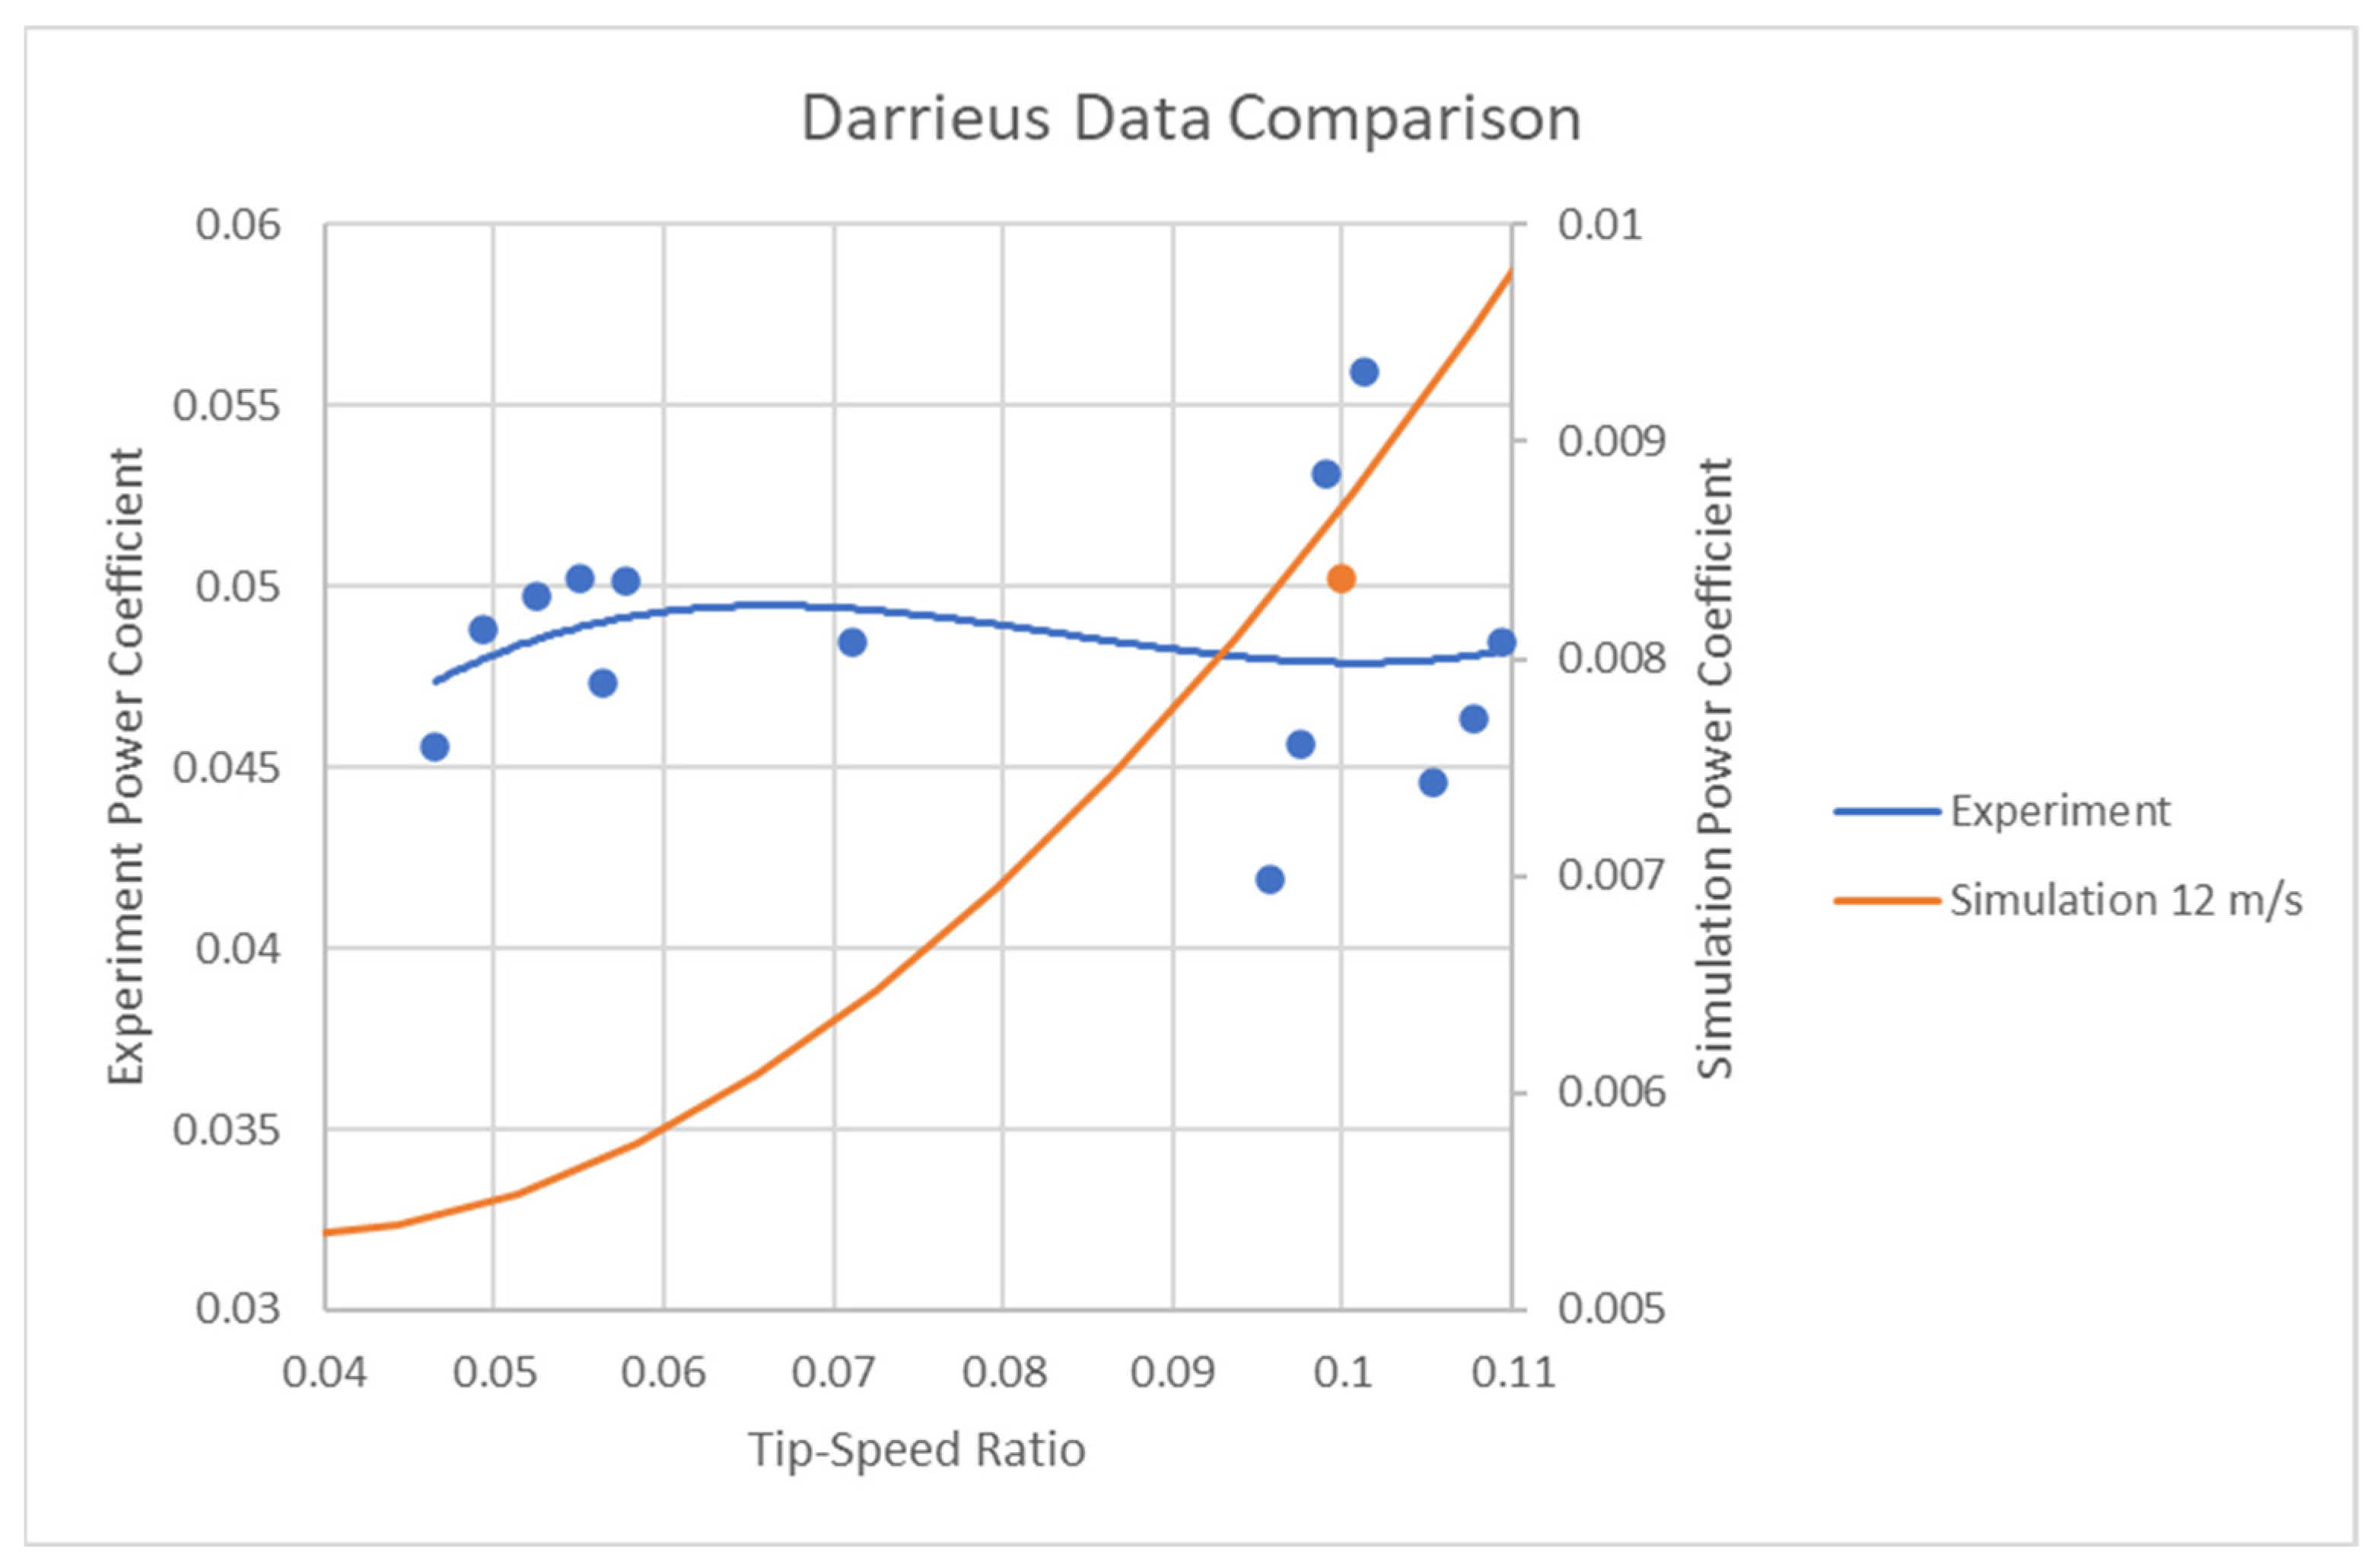
- The experiments showed that the simulations underpredicted the efficiency at low TSRs, with an average of a tenfold increase found.
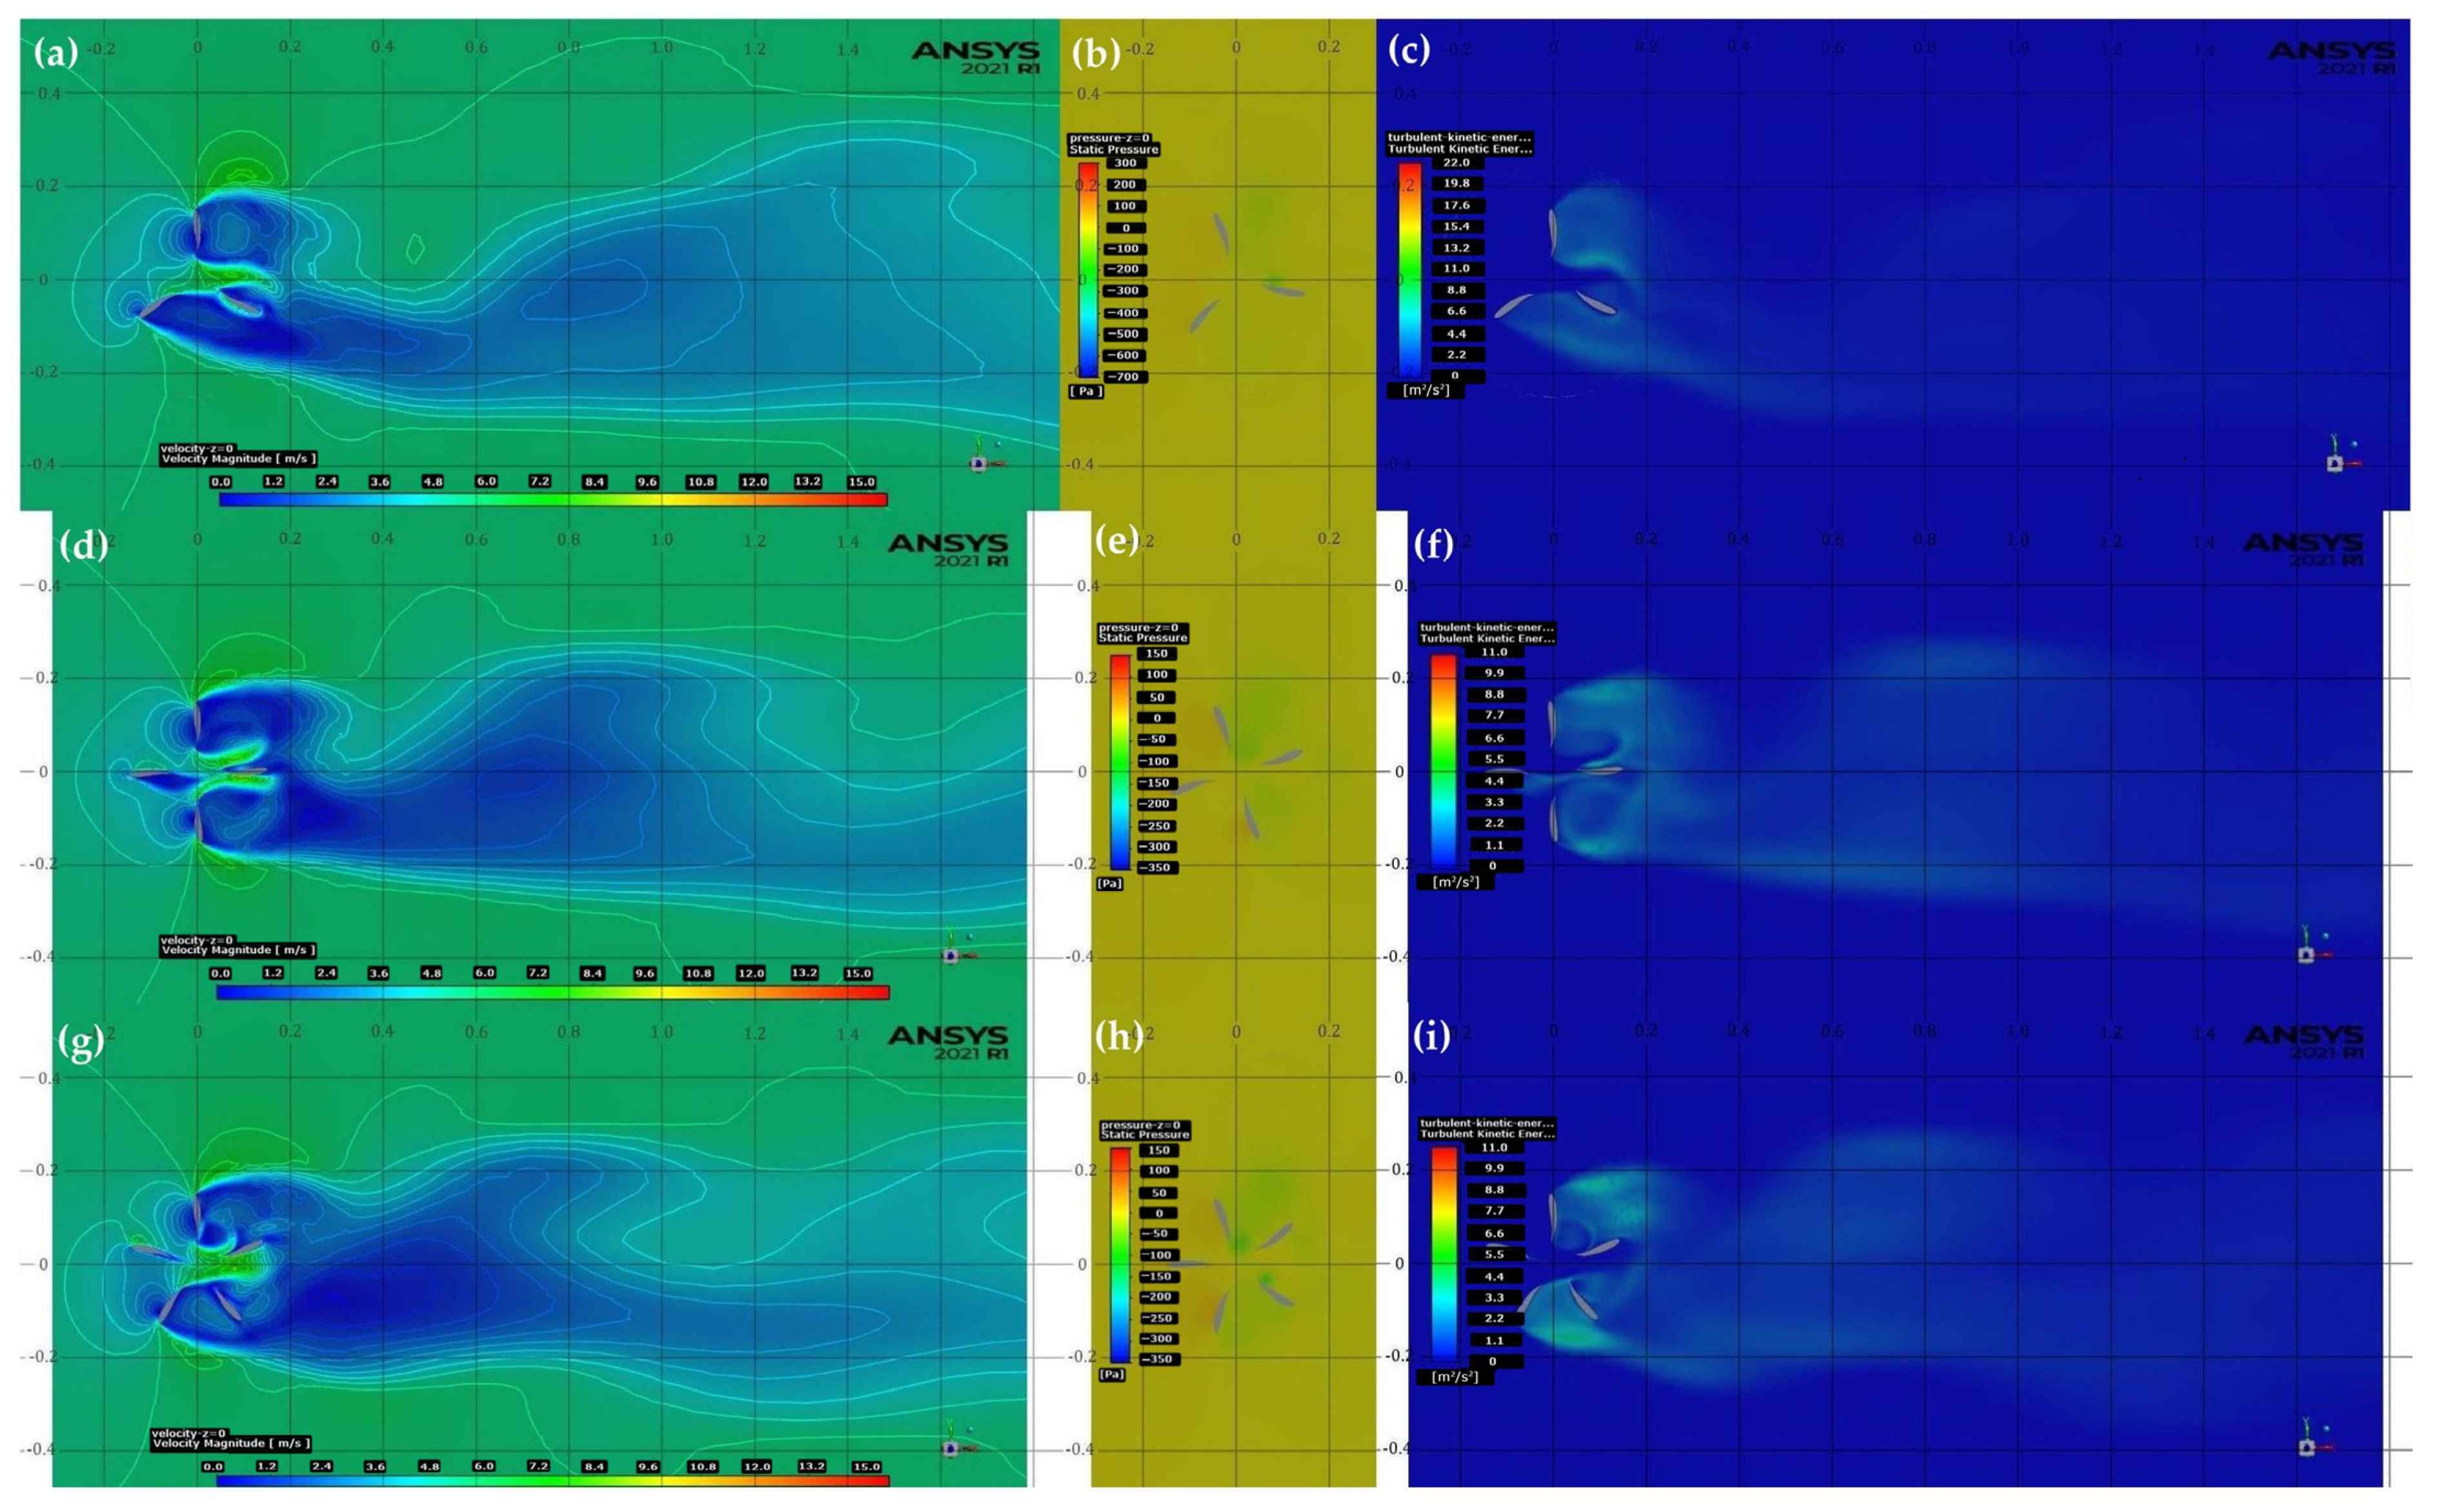
- Increasing the TSR will decrease the wake recovery distance, making the design more suitable for implementation in a wind farm.
- The blade length does not affect the wake recovery distance; however, increasing the diameter, changing to a Savonius design, and increasing the number of blades all increase the wake recovery distance.
- Due to the large discrepancy in values obtained in the experiment and simulations, further experiments could be performed with models that represent the changes to the design parameters. The main purpose of this would be to determine if the same trends as found in the simulations are found from the experiments to verify whether the simulations have accurately predicted changes in performance.
- A cost performance analysis can be performed with the designs that obtained higher efficiency, with the aim of determining the point where efficiency increases are outweighed by increased costs.
- Simulations can be performed with the full supporting structure of the VAWT. These can then be compared to simulations without the supports and with other support designs, to determine the optimal structure.
- Based on the angle of attack of 0° not being optimal for the lift of a single blade, the effect of varying the angle of attack of the blades on the VAWT by small increments could be investigated.
- The effects of the turbine could be investigated to determine how the boundary flow created by the ground will affect the operation of the turbine.
Author Contributions
Funding
Data Availability Statement
Acknowledgments
Conflicts of Interest
References
- Franchina, N.; Kouaissah, O.; Persico, G.; Savini, M. Three-Dimensional CFD Simulation and Experimental Assessment of the Performance of a H-Shape Vertical-Axis Wind Turbine at Design and Off-Design Conditions. Int. J. Turbomach. Propuls. Power 2019, 4, 30. [Google Scholar] [CrossRef]
- Simão Ferreira, C.; van Kuik, G.; van Bussel, G.; Scarano, F. Visualization by PIV of dynamic stall on a vertical axis wind turbine. Exp. Fluids 2009, 46, 97–108. [Google Scholar] [CrossRef]
- Ebrahimpour, M.; Shafaghat, R.; Alamian, R.; Safdari Shadloo, M. Numerical Investigation of the Savonius Vertical Axis Wind Turbine and Evaluation of the Effect of the Overlap Parameter in Both Horizontal and Vertical Directions on Its Performance. Symmetry 2019, 11, 821. [Google Scholar] [CrossRef]
- Antar, E.; El Cheikh, A.; Elkhoury, M. A dynamic rotor vertical-axis wind turbine with a blade transitioning capability. Energies 2019, 12, 1446. [Google Scholar] [CrossRef]
- Hosseini, A.; Goudarzi, N. Design and CFD study of a hybrid vertical-axis wind turbine by employing a combined Bach-type and H-Darrieus rotor systems. Energy Convers. Manag. 2019, 189, 49–59. [Google Scholar] [CrossRef]
- Durkacz, J.; Islam, S.; Chan, R.; Fong, E.; Gillies, H.; Karnik, A.; Mullan, T. CFD modelling and prototype testing of a Vertical Axis Wind Turbines in planetary cluster formation. Energy Rep. 2021, 7, 119–126. [Google Scholar] [CrossRef]
- Stout, C.; Islam, S.; White, A.; Arnott, S.; Kollovozi, E.; Shaw, M.; Droubi, G.; Sinha, Y.; Bird, B. Efficiency Improvement of Vertical Axis Wind Turbines with an Upstream Deflector. Energy Procedia 2017, 118, 141–148. [Google Scholar] [CrossRef]
- Subramanian, A.; Yogesh, S.A.; Sivanandan, H.; Giri, A.; Vasudevan, M.; Mugundhan, V.; Velamati, R.K. Effect of airfoil and solidity on performance of small scale vertical axis wind turbine using three dimensional CFD model. Energy 2017, 133, 179–190. [Google Scholar] [CrossRef]
- Gao, Q.; Lian, S.; Yan, H. Aerodynamic Performance Analysis of Adaptive Drag-Lift Hybrid Type Vertical Axis Wind Turbine. Energies 2022, 15, 5600. [Google Scholar] [CrossRef]
- Ahmad, M.; Shahzad, A.; Akram, F.; Ahmad, F.; Shah, S.I.A. Design optimization of Double-Darrieus hybrid vertical axis wind turbine. Ocean Eng. 2022, 254, 111171. [Google Scholar] [CrossRef]
- Belabes, B.; Paraschivoiu, M. Numerical study of the effect of turbulence intensity on VAWT performance. Energy 2021, 233, 121139. [Google Scholar] [CrossRef]
- Almohammadi, K.M.; Ingham, D.B.; Ma, L.; Pourkashanian, M. Modeling dynamic stall of a straight blade vertical axis wind turbine. J. Fluids Struct. 2015, 57, 144–158. [Google Scholar] [CrossRef]
- Wong, K.H.; Chong, W.T.; Poh, S.C.; Shiah, Y.; Sukiman, N.L.; Wang, C. 3D CFD simulation and parametric study of a flat plate deflector for vertical axis wind turbine. Renew. Energy 2018, 129, 32–55. [Google Scholar] [CrossRef]
- Le Clainche, S.; Ferrer, E. A reduced order model to predict transient flows around straight bladed vertical axis wind turbines. Energies 2018, 11, 566. [Google Scholar] [CrossRef]
- Alaimo, A.; Esposito, A.; Messineo, A.; Orlando, C.; Tumino, D. 3D CFD Analysis of a Vertical Axis Wind Turbine. Energies 2015, 8, 3013–3033. [Google Scholar] [CrossRef]
- Lositaño, I.C.M.; Danao, L.A.M. Steady wind performance of a 5 kW three-bladed H-rotor Darrieus Vertical Axis Wind Turbine (VAWT) with cambered tubercle leading edge (TLE) blades. Energy 2019, 175, 278–291. [Google Scholar] [CrossRef]
- Karimian, S.M.H.; Abdolahifar, A. Performance investigation of a new Darrieus Vertical Axis Wind Turbine. Energy 2020, 191, 116551. [Google Scholar] [CrossRef]
- Rogowski, K. Numerical studies on two turbulence models and a laminar model for aerodynamics of a vertical-axis wind turbine. J. Mech. Sci. Technol. 2018, 32, 2079–2088. [Google Scholar] [CrossRef]
- Hand, B.; Cashman, A. Aerodynamic modeling methods for a large-scale vertical axis wind turbine: A comparative study. Renew. Energy 2018, 129, 12–31. [Google Scholar] [CrossRef]
- Lam, H.F.; Peng, H.Y. Study of wake characteristics of a vertical axis wind turbine by two- and three-dimensional computational fluid dynamics simulations. Renew. Energy 2016, 90, 386–398. [Google Scholar] [CrossRef]
- Li, Q.; Maeda, T.; Kamada, Y.; Murata, J.; Kawabata, T.; Shimizu, K.; Ogasawara, T.; Nakai, A.; Kasuya, T. Wind tunnel and numerical study of a straight-bladed Vertical Axis Wind Turbine in three-dimensional analysis (Part II: For predicting flow field and performance). Energy 2016, 104, 295–307. [Google Scholar] [CrossRef]
- Franchina, N.; Persico, G.; Savini, M. 2D-3D Computations of a Vertical Axis Wind Turbine Flow Field: Modeling Issues and Physical Interpretations. Renew. Energy 2019, 136, 1170–1189. [Google Scholar] [CrossRef]
- Hand, B.; Kelly, G.; Cashman, A. Numerical simulation of a vertical axis wind turbine airfoil experiencing dynamic stall at high Reynolds numbers. Comput. Fluids 2017, 149, 12–30. [Google Scholar] [CrossRef]
- Trivellato, F.; Raciti Castelli, M. On the Courant–Friedrichs–Lewy criterion of rotating grids in 2D vertical-axis wind turbine analysis. Renew. Energy 2014, 62, 53–62. [Google Scholar] [CrossRef]
- Tingey, E.B.; Ning, A. Development of a parameterized reduced-order vertical-axis wind turbine wake model. Wind Eng. 2020, 44, 494–508. [Google Scholar] [CrossRef]
- Siddiqui, M.S.; Durrani, N.; Akhtar, I. Quantification of the effects of geometric approximations on the performance of a vertical axis wind turbine. Renew. Energy 2015, 74, 661–670. [Google Scholar] [CrossRef]
- He, J.; Jin, X.; Xie, S.; Cao, L.; Wang, Y.; Lin, Y.; Wang, N. CFD modeling of varying complexity for aerodynamic analysis of H-vertical axis wind turbines. Renew. Energy 2020, 145, 2658–2670. [Google Scholar] [CrossRef]
- Rolland, S.; Newton, W.; Williams, A.J.; Croft, T.N.; Gethin, D.T.; Cross, M. Simulations technique for the design of a vertical axis wind turbine device with experimental validation. Appl. Energy 2013, 111, 1195–1203. [Google Scholar] [CrossRef]
- Mohamed, M. Impacts of solidity and hybrid system in small wind turbines performance. Energy 2013, 57, 495–504. [Google Scholar] [CrossRef]
- Wright, L.; Droubi, M.; Islam, S. Computational fluid dynamics simulation for predicting effect of icing on offshore wind turbine blade. In Proceedings of the 13th International Conference on Fluid Control, Measurements and Visualization, Doha, Qatar, 15–18 November 2015; pp. 15–18. [Google Scholar]


| Parameter | Value |
|---|---|
| Area 1 | 0.0625 m2 |
| Density | 1.225 kg/m3 |
| Enthalpy | 0 J/kg |
| Length | 0.25 m |
| Pressure | 0 Pa |
| Temperature | 288.16 K |
| Velocity 2 | 10 m/s |
| Viscosity | 1.7894 × 10⁻⁵ kg/(m s) |
| Ratio of specific heats | 1.4 |
| Yplus for Heat Tran. Coef. | 300 |
| Parameter | Value |
|---|---|
| VAWT type | Darrieus |
| No. of blades | 3 |
| Chord length | 100 mm |
| Blade height | 260 mm |
| Rotor diameter | 200 mm |
| Domain length (X) | 4 m |
| Domain width (Y) | 2.2 m |
| Domain height (Z) | 2.26 m |
| Parameter | Value |
|---|---|
| Time | Transient |
| Turbulence model | SST k- |
| Area | 0.052 m2 |
| Density | 1.225 kg/m3 |
| Enthalpy | 0 J/kg |
| Length | 0.1 m |
| Pressure | 0 Pa |
| Temperature | 288.16 K |
| Velocity | 12 m/s |
| Viscosity | 1.7894 × 10⁻⁵ kg/(m s) |
| Ratio of specific heats | 1.4 |
| Yplus for Heat Tran. Coef. | 300 |
| Inlet turbulent intensity | 2% |
| Inlet turbulent length scale | 0.02 m |
| Outlet turbulent intensity | 2.2% |
| Outlet turbulent viscosity ratio | 0.1 |
| No. of timesteps | 900 |
| Iterations per timestep | 20 |
| Elements | Duration | Drag Coefficient | Lift Coefficient | Drag (N) | Lift (N) | Iterations |
|---|---|---|---|---|---|---|
| 510,124 | 2 h | 0.070788 | 0.23833 | 0.27098 | 0.91236 | 500 |
| 1,013,542 | 1 h | 0.056044 | 0.21801 | 0.21454 | 0.83456 | 90 |
| 1,363,588 | 1 h | 0.055799 | 0.21802 | 0.21361 | 0.83460 | 88 |
| Parameter | Value | ||||||
|---|---|---|---|---|---|---|---|
| WS (m/s) | 12 | 12 | 12 | 12 | 12 | 12 | 12 |
| TSR | 0.1 | 0.3 | 0.5 | 0.7 | 0.9 | 1 | 1.2 |
| Cp (TSR method) | 0.00837 | 0.048732 | 0.091961 | 0.121013 | 0.109003 | 0.085687 | 0.026125 |
| Cp (power method) | 0.00837 | 0.048732 | 0.091961 | 0.121013 | 0.109003 | 0.085687 | 0.026125 |
| % Difference | −3.6 × 10⁻⁶ | −3.6 × 10⁻⁶ | −3.6 × 10⁻⁶ | −3.6 × 10⁻⁶ | −3.6 × 10⁻⁶ | −3.6 × 10⁻⁶ | −3.6 × 10⁻⁶ |
| Inlet Velocity (m/s) | Y (m) | Wind Speed (m/s) | ||||||
|---|---|---|---|---|---|---|---|---|
| 14.12 | 0.24 | 14 | 12 | |||||
| 0 | 14.12 | Turbine | 7.9 | 6.7 | 7.2 | 7.5 | 8.4 | |
| −0.24 | 14 | 12.2 | ||||||
| 13.86 | 0.24 | 13 | 10.1 | |||||
| 0 | 13.86 | Turbine | 9 | 8.8 | 8.5 | 8.2 | 8.8 | |
| −0.24 | 15.2 | 11.9 | ||||||
| X (m) | −0.24 | 0 | 0.24 | 0.365 | 0.49 | 0.615 | 0.740 | |
Disclaimer/Publisher’s Note: The statements, opinions and data contained in all publications are solely those of the individual author(s) and contributor(s) and not of MDPI and/or the editor(s). MDPI and/or the editor(s) disclaim responsibility for any injury to people or property resulting from any ideas, methods, instructions or products referred to in the content. |
© 2023 by the authors. Licensee MDPI, Basel, Switzerland. This article is an open access article distributed under the terms and conditions of the Creative Commons Attribution (CC BY) license (https://creativecommons.org/licenses/by/4.0/).
Share and Cite
Gerrie, C.; Islam, S.Z.; Gerrie, S.; Turner, N.; Asim, T. 3D CFD Modelling of Performance of a Vertical Axis Turbine. Energies 2023, 16, 1144. https://doi.org/10.3390/en16031144
Gerrie C, Islam SZ, Gerrie S, Turner N, Asim T. 3D CFD Modelling of Performance of a Vertical Axis Turbine. Energies. 2023; 16(3):1144. https://doi.org/10.3390/en16031144
Chicago/Turabian StyleGerrie, Cameron, Sheikh Zahidul Islam, Sean Gerrie, Naomi Turner, and Taimoor Asim. 2023. "3D CFD Modelling of Performance of a Vertical Axis Turbine" Energies 16, no. 3: 1144. https://doi.org/10.3390/en16031144
APA StyleGerrie, C., Islam, S. Z., Gerrie, S., Turner, N., & Asim, T. (2023). 3D CFD Modelling of Performance of a Vertical Axis Turbine. Energies, 16(3), 1144. https://doi.org/10.3390/en16031144