1. Introduction
The installed capacity of offshore wind power in Europe increased from about 3 GW in 2009 to about 22 GW in 2019, and is growing even faster in attempts to realize the European Union (EU) climate-neutralization goal by 2050. To reach this goal, renewable energy has to increase from
to
by 2030, which demands 451 GW of wind power capacity by 2030. To reach this capacity, 271 GW new installations [
1] are called for. The United States is also planning to increase its installed offshore wind power from 30 MW in 2020 to as much as 30 GW by 2030 [
2]. Offshore wind is an enabler for the utilization of larger turbines. The rated power of wind turbines is increasing with a fast pace. Increasing the size of offshore wind turbines is an effective measure to lower the levelized cost of energy (LCOE) [
3]. The largest commercially available turbine is currently 16 MW [
4]. The largest available reference research turbine is 20 MW [
5]. Research has been carried out on the different aspects of design and analysis of turbines with a rated power up to 50 MW [
6,
7], which is much higher than what is currently available in industry, showing that wind turbines of higher-rated power are expected in the wind power market in the upcoming future.
The power train system, consisting of back-to-back (BTB) frequency converter, generator, gearbox, shafts, main bearings and rotor assembly, is responsible for
of the LCOE of land-based wind turbines [
8]. This contribution is expected to be lower in offshore applications, due to a lower contribution of turbine components and O&M in the LCOE [
8]. The high contribution of the power train system in the LCOE motivates the employment of the life cycle assessment approach in a bid to reduce the overall costs. In the power train system, the drivetrain converts the variable input mechanical power to regulated electrical power at the desired voltage and frequency, and transmits the non-torque loads to the bed-plate and tower. The drivetrain in our definition includes the entire power conversion system from the main bearings to the electrical generator and power-frequency converter system. The two main drivetrain technologies, namely direct-drive and geared drivetrain systems, and the components that characterize them are depicted in
Figure 1. Beside the rotor–gearbox–generator configuration, there are other alternatives, such as hydraulic transmission systems, to realize the wind turbine drivetrain [
9], which are not discussed in this work.
Today’s largest commercially available wind turbine drivetrain systems are MHI Vestas 15 MW, MingYang 16 MW and Bewind 14 MW medium-speed drivetrains, and GE Haliade 14 MW and Siemens Gamesa 14 MW direct-drive solutions, which shows that there is no single solution for the selection of drivetrain configuration for wind turbines with a rated power around 15 MW. Even for geared configurations, there are different choices of gearbox ratio offered by different manufacturers. The next commercially available turbine is expected to have a nominal power of about 20 MW. Due to the significant influence of drivetrain on turbine reliability and availability [
10], turbine manufacturers are running extensive simulations and test campaigns to optimize their drivetrain systems for offshore applications. The floating offshore application can expose turbines to a wider range of external excitation frequencies and the risk of unknown dynamics, which could be critical for drivetrain operation. As explained in [
11,
12,
13], higher efficiency and reliability, less maintenance costs and less downtime, due to compactness and lightweight design, and the elimination of brushes, are all motivations for using PMSG in the drivetrain of high-power offshore wind turbines.
Moghadam et al. in [
11] proposed a life cycle assessment approach by taking, simultaneously, into consideration the drivetrain design, manufacturing and operation and maintenance (O&M), to examine the pros and cons of three different drivetrain technologies based on direct-drive, medium- and high-speed PMSGs for 10 MW wind turbines. In that paper, the authors reported that the selection of drivetrain topology depends on the power and application, and cannot be extended to different turbines of different powers and applications. By moving from 10 MW to 15 MW, one can still see different choices in the drivetrain configuration in industry. In theory, the output coefficient of an electric generator is
[
14], where
P is the nominal power,
V is the volume (
, with
D the diameter and
L the length) and
N is the rotational speed. Therefore, to maintain the output coefficient at lower rated rotational speeds of the generator (toward direct-drive configuration), the volume of the generator has to increase. The latter shows why direct-drive generators are designed and constructed to have large diameters. This relationship also shows that, by moving toward larger turbines and higher powers, due to reduction of the rotational speed to maintain the tip speed ratio, the generator volume and mass increases more than linearly.
Comparing the different drivetrain technologies from the different aspects of design, manufacturing and O&M attracted the attention of the research society and industry. Li et al. in [
15] performed a study on a 1.5 MW wind turbine drivetrain, based on PMSG, and demonstrated how increase in the gear ratio of the gearbox could influence the generator’s active material weight and cost. Harzendorf et al. in [
16] focused on operational behavior and the criterion called drivetrain-influenced unplanned operational effort (DUOE). The authors compared five different concepts of drivetrain, based on direct-drive and gearbox, with two different types of generators, doubly-fed induction generator (DFIG) and PMSG, for a rated power of 3 MW and showed that the direct-drive concept, based on PMSG, led to the lowest mean DUOE over the drivetrain’s lifetime. A holistic comparison between a wide range of drivetrain concepts is given by the same authors in [
17]. Authors in [
11] compared the direct-drive, medium- and high-speed PMSG-based drivetrain configurations for a 10 MW wind turbine by looking into performance these different drivetrain technologies and considering the design, manufacturing and O&M phases of drivetrain operation. The results of this study showed that the reduced weight of drivetrain, due to a smaller generator, can compensate for the increased weight, due to the presence of the gearbox, in geared drivetrain technologies. That study also cast doubt on the judgement that gearbox removal in the direct-drive technology could improve the overall efficiency and reliability of the drivetrain. Recent research carried out by Jenkins et al. in [
18] compared the medium-speed and direct-drive PMSG-based drivetrain technologies for 15 MW wind turbine drivetrain from the O&M perspective and the reported results were complementary to the study performed in [
11]. The results of that study, by taking into account the generator, gearbox and rotor blades, showed that the total O&M cost (vessel + repair + lost electricity costs) of the medium-speed technology could be lower than direct-drive over the turbine lifetime driven by the lower repair cost, despite a larger number of replacements.
The emphasis of this paper is on the coupled gearbox-generator design for direct-drive, medium- and high-speed drivetrain realizations for 15 MW bottom-fixed and floating offshore wind turbines applications. This paper aimed to show how the choice of the gearbox of the drivetrain in 15 MW turbines can influence the overall drivetrain cost and performance by using a life cycle assessment approach.
The main contributions of this research are:
The conceptual design of the 15 MW drivetrain of three different topologies, namely direct-drive, medium- and high-speed drivetrain systems is presented,
The three PMSG-based drivetrain systems, designed for 15 MW offshore wind turbines, are compared from weight, dimension, efficiency and raw material cost perspectives,
The feasibility of the three designed drivetrain systems is evaluated by performing a drivetrain and turbine coupled dynamic analysis in OpenFAST and exposing the turbines to turbulent wind and irregular wave conditions for both bottom-fixed and floating offshore applications,
Compared to the previous work [
11], a more accurate model of drivetrain weight is presented, which helps to achieve a more reliable comparison between the different drivetrain configurations.
The following assumptions were made in this work:
Even though the designs of the main components are based on optimization, the drivetrain system level optimization, to find the optimal gearbox ratio for each of the medium- and high-speed drivetrain technologies, is beyond the scope of this paper,
The different bedplate, main bearing housing, low-speed coupling and converter requirements, due to different voltage levels, can also contribute to the weight comparison of the different drivetrain configurations, which are not taken into consideration in the comparison studies,
The higher voltage level in geared technologies reduces the size of the transformer and facilitates its placement in the bottom of the tower, which is not taken into account.
This paper is structured as follows. In
Section 2, the methodology, including the drivetrain life cycle assessment approach, the internal generator and gearbox optimized design approaches and the drivetrain dynamic model, are discussed. In
Section 3, the generator and gearbox optimization results of the three drivetrain configurations under consideration, the dynamic analysis of each drivetrain technology, and the comparison study between the different drivetrain systems are presented. This work is finally concluded in
Section 4.
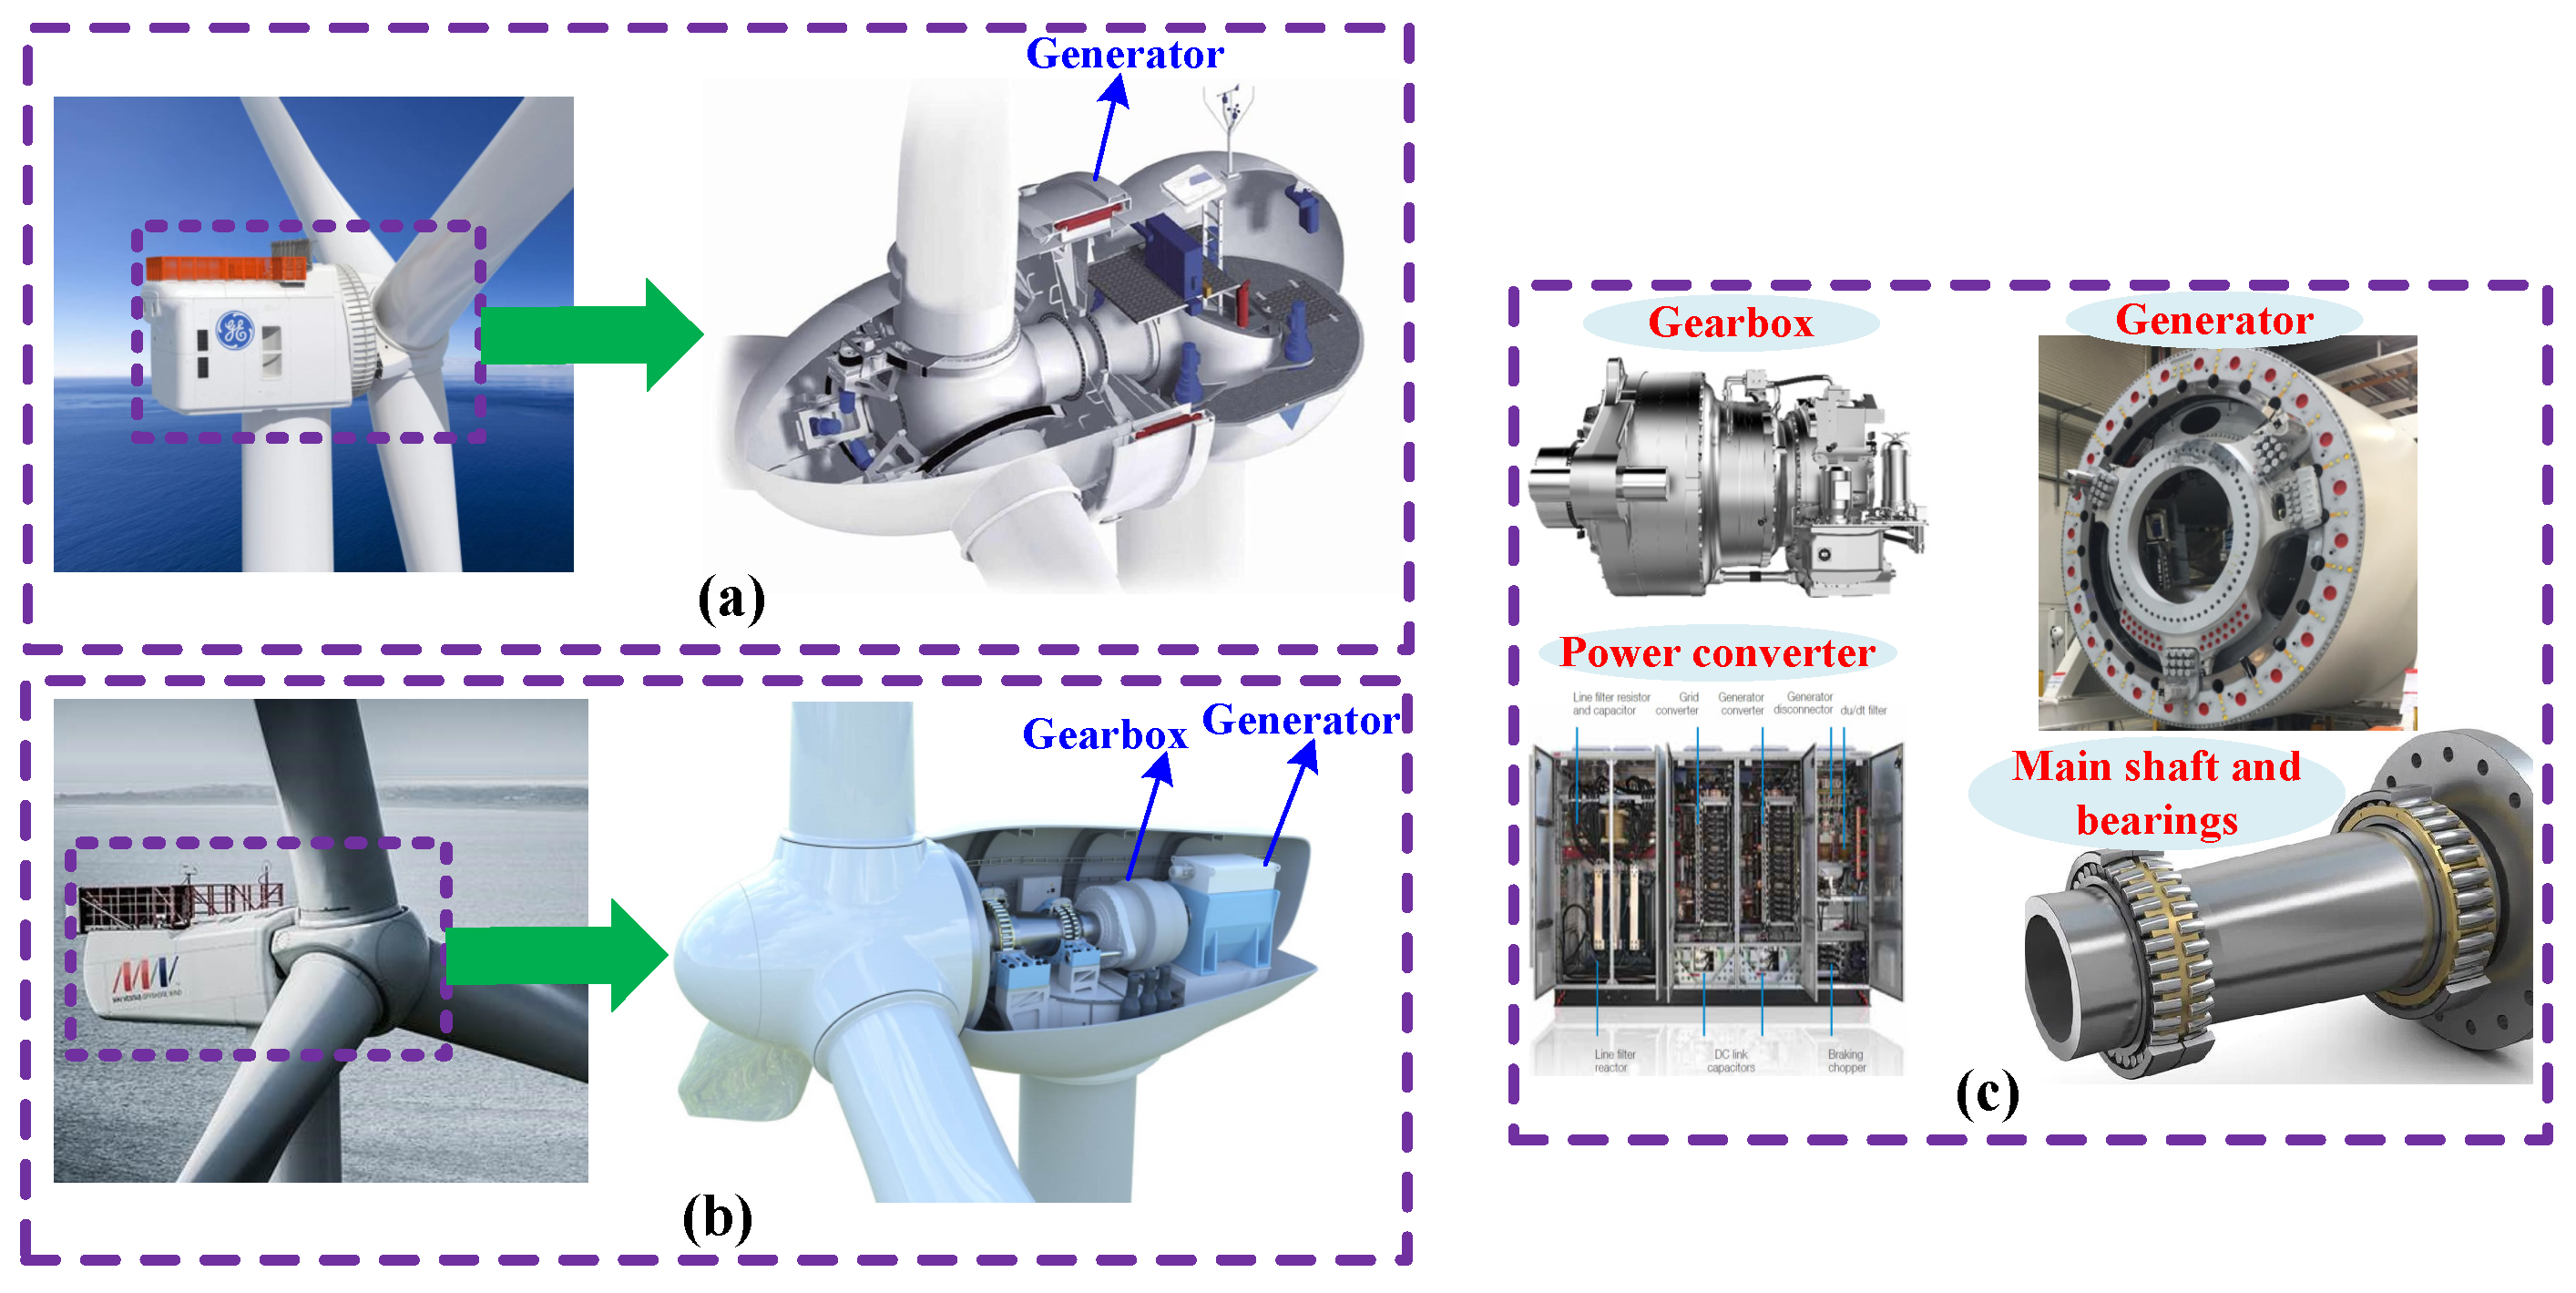
Figure 1.
Drivetrain configurations and main components. (
a) Direct-drive drivetrain, (
b) Geared drivetrain, (
c) Drivetrain breakdown (photos and figures are adopted from [
19,
20,
21,
22,
23,
24,
25,
26]).
Figure 1.
Drivetrain configurations and main components. (
a) Direct-drive drivetrain, (
b) Geared drivetrain, (
c) Drivetrain breakdown (photos and figures are adopted from [
19,
20,
21,
22,
23,
24,
25,
26]).
2. Methodology
As discussed in [
11], the choice of gearbox can significantly influence the overall weight, dynamic behavior, efficiency, manufacturing, installation, maintenance, reliability and availability of the drivetrain. In this section, to provide the framework required to compare the different drivetrain concepts for 15 MW offshore wind turbine application, the conceptual design at the component-level in each configuration is explained. The main focus is on the generator and gearbox coupled design. The interactions between generator and gearbox design in the drivetrain are discussed in [
11]. The three drivetrain configurations under consideration are based on direct-drive, medium- and high-speed generators. We initially followed a similar approach in the generator and gearbox optimized design and validation as that proposed by [
11] for a 10 MW drivetrain, with adjustments in the design strategy, according to the requirements of a 15 MW drivetrain design. Additional details were added to this model, which are explained below.
2.1. Drivetrain Life Cycle Assessment
Drivetrain life cycle assessment is based on simultaneously considering the feasibility and complexity of design, raw material and manufacturing costs, installation efforts, the costs of O&M, life extension and decommissioning phases of the drivetrain operation.
In this work, life extension and decommissioning were not taken into consideration. In regard to the design consideration in the drivetrain life cycle assessment, the dynamic models of the different drivetrain technologies were constructed, and the possibility of resonance between the drivetrain natural frequencies and the external excitation frequencies, due to the coupled effects of wind, wave and structurally-induced motion natural periods, and structural modes, were investigated. The dynamic properties and behavior of the drivetrain is generally an important factor in the comparison of the different possible drivetrain realizations.
To consider the role of manufacturing in the life cycle assessment, the raw material consumption of the different configurations was examined. For this purpose, the weight and size of the different drivetrain technologies were specified by solving the component-level raw material cost minimization problems of the generator and gearbox as the two main contributors to the overall drivetrain weight. The latter also provides input to calculate the installation costs (transport and craning operations), but this was not studied in this work. The length and diameter of the drivetrain components have an influence on the nacelle and bedplate size, which both influence the nacelle overall weight and, therefore, the manufacturing and installation costs. Weight is critical as it influences the installation and service costs, because a heavier drivetrain or nacelle requires more costly lifting operations. The drivetrain manufacturing costs are correlated to the drivetrain weight, but different drivetrain topologies, and the selection of components, can have a different ratio of raw material cost to overall drivetrain weight. The reason for this is that the cost to weight ratio of generators and gearboxes is dependent on their design complexity, and size has a different magnitude. Additionally, even inside a component, there is not necessarily a constant cost to weight ratio for different topologies. The gearbox manufacturing costs are closely connected to the gearbox weight; but not, however, necessarily proportional. This is because different machine elements have different cost to weight ratios and, therefore, different gearbox configurations can have different ratios of raw material costs to overall gearbox weight. As discussed earlier, the complexity of the drivetrain influences the design and manufacturing costs, as well as the maintenance and, hence, the operational costs. The use of standard parts is always the goal, as this reduces the design and manufacturing costs. However, the design process within the extent of this work is not detailed enough to make a differentiated assessment of the ability to use standard parts of the different drivetrain technologies. For all these reasons and, also, the uncertainties in the unit costs of materials, the cost of raw material was not used as a key performance index in the overall drivetrain comparison study. The cost of raw material is discussed in the paper as each component was individually designed to minimize the raw material costs.
The life cycle assessment should also accommodate O&M costs. The drivetrain efficiency is important to the overall cost of energy. The overall efficiency of the different drivetrain configurations was one of the criteria considered here to account for operation in the life cycle assessment. Reliability has a key influence on the maintenance and, therefore, the operational expenditure. It also has an impact on the lifetime and, therefore, influences the LCOE. The reliability analysis of the drivetrain can be performed by using long-term fatigue damage analysis of the bearings and gears as the drivetrain fatigue damage critical components, which should be profoundly inspected against the fatigue defects. Then, the damage index can be defined as the indicator of the overall fatigue damage for each drivetrain technology, by following the procedure explained in [
1], and using the bearings and gears specification as a result of this study. The latter can be supported by machine learning to account for the model and measurement uncertainties [
27]. This work provides the specification of the drivetrain components as the main input for a detailed reliability analysis. To maintain the tip speed ratio of larger rotors in higher powers to reach the highest power coefficient, the nominal rotational speed of rotor is reduced. The latter, together with the different selection of drivetrain, turbine and support substructure components, are the reasons why a failure modes analysis for a drivetrain of a similar technology would not be valid when the rated power, rotational speed and support substructure change. Therefore, an analysis for the 15 MW turbine, in particular, was performed in this work.
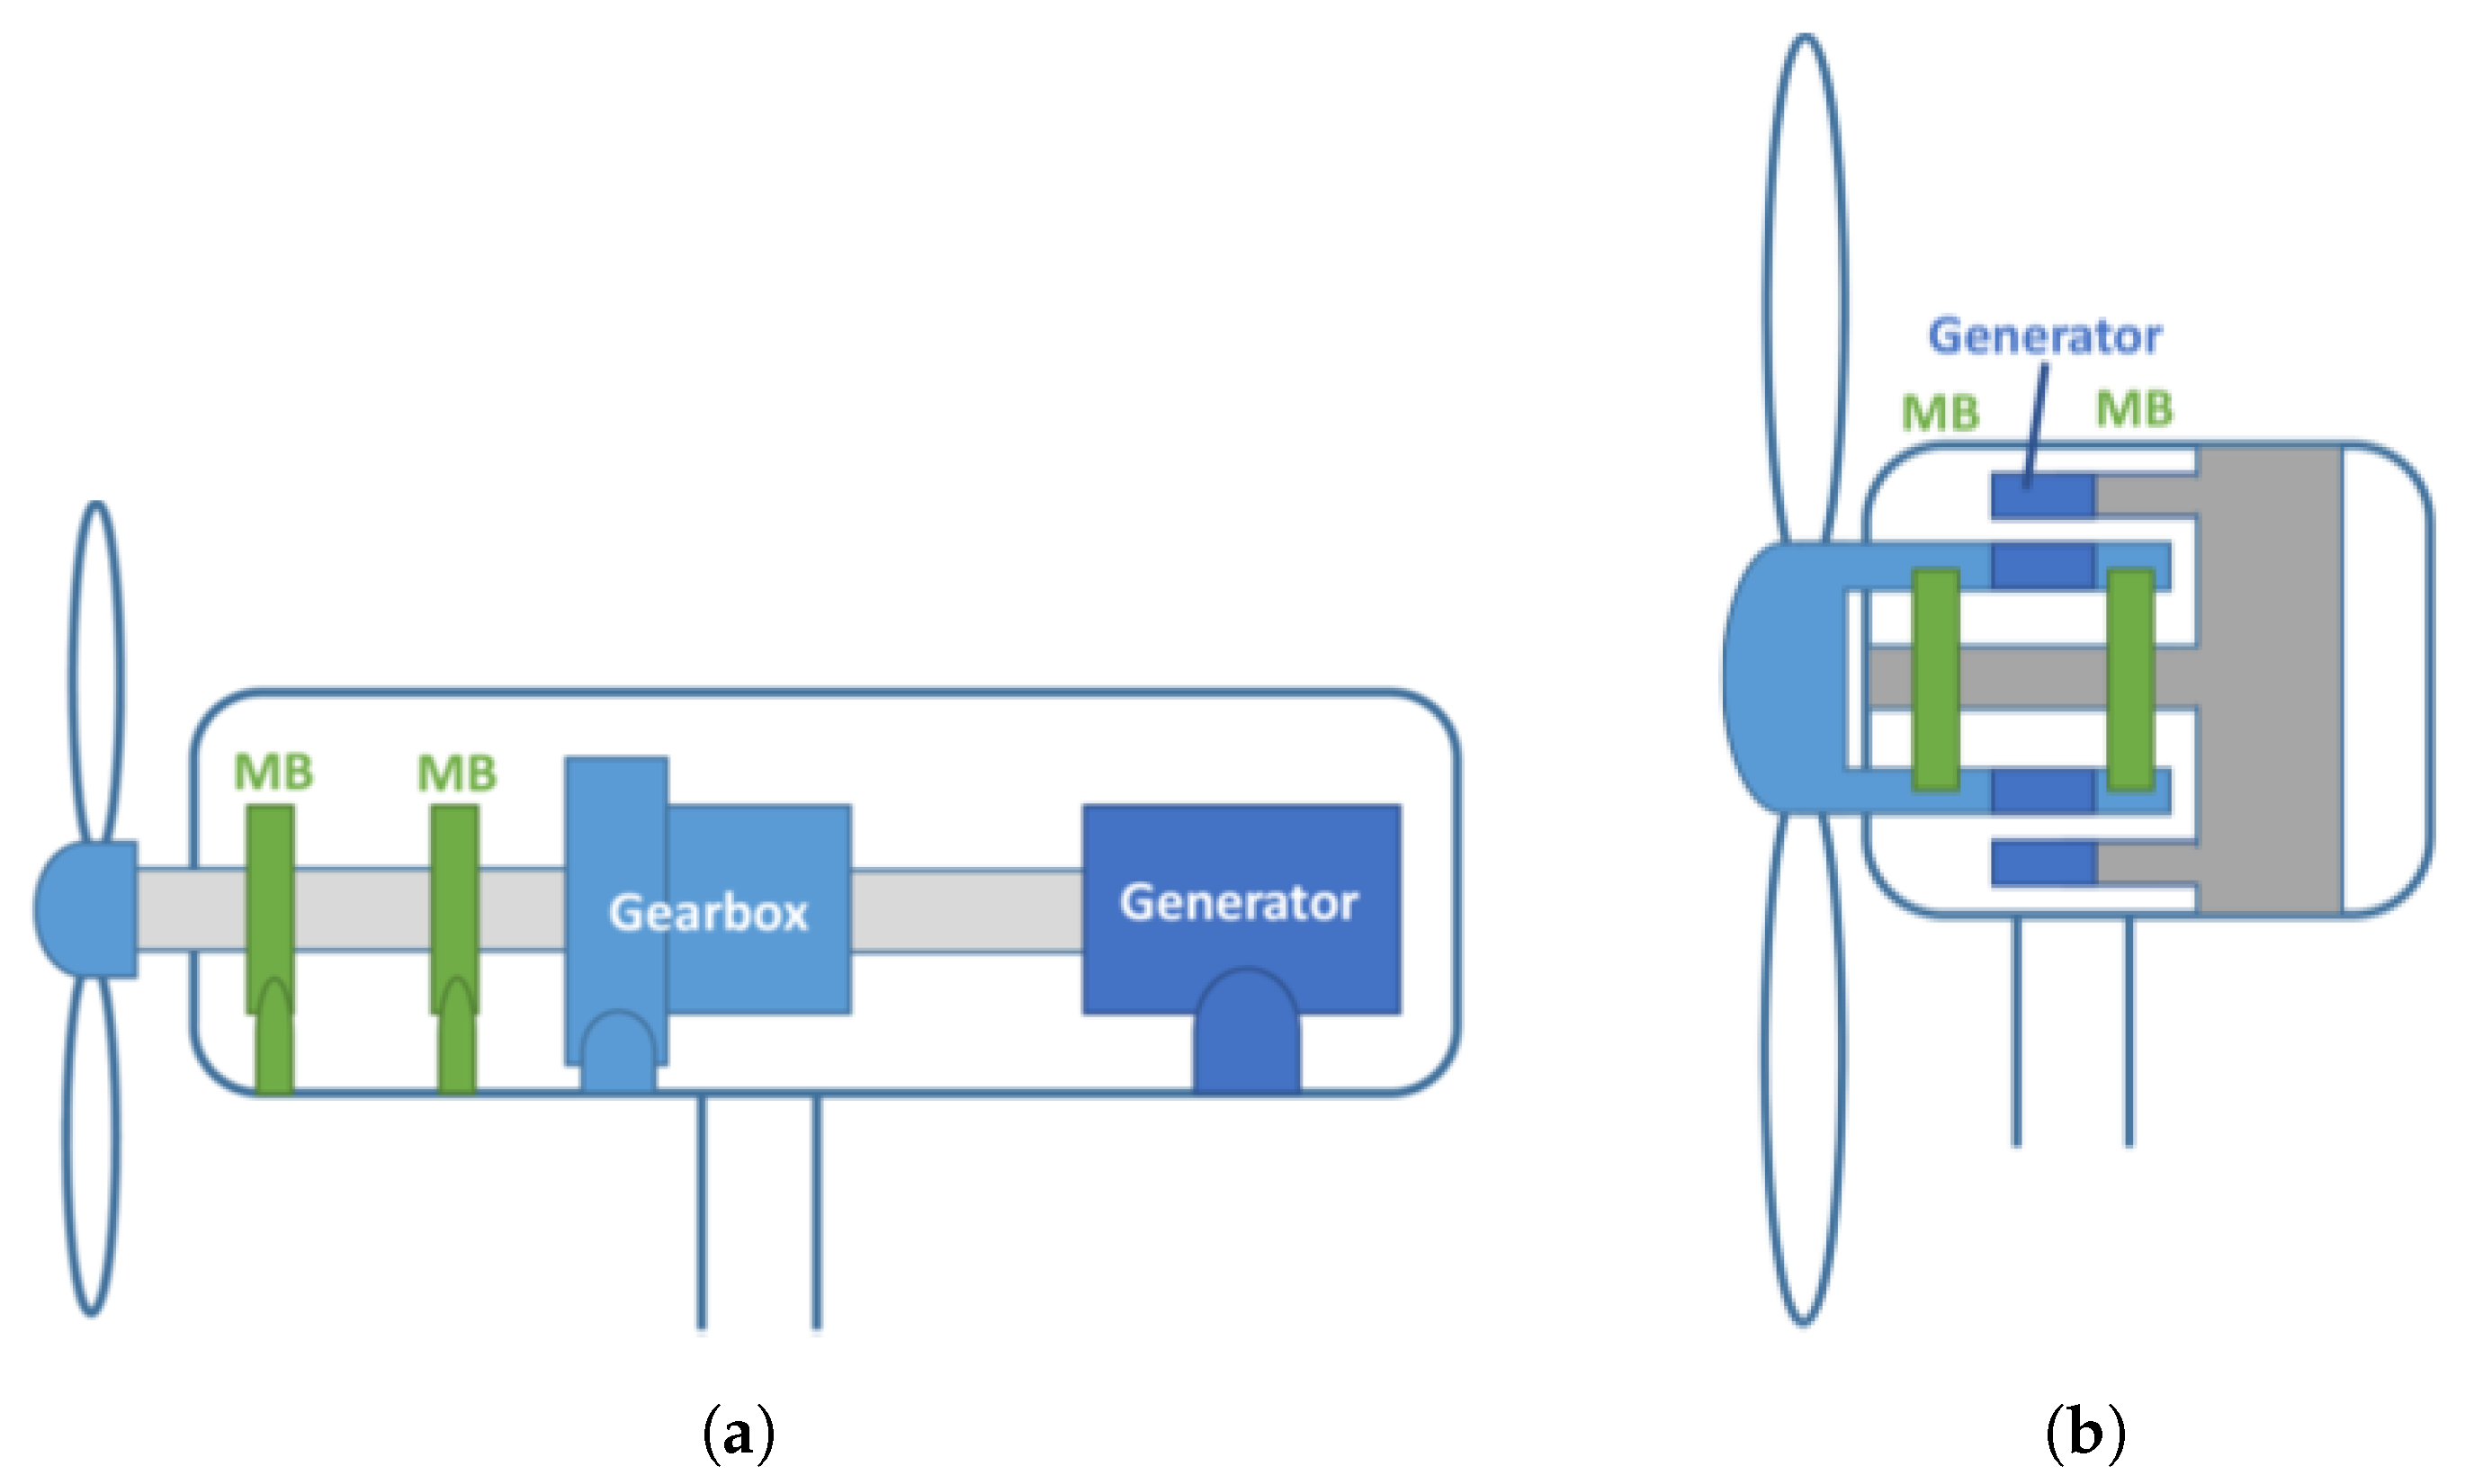
2.2. Drivetrain Layout
Different drivetrain layouts for rotor–gearbox–generator configuration, based on both direct-drive and geared drivetrain technologies, are described in [
28].
Figure 2 illustrates the two different drivetrain layouts assumed for the geared and direct-drive drivetrain configurations in this research. The two geared drivetrain technologies, based on medium- and high-speed generators, are assumed to be based on a four-point suspension and two main bearings. In this layout, a second main bearing is placed right before the gearbox at the end of the main shaft to react to the non-torque loads right before the gearbox (
Figure 2a). The direct-drive drivetrain is based on a double main bearings design, where the bearings are integrated to the hub and are outer ring/race rotating bearings (
Figure 2b).
The distribution of loads, the size and weight of the two main bearings and the requirements of the main bearings housing are different in these two different drivetrain layouts. For example, in the direct-drive drivetrain layout, there is no need to use additional housings for the two main bearings, which can reduce the overall drivetrain weight.
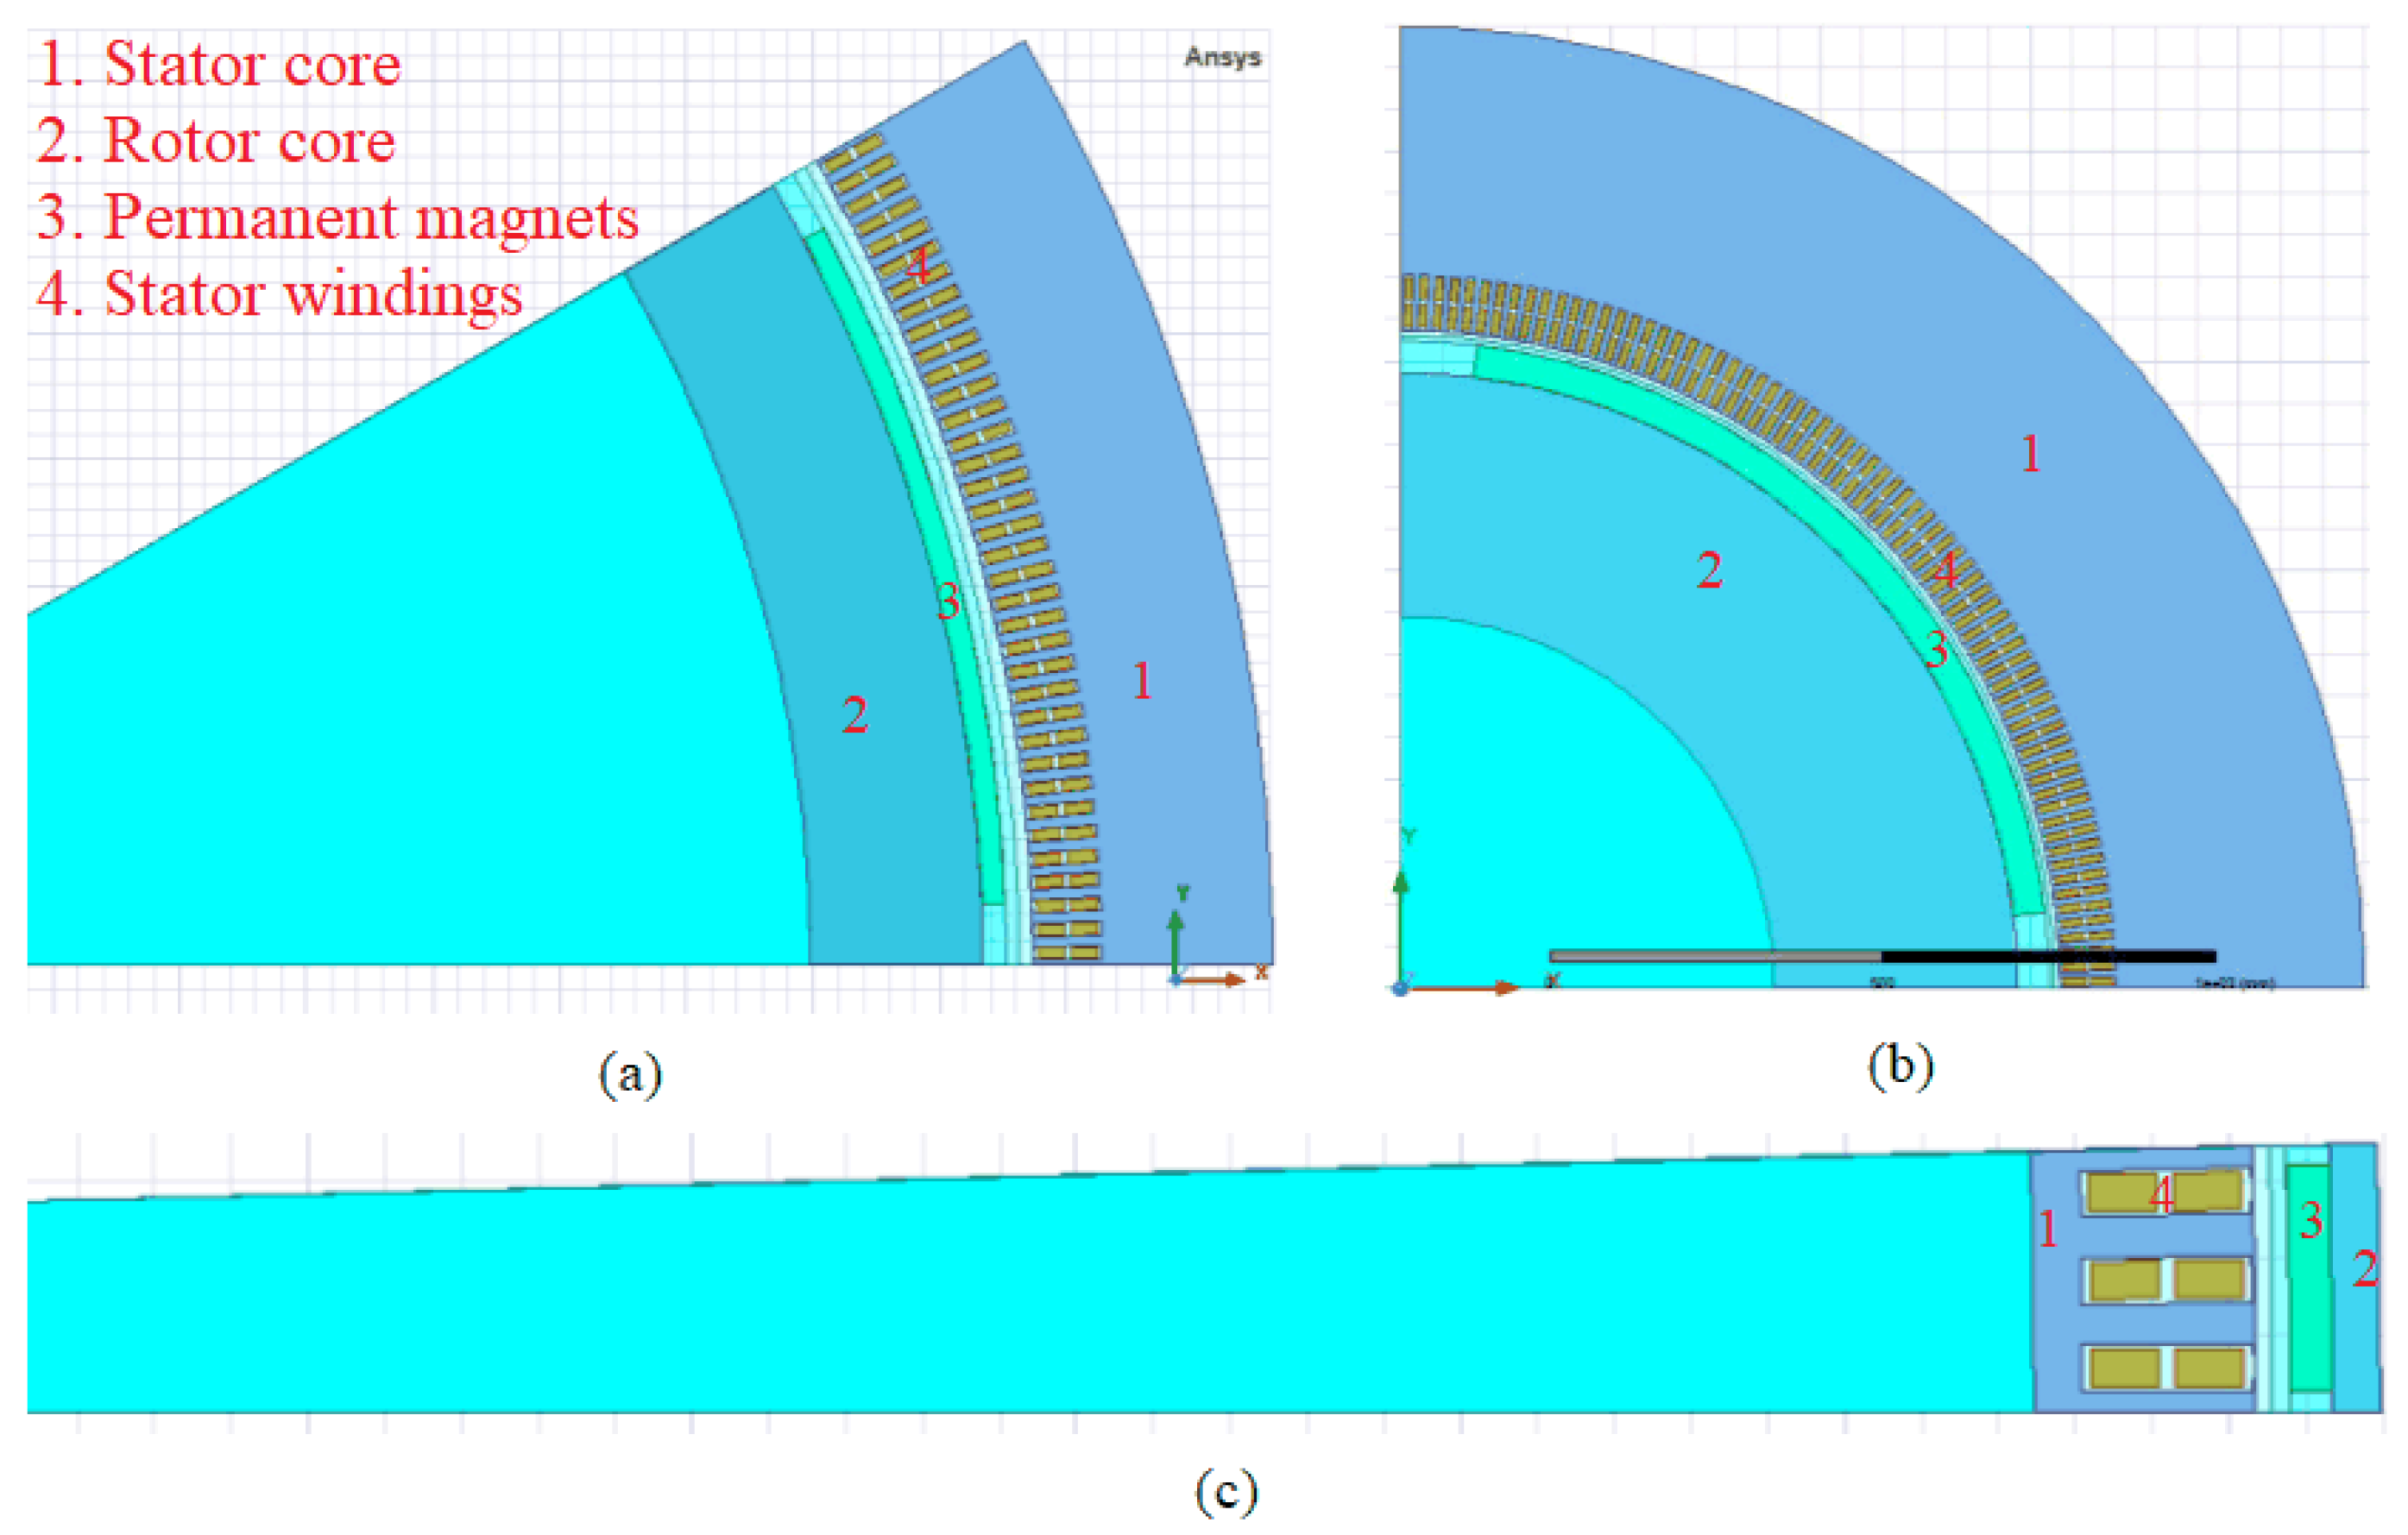
2.3. Generator Design
In wind power applications, the most common large permanent magnet generator for direct-drive is the outer rotor radial-flux surface mounted PMSG, and the most common for the geared drivetrain is the same technology, but with an inner rotor. The main advantages with inner and outer rotor radial-flux PMSGs, when compared to one another, are discussed in [
29]. The area covered by a single pole for the three designed generators are depicted in
Figure 3, which shows the stator windings placed in the stator slots, the stator and rotor cores and the permanent magnets placed on the rotor surface.
The cost function applied to the generator optimized design problem was the cost of active material over the torque density, as defined by [
11], and aimed at maximizing the utilization of generator weight. The optimization problem was the function of five design variables, namely, the air-gap diameter
, stack length
, slot width
, slot height
and magnet height
. The design constraints included the equality constraint, related to the no-load Electromotive force (emf), and inequality constraints, related to the limits of current density. The proper mechanical design to withstand vibration and bending (slot height to width, slot width to tooth width, magnet height to pole pitch and air-gap diameter to stack length ratios), the limits of tooth and air-gap flux densities, and the specific electrical loading were added to the design objective function. The main optimization constraints, as the function of the five optimization variables, are described by the following equation:
where
is the winding factor. The definition of the other parameters are given in
Section 3.2.
The direct relationship between the induced voltage and speed, means that, by taking into consideration the rotational speed in the direct-drive compared to medium-speed, the medium-speed compared to high-speed generator is reduced, and it is not efficient to design these generators with the same voltage level. As a result, to realize a more realistic design, these generators were designed for different standard voltage levels, which also helped to significantly save in the overall weight of the designed generators.
The conceptual design performed by using this analytical design approach was then modeled and validated using Ansys RMxprt to ensure that the designed generator was able to stably deliver the desired power at the desired voltage level. In this model, more details of the slots, material properties and the windings were applied, which caused the design outputs to slightly change compared to the primary input values calculated from the conceptual design step.
In this work, compared to the generator design proposed in [
11], a detailed model of structural weight was employed to realize a more accurate comparison between the total weight of the different generators under consideration. The generator structural model is described in the following.
Structural model of PMSG: The generator structural model of radial-flux permanent magnet machines was adopted from [
30], where a disc structure was used for the rotor and an arm structure with hollow arms for the stator. The design criteria were the deflections (radial, axial and torsional) to maintain the air-gap clearance against the structural forces acting on the structure and torque limitations, as explained by [
31]. By using this model, the generator structural weight is described by the equation:
where
,
and
are the structural weight of rotor, the structural weight of stator and the weight of generator bearings, respectively.
and
are the weights of rotor support disk and cylinder, and
is the weight of generator shaft.
and
are the weights of the support arms and cylinder of stator. The weight of generator bearings and shaft was not included in the calculation of the structural weight of the direct-drive generator, because the main bearings and main shaft were not included in the weight calculations of the three drivetrain technologies under consideration. Moreover, the arm structure was assumed to be used for both the rotor and the stator of the outer rotor direct-drive generator. The generator shaft was roughly designed based on the maximum torsional stress, the stiffness requirements to limit the shaft deflection, and the diameter requirement to match the bore diameter of the deep groove roller bearings of the generator. The cooling system design of the generator was generally performed in a way to keep the generator size down and to ensure that the operation of the generator was within the safe thermal limits [
32]. The cooling system design and its influence on the structural weight was not considered here.
One main source of mechanical vibrations in PMSGs is the cogging torque. The attractive force between rotor magnets and steel-made stator slots which is called cogging effect is prevalent in slotted synchronous motors. The oscillatory torque generated by the generator to oppose the cogging effect is called the cogging torque. As the definition says, the fundamental cogging frequency
is the function of the number of rotor poles
P and stator slots
Q as defined by:
By taking into consideration that in each rotation,
p poles interact with
Q slots, the resultant cogging torque is made of a modulated carrier with the frequency
modulated by a signal with the frequency
[
33]. Different analytical models are proposed in the literature for modeling the cogging torque [
34]. A common way to model cogging torque is based on the energy approach. In this method, cogging torque is derived from the magnetic flux density spatial distribution by calculating the rate of change of total stored energy in the air-gap with respect to the rotor angular position assuming the energy variation in the iron is negligible compared with the energy variation in the air-gap [
33,
35]. The latter leads to Equation (
4) as
where
g is the mechanical air-gap height,
is the effective length of stator core,
is the air-gap permeance,
is rotor pole pitch described by
,
is air-gap diameter and
is the air-gap magnetic flux density expressed as a function of the
x coordinate representing the linear displacement of rotor in the air-gap.
further depends on the maximum value of the stator current, the winding factor and the number of stator turns in series in each phase. In the above model, the cogging torque of a single pole was analyzed, which could be extended to the other poles.
2.4. Gearbox Design
2.4.1. Gearbox Configuration and Layout
The decision on the gearbox configuration was a compromise between weight, complexity and efficiency. One of the most common gearbox configurations in offshore wind turbines, to realize medium-speed and high-speed drivetrain technologies, is a conventional three-stage configuration with two planetary stages and one parallel stage [
36,
37,
38]. Depending on the overall gear ratio, three planetary stages could be a better solution considering the overall weight reduction [
11]. This topology was also the one used by MHI Vestas in V236-15.0 MW wind turbine [
39]. Using a planetary stage, compared to parallel, helps to keep the torque–density up, even if it costs more to manufacture. A comparison between the gearbox with two planetary stages and one parallel stage and three planetary stages to realize the 15 MW medium-speed drivetrain is given in [
40]. In general, the gearbox mass has a relationship with the rated rotor torque in such a way that it increases as the torque increases. The increase of torque happens in the case that the rated power of the turbine increases, or the rated rotor speed decreases, which both these cases happen simultaneously when sizing up a turbine from 10 to 15 MW.
The study performed by Desch [
40] showed that a four-stage gearbox was a promising configuration for the high-speed drivetrain, from the weight and raw material cost points of view. Therefore, a four-stages gearbox configuration was considered for the high-speed drivetrain analysis in this work.
An individual gear stage has an optimal stage ratio for which the relation between the achieved gear ratio and the gear weight reaches a minimum value [
41,
42]. This is the reason why the optimal number of stages increases with the increased gearbox overall ratio. This assumption could justify the view that a fourth stage only has benefits for a high-speed gearbox as the gearbox ratio of this gearbox is much higher than that in a medium-speed gearbox.
A planetary stage with fixed ring gear, driving planetary carrier and driven sun gear was used. Five planets in the first stage and three planets in all the following stages, as used in [
11,
38], were assumed in the planetary stages. This configuration was still found to be reasonable for 15 MW, because the increase of the planet number in the following stages was shown to reduce the gearbox weight by 1 to 2% but had no significant influence on the overall comparison [
40]. Therefore, the optimization of the number of the planets of each stage was not of a focus in this work. The bearing arrangement was chosen according to the recommendations in IEC 61400-4 [
43]. According to the chosen bearings types and the static loads, the size of the bearings was calculated by using KISSsoft to reach a lifetime of 20 years.
2.4.2. Gearbox Optimization
As discussed earlier, the main factors for the gear weight of a gear stage are the torque and the stage ratio. The optimized gearbox design consisted of a conceptual design step, using an analytical gearbox model to find the optimized gear ratios of the stages in the gearbox layout, and a detailed design step, using KISSsoft software to obtain the detailed geometry of gears, their equivalent model parameters, including inertia and stiffness, their weights and the overall performance indices, such as efficiency. The details of the gearbox shafts and bearings could also be specified in this analysis. The gearbox model used for the 15 MW gearbox design optimization was based on [
44], and, throughout this section, the gearbox optimized design code [
45] was used. The authors remind the reader that the Matlab implementation of the gearbox design code is available online [
45]. The objective function of the gearbox optimization algorithm is the minimization of the gears’ overall weight by optimizing the gear stage ratios. This optimization is based on the gear stage weight model proposed by [
44], which contains the correlation between the gear weight of an individual stage and the stage ratio on a physical basis.
The weights of a planetary
and a parallel stage
are calculated as the function of the torque of the individual stage
, the gear stage ratio
u and the planets number
B for a planetary stage [
44] as:
where
is the density of steel,
k is the intensity of the tooth loads factor and
is the ring scaling factor. The input torque of the individual stage
S, defined as
, can be expressed as a function of the rated input torque
and the individual gear stage ratios of the previous stages
:
The total gears weight of the gearbox with
k planetary and
l parallel stages is
:
which is the sum of the weight of all the individual stages.
This optimization problem in Equation (
8) was solved by using Matlab fmincon nonlinear optimization solver. The inputs were the gearbox configuration (number and type of stages), the rated torque, the overall gear ratio, the number of planets in the planetary stage and a constraint related to the gear ratio of each stage. The outputs were the optimized stage ratios and the calculated weight. In [
11], a weight correction factor was used to account for the weight of bearings, shafts, housing and lubrication. In this work, a more accurate weight model of gearbox was used. For this purpose, KISSsoft was used to size the shafts and bearings and to calculate the weight of bearings and shafts, while the weight of housing and lubrication was not taken into consideration in the reported overall gearbox weight. With the optimized gear stage ratios, a detailed gearbox design in KISSsoft was conducted.
The total gearbox weight
including gears, shafts and bearings was:
The gearbox raw material costs were calculated in KISSsoft, using the weights of the different components (shafts, gears, bearings) and the predefined cost factors to calculate an estimate for the costs of the different machine elements, based on their weight. The gearbox raw material cost
was:
The cost factors
c of the different gearbox components used in the Equation (
10) were defined in
Section 3.3.
2.5. Drivetrain Dynamic Analysis
The general form of n-DOF torsional dynamic model of drivetrain in the time domain was defined by [
18]:
where
,
and
are the moment of inertia, damping and stiffness matrices with the size
.
and
are the response and load vectors with the size
. The procedure to calculate the inertia and stiffness matrices from the geometrical and material properties of the drivetrain are explained in [
46]. The torsional natural frequencies by using this model can be calculated by:
To see the influence of gearbox inertia on the drivetrain dynamics, the equivalent gearbox inertia was calculated from the equivalent inertia of each stage by using the equation:
where
, is the equivalent inertia of the gear stage
from the the stage input shaft, and
is the gear stage ratio. To estimate the generator inertia for the dynamic model, one can use the equation:
where
,
,
,
,
and
are the inertia of the rotor yoke, permanent magnets, support cylinder, support disk and shaft, respectively. To estimate the high-speed shaft stiffness for the dynamic model, the following equation can be used:
where
is the stiffness of the part of gearbox shaft placed between the gearbox output and the coupling,
is the stiffness of the coupling, and
is the stiffness of the part of generator shaft placed between the generator output and the coupling. The length of gearbox and generator output shafts were selected to fit the coupling and to leave some space for instrumentation and maintenance operations. The criteria for the selection of generator coupling in geared drivetrain technologies were the high torque capacity, low torsional flexibility, backlash free and fail safe features and the possibility to add the disk brake. The coupling torque was selected based on the rated and peak torques of the driving side and the applying of sufficient safety factors.
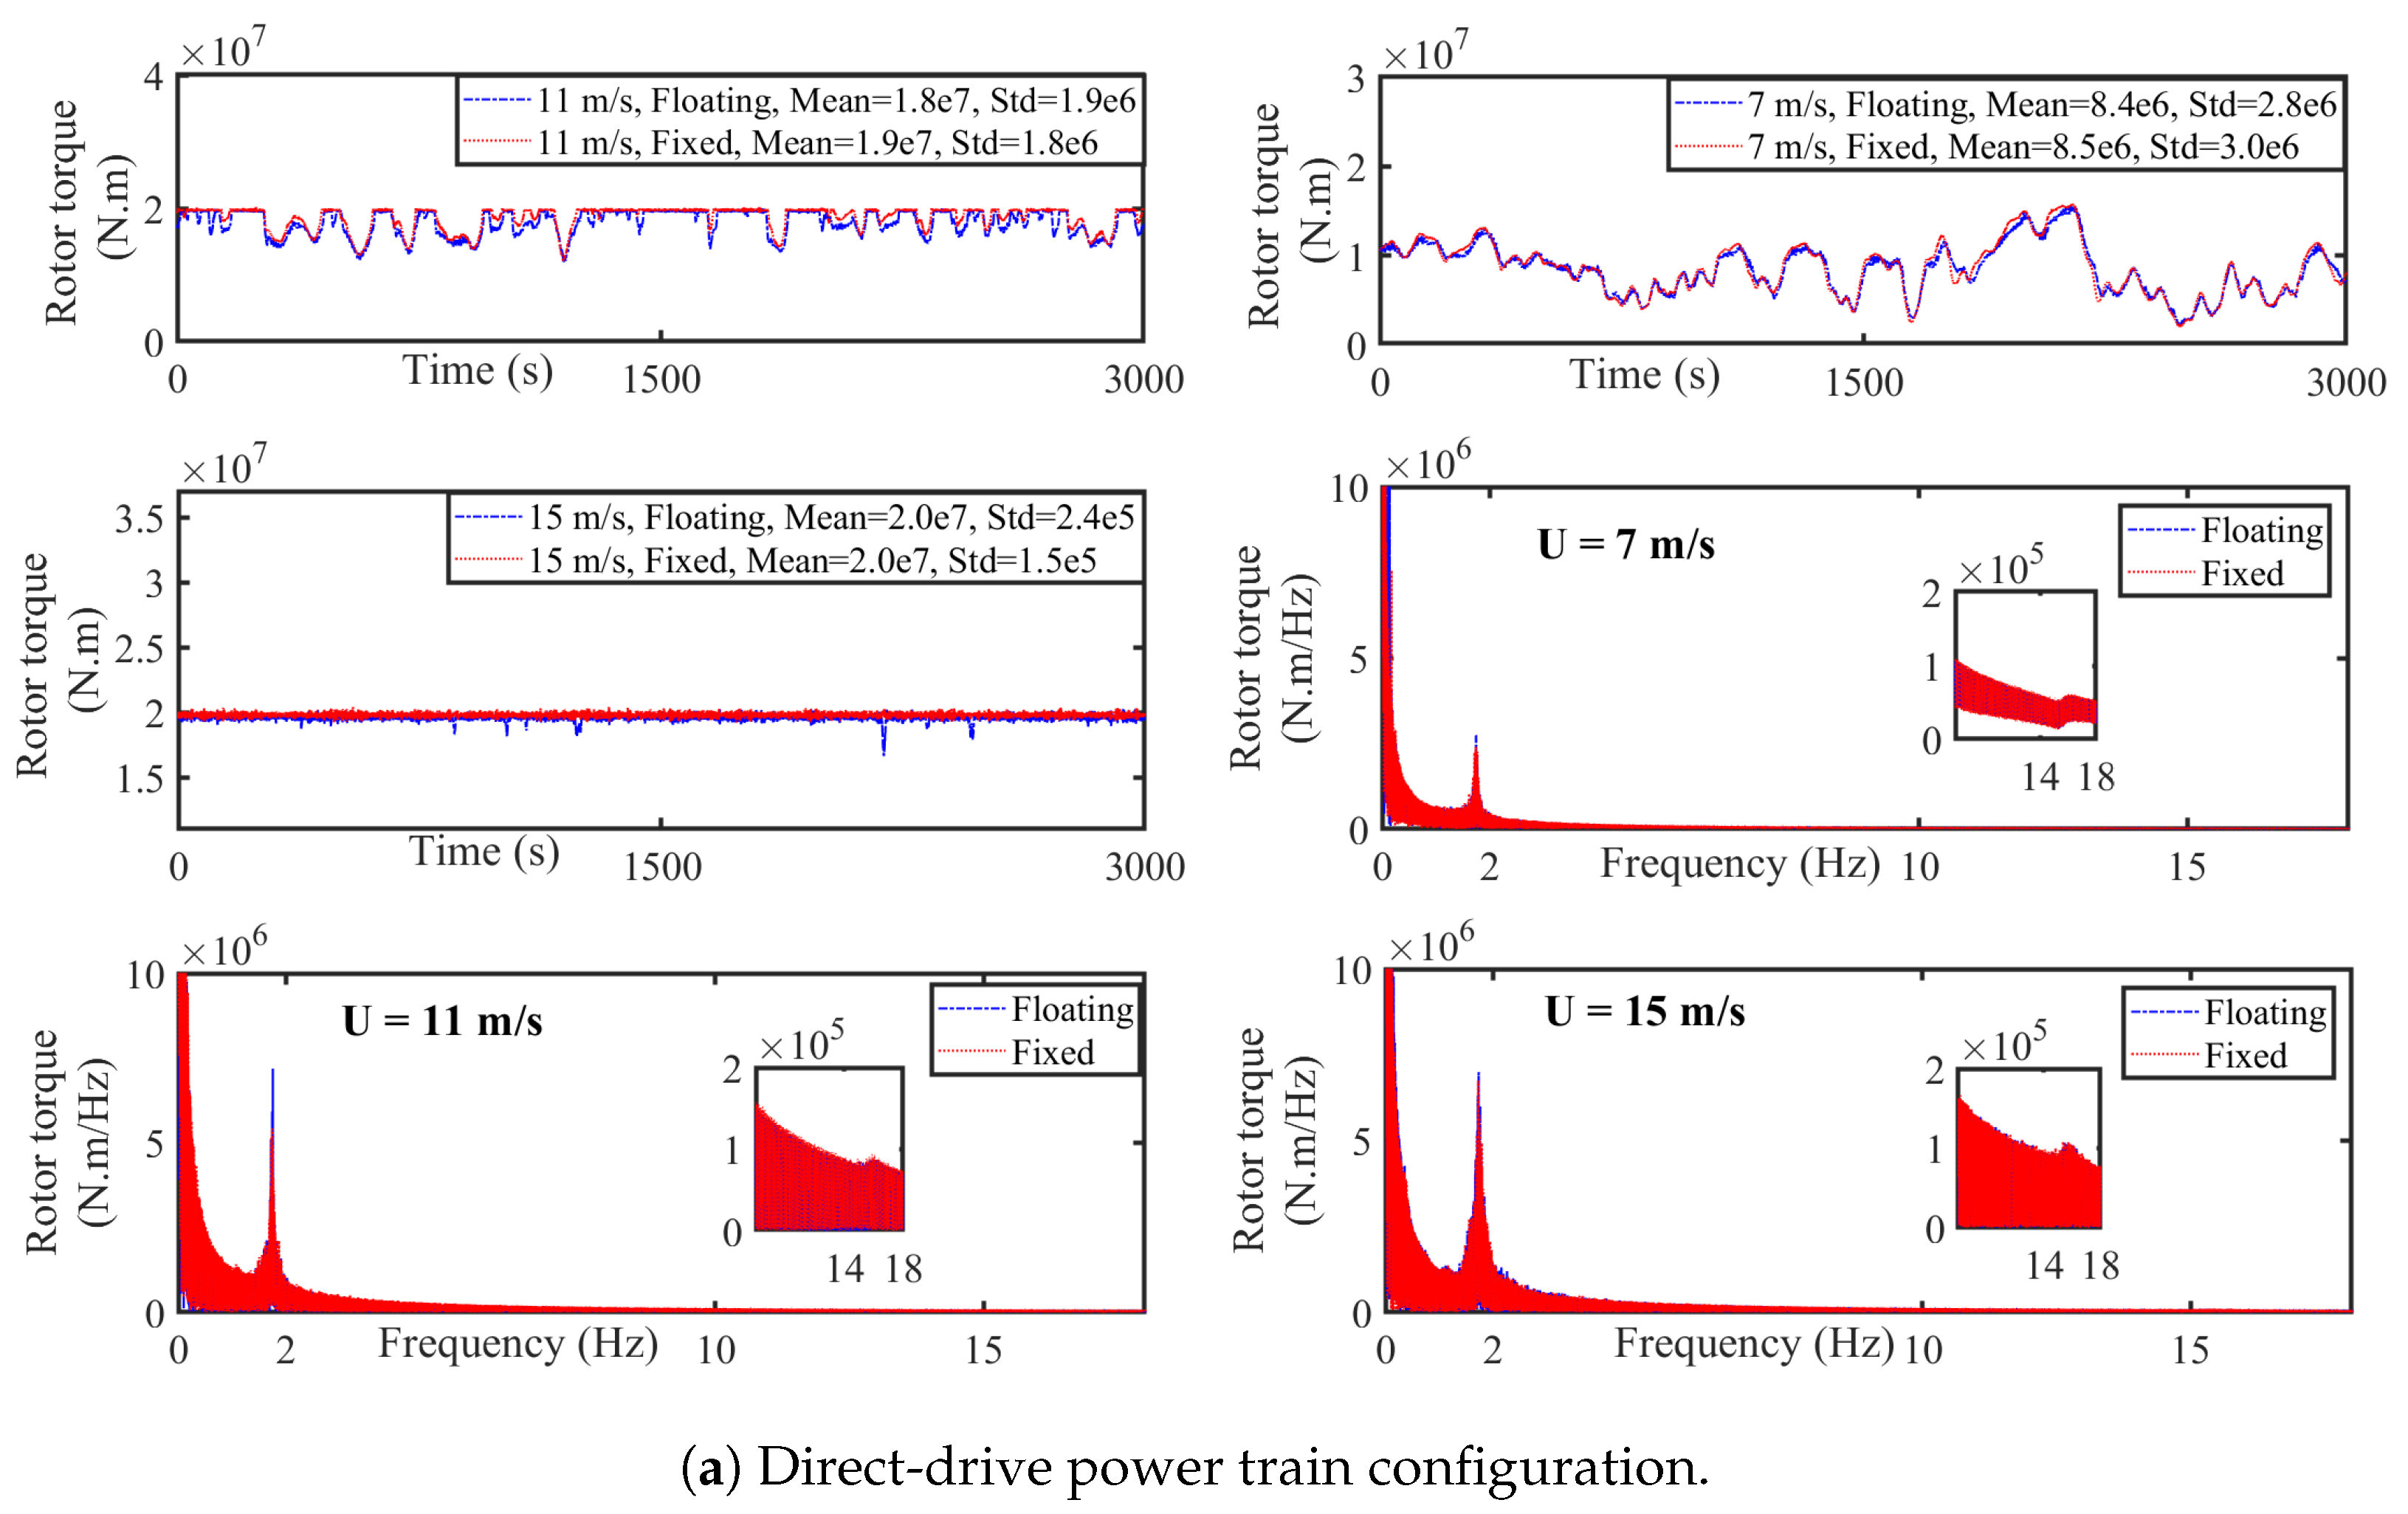
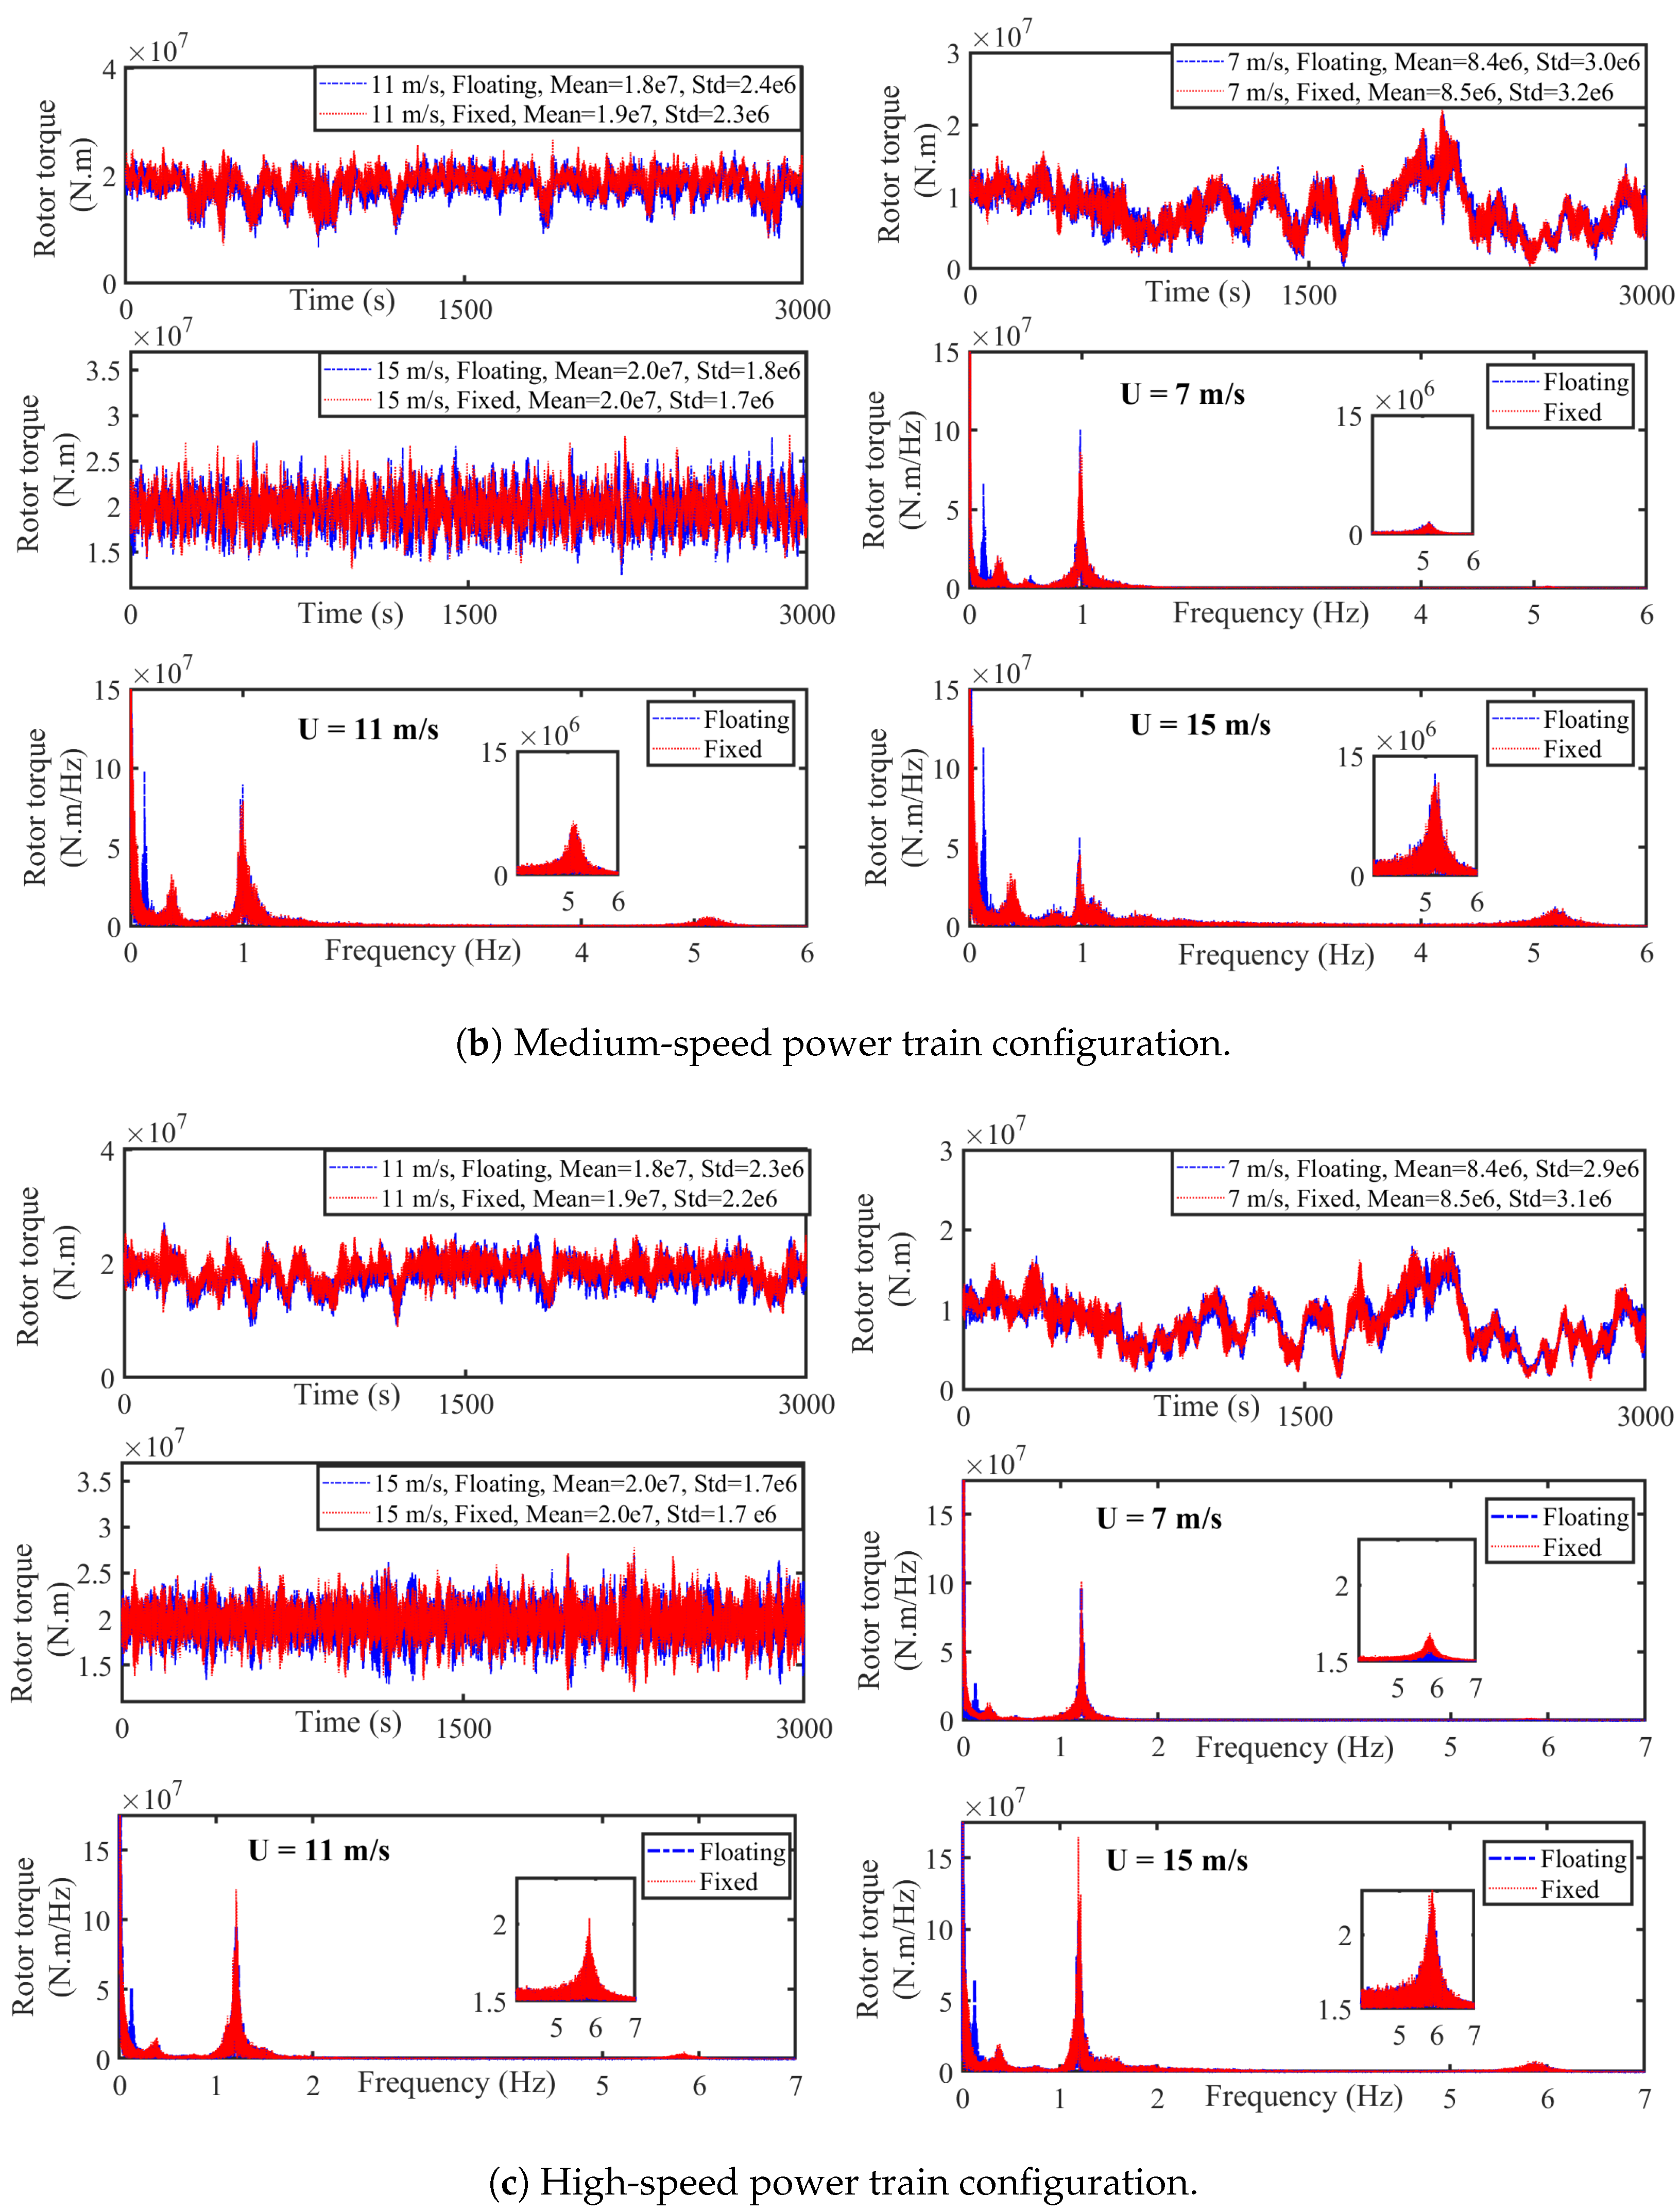
To analyze the turbine-power train systems coupled dynamics in the three drivetrain configurations under consideration, the equivalent reduced-order dynamic model of each drivetrain configuration was created. Then, the drivetrain equivalent dynamic models were integrated into the turbine simulations containing both the turbine model and the external loads. As a result, the drivetrain loads were calculated from the fully-coupled turbine-power train dynamic model. The turbine model developed in NREL’s OpenFAST is a detailed coupled aero–hydro–servo elastic dynamic model, which contains the structural and power train dynamics loading NREL Reference OpenSource Controller (ROSCO). More details about OpenFAST load and response analysis can be found in [
47]. The global simulations were performed for both bottom-fixed monopile and floating semi-submersible (UMaine design) substructures. This model was beneficial from two aspects. First, to validate the drivetrain design, by using the coupled turbine model, to show that resonance avoidance could be achieved in each of the designs for different operating conditions and to ensure a safe operation for all the load cases defined by IEC61400-1 standard [
48]. Second, to calculate the accurate values of the drivetrain loads for various load cases to provide the inputs for potential drivetrain life calculation and reliability analysis.
The power train model in the global simulations was a two-degree-of-freedom (2-DOF) torsional model, which was able to capture the dynamics due to the first power train system rigid and non-rigid modes and their interactions with the structural modes and external excitation sources. The following equation describes the first rigid and nonrigid torsional natural frequencies of the general case of geared drivetrain based on a 2-DOF model as:
where
and
are the moment of inertia of rotor and generator,
and
are the stiffness of the main- and high-speed shafts, respectively.
is the inverse of the overall gear-ratio which takes the value 1 for the direct-drive drivetrain. Gear-ratio in IEC 61400-4 is defined by
, where
n and
are the rotational speeds of the input and output shafts, respectively [
43].
is the equivalent stiffness presented by the rotor-generator system interacting between this system and nacelle.
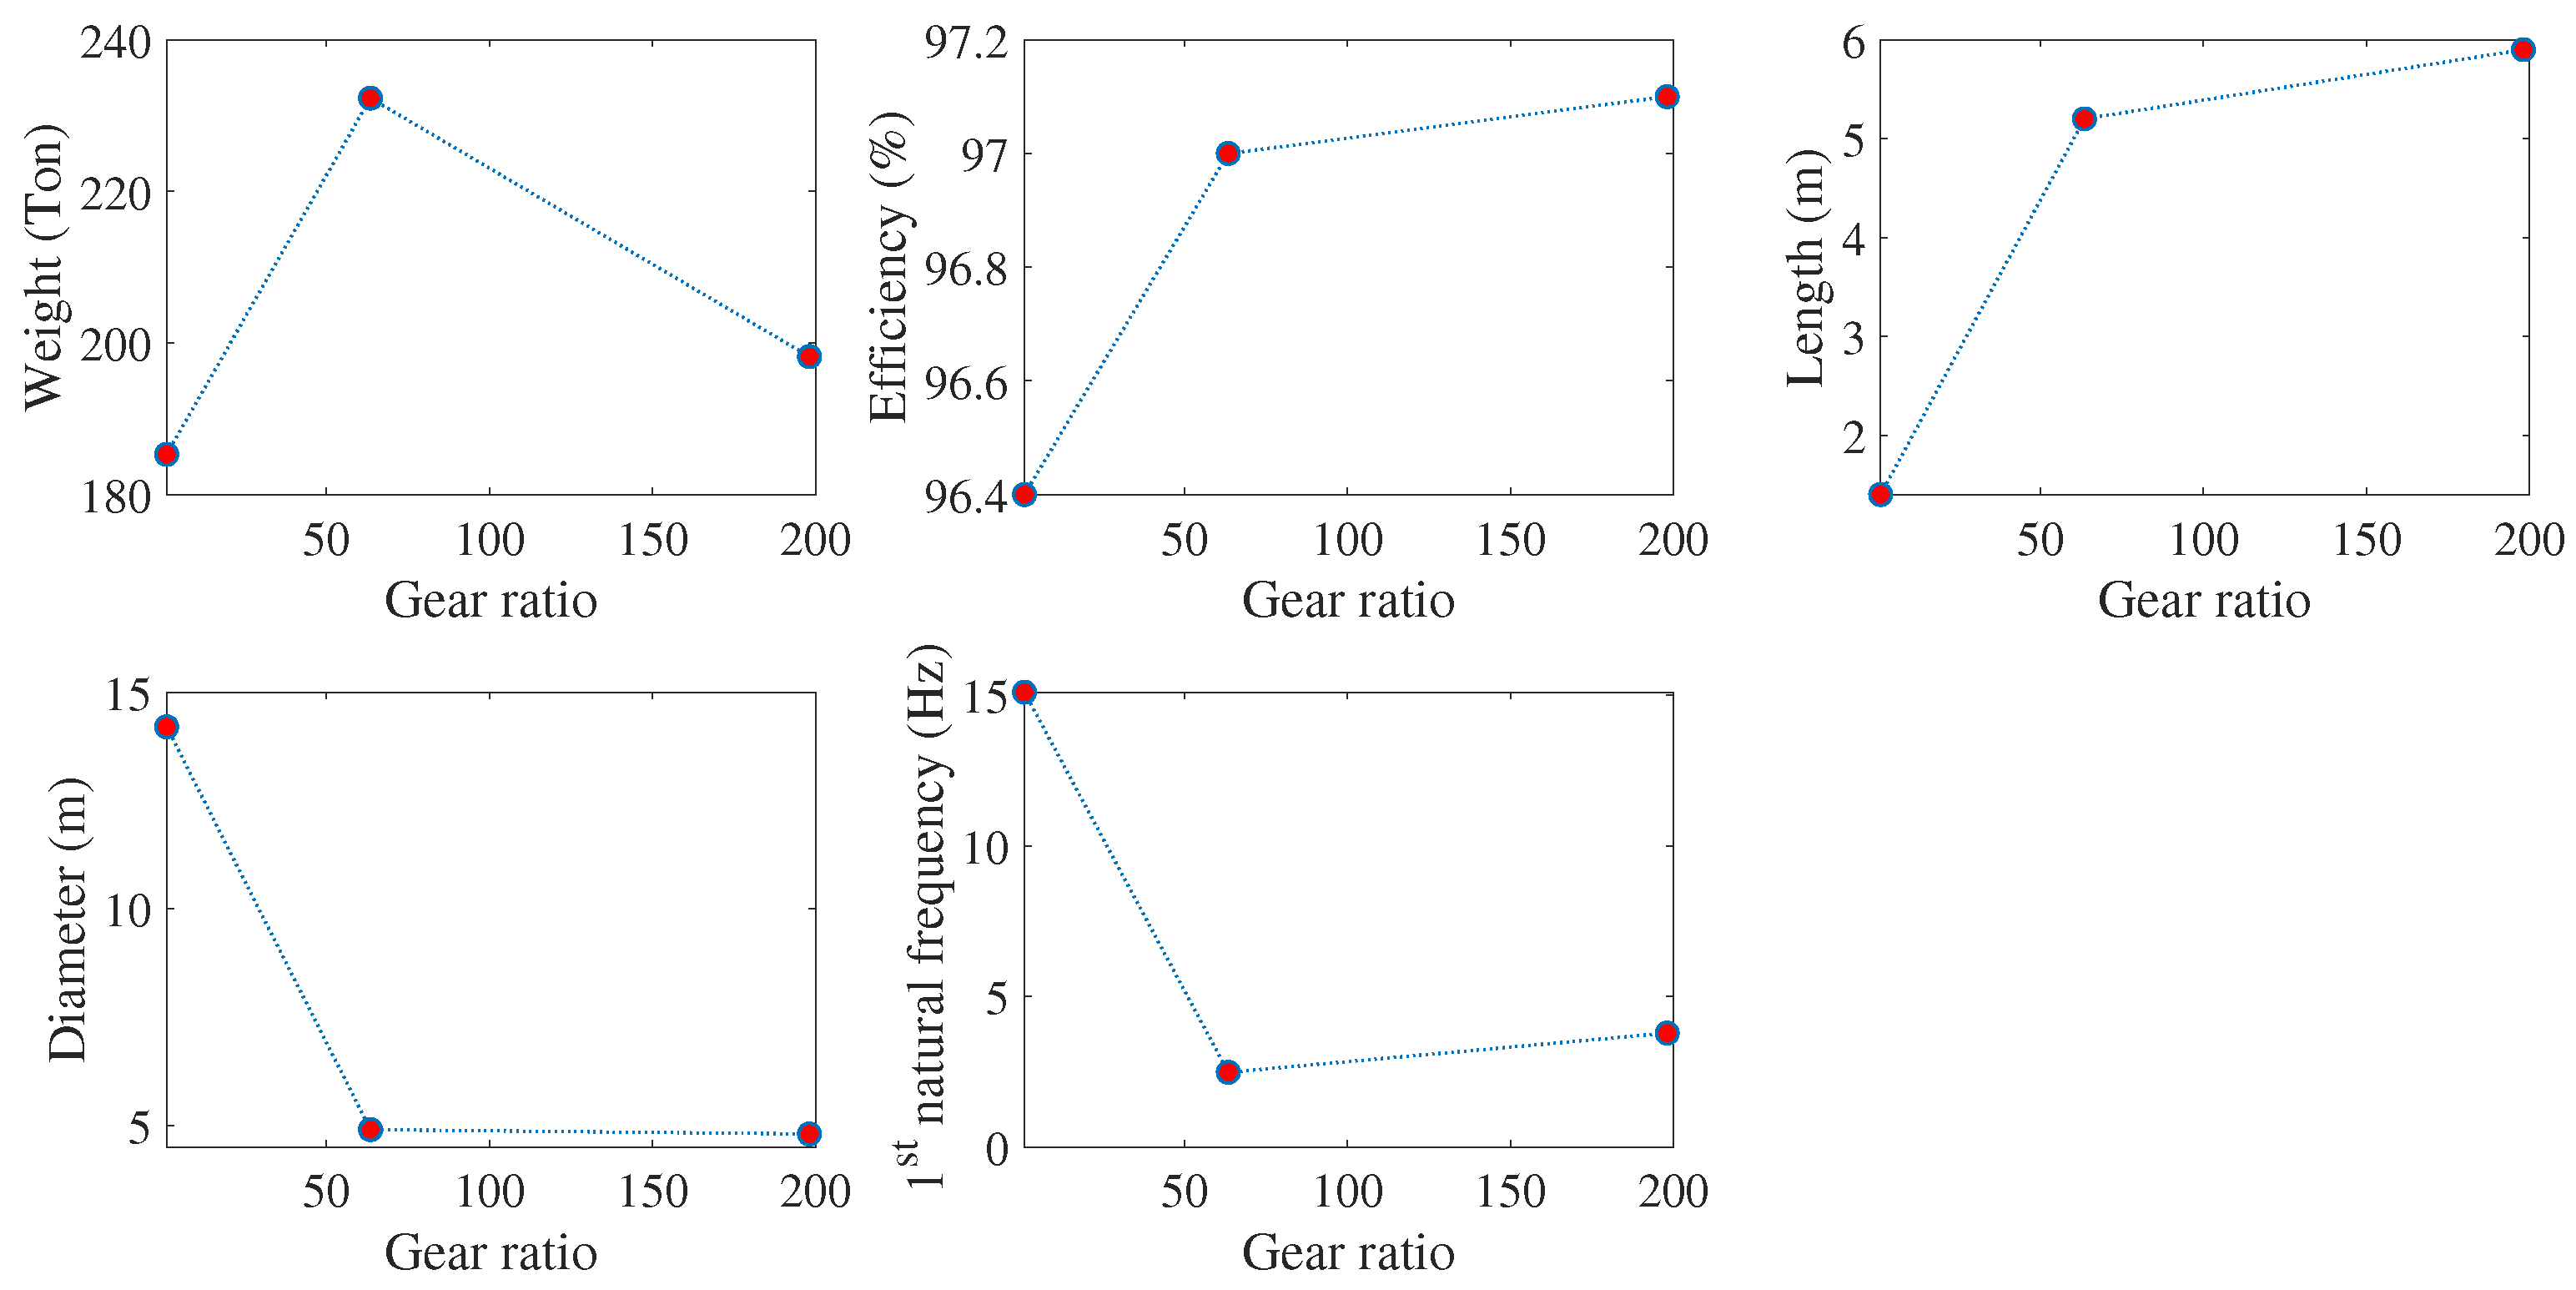
4. Concluding Remarks
The coupled generator–gearbox design of the most common drivetrain technologies for 15 MW offshore wind turbines was presented. These configurations were all based on PMSG with or without a gearbox to realize direct-drive, medium- and high-speed drivetrain technologies. The design procedure started from optimal analytical design at the component-level supported by design validation in secondary software, which also provided the more detailed specification of the designed components. This detailed specification provided the basis for the comparison study between the different configurations to see how the utilization of a gearbox with the different gear ratios influenced the overall weight, efficiency, length, diameter, natural frequencies and the torque oscillations of the drivetrain. This study showed that the utilization of the direct-drive configuration for 15 MW wind turbine application could:
help to reduce the overall weight and length of the drivetrain,
cause increase in the overall diameter and the generator electromagnetic torque oscillations and reduction of overall efficiency.
The drivetrain-turbine coupled dynamic analysis was performed, using the simplified models of the designed drivetrain systems, where the drivetrain–turbine coupled natural frequencies and the possibility of resonance with the external excitation frequencies were investigated. The dynamic analysis results showed that:
in all the three designed drivetrain technologies, the drivetrain natural frequencies took a distance from the external excitation and structural frequencies, though the direct-drive generator took a safer distance over the turbine power production range,
in the direct-drive, compared to the other two configurations, the oscillations of the torque applied to the input shaft of drivetrain reduced, which implied more robustness and potentially less fatigue damage of direct-drive when confronting with environmentally- and structurally-induced loads.
There was uncertainty in the inputs applied to this research, such as the unit prices of the materials used for the components costs calculations, which could influence the conclusions made in this paper. Exposing the coupled model, based on the designed drivetrain systems to all the load cases, and performing detailed reliability analysis, is considered to be future work.


