1. Introduction
Currently, 55% of the earth’s population lives in cities, and by 2050, this is projected to be 68%. In Europe, 74% of the population already lives in cities, and by 2050, this is projected to be 80% [
1]. The global population is aging. In 2022, there 10% of the population was over 65. In 2050, this is projected to be 16% [
2]. In the world population, there is an average of 20% who are disabled, including those with an official disability certificate. However, in the European Union, one in four people have a disability, and of people over 65, half of this population has some disability. The population is getting older, the number of disabled people is increasing yearly and many will have undiagnosed health problems. It is estimated that there may be up to 10% more people with disabilities in the population than that reported by official sources [
3]. Cities are therefore faced with the need to adapt infrastructure to the needs of all people with mobility, health and perception problems. There has been a movement away from barrier-free design toward universal design, i.e., design for all, including people with disabilities, people with young children, pregnant women, children, the elderly, the digitally excluded, people with heavy luggage and shopping trolleys. The aim is not to adapt already existing infrastructure to the needs of these people, but to re-design the city so that the infrastructure is accessible to all, as facilities should not be dedicated to a specific category of people. Initially, the concept of universal design applied to architectural design; over time, it has been used for various applications [
4]. Universal design is concerned with urban design, comfortable pavements and streets, convenient transport, accessibility of shopping centers, use of public and outdoor spaces, computer applications, urban navigation, etc. [
5].
The use of Internet of Things (IoT) technology can help to adapt a city to the needs of all residents. The term Internet of Things (IoT) was first used in 1999 by Kevin Ashton during a presentation at Procter & Gamble (P&G) in the context of radio frequency identification (RFID) technology. Ashton believed that things are fundamental to human functioning, so linking their functioning to the Internet opens a new chapter in development and could be as groundbreaking as the Internet. Things equipped with computing modules and the ability to communicate with the Internet and with each other allow for the collection of large amounts of data and their processing. IoT technology has found applications in many areas, including smart cities, industry, agriculture, transportation, environmental protection, smart homes and monitoring and controlling things. This will make it possible to track things, process data numerically, reduce waste, reduce operating costs, improve the quality of life and respond autonomously to unexpected situations [
6,
7,
8]. IoT sensors access a shared pool of resources such as servers, computers, storage, software and applications [
9,
10,
11]. Sensor data are processed in real-time using Cloud Computing or Edge Computing technology. Cloud Computing requires sensor data to be sent to central computing units, which involves the transmission of large amounts of data, often exceeding the capacity of the links to collect actual data about objects and people in the vicinity of the sensors. Edge Computing technology makes it possible to process data near sensors, sending not all but only aggregated data to the Cloud, thus reducing the amount of data sent over Internet links. Edge Computing applications allow for the compression and anonymization of data, making the technology appear more secure to users [
12,
13,
14]. Sensor-based data are used widely in the design process of urban spaces and landscape design. The usage is two-fold: First, they are used to observe real-time user behavior of urban spaces, aiming to discover and parametrize relations between the built environment and physical space usage to find general patterns to be applied in future designs, and second, they are used in specific cases related to particular design situations to understand the existing conditions of user movements and space usage and to relate proposed solutions to them. In both cases, we can speak about data-driven urban design, which reflects the pursuit of grounding design decisions in evidence-informed and analytical methods. The first situation, aiming to investigate general rules and the relation between space usage and built environment characteristics, involves two possible approaches: that based on geographic data/geometrical dimensions or, being more popular, that based on topological features—called space syntax [
15,
16,
17]. In both cases, revealed patterns can be used to model urban situations, allowing space usage simulations and thus predicting users’ behaviors using multiple regression analysis or an agent-based approach [
18,
19]. However, research results related to discovering such relations are still ambiguous, sometimes even contradictory [
20], which empowers such investigations. The second situation, associated with a specific design case and setting, employs the same methodology of gathering data, benefitting from the interactivity of digital tools, which allows the dynamic analysis of design decisions [
21].
IoT sensor usage is a critical factor in the effectiveness and accuracy of all evidence-based urban design methods. Acquired data are integrated into a more comprehensive, multicriteria evaluation approach involving GIS, 3D modeling and semantic segmentation, image analysis and deep learning [
22]. IoT sensors in contemporary urban and landscape design are closely related to universal design. The latter is defined by seven principles that designed environments should fulfil: fair use, flexibility of use, simple and intuitive use, perceptible information, tolerance for error, low physical effort and the size and space for approach and use [
23]. When these guidelines are met, designed spaces and buildings can be used equally by the maximum possible number of people, including those with special needs. Practical consideration of the needs of all users, including those with disabilities, requires the analyses described above, carried out at the design stage and based on data collected by IoT sensors. To design inclusively, it is also necessary to consider the opportunities that IoT infrastructure offers to apply solutions that facilitate the functioning of people with special needs. Different scenarios can be used here, including shopping, schools, wayfinding, the safe usage of public space in mixed-use environments, etc. [
24,
25,
26]. It is the direct use of IoT technologies to assist those who are less able to take advantage of spaces and services, even if they are designed according to universal design principles. However, it should be stressed that all these situations require user data collection and may be subject to the discussion of acceptance of such situations.
In smart cities, IoT technology has many applications in managing urban traffic and parking, managing lighting and energy consumption, managing waste, controlling air quality, controlling noise, controlling crime and providing smart services to the public. Data from IoT sensors are an essential part of city management for city authorities. At the same time, for residents, it improves their quality of life, especially regarding being able to help people with disabilities. RFID sensors deployed on thoroughfares allow blind people to move around cities safely, and gloves equipped with RFID sensors enable people who do not know sign language to communicate with the disabled. Deaf and hard-of-hearing people can use devices placed in their ears or induction loops [
7]. IoT-related infrastructure may also facilitate the introduction of new urban layouts, which include, for example, less rigorous space zoning. The traditional division between the sidewalk and roadways may no longer be needed as a result of collision detection and traffic flow analysis in street spaces. People with mobility disabilities can find a better way through cities as a result of IoT sensors. Traffic monitoring in a city can allow the city’s infrastructure to better adapt to the needs of all users, including not only people with disabilities but also the elderly, people with young children and people with shopping carts—all those who may have mobility difficulties. The use of IoT sensors in smart cities involves the collection of large amounts of data from users who are reluctant to accept it [
27].
Public attitudes can change the purpose and method of data collection [
28]. Negative public attitudes toward surveillance may result in residents’ data not being collected [
29,
30]. However, if data are collected anonymously using Edge Computing, this may change residents’ attitudes toward using IoT sensors [
31,
32]. This study aims to evaluate the factors that influence the acceptance of data collection in a city by IoT sensors operating in the Edge Computing mode. This type of data collection can be used for universal design, i.e., for all residents, including people with mobility problems and disabilities. The purpose of data collection can also influence residents’ attitudes toward the collection of data about them. Empathy for people with disabilities and mobility problems and concerns about data security may influence the acceptance of the use of IoT sensor data [
33]. For this purpose, a survey was conducted to collect information on the acceptance of IoT technology in cities. A structural model was proposed to evaluate the impact of selected factors on public acceptance. It should be noted that IoT technology is needed in smart cities to adapt urban spaces to the needs of all residents, the disabled, people with young children, the elderly or those with mobility problems. IoT sensors exchange data with residents’ devices, such as phones or wearables. The goal is to improve the convenience of using urban spaces [
34].
The studied problem was the acceptance of using Edge-Computing-based Internet of Things devices to collect data in smart cities for universal design purposes. Because city inhabitants fear surveillance, they do not accept technology that collects data about them [
35]. The information collected by IoT devices is vast, so this causes privacy concerns for residents [
36,
37]. There is a lack of research that evaluates the use of IoT devices anonymously and for worthy causes, such as helping people with disabilities and mobility problems. The theoretical framework for this study included the Technology Acceptance Model (TAM) [
38] as well as surveillance acceptance models and models that include the empathy variable [
27,
39,
40].
The research objective of this study was to assess the acceptance of using Edge Computing IoT devices in smart cities for universal design purposes. This study explored the attitudes of residents of big cities toward IoT devices used in smart cities due to the possibility of using data for universal design, i.e., to make life easier for residents with disabilities, mobility problems and people who cannot use the current urban infrastructure. This study addresses a gap in the literature regarding the impact of empathy for people with disabilities and their needs on the acceptance of IoT technologies from the point of view of the usability of such collected data. The impact of the privacy of data collected by urban sensors on the acceptance of IoT technology was also assessed. Respondents were informed that data were collected in the Edge Computing mode and therefore were anonymized. Personalized information was not sent to the Cloud. This study also aimed to assess the impact of trust in IoT sensors operating in the Edge Computing mode on their acceptance and the impact of trust in city authorities on the acceptance of IoT sensor use [
41].
The following research questions were posed in relation to the stated research objective:
Q1: To what extent, if any, does empathy for people with disabilities and their needs influence the acceptance of IoT devices in smart cities for universal design purposes?
Q2: To what extent, if any, do concerns about data security influence the acceptance of the use of IoT devices in smart cities for universal design purposes?
Q3: To what extent, if any, does confidence in IoT technology operating in the Edge Computing mode affect the acceptance of using IoT devices in smart cities for universal design purposes?
Q4: To what extent, if any, does trust in city authorities influence the acceptance of the use of IoT devices in smart cities for universal design purposes?
The findings indicate that there is a significant relationship between the perceived usefulness of smart city technologies used for universal design purposes and their acceptance. This relationship is influenced by trust in city authorities and concern about the security of data collected by city sensors.
This study is essential for city authorities to understand what and how certain factors influence the use of IoT in smart cities for universal design purposes. It can allow city authorities to understand the following:
It is crucial for city authorities to be aware of what factors influence the acceptance of IoT applied for universal design purposes, what concerns of residents are related to this and therefore what information policies to apply.
2. Literature Review
In the literature, no studies were found addressing the acceptance of IoT sensor data in smart cities for universal design purposes. No studies were found that posed research questions similar to those in this paper. Therefore, studies that addressed the acceptance of IoT technology in smart cities, the acceptance of surveillance, the use of IoT data for the disabled and the acceptance of IoT technologies operating in Edge Computing mode were used.
IoT sensors in smart cities are installed in urban spaces and in devices used by residents [
29,
42,
43]. The acceptance of the use of IoT sensor devices assessed by the Technology Acceptance Model (TAM) method depends on the users’ intended ease of use and anticipated usefulness. These variables affect the acceptance and anticipated willingness of using such devices. TAM is a general model of technology acceptance. It is mentioned because many authors evaluating IoT acceptance provide validated questions that correctly measure model constructs, such as the perceived usefulness of the technology. Often, the models are supplemented with various variables describing problems broader than those described by Davis [
38]. Venkatesh proposed the Unified Theory of Acceptance and Use of Technology model (UTAUT). The model is an extension of the TAM model with additional factors such as performance expectancy, effort expectancy, attitude toward using technology, social influence, facilitating conditions, self-efficacy, intention and anxiety [
44]. This model was later used and extended several times [
9,
45,
46,
47]. IoT technology is constantly evolving and applied to smart cities on a large scale. It is worth using the data collected by IoT sensors already installed in cities to better design them for the needs of the inhabitants. If possible, it is also worth installing new sensors to assess the habits of residents [
48]. Unfortunately, excessive surveillance is not supported by residents. City authorities want cities to function at their best and to have a good relationship with their inhabitants. Only clear communication with residents can enable authorities to achieve both goals. This study, identifying factors influencing the acceptance of IoT technology, can allow for a clear and precise message to be prepared for residents [
49].
When IoT technology is used in smart homes, residents use the devices themselves and must know how to operate them [
50,
51,
52]. These purchases need to involve the ability to manage the new devices. If their operation is too complicated and unintuitive, unfortunately, such devices are not accepted or bought, despite their anticipated usefulness [
53]. Such models cannot be used directly to evaluate IoT sensors in smart cities because residents do not use IoT-sensor-equipped devices directly. In cities, sensors observe residents and collect data about their behavior, mobility, infractions and preferences [
54]. In this situation, the acceptance of IoT-sensor-equipped devices should be considered from the point of view of accepting monitoring and surveillance [
55]. Koohang et al. proposed a five-factor model of IoT technology acceptance with IoT awareness, users’ knowledge of IoT privacy, users’ understanding of IoT security, trust in IoT and further intention to use IoT. According to the authors, IoT awareness positively impacts users’ knowledge of IoT privacy and security. Users’ understanding of IoT privacy and security positively affects users’ trust in IoT, and users’ trust in IoT positively affects further intention to use IoT. In addition, IoT privacy knowledge, security knowledge and trust are mediating variables in the IoT acceptance model. The model primarily concerns IoT technology in shopping and service centers, industrial facilities and smart homes. However, the model can be used to assess IoT acceptance in smart cities because it pays attention to external factors such as IoT knowledge, privacy, security and trust in the technology. In the model presented here, awareness of the technology affects a sense of security and privacy, both of which affect trust in IoT technology. In turn, this variable affects the intention to use. Privacy and a sense of security are mediators between technology awareness and acceptance [
56].
Barn and Barn provided an overview of surveillance acceptance models. Their model is based on general surveillance theories but implements computer science and surveillance knowledge applied to information systems. The most important variable influencing the acceptance of surveillance is privacy. The authors treated the two dimensions of privacy and surveillance as a zero-sum game—if there is more surveillance, there is less privacy and less acceptance of IT surveillance technologies. One strand of surveillance theory assesses the impact of being watched on reluctance to be protected. The security of citizens justifies increased mass surveillance. Unfortunately, private institutions, domestic and foreign, cooperate with state authorities to increase the surveillance of citizens. The mechanism of participatory surveillance is used in social media and computer games, where the boundary between the observer and the observed disappears. In addition, machine learning and artificial intelligence algorithms are used here, including in fitness trackers and health applications. Based on observations, to which users often unwittingly given their permission, it is possible to profile citizens and track them accurately. The authors noted that those subjected to surveillance are not happy about it. Resistance to surveillance was observed [
27].
Bennett and Gelsthorpe also used surveillance models to analyze the acceptance of Closed-Circuit Television Camera (CCTV) monitoring. The survey found that residents support the use of urban surveillance. A majority of residents favor it, averaging more than 70%. The elderly and the very young are more trusting of technology. This technology has the lowest support among those aged 30–40. The authors noted that city surveillance cameras are a surveillance tool restricting freedom. This is the view of one-third of the respondents. Men are more concerned about their loss of privacy (34%) than women are (23%). Fear of the failure of privacy is higher among young people (35%) than it is among older people. A sense of security in the city influences the acceptance of CCTV technology. If one feels safe, even at night (16%), one is more afraid of losing privacy (48%). For the loss of privacy, residents feel a reluctance to be watched, greater state control and a loss of civil liberty. Residents generally accept the installation of cameras in the city and the loss of privacy in exchange for security [
40].
Thompson et al. assessed the acceptance of government surveillance. They indicated that the essential factors in the model were privacy, trust in the government and the need for government surveillance. The influence of culture on the acceptance of surveillance was also studied. Online surveillance of residents was assessed. The surveyed residents tried to avoid surveillance, such as using TOR (The Onion Router) or VPNs (virtual private networks), but did not accept surveillance. Fear of losing privacy increased after surveillance incidents. The influence of national culture on the acceptance of surveillance was also considered. The study found that privacy, the need for government surveillance and trust in authorities affect public approval. Trust in authorities and the need for surveillance positively impact acceptance, whereas a negative correlation was observed for the privacy dimension with the acceptance variable. It was assessed that culture influences the acceptance of surveillance, indirectly affecting other variables in the model [
57].
Offermann-Van Heek et al. evaluated the acceptance of technologies that allow the surveillance of urban residents [
39]. They studied the impact of the location of cameras in a city on the level of security. They assessed residents’ acceptance of different camera locations and the effect of cameras on privacy and security. The acceptance of surveillance in different places was studied in the following situations: privately—in one’s own home; semi-privately—in small stores; semi-publicly—in large stores; and publicly—in a train station. The level of acceptance was also assessed for the use of cameras of different sizes, from small cameras hidden in various devices to large cameras with the ability to track the movement of monitored objects. According to the authors, the most crucial benefit of using surveillance technology is improved security and reduced crime. Respondents’ significant factors in terms of acceptance of camera surveillance are the loss of privacy and the improper storage and use of data. The most important of the factors is the loss of privacy. Here, attention was drawn to storing data on residents’ profiles, facial recognition and location determination. Acceptance was assessed regarding the location of surveillance cameras, crime reduction, the storage of collected data and types of cameras [
58]. Respondents disapprove of the use of cameras in homes [
59]. As the location becomes more public, the acceptance of monitoring becomes greater [
55]. Respondents say cameras in homes and small stores do not improve security. According to respondents, monitoring used in public places such as large stores and train stations enhances security. In data handling, respondents support the archiving of data by the police and, to a small extent, determining the location of residents. There is disagreement with facial recognition and the profiling of respondents. Respondents support the use of huge, visible cameras, whereas there is disagreement with the use of mini and micro cameras that are not visible to residents. Respondents consider determining the location of residents to be the most crucial dimension, whereas the type of camera appears to be the least important in assessing the acceptance of surveillance. The authors only evaluated the importance of each dimension in the evaluation of surveillance; no analysis of the mutual influence of each dimension on the other was conducted. No structural model was presented [
39].
Empathy is the ability to recognize and empathize with the mental states of others. The ability to put oneself in another person’s position and adopt the other’s way of thinking is important in terms of accepting the needs of others [
60]. People are characterized by varying levels of empathy. Emotional empathy involves feeling the emotions of others. Cognitive empathy is the ability to adopt another person’s way of thinking and observe reality from that person’s perspective. A person demonstrating cognitive empathy is able to adapt to the assumptions of another’s value system. Regarding accepting the adaptation of smart city infrastructure for people with disabilities, cognitive empathy is important [
61]. Empathy can change attitudes toward reality. Positive attitudes toward disadvantaged groups can change attitudes toward their needs [
62]. The literature lacks information on how empathy toward people with disabilities can influence residents’ attitudes toward urban design. Biloria highlighted this in research on smart and empathetic cities, but no structural model was presented to assess the impact of empathy on the acceptance of technologies used in smart cities [
63].
Yoon and Lee studied the effect of empathy on using artificial intelligence (AI) services. The authors used the TAM model, to which they added empathy as a variable directly influencing the behavioral intention to use AI. The study compared attitudes toward a human expert and an AI expert providing recommendation services. The authors demonstrated an effect of empathy for AI technology comparable to empathy for a human expert on the intention to use AI technology [
64].
Coulton argued that empathy should be a concern when designing IoT devices in the context of online shopping. The author emphasized the importance of the designer’s empathy toward the users of IoT devices and the users’ empathy among themselves, which the designer should also take into account [
65].
Phaosathianphan et al., in an extended TAM model on the acceptance of a smart travel assistant, proved empathy’s influence on the perceived usefulness of the technology. Consumers compared the intelligent assistant to a human giving travel advice. The authors presented a structural model and validated survey questions measuring empathy and perceived usefulness [
66].
In his research, Oliveira Neto showed that more than half of the surveyed residents of the city of Sao Paulo feel empathy toward people with disabilities and believe that the city should be adapted to their needs. The author claimed that city authorities should take this into account. The author did not present a structural model and did not prove the relationship between empathy and the acceptance of the use of IoT technologies in smart cities [
25]. The model presented in this article combines different models’ functionalities. The perceived usefulness dimension (PU) is taken from the TAM model, and trust in city authorities (TG), trust in IoT devices (TT) and perceived data security (DS) were taken from other studies regarding IoT security and empathy. No similar model assessing the acceptance of the use of Edge Computing data from IoT devices for universal design was found in the literature, so a hybrid model based on the TAM model, surveillance acceptance models, empathy models and the IoT acceptance model for disability needs was created [
39].
3. Materials and Methods
Assessing technology acceptance uses structural modeling, where variables observed through a survey questionnaire allow the description of unobservable variables and the relationships between them. The main factors influencing the acceptance of IoT services include quality of service, trust, the perceived usefulness of the technology and ease of use. Respondents are concerned about using IoT technology in and around their devices. Edge Computing technology allows signals to be processed anonymously near IoT devices without transmitting them further [
67]. This greatly expands the possibilities of using IoT technology operating in the Edge Computing mode, but this requires understanding the residents and their acceptance [
68].
In this study, the following quantitative statistical methods were used: descriptive statistics, exploratory factor analysis (EFA), reliability analysis, confirmatory factor analysis (CFA) and structural equation modeling (SEM). Based on the literature analysis presented above, a proposed model of the relationship between variables is presented, as shown in
Figure 1, and the associated research hypotheses are stated. The model’s variables are latent variables that need to be described by observable variables measured by questionnaire questions. The detailed questionnaire questions are presented in this paper so that this study can be repeated.
The Warsaw University of Technology prepared an online questionnaire to collect the results. The link to the survey was made public on the Warsaw University of Technology website. The Senate Ethics Committee of Warsaw University of Technology approved the content of the survey. The survey was presented to Warsaw University of Technology staff and students because the university was installing IoT sensors to observe passers-by. This made it possible to determine the opinions of the academic community. The Warsaw Universtity of Technology’s campuses are located in Warsaw and Plock. Respondents from Warsaw and Plock participated in the survey. The questions in the survey were general and anonymous and concerned smart cities. The questions could be answered by Warsaw University of Technology staff, students and people from both cities. The questionnaire was anonymous, and it was impossible to assess who answered it. The survey results were generalized to people living in big cities. The survey, although not representative, allowed a lot of data to be collected to assess the links in the model.
Data were collected from January 2022 to June 2022. In the survey, a convenience sampling method was used. The questionnaire was filled out by people who learned about the survey and who accessed to the questionnaire. A total of 1642 people participated in the survey, but many responses were incomplete. Only 288 complete data records were collected and used for the analysis. Due to the requirements of structural equation modeling method, it is impossible to use incomplete data, so incomplete records were discarded. The survey was not representative. However, it was decided to prepare a structural model on this basis, as it could provide valuable information for city authorities [
9,
69]. In the literature, similar studies have also not been conducted on a non-representative sample of respondents. Darmavan et al., in their search for factors influencing IoT acceptance in smart cities, conducted a study on a non-representative sample of 201 respondents [
70]. Respondents from the local government in the Government Sector and from the community of the Sampang and Pamekasan Regencies in Indonesia were surveyed. Although only 201 respondents participated in the survey, a structural model of IoT acceptance based on the TAM model was prepared, and factors influencing regional readiness for IoT in smart cities were identified. A total of 10 out of 15 research hypotheses were confirmed, and factors influencing the readiness of the public and officials to implement IoT technologies in smart cities were identified. Through the model, it was possible to prepare communities and local authorities to accept and adopt new technologies [
70].
Ning et al. studied the acceptance of shared parking in China, in which the survey was also non-representative. As in the present study, an online questionnaire was used using a convenience sampling approach [
71]. The survey included adults who were interested in the topic of the study. There were 550 respondents to the survey, but 321 complete records were used for further research due to incomplete responses. A structural model of acceptance of shared car parks was prepared based on questionnaire results, and the factors influencing this acceptance were identified. In China, the use of shared car parks raised many concerns. Residents were afraid to use shared car parks. With the model, even though it was conducted on a non-representative sample, it was possible to diagnose the reasons for residents’ reluctance and to improve the functioning of car parks. The model was used to improve parking management and to assess the acceptance of bike and car sharing [
71].
Habib also conducted a non-representative survey to search for factors influencing IoT acceptance in smart cities [
9]. The survey was conducted via the Internet. The link to the survey was sent through several different channels, such as email, information on websites and social media. Additionally, students participated in the survey and received a voucher for coffee by completing the questionnaire. A total of 1782 records were collected, and after removing incomplete ones, 1444 complete records were used for further research. The authors prepared a structural model, an extended TAM and a UTAUT model, based on which they identified factors influencing the acceptance of new technologies in smart cities. Although the sample was not representative and the authors emphasized the modest contribution of academic research, they nevertheless acknowledged that the model worked well in predicting the behavior of city inhabitants. City authorities were able to select technologies that residents trusted, to create appropriate information policies and to prepare appropriate intervention measures [
9].
Hizam et al., in studying the acceptance of facial recognition, also used an online survey of people who had heard about the survey [
72]. Ninety percent were university-educated, and more than half were young people. Convenience sampling was used. There were 475 respondents, but 200 records were used for the study. The authors prepared a structural model for facial recognition acceptance. Additionally, a model using artificial neural networks was prepared. Although the survey was not representative, it represented a novel contribution to the literature and was of great benefit to city authorities, who could understand residents’ concerns when implementing smart technologies [
72].
In this study, respondents were informed before the survey began that the survey was anonymous and voluntary and that they could stop at any time. In the general description of the survey, respondents were informed that the questions were about the use of Edge Computing IoT sensors and that the data collected by the sensors would be used to redesign the city for all residents, especially the disabled, according to their requirements and needs, following the principles of universal design. The data collected by IoT sensors would be used to improve the quality of life of people with disabilities.
After conducting the survey, descriptive statistics were determined, followed by exploratory factor analysis (EFA). On this basis, variables correctly describing latent variables were selected. The validity of the EFA was checked by determining Cronbach’s-alpha coefficients (based on reliability analysis), the Kaiser–Meyer–Olkin Measure of Sampling Adequacy (KMO) and Bartlett’s Test of Sphericity. It was checked whether the values fell within acceptable ranges and whether they were statistically significant. The results of the tests and their acceptable values are presented in the Results Section. Based on the EFA analysis, a CFA model was prepared and used to impute latent variables, it was normalized and it was used to build the structural model. The quality of the model was assessed by analyzing coefficients of the model’s quality, such as Chi-Squared (C_min), the Chi-Squared to degree of freedom (DF) ratio and P-Close probability, as well as measures of the model’s goodness of fit, such as the Root-Mean-Square Error of Approximation (RMSEA), Confirmatory Fit Index (CFI), Standardized Root-Mean-Square Residual (SRMR) and Critical Ratio (CR). The relevance of the values was also assessed based on the probability of obtaining a real-valued test statistic (
p-value). Based on the literature, acceptable parameter values are presented in the Results Section [
73,
74].
The structural model analyzed the direct effect of variables on the acceptance of IoT use, the indirect (moderating) effect of variables on the acceptance of IoT use and the moderating effect of latent variables on the relationships presented in the model. The influence of moderators was examined by entering the product of the moderator and test variables into the model.
For all model relationships, the influence of variables on the acceptance of IoT sensors was assessed based on the value of the model regression coefficients and their p-values. Significant relationships are characterised by a p-value smaller than 0.05. For the moderating variables, the effect of the moderator on the model relationships was determined based on the values of the model regression coefficients. The relationship should be statistically significant (p-value < 0.05). The results of the research include an evaluation of the regression coefficients of all model paths and the verification of the research hypotheses. An analysis of the results is presented in the Discussion Section.
The following dimensions were selected for the analysis:
PU: Perceived usefulness of IoT sensors operating in the Edge Computing mode;
TG: Trust in city authorities;
AC: Acceptance of IoT sensors used for universal design purposes operating in the Edge Computing mode;
TT: Confidence in IoT Edge-Computing-based technology;
ETD: Empathy toward the disabled and people who have mobility problems;
DS: Perceived data security.
The dimension of the perceived usefulness of IoT sensors (PU) is the extent to which respondents believe that IoT devices can help in making the city better suited for people with disabilities and in making the city function better [
38,
75,
76,
77].
The PU dimension is a factor in the Technology Acceptance Model (TAM) [
33,
78,
79,
80].
To design a city for all inhabitants, it is necessary to collect information on the movements of inhabitants and their habits. Residents do not use technology directly but are only observed by city sensors. In this case, models regarding the acceptance of surveillance technology were used [
39,
56].
To measure PU, the following variables were used:
PU1: City surveillance images can be helpful in better designing the city for the needs of people with young children.
PU2: Using data from city cameras will allow the city to be better designed to meet the needs of people in wheelchairs.
PU3: Data from city cameras could be helpful to better design streets for the blind.
PU4: Data from the city’s sensors will make it possible to offer many new services to residents.
PU5: Observing the movement of residents using urban surveillance will help introduce more greenery into the city in places convenient for them.
The use and acceptance of this technology is also determined by trust in the institutions operating it and holding the data collected by the devices. Many studies indicate that residents are concerned about collecting and storing personal data. The opinions of city authorities and data processing companies can influence the acceptance of Edge Computing IoT sensors [
9,
81,
82].
Trust toward authorities (TG) was measured by the following variables:
TG1: I trust in the city government to use Edge Computing data from city sensors and cameras to improve the city’s infrastructure.
TG2: I believe that the city’s highest priority is to safeguard the interests of its residents.
TG3: I believe that city procedures safeguard the data of those observed by city surveillance.
TG4: I generally have confidence in the city’s authorities.
The variable AC, directly measuring attitudes toward IoT sensors, was also introduced into the model. The variable was introduced intentionally to test the relationships with the other following variables in the model: trust in the city government, trust in IoT technology and perceived usefulness of the technology. Respondents were asked about their acceptance of IoT devices in the context of using data to help the needy and disabled [
9,
23,
54,
83].
The acceptance of IoT sensors working in the Edge Computing mode (AC) was measured by the following variables:
AC1: I support the use of facial recognition in city surveillance cameras to search for missing persons.
AC2: I support the collection of data on parking space occupancy to show drivers where to park.
AC3: I support the collection of data on people’s movements in the city in order to adapt the infrastructure to their needs.
AC4: I support observing people through cameras operating in the Edge Computing mode (anonymously) to offer them dedicated products and services.
Trust in this technology is also a key factor when assessing public acceptance [
11].
The public is aware that IoT sensor software is not updated frequently, so it is a potential channel for hacking attacks. It is important that, when data analysis occurs in the sensors, the data are not transmitted anywhere and, above all, are processed anonymously, which affects attitudes toward IoT sensors [
9,
34,
81,
84].
The following variables measured trust toward IoT Edge-Computing-based technology (TT):
TT1: I have trust in the technology of IoT urban sensors collecting air pollution data.
TT2: I have trust in the system of city cameras operating in the Edge Computing mode (the data are anonymous) and collecting data necessary to adapt the city to the needs of people with disabilities.
TT3: I have trust in the system of city sensors operating in the Edge Computing mode (anonymously), collecting data on the occupancy of parking spaces.
TT4: I have trust in the system of urban sensors (cameras, microphones) operating in the Edge Computing mode (anonymously) that collect data that are necessary to offer products and services suited to the needs of residents.
TT5: I have trust in urban sensors operating in the Edge Computing mode (anonymously), helping residents and tourists navigate the city.
Data security and privacy issues for people in cities are a factor that influences the acceptance of IoT devices used in smart cities [
85].
IoT devices interact with residents and with each other. People are concerned that, when using the latest technology, hackers can take over their data [
86].
Residents fear that they may be surveilled by IoT cameras and sensors installed in the city and that their privacy is invaded. The ability to remotely access IoT devices increases the risk of attack exposure [
87,
88].
The following variables measured perceived data security, DS:
DS1: Unauthorized persons cannot have access to data collected by city sensors.
DS2: Data collected by the city’s Edge Computing sensors are anonymous.
DS3: Data collected by city sensors operating in the Edge Computing mode are not transmitted anywhere.
Empathy for people with disabilities is also an important factor that can influence the acceptance of IoT technologies [
35], which are intended to adapt cities to the needs of all residents. It is worth examining the level of empathy and its impact on the acceptance of IoT technology. Empathy is an understanding of the needs of people with disabilities and people with mobility problems and an understanding of the need to adapt the city to meet their needs [
33,
89].
The following variables measured empathy:
ETD1: Pavements and streets should be adapted to the needs of people with mobility impairments.
ETD2: Urban spaces should be stroller-friendly.
ETD3: Cities should be adapted to the needs of blind people.
ETD4: Cities should be friendly to people with young children.
ETD5: In general, people with disabilities deserve special care and treatment.
A five-point Likert scale was used to evaluate each statement, as follows: 1—strongly disagree, 2—disagree somewhat, 3—neither agree nor disagree, 4—agree somewhat and 5—strongly agree. The demographic results of the survey sample are shown in
Table 1.
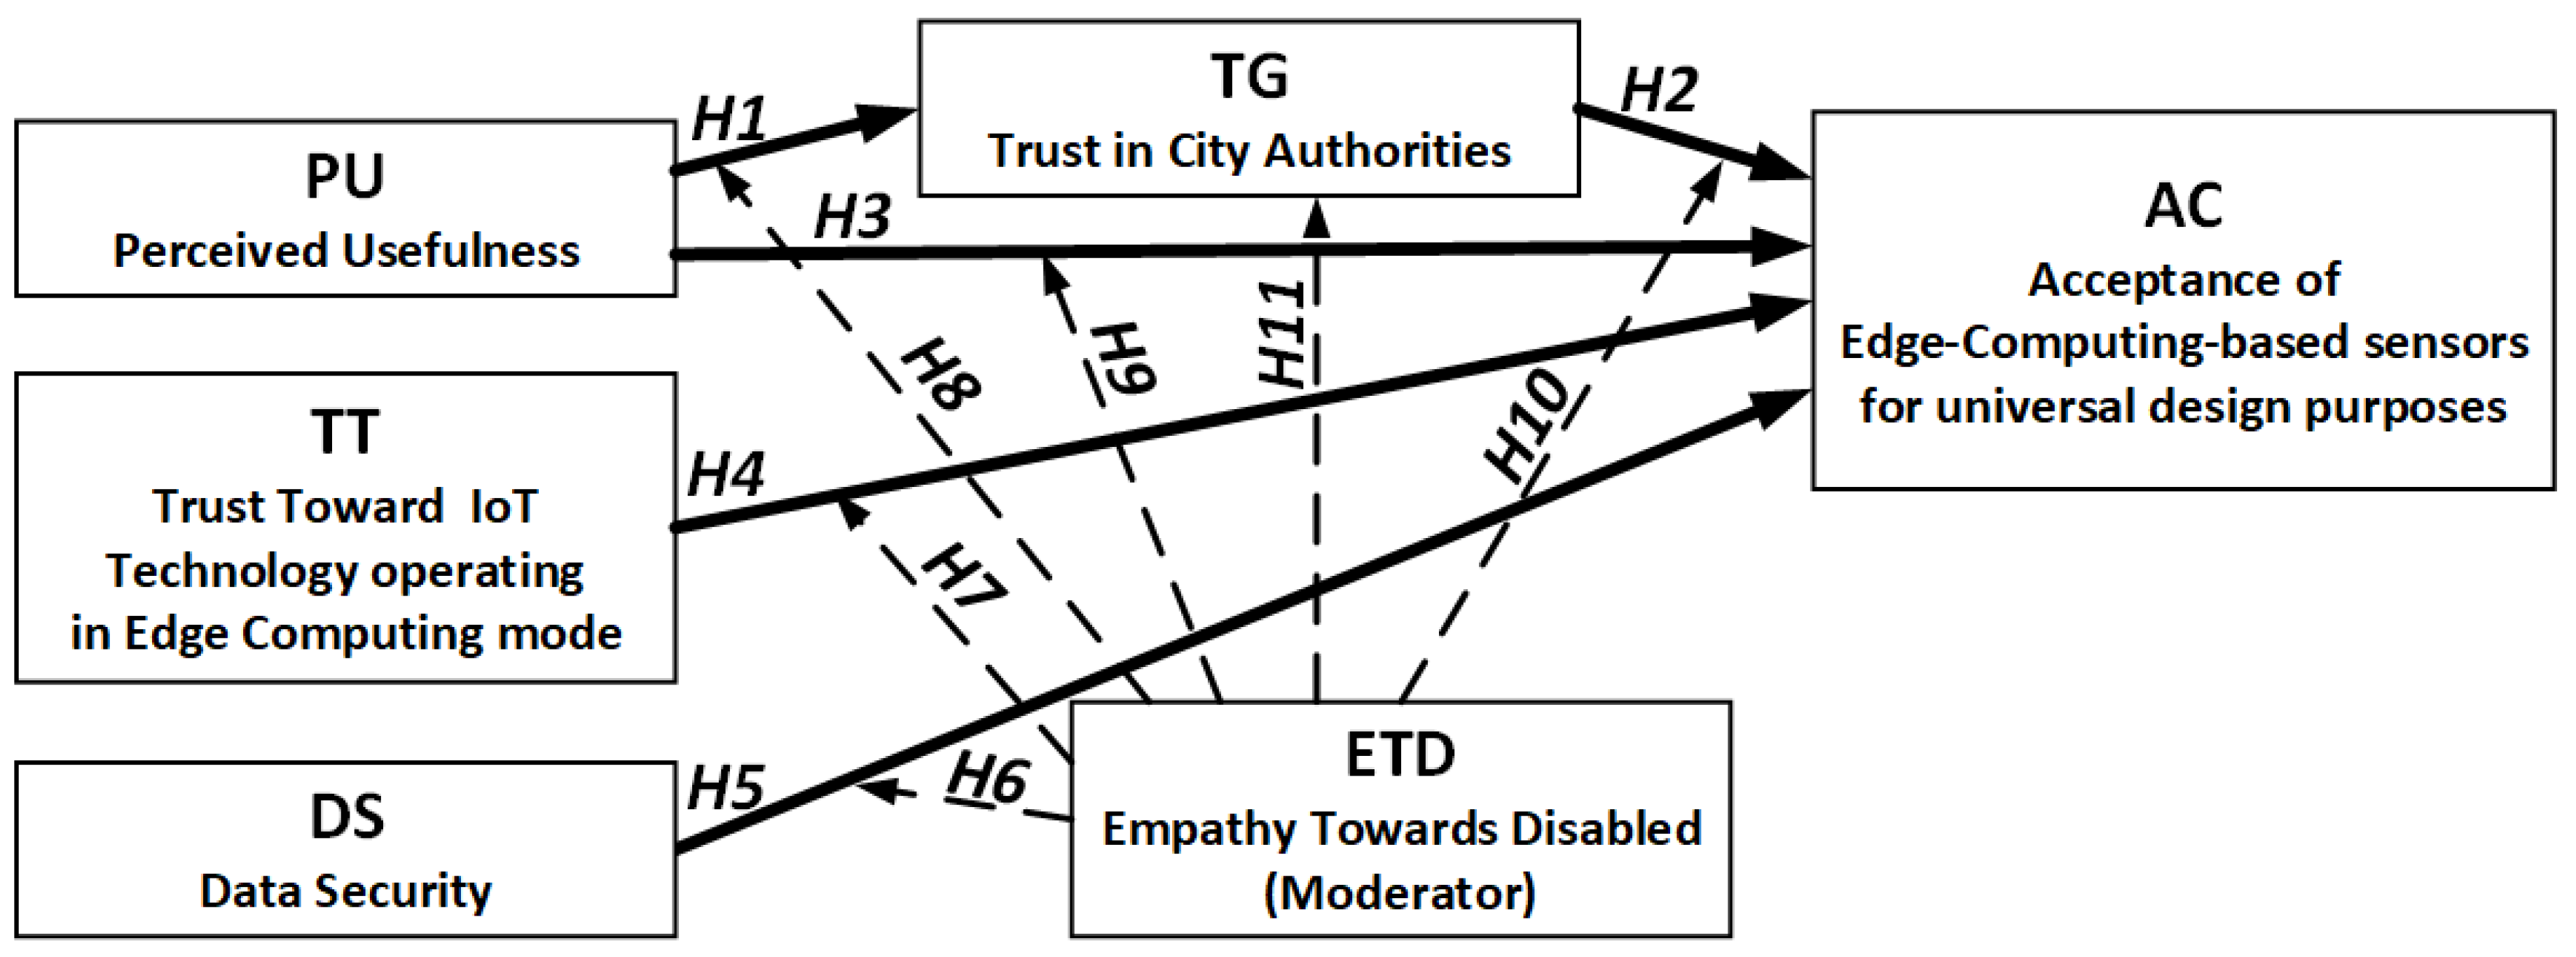
Based on the literature and after analyzing many structural models, the following research hypotheses were proposed according to the model presented in
Figure 1:
H1: The perceived usefulness of IoT sensors (PU) positively influences trust in city authorities (TG).
H2: Trust in city authorities (TG) positively influences the acceptance of IoT sensors (AC).
H3: The perceived usefulness of IoT sensors (PU) positively influences the acceptance of IoT sensors (AC).
H4: Trust toward IoT technology operating in the Edge Computing mode (TT) positively influences the acceptance of IoT sensors (AC).
H5: Perceived data security (DS) negatively influences the acceptance of IoT sensors (AC).
H6: Empathy toward the disabled (ETD) positively moderates the relationship between perceived data security (DS) and the acceptance of IoT sensors (AC).
H7: Empathy toward the disabled (ETD) positively moderates the relationship between trust toward IoT technology operating in the Edge Computing mode (TT) and the acceptance of IoT sensors (AC).
H8: Empathy toward the disabled (ETD) positively moderates the relationship between perceived usefulness (PU) and trust in city authorities (TG).
H9: Empathy toward the disabled (ETD) positively moderates the relationship between perceived usefulness (PU) and the acceptance of IoT sensors (AC).
H10: Empathy toward the disabled (ETD) positively moderates the relationship between trust in city authorities (TG) and the acceptance of IoT sensors (AC).
H11: Trust in city authorities (TG) positively mediates the relationship between perceived usefulness (PU) and the acceptance of IoT sensors (AC).
After data collection, basic descriptive statistics were calculated, and the variables PU, TG, AC, TT, ETD and DS were checked for the quality of their representation of the survey questions, i.e., the model’s variables. A factor analysis was performed for each dimension to check the coefficient value of the Kaiser–Meyer–Olkin Measure of Sampling Adequacy (KMO) and Bartlett’s Test of Sphericity. In addition, the validity of Cronbach’s alpha coefficient was checked for each dimension [
73,
74]. The different dimensions are represented by the model’s imputed variables, which were used in the structural model shown in
Figure 1.
4. Results
Analyses were performed using the SPSS v.7 statistical package, IBM AMOS v.27, Statistica v.13.3 and Microsoft Excel 365. Descriptive statistics of all variables are presented in
Table 2. The distributions of respondents’ answers are presented in
Figure 2 and
Figure 3. Mean values of the perceived usefulness (PU) dimension ranged from 3.75 to 3.88, and the dimension was consistent. Based on reliability analysis and factor analysis, it was assessed that statements PU1 to PU5 describing the PU dimension measure it correctly.
Kaiser–Meyer–Olkin Measure of Sampling Adequacy:
Bartlett’s Test of Sphericity:
. The predicted utility measures of all variables were determined by imputing the responses from each dimension variable after conducting Confirmatory Factor Analysis [
81]. Mean values of the TG dimension ranged from 2.83 to 3.20, and the dimension was consistent. Based on reliability analysis and factor analysis, it was assessed that statements TG1 to TG4 correctly measure the TG dimension.
Kaiser–Meyer–Olkin Measure of Sampling Adequacy:
Bartlett’s Test of Sphericity:
. Mean values of the AC dimension ranged from 2.25 to 4.51. The model explained 48% of AC variance. The measures of the correctness of the representation of the AC dimension were correct, so it was assumed that the variables correctly represent the AC dimension.
Kaiser–Meyer–Olkin Measure of Sampling Adequacy:
Bartlett’s Test of Sphericity:
. Mean values of the TT dimension ranged from 2.65 to 3.81, and the dimension was consistent. Based on reliability analysis and factor analysis, it was assessed that statements TT1 to TT5 describing the TT dimension measure it correctly.
Kaiser–Meyer–Olkin Measure of Sampling Adequacy:
Bartlett’s Test of Sphericity:
. Mean values of the ETD dimension ranged from 4.5 to 4.86, and the dimension was consistent. Based on reliability analysis and factor analysis, it was assessed that statements ETD1 to ETD5 describing the ETD dimension measure it correctly.
Kaiser–Meyer–Olkin Measure of Sampling Adequacy:
Bartlett’s Test of Sphericity:
. Mean values of the DS dimension ranged from 3.32 to 3.6, and the dimension was consistent. Based on reliability analysis and factor analysis, it was assessed that statements DS1 to DS3 describing the DS dimension measure it correctly.
Kaiser–Meyer–Olkin Measure of Sampling Adequacy:
Bartlett’s Test of Sphericity:
[
73,
74].
The whole model presented in
Figure 1 is also consistent. Measure of Sampling Adequacy:
Bartlett’s Test of Sphericity:
The model explains 76.44% of data variance. Factor extraction results are presented in
Table 3.
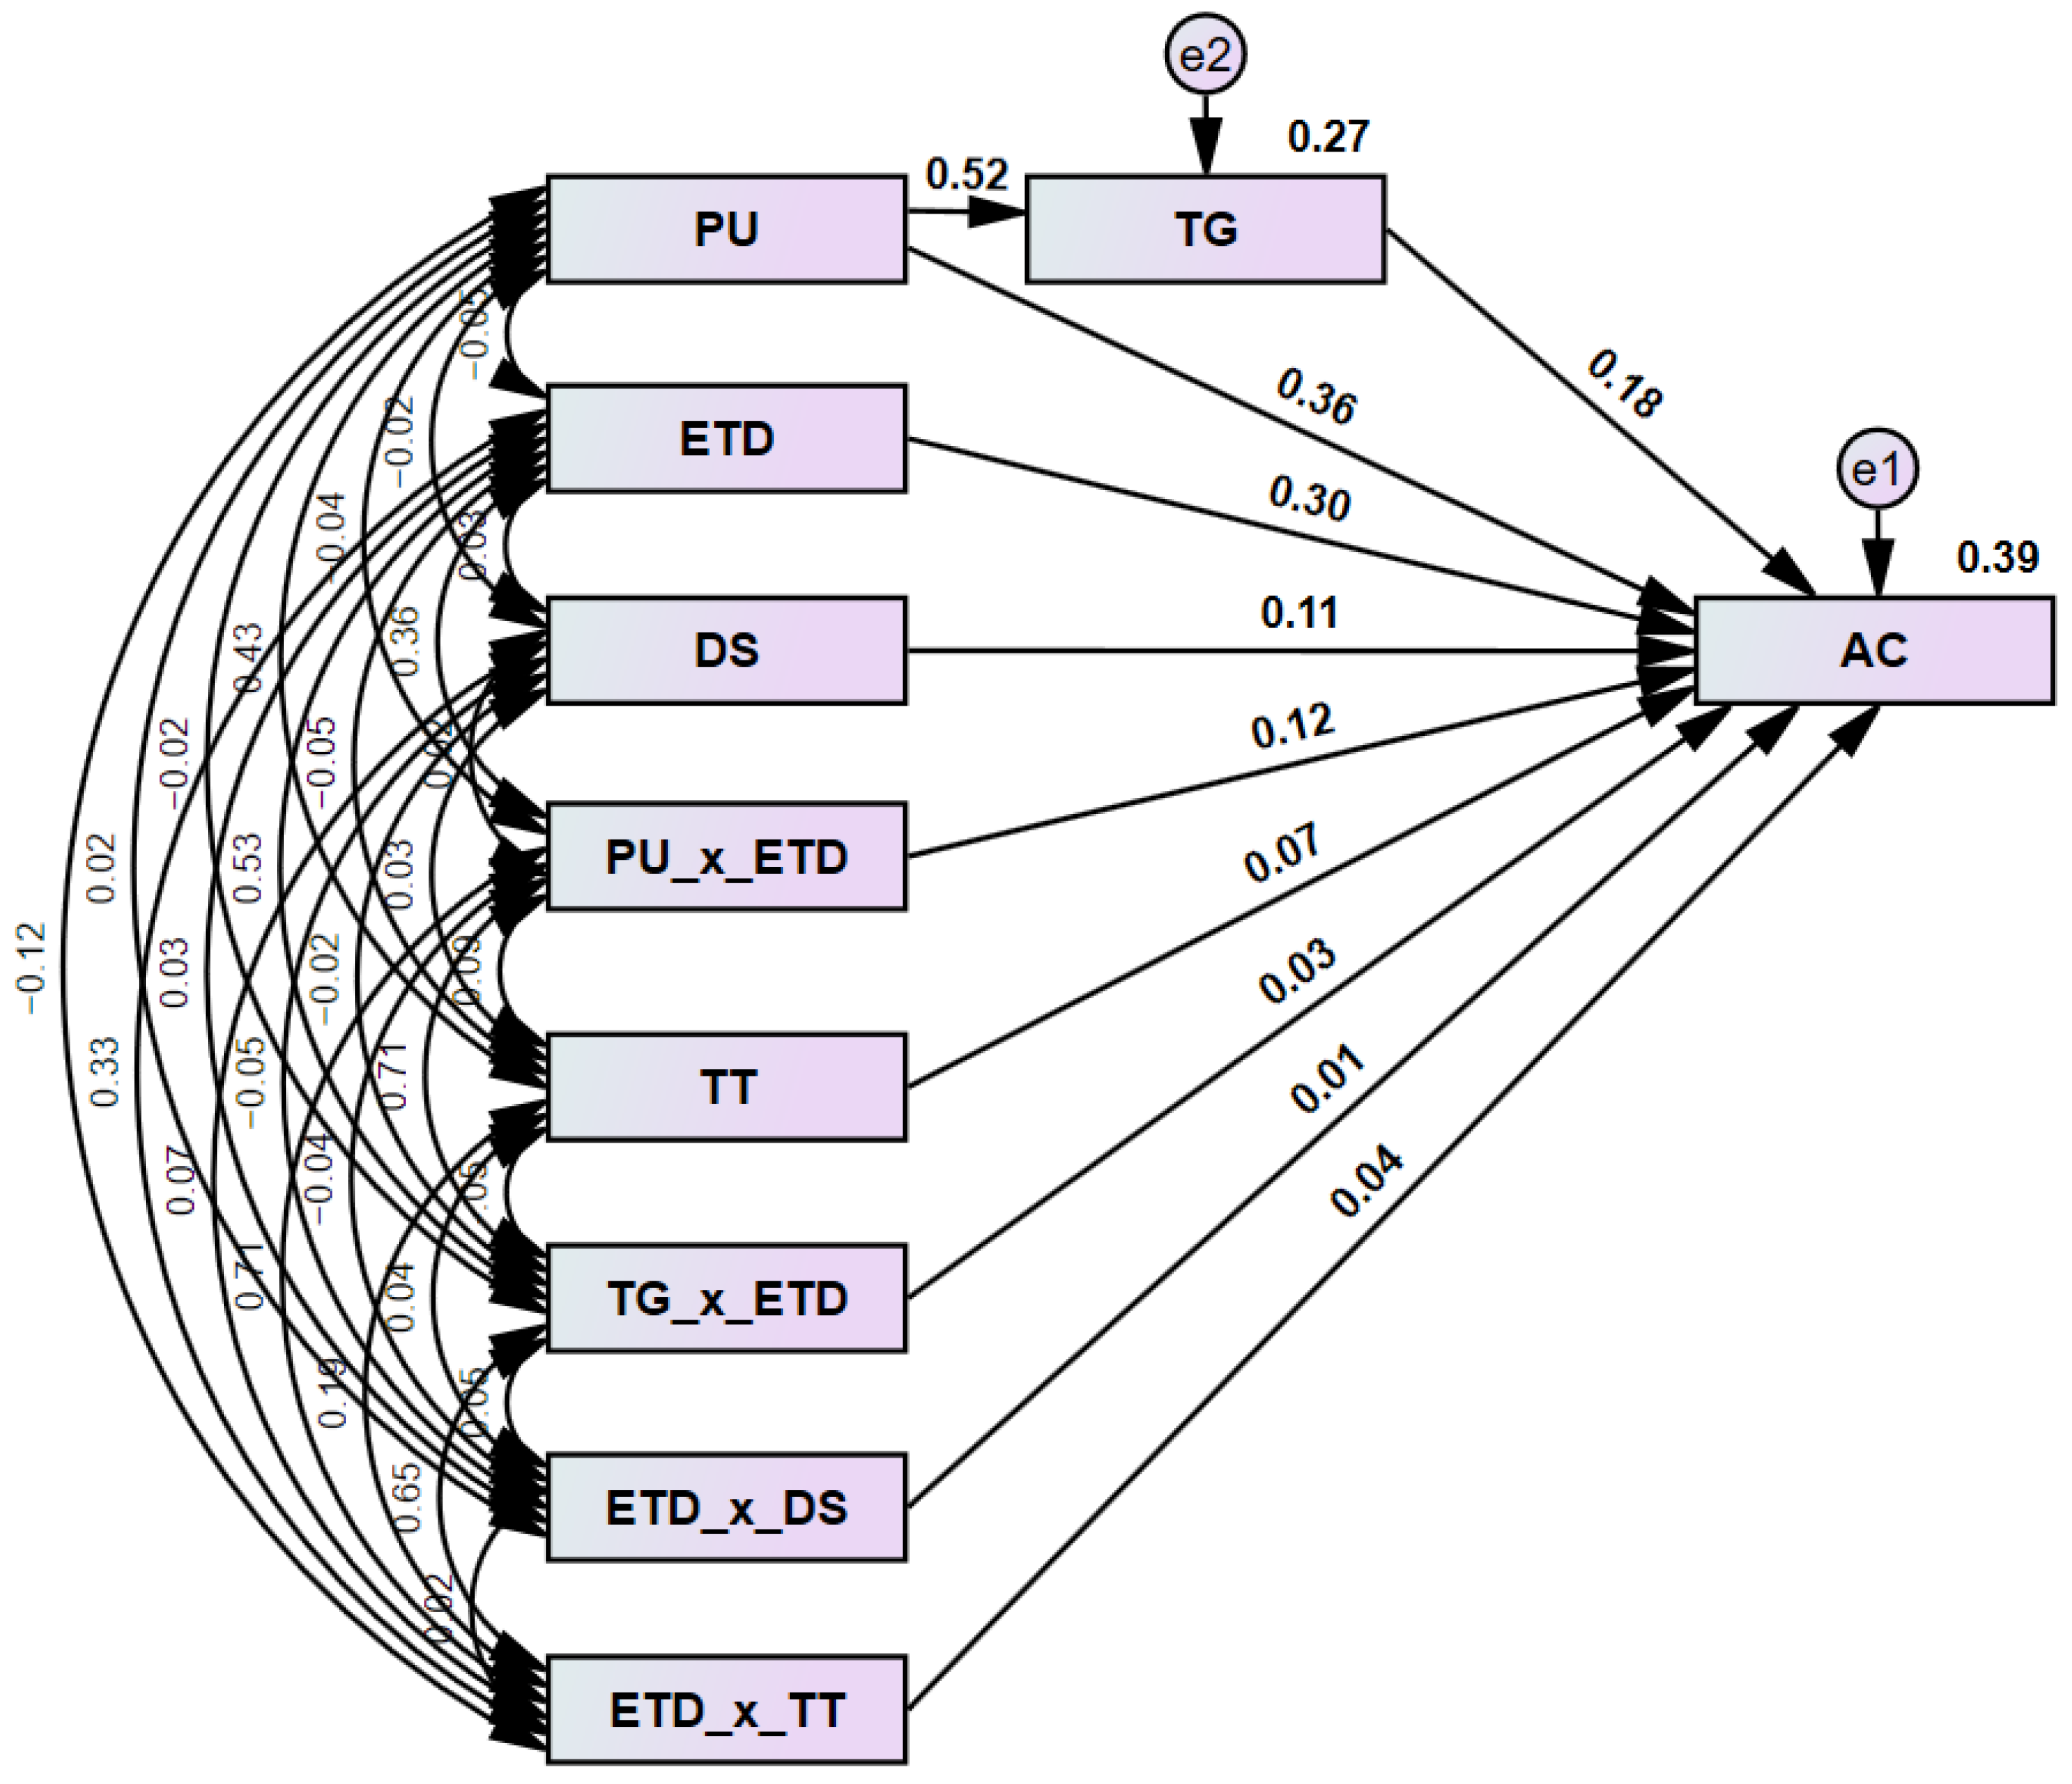
Figure 4 shows the structural model with the determined standard path loadings. The values of the model evaluation coefficients, RMSEA = 0.188 > 0.06, CFI = 0.885 > 0.8, C_min/DF = 44 > 3, P-Close = 0.0001 < 0.05 and SRMR = 0.0001 < 0.008, confirmed the reliability of the model. The Critical Ratio value (CR) for all variables was greater than 0.7, which confirmed the convergent validity of the model. The model was considered correct in terms of the requirements for structural models [
73,
74]. Note that there were high correlations between the model’s explanatory variables. Hypotheses H1, H2, H3, H5 and H9 were confirmed. The analysis of path loadings is presented in
Table 4. The highest impact on the acceptance of IoT technology was perceived usefulness (PU) for adapting the city to the needs of people with disabilities and mobility problems (correlation of 0.93). The impact of trust in IoT Edge-Computing-based technology is smaller (correlation is 0.23). The smallest yet most significant impact was trust in city authorities (correlation of 19%), who would implement the technology in the city and process the data collected by IoT sensors.
5. Discussion
The perceived usefulness variables, PU, were rated similarly by respondents. Details of all the distributions of respondents’ answers are shown in
Figure 2 and
Figure 3. Respondents believed that IoT sensors would be needed in a smart city (71%) and allow for the city’s infrastructure to be adapted to the needs of people with disabilities and special needs (68%). Respondents believed IoT sensors would allow the city to introduce new services for residents (70%) and more greenery in convenient locations (47%).
Trust in city authorities was rated similarly by respondents. Thirty-five percent of residents believed that city authorities’ introduction of Edge Computing IoT sensors would help improve city infrastructure. Forty-five percent believed that the city would not introduce IoT sensors to help collect data to improve city infrastructure. Respondents believed that the authorities’ top priority is to look after the interests of residents (51%), and 37% believed that this is not the authorities’ priority. Forty-nine percent of respondents believed that the city would take care of the data collected by IoT sensors, and thirty-eight percent held the opposite view. Overall, residents trusted city authorities (52%), and 37% did not. The IoT acceptance (AC) dimension showed the most significant variability. Sixty-nine percent of respondents supported facial recognition by IoT sensors, and fifteen percent did not. Residents (92%) supported data collection by city sensors in parking places to improve their operation. Eighty-five percent of residents supported the anonymous collection of urban traffic data to adapt city infrastructure to meet the needs of all residents. Fifty-one percent of respondents disagreed with offering products and services to residents based on their observations, even though the data are collected anonymously. Only 26% of respondents supported such functionality.
The evaluation of the statements of the TT dimension differentiates. Sixty percent of residents supported the collection of data by rain sensors. Fifty-one percent of respondents supported collecting data about residents and their movements in the city to adapt the city to their needs. Sixteen percent of people did not trust IoT technology in this regard. Sixty-six percent of people trusted sensors that collect data on parking space occupancy. The variable that differed the most from the other variables was TT4. Thirty percent of respondents did not trust IoT sensors that collect data on residents to offer them products and services. Forty-nine percent of residents trusted city apps that help tourists.
The structural model confirmed most of the hypotheses regarding the direct influence of the studied factors on the acceptance of the use of IoT sensor data for universal design. Respondents of the presented studies in the literature believed that the predicted usability of IoT devices influences their acceptance of IoT technologies in smart cities [
90,
91].
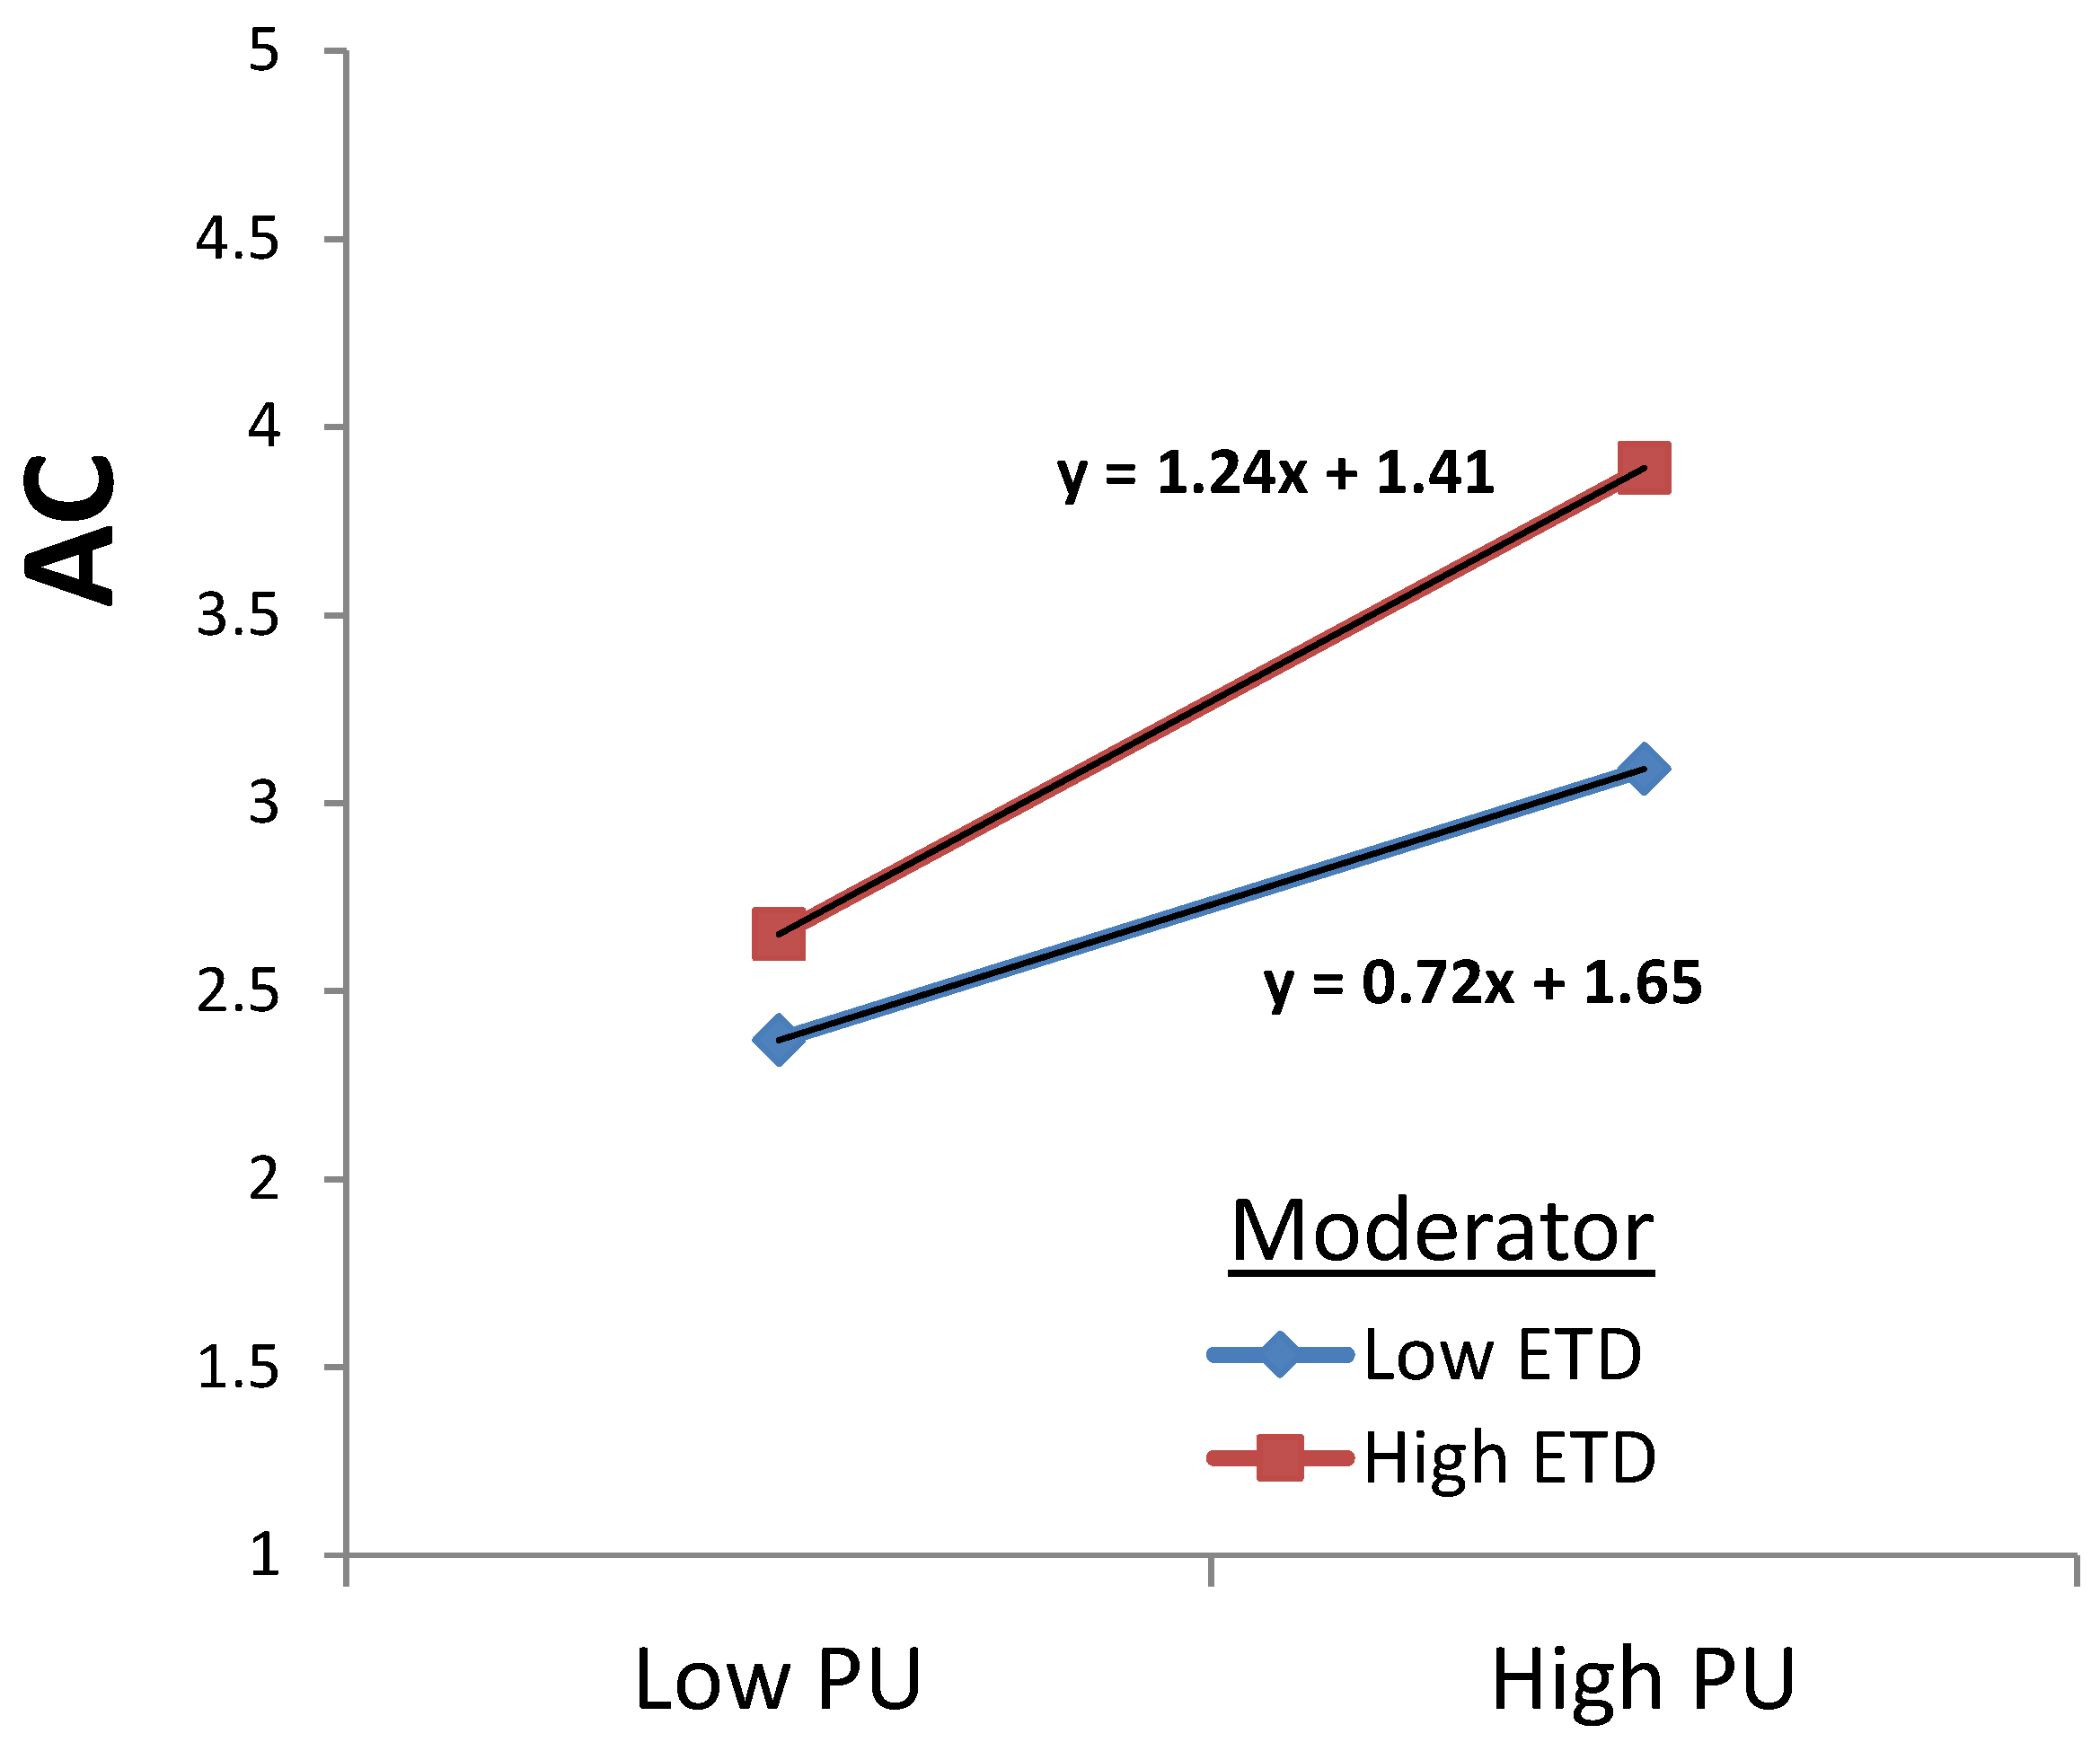
This study shows that perceived utility (PU) influenced the acceptance of using IoT device data for universal design. The regression coefficient
, is significant. Before developing the structural model presented in this study, multiple models were tested, considering the effect of empathy for the disabled on increasing public acceptance of the use of urban IoT sensor data for universal design purposes. Respondents expressed high empathy for people with disabilities. Eighty percent declared an understanding of the needs of these people and the need to adapt the city for all residents. It was proven that empathy toward the disabled (ETD) strengthens the positive relationship between perceived usefulness (PU) and the acceptance of IoT sensors (AC) for universal design purposes by 42%. The relationship was statistically significant, with
p = 0.026 (
Figure 5). Garofolo et al. also noticed this relationship [
92].
Khanh et al. noted that the security of IoT devices is a challenge. These devices are vulnerable to attacks by hackers. The public is concerned that IoT devices are not supported. A large number of devices and the constant launch of new models means that robust security algorithms are not being prepared. Transferring data from IoT devices to the Cloud requires gateway devices, which are also vulnerable to hacking attacks.
Additionally, data collected in the Cloud can also be vulnerable to attacks. The use of Edge Computing technology that allows data to be processed at the edge is also a challenge. With this technology, data are processed faster than in the Cloud, but security is still at risk. Data can be stolen from servers at the edge, requiring operators’ special attention [
86].
Residents are concerned about the security of data collected by IoT sensors in smart cities [
87,
90,
93,
94]. This study confirms these concerns. Data security (DS) negatively impacts the acceptance of using IoT devices for universal design purposes. The regression coefficient
, is significant. The model also indicated that trust in city authorities (TG) is a mediator of the relationship between perceived usefulness (PU) and the acceptance of IoT sensor use (AC). This influence is not strong (
) but is significant (
). It was also observed that trust in city authorities (TG) impacts the acceptance of using IoT sensors for universal design (AC). The regression coefficient
,
, is significant.


 ,
, 


