Article

Mobility-as-a-Service as a Catalyst for Urban Transport Integration in Conditions of Uncertainty

by
Beata Chmiel
1,
Barbara Pawlowska
2,* and
Agnieszka Szmelter-Jarosz
3
1
Doctoral School of Humanities and Social Sciences, University of Gdańsk, Bażyńskiego 8, 80-309 Gdańsk, Poland
2
Faculty of Economics, Transport Economics Department, University of Gdańsk, Armii Krajowej 119/121, 81-824 Sopot, Poland
3
Faculty of Economics, Logistics Department, University of Gdańsk, Armii Krajowej 119/121, 81-824 Sopot, Poland
*
Author to whom correspondence should be addressed.
Energies 2023, 16(4), 1828; https://doi.org/10.3390/en16041828
Submission received: 15 December 2022 / Revised: 4 February 2023 / Accepted: 6 February 2023 / Published: 12 February 2023

Abstract

:
Sudden events are being observed more often (pandemics, armed conflicts, high inflation, etc.). Urban transport systems are especially susceptible to sudden disruptions as manifested by sharp changes in user preferences and demand for transport services. Mobility as a service (MaaS) aims to improve the efficiency of urban transport systems and support the integration of various forms of transport. The main goal of the research is to assess the level of MaaS use and check what characteristics could influence using MaaS by different groups of users. A case study of the Tri-City, the largest urban centre in northern Poland, was used to examine the possibility of implementing MaaS. We assumed that the use of IT applications would help to reduce the challenges faced by mobility in modern cities. We hypothesised that MaaS is conducive to integrating transport in the city. Knowledge of MaaS acceptance is essential in implementing this concept and can help local authorities respond to sudden disruptions by increasing flexibility in shaping urban mobility. Poland still lacks a universal multimodal solution that would help optimise travel within the cities and actions should be undertaken to popularise digital solutions that improve the efficiency and organisation of PT.

1. Introduction

Cities are being subjected to constant change. Urbanisation is one of the main aspects of modern urban development—urban development means the growth of entire regions economically and socially. In 2018, 1.7 billion people—23% of the world’s population—lived in cities with at least 1 million inhabitants. In 2030, a projected 28% of people worldwide will be concentrated in cities with at least 1 million inhabitants [1,2]. Globally, cities diversify very much from one another. Hence, their development and transformation are conditioned by many regional or country-specific factors. As a result, cities are exposed to many threats, both internal and external. Internal threats are well recognised and relatively easy to predict. These include urban problems that arise from functioning and development, such as waste management or transport congestion. These problems are global, common to most agglomerations and metropolises, and are well described in the literature. External threats, on the other hand, are difficult, often impossible, to predict. A particularly vulnerable area is the urban transport system, given its essential role in shaping the urban tissue (see Figure 1).
Figure 1 presents a map of city challenges. It is supplemented by major challenges that urban areas will face in the coming years. One of them is renewable energy production, which is linked to the energy crisis. Many of the challenges mentioned indirectly relate to transport operations in urban areas. Growing suburbs create new challenges mainly related to stakeholders’ different needs and expectations [3].
The ability to respond quickly to emerging challenges is linked to the concept of resilience, which refers to the ability to resist and recover relatively quickly [4]. Urban resilience is addressing the global climate crisis, spatial planning in urban areas, energy supply, disasters, and local communities [5]. Minimising the negative impacts of challenges maintains a high level of safety for residents. Local communities are a key area for the functioning of cities [6]. However, they are particularly vulnerable to their adverse effects. For example, although there are currently no power outages for consumers, the threat of such may occur [7]. A city should be prepared to take appropriate preventive measures when anticipating such a threat. However, the municipal authorities should implement solutions to minimise the risk as well.
Public transport (PT) is an essential service provided by cities to their residents, but PT generates polluting emissions of particulate matter (including PM10 and PM2.5) and thus makes a major contribution to urban pollution. Activities aimed at reducing the nuisance of transport are mostly based on electromobility and implementing urban sharing systems [8]. However, private cars dominate in urban areas, causing difficulties related to congestion or the availability of parking spaces [9]. This provides new opportunities for the development of urban mobility, which must be supported, however, by the development of infrastructure, mainly walking and cycling pathways and interchange points, integrating the transport modes and network. Despite the development of bicycles and electric scooters or car-sharing and carpooling systems, which has been observed for many years, cities still face a growing problem of transport congestion. According to the PWC report of 2022, residents of the sample cities spent an average of 111 h annually idling in traffic. Assuming a 45 h workweek with 48 working weeks in a year, that equals up to 5% of one’s total working hours spent stuck in traffic [10].
The paper highlights the most important challenges of modern cities, including those related to urban transport. Among the most important challenges in this field are management and planning considering the transport needs of different stakeholders. This paper aims to address the question of new development directions for PT in the context of urban transport. The specific goal of our research was to identify problems and barriers in developing urban transport in Poland on the example of Tri-City agglomeration. To achieve this goal, we used a survey to collect data, asking respondents about the purposes of their daily/weekly mobility and ways to meet these needs. Then, for data analysis, the ordered logit models were prepared. This allowed us to identify mobility pathways in the city and how to meet transport needs using different transport modes and forms. We assumed that the use of IT applications would help to reduce the challenges faced by mobility in modern cities. We hypothesised that MaaS is conducive to the integration of transport in the city. Therefore, the next research goal was to assess the level of MaaS usage. The other goal of the research was to check what characteristics could influence the use of MaaS by different groups of users. By analysing the results of our research, we tried to point out the actions that would support the development of MaaS system solutions. Especially cities that should attempt to establish resilience by implementing appropriate policies. Furthermore, the concept of mobility development based on an integrated transport network that uses different ways of getting around the city (Mobility-as-a-Service) is one of the factors of adaptation to the changes that have occurred. The level of acceptance of MaaS implementation by PT users in the Tri-City agglomeration is fundamental to future development.

2. Literature Review

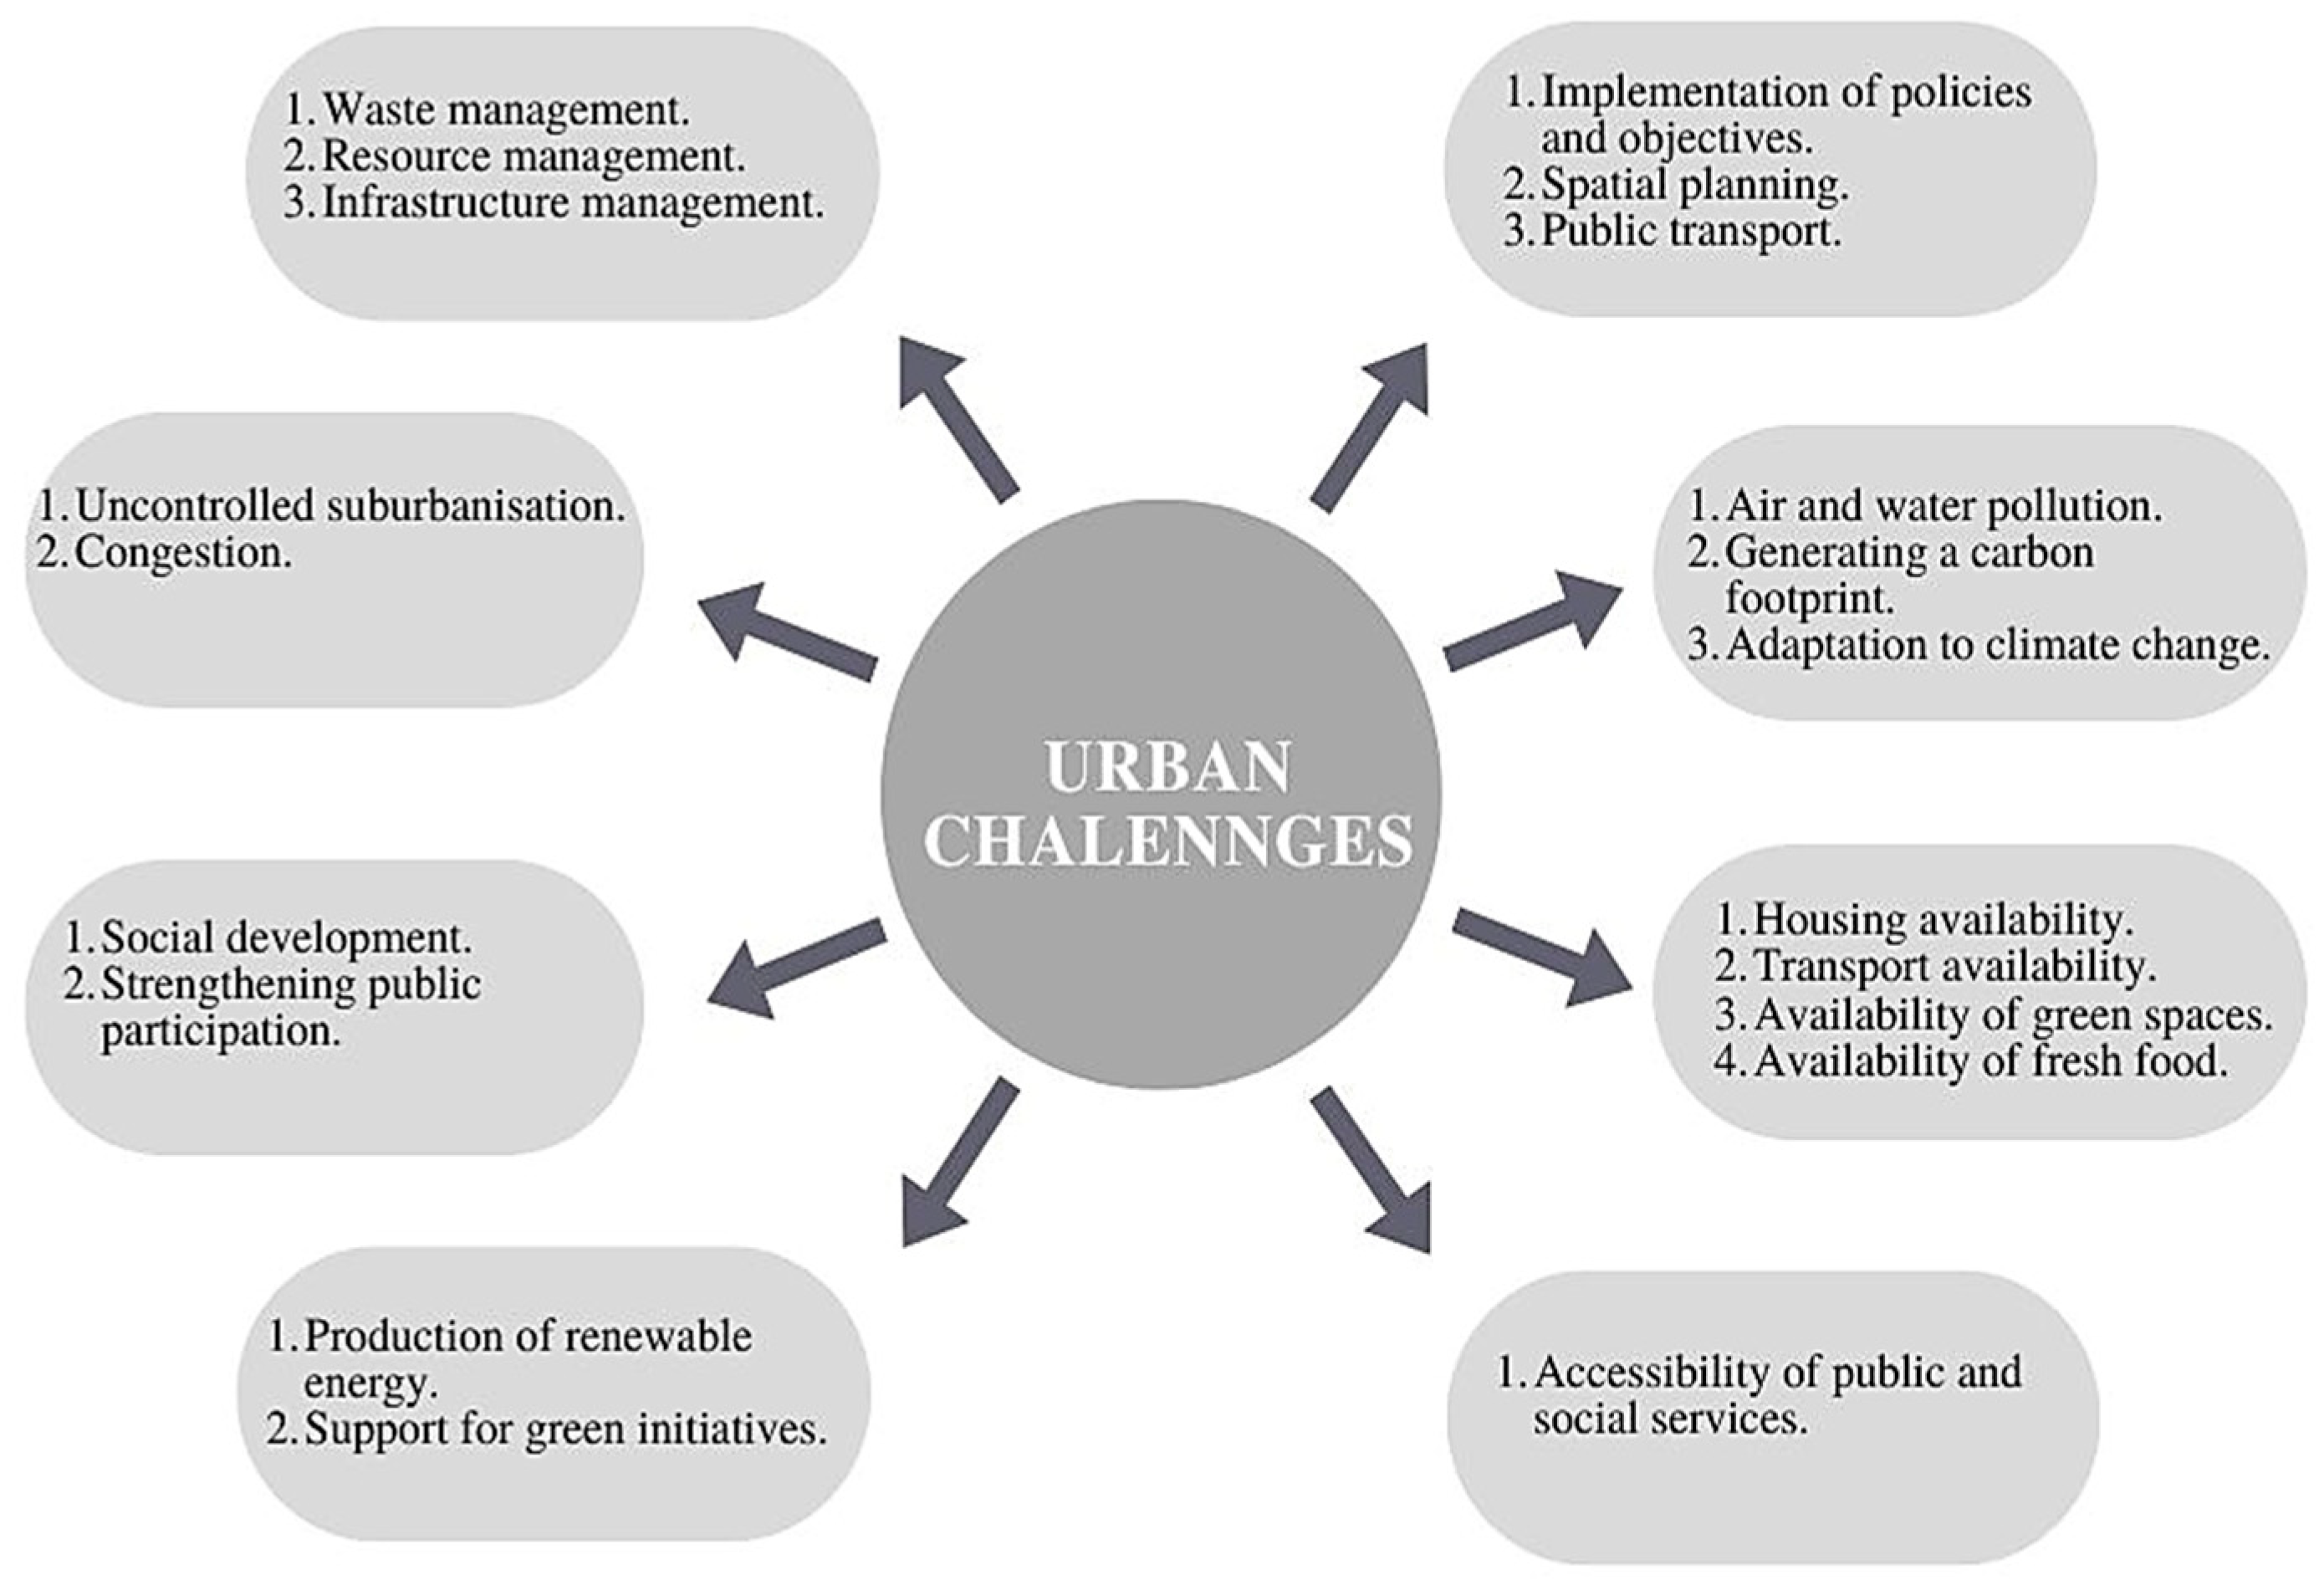
2.1. Challenges and Developments in Urban Transportation

Urban transport development should take into account the principles of sustainable development; thus, it should be economically efficient, and it is also socially and environmentally sensitive. The assumptions of the transport policy are based on the need to implement environmentally friendly principles in the form of energy-saving solutions. They focus on the issue of alternative-powered vehicles, mainly electric ones. There is a strong correlation between GDP growth and volume and passenger transport performance [9]. An improvement in the quality of life can significantly affect the increase in demand for transport, especially in short-term journeys [11]. However, it is reasonable to assume that this will be related to using private cars rather than public transport [12]. The European Union transport policy focuses on the implementation of relevant policies of an interdisciplinary nature. The main challenge is to achieve low-carbon neutrality by 2030 [13].
Public transport (PT) is vulnerable to fluctuations in passenger numbers, which can occur as a result of basically any sudden event. In addition, there is a contradiction between the need to minimise the operating costs and maximise the quality of transport services [14,15]. Low funding for PT operations is not conducive to building the long-term resilience of the transport system to disruption [16]. In particular, local development policies and strategies are a tool to support the resilience of the transport system. Diversification of transport modes and ways of getting around the city is vital for the system’s resilience. This makes it possible to easily divert traffic to specific PT modes or reduce vehicle congestion by using individual transport modes.

2.2. The Importance of Transport Integration for Urban Mobility

Transport has a crucial role in the functioning of a city, ensuring the mobility of both people and goods. The demand for passenger transport services can be satisfied by private modes of transport or by PT. Urban transport also generates many negative externalities, including congestion, air pollution, and noise. Transport integration is a process of organising transport in the city and in its suburbs, increasingly also within regional clusters based on multimodality, and cooperation between different public and private actors [17,18,19].
Transport integration can involve several levels—infrastructure, digital, information, tariff, and institutional (Figure 2). Full integration implies integrating transport in all five dimensions. Transport in the city depends on the state and quality of the infrastructure. Outdated infrastructure is often the cause of inefficiencies in the transport system, resulting in congestion [20].
In addition, the high costs of operating and building new infrastructure can be a critical barrier to developing mobility for residents, as the poor condition of the infrastructure does not encourage the diversification of transport modes [21]. The digitalisation of transport is mainly the implementation of modern solutions in traffic management, such as ITS—intelligent transport system—systems or the use of GPS to manage or monitor passenger flows [22,23]. Their implementation has multiple benefits, such as prioritising PT in traffic or improving safety. Another essential factor for full integration is the unification of passenger information and the implementation of dynamic information systems [24]. These pro-passenger activities enhance the comfort of travelling around the city using PT. The information system should, above all, be transparent and available online. Tariff integration refers to tariffs and PT tickets. Especially in metropolitan areas, it can be difficult to have several tariffs depending on the operator, making it difficult to navigate [25]. Finally, institutional integration requires in-depth cooperation between the different stakeholders operating in the urban transport field.
Currently, urban authorities are aiming to meet transport needs based on the creation of development policies and strategies, the focus of which is to create sustainable mobility [26]. This idea is also present in European policy, and citizens are increasingly working towards sustainable mobility by initiating shared mobility measures. Fragmented measures, however, are ineffective in improving the transport system’s functioning. Nowadays, PT should not only address the transport needs of the residents but also provide different modes of transport, including bicycle transport systems or micro-mobility solutions. This is due to the need to integrate transport in the city to improve the flow of people and reduce social costs [27]. It is a crucial component of the functioning of the transport network to intensify cooperation between the municipal authorities and operators [28]. Private sector initiatives to provide new transport solutions (e.g., car-sharing and electric scooters) are part of the necessity to create flexible forms of mobility [29].
The role of the city authorities in creating urban mobility is fundamental. Local authorities are responsible for implementing transport policies and working with other stakeholders. Initiatives related to the development of urban mobility focus on multimodality and transport integration, i.e., combining different modes of transport and routes within a single journey [22].

2.3. Mobility as a Service as a Final Stage in Urban Transport Integration

The Mobility-as-a-Service (MaaS) concept is a new approach to transport. MaaS is particularly relevant to the sustainable development paradigm, combining economic efficiency with environmental friendliness and increased comfort and safety for residents [30]. MaaS focuses on integrating travel planning, including using mobile apps and different ticket payment methods or providing real-time passenger information [30]. As a transportation system, MaaS creates a network of cooperation and dependencies between stakeholders: users, operators, and designers of new solutions and the public sector represented by municipal authorities and other city institutions [31]. Thus, MaaS can be considered as a final stage of transport integration in traditional terms (see Figure 3).
MaaS is a fully integrated transport system based on clustered services and establishing specific transport policies, a common development strategy, or promoting social initiatives [32]. The crucial component of MaaS is using digital technologies—IoT (Internet of Things), mobile applications, or satellite systems. These provide the tools to reduce the system’s cost, improve movement, and provide information to various stakeholders. MaaS is specifically a transport development concept aimed at people of all ages who do not use a private car [33]. Therefore, integrating MaaS towards a flexible system guided by mobile applications can increase the uptake of PT as a convenient and efficient way of getting around the city [34].
Multi-stakeholder cooperation and a developed PT network are required for MaaS implementation. The city must meet several conditions to implement MaaS solutions, in particular: (1) the availability of a wide variety of transport modes, (2) the availability of mobile applications and e-ticketing, (3) the sharing of data by individual operators, (4) the availability of real-time transport data, and (5) the agreement among operators to sell the services offered by another institution [35]. De facto, the implementation of MaaS relies on the cooperation of a multitude of actors to achieve certain goals or to implement a common policy [30].
The superior role of the municipal authorities in the MaaS implementation process can therefore be pointed out. It is the municipal authority which should initiate the MaaS implementation process with the appropriate tools—strategies and legal regulations—and then actively participate in it as one of the entities. Simultaneously, the authorities should support the individual system operators and build cooperation among them. The tasks of the municipal authorities also include coordinating the system, including collecting and sharing data with individual operators, and monitoring and controlling the correct functioning of the MaaS.
The requirement for PT to develop shared solutions and innovation was already recognised in the 1990s. At that time, concepts of transport as an end-to-end service emerged [36]. These concepts were clarified with the development of services such as Uber, with it rapidly becoming popular in the US and later in European cities. Based on mobile applications, these new solutions in urban mobility made urban travel much easier, mainly due to their high flexibility and accessibility, as well as their relatively low price. During the the COVID-19 pandemic, interest in the MaaS concept increased significantly (see Figure 4).
The number of published academic papers on the MaaS concept between 2008 and 2022 in the three largest databases was reviewed. The results show that the largest number of articles were published during the COVID-19 pandemic, i.e., between 2020 and 2021. The lockdown caused by the COVID-19 pandemic resulted in many changes in the PT operation systems. In Poland, it was visible that in many cities, the authorities decided to reduce the frequency of selected bus, tram, and trolley bus transport lines and impose passenger limits on vehicles. This affected growing interest in shared solutions and micro-mobility increased.
A synthesis of the literature review is presented in Table 1. Based on the reviewed sources, it can be concluded that there are different understandings of implementing IT solutions that make up MaaS systems in different cities. Another important observation is that the papers reviewed are concerned mostly with theoretical aspects: defining MaaS, identifying users, or focusing on transport integration per se rather than practical ones.

3. Materials and Methods

3.1. Research Framework

The authors decided to use the case study method as the primary approach to present the current situation in Polish cities/agglomerations in the range of the MaaS implementation. According to Yin [37], the selection process of the case study should be ambitious enough to try to select a significant or “special” case for the case study. For this reason, we decided to consider a very specific Polish agglomeration, one of the biggest in the country, with the big potential to implement and use multiple MaaS services and apps, also due to its wide suburban area (see Section 3.1). The case study is composed of four parts:
  • Presentation of the main characteristics of the Tri-City agglomeration (see Section 3.2).
  • Data collection to analyse MaaS users (see Section 3.3).
  • Results (see Section 4).
  • Discussion and recommendations (see Section 5).

3.2. Case Study

The Tri-City agglomeration is located in northern Poland on the Bay of Gdańsk. It includes Gdańsk, Gdynia, and Sopot, but more generally, it also includes the smaller neighbouring cities of Wejherowo, Reda, Rumia, and Pruszcz Gdański, as well as suburban areas located along the Tri-City ring road. (see Figure 5). In 2011, the Gdansk Metropolitan Area Association was established [38]. In 2021, it was transformed into the Gdansk–Gdynia–Sopot Metropolitan Area Association [39].
The Tri-City agglomeration is the third largest in Poland. The estimated number of residents reaches approx. 1.5 million people [41]. There are several universities within the three cities; hence, because of the large number of students not registered as residents, it is difficult to give an accurate population figure. In addition, the developing suburbs are causing little population growth or even depopulation of the core in favour of population growth in the outer areas.
In the third edition of Antal’s surveys, the Tri-City agglomeration was characterised as having the greatest investment potential in Poland [42]. The GDP per capita in Pomorskie Voivodeship was higher than in most of the country. It is an exceptionally fast-growing region and is attractive for tourism and business. The Tri-City agglomeration is located close to the Baltic Sea, which is an advantage in relation to other centres in the country in terms of economic development—many maritime, touristic, and transport companies operate in the agglomeration.
There are several transport operators within the agglomeration: ZTM Gdańsk, ZKM Gdynia, SKM (Rapid Urban Railway), and PKM (Pomeranian Metropolitan Railway), of which only the rail operators serve the entire agglomeration area. PKM has the largest range, but there is a significant lack of integration with other modes of transport [43]. Currently, the problem is the lack of a common tariff and different ticket prices for each operator. This generates further problems related to the issue of mobility within the agglomeration or the metropolis more generally. These problems were partly solved by creating the Metropolitan Transport Union of the Gulf of Gdansk—MZKZG in 2008 [43]. However, the integration of public transport requires much more extensive measures.
The 2015 Transport Development Strategy for the Metropolitan Area Gdańsk–Gdynia–Sopot identified the need for a metropolitan public transport authority—MZTP—to be established based on the currently operating MZKZG [44,45,46]. The actions needed for the smooth operation of the transportation system are: forming a single transport organiser, reducing the negative impact of suburbanisation, and the developing cycling, pedestrian, and road infrastructure.

3.3. Data Collection

The research method for data collection used in this study was an online survey held between 17 July and 22 September 2022. The survey consisted of 15 open-ended or closed-ended questions. The questionnaire was validated on a group of 20 respondents and then adjusted to their opinions (before 17 July). The scale questions were based on often used 10-point scales, allowing the scale of phenomenon or the strength of beliefs and opinions to be assessed in more detail than with the frequently used five-scale questions. Nonetheless, in some cases, the respondents were asked to assess their opinions using five-scale questions, especially when they had to agree or disagree with them. Finally, 519 respondents took part in the survey.
The data were gathered using the snowball method. The population of people using MaaS solutions is not well known in Poland, nor is it assessed by any agency—only to some limited extent, both for pre-pandemic and pandemic situations. However, the mobility market, including the use of MaaS, is rapidly changing in Poland and any data collected in 2019 or 2020 are no longer valid. Additionally, users of shared mobility services and mobility-as-a-service are usually from the younger generation which was also the case in our study. Therefore, it was justified to collect data without any sample stratification if the population was the group of MaaS users. Nonetheless, we tried to reach as minimal of a sample size as possible. The estimated number of shared mobility users, according to Statista, is between 3 and 3.5 million in Poland [47]. Hence, the sample size should be at least 384 (with a fraction of 0.5 and a maximal estimated error of 5%).
In our research, the number of observations reached 519; thus, we met the minimal sample size for the Tri-City population since this population reached ca. 1 million residents, and therefore, the minimal sample size was 385 respondents. However, as the snowball sampling method was used, the sample cannot be assessed as random. On the other hand, users of MaaS apps are usually people from generation Y and generation Z; therefore, the overrepresentation of younger respondents could meet the rule of a random sample according to the respondent’s age (see Table 2).
According to the MaaS Study for Poland 2020 [48], 52% of MaaS users are female, 45% have higher education, 38% have high school education (both during college or university studies or not in the process of studying), 10% are at the age of 18–24, 46% are at the age of 25–44, 15% are at the age of 45–54, 14% are at the age of 55–64, and 14% are at the age of 65 and more. Thirty-three percent of them live in cities such as Gdańsk and Gdynia; 30% of them live in towns similar to Sopot.

3.4. Data Analysis

The dependent variable was the intensity of using MaaS and the potential independent variables are presented in Table A1. As the dependent variable was ordered, one of the best statistical models was the ordered logit model. Our approach assumed the following steps of the calculation: (1) calculation of the model with all the potential independent variables, (2) reducing the non-significant variables one after the other until the final model will include only statistically significant variables, and (3) analysing the final model. If so, firstly, the correlations between the variables were calculated and checked. The correlated variables could not be included in the subsequent calculations. Then, the initial model was calculated as presented in Table A1 and followed the equation for the ordered logit model as presented below.
Let Yi be an ordinal response variable (intensity of using MaaS solutions) with C (in our case: 10) categories for the i-th subject (respondents), alongside a vector of covariates xi. According to [44], an ordered logit regression model establishes a relationship between the covariates and probabilities of the six categories of assessing the intensity of using MaaS: pci = Pr(Yi = yc | xi), c = 1,…,C. Usually, ordinal regression models refer to cumulative probabilities gci = Pr(Yi ≤ yc | xi), c = 1, …, C. The last of them is equal to 1, so then the model has to specify only C−1 cumulative probabilities. The model is related to a linear predictor β′ xi = β0 + β1 × 1i + β2 × 2i + … through the logit function:
logit(gci) = log(gci/(1 − gci)) = αc β′xi, c = 1, 2, …, C − 1
The parameters αc are thresholds (α1 < α2 < …< αC − 1). The vector β (slopes) is parallel regression assumption. An ordinal response Yi with C categories is represented by response Yi* with a set of C − 1 thresholds αc*. The linear regression model for an underlying continuous response:
Yi* = (β∗)′ xi + ei*
where ei*—error with mean = 0 and standard deviation σe*. The relationship Pr(Yiyc) = Pr(Yi* ≤ αc*) proves that the linear model (2) is equivalent to the cumulative model log(gci) = αcβ′xi (1).
Then, the results for calculating the first-ordered logit model are presented in Table A1. The bolded lines represent the variables statistically significant at the level of 0.05. Then, it means that they statistically significantly shape the intensity of using the MaaS solutions. It is evident, looking at Table A1, that most of the potential independent variables did not impact the level of intensity of using MaaS. At this stage, it was necessary to reduce the independent variables to obtain the final model.
Because of that, several models were calculated, one variable was deleted every time, and then the model with the same dependent variable was calculated again. Finally, the last model with only the significant variables was calculated (see Section 4.2 and Table A2). As the results show, the final model was built so that all the independent variables should be statistically significant at the level of 0.05 or (in one case) 0.06 as the Akaike and Bayesian information criterion was lower than in the situation of excluding the one variable with the significance level of 0.06. However, for this model, the test LR (likelihood ratio; chi-square) 1 and LR 3 were held and confirmed the significance of the variable.

4. Results

4.1. Descriptive Statistics

The descriptive statistics present the outcomes of the survey. The main goal of the research was to check what characteristics could influence using MaaS by different groups of users.
In this section, we would like to present the descriptive statistics from our study, helping to assess the level of MaaS awareness and the level of use. Firstly, 63% of the surveyed urban residents travel every day. Furthermore, 84% travel during the whole week, while 14% only travel during the working days.
Car use might reflect the level of the car culture observed in Poland. It confirms what the public data present—Poland notes the highest number of cars per 1000 residents in Central and Eastern European countries. Therefore, 42% of the respondents in our survey confirmed that they used a car to travel to work or school, 61% use a car for shopping purposes, and 47% use a car for recreation. Twenty percent of the respondents did not have their own car. Interestingly, 10% of the surveyed people admitted that they would use on-demand cars for recreation. Forty percent of the respondents would use on-demand cars for different purposes, but recreation was the most common choice. Moreover, 6% of the surveyed people would use car-sharing for recreation. Altogether, 35% would use car-sharing for different purposes.
The use PT is very high among the surveyed people. For example, 44% of the respondents use a bus, tram, or trolley to go to work or school, 30% use these methods for shopping, and 55% use them for recreation. Similarly, the rapid urban rail or the regional rail are used by almost half of the respondents (49%) for recreation and by one-fourth (24%) for going to work or school.
Micro-mobility is one of the leading transport modes in the surveyed group (see Figure 6 and Table 3). Nineteen percent declared using a bike to travel to work or school, 18% used one for shopping, and 47% used one for recreational purposes. One-third of the surveyed people do not use a bike at all. Seventy-three percent of the respondents do not use urban shared bikes. The respondents rarely used other means of transport. Motorbikes are used by only 4% of respondents for recreation, the use of their own e-scooter was indicated by 3% to go to work or school and by 6% for recreation, a shared e-scooter was used by 4% for work or school, 3% for shopping, and 14% for recreation. 30% of the respondents go to work or school by foot, 75% go by foot for shopping, and 70% go by foot for recreation.
Among the most crucial problems and barriers in developing and improving the Tri-City transportation system, the respondents primarily indicated (see Appendix A, Figure A1) traffic and congestion and the long time to search for a parking space regarding car use. In the part about the PT operation, the respondents especially mentioned the lack of a metropolitan ticket (very important in the multi-city agglomerations), poor integration of timetables, crowded vehicles, and insufficient frequency of the PT service.
Surprisingly, the technical condition of the means of transport was assessed as relatively good, as well as the cycling and walking infrastructure and access to mobile applications on the traffic and PT. The respondents are not focused on the city bike system. In addition, the survey participants are relatively content to have as much need to change their transport mode as now—so the transport multimodality in the Tri-City is not a problem or the timetables are planned in such a way so as not to require too many changes of the means of transport during a journey.
The most popular navigation apps are Google Maps (used by 75% of the surveyed group), JakDojade.pl (usually used for PT trip planning—58% of the respondents declared using it), Mapy (14%; similar to Google Maps), and Koleo (17%; for rail transport). Eleven percent declared using other, less popular solutions.
The respondents assessed public transport operation in the cities as relatively low—most of the respondents gave a 2 or 3 in the five-scale assessment.
For the purpose of our study, it is essential to assess the needs and opinions of residents and other transport system users. Then, the weak points of the current system can be identified and recommendations can be formulated. In our survey, the respondents assessed the operation of the PT in Tri-City as rather low (see Figure 7). Only about 21% indicated the PT as good or very good. Therefore, there are probably many issues to be addressed by the decision-makers to raise the attractiveness of PT for Tri-City users. To identify what the exact shortcomings of the current PT offer are, in the survey, we proposed the potential problems and barriers to using PT successfully, which we found in the literature (see Figure A1 in the Appendix A).
The dependent variable was the respondents’ self-assessment of how often they would use the MaaS applications to navigate from the point of origin to the point of destination. Therefore, the five-point Likert scale was used. The higher the score, the greater the intensity of using the MaaS applications by the user (on a mobile device). Firstly, all the potential independent variables were used to build an ordered logit model. Several potential variables appeared as not significant for the intensity of using MaaS applications. For example, using a car to go to work or school was not significant, since drivers commuting every day to work or going to school probably know full well all of the possible ways to reach their point of destination, and therefore, they are able to assess the traffic in such a way that they know what route should be chosen. Moreover, using one’s own car for other purposes was not significant with one exception—it was significant when someone wanted to go shopping—probably because of a longer route and the low frequency of using this route the driver would have to check the traffic first and then plan the journey.
Car-sharing was not significant, either. However, it was not often used by the respondents. On the other hand, in using PT (bus, tram, or a trolley bus), rapid rail/regional rail was significant for the level of intensity of using the MaaS applications. Despite the intense use of a bike to commute, go shopping, or to visit a medical institution, it was not significant either—probably because the bike roads are not congested and usually, the user does not need to use other transport modes to reach their final destination. As they appeared in the final ordered logit model, 12 independent variables were statistically significant.

4.2. Results for the Ordered Logit Model

As presented in Table 4, the final model was calculated and all the independent variables in Table 4 were assessed as statistically significant. Finally, the following main findings can be drawn from the research results mentioned above:
(1)
In terms of the intensity of travelling:
  • The more frequently the person is travelling, the more intense he or she uses MaaS applications to choose the optimal option to travel but the optimal one does not mean the cheapest one or the fastest one;
  • If the journeys are taken only during workdays or only during the weekend, then the traveller uses MaaS applications significantly less often;
(2)
In terms of car-related mobility choices:
  • If someone is travelling by his or her own car to carry out shopping, then he or she uses the MaaS applications significantly less frequently;
  • If someone does not own a car, then he or she uses the MaaS applications significantly less often;
(3)
In terms of using PT (bus, tram, trolley bus, rapid urban rail, or regional rail) or environmentally friendly modes of transport (bike or by foot):
  • If the traveller is using PT or a bike or goes by foot to their final destination, then he or she uses MaaS applications significantly less frequently;
(4)
In terms of the socio-economic situation:
  • If the traveller is male, he uses MaaS applications more often;
  • Older users usually use MaaS applications more often than youngest ones;
  • The higher the education level of the respondent, the lower the intensity of using MaaS applications;
  • Regular workers use MaaS applications significantly less often (probably because of the high level of knowledge of the possible routes from their point of origin to their point of destination).

5. Discussion

The mainstream scientific literature (see the Literature Review, Section 2) agrees as to the fact that the essence of MaaS models is the integration of the offer of various transport services provided by public and private enterprises and the integration of information, payments, and tickets, where all of this is aimed at meeting the transport needs of users, reducing the external effects of transport in the city, and providing a sustainable urban transport structure. The literature review also shows significant differences in the understanding of the MaaS concept and the level of system implementation in different cities [34]. In our research, we assumed that in the MaaS model, the whole transport system operates as an interconnected, cooperative system meeting customer transport/travel needs through a combination of transport modes. Feng uses the term “seamless intermobility” to describe this ideal system, distinguishing four dimensions [49]:
  • Seamless information;
  • Seamless time (reduced waiting times);
  • Seamless space (short distances between modes);
  • Seamless service.
Analysing the research results in Poland [23] and our study, it is safe to say that MaaS services have become a permanent part of the Polish market. City dwellers begin to see the advantages of using public transport multimodally. This is confirmed by the results of the report and the opinions of the respondents who express the need for an application that would combine the offers of many transport options [48]. Thus, there is space for development or even a synergy of operations of many enterprises offering their services on the transport market in the city. A conclusion following from the research and literature review [50] is that Poland still lacks a universal multimodal solution that would help optimise travel—using public transport, car-sharing, or, eventually, personal transport vehicles.
Our research results confirm the above approach to MaaS. It is interesting to compare the results obtained in Poland with those of a study carried out in Belgium and published in April 2022 [51]. The first survey conducted on the Belgian population indicates that there is a strong interest in MaaS applications among all age groups. However, there remains a huge untapped potential for MaaS, as shown by the discrepancy between the interest in and the actual usage of MaaS applications. According to the authors of the Belgian case, it is important to note that a substantial share of all participants is considering changing their travel behaviour thanks to MaaS, mainly in favour of public transport. This seems to imply that MaaS solutions will result in a modal shift. In the case of the Tri-City, it is confirmed that MaaS applications are used more frequently by people who travel more. We also noticed that MaaS applications are more popular with the younger generation and this group of users is easier to convince of the benefits of using these solutions. Special efforts are needed for the other age groups to make them accept these solutions.
The report prepared by Little and UITP [52] shows that the crisis caused by the COVID-19 pandemic, both in the short and long term, will significantly impact urban mobility and public operation transport. On a short-term basis, the COVID-19 crisis is likely to impact the development of MaaS negatively, as the MaaS business model revolves mostly around public transport and shared mobility, which has suffered from a collapse in demand due to restrictions on transport and lockdowns.
In the medium term, MaaS can help make the system more resilient by providing more mobility options and ease of use. Multimodal real-time information can help restore confidence in public transport. A serious barrier is the current low level of implementation and adoption of MaaS in cities worldwide, which significantly limits the possible effect in the medium term [37].
In the long term, MaaS can certainly positively contribute to mobility patterns and behaviour in a way that will be much better suited to the uncertain environment and challenges relating to balancing urban mobility. Changes on the supply side related to the development of technology and market trends will be very important (increasing the importance of digital technologies such as ITS and MaaS applications, increasing the importance of new forms of mobility, the development of “on-demand” transport, and consolidation of activities of private enterprises providing mobility services). They will favour changing the modal split in urban travelling [35].
Another factor affecting the transport behaviour of city inhabitants is the change in the transport behaviour affecting the demand for public passenger transport services, such as [28,35]: (1) the development of flexible forms of employment and teleworking, (2) an increase in the passenger requirements concerning the sanitary safety of transport services, (3) change in lifestyle to be more environmentally friendly, or (4) change of behaviour in respect of the motivation, time, and area of movement.
As we noticed from our research, the key issues for a transport user in a city are the time in which he or she can move or rent and enter a means of transport, quick and secure payment, and general convenience which can be guaranteed only by agile and economic urban mobility platforms. Consumers value convenience and ease that go hand in hand with technological innovations offered by shared mobility services. On the other hand, the need to open an account, log in, and connect a payment method to each of the shared mobility applications can be burdensome in the long term [36]. The most visible issue here is the lack of integration of transport services in the city. A solution could be a shared common application providing the possibility of using the most important services offering transport in the city.
Our survey shows that to travel around the Tri-City, transport users most frequently used Google Maps (75%) and Jakdojadę (58%). These were followed by Koleo (17%) and Maps (13%). Four percent of the respondents only said they used MaaS applications daily, although 36% said they were using multimodal travelling. Analysing the travel destinations, it can be seen that obligatory trips, such as commuting to work or driving to school, to a large extent, more than 40%, are made using private cars or public transport (including the rapid rail service). Bicycles, scooters, and walking are mainly for recreation and entertainment. The share of private cars is predominant for practically all destinations.
The essential things in using MaaS are convenience and ease [34]. Modern payment methods such as card payments (both one-time and recurring), instant transfers, or BLIK payments are most frequently used in MaaS applications mainly due to convenience. In the mechanism of each MaaS application, it is crucial to reduce the number of steps needed to perform the service and even reduce them to one click.
Booking, payment, and ticketing systems should be seen as part of the infrastructure whilst upgrading and fostering the interoperability of these systems and services should be sought as a part of transport strategies at local, national, and international levels. Legislation facilitating ticket selling by third parties should be the first step, and this should ideally include flexibility in terms of pricing when issuing public transport tickets.
In 2017, the EC identified major barriers to interoperability and the wide adoption of door-to-door mobility solutions [53]. They are listed below:
  • Insufficient accessibility of travel and traffic data—without access to a full range of datasets across Europe from public and private sources, services will remain limited in scope.
  • A lack of travel and traffic data interoperability—the ability to easily exchange and integrate multiple data sources of different transport modes is essential.
  • A lack of travel information service interoperability—many travel/transport information services exist at city, regional, and national levels. However, the interoperability between such services remains limited.
  • Insufficient travel and traffic data quality—the quality of travel and traffic data in terms of being accurate, up to date, etc., are fundamental for the widespread uptake of multimodal travel information services.
We asked our respondents about their preferred directions of mobility changes. When answering the question: ‘What directions of development of joint metropolitan initiatives in the area of transport, communication, and mobility would, in your opinion, be the most important for the inhabitants of the Tri-City?’ Our respondents indicated the directions of actions that would accelerate changes in the use of urban transport and implementation of the goals of sustainable mobility in the city (see Figure A2).
The main actions indicated by our respondents:
  • Implement free public transport.
  • Adjust the transport offer to the needs of people with disabilities.
  • Build an integrated transport hub near the railway/tram/bus station.
  • Implement a metropolitan bike system (available at bus stops and stations and on platforms).
  • Popularisation of ITS.
  • Introducing a dynamic passenger information system.
  • Introducing metropolitan tickets.
  • Expansion of the metropolitan railway.
  • Common unified standards of static passenger information.
MaaS deployment can be accelerated with supportive actions and policies, mainly in the following areas [54]:
  • Appropriate methods of sharing data in a way that is fair to consumers and businesses to increase opportunities for integrating into a MaaS platform;
  • Support business and industry in elaborating interoperability standards for facilitating communication between mobility systems;
  • Support—in collaboration with national authorities—innovation and MaaS development by incorporating the notion that no transportation title is anonymous;
  • Address the physical infrastructure challenge by working with the car- and bike-sharing providers and other mobility service operators/providers to deliver adequate infrastructure;
  • Address the physical infrastructure challenge by working with the car- and bike-sharing providers and other mobility service operators/providers to deliver adequate infrastructure for car-sharing, bike-sharing, and adequate cycling lanes for safe bike riding;
  • Support and become a member of a MaaS partnership model and help to establish a level-playing field for the mobility service operators/providers;
  • Orchestrate MaaS as a member of the MaaS partnership towards high-level objectives such as decreasing the impact of transport and mobility on the environment and human health;
  • Support transport infrastructure providers (TIPs) to apply integrated network management and assist the coordination between TIPs for different modes and between them and other partners such as MaaS providers and mobility service operators/providers;
  • Provide—in collaboration with national authorities—platforms for knowledge exchange for integrated network management.
When implementing these actions, it is extremely important that the MaaS stakeholders work together at all levels, from national to local, and work with businesses in developing a framework for the system to function where the legal system is of great importance [32]. An integrated transport system is based on the interoperability of its components. This means that systems must be able to interact with one another across borders and regardless of the mode of transport at all levels: infrastructure, data, services, applications, and networks.

6. Conclusions

The use of MaaS is a component of the current transport behaviour. Checking the availability of PT means, routes, shared mobility solutions, or, finally, non-congested roads is extremely important for passengers and drivers. MaaS meets the demand for real-time information about the accessibility of transport modes. Therefore, it is expected to grow in the future.
Our study has shown that the use of MaaS in the Tri-City depends on using a car, PT, or environmentally friendly, zero-emission vehicles such as bikes, the frequency of travel, and the socio-economic profile of the traveller. The transport offer, both public (PT) and private (private mobility services operators), should be adjusted to the needs, behaviour and habits of passengers and drivers and bring a compromise between the individual needs and priorities of local authorities and transport service providers. MaaS can be one of the solutions helping to achieve this compromise.
Nevertheless, we are aware of the limitations of this study. Firstly, we have presented the results for one agglomeration in Poland only—a quite specific one, with two bigger cities and a smaller one between them. However, this agglomeration which is assessed as one of the best to live in Poland, can be a benchmark for other cities in the country and on a broader scale—in Central and Eastern Europe [50]. The solutions found by us for meeting the demands of customers have the potential to be helpful in solving problems in other locations. Secondly, we carried out our survey using non-random sampling and the snowball method. Hence, the sample is not homogeneous in terms of gender compared to a similar study carried out on almost 700 Polish people by Digital Poland [48]. Nevertheless, this is a study with a large number of observations providing valuable insights for the use of MaaS. Furthermore, there is no comprehensive and reliable study for Poland on using the MaaS service to present and show the population of MaaS users. What is more, even the definition of MaaS differs among various publications.
Nevertheless, we hope this study will continue the scientific discussion about MaaS solutions and their development in urban, suburban, and rural areas, especially those characterised by high density and congestion. We think that there is a need to study this topic more thoroughly for other cities and agglomerations to build a broader picture of the use of MaaS in Poland and Central and Eastern Europe, as this field is poorly represented by research for this specific geographical area.

Author Contributions

Conceptualisation, B.C., A.S.-J. and B.P.; methodology, B.P.; software, A.S.-J.; validation, A.S.-J. and B.P.; formal analysis, A.S.-J.; investigation, B.C. and A.S.-J.; resources, B.C.; data curation, A.S.-J.; writing—original draft preparation, B.C., A.S.-J. and B.P.; writing—review and editing, B.P.; visualisation, A.S.-J.; supervision, B.P.; project administration, B.P. All authors have read and agreed to the published version of the manuscript.

Funding

This research received no external funding.

Institutional Review Board Statement

Ethical review and approval were waived for this study due to full anonymisation of the data collection process.

Informed Consent Statement

Not applicable.

Data Availability Statement

The data presented in this study are available on request from the corresponding author. The data are not publicly available due to privacy reasons.

Conflicts of Interest

The authors declare no conflict of interest.

Appendix A

Table A1. The results of the first calculation of the ordered logit model (LR 1 test).
VariableDegrees of FreedomLog. LikelihoodChi-Sq.p-Value
Const5−719.157
Frequency of travel1−715.5537.208840.007255
Days when travelling1−703.92423.258850.000001
Using car (work/school)1−703.8970.053840.816508
Using car (shopping)1−703.5150.763480.382243
Using car (administration)1−703.4050.219310.639568
Using car (medical visits)1−703.2430.325270.56846
Using car (recreation/entertainment)1−702.9480.590110.442377
Not having own car1−694.54716.801580.000041
Renting a car (recreation)1−693.2712.552530.110117
Car-sharing (recreation)1−693.0810.379930.537642
PT (tram, bus…) work/school1−691.7892.583420.107988
PT (tram, bus…) shopping1−689.7264.125360.042245
PT (tram, bus…) administration1−682.55114.350490.000152
PT (tram, bus…) medical visits1−681.9171.267210.26029
PT (tram, bus…) recreation1−674.3115.21420.000096
PT (rapid rail) work/school1−668.32711.966410.000542
PT (rapid rail) shopping1−667.9360.782970.376233
Train (SKM, Regio, and PKM) administration1−663.718.450170.00365
PT (rapid rail) medical visits1−660.8985.625480.017701
PT (rapid rail) recreation1−660.7830.229690.631754
Own bike (work/school)1−659.3882.78950.094884
Own bike (shopping)1−656.9434.889360.027023
Own bike (administration)1−655.1513.58410.058335
Own bike (medical visit)1−654.3551.591920.207052
Own bike (recreation)1−653.5081.695070.192934
Shared bike (recreation)1−653.2630.489330.484226
Own motorbike/scooter (recreation)1−653.0040.519010.471266
Own e-scooter (work/school)1−652.750.50750.476225
Own e-scooter (recreation)1−652.7340.032410.85713
Shared e-scooter (work/school)1−652.1341.200420.273238
Shared e-scooter (recreation)1−651.7780.710780.399185
On foot (work/school)1−651.5780.400910.526617
On foot (shopping)1−651.4980.159310.689789
On foot (administration)1−649.9343.128550.076932
On foot (medical visit)1−648.5642.738720.097943
On foot (recreation)1−648.4550.219330.639553
Using multiple transport modes while travelling1−648.2960.318160.572716
Assessment of PT operation in Tri-City1−648.2950.000820.977161
Frequency of using PT1−648.1260.338390.560758
Gender1−646.8822.488650.11467
Age1−634.13825.487880.00000
Education1−631.2795.718470.016787
Socio-economic status1−628.5255.50770.018933
Table A2. Wald statistics and p-values for the final ordered logit model.
VariableDegrees of FreedomWald Statp-Value
Const5556.40740
Frequency of travel14.95920.025952
Days of travelling14.04230.044373
Lack of own car18.06240.004519
Using car (shopping)113.31160.000264
Using PT (bus, tram) administration14.3040.038024
Using PT (bus, tram) recreation111.34740.000756
Using PT (rapid rail) medical visits19.24280.002364
Own bike (administration)17.6020.00583
On foot (administration)18.06320.004517
Gender14.60840.031816
Age130.04450
Education13.48590.061893
Socio-economic status14.46760.034543
Figure A1. The main problems of public transport in the Tri-City (0—I definitely disagree; 5—I definitely agree).
Energies 16 01828 g0a1
Figure A2. Directions of development of joint metropolitan initiatives in the area of transport, communication, and mobility favourable to the change in the use of urban transport and implementation of the goals of sustainable mobility in the city.
Energies 16 01828 g0a2aEnergies 16 01828 g0a2b

References

  1. United Nations. World Urbanization Prospects The 2018 Revision; Department of Economic and Social Affairs, Population Division: New York, NY, USA, 2019.
  2. Wang, J.; Cao, S.J.; Yu, C.W. Development trend and challenges of sustainable urban design in the digital age. Indoor Built Environ. 2021, 30, 3–6. [Google Scholar] [CrossRef]
  3. Chourabi, H.; Nam, T.; Walker, S.; Gil-Garcia, J.R.; Mellouli, S.; Nahon, K.; Pardo, T.A.; Scholl, H.J. Understanding Smart Cities: An Integrative Framework. In Proceedings of the 2012 45th Hawaii International Conference on System Science (HICSS), Maui, HI, USA, 4–7 January 2012. [Google Scholar]
  4. Mazzucato, M. Mission-Oriented Research & Innovation in the European Union A Problem-Solving Approach to Fuel Innovation-Led Growth; European Commission: Brussels, Belgium, 2018; pp. 10–25.
  5. Anand, P.B.; Navio-Marco, J. Governance and economics of smart cities: Opportunities and challenges. Telecommun. Policy 2018, 42, 795–799. [Google Scholar] [CrossRef]
  6. May, A.D. Urban Transport and Sustainability: The Key Challenges. Int. J. Sustain. Transp. 2013, 7, 483–495. [Google Scholar] [CrossRef]
  7. Coaffee, J.; Therrien, M.C.; Chelleri, L.; Henstra, D.; Aldrich, D.P.; Mitchell, C.L.; Tsenkova, S.; Rigaud, E. Urban resilience implementation: A policy challenge and research agenda for the 21st century. J. Contingencies Crisis Manag. 2018, 26, 403–410. [Google Scholar] [CrossRef]
  8. Hörcher, D.; Tirachini, A. A review of public transport economics. Econ. Transp. 2021, 25, 100196. [Google Scholar] [CrossRef]
  9. Wimbadi, R.W.; Djalante, R.; Mori, A. Urban experiments with public transport for low carbon mobility transitions in cities: A systematic literature review (1990–2020). Sustain. Cities Soc. 2021, 73, 103023. [Google Scholar] [CrossRef]
  10. Galal, H.; Wimmer, H.; Khurana, A. Smart Mobility. Smart Cities: Mobility Ecosystems for a More Sustainable Future Navigating Converging Social, Economic, and Technological Trends Requires Rethinking Your Ecosystems Strategy, PWCS&B, (2022). Available online: https://www.pwc.com/gx/en/issues/reinventing-the-future/smart-mobility-hub/sustainable-mobility-ecosystems-in-smart-cities.html (accessed on 6 December 2022).
  11. Bakker, S.; Zuidgeest, M.; de Coninck, H.; Huizenga, C. Transport, Development and Climate Change Mitigation: Towards an Integrated Approach. Transp. Rev. 2014, 34, 335–355. [Google Scholar] [CrossRef]
  12. Pawłowska, B. Analiza czynników kształtujących popyt na usługi transportowe w Unii Europejskiej. Probl. Transp. I Logistyki 2015, 30, 87–104. [Google Scholar] [CrossRef]
  13. Korneć, R. System of city transport towards sustainable development. Stud. Miej. 2018, 30, 71–84. [Google Scholar] [CrossRef]
  14. Ribeiro, P.J.G.; Goncalves, L.A.P.J. Urban resilience: A conceptual framework. Sustain. Cities Soc. 2019, 50, 101625. [Google Scholar] [CrossRef]
  15. Balakrishnan, S.; Zhang, Z. Developing Priority Index for Managing Utility Disruptions in Urban Areas with Focus on Cascading and Interdependent Effects. Transp. Res. Rec. 2018, 2672, 101–112. [Google Scholar] [CrossRef]
  16. Mola, M.; Feofilovs, M.; Romagnoli, F. Energy resilience: Research trends at urban, municipal and country levels. Energy Procedia 2018, 147, 104–113. [Google Scholar] [CrossRef]
  17. Schmaranzer, D.; Braune, R.; Doerner, K.F. Multi-objective simulation optimisation for complex urban mass rapid transit systems. Ann. Oper. Res. 2021, 305, 449–486. [Google Scholar] [CrossRef]
  18. Mo, B.; Koutsopoulos, H.N.; Zhao, J. Inferring passenger responses to urban rail disruptions using smart card data: A probabilistic framework. Transp. Res. Part E 2022, 159, 102628. [Google Scholar] [CrossRef]
  19. Maretić, B.; Abramović, B. The Spatial Reorganization of an Integration Transport Point: A Case Study of the City of Šibenik. Transp. Probl. 2021, 16, 15–22. [Google Scholar] [CrossRef]
  20. Ma, W.L.; Zhao, X. Evaluation research of transfer convergence between inter-city rail transit and urban transport based on AHP and grey clustering method. Adv. Transp. Stud. 2018, 2, 37–48. [Google Scholar]
  21. Sinkevicius, G.; Ginevicius, R.; Jarasuniene, A. Analysis of clusterisation and networking processes in developing intermodal transportation. Eng. Manag. Prod. Serv. 2016, 8, 63–71. [Google Scholar]
  22. Koźlak, A. Ograniczenie kongestii transportowej w miastach jako główne wyzwanie dla polityki transportowej. Logistyka 2015, 3, 5386–5394. [Google Scholar]
  23. Solecka, K. Integration of public transport in polish and EU documents and examples of solutions for integration of public transport in Poland and in the world. Transp. Probl. 2011, 6, 23–34. [Google Scholar]
  24. Kunicina, N.; Galkina, A.; Zabasta, A.; Patlins, A.; Kondratjevs, K. Traffic Route Modelling and Assignment with Intelligent Transport System. Electr. Control Commun. Eng. 2014, 7, 34–40. [Google Scholar] [CrossRef]
  25. Boycov, V.; Zivitere, M. GPS Satellite System Integration in Monitoring of Automobile Transport in Latvia. Sci. J. Riga Tech. Univ. Transp. Engineering. Intell. Transp. Syst. 2010, 34, 155–160. [Google Scholar]
  26. Leng, N.; Corman, F. The role of information availability to passengers in public transport disruptions: An agent-based simulation approach. Transp. Res. Part A 2020, 133, 214–236. [Google Scholar] [CrossRef]
  27. Bashynska, I. Improving the Tariff Policy of Urban Passenger Transport Based on International Experience. TEM J. 2020, 9, 1588–1596. [Google Scholar] [CrossRef]
  28. Carlan, V.; Rosca, E.; Rosca, M.A. Urban and peri-urban passenger transport integration through hub-and-spoke-network. Theor. Empir. Res. Urban Manag. 2014, 9, 74–84. [Google Scholar]
  29. Doina, C. Indicators for the performance and for the effort in transport. Constanta Marit. Univ. Ann. 2013, 18, 261–265. [Google Scholar]
  30. Bąk, M.; Borkowski, P.; Pawłowska, B. Types of solutions improving passenger transport interconnectivity. Transp. Probl. 2012, 7, 27–63. [Google Scholar]
  31. Vegah, G.; Wajid, U.; Adebisi, B. Smart-agent system for flexible, personalised transport service. J. Eng. 2016, 12, 456–466. [Google Scholar] [CrossRef]
  32. König, D.; Eckhardt, J.; Aapaoja, A.; Sochor, J.; Karlsson, M.A. Deliverable 3: Business and Operator Models for MaaS; MAASiFiE Project Funded by CEDR; 2016; pp. 10–16. [Google Scholar]
  33. Transport Committee. Mobility as a Service, Eight Report of Session 2017-19; UK Parliament: London, UK, 2018; pp. 12–36.
  34. Koźlak, A.; Pawłowska, B. Mobility-as-a-service for improving mobility in smart cities—A comparative analysis of selected cities. Pr. Nauk. Uniw. Ekon. We Wrocławiu 2019, 63, 31–46. [Google Scholar] [CrossRef]
  35. Mulley, C.; Nelson, J.D.; Wright, S. Community transport meets mobility as a service: On the road to a new a flexible future. Res. Transp. Econ. 2018, 69, 583–591. [Google Scholar] [CrossRef]
  36. Lyons, G.; Hammond, P.; Mackay, K. The importance of user perspective in the evolution of MaaS. Transp. Res. Part A 2019, 121, 22–36. [Google Scholar] [CrossRef]
  37. Li, Y.; Voege, T. Mobility as a Service (MaaS): Challenges of Implementation and Policy Required. J. Transp. Technol. 2017, 7, 95–106. [Google Scholar] [CrossRef]
  38. Snöeren, A.C.; Balakrishnan, H. An end-to-end approach to host mobility. In MobiCom’00, Proceedings of the 6th Annual International Conference on Mobile Computing and Networking, Massachusetts, Boston, USA, 6–11 August 2000; Association for Computing Machinery: New York, NY, USA, 2000. [Google Scholar]
  39. Yin, R.K. How to do better case studies: (with illustrations from 20 exemplary case studies). In The SAGE Handbook of Applied Social Research Methods; SAGE Publications, Inc.: Thousand Oaks, CA, USA, 2009; pp. 254–282. [Google Scholar]
  40. Główny Urząd Statystyczny. Functional Urban Areas. Available online: https://stat.gov.pl/en/regional-statistics/classification-of-territorial-units/union-territorial-typologies-tercet/functional-urban-areas-fua/ (accessed on 25 November 2022).
  41. OMGGS. Available online: https://www.metropoliagdansk.pl/ (accessed on 25 November 2022).
  42. Śleszyński, P. Naukowe podstawy i praktyczne problemy klasyfikacji i delimitacji obszarów metropolitalnych. In Instytucjonalne Formy Współdziałania Jednostek Samorządu Terytorialnego na Obszarach Metropolitalnych; Szlachetko, J.H., Gajewski, R., Eds.; Wydawnictwo Uniwersytetu Gdańskiego: Gdańsk, Poland, 2016; pp. 75–85. [Google Scholar]
  43. GUS. Population. Size and Structure and Vital Statistics in Poland by Territorial Division in 2021; As of 31 December; Statistical Office in Olsztyn: Warsaw, Poland, 2022; pp. 14–23.
  44. Antal. Investment Potential of Tri-City. Third Edition. 2021. Available online: https://antal.pl/wiedza/raport/potencjal-inwestycyjny-trojmiasta-beas-2021 (accessed on 27 November 2022).
  45. Połom, M.; Tarkowski, M. The Effect of Pomeranian Metropolitan Railway on Spatial-Functional Structure of Gdańsk (Poland). Stud. Miej. 2018, 30, 39–55. [Google Scholar] [CrossRef]
  46. Strategia Transportu i Mobilności Obszaru Metropolitalnego Gdańsk-Gdynia-Sopot do Roku 2030. Available online: https://www.metropoliagdansk.pl/upload/files/STIM_ZIT_Strategia-VI%205_2015-10-9_2(1).pdf (accessed on 27 November 2022).
  47. Statista. Available online: https://www.statista.com/forecasts/1260090/number-shared-mobility-services-users-poland (accessed on 2 December 2022).
  48. Pandemia a Współdzielona Mobilność. Stan i Perspektywy Polskiego Rynku Mobility-as-a-Service w Obliczu Epidemii COVID-19; Fundacja Digital Poland: Warszawa, Poland, 2020; Available online: https://digitalpoland.prowly.com/114382-pandemia-a-wspoldzielona-mobilnosc-nowy-raport-na-temat-stanu-i-perspektyw-polskiego-rynku-mobility-as-a-service-w-obliczu-epidemii (accessed on 2 December 2022).
  49. Feng, C.M. New prospects of transportation mobility. IATSS Res. 2014, 38, 22–26. [Google Scholar] [CrossRef]
  50. Utriainen, R.; Pöllänen, M. Review on Mobility as a Service in scientific publications. Res. Transp. Bus. Manag. 2018, 27, 15–23. [Google Scholar] [CrossRef]
  51. MaaS Alliance. Available online: https://maas-alliance.eu/2022/11/30/survey-demonstrates-the-interest-in-maas-in-belgium/ (accessed on 8 December 2022).
  52. van Audenhove, F.J.; Pourbaix, J.; Rominger, G.; Dommergues, E.; Eagar, R.; Carlier, J. The Future of Mobility Post-COVID. Turning the Crisis into an Opportunity to Accelerate Towards More Sustainable, Resilient and Humancentric Urban Mobility Systems, Arthur D Little & UITP. Available online: https://cms.uitp.org/wp/wp-content/uploads/2020/10/2020-ADL-FoM-Lab-UITP_Future-of-Mobility-post-COVID-study.pdf (accessed on 10 December 2022).
  53. Communication from the Commission to the European Parliament, the Council, the European Economic and Social Committee and the Committee of the Regions, A European Strategy on Cooperative Intelligent Transport Systems, a Milestone towards Cooperative, Connected and Automated Mobility, COM/2016/0766 Final. Available online: https://eur-lex.europa.eu/legal-content/EN/TXT/?uri=CELEX%3A52016DC0766 (accessed on 2 December 2022).
  54. Transport Trends and Economics 2018–2019, Mobility as a Service; United Nations, UNECE: Geneva, Switzerland, 2020.
Figure 1. Key challenges for 21st-century cities. Source: Own elaboration based on [3,4,5,6].
Energies 16 01828 g001
Figure 2. Transport integration process. Source: [17].
Energies 16 01828 g002
Figure 3. Mobility-as-a-service levels of integration. Source: [32].
Energies 16 01828 g003
Figure 4. Mobility-as-a-service articles published every year since 2008. Source: Own elaboration.
Energies 16 01828 g004
Figure 5. Functional urban areas (FUAs) in Poland–Tri-City as number 8. Source: [40].
Energies 16 01828 g005
Figure 6. How often do you travel? (1—daily; 2—several times a week; 3—several times a month; 4—fewer than several times a month).
Energies 16 01828 g006
Figure 7. The answers to the question: How do you assess the public transport operation in the Tri-City?
Energies 16 01828 g007
Table 1. Synthesis of the literature review.
Key AreasSourcesRelevance to the Study
Integration of PT with individual means of transport[19]High relevance
Functioning of PT in the agglomeration[20]High relevance
Solutions for increased transport integration[21,30]High relevance
Identification of MaaS stakeholders in urban transport[32]High relevance
Defining MaaS and transport integration; identification of potential benefits and barriers to implementation[33,36]High relevance
An indication of how MaaS fits into the urban transport system[35]High relevance
Analysis of urban transport solutions for addressing major urban mobility challenges[6]Medium relevance
Identification of transport system challenges[6,12]Medium relevance
Analysis of urban transport development strategies and policies towards sustainable mobility[7]Medium relevance
Analysis of transport demand in the city with a proposal for optimisation[8,17]Medium relevance
Challenges for urban mobility in EU policy terms[10]Low relevance
Transport congestion—causes, effects, and counteracting[22]Low relevance
Define ITS systems and provide examples of such systems[24]Low relevance
Table 2. Descriptive statistics for the research sample.
CharacteristicDescriptive Statistic
GenderFemale 65.90%
Male 32.56%
Other 0.39%
Do not want to indicate 1.15%
Age16–24 years old 11.56%
25–49 years old 71.67%
50–69 years old 14.84%
Over 70 years old 1.93%
EducationElementary 0.96%
Secondary 1.15%
High school 22.92%
Higher education 74.95%
Socio-economic statusWorking 78.61%
Not working 2.70%
Student 5.20%
Working student 6.55%
Pensioner 4.82%
Working pensioner 2.12%
Table 3. Basic characteristics of surveyed group.
CategoryQuestion Result
TravelFrequency of travelEvery day 63%
Few times a week 28%
Few times a month 7%
Less than few times a month 2%
Days when travellingOnly in workdays 14%
Only in weekend 1%
7 days a week 84%
Transport modeUsing a carGoing to school or work 42%
Go shopping 61%
Recreation and entertainment 47%
Using car sharingRecreation and entertainment 6%
Using public transport (bus, tram, trolley)Going to school or work 44%
Go shopping 30%
Recreation and entertainment 55%
Using public transport (fast urban rail)Going to school or work 24%
Recreation and entertainment 49%
Using own bikeGoing to school or work 19%
Go shopping 18%
Recreation and entertainment 47%
Using e-scooterRecreation and entertainment 14%
Going on footGoing to school or work 30%
Go shopping 75%
Recreation and entertainment 70%
MultimodalityUsing multiple (more than one) transport means to travelYes 36%
Using MaaSLevel of using MaaS applicationsNot using 9%
Less than few times a month 32%
Few times a month 38%
Few times a week 16%
Every day 4%
The most popular applicationsGoogle Maps 75%
Jakdojade.pl 58%
Koleo 17%
Maps (Mapy) 13%
Other 11%
Table 4. Final results for ordered logit model.
Variable/EffectAssess.St. Dev.Wald Stat.Upper 95.0%Lower 95.0%p-Value
Const1−1.535230.8364763.36852−3.174690.104230.066453
Const20.877250.8269071.12547−0.743462.497960.288744
Const32.958230.83863412.442811.314544.601920.000420
Const44.973200.86674932.921893.274406.671990.000000
Const58.195311.30495239.440475.6376510.752970.000000
Frequency of use0.262550.1178974.959190.031470.493620.025952
Days of travelling−0.249780.1242324.04231−0.49327−0.006280.044373
Lack of own car−0.769930.2711568.06243−1.30139−0.238480.004519
PT (bus tram (administration)−0.395930.1908474.30397−0.76999−0.021880.038024
PT (bus tram (recreation)−0.619040.18376911.34741−0.97922−0.258860.000756
PT (rapid rail) medical visit−0.792660.2607279.24281−1.30368−0.281650.002364
Own bike (administration)−0.796830.2890017.60201−1.36326−0.230390.005830
By foot (administration)−0.571910.2014058.06323−0.96665−0.177160.004517
Gender−0.321720.1498684.60838−0.61546−0.027990.031816
Age0.863340.15750630.044540.554631.172040.000000
Education−0.304600.1631423.48592−0.624350.015160.061893
Socio-economic status0.143750.0680104.467600.010450.277050.034543
Using car (shopping)−0.818850.22443313.31158−1.25873−0.378960.000264
Scale1.000000.000000 1.000001.00000
Disclaimer/Publisher’s Note: The statements, opinions and data contained in all publications are solely those of the individual author(s) and contributor(s) and not of MDPI and/or the editor(s). MDPI and/or the editor(s) disclaim responsibility for any injury to people or property resulting from any ideas, methods, instructions or products referred to in the content.

