Article

Empirical Degradation Models of the Different Indexes of the Proton Exchange Membrane Fuel Cell Based on the Component Degradation

1
School of Automotive Studies, Tongji University, Shanghai 201804, China
2
School of Intelligent Manufacturing, Shanghai Zhongqiao Vocational and Technical University, Shanghai 201514, China
3
Shanghai TXJS Engineering Technology Co., Ltd., Shanghai 201804, China
4
Chinesisch-Deutsches Hochschulkolleg, Tongji University, Shanghai 201804, China
*
Authors to whom correspondence should be addressed.
Energies 2023, 16(24), 8012; https://doi.org/10.3390/en16248012
Submission received: 13 November 2023 / Revised: 1 December 2023 / Accepted: 10 December 2023 / Published: 11 December 2023
(This article belongs to the Special Issue Research and Development of Proton Exchange Membrane Fuel Cells)

Abstract

:
To describe the degradation of proton exchange membrane fuel cells (PEMFCs), empirical degradation models of different indexes of PEMFCs are established. Firstly, the simulation process and assumptions of PEMFC degradation are proposed. Secondly, the degradation simulation results including the performance and distribution indexes under the different degradation levels are conducted by AVL FIRE M. Finally, the empirical degradation models of performance and distribution indexes are established based on the above simulation results and experimental data. The results show that the relationship between the experimental and simulation results is established by the index of current density. The empirical degradation models of current density, average equilibrium potential on the cathode catalyst layer (CL), average membrane water content, average oxygen molar concentration on the cathode CL, and average hydrogen crossover flux are the linear function. The empirical degradation models of average exchange current density on the anode CL, average hydrogen molar concentration on the anode CL, and average oxygen crossover flux are the quadratic function. The empirical degradation model of average activation overpotential on the cathode CL is the quintic function.

1. Introduction

In recent years, with the continuous intensification of the greenhouse effect, climate change has been widely recognized as an international problem [1]. About 40% of global CO2 emissions in 2014 were related to industries of electricity and heat production according to the International Energy Agency [2]. The carbon emissions of China account for about 30% of the global total in 2018 [3]. The Chinese government proposed the goal of achieving a carbon emissions peak by 2030 and striving to realize carbon neutrality by 2060 [4,5,6]. Therefore, to achieve the task of carbon neutrality, it is necessary to simultaneously advance from three aspects: formulating relevant policies, adjusting industrial structure, and developing new energy technologies [7]. Among them, in terms of developing new energy technologies, the proportion of new energy sources such as wind energy, solar energy, hydro energy, and hydrogen energy should be improved in the entire energy structure. Taking the field of power generation as an example, the above-mentioned new energy sources can be used to replace traditional thermal power generation, which can greatly reduce CO2 emissions. However, solar and wind energy sources are intermittent, opening spatial and temporal gaps between the availability of the energy and its consumption by end users [8]. To address these issues, it is necessary to develop suitable energy storage systems for the power grid, which further increases the operation complexity. The proton exchange membrane fuel cell (PEMFC) has the advantages of zero emissions, high efficiency, easy placement, good portability, and low noise [9], and it is considered one of the most promising technologies in the field of alternative power generation equipment. However, its high cost, relatively short service life, and significant performance degradation limit the large-scale commercial application of the PEMFC in the power generation field [10,11]. It is necessary to establish the PEMFC degradation model to describe its degradation and control the PEMFC system.
There is currently limited research on PEMFC degradation models, mainly due to two reasons: Firstly, the degradation mechanisms of PEMFC components are not yet clear, and it is extremely difficult to measure their internal parameters. This makes it difficult to accurately model the degradation of PEMFCs. Several catalyst characteristics such as X-ray diffraction patterns, BET measurements, FTIR spectroscopic studies, and SEM and TEM images were conducted [12,13]. Secondly, experimentation is time consuming and extremely high cost, and the PEMFC stack operation conditions of different types vary. This results in a complex durability testing process. The existing durability experimental objects are basically the single PEMFC with a small area or low power stack consisting of a few single PEMFCs. Based on the limitations of the above conditions, the current research on PEMFC degradation models is mainly focused on a single component of PEMFCs, while there is little research on the degradation model involving a single cell/stack.
Nafion as an outstanding representative of perfluorinated sulfonic acid membranes is widely adopted as a consequence of its superior chemical stability and extremely high ionic conduction. The pinholes and cracks usually occur during the early operating stages. They may cause reactant crossover or the direct combustion of hydrogen and oxygen. The excessive pressure difference on both sides of the PEM can also damage it. Karpenko-Jereb et al. [14] proposed an empirical model of membrane degradation. When the voltage is V t , the degradation rate of the membrane is shown in Equation (1).
r c u r r V t = r r e f 1.12 V t 0.06 a 0 + a 1 T c u r r + a 2 R H c u r r + a 3 + a 4 / ln L P E M _ c u r r a 0 + a 1 T r e f + a 2 R H r e f + a 3 + a 4 / ln L P E M _ r e f
where r r e f is the degradation rate of the membrane under reference operating conditions, 1/h; V t is the single PEMFC voltage at the time of t , V; a 0 is the regression constant; a 1 is the temperature partial regression coefficient; T c u r r and T r e f are the temperatures of the current time and reference value, K; R H c u r r and R H r e f are the RH of the current time and reference value; a 2 is the RH partial regression coefficient; a 3 is the hydrogen pressure partial regression coefficient; a 4 is the partial regression coefficient of the proton exchange membrane (PEM) thickness; and L P E M _ c u r r and L P E M _ r e f are the PEM thickness of the current time and reference value, μm.
The thickness and conductivity models of the PEM are shown in Equations (2) and (3), respectively.
L P E M t = L P E M 0 1 t · r c u r r V t
σ P E M t = σ P E M 0 1 t · r c u r r V t
where L P E M 0 is the PEM thickness at time 0, μm; σ P E M 0 is the conductivity of the membrane at time 0, S/m; and t is the operation time, h.
Chandesris et al. [15] proposed a model of the fluorine release rate shown in Equation (4).
v F t = A 1 Δ p O 2 p 0 L P E M 0 L P E M ( t ) exp α e q F R T V t exp E a c t R 1 T 1 T r e f
where A 1 is an adjustable constant, Δ p O 2 = p O 2 c a t p O 2 a n o is the oxygen partial pressure difference at the inlet of PEMFC, bar; p 0 = 1   b a r is the reference pressure, L P E M ( t ) and L P E M ( 0 ) are the PEM thickness at time t and 0, μm; F = 96485   C / m o l is the Faraday constant, R is the ideal gas constant, J/(mol·K); T is the stack temperature, K; V t is the PEMFC voltage, V; α e q is the equivalent transfer coefficient, E a c t is the activation energy, J; and T r e f = 368.15   K is the reference temperature.
Moreover, they proposed a model of the PEM thickness degradation rate shown in Equation (5).
d L P E M t d t = A 2 v F t 1 ω ρ N
where A 2 is an adjustable constant, ρ N is the density of the dry Nafion membrane, ω is the mass fraction of the fluorine in the Nafion membrane.
Robin et al. [16] proposed a Pt dissolution model, and the dissolution rate and average radius reduction rate of Pt particles are shown in Equations (6) and (7), respectively.
v d i s s = k e x p Δ G s + Δ G e l e c + Δ G d e s R T F C
d r d t = v d i s s M P t ρ P t
where Δ G s is the free enthalpy required to extract Pt atoms; Δ G e l e c is the free enthalpy of Pt atomic oxidation; Δ G d e s is the free enthalpy required for the precipitation of Pt ions; M P t is the Pt molar mass, kg/mol; and ρ P t is the Pt density, kg/m3.
Moein-Jahromi et al. [17] proposed the empirical and mechanistic models for electrochemical surface area (ECSA) reduction.
The empirical model for ECSA reduction is shown in Equation (8).
S N = E C S A N E C S A N = 0 = S m i n + 1 S m i n e x p K D N
where S m i n = E C S A m i n E C S A N = 0 , K D = K S C × K T × K R H × K V is the ECSA reduction factor, K S C is the standard condition correction coefficient, K T is the temperature correction coefficient, K R H is the RH correction coefficient, K V is the cycle loading correction factor, and N is the cycle number.
The mechanistic model for ECSA reduction is shown in Equation (9).
S t = S m i n + 1 S m i n × E C S A t E C S A 0 = S m i n + 1 S m i n × D ¯ P t _ d t 2 D ¯ P t _ O R t 3 × D ¯ P t _ d 0
where D ¯ P t _ d t and D ¯ P t _ O R t represent the degree of Pt dissolution and Ostwald ripening (OR), respectively.
The Pt dissolution model is shown in Equations (10) and (11).
d D ¯ P t _ d t d t = v d M P t ρ P t
v d = k 1 θ P t exp 2 1 α 1 F V F C V 1 R T F C + k 2 exp 2 1 α 2 F V F C V 2 ω θ P t O R T F C
The OR model is shown in Equations (12) and (13).
d D ¯ P t _ O R t d t = v O R M P t ρ P t
v O R = k 1 θ P t c P t 2 + c r e f exp 2 α 1 F V F C V 1 R T F C + k 2 θ P t O c H + 2 c r e f 2 exp 2 α 2 F V F C V 2 R T F C
The above previous research is mainly focused on several micro indexes such as PEM thickness and conductivity, Pt dissolution and OR, as well as ECSA reduction, and the research on the micro indexes is not yet comprehensive. Only some indexes of the PEM and catalyst layer (CL) have been studied, and there is a lack of research on the degradation indexes of the gas diffusion layer (GDL) and bipolar plate (BP). At the same time, there is a lack of research on macroscopic indexes such as the voltage and power of PEMFCs. In general, the micro indexes are used for the mechanism analysis, while macro indexes are used for the system control. Therefore, it is necessary to study the degradation model of PEMFC macro indexes to design control systems. Furthermore, it is necessary to have abundant micro indexes characterizing PEMFC degradation to more comprehensively reflect the degradation of PEMFCs. It is noted that the operating conditions, namely the operating temperature, reactant flow rate, pressure, and temperature, are also an important factor affecting PEMFC degradation. However, this paper focuses on the influence of four components of PEMFCs on the performance degradation. Therefore, the operating temperatures of the experiment and simulation are a constant.

2. Simulation of PEMFC Degradation

Based on the previous research [18], the performance and distribution indexes of PEMFCs under different degradation levels are conducted by AVL FIRE M. It should be noted that the simulation only attains the degradation level and not the operation time. Therefore, the operation time is obtained by the experiments. Based on the comprehensive simulation and experimental results, the relationship between the operation time in the experimental data and the degradation levels in the simulation results is obtained using the index of current density. Moreover, the empirical degradation models of PEMFC performance and distribution indexes are established, which can characterize the relationship between the operation time of PEMFCs and the degradation level of corresponding indexes.

2.1. Simulation Process and Assumptions

The simulation process of PEMFCs under different degradation levels is shown in Figure 1. Firstly, the degradation level (k) of the PEMFC is determined. k = 0 indicates that the PEMFC is in a non-degradation state, k = 1, 2, …, N indicates that the percentage of PEMFC degradation is 1%, 2%, …, N%, respectively. This parameter determines the core parameter changes of each component, and it is needed to modify the relevant core parameters of each component before each simulation process to achieve a simulation of the different degradation levels of the PEMFC. After completing the simulation of each degradation situation, the results are exported and processed, and the whole simulation process ends when the N simulation processes are completed.
The assumptions of PEMFC degradation simulation are as follows:
(a)
Assuming that each component of the PEMFC undergoes synchronous degradation, i.e., PEM, CL, GDL, and BP are degraded at the same percentage when the PEMFC is operating.
(b)
Assuming synchronous degradation of each component parameter, the PEMFC exhibits the most severe degradation.
(c)
Assuming that the PEMFC operates at a constant current, all auxiliary subsystems can operate stably. The flow rate, pressure, and temperature of reactants (hydrogen and air), coolant flow rate, and DC/DC load current can remain unchanged.

2.2. Parameters of Each Component under Different Degradation Levels

The parameters of the PEM are shown in Table 1. The electro-osmotic drag coefficient, ionic conductivity, and water diffusion coefficient show a downward trend, while thermal conductivity shows an upward trend with the degradation of the PEMFC.
The parameters of the CL under different degradation levels are shown in Table 2. The electrical conductivity, ionomer film thickness, and electrolyte volume fraction show a downward trend, while the agglomerate radius, average pore diameter, porosity, and thermal conductivity show an upward trend with the degradation of the PEMFC.
The parameters of the GDL under the different degradation levels are shown in Table 3. The average pore diameter, porosity, and thermal conductivity show an upward trend with the degradation of the PEMFC.
The parameters of the BP under different degradation levels are shown in Table 4. The electrical conductivity shows a downward trend with the degradation of the PEMFC.

3. Results and Discussion

This section provides the simulation results of the different indexes and the empirical degradation models based on the different indexes. It is noted that the current density of the experiment and simulation is the key index to establish the empirical degradation models of other indexes because it can establish the relationship between the operation time and degradation level of the PEMFC.

3.1. Empirical Degradation Models of the Performance Indexes

The performance indexes include current density, activation overpotential at the cathode CL, equilibrium potential at the cathode CL, and exchange current density at the anode CL. It should be noted that the experimental data are from the IEEE PHM 2014 Data Challenge, and the detailed experimental test bench and aging test can be found in the previous work [19].

3.1.1. Empirical Degradation Model of Current Density

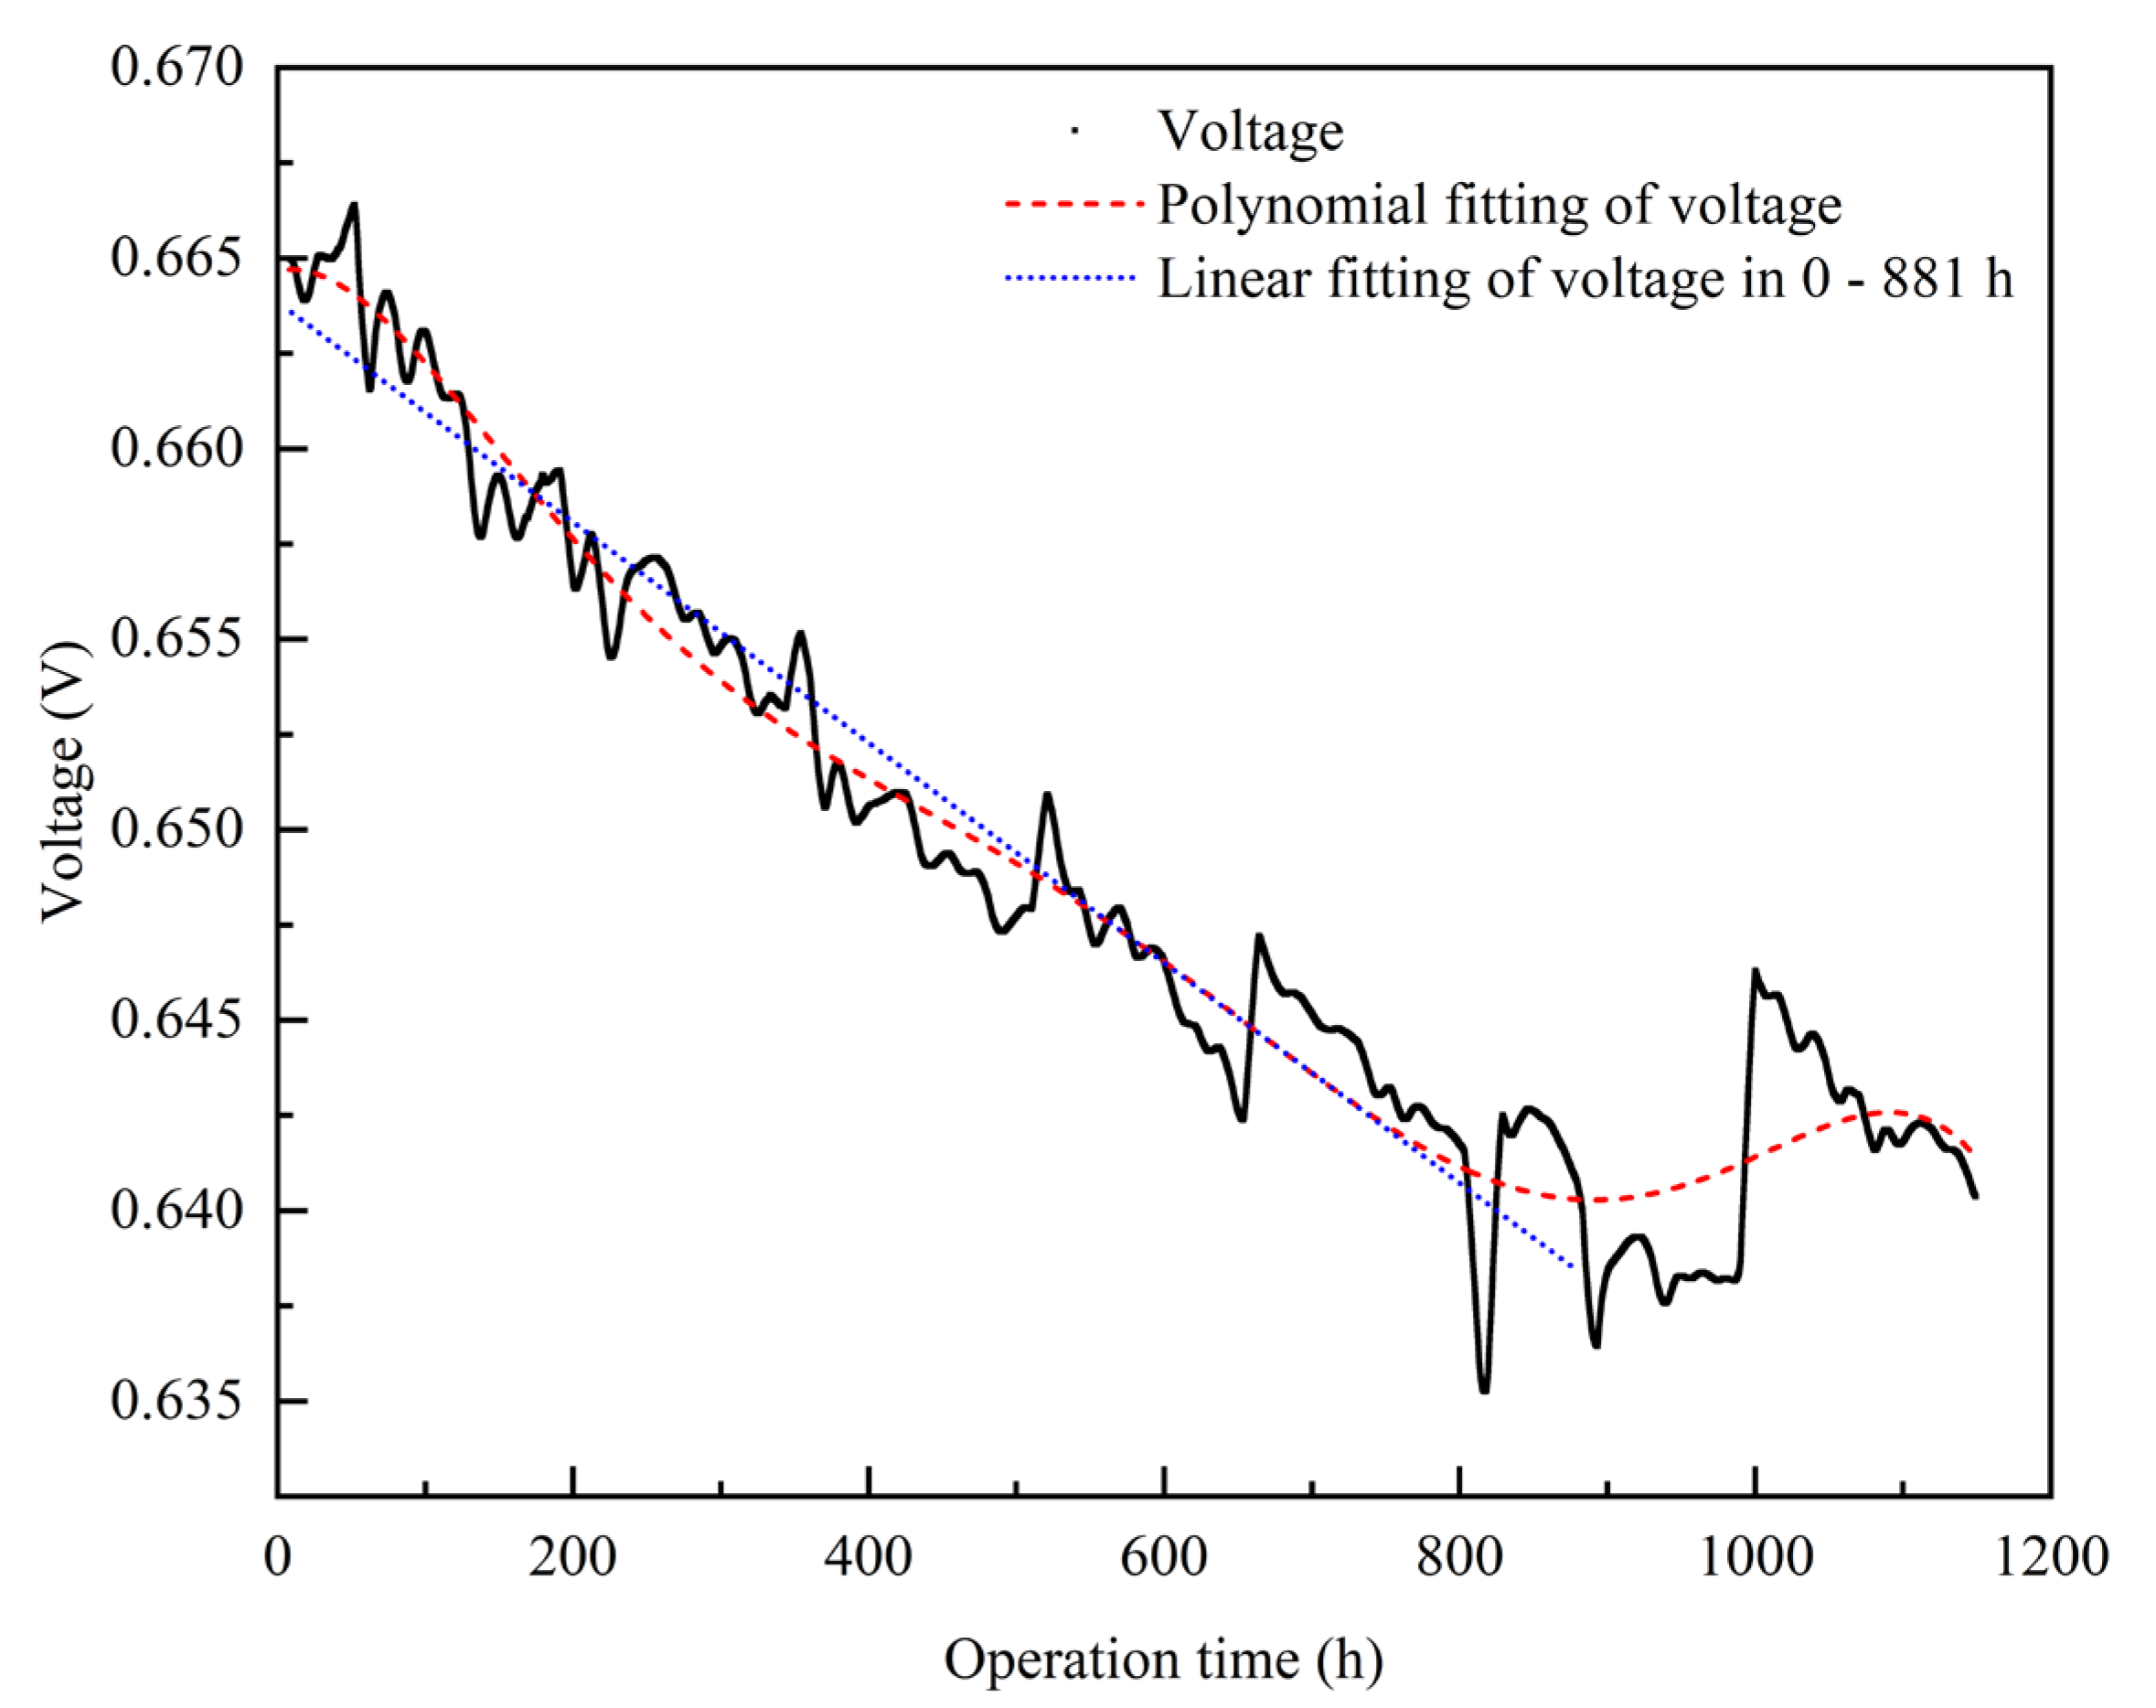
The average experimental voltage of a single PEMFC obtained by the PEMFC degradation experiment is shown in Figure 2. The polynomial fitting of the voltage (red line) is conducted, and it can be expressed as Equation (14). During the operation time of 8–881 h, the voltage of a single PEMFC decreases approximately linearly with the increase in operation time because there are small fluctuations in the reaction gas supply, loading current, and stack temperature during the experiment. Although there are small fluctuations, the overall decrease trend of the voltage is determined. However, during the operation time of 881–1154 h, the voltage improves due to the stopping and restarting of the PEMFC, which will continue to decrease with the increase in operation time. It is noted that the definition of PEMFC degradation is a monotonic decrease in PEMFC voltage when the reaction conditions and loading current remain constant. Therefore, only the experimental data of 8–881 h are used to establish the PEMFC empirical degradation model. The analysis of other indexes also only uses experimental data in this time period. Moreover, the voltage decrease of 8–881 h is basically linearly related to the operation time. The linear fitting of the voltage (blue line) is conducted, and it can be expressed as Equation (15).
V ¯ F C p t = 0.66466 + 8.69118 × 10 6 t 4.88312 × 10 7 t 2 + 1.9041 × 10 9 t 3 3.28571 × 10 12 t 4 + 2.61189 × 10 15 t 5 7.73906 × 10 19 t 6 , t [ 8 , 1154 ]
V ¯ F C l t = 0.66384 2.88987 × 10 5 t , t 8 , 881
where V ¯ F C p t is the polynomial fitting result of the average single PEMFC voltage, V; t is operation time, h; and V ¯ F C l t is the linear fitting results of the average single PEMFC voltage, V.
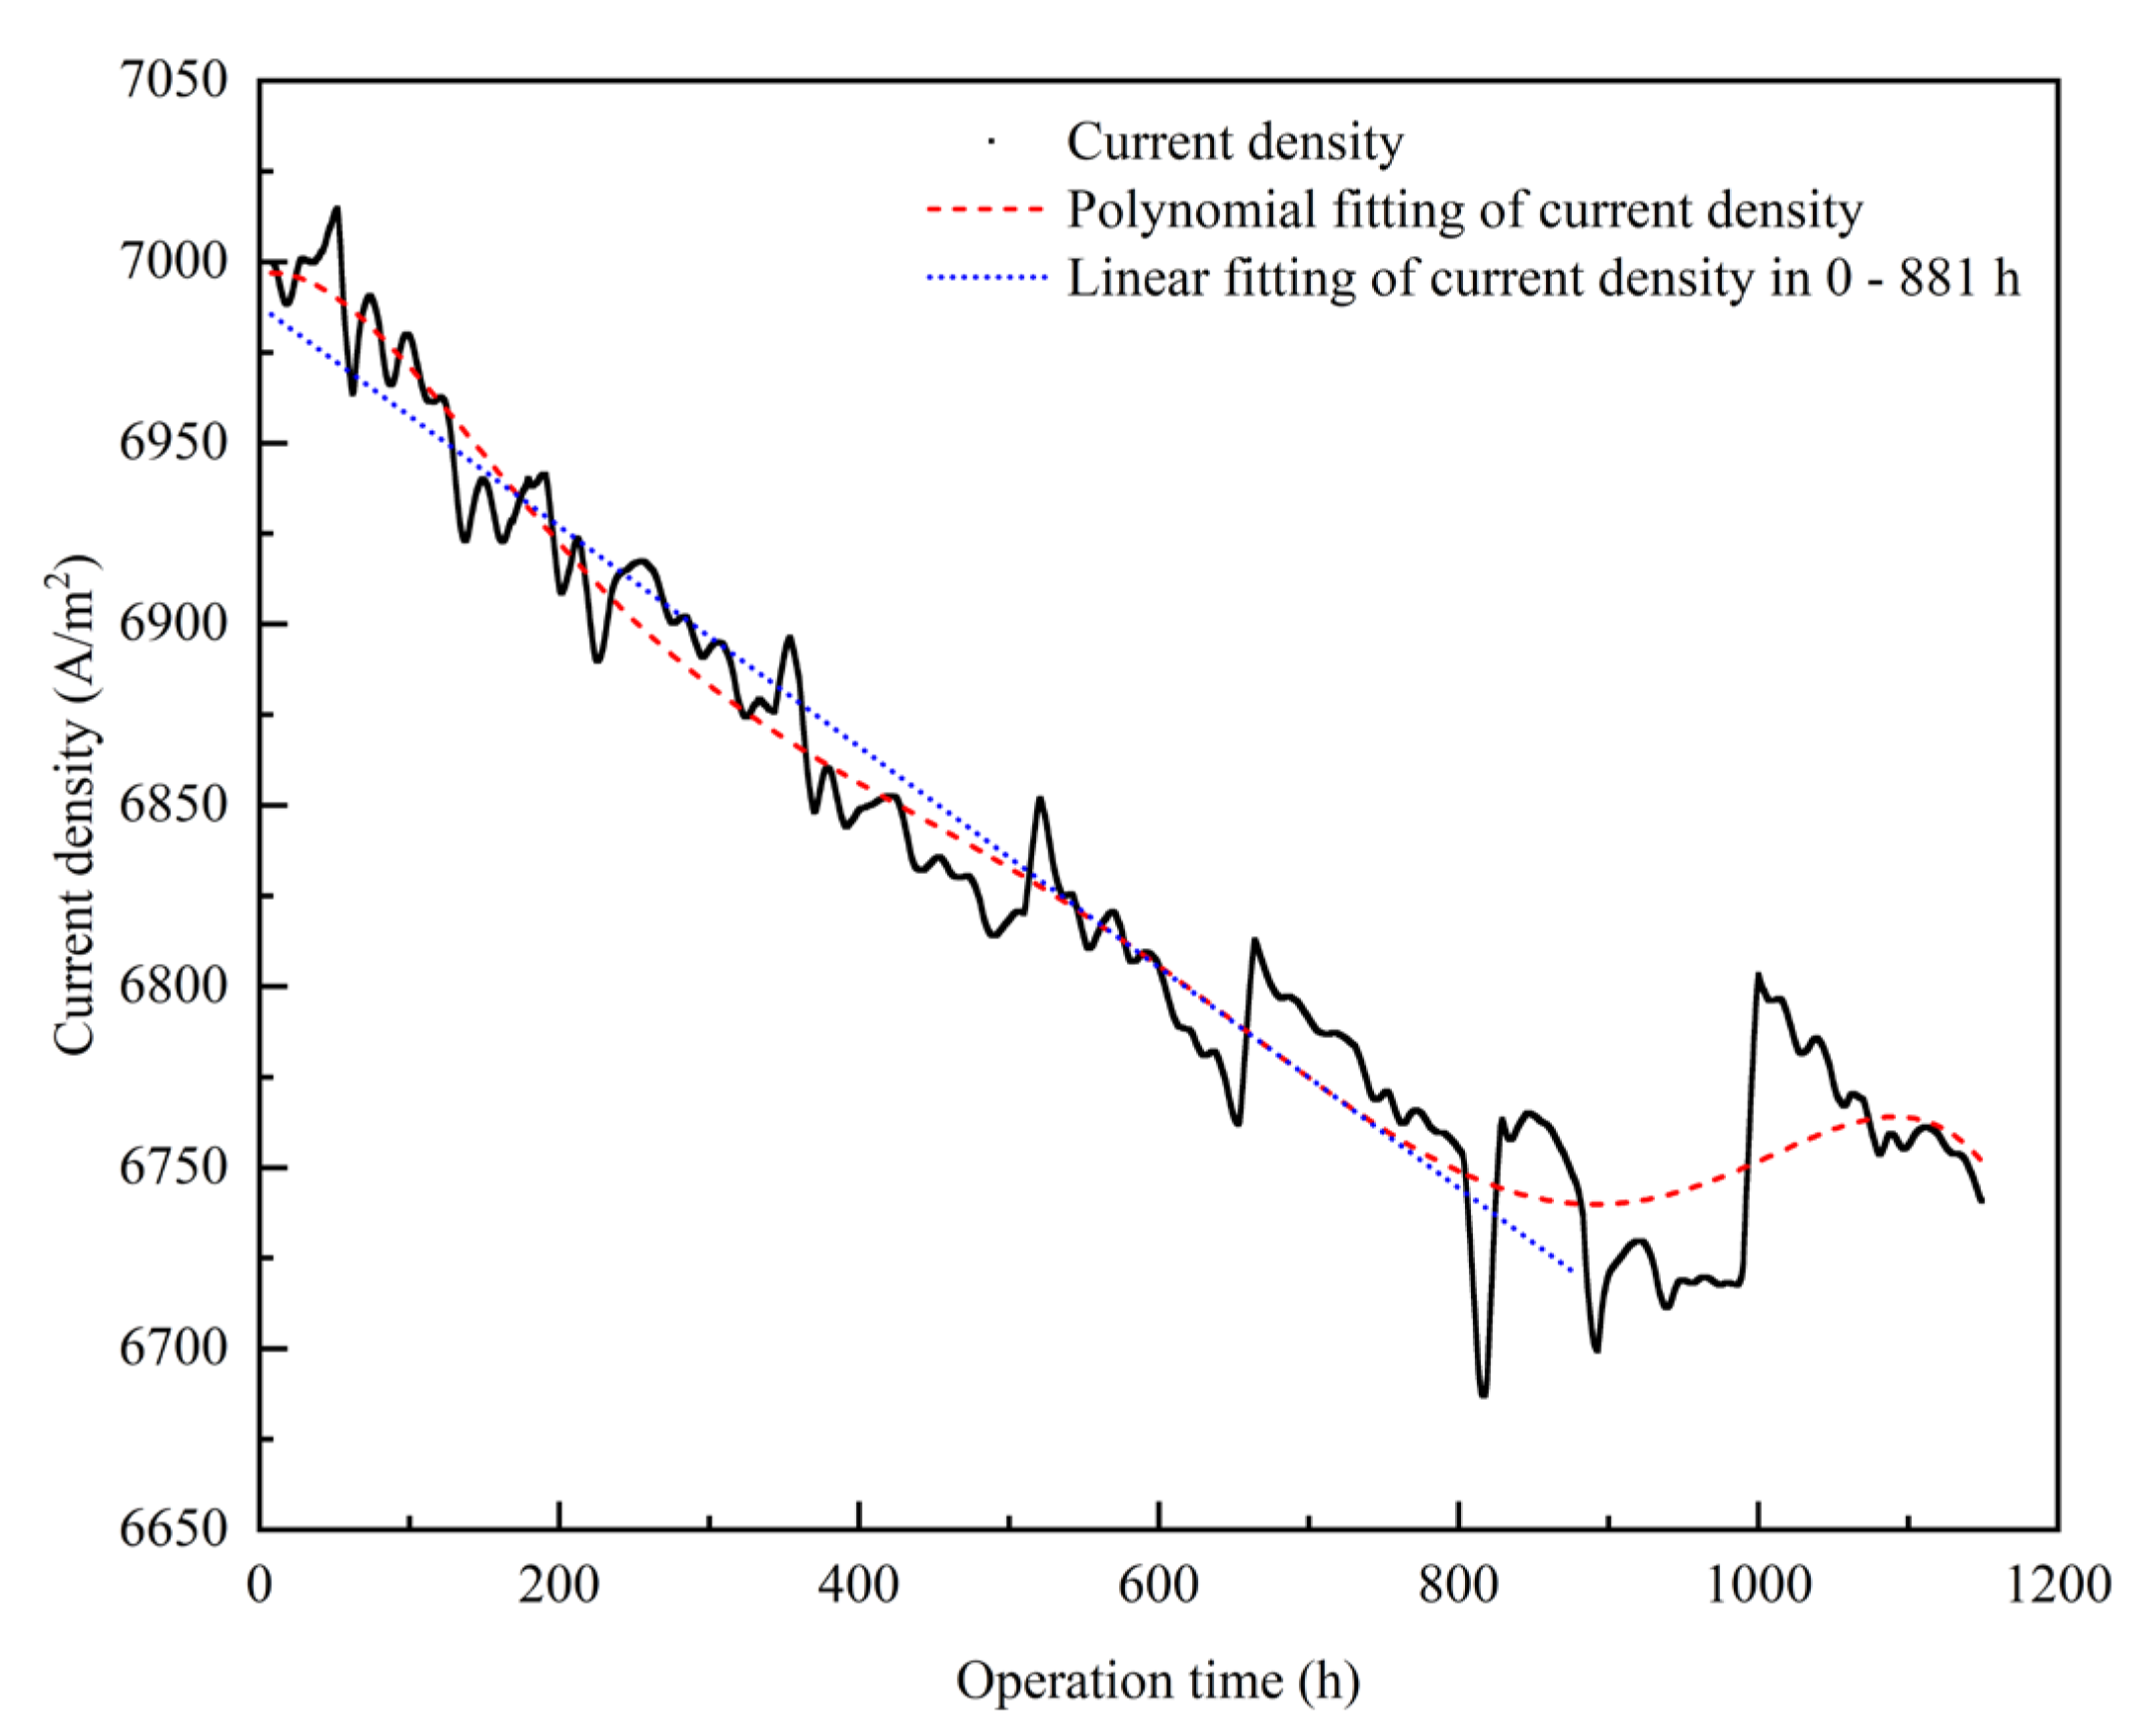
To compare with the simulation results, the voltage of the experiment needs to be converted to the current density, which is shown in Figure 3. The polynomial fitting of the current density (red line) is conducted, and it can be expressed as Equation (16). Furthermore, the linear fitting of the current density (blue line) is conducted, and it can be expressed as Equation (17). The current density decreased from 6985.5 A/m2 at a time of 0 to 6720.0 A/m2 at a time of 881 h, and the current density of the PEMFC decreased by 265.5 A/m2, which is 3.8% of the initial value. Therefore, the empirical degradation model of the current density under the loading current 70 A and corresponding reaction conditions during the 8–881 h is expressed in Equation (17).
i P E M F C p = 6996.45152 + 0.09149 t 0.00514 t 2 + 2.00431 × 10 5 t 3 3.45864 × 10 8 t 4 + 2.74936 × 10 11 t 5 8.14638 × 10 15 t 6 , t 8 , 1154
i P E M F C l = 6987.89188 0.3043 t , t 8 , 881
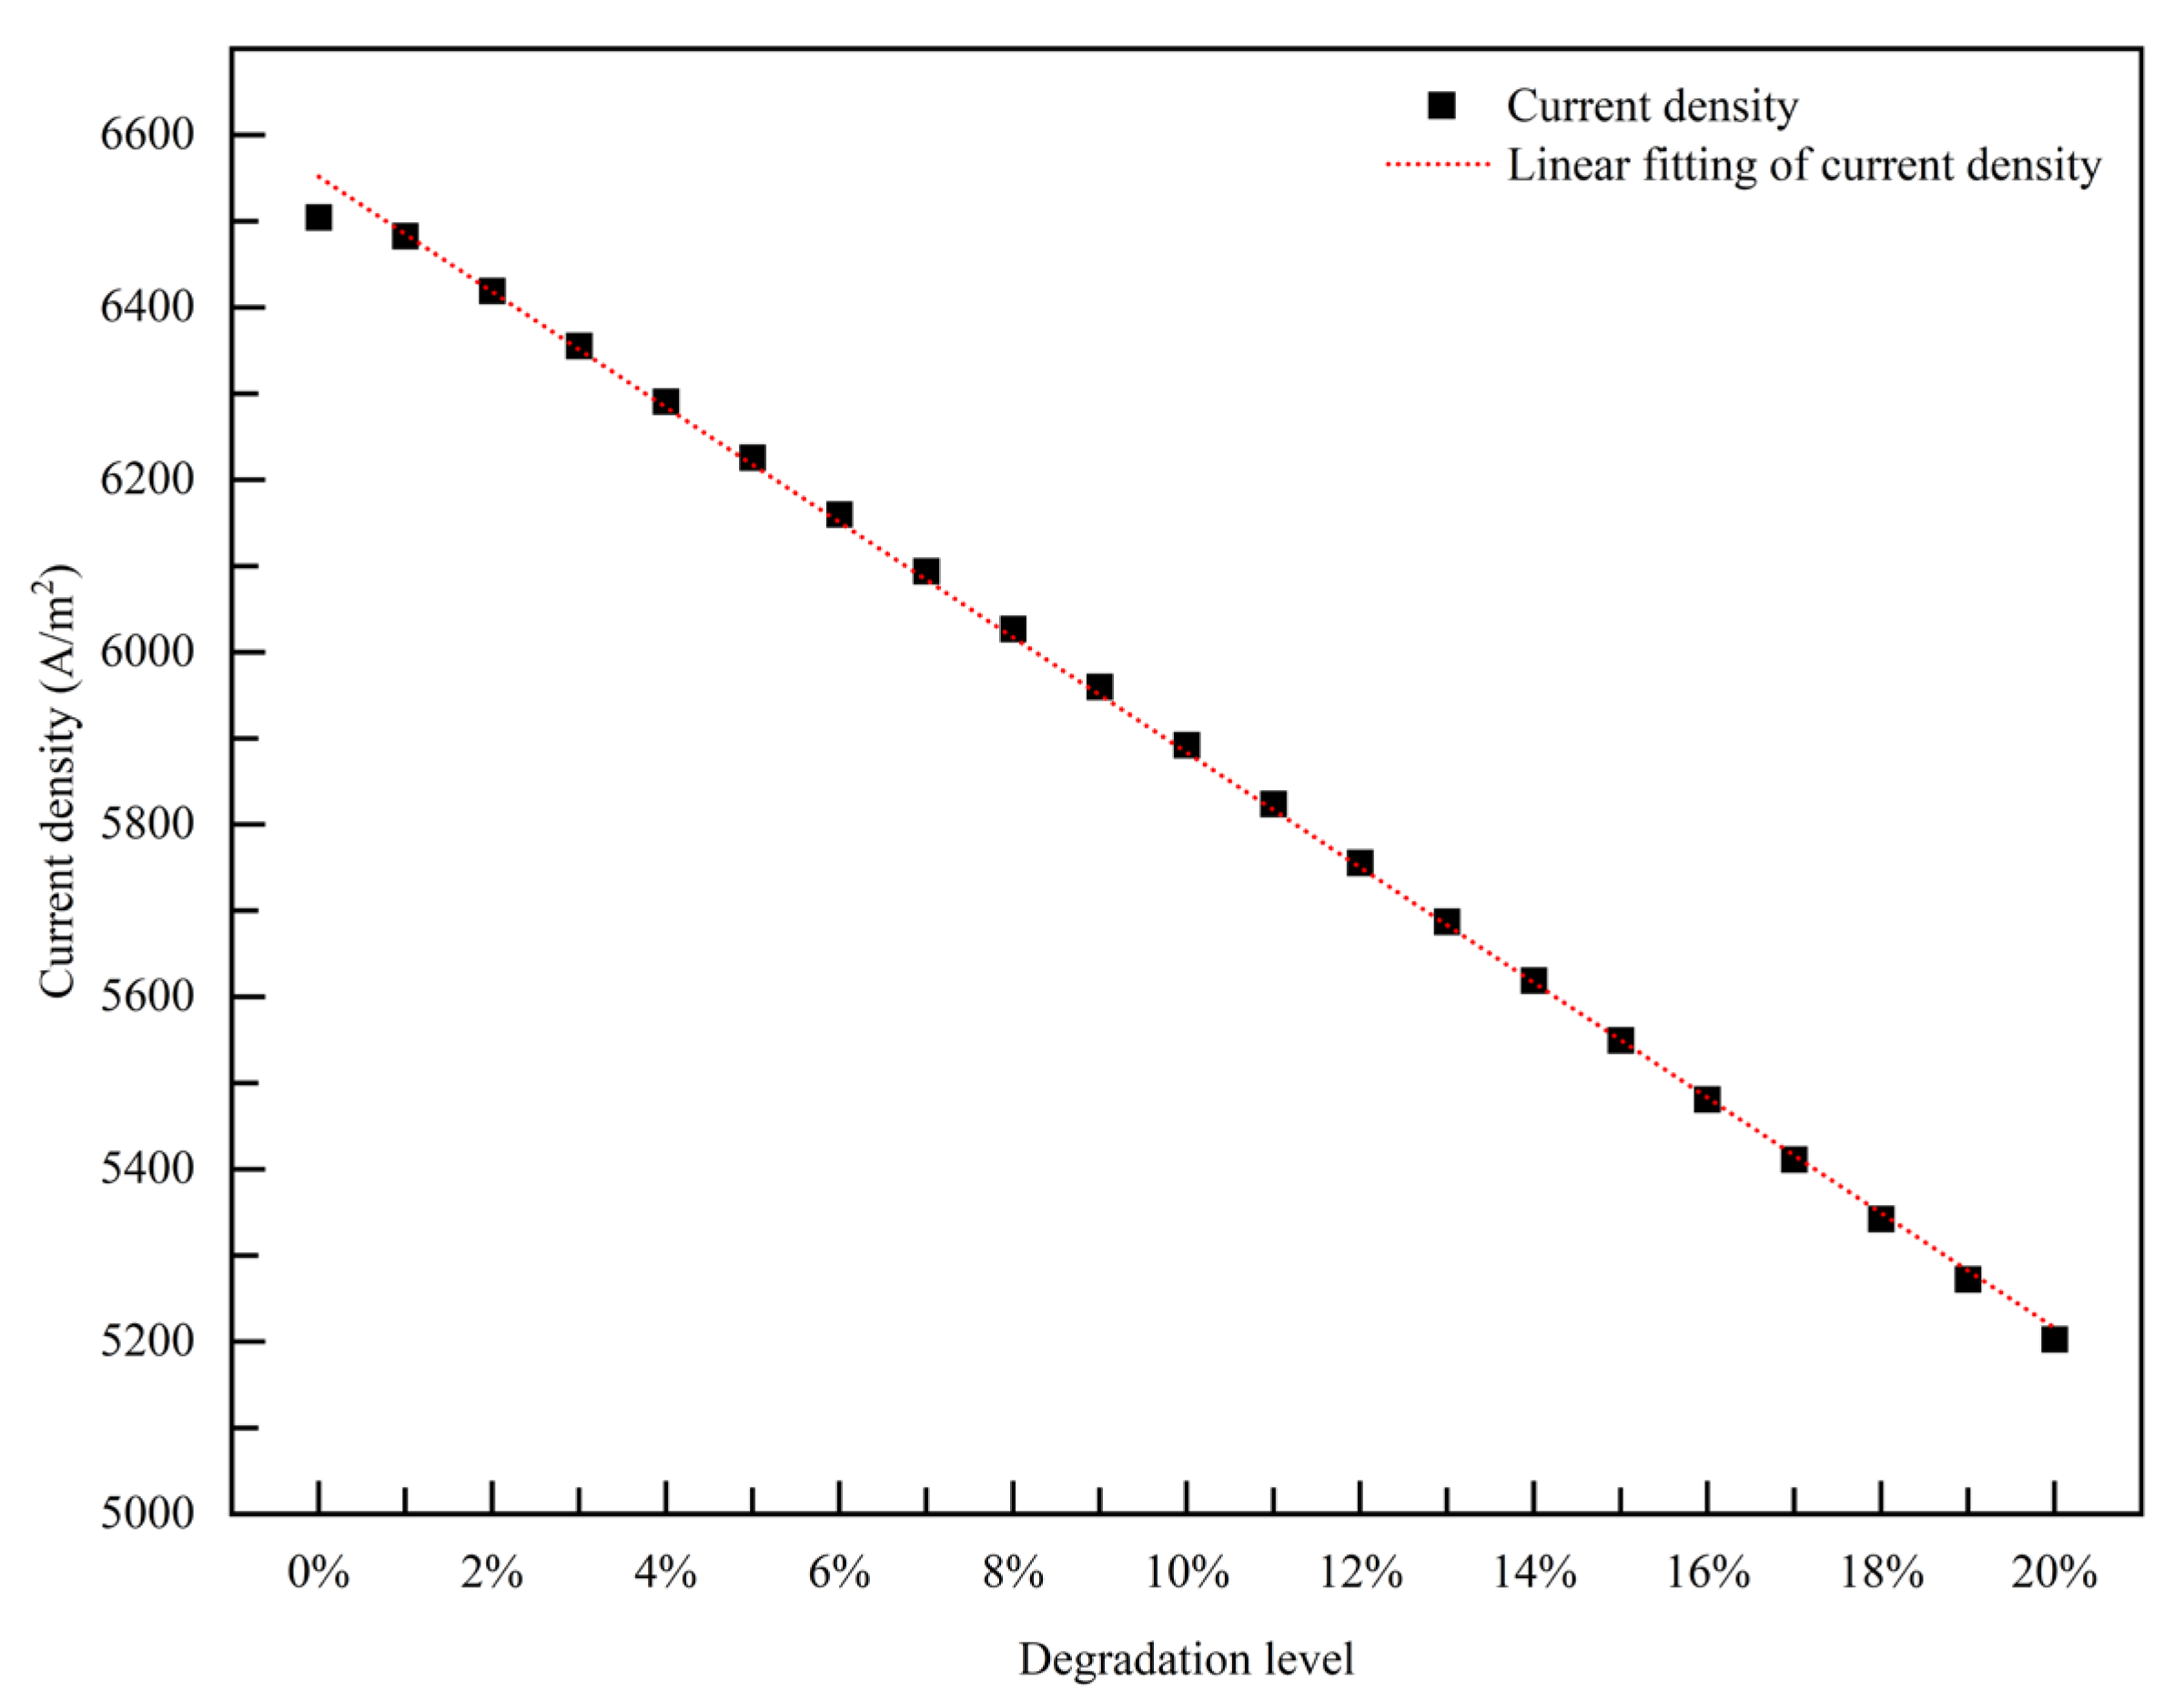
The simulation results of the current density under the different degradation levels are shown in Figure 4. The current density gradually decreases with the increase in the degradation level. The current density of the PEMFC is approximately linearly related to the degradation level ( D P E M F C ), which can be expressed as Equation (18). The initial current density of the simulation is 6551.6 A/m2, which is used as the reference value. After being decreased by 3.8% of the reference value, the current density is 6302.6 A/m2, as shown in Figure 4. The degradation level of the PEMFC corresponding to this value is 3.73%, which means that the PEMFC has degraded by 3.73% after running for 881 h at a loading current of 70 A and corresponding reaction conditions.
i P E M F C = 6551.63766 6678.66234 D P E M F C
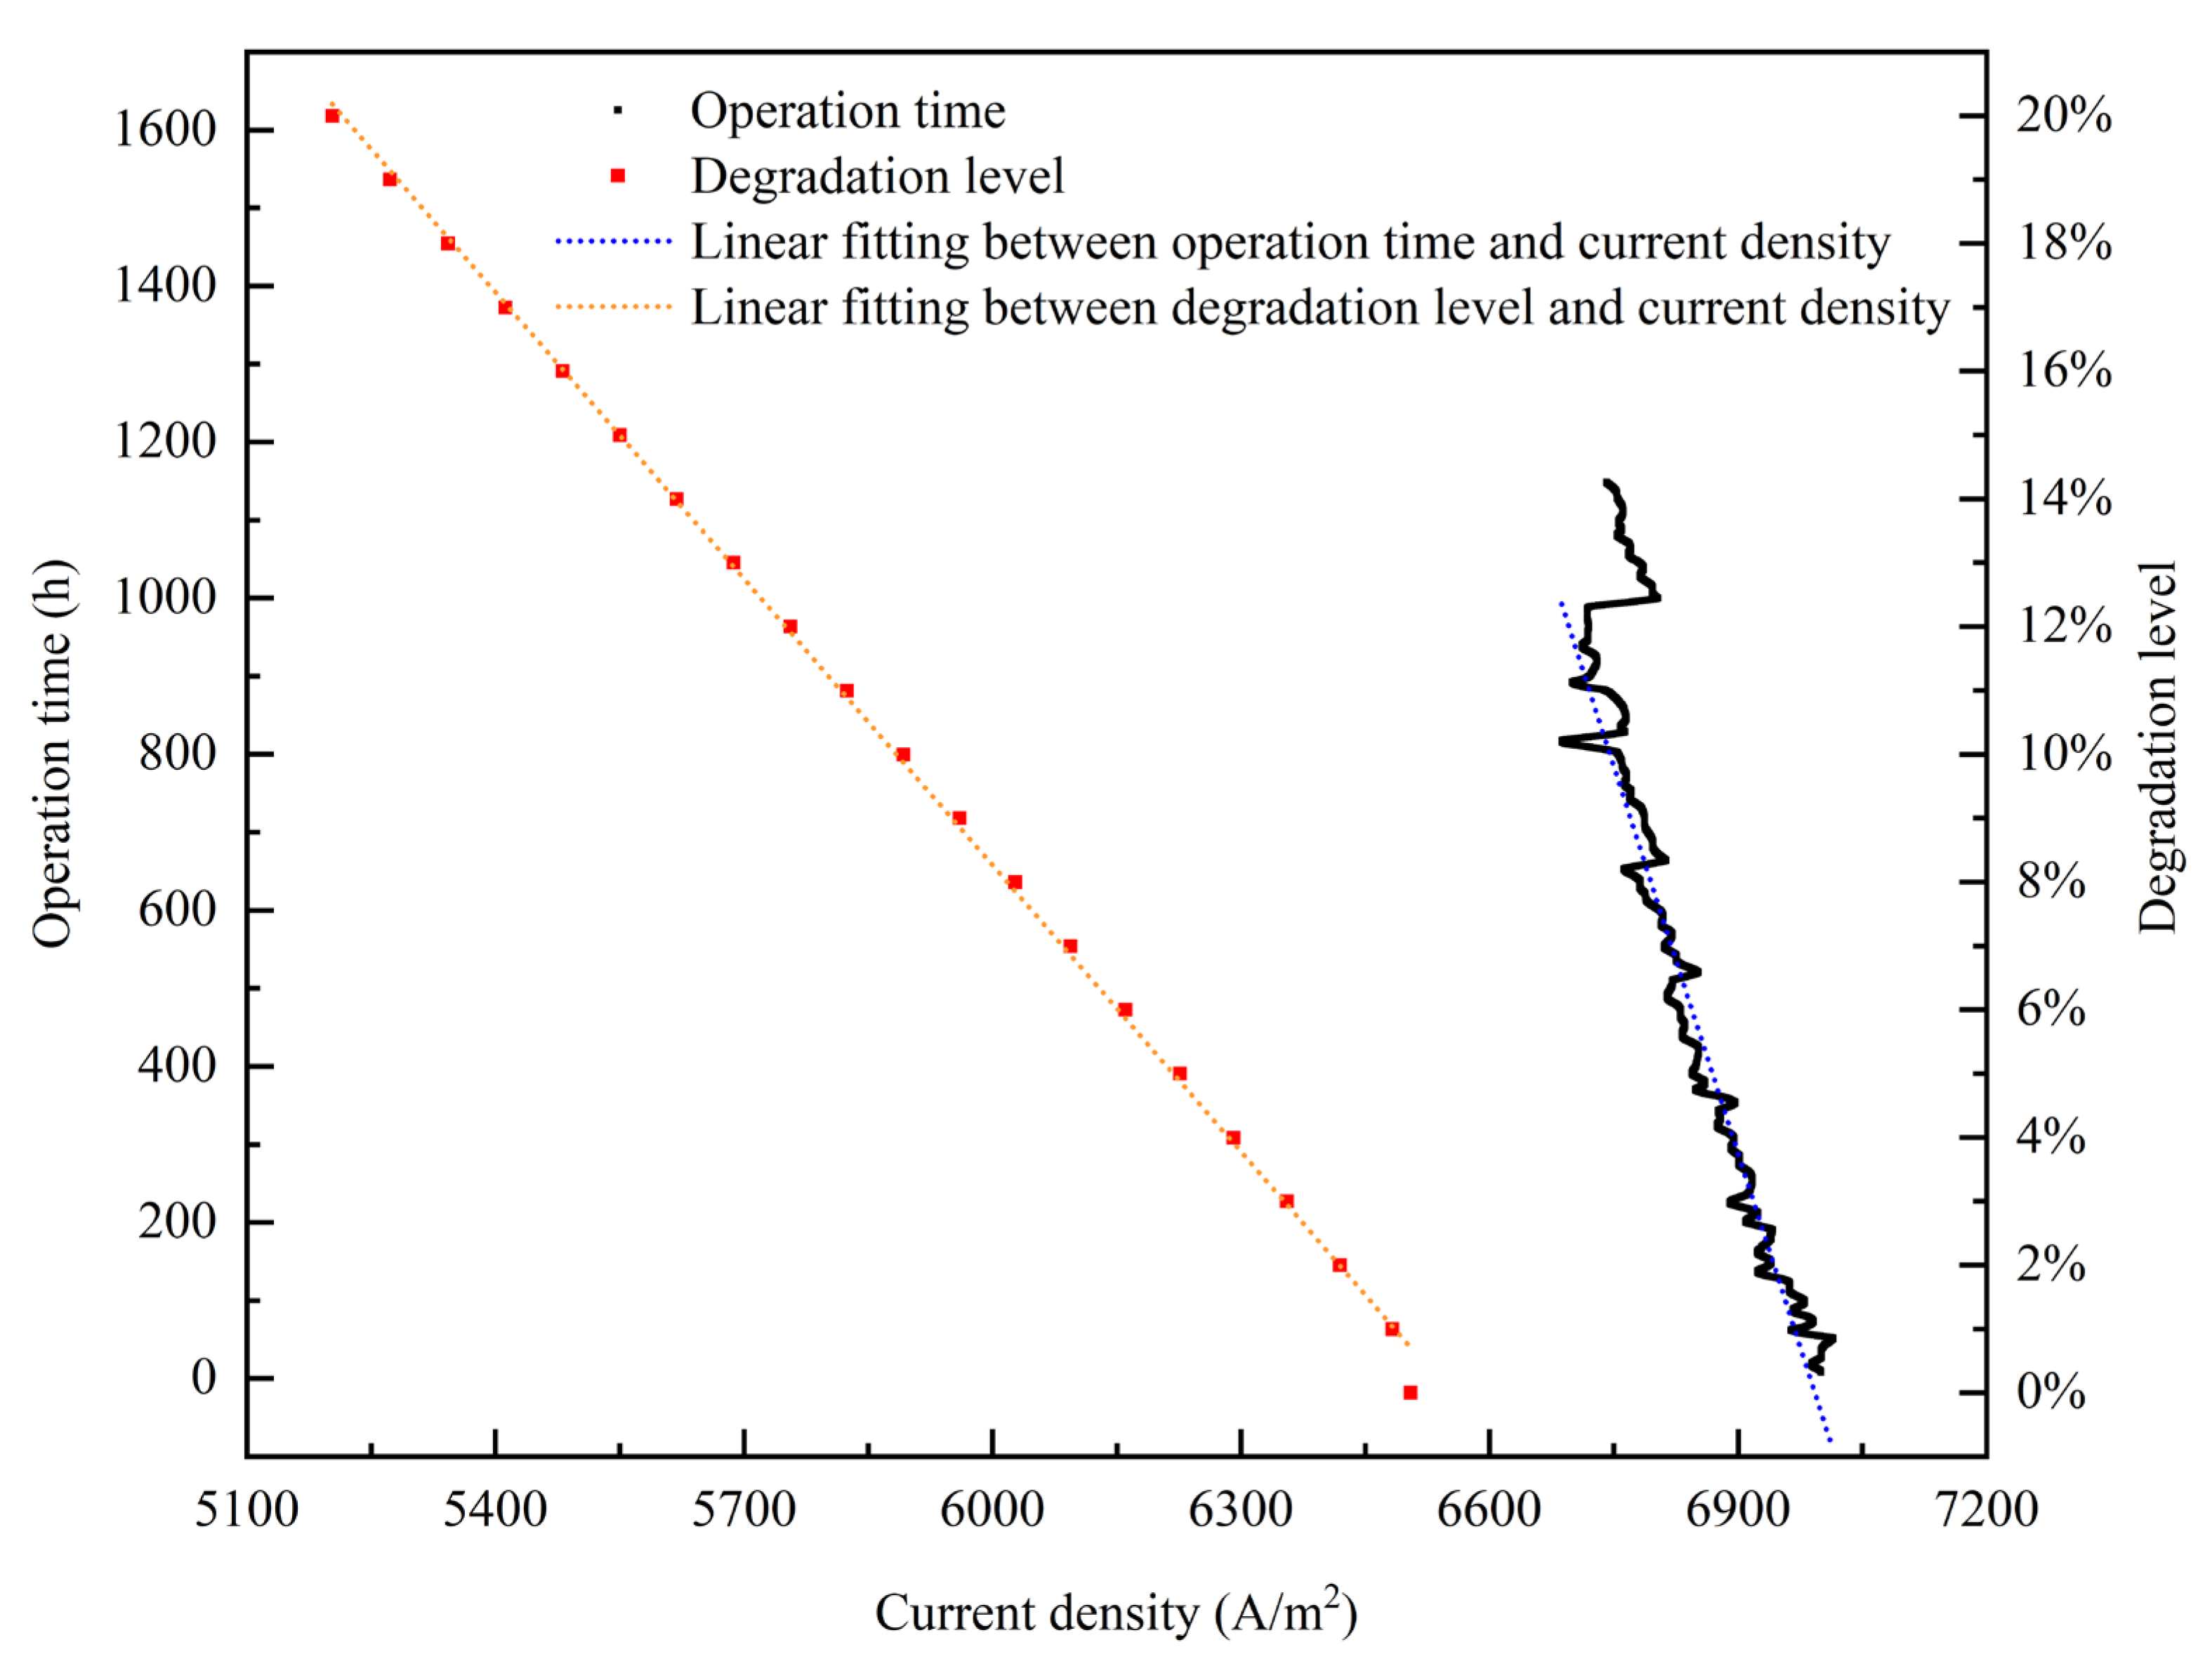
The simulation results can only obtain the relationship between the degradation level and various indexes, while the experimental results can only obtain the relationship between the operation time and the index of current density. The empirical degradation models of other indexes are established by the index of current density because both simulation and experimental results have the index of current density. The relationship between the degradation level of the PEMFC and the operation time is shown in Figure 5. The black dots represent the relationship between the current density degradation and the operation time obtained from the experiment shown in Figure 3, and the blue line represents the linear fitting between the operation time and current density shown in Equation (19). The red dots represent the relationship between the current density degradation and the degradation level obtained from the simulation, as shown in Figure 4, and the orange line represents a linear fitting between the degradation level and the current density shown in Equation (20). The relationship between the degradation level of the PEMFC and the operation time can be established by the current density, which serves as the basis for the analysis of other indexes. For example, the first step is to determine the operation time of the PEMFC, and the second step is to determine its degradation level. Firstly, the current density of the PEMFC is obtained from the experiment, and the operation time is determined based on the blue line. Then, the degradation level is determined by dividing the current density at the current time by the initial current density and multiplying the obtained degradation level by the initial value of the simulation results, and the degradation level is determined based on the orange line. It should be noted that the corresponding operation time of each index is the same as the corresponding operation time of the index of current density because each index is calculated from the same set of component-related parameters. Therefore, the corresponding relationship between the operation time and the degradation level is brought into the expression of each index to obtain the empirical degradation model of each index.
t = 23095.72347 3.30544 i P E M F C , i P E M F C 6719.9 , 6985.4
D P E M F C = 0.98015 1.49589 × 10 4 i P E M F C , i P E M F C 5202.9 , 6551.6
The relationships between the degradation level and the operation time are shown in Equations (21) and (22).
D P E M F C = f t
t = f 1 D P E M F C

3.1.2. Empirical Degradation Model of Average Activation Overpotential at the Cathode CL

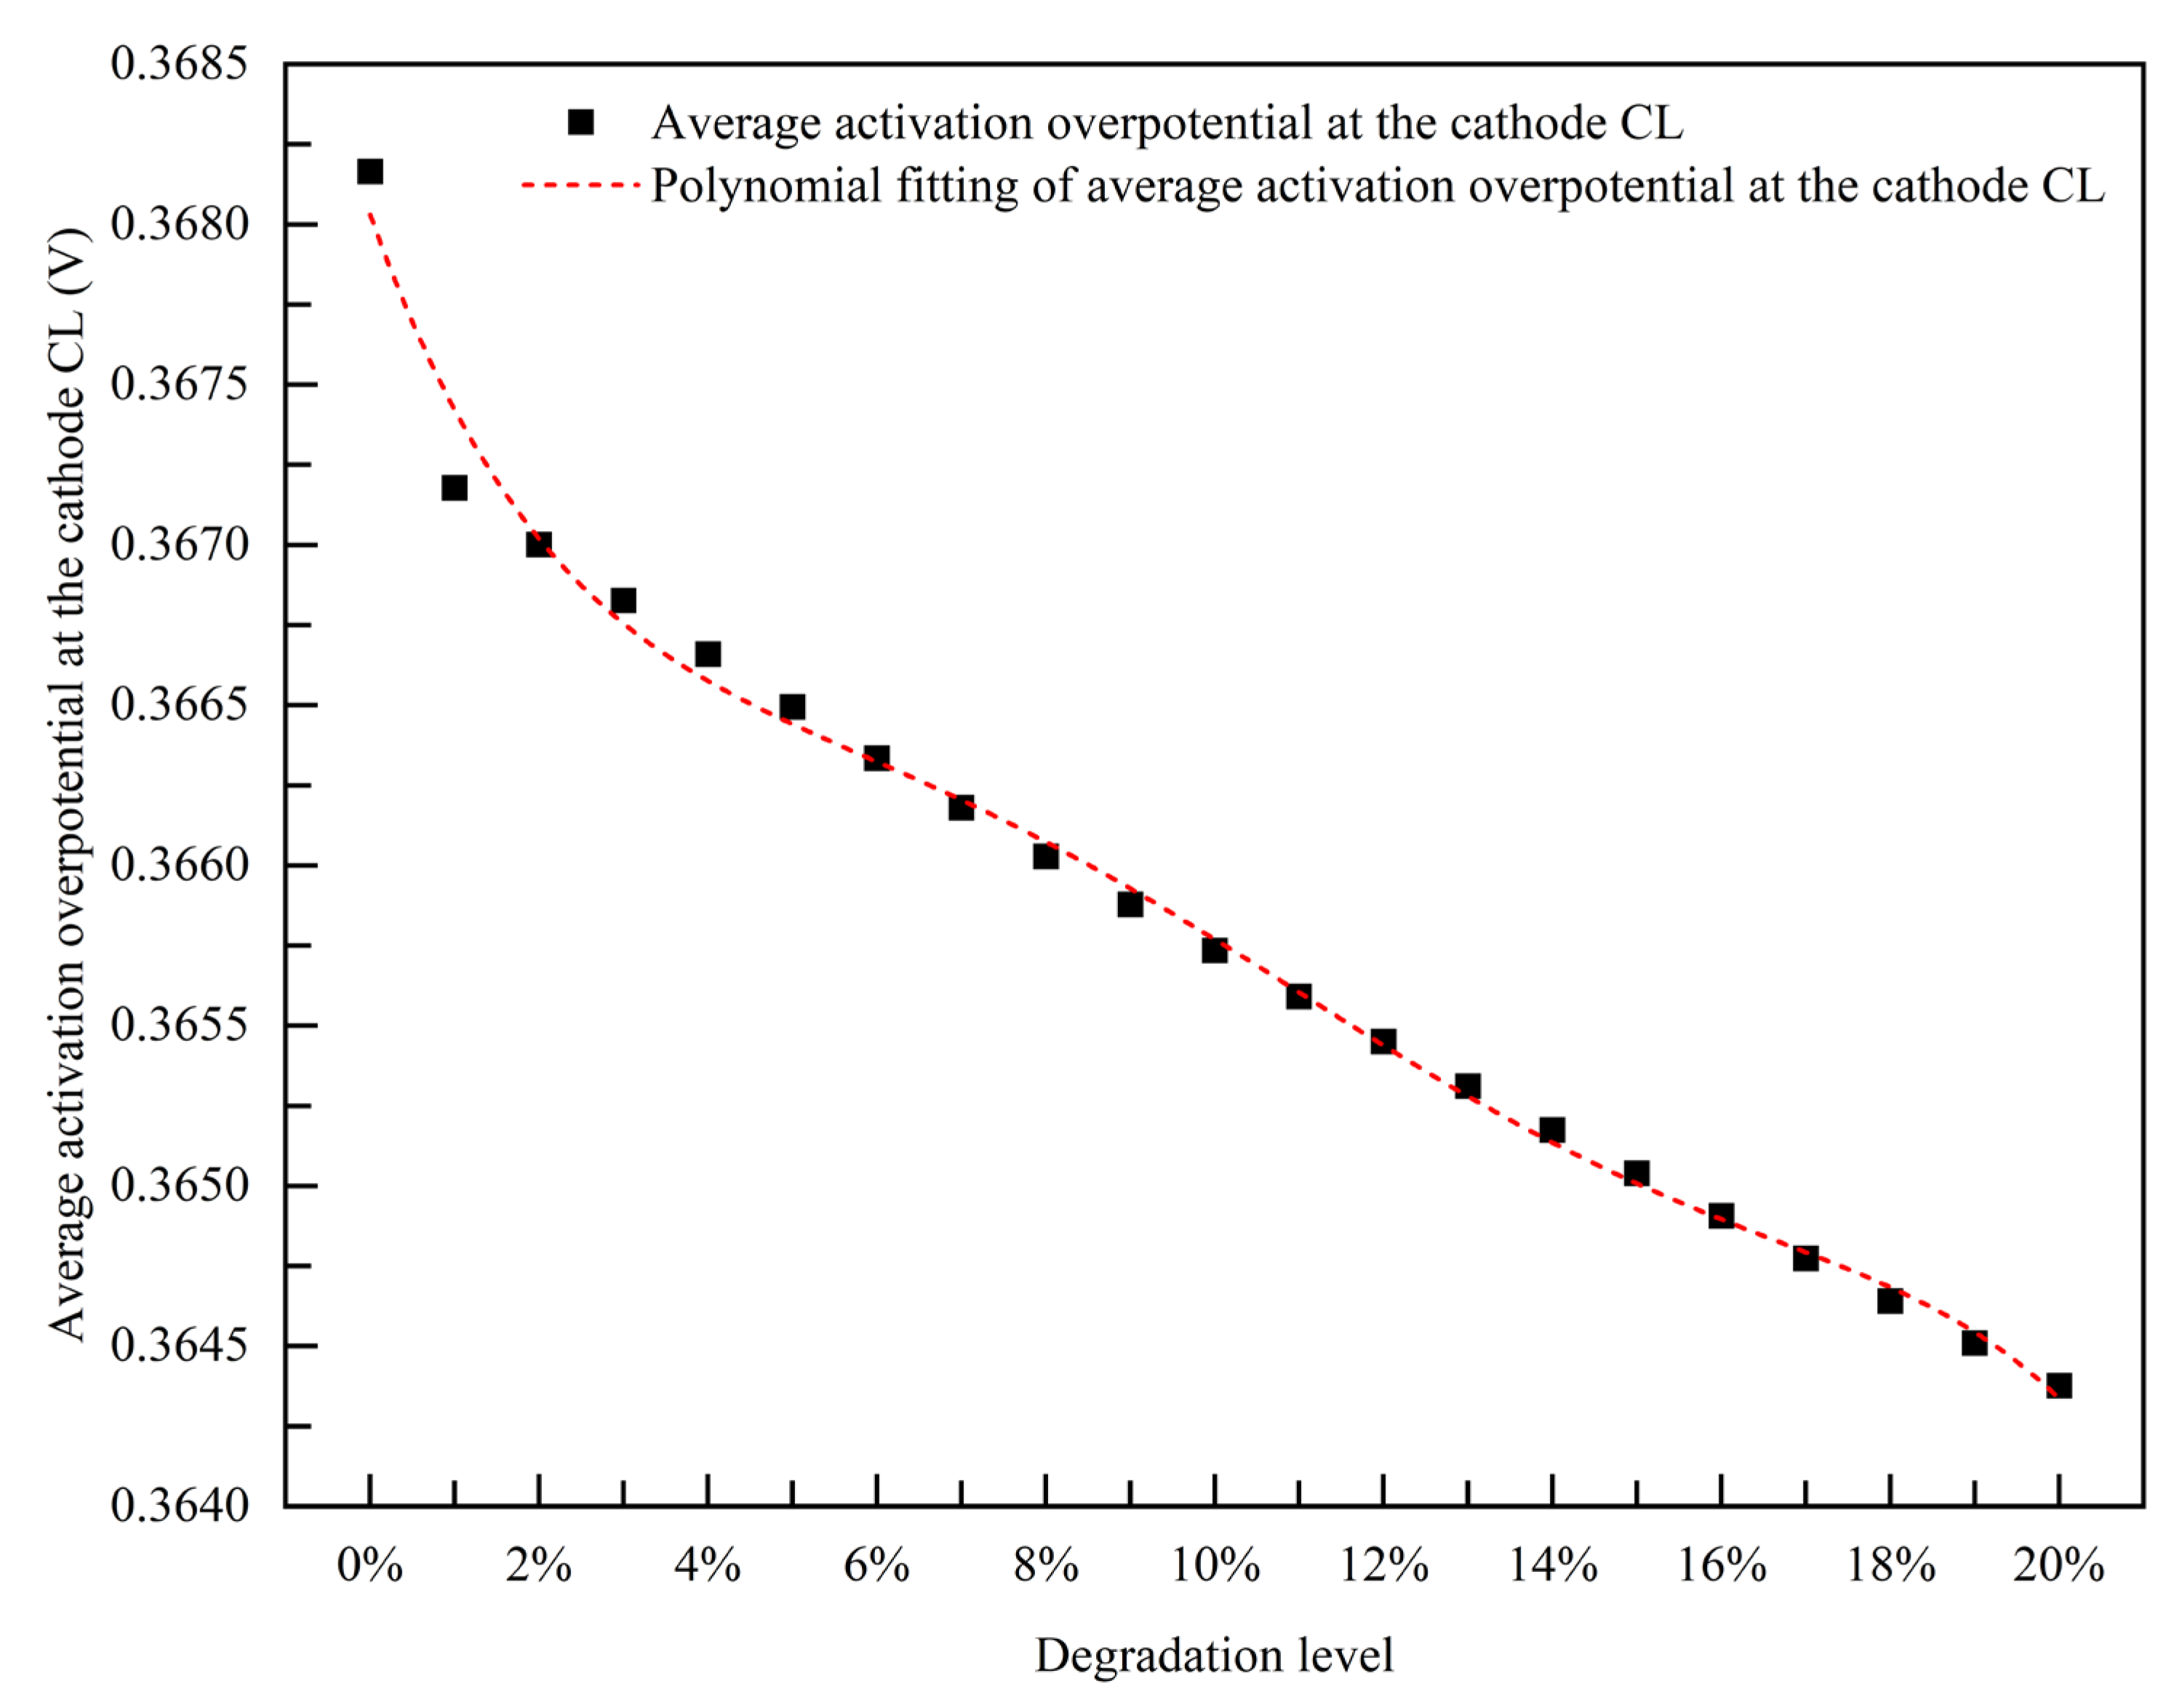
The results of the comparison of the average activation overpotential at the cathode CL under different degradation levels are shown in Figure 6. The average activation overpotential at the cathode CL gradually decreases with the increase in the PEMFC degradation level. The polynomial fitting of the average activation overpotential at the cathode CL under different degradation levels (red line) is conducted, and it can be expressed as Equation (23).
V ¯ C L , c a A O = 0.36803 0.07379 D P E M F C + 1.44316 D P E M F C 2 15.48027 D P E M F C 3 + 75.10384 D P E M F C 4 134.33047 D P E M F C 5
The empirical degradation model for the average activation overpotential at the cathode CL is shown in Equation (24).
V ¯ C L , c a A O = 0.36803 0.07379 f t + 1.44316 f 2 t 15.48027 f 3 t + 75.10384 f 4 t 134.33047 f 5 t

3.1.3. Empirical Degradation Model of Average Equilibrium Potential at the Cathode CL

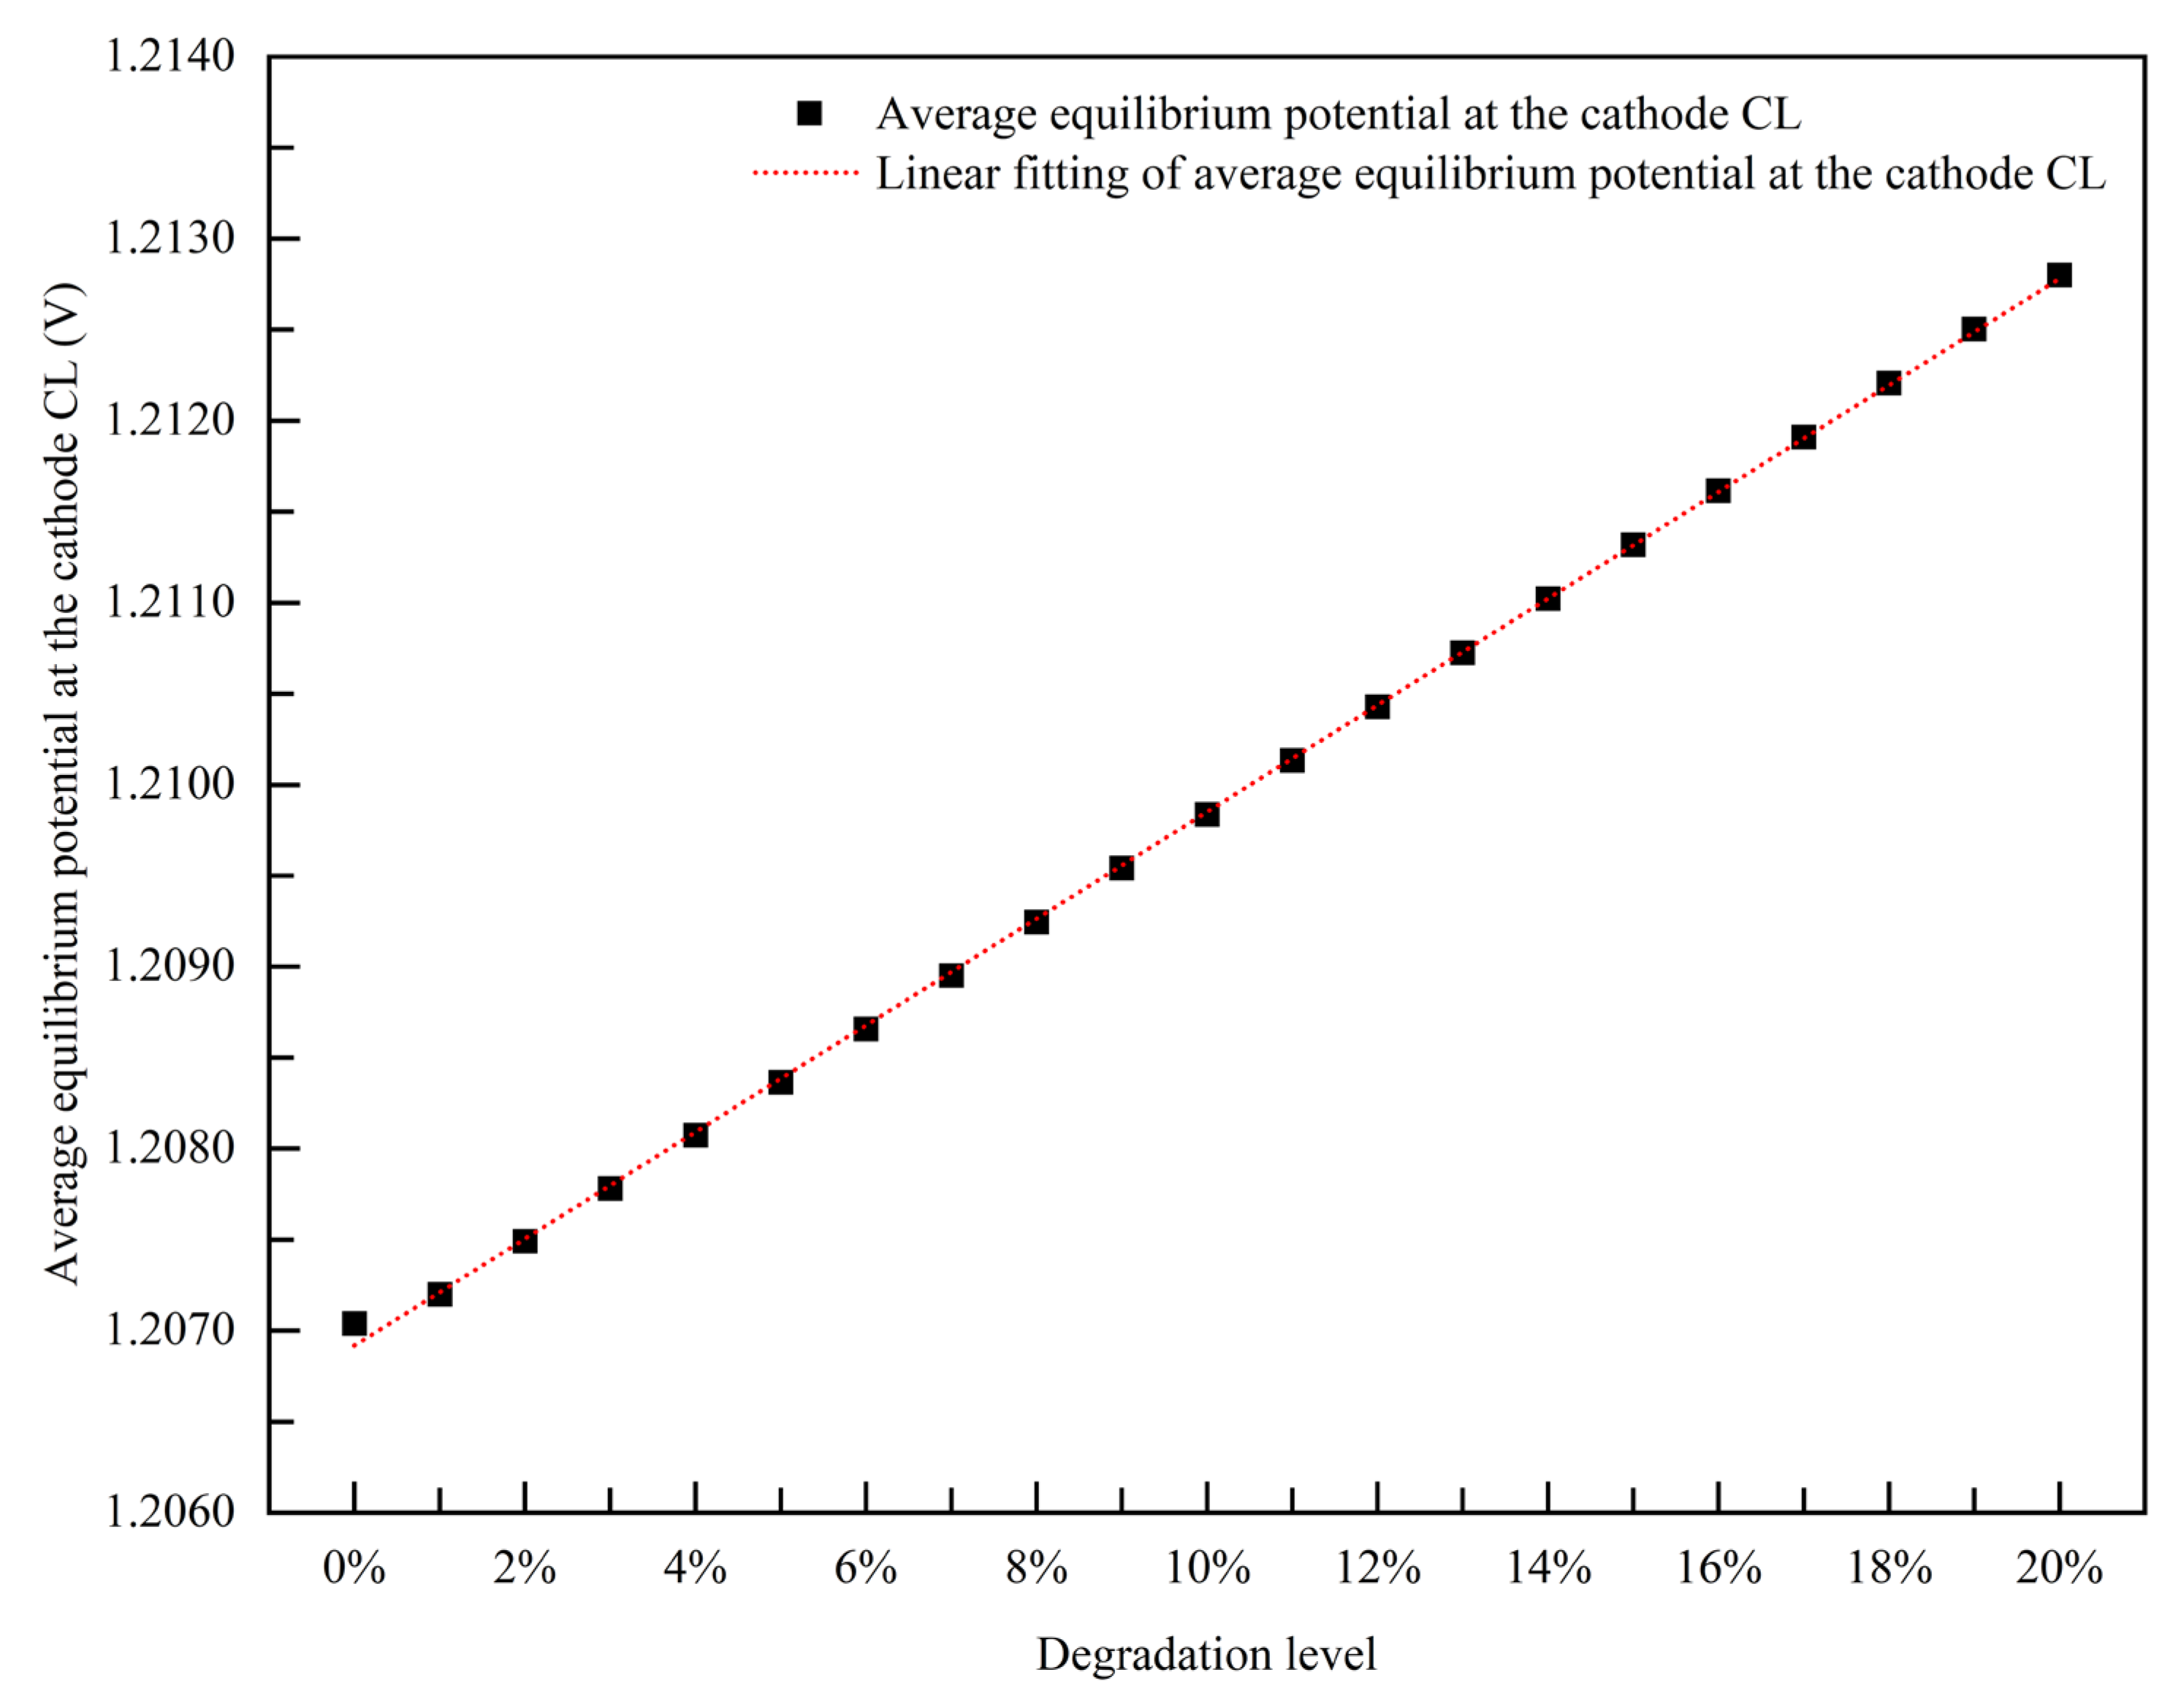
The results of the comparison of the average equilibrium potential at the cathode CL under different degradation levels are shown in Figure 7. The average equilibrium potential at the cathode CL gradually increases with the increase in the PEMFC degradation level. The linear fitting of the average equilibrium potential at the cathode CL under different degradation levels (red line) is conducted, and it can be expressed as Equation (25).
V ¯ C L , c a E P = 1.20692 + 0.02932 D P E M F C
The empirical degradation model for the average equilibrium potential at the cathode CL is shown in Equation (26).
V ¯ C L , c a E P = 1.20692 + 0.02932 f t

3.1.4. Empirical Degradation Model of Average Exchange Current Density at the Anode CL

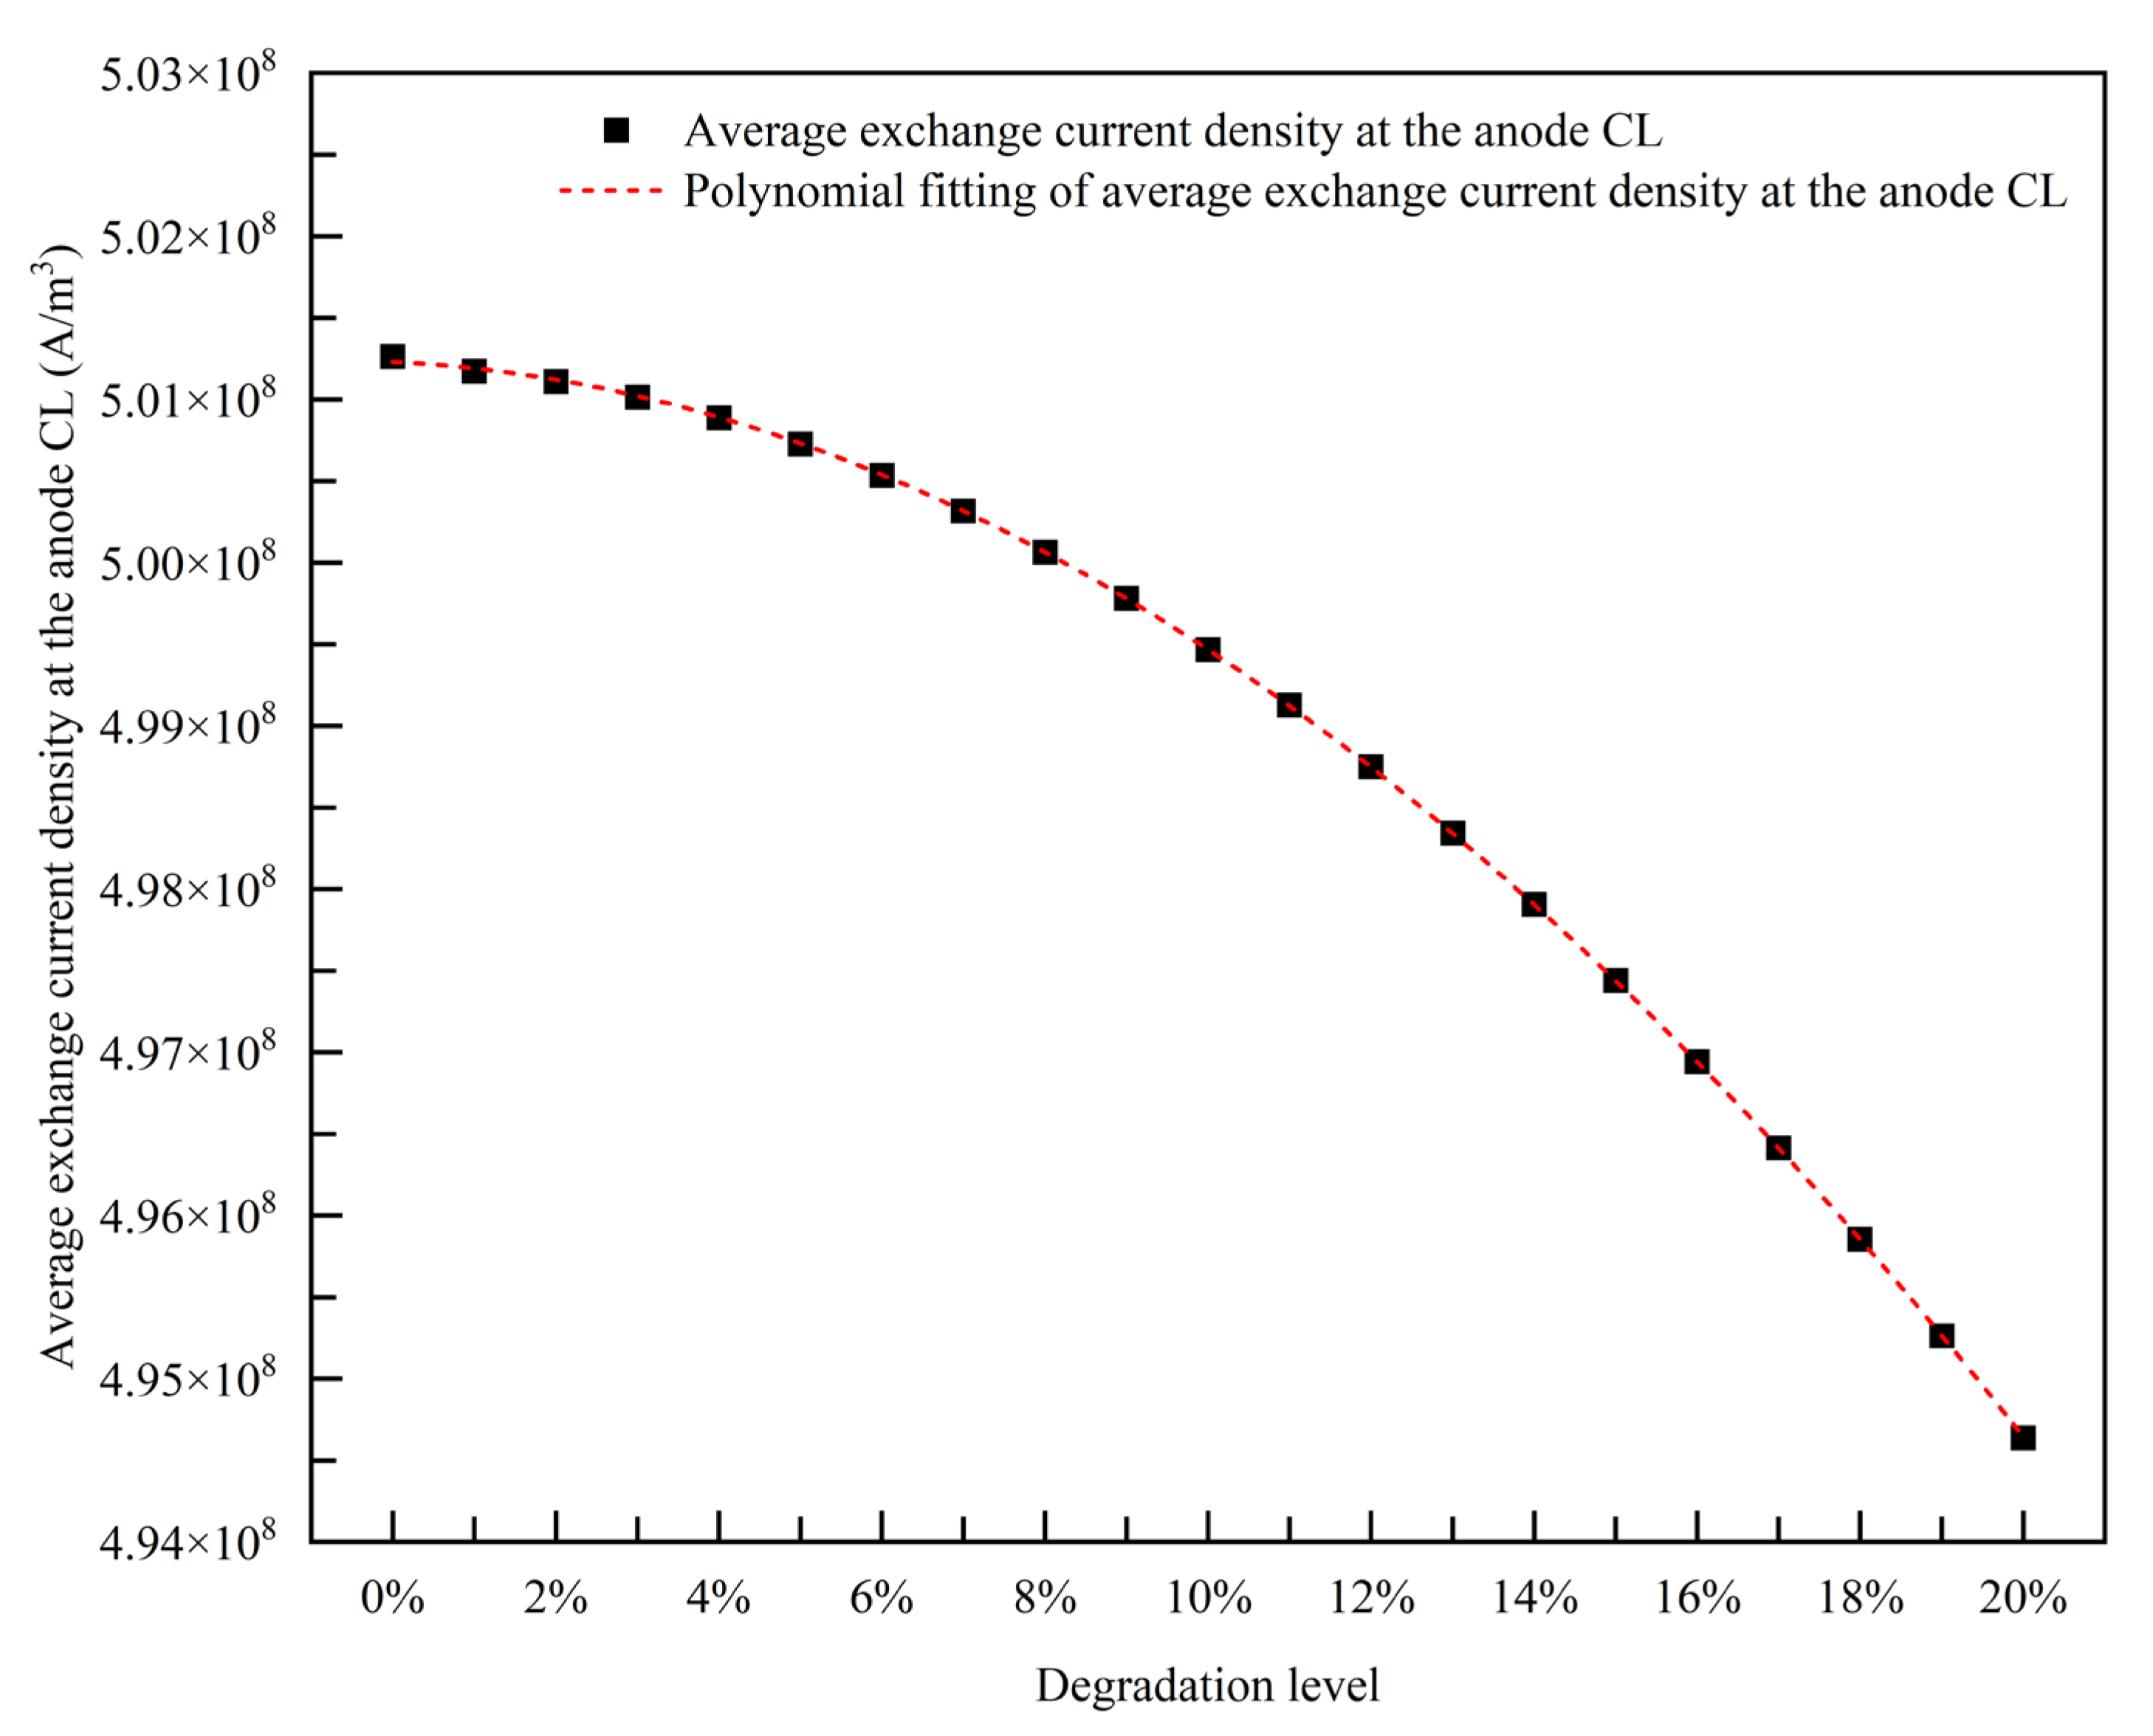
The results of the comparison of the average exchange current density at the anode CL under different degradation levels are shown in Figure 8. The average exchange current density at the anode CL gradually decreases with the increase in the PEMFC degradation level. The polynomial fitting of the average exchange current density at the anode CL under different degradation levels (red line) is conducted, and it can be expressed as Equation (27).
i ¯ C L , a n E C D = 5.01229 × 10 8 2.32793 × 10 6 D P E M F C 1.52958 × 10 8 D P E M F C 2
The empirical degradation model for the average exchange current density at the anode CL is shown in Equation (28).
i ¯ C L , a n E C D = 5.01229 × 10 8 2.32793 × 10 6 f t 1.52958 × 10 8 f 2 t

3.2. Empirical Degradation Models of the Distribution Indexes

The distribution indexes include thee average membrane water content, H2 molar concentration at the anode CL, O2 molar concentration at the cathode CL, H2 crossover flux, and O2 crossover flux.

3.2.1. Empirical Degradation Model of Average Membrane Water Content

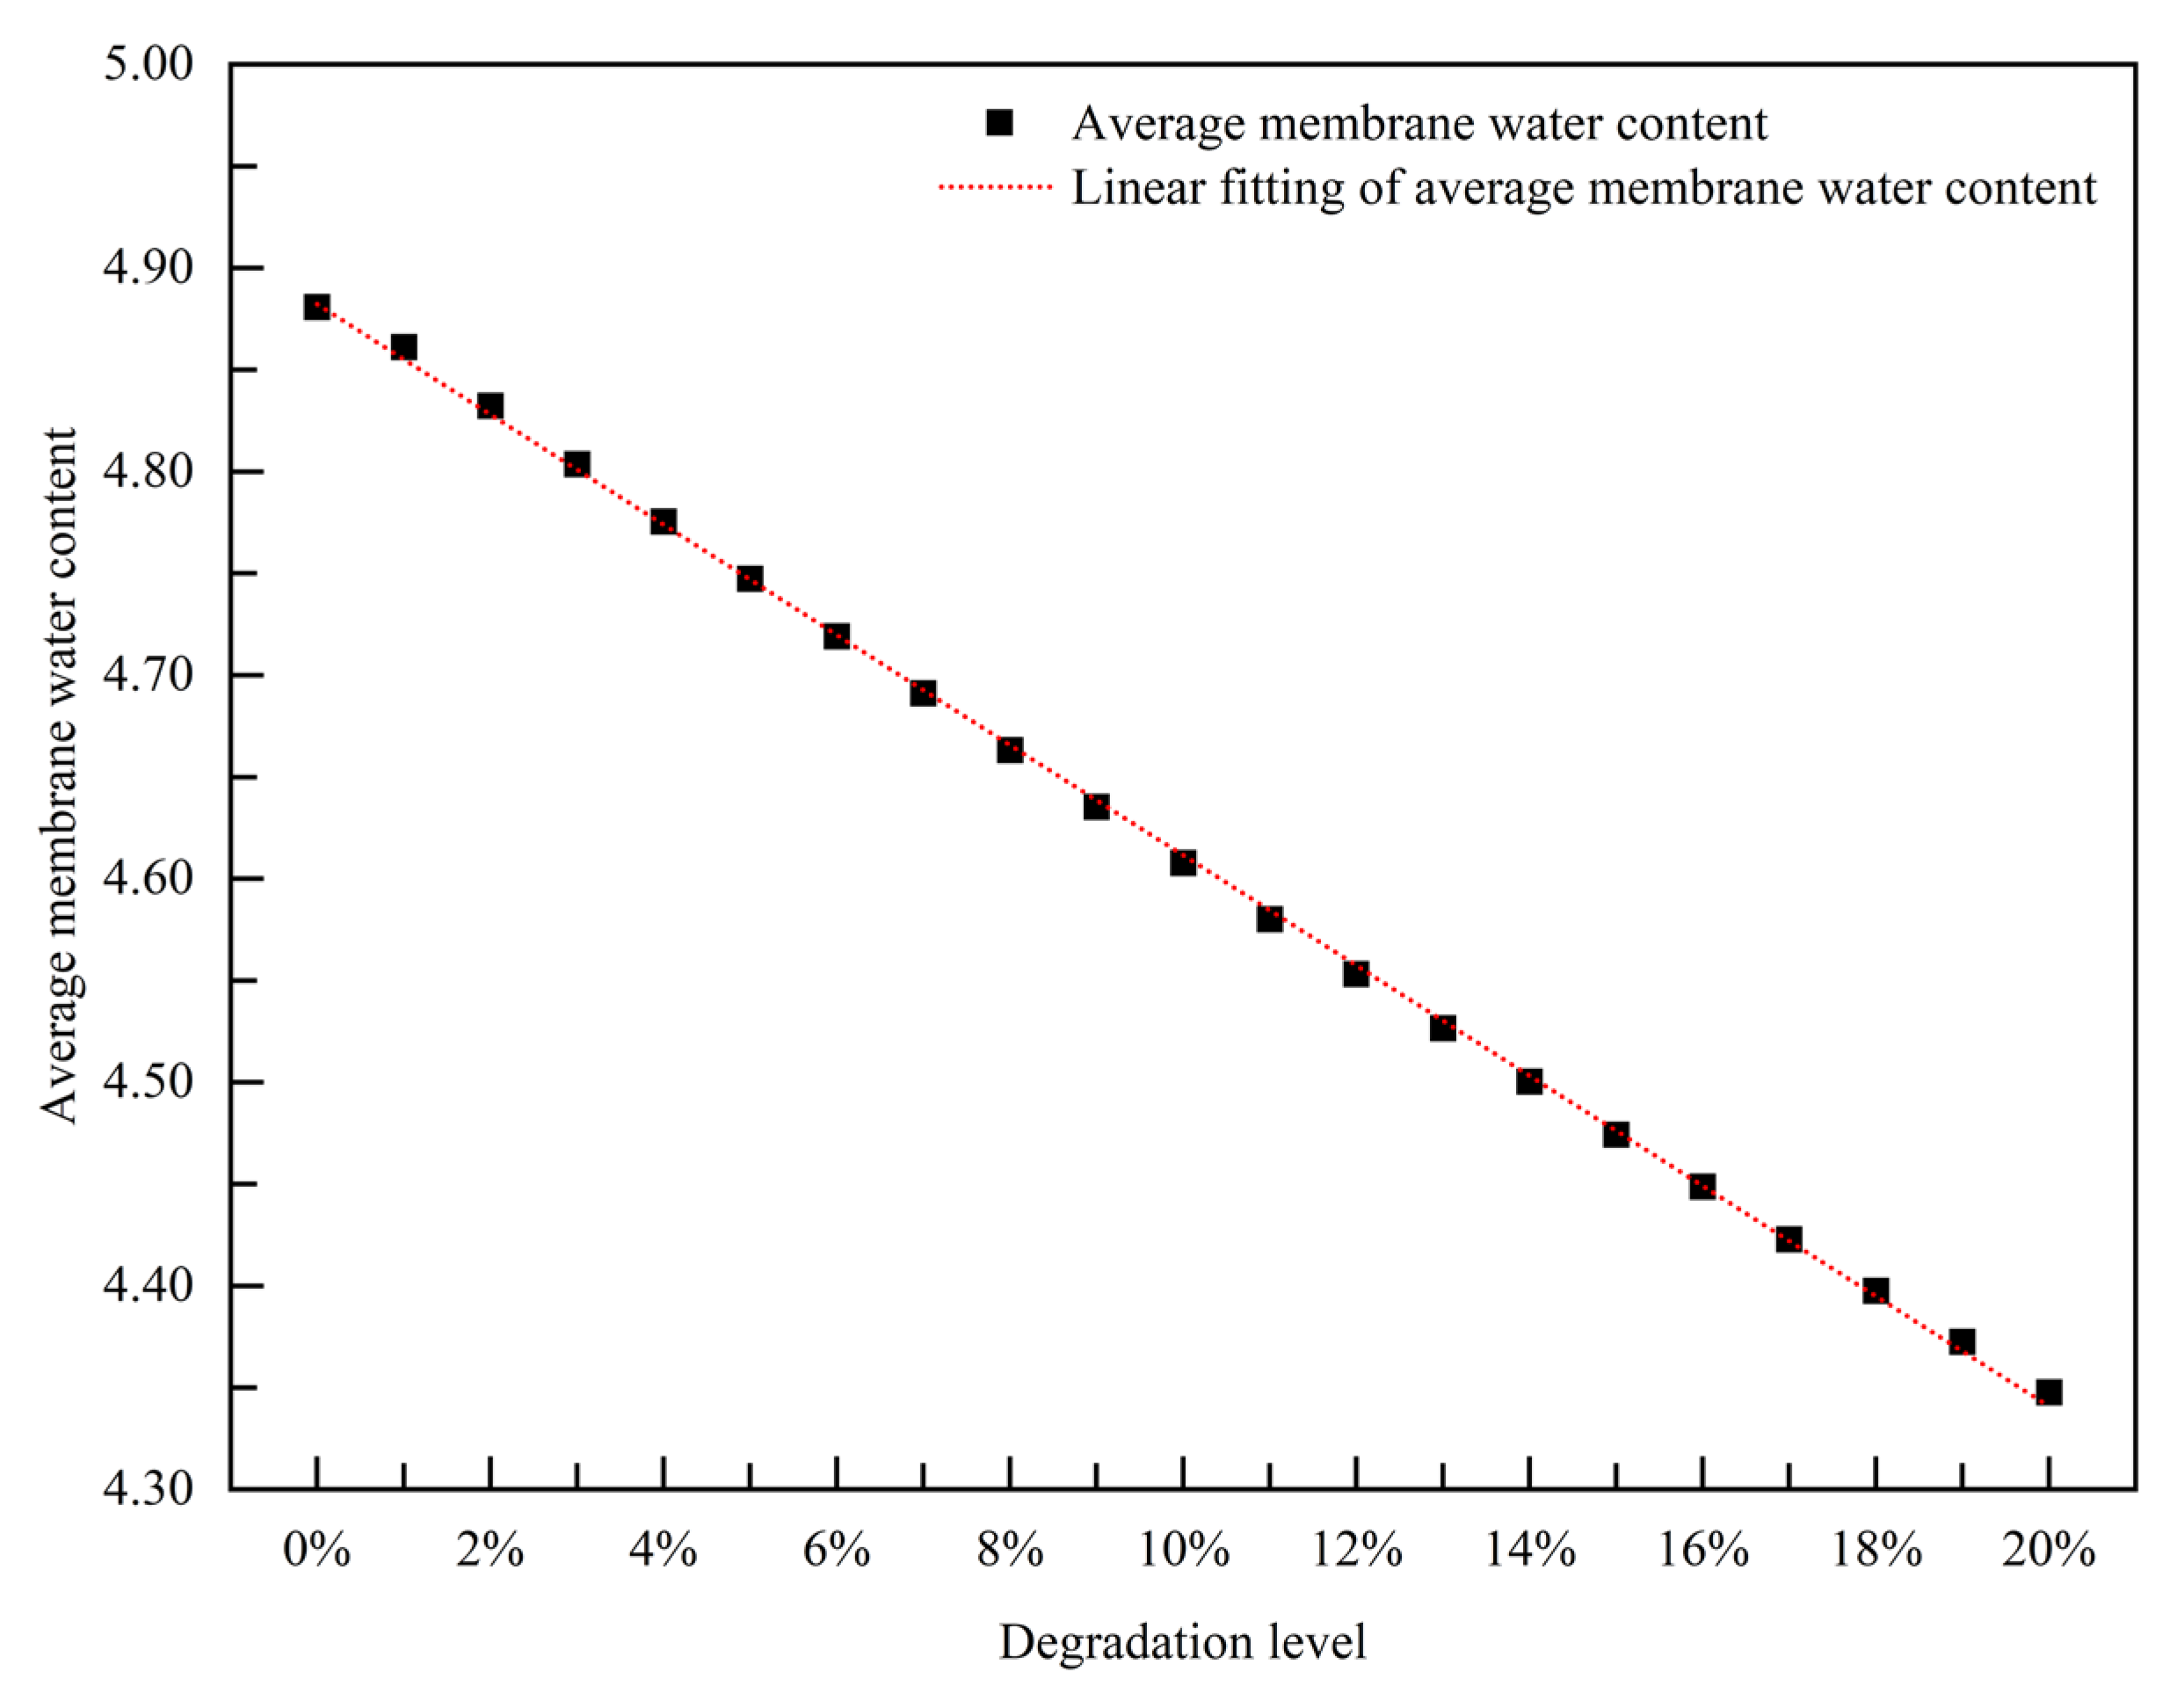
The results of the comparison of the average membrane water content under different degradation levels are shown in Figure 9. The average membrane water content gradually decreases with the increase in the PEMFC degradation level. The linear fitting of the average membrane water content under the different degradation levels (red line) is conducted, and it can be expressed as Equation (23). It should be noted that water management is very important during the PEMFC operation. The large-scale commercialization of PEMFCs requires higher power and current densities; however, at high operating current densities, the massive accumulation of liquid water in the GDL will lead to flooding and impede the gas diffusion, resulting in rapid degradation of cell performance. Accordingly, improving the water management ability is imperative for pursuing better cell output performance [20].
ζ ¯ m e m b r a n e   w a t e r   c o n t e n t = 4.88219 2.70639 D P E M F C
The empirical degradation model for the average membrane water content is shown in Equation (30).
ζ ¯ m e m b r a n e   w a t e r   c o n t e n t = 4.88219 2.70639 f t

3.2.2. Empirical Degradation Model of Average H2 Molar Concentration at the Anode CL

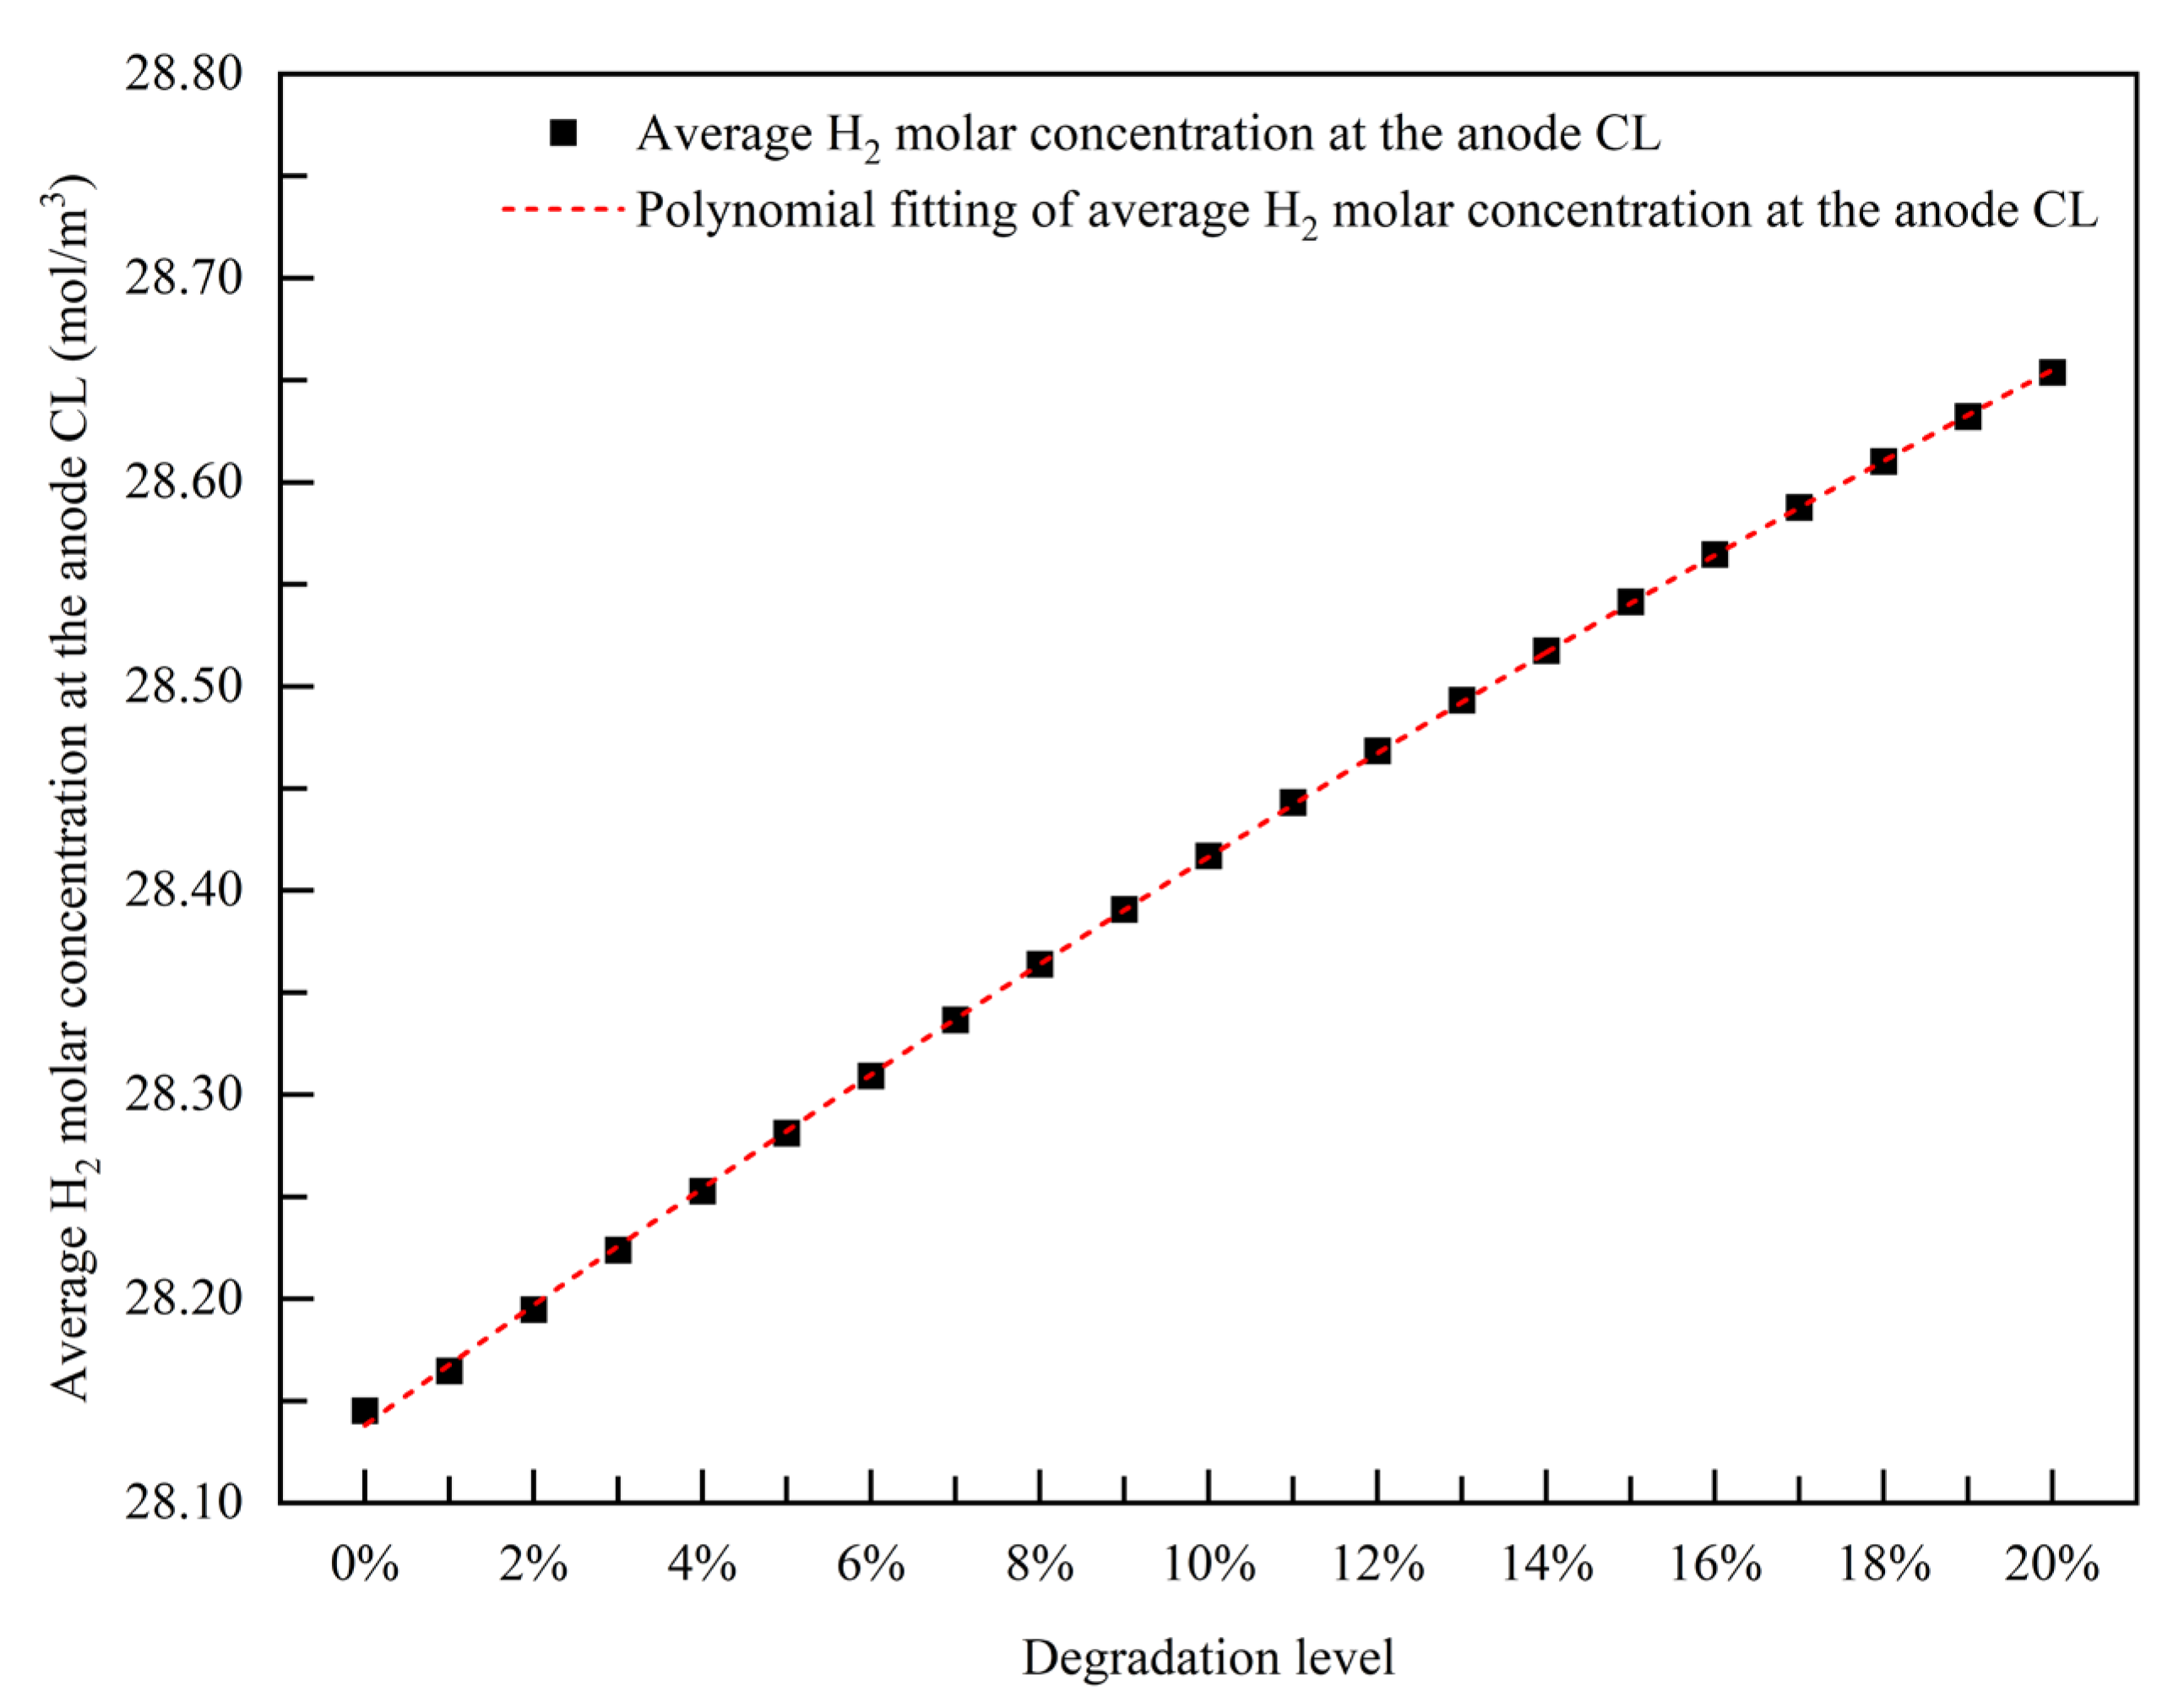
The results of the comparison of the average H2 molar concentration at the anode CL under different degradation levels are shown in Figure 10. The average H2 molar concentration at the anode CL gradually increases with the increase in the PEMFC degradation level. The polynomial fitting of the average H2 molar concentration at the anode CL under the different degradation levels (red line) is conducted, and it can be expressed as Equation (31).
C ¯ C L , a n M H 2 = 28.13812 + 2.9826 D P E M F C 1.98965 D P E M F C 2
The empirical degradation model for the average H2 molar concentration at the anode CL is shown in Equation (32).
C ¯ C L , a n M H 2 = 28.13812 + 2.9826 f t 1.98965 f 2 t

3.2.3. Empirical Degradation Model of Average O2 Molar Concentration at the Cathode CL

The results of the comparison of the average O2 molar concentration at the cathode CL under different degradation levels are shown in Figure 11. The average O2 molar concentration at the cathode CL gradually increases with the increase in the PEMFC degradation level. The linear fitting of the average O2 molar concentration at the cathode CL under different degradation levels (red line) is conducted, and it can be expressed as Equation (33).
C ¯ C L , c a M O 2 = 0.63835 + 0.53754 D P E M F C
The empirical degradation model for the average O2 molar concentration at the cathode CL is shown in Equation (34).
C ¯ C L , c a M _ O 2 = 0.63835 + 0.53754 f ( t )

3.2.4. Empirical Degradation Model of Average H2 Crossover Flux

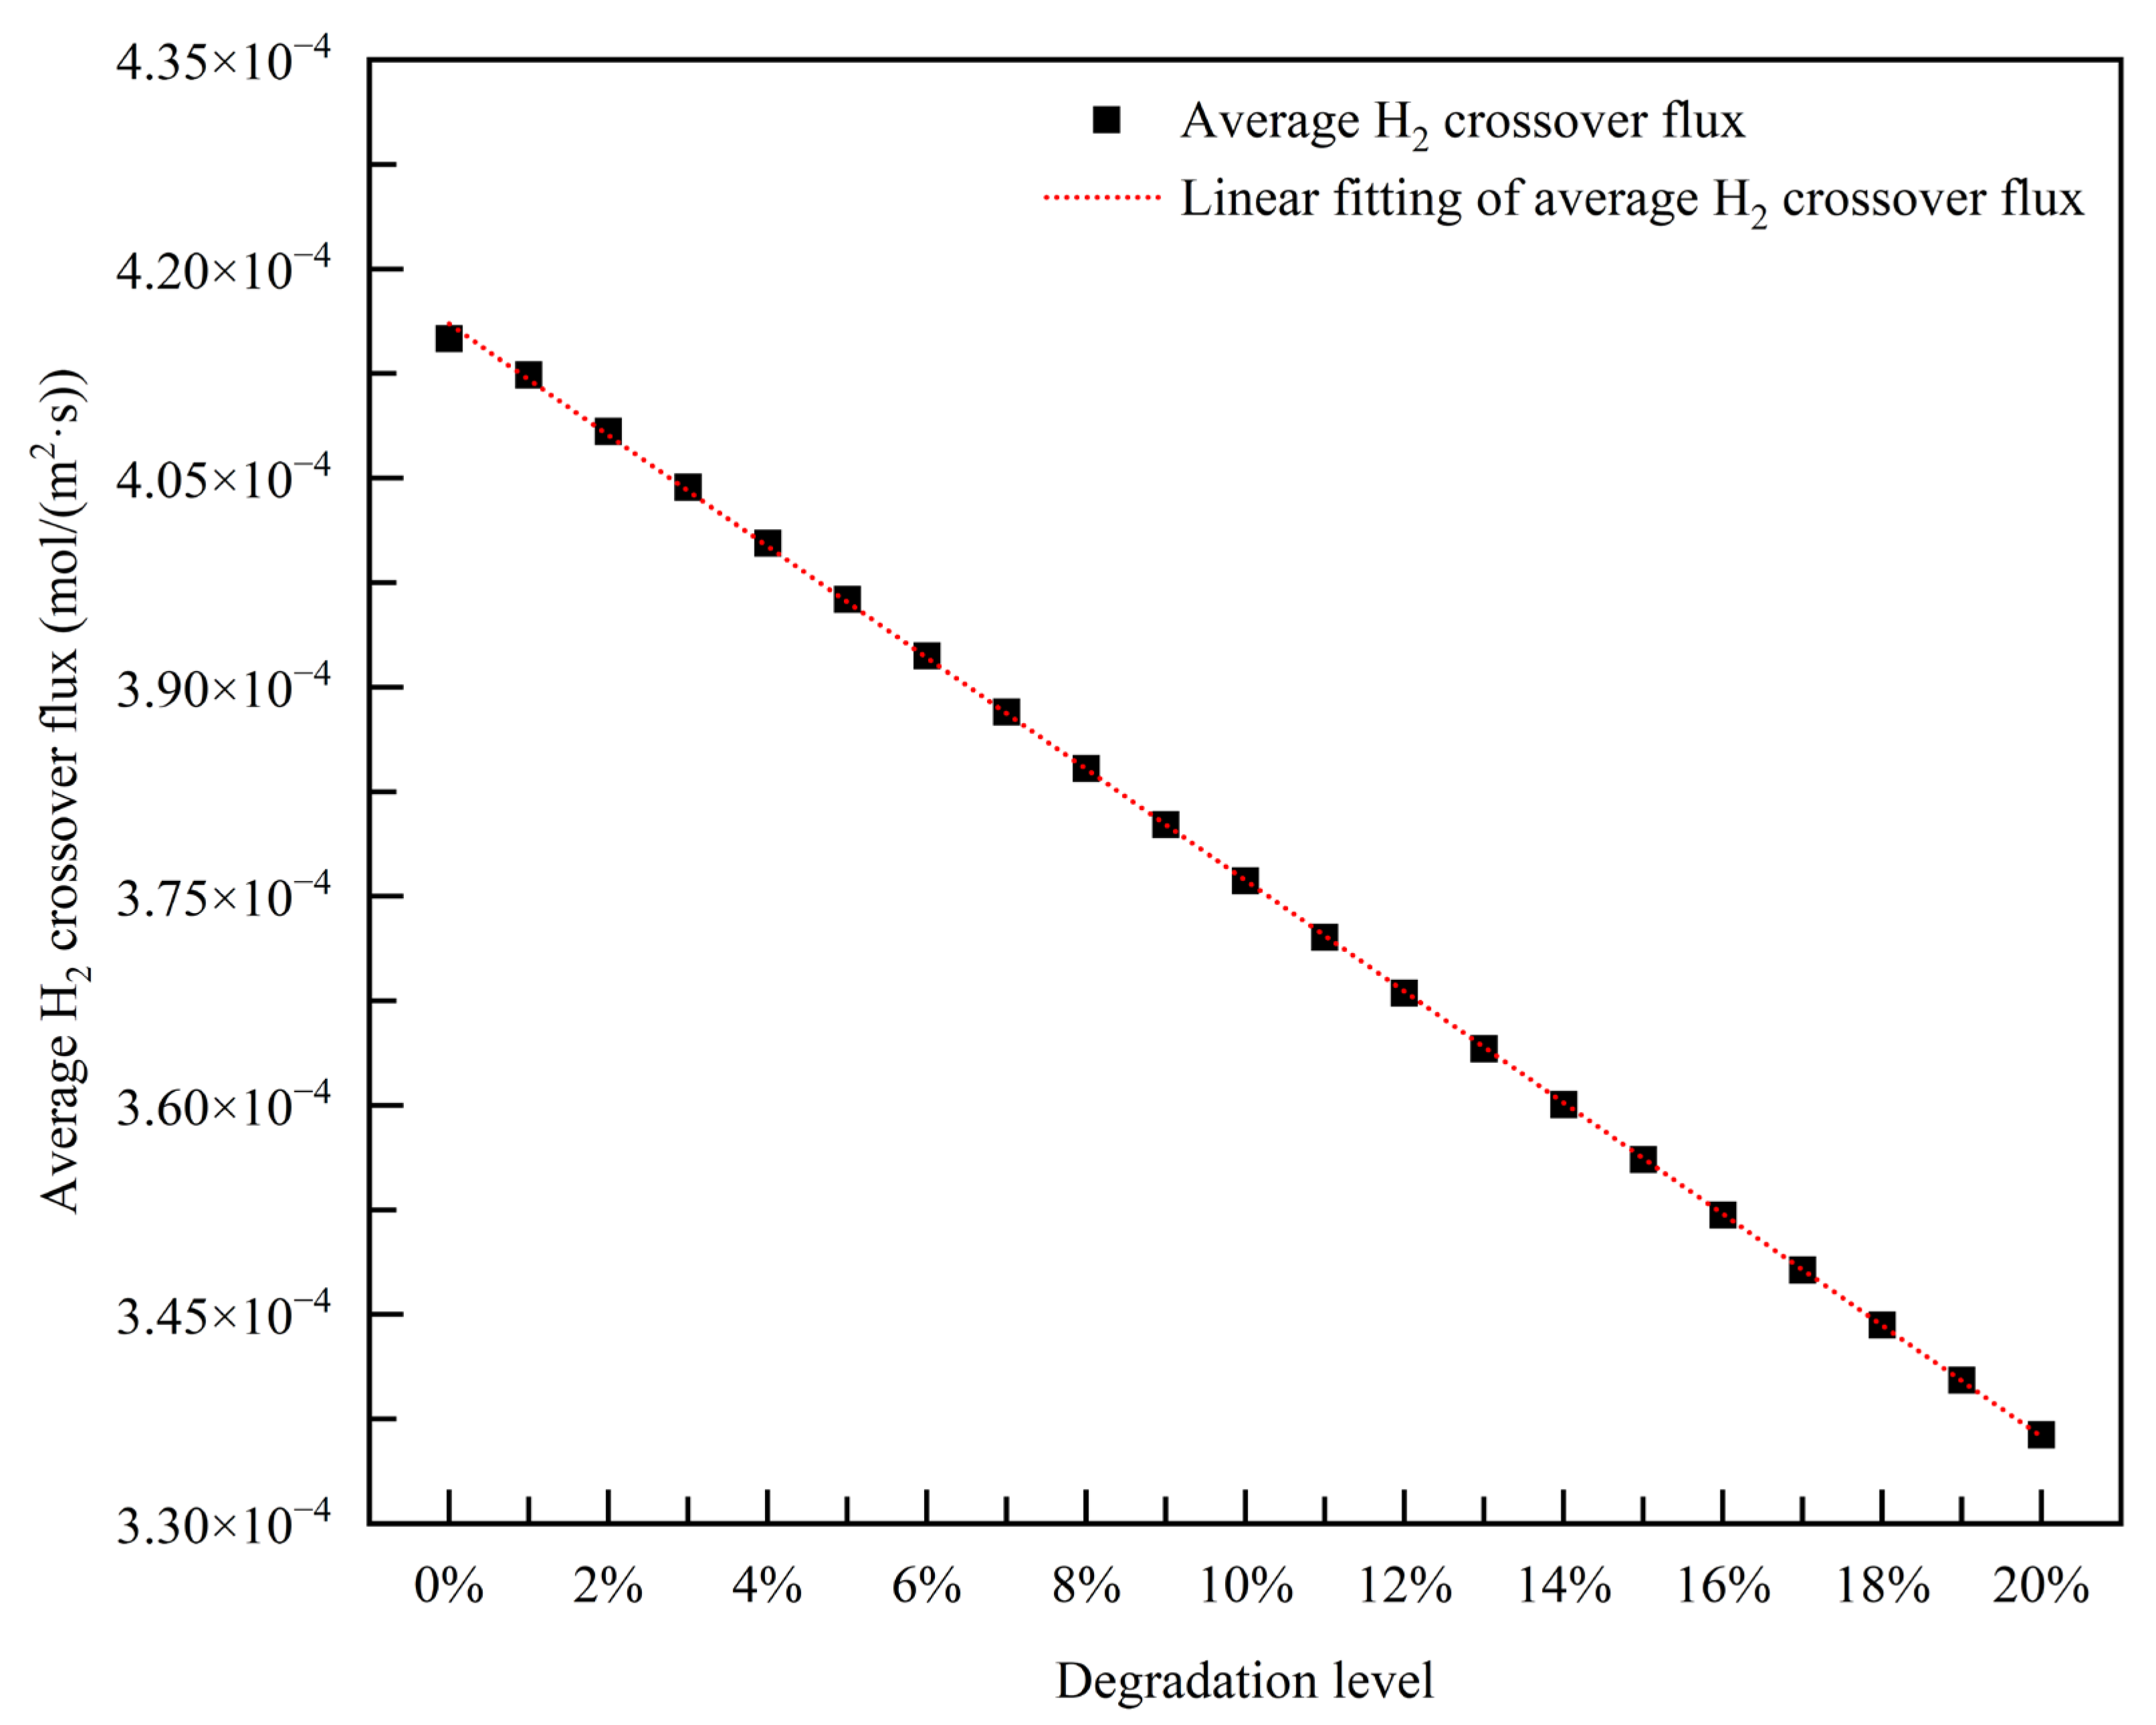
The results of the comparison of the average H2 crossover flux under different degradation levels are shown in Figure 12. The average H2 crossover flux gradually decreases with the increase in the PEMFC degradation level. The linear fitting of the average H2 crossover flux under different degradation levels (red line) is conducted, and it can be expressed as Equation (35).
v ¯ P E M H 2 = 4.16062 × 10 4 3.99008 × 10 4 D P E M F C
The empirical degradation model for the average H2 crossover flux is shown in Equation (36).
v ¯ P E M H 2 = 4.16062 × 10 4 3.99008 × 10 4 f t

3.2.5. Empirical Degradation Model of Average O2 Crossover Flux

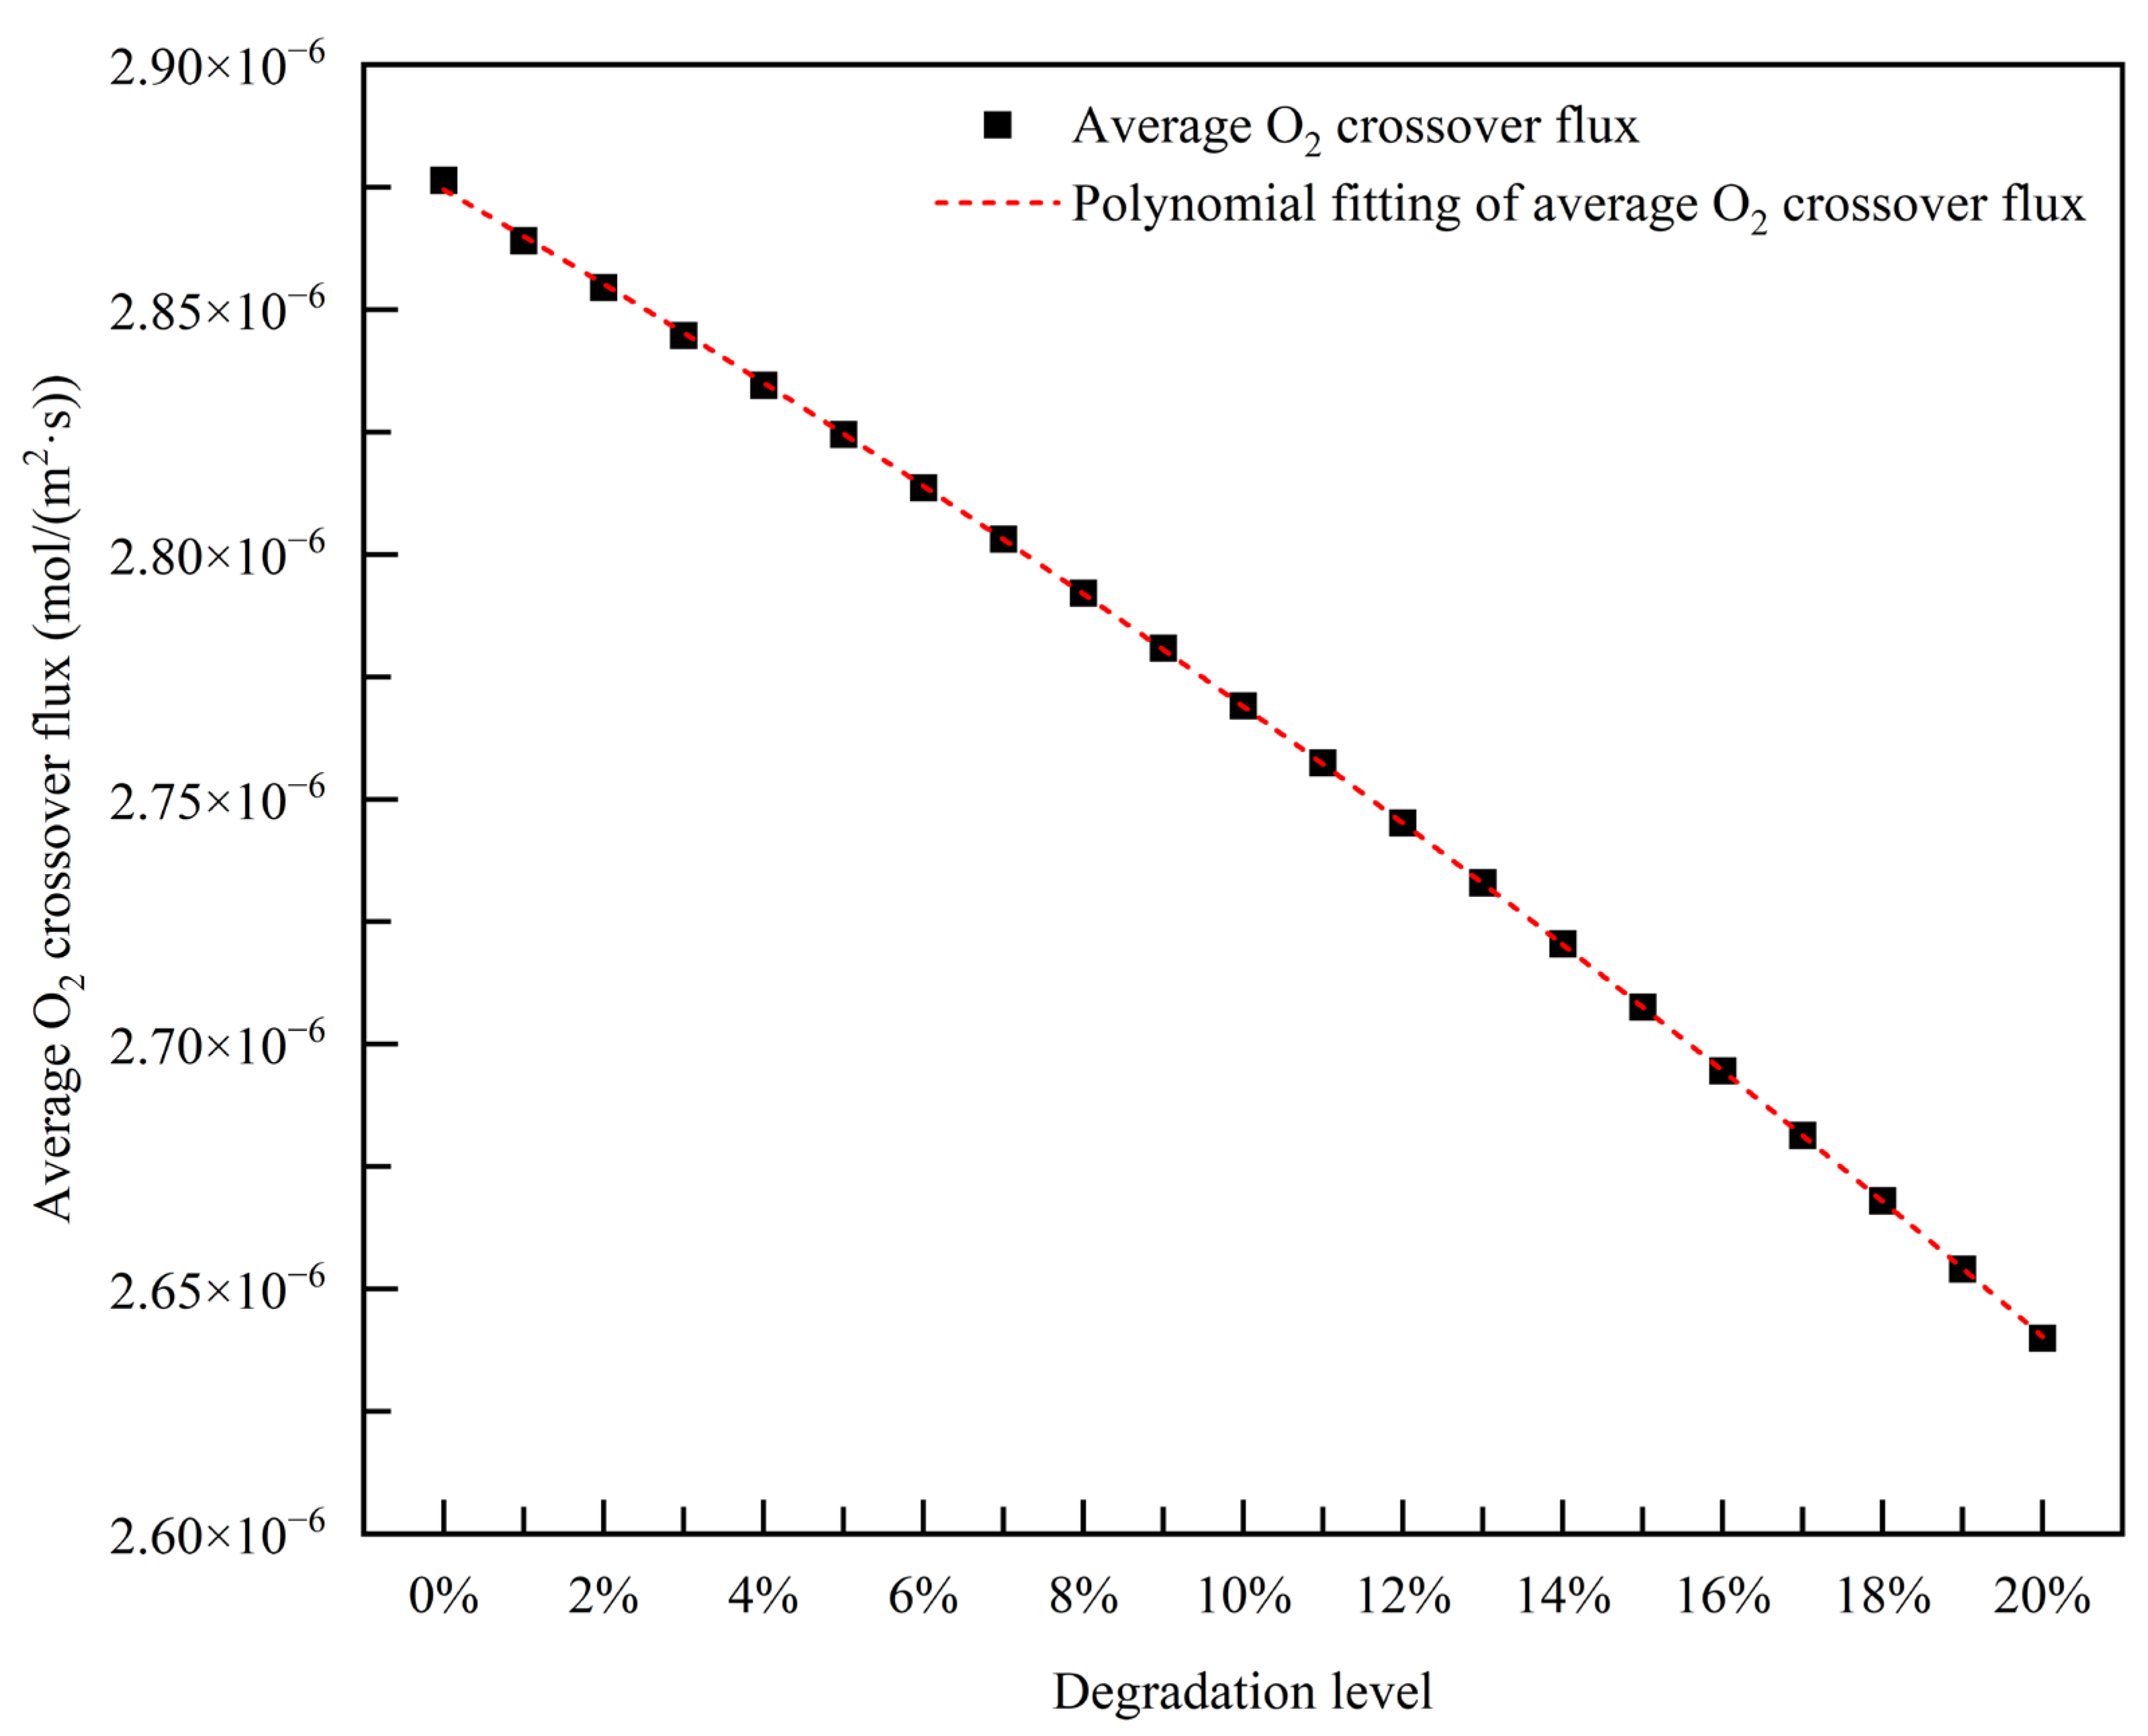
The results of the comparison of the average O2 crossover flux under the different degradation levels are shown in Figure 13. The average O2 crossover flux gradually decreases with the increase in the PEMFC degradation level. The polynomial fitting of the average O2 crossover flux under different degradation levels (red line) is conducted, and it can be expressed as Equation (37).
v ¯ P E M O 2 = 2.87447 × 10 6 9.38563 × 10 7 D P E M F C 1.1609 × 10 6 D P E M F C 2
The empirical degradation model for the average O2 crossover flux is shown in Equation (38).
v ¯ P E M O 2 = 2.87447 × 10 6 9.38563 × 10 7 f t 1.1609 × 10 6 f 2 t

4. Conclusions

This work presents the empirical degradation models of performance and distribution indexes by comparing the experimental and simulation data. The detailed conclusions are as follows:
(a)
The parameters specific values of the PEM, CL, GDL, and BP of PEMFCs under different degradation levels are clarified, with degradation percentages of 0, 1%, …, 20%, respectively. The PEM parameters include the electro-osmotic drag coefficient, ionic conductivity, thermal conductivity, and water diffusion coefficient. The CL parameters include the agglomerate radius, electrical conductivity, average pore diameter, porosity, thermal conductivity, ionomer film thickness, and electrolyte volume fraction. The GDL parameters include the average pore diameter, porosity, and thermal conductivity. The BP parameter includes the electrical conductivity.
(b)
The relationship between the experimental and simulation results is established by the index of current density, and the relationship between the operation time and degradation level of the PEMFC is obtained. The empirical degradation models of the different indexes of the PEMFC are established. Among them, the empirical degradation models of current density, average equilibrium potential on the cathode CL, average membrane water content, average oxygen molar concentration on the cathode CL, and average hydrogen crossover flux can be represented by the linear function. The empirical degradation models of the average exchange current density on the anode CL, average hydrogen molar concentration on the anode CL, and average oxygen crossover flux can be represented by the quadratic function. The empirical degradation model of average activation overpotential on the cathode CL can be represented by the quintic function.
(c)
The above models enrich the macroscopic and microscopic characterization of PEMFC degradation, and the established models can be used for PEMFC control system design and PEMFC degradation analysis, providing new ideas for PEMFC degradation description.

Author Contributions

Conceptualization, L.F. and S.Z.; methodology, L.F. and W.S.; software, L.F., J.G. and Y.L.; validation, J.G. and Y.L.; formal analysis, L.F. and J.G.; investigation, L.F., J.G. and Y.L.; resources, W.S. and S.Z.; data curation, Y.L.; writing—original draft preparation, L.F., J.G. and Y.L.; writing—review and editing, W.S. and S.Z.; visualization, L.F., J.G. and Y.L.; supervision, S.Z.; project administration, S.Z.; funding acquisition, W.S. and S.Z. All authors have read and agreed to the published version of the manuscript.

Funding

The authors declare that this study received funding from Shanghai TXJS Engineering Technology Co., Ltd., Shanghai REFIRE Technology Co., Ltd., AVL-List Gmbh. The funder had the following involvement with the study: study design, data analysis, interpretation of data, and the writing of this article.

Data Availability Statement

Data is contained within the article.

Acknowledgments

This work was supported by the IEEE PHM 2014 Data Challenge (experimental data were provided by FCLAB Federation, FR CNRS 3539, France).

Conflicts of Interest

W.S. were employed by the Shanghai TXJS Engineering Technology Co., Ltd. The remaining authors declare that the research was conducted in the absence of any commercial or financial relationships that could be construed as a potential conflict of interest.

References

  1. Mostafa, M.M. Post-materialism, religiosity, political orientation, locus of control and concern for global warming: A multilevel analysis across 40 nations. Soc. Indic. Res. 2015, 128, 1273–1298. [Google Scholar] [CrossRef]
  2. Santos-Alamillos, F.J.; Archer, C.L.; Noel, L.; Budischak, C.; Facciolo, W. Assessing the economic feasibility of the gradual decarbonization of a large electric power system. J. Clean. Prod. 2017, 147, 130–141. [Google Scholar] [CrossRef]
  3. Ren, F.; Long, D. Carbon emission forecasting and scenario analysis in Guangdong Province based on optimized Fast Learning Network. J. Clean. Prod. 2021, 317, 128408–128424. [Google Scholar] [CrossRef]
  4. Xu, L.; Fan, M.; Yang, L.; Shao, S. Heterogeneous green innovations and carbon emission performance: Evidence at China’s city level. Energy Econ. 2021, 99, 105269–105285. [Google Scholar] [CrossRef]
  5. Huang, J.; Li, X.; Wang, Y.; Lei, H. The effect of energy patents on China’s carbon emissions: Evidence from the STIRPAT model. Technol. Forecast. Soc. Chang. 2021, 173, 121110–121121. [Google Scholar] [CrossRef]
  6. Zhou, S.; Fan, L.; Zhang, G.; Gao, J.; Lu, Y.; Zhao, P.; Wen, C.; Shi, L.; Hu, Z. A review on proton exchange membrane multi-stack fuel cell systems: Architecture, performance, and power management. Appl. Energy 2022, 310, 118555. [Google Scholar] [CrossRef]
  7. Chen, X.; Lin, B. Towards carbon neutrality by implementing carbon emissions trading scheme: Policy evaluation in China. Energy Policy 2021, 157, 112510–112522. [Google Scholar] [CrossRef]
  8. Sun, C.; Negro, E.; Vezzù, K.; Pagot, G.; Cavinato, G.; Nale, A.; Herve Bang, Y.; Di Noto, V. Hybrid inorganic-organic proton-conducting membranes based on SPEEK doped with WO3 nanoparticles for application in vanadium redox flow batteries. Electrochim. Acta 2019, 309, 311–325. [Google Scholar] [CrossRef]
  9. Liu, Y.; Fan, L.; Pei, P.; Yao, S.; Wang, F. Asymptotic analysis for the inlet relative humidity effects on the performance of proton exchange membrane fuel cell. Appl. Energy 2018, 213, 573–584. [Google Scholar] [CrossRef]
  10. Li, Y.; Yang, F.; Chen, D.; Hu, S.; Xu, X. Thermal-physical modeling and parameter identification method for dynamic model with unmeasurable state in 10-kW scale proton exchange membrane fuel cell system. Energy Convers. Manag. 2023, 276, 116580. [Google Scholar] [CrossRef]
  11. Fukuhara, S.; Marx, N.; Ettihir, K.; Boulon, L.; Ait-Amirat, Y.; Becherif, M. A lumped fluidic model of an anode chamber for fault tolerant strategy design. Int. J. Hydrogen Energy 2016, 41, 5037–5047. [Google Scholar] [CrossRef]
  12. Ibrahim, A.A.; Salama, R.S.; El-Hakam, S.A.; Khder, A.S.; Ahmed, A.I. Synthesis of sulfated zirconium supported MCM-41 composite with high-rate adsorption of methylene blue and excellent heterogeneous catalyst. Colloids Surf. A Physicochem. Eng. Asp. 2021, 616, 126361–126371. [Google Scholar] [CrossRef]
  13. Salama, R.S.; Mannaa, M.A.; Altass, H.M.; Ibrahim, A.A.; Khder, A.E.-R.S. Palladium supported on mixed-metal–organic framework (Co–Mn-MOF-74) for efficient catalytic oxidation of CO. RSC Adv. 2021, 11, 4318–4326. [Google Scholar] [CrossRef] [PubMed]
  14. Karpenko-Jereb, L.; Sternig, C.; Fink, C.; Tatschl, R. Membrane degradation model for 3D CFD analysis of fuel cell performance as a function of time. Int. J. Hydrogen Energy 2016, 41, 13644–13656. [Google Scholar] [CrossRef]
  15. Chandesris, M.; Vincent, R.; Guetaz, L.; Roch, J.S.; Thoby, D.; Quinaud, M. Membrane degradation in PEM fuel cells: From experimental results to semi-empirical degradation laws. Int. J. Hydrogen Energy 2017, 42, 8139–8149. [Google Scholar] [CrossRef]
  16. Robin, C.; Gérard, M.; Quinaud, M.; d’Arbigny, J.; Bultel, Y. Proton exchange membrane fuel cell model for aging predictions: Simulated equivalent active surface area loss and comparisons with durability tests. J. Power Source 2016, 326, 417–427. [Google Scholar] [CrossRef]
  17. Moein-Jahromi, M.; Kermani, M.J.; Movahed, S. Degradation forecast for PEMFC cathode-catalysts under cyclic loads. J. Power Source 2017, 359, 611–625. [Google Scholar] [CrossRef]
  18. Fan, L.; Gao, J.; Lu, Y.; Shen, W.; Zhou, S. Analysis of the Influence of Component Degradation on Different Degradation Indexes of PEMFC. Energies 2023, 16, 7806. [Google Scholar] [CrossRef]
  19. Fan, L.; Zhou, S.; Zhao, P.; Gao, J. A Novel Hybrid Method Based on the Sliding Window Method for the Estimation of the State of Health of the Proton Exchange Membrane Fuel Cell; SAE Technical Paper Series; SAE: Shanghai, China, 2023. [Google Scholar]
  20. Yan, S.; Yang, M.; Sun, C.; Xu, S. Liquid Water Characteristics in the Compressed Gradient Porosity Gas Diffusion Layer of Proton Exchange Membrane Fuel Cells Using the Lattice Boltzmann Method. Energies 2023, 16, 6010. [Google Scholar] [CrossRef]
Figure 1. Simulation process of the PEMFC under different degradation levels.
Energies 16 08012 g001
Figure 2. Average experimental voltage of a single PEMFC.
Energies 16 08012 g002
Figure 3. Average experimental current density of a single PEMFC.
Energies 16 08012 g003
Figure 4. Simulation of the current density of the different degradation levels.
Energies 16 08012 g004
Figure 5. Relationship between the operation time and degradation level.
Energies 16 08012 g005
Figure 6. Average activation overpotential at the cathode CL under different degradation levels.
Energies 16 08012 g006
Figure 7. Average equilibrium potential at the cathode CL under different degradation levels.
Energies 16 08012 g007
Figure 8. Average exchange current density at the anode CL under the different degradation levels.
Energies 16 08012 g008
Figure 9. Average membrane water content under the different degradation levels.
Energies 16 08012 g009
Figure 10. Average H2 molar concentration at the anode CL under different degradation levels.
Energies 16 08012 g010
Figure 11. Average O2 molar concentration at the cathode CL under different degradation levels.
Energies 16 08012 g011
Figure 12. Average H2 crossover flux under different degradation levels.
Energies 16 08012 g012
Figure 13. Average O2 crossover flux under different degradation levels.
Energies 16 08012 g013
Table 1. Parameters of the PEM under different degradation levels.
Degradation LevelElectro-Osmotic Drag Coefficient (-)Ionic Conductivity (S/m)Thermal Conductivity (W/(m·K))Water Diffusion Coefficient (m2/s)
00.1136000.1879000.2002.1600 × 10−11
1%0.1124640.1860210.2022.1384 × 10−11
2%0.1113280.1841420.2042.1168 × 10−11
3%0.1101920.1822630.2062.0952 × 10−11
4%0.1090560.1803840.2082.0736 × 10−11
5%0.1079200.1785050.2102.0520 × 10−11
6%0.1067840.1766260.2122.0304 × 10−11
7%0.1056480.1747470.2142.0088 × 10−11
8%0.1045120.1728680.2161.9872 × 10−11
9%0.1033760.1709890.2181.9656 × 10−11
10%0.1022400.1691100.2201.9440 × 10−11
11%0.1011040.1672310.2221.9224 × 10−11
12%0.0999680.1653520.2241.9008 × 10−11
13%0.0988320.1634730.2261.8792 × 10−11
14%0.0976960.1615940.2281.8576 × 10−11
15%0.0965600.1597150.2301.8360 × 10−11
16%0.0954240.1578360.2321.8144 × 10−11
17%0.0942880.1559570.2341.7928 × 10−11
18%0.0931520.1540780.2361.7712 × 10−11
19%0.0920160.1521990.2381.7496 × 10−11
20%0.0908800.1503200.2401.7280 × 10−11
Table 2. Parameters of the CL under the different degradation levels.
Degradation LevelAgglomerate Radius (m)Electrical Conductivity (S/m)Average Pore Diameter (m)Porosity (-)Thermal Conductivity (W/(m·K))Ionomer film Thickness (m)Electrolyte Volume Fraction (-)
05.00 × 10−713,514.005.00 × 10−80.4002.74005.00 × 10−80.2500
1%5.05 × 10−713,378.865.05 × 10−80.4042.76744.95 × 10−80.2475
2%5.10 × 10−713,243.725.10 × 10−80.4082.79484.90 × 10−80.2450
3%5.15 × 10−713,108.585.15 × 10−80.4122.82224.85 × 10−80.2425
4%5.20 × 10−712,973.445.20 × 10−80.4162.84964.80 × 10−80.2400
5%5.25 × 10−712,838.305.25 × 10−80.4202.87704.75 × 10−80.2375
6%5.30 × 10−712,703.165.30 × 10−80.4242.90444.70 × 10−80.2350
7%5.35 × 10−712,568.025.35 × 10−80.4282.93184.65 × 10−80.2325
8%5.40 × 10−712,432.885.40 × 10−80.4322.95924.60 × 10−80.2300
9%5.45 × 10−712,297.745.45 × 10−80.4362.98664.55 × 10−80.2275
10%5.50 × 10−712,162.605.50 × 10−80.4403.01404.50 × 10−80.2250
11%5.55 × 10−712,027.465.55 × 10−80.4443.04144.45 × 10−80.2225
12%5.60 × 10−711,892.325.60 × 10−80.4483.06884.40 × 10−80.2200
13%5.65 × 10−711,757.185.65 × 10−80.4523.09624.35 × 10−80.2175
14%5.70 × 10−711,622.045.70 × 10−80.4563.12364.30 × 10−80.2150
15%5.75 × 10−711,486.905.75 × 10−80.4603.15104.25 × 10−80.2125
16%5.80 × 10−711,351.765.80 × 10−80.4643.17844.20 × 10−80.2100
17%5.85 × 10−711,216.625.85 × 10−80.4683.20584.15 × 10−80.2075
18%5.90 × 10−711,081.485.90 × 10−80.4723.23324.10 × 10−80.2050
19%5.95 × 10−710,946.345.95 × 10−80.4763.26064.05 × 10−80.2025
20%6.00 × 10−710,811.206.00 × 10−80.4803.28804.00 × 10−80.2000
Table 3. Parameters of the GDL under different degradation levels.
Degradation LevelAverage Pore Diameter (m)Porosity (-)Thermal Conductivity (W/(m·K))
01.500 × 10−60.4005.00
1%1.515 × 10−60.4045.05
2%1.530 × 10−60.4085.10
3%1.545 × 10−60.4125.15
4%1.560 × 10−60.4165.20
5%1.575 × 10−60.4205.25
6%1.590 × 10−60.4245.30
7%1.605 × 10−60.4285.35
8%1.620 × 10−60.4325.40
9%1.635 × 10−60.4365.45
10%1.650 × 10−60.4405.50
11%1.665 × 10−60.4445.55
12%1.680 × 10−60.4485.60
13%1.695 × 10−60.4525.65
14%1.710 × 10−60.4565.70
15%1.725 × 10−60.4605.75
16%1.740 × 10−60.4645.80
17%1.755 × 10−60.4685.85
18%1.770 × 10−60.4725.90
19%1.785 × 10−60.4765.95
20%1.800 × 10−60.4806.00
Table 4. Parameters of the BP under different degradation levels.
Degradation LevelElectrical Conductivity (S/m)
01.4500 × 10⁶
1%1.4355 × 10⁶
2%1.4210 × 10⁶
3%1.4065 × 10⁶
4%1.3920 × 10⁶
5%1.3775 × 10⁶
6%1.3630 × 10⁶
7%1.3485 × 10⁶
8%1.3340 × 10⁶
9%1.3195 × 10⁶
10%1.3050 × 10⁶
11%1.2905 × 10⁶
12%1.2760 × 10⁶
13%1.2615 × 10⁶
14%1.2470 × 10⁶
15%1.2325 × 10⁶
16%1.2180 × 10⁶
17%1.2035 × 10⁶
18%1.1890 × 10⁶
19%1.1745 × 10⁶
20%1.1600 × 10⁶
Disclaimer/Publisher’s Note: The statements, opinions and data contained in all publications are solely those of the individual author(s) and contributor(s) and not of MDPI and/or the editor(s). MDPI and/or the editor(s) disclaim responsibility for any injury to people or property resulting from any ideas, methods, instructions or products referred to in the content.