Article

Analysis of the Influence of Component Degradation on Different Degradation Indexes of PEMFC

1
School of Automotive Studies, Tongji University, Shanghai 201804, China
2
School of Intelligent Manufacturing, Shanghai Zhongqiao Vocational and Technical University, Shanghai 201514, China
3
Shanghai TXJS Engineering Technology Co., Ltd., Shanghai 201804, China
4
Chinesisch-Deutsches Hochschulkolleg, Tongji University, Shanghai 201804, China
*
Authors to whom correspondence should be addressed.
Energies 2023, 16(23), 7806; https://doi.org/10.3390/en16237806
Submission received: 7 November 2023 / Revised: 19 November 2023 / Accepted: 20 November 2023 / Published: 27 November 2023
(This article belongs to the Special Issue Research and Development of Proton Exchange Membrane Fuel Cells)

Abstract

:
To study the effect of component degradation on different degradation indexes of the proton exchange membrane fuel cell (PEMFC), a novel model of the PEMFC based on component properties was established. Firstly, the four main components, namely the proton exchange membrane (PEM), catalyst layer (CL), gas diffusion layer (GDL), and bipolar plate (BP), were selected. Moreover, a model of each component reflecting their properties was established and verified. Secondly, calculations of the component properties at the initial state and 5% changed were conducted. The results showed that the effects of the different components’ degradation on the different performance and distribution indexes were different. Considering the nine indexes comprehensively, the influence of component degradation on performance degradation was as follows: GDL > PEM = CL > BP.

1. Introduction

Carbon emissions have been one of the core concerns attributed to climate change and environmental pollution. Hydrogen energy is considered as the most promising form of clean energy, attributed to reducing carbon emissions and updating the energy structure. The Chinese government has committed to reaching a carbon emissions peak by 2030 in the China–US Joint Announcement on Climate Change, striving to realize carbon neutrality by 2060, as declared in the 75th United Nations General Assembly [1,2]. The proton exchange membrane fuel cell (PEMFC) is one of the most promising technologies concerning the transfer of hydrogen chemistry energy to electrical energy because it has several advantages, such as zero emissions, high efficiency, and low noise [3]. However, it also has some disadvantages, such as its cost, durability, life, and degradation [2]. Among them, degradation, which is inevitable, is one of the core issues for the commercial application of the PEMFC [4]. Therefore, the study of the degradation rule is helpful to decrease degradation during operation and suggest research directions for new material development.
A number of studies on the degradation of the PEMFC have been conducted. Studies on PEMFC component degradation mainly focus on the following four components: the proton exchange membrane (PEM), catalyst layer (CL), gas diffusion layer (GDL), and bipolar plate (BP).
There are three main reasons for PEM degradation: mechanical degradation, thermal degradation, and chemical/electrochemical degradation. Mechanical degradation includes pinholes and cracks [5] and membrane electrode assembly (MEA) surface delamination [6]. The pinholes and cracks caused by manufacturing defects in the PEM, CL, or MEA usually occur during the early operating stages. They may cause reactant crossover in the corresponding electrodes or the direct combustion of hydrogen and oxygen. MEA surface delamination may be caused by stress cycling, which hinders reactant flow and leads to a serious decrease in performance. The excessive pressure difference on both sides of the PEM can also damage it. PEM degradation indexes include the PEM thickness [7], fluoride release rate (FRR) [8], reactant crossover flux [9], and ionomer concentration [10].
There are two degradation mechanisms of CL, namely Ostwald ripening (OR) and particle migration and coalescence (PMC) [11]. On the one hand, OR involves the migration of adatoms or mobile molecular species driven by differences in free energy and local adatom concentrations on the support surface. On the other hand, PMC involves the mobility of particles in a Brownian-like motion on the support surface, with subsequent coalescence leading to nanoparticle growth. The sintering of CL runs through the entire life of the PEMFC, and the sintering speed of Pt is related to the operating conditions of the vehicle. The PEMFC used in a vehicle requires frequent load changes to meet the requirements of transient loads; therefore, its operating conditions need to change frequently, making effective reactant supply and hydrothermal management difficult. CL degradation includes Pt corrosion [11], carbon support corrosion [12], and ionomer corrosion [13]. The CL degradation indexes include the Pt particle size [14], loss of electrochemical surface area (ECSA), and carbon support [14].
For GDL degradation, the materials of GDL are the same or similar to those of the CL support; therefore, the degradation mechanisms of CL are also applicable to those of GDL. Research on GDL degradation rarely concerns the MEA components because of the slow degradation rate. Fuel starvation can lead to carbon oxidation, which may be caused by an insufficient fuel supply at high current density or local starvation during start/stop cycles or transient loading. The GDL is also affected by thermal and humidity management issues. The excessive humidity at high current densities can lead to flooding, resulting in an insufficient supply of reactants in the local areas. Additionally, a high temperature can increase the oxidation rate of the carbon support. The GDL degradation indexes include the hydrophobicity loss [15], water content loss [16], and carbon mass loss [17].
For BP degradation, the contact resistance between the BP and GDL affects the performance of the PEMFC. In addition, the corrosion and oxidation of the BP metal materials seriously affect the durability of the PEM and CL, leading to conductivity loss. The other reason for BP degradation is that BP may deform or fracture under compressive force, which is applied to fully seal the PEMFC and ensure good electrical contact between the PEMFC components.
The above research mainly focuses on the degradation mechanisms of the PEM, CL, GDL, and BP components in the PEMFC. The studies qualitatively analyze the effects of component degradation on PEMFC performance and reveal the reasons for the decline in PEMFC performance caused by component degradation, thus providing a theoretical basis for the modeling of PEMFC component degradation. However, a limitation of these studies is that they only focus on a single component and lack a comprehensive quantitative analysis of the degradation of all components.
In view of the above deficiencies, this work analyzed the effect of PEMFC component degradation on different degradation indexes by comparing the degree of PEMFC performance degradation under the conditions of single and all components’ degradation, in order to determine the extent to which each component’s degradation affects the PEMFC performance. The detailed tasks were as follows. Firstly, a PEMFC model reflecting the properties of each component was established. Secondly, an analysis of PEMFC degradation was conducted from two aspects, namely experiments and simulation. Finally, simulation results reflecting the effect of each component’s degradation on the different degradation indexes, including the performance and distribution, were discussed. This work is helpful in revealing the importance of each component in the different degradation indexes from a novel perspective. Moreover, it can provide theoretical guidance concerning the properties of new materials applied in the PEMFC.

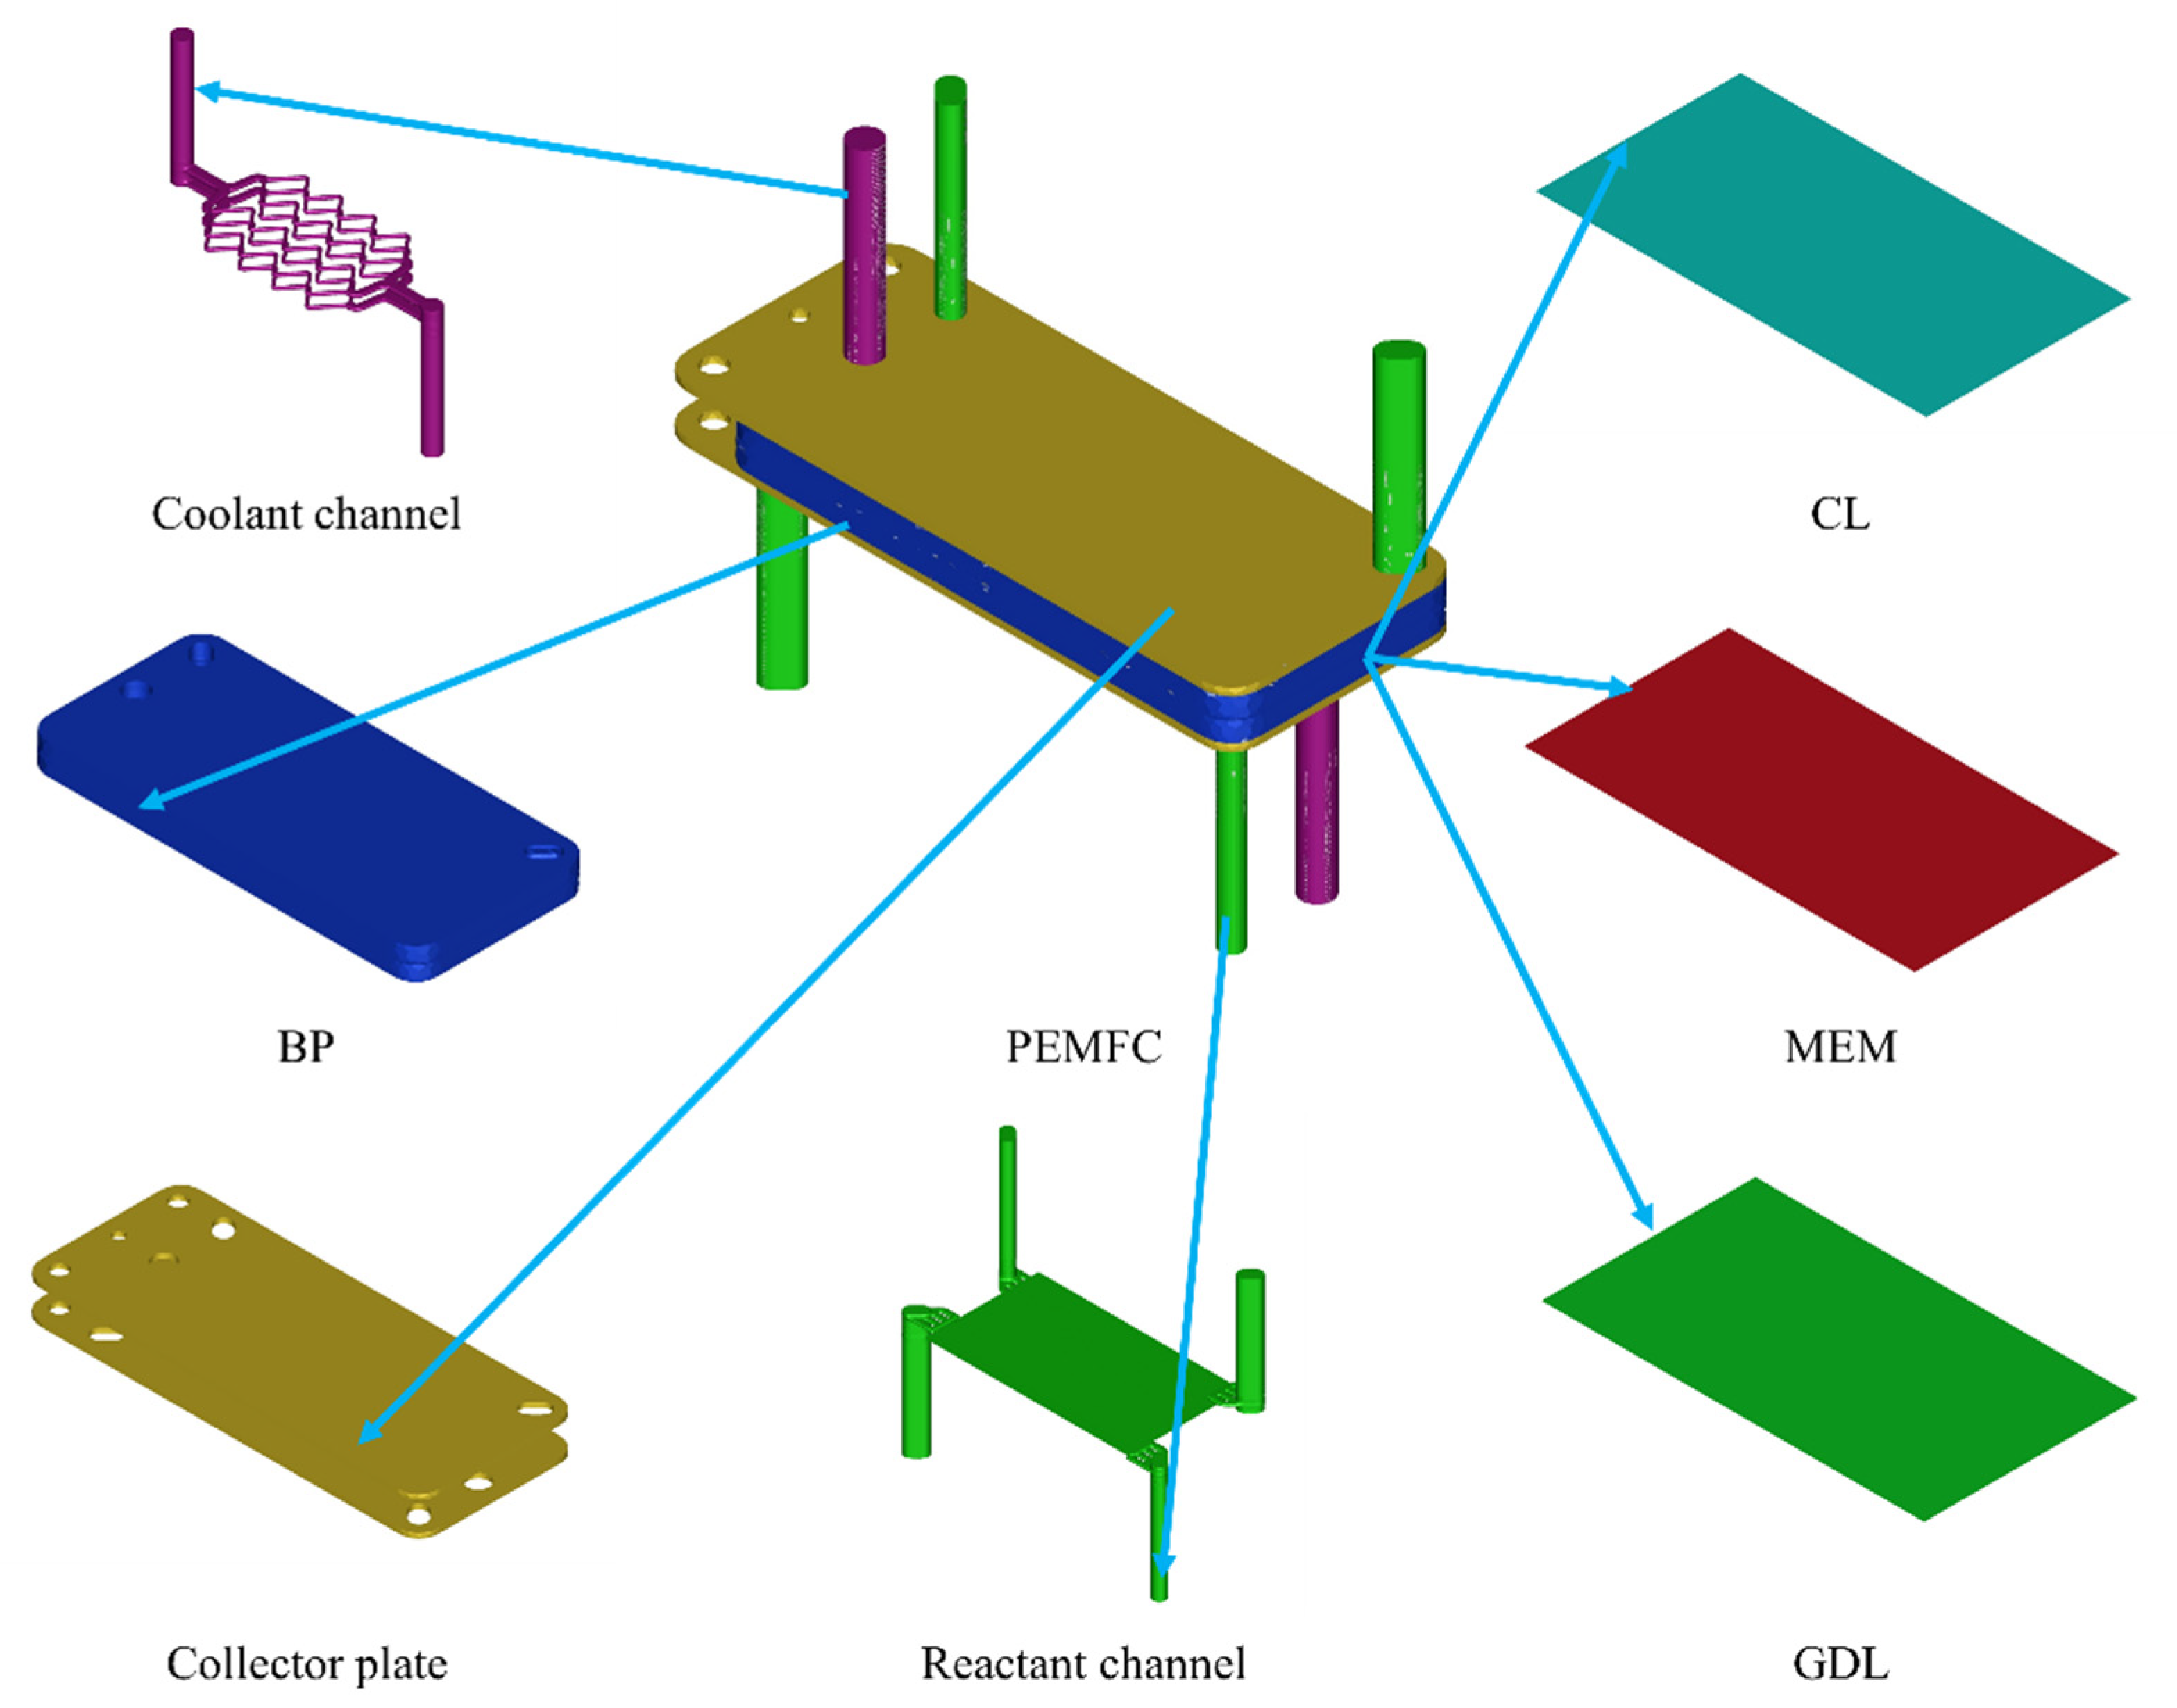
2. PEMFC Model Description

This section introduces the governing equations, source terms, and calculation boundary conditions in the different PEMFC regions.

2.1. Governing Equations and Source Terms

The governing equations in the different PEMFC regions and the source terms are shown in Table 1 and Table 2, respectively. The descriptions of all the symbols are shown in Table A1 in Appendix A. The governing equations describe heat and mass transfer in the different regions of the PEMFC according to the law of conservation of mass, law of conservation of momentum, and law of conservation of energy. Moreover, the source terms describe the relationships of the mass, momentum, charge, and heat of the PEMFC.

2.2. Calculation Boundary Conditions in the Different PEMFC Regions

The calculation boundary conditions in the different PEMFC regions involving several assumptions are shown in Table 3.

2.3. PEMFC Model Validation

The PEMFC model characterizing the component properties is validated by comparing it with the experimental data. The detailed initial boundary conditions and parameters of each component are shown in Section 3.2 and Section 3.3. The current densities in the experiment and simulation are 0.7 A/cm2 and 0.66265 A/cm2, respectively, when the boundary conditions of the simulation are equal to those of the experiment, and the PEMFC model’s accuracy is 94.7%. This shows that the PEMFC model can reflect the effect of the component properties and apply it to simulate the PEMFC’s degradation.

3. Analysis of the PEMFC Component Degradation

This section mainly describes the simulation of PEMFC degradation. An analysis was conducted to reveal the effect of component degradation on the different degradation indexes. Meanwhile, the details of the degradation experiment can be found in Ref. [19]. It is challenging to obtain the comprehensive internal information in an experiment when the PEMFC is operating. Therefore, simulation has become a significant technology to study the mechanism of PEMFC degradation. Among them, the computational fluid dynamics method [12] and Lattice Boltzmann method [13] are commonly applied.

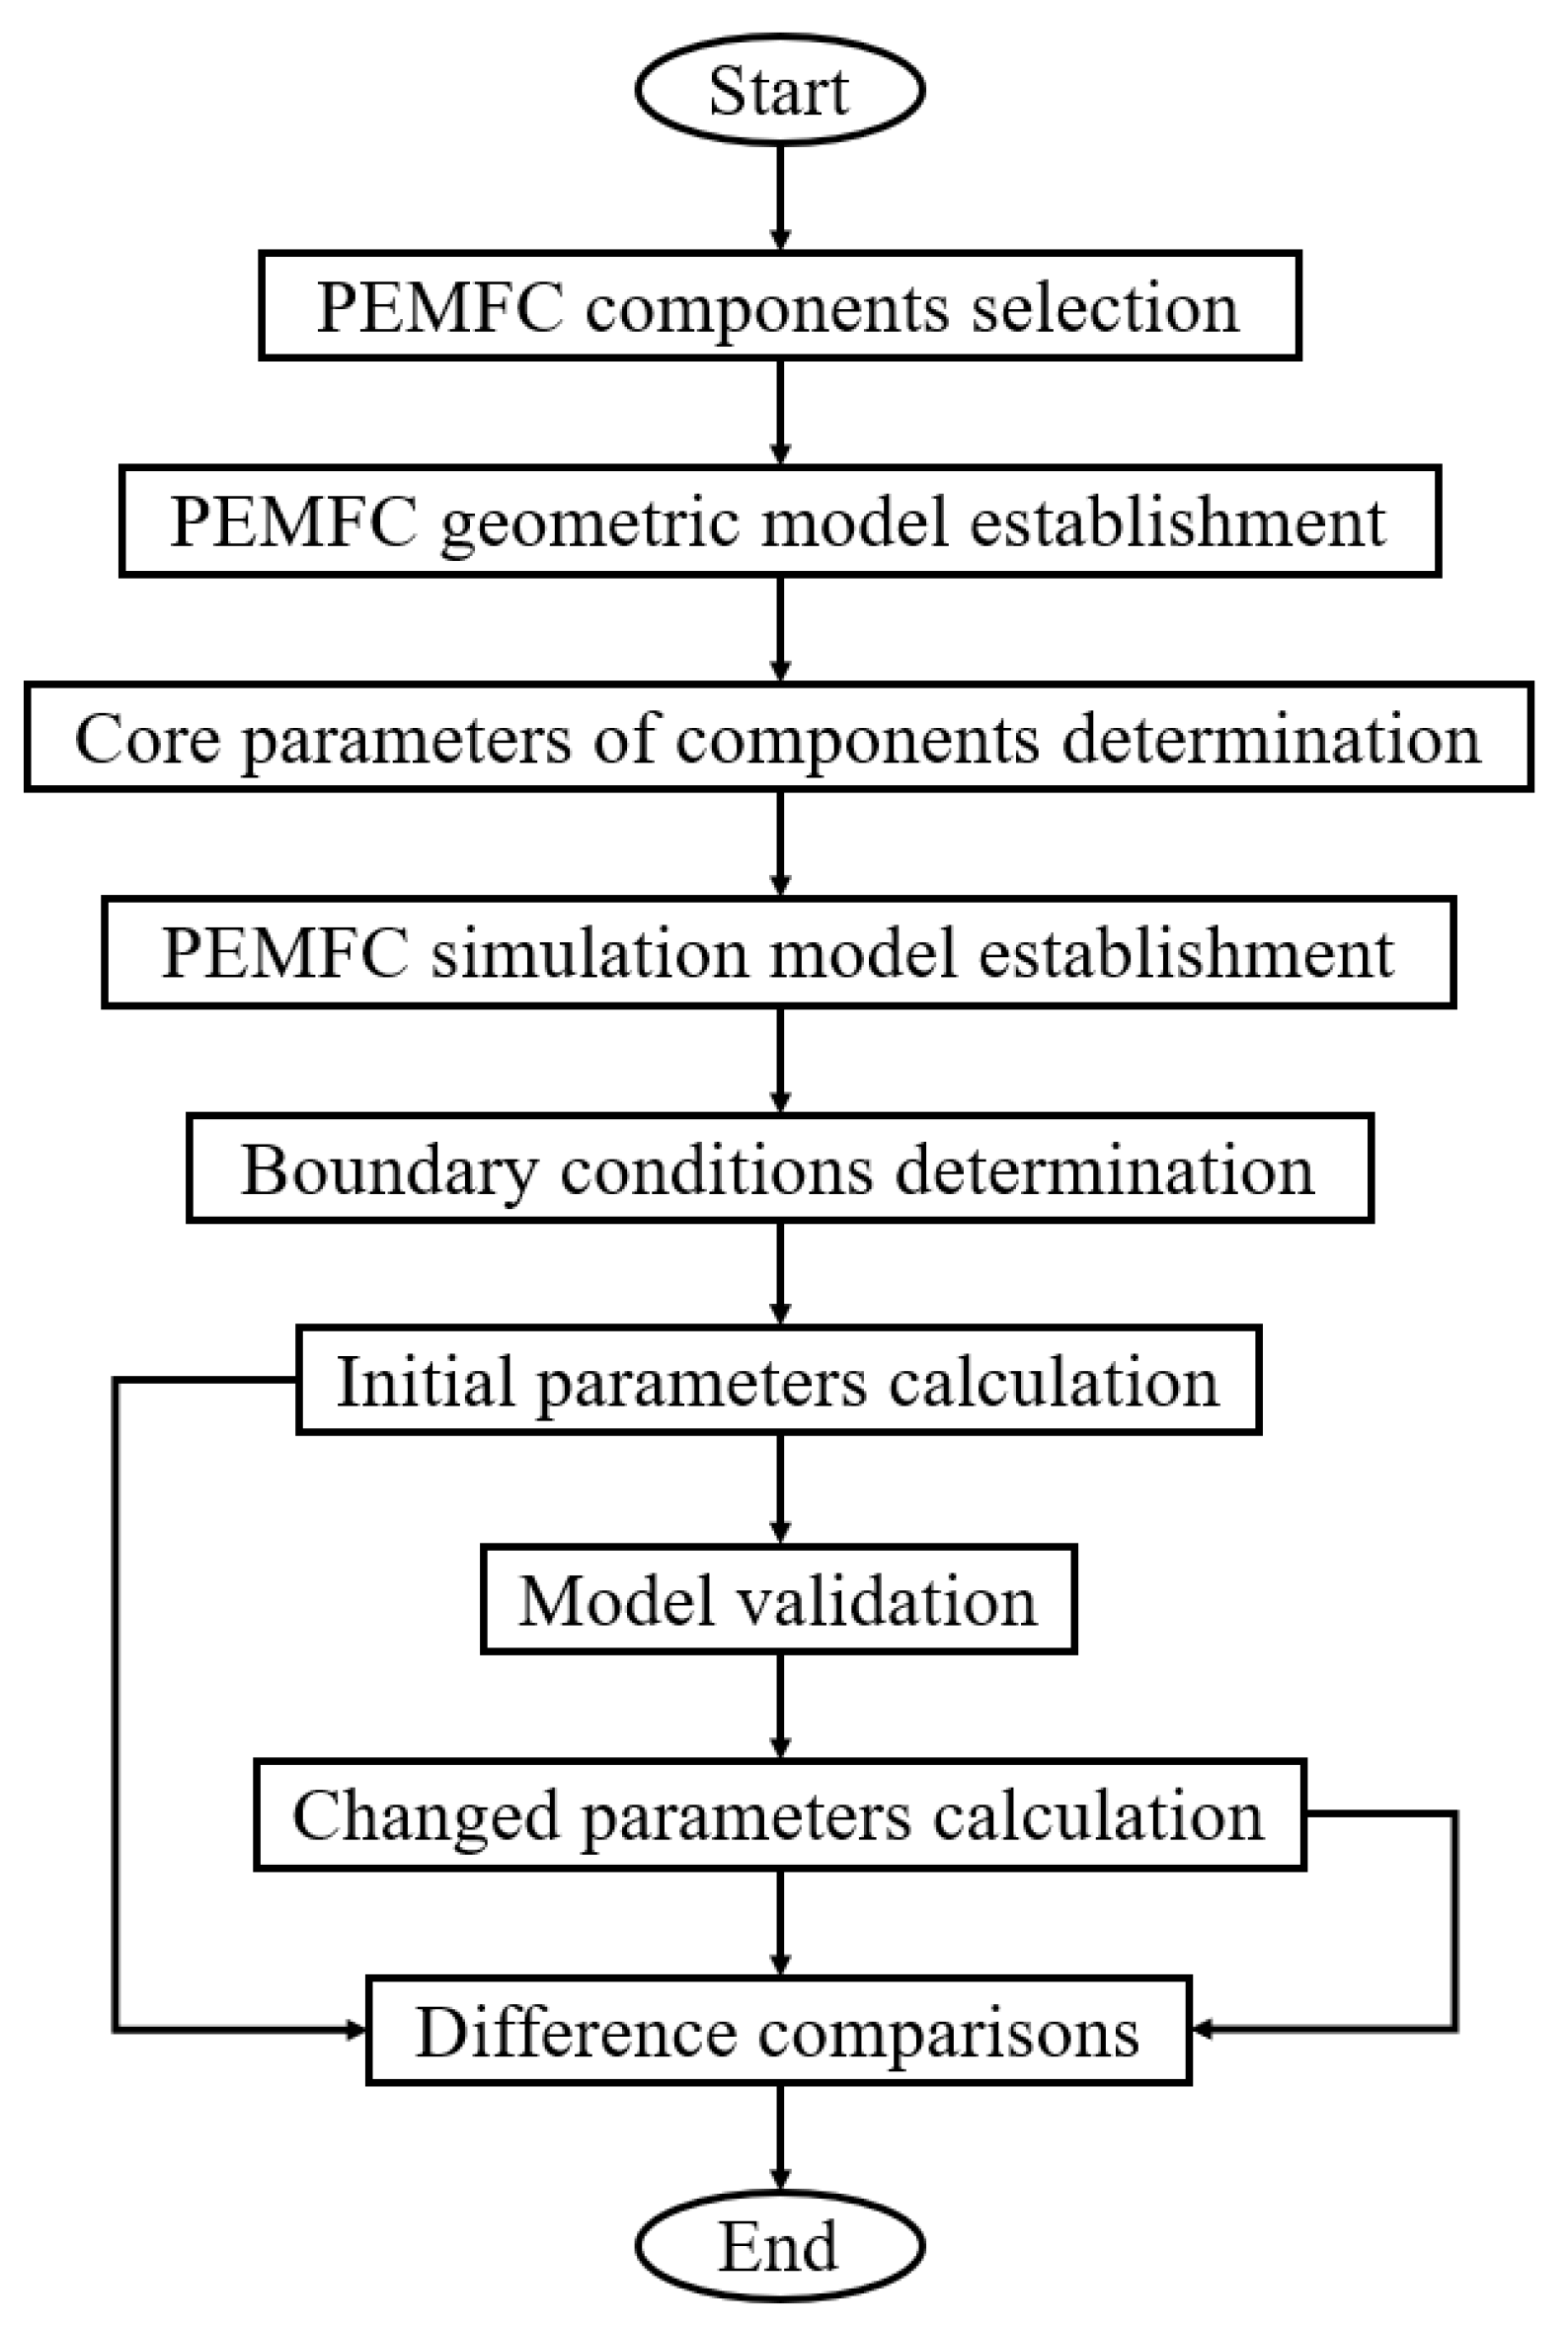
3.1. Simulation Process

The schematic of the PEMFC degradation simulation is shown in Figure 1. Firstly, the PEMFC components, including the PEM, CL, GDL, and BP, are selected. Moreover, the geometric model shown in Figure 2 is established. Secondly, the core parameters of components characterizing the performance degradation of the PEMFC are determined. Thirdly, the boundary (operating) conditions are determined according to the experimental operating conditions because the degradation rate is dependent on the operating conditions. Additionally, the calculations of the initial and changed parameters are conducted. Finally, the difference in the calculation results obtained based on the above conditions is compared.

3.2. Boundary Conditions

To compare and analyze the results between the experiment and simulation, the boundary conditions of the simulation are set as shown in Table 4.

3.3. Core Parameters of Each Component

There are four components of a PEMFC, namely the PEM, CL, GDL, and BP. The detailed core parameters of each component are as follows.

3.3.1. PEM Parameters

The initial and changed values of the PEM parameters, including the electro-osmotic drag coefficient, ionic conductivity, thermal conductivity, and water diffusion coefficient, are shown in Table 5.

3.3.2. CL Parameters

The initial and changed values of the CL parameters, including the agglomerate radius, electrical conductivity, average pore diameter, porosity, thermal conductivity, ionomer film thickness, and electrolyte volume fraction, are shown in Table 6.

3.3.3. GDL Parameters

The initial and changed values of the GDL parameters, including the average pore diameter, porosity, and thermal conductivity, are shown in Table 7.

3.3.4. BP Parameters

The initial and changed values of the BP parameter (electrical conductivity) are shown in Table 8.

4. Results and Discussion

This section presents the detailed results of the different indexes. Additionally, the results of the simulation of component degradation are provided according to the different indexes, including the performance and distribution indexes.

4.1. Performance Indexes

The performance indexes include the current density, activation overpotential at the cathode CL, equilibrium potential at the cathode CL, and exchange current density at the anode CL.

4.1.1. Current Density

With the increase in the operating time, the PEMFC output power slowly decreases because of the component degradation. The current density is a core index to reflect the PEMFC’s performance when the voltage is constant, and it decreases slowly when the voltage and operating conditions are constant. Moreover, it has a series of advantages in real application, e.g., measurement is performed easily, it can be changed sensitively, and the response time is short. The current density under the conditions of the different components’ degradation is shown in Table 9. The effect of the different components’ degradation on the current density is as follows: GDL > PEM > CL > BP. Moreover, the effect of the PEM, CL, GDL, and BP on the current density accounts for approximately 44.6%, 7.6%, 48.2%, and 0.2%, respectively.

4.1.2. Average Activation Overpotential at the Cathode CL

The irreversible voltage loss is the sum of the activation overpotential, ohmic overpotential, and concentration overpotential. The activation overpotential is caused by the limited rate of charge transfer and other activated processes [20]. It is noted that the activation overpotential at the anode is usually negligible compared to that of the cathode, because the cathode activation loss (due to the slow, multiple-step oxygen reduction process at the cathode side) is several magnitudes larger than the anode activation loss (due to hydrogen oxidation, which is a very fast and easily occurring electrochemical process) [21,22]. The average activation overpotential at the cathode CL under the conditions of the different components’ degradation is shown in Table 10. The effect of the different components’ degradation on the average activation overpotential at the cathode CL is as follows: CL > GDL > PEM > BP. Moreover, the effect of the PEM, CL, GDL, and BP on the average activation overpotential at the cathode CL accounts for approximately 25.0%, 37.5%, 37.5%, and 0, respectively.

4.1.3. Average Equilibrium Potential at the Cathode CL

The equilibrium potential determines the CL’s platinum solubility. Moreover, when the PEMFC is operating above/below the equilibrium potential, Pt ions are driven into/from the water [23]. The PEMFC actual potential decreases from its equilibrium potential because of irreversible losses [20]. Ahluwalia et al. [24] proposed the solid solution theory to explain the effects of the Pt nanoparticle size, oxide coverage, and potential on the equilibrium dissolved Pt concentration based on cyclic voltammetry spectroscopy. The average equilibrium potential at the cathode CL under the conditions of the different components’ degradation is shown in Table 11. The effect of the different components’ degradation on the average equilibrium potential at the cathode CL is as follows: GDL > PEM > CL > BP. Moreover, the effect of the PEM, CL, GDL, and BP on the average equilibrium potential at the cathode CL accounts for approximately 28.6%, 14.3%, 50.0%, and 0, respectively.

4.1.4. Average Exchange Current Density at the Anode CL

The exchange current density characterizing the CL’s degradation determines how easily the reaction can occur on electrodes [22,25]. The average exchange current density at the anode CL under the conditions of the different components’ degradation is shown in Table 12. The effect of the different components’ degradation on the average exchange current density at the anode CL is as follows: CL > PEM > GDL > BP. Moreover, the effect of the PEM, CL, GDL, and BP on the average exchange current density at the anode CL accounts for approximately 16.6%, 69.2%, 13.9%, and 0, respectively.

4.2. Distribution Indexes

The distribution indexes include the average membrane water content, H2 molar concentration at the anode CL, O2 molar concentration at the cathode CL, H2 crossover flux, and O2 crossover flux.

4.2.1. Average Membrane Water Content

The membrane water content determines the membrane conductivity and the Pt ion transport rate [23,26]. Adequate membrane water content is important for proton conduction in the polymer film, but excessive water may block the contact in reactants because of the “flooding” phenomenon [27]. If the PEMFC is properly hydrated, the PEM conductivity and the CL electrochemical performance can be greatly improved. On the contrary, the dehydration of the PEM and flooding in the CL will lead to obvious performance degradation [28]. The average membrane water content under the conditions of the different components’ degradation is shown in Table 13. The effect of the different components’ degradation on the average membrane water content is as follows: GDL > CL > PEM > BP.

4.2.2. Average H2 Molar Concentration at the Anode CL

The H2 molar concentration at the anode CL reflects the remaining H2 at the anode CL after the electrochemical reaction. Combined with the current density, this index reflects the PEMFC’s electrical efficiency. The average H2 molar concentration at the anode CL under the conditions of the different components’ degradation is shown in Table 14. The effect of the different components’ degradation on the average H2 molar concentration at the anode CL is as follows: GDL > PEM > CL > BP. Moreover, the effect of the PEM, CL, GDL, and BP on the average H2 molar concentration at the anode CL accounts for approximately 25.4%, 3.6%, 80.1%, and 1.8%, respectively.

4.2.3. Average O2 Molar Concentration at the Cathode CL

With the PEMFC’s degradation, the hydrophobicity of the catalytic layer deteriorates, resulting in more and more water accumulation on the cathode side. The water accumulation also affects the PEMFC’s performance and lifetime. The excess water can block the flow channels and the GDL pores. Moreover, it can instantly lead to reactant starvation. In addition, too much water also aggravates other degradation mechanisms, such as the corrosion and contamination of components. The O2 molar concentration at the cathode CL reflects the remaining O2 at the cathode CL after the electrochemical reaction. Combined with the current density, this index also reflects the PEMFC’s electrical efficiency and the water production. The average O2 molar concentration at the cathode CL under the conditions of the different components’ degradation is shown in Table 15. The effect of the different components’ degradation on the average O2 molar concentration at the cathode CL is as follows: GDL > PEM > CL > BP. Moreover, the effect of the PEM, CL, GDL, and BP on the average O2 molar concentration at the cathode CL accounts for approximately 29.7%, 3.4%, 66.9%, and 0, respectively.

4.2.4. Average H2 Crossover Flux

The H2 crossover leads to hot spot formation in the PEM, and this in turn causes pinholes in the PEM, leading to more H2 crossover. This process will aggravate the PEM’s degradation [23]. Therefore, the average H2 crossover flux can reflect the PEM degradation level. The average H2 crossover flux under the conditions of the different components’ degradation is shown in Table 16. The effect of the different components’ degradation on the average H2 crossover flux is as follows: GDL > CL > PEM > BP. Moreover, the effect of the PEM, CL, GDL, and BP on the average H2 crossover flux accounts for approximately 17.4%, 35.5%, 48.5%, and 0, respectively.

4.2.5. Average O2 Crossover Flux

The O2 crossover also leads to hot spot formation in the PEM, and this in turn causes pinholes in the PEM, leading to more O2 crossover. This process will aggravate the PEM’s degradation [23]. Therefore, the average O2 crossover flux can reflect the PEM degradation level. The average O2 crossover flux under the conditions of the different components’ degradation is shown in Table 17. The negative sign indicates that the transfer direction is from the cathode to the anode. The effect of the different components’ degradation on the average O2 crossover flux is as follows: CL > PEM > GDL > BP.
To summarize, the effect levels of the components’ degradation on the different indexes, including the performance and distribution indexes, are provided in Table 18. The effect level of the components’ degradation is represented by the number, and the smaller the number, the greater the effect level. Considering the nine indexes comprehensively, the influence of component degradation on performance degradation is as follows: GDL > PEM = CL > BP.

5. Conclusions

This paper studies the effect of the four main components’ (PEM, CL, GDL, and BP) degradation on the PEMFC’s performance, focusing on a change of 5% in the related parameters of each PEMFC component. The detailed conclusions are as follows.
(a)
The effects of the components’ degradation on the different indexes (performance and distribution) are provided. The effects of the different components’ degradation on the current density, average activation overpotential at the cathode CL, average equilibrium potential at the cathode CL, average exchange current density at the anode CL, average H2 molar concentration at the anode CL, average O2 molar concentration at the cathode CL, average membrane water content, average H2 crossover flux, and average O2 crossover flux are as follows: GDL > PEM > CL > BP, CL > GDL > PEM > BP, GDL > PEM > CL > BP, CL > PEM > GDL > BP, GDL > PEM > CL > BP, GDL > PEM > CL > BP, GDL > CL > PEM > BP, GDL > CL > PEM > BP, and CL > PEM > GDL > BP, respectively. Considering the nine indexes comprehensively, the influence of the components’ degradation on the performance degradation is as follows: GDL > PEM = CL > BP.
(b)
For the performance indexes, the effects of the PEM, CL, GDL, and BP on the current density account for approximately 44.6%, 7.6%, 48.2%, and 0.2%, respectively. The effects of the PEM, CL, GDL, and BP on the average activation overpotential at the cathode CL account for approximately 25.0%, 37.5%, 37.5%, and 0, respectively. The effects of the PEM, CL, GDL, and BP on the average equilibrium potential at the cathode CL account for approximately 28.6%, 14.3%, 50.0%, and 0, respectively. The effects of the PEM, CL, GDL, and BP on the average exchange current density at the anode CL account for approximately 16.6%, 69.2%, 13.9%, and 0, respectively.
(c)
For the distribution indexes, the effect of the PEM, CL, GDL, and BP on the average H2 molar concentration at the anode CL accounts for approximately 25.4%, 3.6%, 80.1%, and 1.8%, respectively. The effect of the PEM, CL, GDL, and BP on the average O2 molar concentration at the cathode CL accounts for approximately 29.7%, 3.4%, 66.9%, and 0, respectively. The effect of the PEM, CL, GDL, and BP on the average H2 crossover flux accounts for approximately 17.4%, 35.5%, 48.5%, and 0, respectively.
(d)
This work provides theoretical guidance for the selection and preparation of PEMFC component materials and also points out the possibility to delay the PEMFC’s performance degradation. At the same time, it expands the detection range during the PEMFC’s operation and provides more comprehensive indexes for the estimation of the state of health and the prediction of the remaining useful life.

Author Contributions

Conceptualization, L.F. and S.Z.; methodology, L.F. and W.S.; software, L.F., J.G. and Y.L.; validation, J.G. and Y.L.; formal analysis, L.F. and J.G.; investigation, L.F., J.G. and Y.L.; resources, W.S. and S.Z.; data curation, Y.L.; writing—original draft preparation, L.F., J.G. and Y.L.; writing—review and editing, W.S. and S.Z.; visualization, L.F., J.G. and Y.L.; supervision, S.Z.; project administration, S.Z.; funding acquisition, W.S. and S.Z. All authors have read and agreed to the published version of the manuscript.

Funding

This research received no external funding.

Data Availability Statement

Data are contained within the article.

Acknowledgments

This work was supported by Shanghai TXJS Engineering Technology Co., Ltd., Shanghai REFIRE Technology Co., Ltd., AVL-List Gmbh, and the IEEE PHM 2014 Data Challenge (experimental data were provided by FCLAB Federation, FR CNRS 3539, France).

Conflicts of Interest

W.S. were employed by the Shanghai TXJS Engineering Technology Co., Ltd. The remaining authors declare that the research was conducted in the absence of any commercial or financial relationships that could be construed as a potential conflict of interest.

Appendix A

Table A1. The descriptions of all the symbols.
b Partial pressure index κ Mass transfer coefficient
c Specific heat capacity μ Dynamic viscosity
C w Dissolved water content ρ Density
D Diffusion coefficient ϕ Potential
E W Ionomer equivalent
F Faraday constantSuperscript and subscript
h External heat transfer coefficientactActivation polarization
H Specific total enthalpyaggAgglomerate
j Current densityanoAnode
J Diffusion mass fluxcapCapillary
K Fluid permeability tensorcatCathode
N u Nusselt numberecElectrochemical reaction
p PressureeleElectrical phases
Q PowereqEquilibrium
r RadiusfilmIonomer film
R Gas constantgGas phase
T TemperatureH2Hydrogen
v Velocity of flowionIonic phase
V VoltagekSubstance k
x Molar fractionlLiquid phase
y Mass fractionO2Oxygen
α Phase volume fractionohmOhmic polarization
β Charge transfer coefficientrefReference
δ ThicknesswDissolved water
η EfficiencywallWall surface

References

  1. Zhou, S.; Fan, L.; Zhang, G.; Gao, J.; Lu, Y.; Zhao, P.; Wen, C.; Shi, L.; Hu, Z. A review on proton exchange membrane multi-stack fuel cell systems: Architecture, performance, and power management. Appl. Energy 2022, 310, 118555–118579. [Google Scholar] [CrossRef]
  2. Li, Y.; Yang, F.; Chen, D.; Hu, S.; Xu, X. Thermal-physical modeling and parameter identification method for dynamic model with unmeasurable state in 10-kW scale proton exchange membrane fuel cell system. Energy Convers. Manag. 2023, 276, 116580. [Google Scholar] [CrossRef]
  3. Liu, Y.; Fan, L.; Pei, P.; Yao, S.; Wang, F. Asymptotic analysis for the inlet relative humidity effects on the performance of proton exchange membrane fuel cell. Appl. Energy 2018, 213, 573–584. [Google Scholar] [CrossRef]
  4. Fukuhara, S.; Marx, N.; Ettihir, K.; Boulon, L.; Ait-Amirat, Y.; Becherif, M. A lumped fluidic model of an anode chamber for fault tolerant strategy design. Int. J. Hydrogen Energy 2016, 41, 5037–5047. [Google Scholar] [CrossRef]
  5. Kim, S.; Ahn, B.K.; Mench, M.M. Physical degradation of membrane electrode assemblies undergoing freeze/thaw cycling: Diffusion media effects. J. Power Sources 2008, 179, 140–146. [Google Scholar] [CrossRef]
  6. Shi, S.; Sun, X.; Lin, Q.; Chen, J.; Fu, Y.; Hong, X.; Li, C.; Guo, X.; Chen, G.; Chen, X. Fatigue crack propagation behavior of fuel cell membranes after chemical degradation. Int. J. Hydrogen Energy 2020, 45, 27653–27664. [Google Scholar] [CrossRef]
  7. Yuan, X.-Z.; Zhang, S.; Wang, H.; Wu, J.; Sun, J.C.; Hiesgen, R.; Friedrich, K.A.; Schulze, M.; Haug, A. Degradation of a polymer exchange membrane fuel cell stack with Nafion® membranes of different thicknesses: Part I. In situ diagnosis. J. Power Sources 2010, 195, 7594–7599. [Google Scholar] [CrossRef]
  8. Lim, C.; Ghassemzadeh, L.; Van Hove, F.; Lauritzen, M.; Kolodziej, J.; Wang, G.G.; Holdcroft, S.; Kjeang, E. Membrane degradation during combined chemical and mechanical accelerated stress testing of polymer electrolyte fuel cells. J. Power Sources 2014, 257, 102–110. [Google Scholar] [CrossRef]
  9. Inaba, M.; Kinumoto, T.; Kiriake, M.; Umebayashi, R.; Tasaka, A.; Ogumi, Z. Gas crossover and membrane degradation in polymer electrolyte fuel cells. Electrochim. Acta 2006, 51, 5746–5753. [Google Scholar] [CrossRef]
  10. Wu, B.; Zhao, M.; Shi, W.; Liu, W.; Liu, J.; Xing, D.; Yao, Y.; Hou, Z.; Ming, P.; Gu, J.; et al. The degradation study of Nafion/PTFE composite membrane in PEM fuel cell under accelerated stress tests. Int. J. Hydrogen Energy 2014, 39, 14381–14390. [Google Scholar] [CrossRef]
  11. Shao, Y.; Yin, G.; Gao, Y. Understanding and approaches for the durability issues of Pt-based catalysts for PEM fuel cell. J. Power Sources 2007, 171, 558–566. [Google Scholar] [CrossRef]
  12. Qu, L.; Wang, Z.; Guo, X.; Song, W.; Xie, F.; He, L.; Shao, Z.; Yi, B. Effect of electrode Pt-loading and cathode flow-field plate type on the degradation of PEMFC. J. Energy Chem. 2018, 35, 95–103. [Google Scholar] [CrossRef]
  13. Sharma, R.; Andersen, S.M. Quantification on degradation mechanisms of polymer electrolyte membrane fuel cell catalyst layers during an accelerated stress test. ACS Catal. 2018, 8, 3424–3434. [Google Scholar] [CrossRef]
  14. Bi, W.; Fuller, T.F. Modeling of PEM fuel cell Pt/C catalyst degradation. J. Power Sources 2008, 178, 188–196. [Google Scholar] [CrossRef]
  15. Pauchet, J.; Prat, M.; Schott, P.; Kuttanikkad, S.P. Performance loss of proton exchange membrane fuel cell due to hydrophobicity loss in gas diffusion layer: Analysis by multiscale approach combining pore network and performance modelling. Int. J. Hydrogen Energy 2012, 37, 1628–1641. [Google Scholar] [CrossRef]
  16. Zhang, X.; Yang, Y.; Zhang, X.; Liu, H. Identification of performance degradations in catalyst layer and gas diffusion layer in proton exchange membrane fuel cells. J. Power Sources 2020, 449, 227580. [Google Scholar] [CrossRef]
  17. Liu, H.; George, M.G.; Messerschmidt, M.; Zeis, R.; Kramer, D.; Scholta, J.; Bazylak, A. Accelerated degradation of polymer electrolyte membrane fuel cell gas diffusion layers. J. Electrochem. Soc. 2017, 164, F695–F703. [Google Scholar] [CrossRef]
  18. Yin, C.; Gao, Y.; Li, T.; Xie, G.; Li, K.; Tang, H. Study of internal multi-parameter distributions of proton exchange membrane fuel cell with segmented cell device and coupled three-dimensional model. Renew. Energy 2020, 147, 650–662. [Google Scholar] [CrossRef]
  19. Fan, L.; Zhou, S.; Zhao, P.; Gao, J. A Novel Hybrid Method Based on the Sliding Window Method for the Estimation of the State of Health of the Proton Exchange Membrane Fuel Cell; SAE Technical Paper Series; IEEE: Piscataway, NJ, USA, 2023. [Google Scholar]
  20. Pohl, E.; Maximini, M.; Bauschulte, A.; vom Schloß, J.; Hermanns, R.T.E. Degradation modeling of high temperature proton exchange membrane fuel cells using dual time scale simulation. J. Power Sources 2015, 275, 777–784. [Google Scholar] [CrossRef]
  21. Liu, M.; Wu, D.; Yin, C.; Gao, Y.; Li, K.; Tang, H. Prediction of voltage degradation trend for a proton exchange membrane fuel cell city bus on roads. J. Power Sources 2021, 512, 230435. [Google Scholar] [CrossRef]
  22. Zhou, D.; Wu, Y.; Gao, F.; Breaz, E.; Ravey, A.; Miraoui, A. Degradation prediction of PEM fuel cell stack based on multi-physical aging model with particle filter approach. IEEE Ind. Appl. Soc. Annu. Meet. 2017, 53, 4041–4052. [Google Scholar] [CrossRef]
  23. Schmittinger, W.; Vahidi, A. A review of the main parameters influencing long-term performance and durability of PEM fuel cells. J. Power Sources 2008, 180, 1–14. [Google Scholar] [CrossRef]
  24. Ahluwalia, R.K.; Arisetty, S.; Wang, X.; Wang, X.; Subbaraman, R.; Ball, S.C.; DeCrane, S.; Myers, D.J. Thermodynamics and Kinetics of Platinum Dissolution from Carbon-Supported Electrocatalysts in Aqueous Media under Potentiostatic and Potentiodynamic Conditions. J. Electrochem. Soc. 2013, 160, F447–F455. [Google Scholar] [CrossRef]
  25. Liu, H.; Chen, J.; Hissel, D.; Lu, J.; Hou, M.; Shao, Z. Prognostics methods and degradation indexes of proton exchange membrane fuel cells: A review. Renew. Sustain. Energy Rev. 2020, 123, 109721–109742. [Google Scholar] [CrossRef]
  26. Bi, W.; Sun, Q.; Deng, Y.; Fuller, T.F. The effect of humidity and oxygen partial pressure on degradation of Pt/C catalyst in PEM fuel cell. Electrochim. Acta 2009, 54, 1826–1833. [Google Scholar] [CrossRef]
  27. Kim, M.; Jung, N.; Eom, K.; Yoo, S.J.; Kim, J.Y.; Jang, J.H.; Kim, H.-J.; Hong, B.K.; Cho, E. Effects of anode flooding on the performance degradation of polymer electrolyte membrane fuel cells. J. Power Sources 2014, 266, 332–340. [Google Scholar] [CrossRef]
  28. Wang, F.; Yang, D.; Li, B.; Zhang, H.; Hao, C.; Chang, F.; Ma, J. Investigation of the recoverable degradation of PEM fuel cell operated under drive cycle and different humidities. Int. J. Hydrogen Energy 2014, 39, 14441–14447. [Google Scholar] [CrossRef]
Figure 1. Schematic of PEMFC degradation simulation.
Energies 16 07806 g001
Figure 2. PEMFC geometric model.
Energies 16 07806 g002
Table 1. Governing equations in the different PEMFC regions [18].
Solution Quantity: Storage and TransportSource 1
CHAGDLCCLPEMACLBPCC
p : ( α g ρ g + α l ρ l ) t + · α g ρ g v g + α l ρ l v l 00 S g d S l d - S g d S l d -0
v g : ( α g ρ g v g ) t + · α g ρ g v g v g α g μ g v g + v g T + α g p F g l + F p c F p c F g s F p c F g s - F p c F g s --
v l : ( α l ρ l v l ) t + · α l ρ l v l v l α l μ l v l + v l T + α l p F g l F p c F p c F l s + F c a p F p c F l s + F c a p - F p c F l s + F c a p -0
α g : α g ρ g t + · α g ρ g v g S l g S l g S g d + S l d - S g d + S l d --
α l : α l ρ l t + · α l ρ l v l S l g S l g S l d S l g - S l d S l g --
y k , g = α g ρ g y k , g t + · α g ρ g v g y k , g + α g j k , g
for   k n s   with   y k , g = 1   and   x k = 1 ρ g τ i k x k x i D k i ( j i , g y i , g j k , g y k , g )
S l g S l g S g d , k + S l g - S g d , k + S l g --
C w : t α i o n ρ i o n E W C w + · n ˙ w
with   n ˙ w = C d r a g α i o n σ i o n ϕ i o n F α i o n ρ i o n E W D w C w
-- S g d , w + S l g + S e c , w 0 S g d , w + S l g --
x k , w : t α i o n ρ i o n E W C w x k , w + · n ˙ w x k , w ρ i o n E W C w D k , w x k , w
for   k H 2 O
-- S g d , k S a g g , k 0 S g d , k S a g g , k --
c k , a g g : α i o n , a g g c k , a g g t 1 r 2 t r 2 D k , w α i o n , a g g 1.5 c k , a g g t
For   k = O 2 , H 2   with   α i o n , a g g = 1 α e l e α s r a g g + δ f i l m r a g g 3 ,   0 < r r a g g 1 ,   r a g g < r < r a g g + δ f i l m
-- S e c , O 2 0 S e c , H 2 --
ϕ e l e :   · α e l e σ e l e ϕ e l e -0 J e c - J e c 0-
ϕ i o n :   · α i o n σ i o n ϕ i o n -- J e c 0 J e c --
T g : α g ρ g H g t + · α g ρ g v g H g α g κ g T g + α g k j k , g h k , g + α g p t · α g μ g v g + v g T · v g Q l g + Q p c Q g s + Q l g + Q p c Q g s + Q l g + Q p c - Q g s + Q l g + Q p c --
T l : α l ρ l H l t + · α l ρ l v l H l α l κ l T l + α l p t · [ α l μ l ( v l + v l T ) · v l ] Q l g Q p c Q l s Q l g Q p c Q l s Q l g Q p c - Q l s Q l g Q p c -0
T s : α s ρ s c p , s T s t · α s κ s T s
With   H p = c p , p T p T r e f , p + v p 2 2   for   p = g , l
- Q l s + Q g s + Q o h m Q l s + Q g s + Q o h m + Q e c , c a t Q o h m Q l s + Q g s + Q o h m + Q e c , a n o Q o h m -
1 CHA, GDL, CCL, PEM, ACL, BP, and CC refer to the gas channel, gas diffusion layer, cathode catalyst layer, proton exchange membrane, anode catalyst layer, bipolar plate, and cooling channel, respectively.
Table 2. Source terms.
Source QuantitySource Definition
Mass S a g g , k = 3 α s r a g g + δ f i l m n ˙ k , a g g r = r a g g + δ f i l m ,   k = O 2 , H 2 0 ,   k O 2 , H 2
S e c , H 2 = J e c , a g g 2 F
S e c , O 2 = J e c , a g g 4 F
S e c , w = J e c 2 F
S g d = k H 2 O S g d , k + S g d , w
S g d , k = k g d , k p k H k ρ i o n E W C w x k , w   for   k H 2 O
S g d , w = 1 s l k g d , w ρ i o n E W C w , e q C w
S l d = s l k g d , w ρ i o n E W C w , e q C w
S l g = 6 α l d l ρ ¯ g D ¯ H 2 O , g S h ~ H 2 O , g d l ln 1 + B m
Momentum F c a p = α l p c a p
F g s = α g 2 μ g s g 3 K 1 v g
F l s = α l 2 μ l s l 3 K 1 v l
F p c = S l g v l g , H 2 O
Charge J e c = 3 α s 4 π r a g g + δ f i l m 3 V a g g J e c , a g g d V
with   J e c , a g g = J 0 , a g g exp 2 β F R T s η a c t exp 2 ( 1 β ) F R T s η a c t
with   J 0 , agg = J 0 , r e f 1 α s r a g g + δ f i l m r a g g 3 H O 2 p r e f b O 2 H H 2 p r e f b H 2 p H 2 O p r e f b H 2 O α g ε exp E a c t R 1 T r e f 1 T s c O 2 , a g g b O 2 c H 2 , a g g b H 2   and   η a c t = ϕ e l e ϕ i o n ϕ e q
with   ϕ e q , c a t = 1.498 9 × 10 4 T g + R T g 4 F ln p O 2 p r e f p H 2 O 2   and   ϕ e q , a n o = R T g 2 F ln p r e f p H 2
Heat Q e c , a n o = J e c η a c t + T g ϕ e q T
Q e c , c a t = J e c η a c t T g ϕ e q T
Q g s = s g 6 α s d s κ g N u g d s ( T g T s )
Q l g = S l g B t c ¯ p , H 2 O , g T l T g ,   S l g 0 6 α l d l κ ¯ g N u g d l T l T g , S l g = 0  
Q l s = s l 6 α s d s κ l N u l d s T l T s
Q o h m = α e l e σ e l e ϕ e l e · ϕ e l e + α i o n σ i o n ϕ i o n · ϕ i o n
Q p c = S l g h H 2 O , g
Table 3. Calculation boundary conditions in the different PEMFC regions.
Solution QuantityCalculation Boundary ConditionsPEMFC Regions
p p = p o u t CHA outlet, CC outlet
v g v g · n = m ˙ g A i n ρ g   with   m ˙ g , c a = λ I o p F M O 2 4 y O 2 ,   m ˙ g , a n = λ I o p F M H 2 2 y H 2 CHA inlet
v l v l · n = m ˙ l , i n A i n ρ l CHA inlet, CC inlet
α g α g = α g , i n CHA inlet
α l α l = α l , i n CHA inlet
y k , g y k , g = x k , g M k M with
x k , g = φ H 2 O , i n p H 2 O , s a t / p ,                 k = H 2 O x k , g , d r y , i n 1 x H 2 O , g ,   k H 2 O
CHA inlet
x k , w x k , w = 0   for   k = H 2 ,   anode O 2 ,   cathode PEM/CL interface
c k , a g g c k , a g g r r = 0 = 0 Agglomerate center
c k , a g g ( c k , a g g ) r = r a g g + δ f i l m = ρ i o n E W c w x k , w Agglomerate surface
ϕ e l e ϕ e l e · n = σ e l e 1 I o p / A t e r m   o r   ϕ e l e = V o p ,   cathode ϕ e l e = 0 ,   anode Electrical terminal
ϕ e l e
ϕ i o n
ϕ e l e · n = σ e l e 1 i r , c r o s s ϕ i o n · n = + σ i o n 1 i r , c r o s s
with   i r , c r o s s = F 2 n ˙ H 2 · n ,   cathode F 4 n ˙ O 2 · n ,   anode
PEM/CL interface
T g T g = T g , i n CHA inlet
T l T l = T l , i n CHA inlet, CC inlet
T s T s · n = κ s 1 h ( T w a l l T ) Lateral walls
Table 4. Boundary conditions of the simulation.
Boundary ConditionsValue
Voltage (V)0.665
Temperature of the anode inlet (K)297.687
Temperature of the cathode inlet (K)316.367
Temperature of the coolant (K)325.877
Pressure of the anode inlet (Pa)128,286.3
Pressure of the cathode inlet (Pa)129,953.1
Flow rate of the anode inlet (L/min)4.793
Flow rate of the cathode inlet (L/min)23.038
Flow rate of the coolant (L/min)0.4028
Relative humidity of the cathode inlet (-)54.351%
Table 5. PEM parameters.
PEM ParameterInitialChanged
Electro-osmotic drag coefficient (-)0.11360.10792
Ionic conductivity (A/(V·m))0.18790.178505
Thermal conductivity (W/(m·K))0.20.21
Water diffusion coefficient (m2/s)2.16 × 10−112.052 × 10⁻¹¹
Table 6. CL parameters.
CL ParameterInitialChanged (Anode and Cathode)
Agglomerate radius (m) 5 × 10 7 5.25 × 10 7
Electrical conductivity (A/(V·m))13,51412,838.3
Average pore diameter (m) 5 × 10 8 5.25 × 10 8
Porosity (-)0.40.42
Thermal conductivity (W/(m·K))2.742.877
Ionomer film thickness (m) 5 × 10 8 4.75 × 10 8
Electrolyte volume fraction (-)0.250.2375
Table 7. GDL parameters.
GDL ParameterInitialChanged (Anode and Cathode)
Average pore diameter (m) 1.5 × 10 6 1.575 × 10 6
Porosity (-)0.40.42
Thermal conductivity (W/(m·K))55.25
Table 8. BP parameter.
BP ParameterInitialChanged
Electrical conductivity (-) 1.45 × 10 6 1.3775 × 10 6
Table 9. Current densities under the conditions of the different components’ degradation.
ComponentCurrent Density (A/cm2)
Initial0.66265
PEM0.65100
CL0.66065
GDL0.65006
BP0.66259
Whole0.63657
Table 10. Average activation overpotential at the cathode CL under the conditions of the different components’ degradation.
ComponentAverage Activation Overpotential at the Cathode CL (V)
Initial0.3685
PEM0.3681
CL0.3679 (0.367894)
GDL0.3679 (0.367935)
BP0.3685
Whole0.3669
Table 11. Average equilibrium potential at the cathode CL under the conditions of the different components’ degradation.
ComponentAverage Equilibrium Potential at the Cathode CL (V)
Initial1.2072
PEM1.2076
CL1.2074
GDL1.2079
BP1.2072
Whole1.2086
Table 12. Average exchange current density at the anode CL under the conditions of the different components’ degradation.
ComponentAverage Exchange Current Density at the Anode CL (A/cm3)
Initial 4.9712 × 10 2
PEM 4.9761 × 10 2
CL 4.9916 × 10 2
GDL 4.9753 × 10 2
BP 4.9712 × 10 2
Whole 5.0007 × 10 2
Table 13. Average membrane water content under the conditions of the different components’ degradation.
ComponentAverage Membrane Water Content (-)
Initial5.0998
PEM5.0820
CL5.1315
GDL4.9821
BP5.0995
Whole4.9955
Table 14. Average H2 molar concentration at the anode CL under the conditions of the different components’ degradation.
ComponentAverage H2 Molar Concentration at the Anode CL (mol/m3)
Initial27.9746
PEM28.0034
CL27.9705
GDL28.0653
BP27.9748
Whole28.0879
Table 15. Average O2 molar concentration at the cathode CL under the conditions of the different components’ degradation.
ComponentAverage O2 Molar Concentration at the Cathode CL (mol/m3)
Initial0.6309
PEM0.6379
CL0.6317
GDL0.6467
BP0.6309
Whole0.6545
Table 16. Average H2 crossover flux under the conditions of the different components’ degradations.
ComponentAverage H2 Crossover Flux (mol/(m2·s))
Initial 4.2280 × 10 4
PEM 4.1969 × 10 4
CL 4.1645 × 10 4
GDL 4.1413 × 10 4
BP 4.2279 × 10 4
Whole 4.0491 × 10 4
Table 17. Average O2 crossover flux under the conditions of the different components’ degradation.
ComponentAverage O2 Crossover Flux (mol/(m2·s))
Initial 2.9278 × 10 6
PEM 2.9397 × 10 6
CL 2.8773 × 10 6
GDL 2.9217 × 10 6
BP 2.9276 × 10 6
Whole 2.8826 × 10 6
Table 18. Effect levels of the components’ degradation on the different indexes.
IndexEffect Levels of the Components’ Degradation
PEMCLGDLBP
Current density2314
Average activation overpotential at the cathode CL3124
Average equilibrium potential at the cathode CL2314
Average exchange current density at the anode CL2134
Average membrane water content2314
Average H2 molar concentration at the anode CL2314
Average O2 molar concentration at the cathode CL2314
Average H2 crossover flux3214
Average O2 crossover flux2134
Disclaimer/Publisher’s Note: The statements, opinions and data contained in all publications are solely those of the individual author(s) and contributor(s) and not of MDPI and/or the editor(s). MDPI and/or the editor(s) disclaim responsibility for any injury to people or property resulting from any ideas, methods, instructions or products referred to in the content.

