Article

Economic Evaluation of a 1 MWel Capacity Power-to-Biomethane System

1
Institute of Applied Economics, Faculty of Economics and Business, University of Debrecen, H-4032 Debrecen, Hungary
2
HUN-REN-DE High-Tech Technologies for Sustainable Management Research Group, University of Debrecen, Boszormenyi Street 138, H-4032 Debrecen, Hungary
3
Department of Statistics and Methodology, Faculty of Economics and Business, University of Debrecen, H-4032 Debrecen, Hungary
4
Department of Management and Organization, Corvinus University of Budapest, H-1093 Budapest, Hungary
5
Power-to-Gas Hungary Kft, H-5000 Szolnok, Hungary
6
Renewable Energy Research Group, University Center for Circular Economy, University of Pannonia Nagykanizsa, Zrínyi Miklós Street 18, H-8800 Nagykanizsa, Hungary
7
Environment and Biofuel Research Laboratory, Department of Hydro and Renewable Energy (HRED), Indian Institute of Technology Roorkee, Roorkee 247667, Uttarakhand, India
*
Authors to whom correspondence should be addressed.
Energies 2023, 16(24), 8009; https://doi.org/10.3390/en16248009
Submission received: 31 October 2023 / Revised: 5 December 2023 / Accepted: 5 December 2023 / Published: 11 December 2023
(This article belongs to the Special Issue Sustainable/Renewable Energy Systems Analysis and Optimization)

Abstract

:
Power-to-biomethane (bio-P2M) is a novel technology that combines the long-term storage of periodically available renewable energy sources (RES) and the upgrading of biogas. This article introduces a complex economic analysis of a 1 megawatt electric (MWel) capacity bio-P2M system based on economic characteristics considered to be typical in practice. The evaluation includes an investment analysis to present the basic scenario, a sensitivity analysis and a unit cost calculation to show the economic viability, the cost structure and the possible reserves of the synthetic natural gas (SNG) as a final output. The risk analysis is executed using Monte Carlo simulation, and the final results are the mean and standard deviation of the outputs, distribution functions and probabilities. Our results show that a significant state subsidy would be needed to boost competitiveness either in terms of investment costs (44% in our calculation) or in technology development to improve technological effectiveness. Another important competitiveness issue is the full utilization of the plant and the lowest possible price for the electricity used. If both cannot be optimized at the same time, then the first one is more important. Natural gas prices and the full utilization of waste heat might result in smaller changes.

1. Introduction

The centralized electricity system dominated by fossil fuels has faced criticism for its environmental impact and inefficiencies. However, the rise of renewable energy sources and decentralized systems has disrupted this traditional market, creating opportunities for innovation [1,2,3]. The rising energy demand and the need for quality power drive the transformation from conventional power grids to smart and microgrid-based structures. This shift enables the integration of renewable energy sources (RES) and addresses associated challenges [2]. The energy market has also evolved, with demand-side management through the electricity market balancing energy requirements with availability [2,4,5,6]. Traditionally, thermal and hydropower plants have provided flexibility in renewable power systems [4,6,7]. However, as variable energy resources (VER) become more prevalent, the nature of required flexibility is evolving. New technological advancements have introduced a range of resources and services to enhance this flexibility. According to Akrami et al. (2019) [4], these include flexible conventional units [8], demand-side flexibility, grid extensions [9] and smart grid initiatives [10]. The relevance of these resources varies by location but aims to ensure efficient and reliable operation with high VER penetration.
Climate change due to rising emissions and increasing energy demand are among the major global challenges of our time [11]. Both indicators have risen steadily (except during the economic crisis of 2008–2009 and the COVID period). In 2022, primary energy consumption increased by 2.1% (to 604 EJ, or 167 777 TWh) [12], while CO2 emissions related to the energy sector increased by 0.9% to 36.8 billion tons [13]. Global electric power consumption grew even faster (by 6% to 87 EJ, or 24 167 TWh, in 2022), with renewables accounting for an increasingly dominant share (28% in 2022), among which wind and solar grew the fastest, accounting for 40% of renewables in 2022 [14]. According to statistics and expert opinions [15,16,17,18], a strong increase is expected in the deployment of primarily these technologies, with solar PV capacity expected to grow from 760 GW in 2020 to 14 TW in 2050 and wind power capacity to grow from 743 to 8 TW by the same year [19]. However, in addition to the energy potential, environmental benefits and decreasing costs of these technologies, we have to consider intermittent power generation, without the storage of which future energy systems are unthinkable [20]. According to Hong et al. (2023) [21], big data technologies will play a key role in the future optimization of energy systems and the reduction of storage costs. Magyari et al. (2022) [22] emphasized that internal organizational processes and resources (especially knowledge management systems) are also critical for the successful implementation of power-to-gas (P2G) technology. The potential of biogas-based energy storage technologies is illustrated by the fact that in 2018, the amount of biomethane produced in the world was 407.1 TWh, while the amount of biomethane that can be produced sustainably is estimated by the IEA (2020) [23] to be 8490 TWh, representing 20% of global natural gas consumption. However, there are economic constraints to exploiting this significant potential. The economics of power-to-biomethane (bio-P2M) technologies are changing due to innovative technologies and electricity storage needs, and this article aims to contribute to this development by introducing the market of competitive products and analyzing a case study.

2. Literature Review

2.1. Energy Storage Technologies

The flexibility of the electric power grid must ensure that it can adapt to weather-dependent power generation and to increases or decreases in market supply in a continuous, cost-effective and timely manner, and it must have the capacity to do so. According to the Hungarian official baseline data [24], the nominal energy storage capacity should reach 1–8% of the nominal capacity of variable renewable energy (VRE) capacities. Globally, renewable energy plants are currently able to store around 1.5% of their annual production, which is significantly less than what is needed. For natural gas, global storage needs are estimated to be 2% of the gas produced and 10% of storage capacity [25].
Choosing the right way to store energy is inevitable, as different technologies can have different advantages and disadvantages [26]. The storage capacity and storage time of the main competitors are as follows [27]:
  • Batteries: kWh–MWh range and same-day storage;
  • Pumped storage: GWh–TWh range and storage within one month.
It is worth adding that hydrogen can also be used as an energy carrier as well as storage for excess electricity from RES, which are produced by electrolyzers and used as long-term electricity storage [27]. According to Shchegolkov et al. (2022) [28], the shift toward hydrogen as an energy source is a fundamental challenge for the global energy, aviation and automotive industries. This step would both reduce the negative environmental impacts caused by human activity and provide previously inaccessible energy options and increased resources for technical systems, anticipating the emergence of a whole new life cycle in important areas of technology. The most important issue in this case is the development of new-generation technologies for waste management in the hydrogen industry, which will certainly reduce the negative environmental impact of the technology. Hydrogen production is projected to grow, and the application areas are expected to increase significantly, with the electric power and transport industries being the largest consumers of hydrogen [29].
P2G technologies have a storage capacity of TWh–PWh and a storage time of up to one year, and they (unlike pumped storage) are not tied to natural conditions. Thus, in this article, we focus on the economic aspects of this technology.
Statista (2023) [30] provided insights into the global power-to-gas market size from 2018 to 2020 segmented by technology, with a forecast extending to 2026. It shows promising (5–10%/year) and growing expansion. Looking ahead to 2026, the forecast suggests substantial growth in both technologies (Figure 1, where electrolysis refers to hydrogen and methanation refers to synthetic natural gas (SNG) production). Methanation has a 60–70% share in the technology, but the percentage of electrolysis (without methanation) becomes higher and higher simultaneously with the spread of hydrogen technologies. As the market matures, it is also essential to consider the key players shaping this landscape and driving these technological advancements.
While pumped hydropower dominates global energy storage, power-to-gas systems that convert excess electricity into hydrogen are gaining traction [31]. These systems offer a more versatile energy storage solution, and their economic and sectoral impacts have been explored in various studies [32,33].

2.2. Successful Applications of the Water-Splitting Process

Electrolysis is the first step in the P2G process by all means, and therefore increasing its efficiency has a significant impact on the competitiveness of bio-P2M. In this chapter, we present the latest solutions for the water-splitting process.
Efficiency and safety are paramount in the water-splitting process. Hashemi et al. (2015) [34] made significant strides in this area, developing devices that achieved impressive current densities exceeding 300 mA cm−2 and showcasing a power conversion efficiency surpassing 42%. This level of efficiency represents a notable advancement in the field. Moreover, the hydrogen fuel stream produced in their study was non-flammable, addressing safety concerns associated with hydrogen production. Hashemi et al. (2015) [34] provided a reliable foundation for the findings and their implications in the broader context of renewable energy. The power-to-gas system, which integrates renewable energy sources like sunlight and wind, offers economic and environmental benefits. Chen et al. (2021) [35] further discussed the economic potential of this system, highlighting the advantages of converting stored hydrogen back to power and methane. Chen et al. (2021) [35], in regard to comprehensive databases related to renewable energy production and consumption, underscored the economic viability of water splitting. Regarding the environmental advantages of the power-to-gas system, Mukherjee et al. (2017) [36] revealed the system’s ability to mitigate greenhouse gas emissions and other pollutants for the ecological benefits of water splitting. In a different vein, Sharshir et al. (2023) [31] explored the role of alkaline electrolyzers in producing green hydrogen. Sharshir et al. (2023) [31] emphasized the synergy between these electrolyzers and other renewable energy technologies like wind turbines and solar panels. Sharshir et al. (2023) [31] introduced a novel energy conversion set-up that combines an alkaline fuel cell, an alkaline electrolyzer and a wind turbine. In their research, the wind turbine generates electricity, which powers the electrolyzer to produce the fuel and oxidant needed for the fuel cell. This integrated system boasts a storage efficiency of 70.8% and can store an average of 1.35 kW of electricity. Additionally, they discussed a multi-functional energy system that generates electricity and produces hydrogen and thermal energy. This system leverages the power generated by an organic Rankine cycle process to run the electrolyzer, which supplies the fuel cell with hydrogen and oxygen to produce electricity and heat.
Expanding on alkaline water electrolysis, Zeng et al. (2022) [37] delved into the technology’s potential for large-scale hydrogen production, mainly when powered by fluctuating renewable energy sources like sunlight and wind. The study is centered on creating a robust hybrid electrocatalyst made of WS2 and mesoporous bimetallic nitride (Ni3FeN) nanoarrays. This unique design features multiple edge sites chemically bonded to a conductive framework, making it highly effective for water dissociation and hydrogen adsorption. The hybrid material performs well in hydrogen and oxygen evolution reactions (HER and OER), requiring minimal voltage to achieve significant current densities. Remarkably, when used as both the anode and cathode in an electrolyzer, the system operates at just 1.5 V to reach a current density of 10 mA cm−2, surpassing the performance of many existing non-precious metal electrocatalysts. This research opens up new possibilities for developing WS2-based electrocatalysts, further bolstering power-to-gas systems’ economic and environmental advantages.
The article by Akrami et al. (2019) [4] focuses on power system flexibility, particularly the increasing penetration of renewable energy resources like wind and sunlight. They provided a comprehensive overview of how flexibility in power systems has evolved to adapt to the challenges posed by the variable and uncertain nature of renewable energy and discuss various dimensions of flexibility, including time, control functions, uncertainty and cost. They also explored different resources and technologies contributing to system flexibility, such as energy storage systems, smart grid initiatives and market design improvements. Their findings offer a broad review of the subject, touching upon both technical and economic aspects, and they suggest that flexibility is crucial for the reliable and economic operation of modern power systems integrated with renewable resources.
Zhang et al. (2021) [38] discussed the complexities of electrocatalytic water splitting (EWS), identifying it as a viable method for hydrogen generation, particularly zeroing in on the oxygen evolution reaction (OER), a key component of EWS systems that often faces challenges like high overpotential and slow reaction rates. Zhang et al. (2021) [38] produced an efficient OER electrocatalyst to address these issues using a cobalt-based enhancement technique, demonstrating exceptional durability and activity thanks to optimized mass and charge transfer pathways, combined catalytic action from various metal phosphides, and a well-regulated electronic structure. Zhang et al. (2021) [38] also brought up the important issue of creating an in situ metal phosphide-oxyhydroxide interface that significantly speeds up charge transfer and thereby improves the overall efficiency of the chemical reactions, which advances the understanding of water-splitting techniques and offers valuable insights into optimizing power-to-gas systems for more efficient hydrogen production and energy utilization.
In contrast, Jiang et al. (2022) [39] brought up the case for ammonia electrolysis as a more energy-efficient alternative to water splitting for hydrogen production and that this method not only requires less energy but also produces nitrogen as a byproduct without emitting harmful COx gases. Jiang et al. (2022) [39] introduced a specially designed nanostructured transition metal binary coated on nickel foam, which exhibited superior performance in hydrogen evolution reactions (HER) within an alkaline ammonia environment. Jiang et al. (2022) [39] argued that, from a thermodynamic standpoint, converting ammonia to hydrogen is more energy-efficient than traditional water-splitting methods. This ammonia-based approach could potentially revolutionize hydrogen production in the future, offering a more sustainable and efficient pathway in the emerging hydrogen economy.
Nevertheless, Yu et al. (2018) [40] analyzed the challenges and opportunities in water-splitting technology for hydrogen production, which bring about the issue that while hydrogen is an ideal medium for storing renewable energy from sources like wind and sunlight, the technology is underutilized, accounting for less than 4% of global industrial hydrogen production. This low utilization is due to economic constraints and low energy conversion efficiency. Yet, they also provided potential solutions, such as the development of cost-effective and abundant catalysts, and emphasized the importance of long-term durability and electrochemical stability for the practical application of this technology. They concluded that significant challenges must be overcome to make these systems economically viable and environmentally sustainable. Similarly, Greene et al. (2020) [41] also discussed the challenges in the broader hydrogen use ecosystem and the prospects of hydrogen refueling infrastructure. They outlined the critical components of a hydrogen production system, which includes an electrolyzer, hydrogen gas storage and a compressor all integrated with renewable energy sources. They mentioned ongoing large-scale projects (primarily in Europe) and noted that the first operational system in the U.S. came online in 2016. Greene et al. (2020) [41] stressed the importance of global initiatives in countries like China, Germany, Japan, South Korea and the U.S. to scale hydrogen as a clean fuel for transportation. They also discussed the co-evolutionary challenges of developing hydrogen refueling stations and hydrogen-powered vehicles, highlighting the need for public policy interventions to ensure environmental sustainability and climate protection.
The potential solution also comes from a further study by Chang et al. (2022) [42] that brought about a test with solar-to-hydrogen efficiencies nearing a 19.75% potential of harnessing solar energy for hydrogen production. Their study highlighted the role of specific catalysts in enhancing the water-splitting process, providing valuable insights for future research and development. Rao and Lingampalli (2016) [43] further emphasized the environmental benefits of hydrogen as a fuel. Their comprehensive analysis, based on extensive hydrogen production and consumption databases, offers a holistic view of hydrogen’s ecological impact.

2.3. Unit Cost Trends of Biogas

In the process we are investigating, biogas is the starting element of the bio-P2M process. Nowadays, the unit cost of producing biogas varies widely (between USD 2 and 20/1000 British thermal units (hereinafter referred to as MBtu)) mainly based on the feedstock used, but it also varies widely by region, with the average unit cost in Europe being around USD 16/MBtu and that in Southeast Asia being around USD 9/MBtu [23]. Herbes (2020) [44] examined the impact of the byproducts (waste heat and biofertilizer) and feedstock transport costs of biogas cogeneration plants and stressed that although their importance varies depending on the plant size and technology, they have a highly significant impact on the unit cost of biogas and the green electricity they produce.
The IEA (2020) [23] calculates the typical unit cost of biogas production as follows:
  • Landfill gas (2000 m3/h capacity): USD 3/MBtu (including 30% CAPEX);
  • Wastewater digester (1000 m3/h capacity): USD 15/MBtu (including 70% CAPEX);
  • Agricultural digesters:
    a.
    Small size (100 m3/h capacity): USD 17/MBtu (including 50–60% CAPEX);
    b.
    Medium size (250 m3/h capacity): USD 13/MBtu (including circa 60% CAPEX);
    c.
    Large size (750 m3/h capacity): USD 9/MBtu (including 60–70% CAPEX).
Among the feedstock, municipal solid waste is clearly the cheapest category, followed by crop byproducts, livestock manure, municipal wastewater and finally energy crops as the most expensive category.

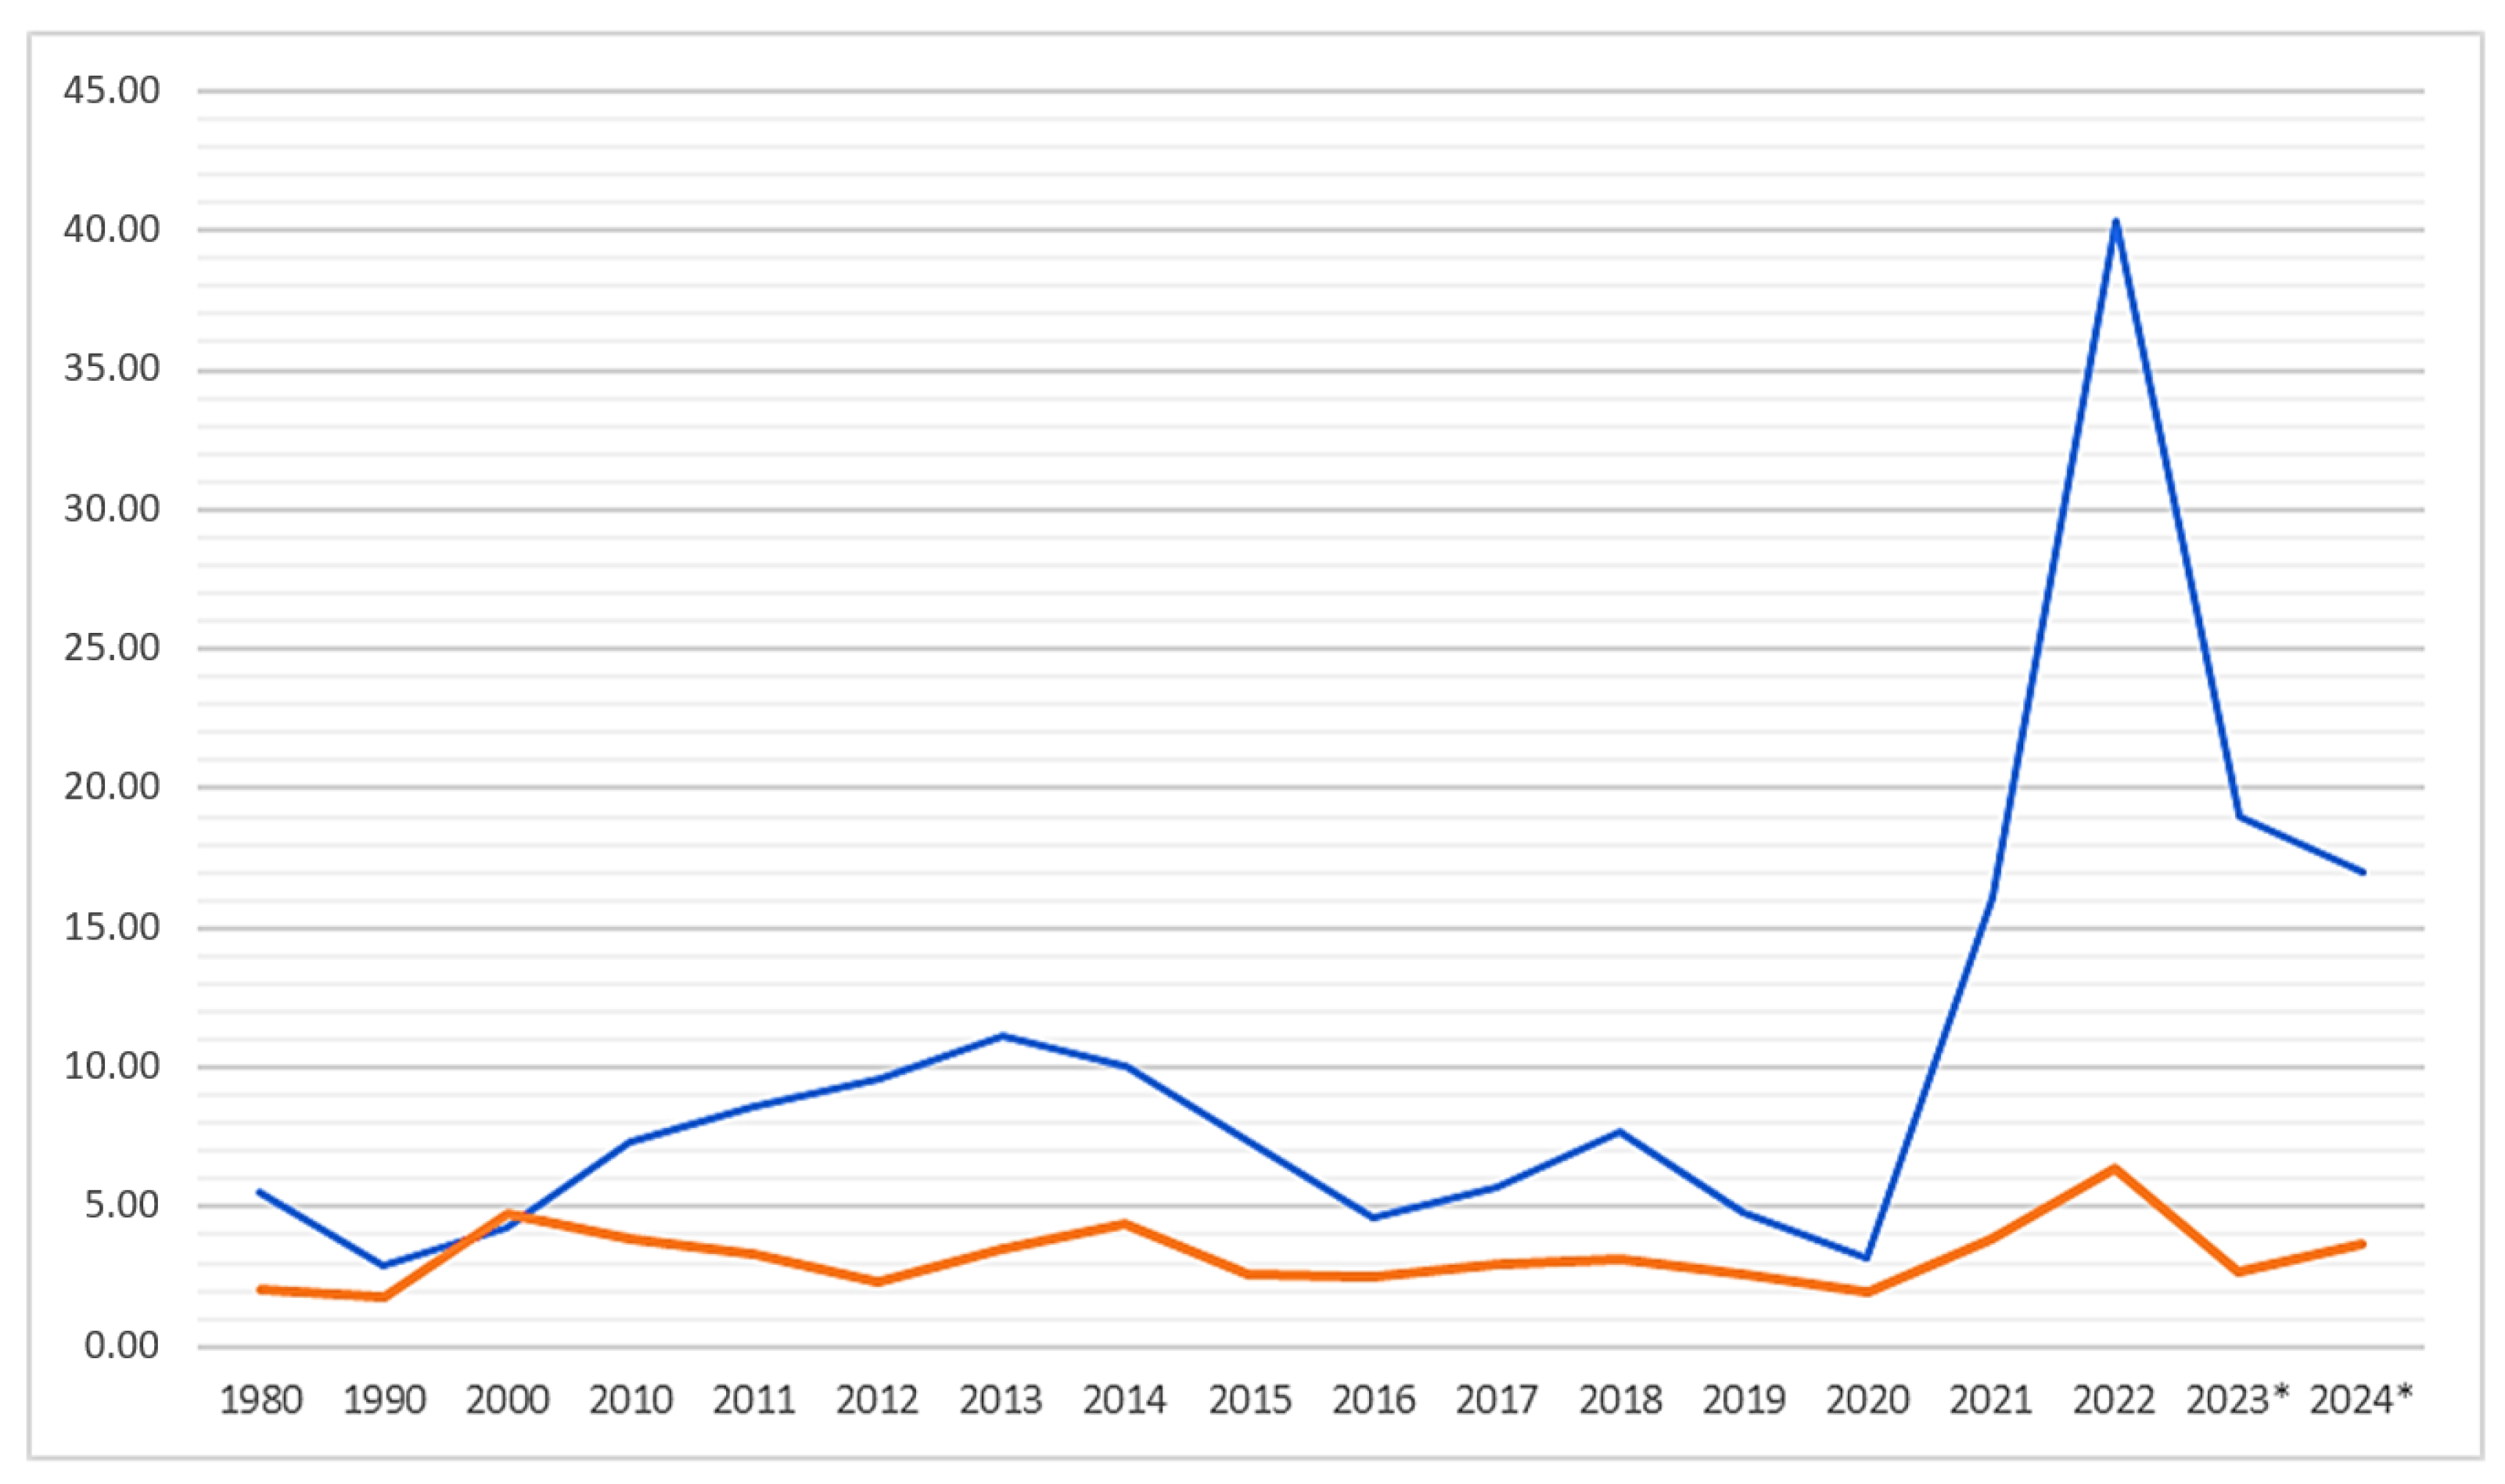
2.4. Economic Trends of Biomethane and Natural Gas

Competitors to the P2G process are biomethane, which is also produced on a renewable basis but with biogas purification, and fossil natural gas. Their cost and prices, therefore, have a major impact on the competitiveness of SNG as a P2G end product.
Recent years have seen dramatic changes in the natural gas market (Figure 2). In 2021, European prices skyrocketed to USD 16.10, a significant increase from USD 3.20 in 2020. The U.S. also saw an increase which was not as drastic, moving from USD 2 in 2020 to USD 3.90 in 2021. In 2022, European prices surged to USD 40.30, while U.S. prices also increased but remained much lower at USD 6.40. The forecast for 2023 and 2024 suggests a decrease in prices for Europe to USD 19 and USD 17, respectively. The U.S. is expected to see a decrease to USD 2.70 in 2023 but a slight increase to USD 3.70 in 2024.
The extreme volatility in Europe could be due to various factors, including geopolitical tensions, supply chain disruptions and increased demand. The U.S., with its more stable natural gas production and supply, has been less susceptible to such extreme price fluctuations. The sharp increase in 2021 and 2022 could be attributed to various factors such as geopolitical tensions, supply chain disruptions and increased demand due to economic recovery from the COVID-19 pandemic. The forecast for 2023 and 2024 suggests a significant reduction in prices to USD 19 and USD 17, respectively, but these are still considerably higher than the prices seen in the early 2010s.
Biomethane can be produced at a unit cost of EUR 55/MWh (approximately USD 60/MWh) according to the EBA (2022) [46], which is much higher than the pre-2022 gas prices (2021: EUR 18/MWh) but still about 30% below the EUR 80/t natural gas price in February 2022. According to Birman et al. (2021) [47], typical biomethane unit costs will range between EUR 40 and 120/MWh in the near future, depending mainly on feedstock and transport costs and fermenter size. The typical cost for a typical fermenter size of 750 Nm3/h used in the EU-28 is estimated to be EUR 69/MWh, of which the CAPEX is about 54–55% if the feedstock cost is excluded. The electricity cost of electrolysis accounts for a major part of the OPEX (about 75% at market prices), and thus reducing it and increasing the capacity utilization (reducing nominal depreciation costs) by increasing the length of the operating time is a key issue. The average biomethane feed-in tariffs in 2018 averaged around EUR 19/MBtu (approximately EUR 0.0056/MWh) [23], which makes the production of only a negligible part of the biomethane potential (20 MtOE or 232.6 TWh) economically reasonable.
Pablo-Romero et al. (2017) [48] provided a comprehensive analysis of biogas and its role in electricity generation within the European Union, focusing on various promotional measures like feed-in tariffs (FITs), feed-in premiums (FIPs) and tenders implemented by EU-28 countries. They emphasized the EU’s objectives to reduce greenhouse gas emissions, increase the renewable energy share and improve energy efficiency by 2020 and 2030, to which biogas contributes significantly. The most relevant country-specific points in the document are as follows:
  • Italy has a system where a monthly bonus is granted to the plant operator, which is calculated by adding various premiums to the base tariffs for the energy sources. This system aims to reduce the price per hour in the electricity market. The range of this incentive varies between EUR 85 and 122 per MWh.
  • The document mentions that most countries have long-term guarantees such as 20 year contracts to make investments in biogas more attractive.
  • Some countries like Lithuania fix their FIT prices quarterly, taking the price of electricity in the three months prior to the call for tenders as a reference.
  • In Finland, if the reference market price is below EUR 30, then the feed-in premium (FIP) will be equal to the difference between the fixed target price and EUR 30.
  • Germany has measures directed toward better integration of biogas into the electricity market. The FIT for electricity produced by cogeneration installations running on biogas will be raised for both new and existing installations.
  • France has an incentive of EUR 40/MWh for plants that reach an energy efficiency of at least 70%.
Power-to-biomethane technology has the advantage of being able to use the available natural gas infrastructure and reduce natural gas imports. According to the EBA (2022) [46], in a supportive regulatory environment, biomethane produced in Europe could replace 10% of natural gas demand by 2030 and up to 30–40% by 2050 if energy crops are used in significantly higher quantities in biogas production, which in turn will make biomethane production more expensive.
As shown in Figure 3, the most important factor in the cost of biomethane produced in the P2G process is the operating cost (excluding feedstock), followed by electricity and then the investment cost per unit of methane produced. This reflects both the importance of capacity utilization, as confirmed by Bassano et al. (2020) [49], and the importance of the unit price of electricity used. As shown in the study by Gorre et al. (2019) [50] for a similar type of technology but at a different system scale, the effect of an increase in the unit price of electricity is a corresponding jump in both the unit cost and the share of electricity in the unit cost.
As can be seen in Figure 4, the unit cost of the methane produced decreased dramatically with increasing operating hours (capacity utilization) due to the distribution of fixed costs (investment costs and fixed costs during operation) over an increasing product quantity, while the significance of the electricity cost increased [51].
Alterations in carbon prices impact the unit cost of bio-P2M and any revenues from the sale of quotas. In the European carbon market, prices have developed in recent years as shown in Figure 5.

2.5. Economic Trends of Electricity

The levelized cost of electricity (LCOE) from biogas, according to the IEA (2020) [23], varies between USD 50 and 190/MWh, which is significantly higher than the full life cycle cost of electricity for the electricity generated from wind and solar power, taking into consideration the quantity of the external cost, compositions of the internal cost and discounting of the electricity production [53]. As the off-take of electricity as an end product of cogeneration biogas plants is also becoming increasingly challenging, feed-in tariffs for this are decreasing, which will require storage of this electricity in the future. The price of electricity can fall below zero during periods of very low electricity demand, when the weather is sunny and solar power generation far exceeds the current consumption.
In flexible modes, electricity is bought on the short-term market, and gas is sold either on the short-term market or under a long-term contract. The high proportion of fluctuating generation capacity, and therefore the amount of energy available, makes electricity prices increasingly volatile. In addition, extremely high and low spot prices can develop on the electricity exchanges. Extreme prices are electricity prices of EUR 0/MWh (or even less) or more than EUR 100/MWh. The expected occurrence of these extreme price ranges, which are expected to rise sharply from 2026 onward, presents opportunities for new market players and technologies, such as storage systems [54].
Figure 6 shows that electricity prices have generally increased over the years, with some countries experiencing dramatic spikes. For example, Italy’s electricity price went from EUR 47.46/MWh in January 2020 to EUR 543.48/MWh in August 2022. Prices were highly volatile, especially in the latter half of 2021 and throughout 2022. This could be due to various factors like supply constraints, increased demand or geopolitical issues. However, there were periods where the electricity prices declined, such as from December 2022 to March 2023 in Italy, Greece and Hungary. However, these declines did not bring the prices to zero or negative levels. The prices for May 2023 onward show a declining trend, reaching as low as EUR 37.30/MWh in Sweden. This could potentially make power-to-gas more profitable, but it is still far from zero or negative prices [55].
Hungary started with a price of EUR 52.96/MWh in January 2020, which was mid-range compared with other countries. The lowest price for Hungary was in March 2020 at EUR 29.75/MWh, likely influenced by the global economic conditions due to the COVID-19 pandemic. A significant spike was observed in July 2022, when the price reached EUR 371.23/MWh, aligning with a general trend of price hikes across all countries. Hungary’s prices appear to have stabilized in 2023, with the lowest one being EUR 88.12/MWh in May 2023. We can interpret that the electricity wholesale prices in Hungary have shown significant volatility over the observed period. The data suggest that most EU countries experienced a dramatic increase in electricity prices, particularly in 2021 and 2022, due to various factors, including increased demand, supply chain disruptions or geopolitical issues affecting energy markets. Regarding the effect of electricity prices on the most important economic characteristics of Central and Eastern European energy companies, a more detailed statistical analysis can be found in the work of Rákos et al. (2022) [56].
According to research by Härtel and Korpås (2021) [57], the occurrence of zero or negative electricity prices due to excess renewable production is expected to be limited, as additional cross-sectoral consumers will increasingly utilize low-carbon electricity. This aligns with the findings of Hagfors et al. (2016) [58], who identified wind power as a key driver in the rare instances of negative price occurrences. On the topic of power-to-gas technology, a study by Leeuwen and Mulder (2018) [59] posited that investments in this area could become profitable when electricity prices are low. This is further supported by Schneider (2011) [60], who noted that negative electricity prices can naturally occur in spot trading due to the limitations and costs associated with plant flexibility. While power-to-gas technology is not currently cost-effective, Liu et al. (2017) [61] suggested that this is likely to change as the technology develops.
According to Ghafoori et al. (2022) [62], below a EUR 20/MWh electricity price, the power-to-biomethane process is already competitive with conventional biogas upgrading technologies. At the same time, among the newest biogas upgrading technologies, the cryogenic biogas upgrading process (CBioUP), according to Yusuf-Almomani (2023) [63], could be a serious competitor to bio-P2M technologies in the future not only because of its favorable economic effects but also because of its flexibility (94.5–99.6% methane content).

2.6. Characteristics of P2G Technology

According to Götz et al. (2016) [64], the power-to-gas process is about converting excess electricity into gas that can be injected into the gas grid.
The term P2G can be used to refer to both power-to-hydrogen (P2H2) technologies (where electricity is used to produce hydrogen as an end product) and power-to-methane technologies (where the system includes a methanation unit that converts hydrogen into synthetic natural gas (SNG)) (Fambri et al., 2022) [65]. Although power-to-methane technology requires an additional conversion step compared with power-to-hydrogen technology and therefore involves additional investment and operating costs, resulting in a loss of efficiency due to conversion losses, it also has a number of advantages:
(a)
The energy density of SNG per unit volume (>1000 kWh/m3) is much higher than that of hydrogen (270 kWh/m3) [25];
(b)
SNG can be injected into existing gas infrastructure, while hydrogen can only be injected at low concentrations due to the “brittleness” of hydrogen, which can cause cracks in iron and steel pipes [66];
(c)
Hydrogen has a higher ignition risk than SNG and is therefore more risky from a safety point of view [66];
(d)
The production of SNG is also beneficial in terms of promoting CO2 capture technologies and benefiting the utilization value chain. Accordingly, hydrogen can be mixed with carbon dioxide from multiple sources (e.g., flue gases, biogas and air) and stored in synthetic hydrocarbons [67].
According to current experiments [68], hydrogen production at plant sizes of 26 and 28 kgH2/h and 70% capacity utilization can be estimated to be at between EUR 1.9 and 3.3/kgH2, and by 2030, taking the full life cycle into account, it could conveniently be below EUR 2/kgH2. The EBA (2022) [46] estimated the unit cost of producing green hydrogen to be EUR 180/MWh. However, the infrastructure for hydrogen storage and utilization is still underdeveloped in Central and Eastern Europe, which is why the P2G process is considered the most promising process for long-term electricity storage in this region.
The biological methanation power-to-gas technologies used in our research can produce biomethane from biogas using hydrogen produced from intermittent renewable energy (e.g., wind or sunlight), which can reduce operational energy demand and costs and minimize CH4 losses [69].
One component of the technology is polymer electrolyte membrane (PEM) electrolysis, which can flexibly adapt to volatile renewable electricity generation. Another component of the technology is a biological methanation solution using a proprietary microorganism (Methanothermobacter thermautotrophicus), which can also provide extreme flexibility, and furthermore, prototype data show that the system is not only flexible but robust. The conversion efficiency of biological methanation averaged 94% for a series of experiments in 2018. The process consists of three steps [54]:
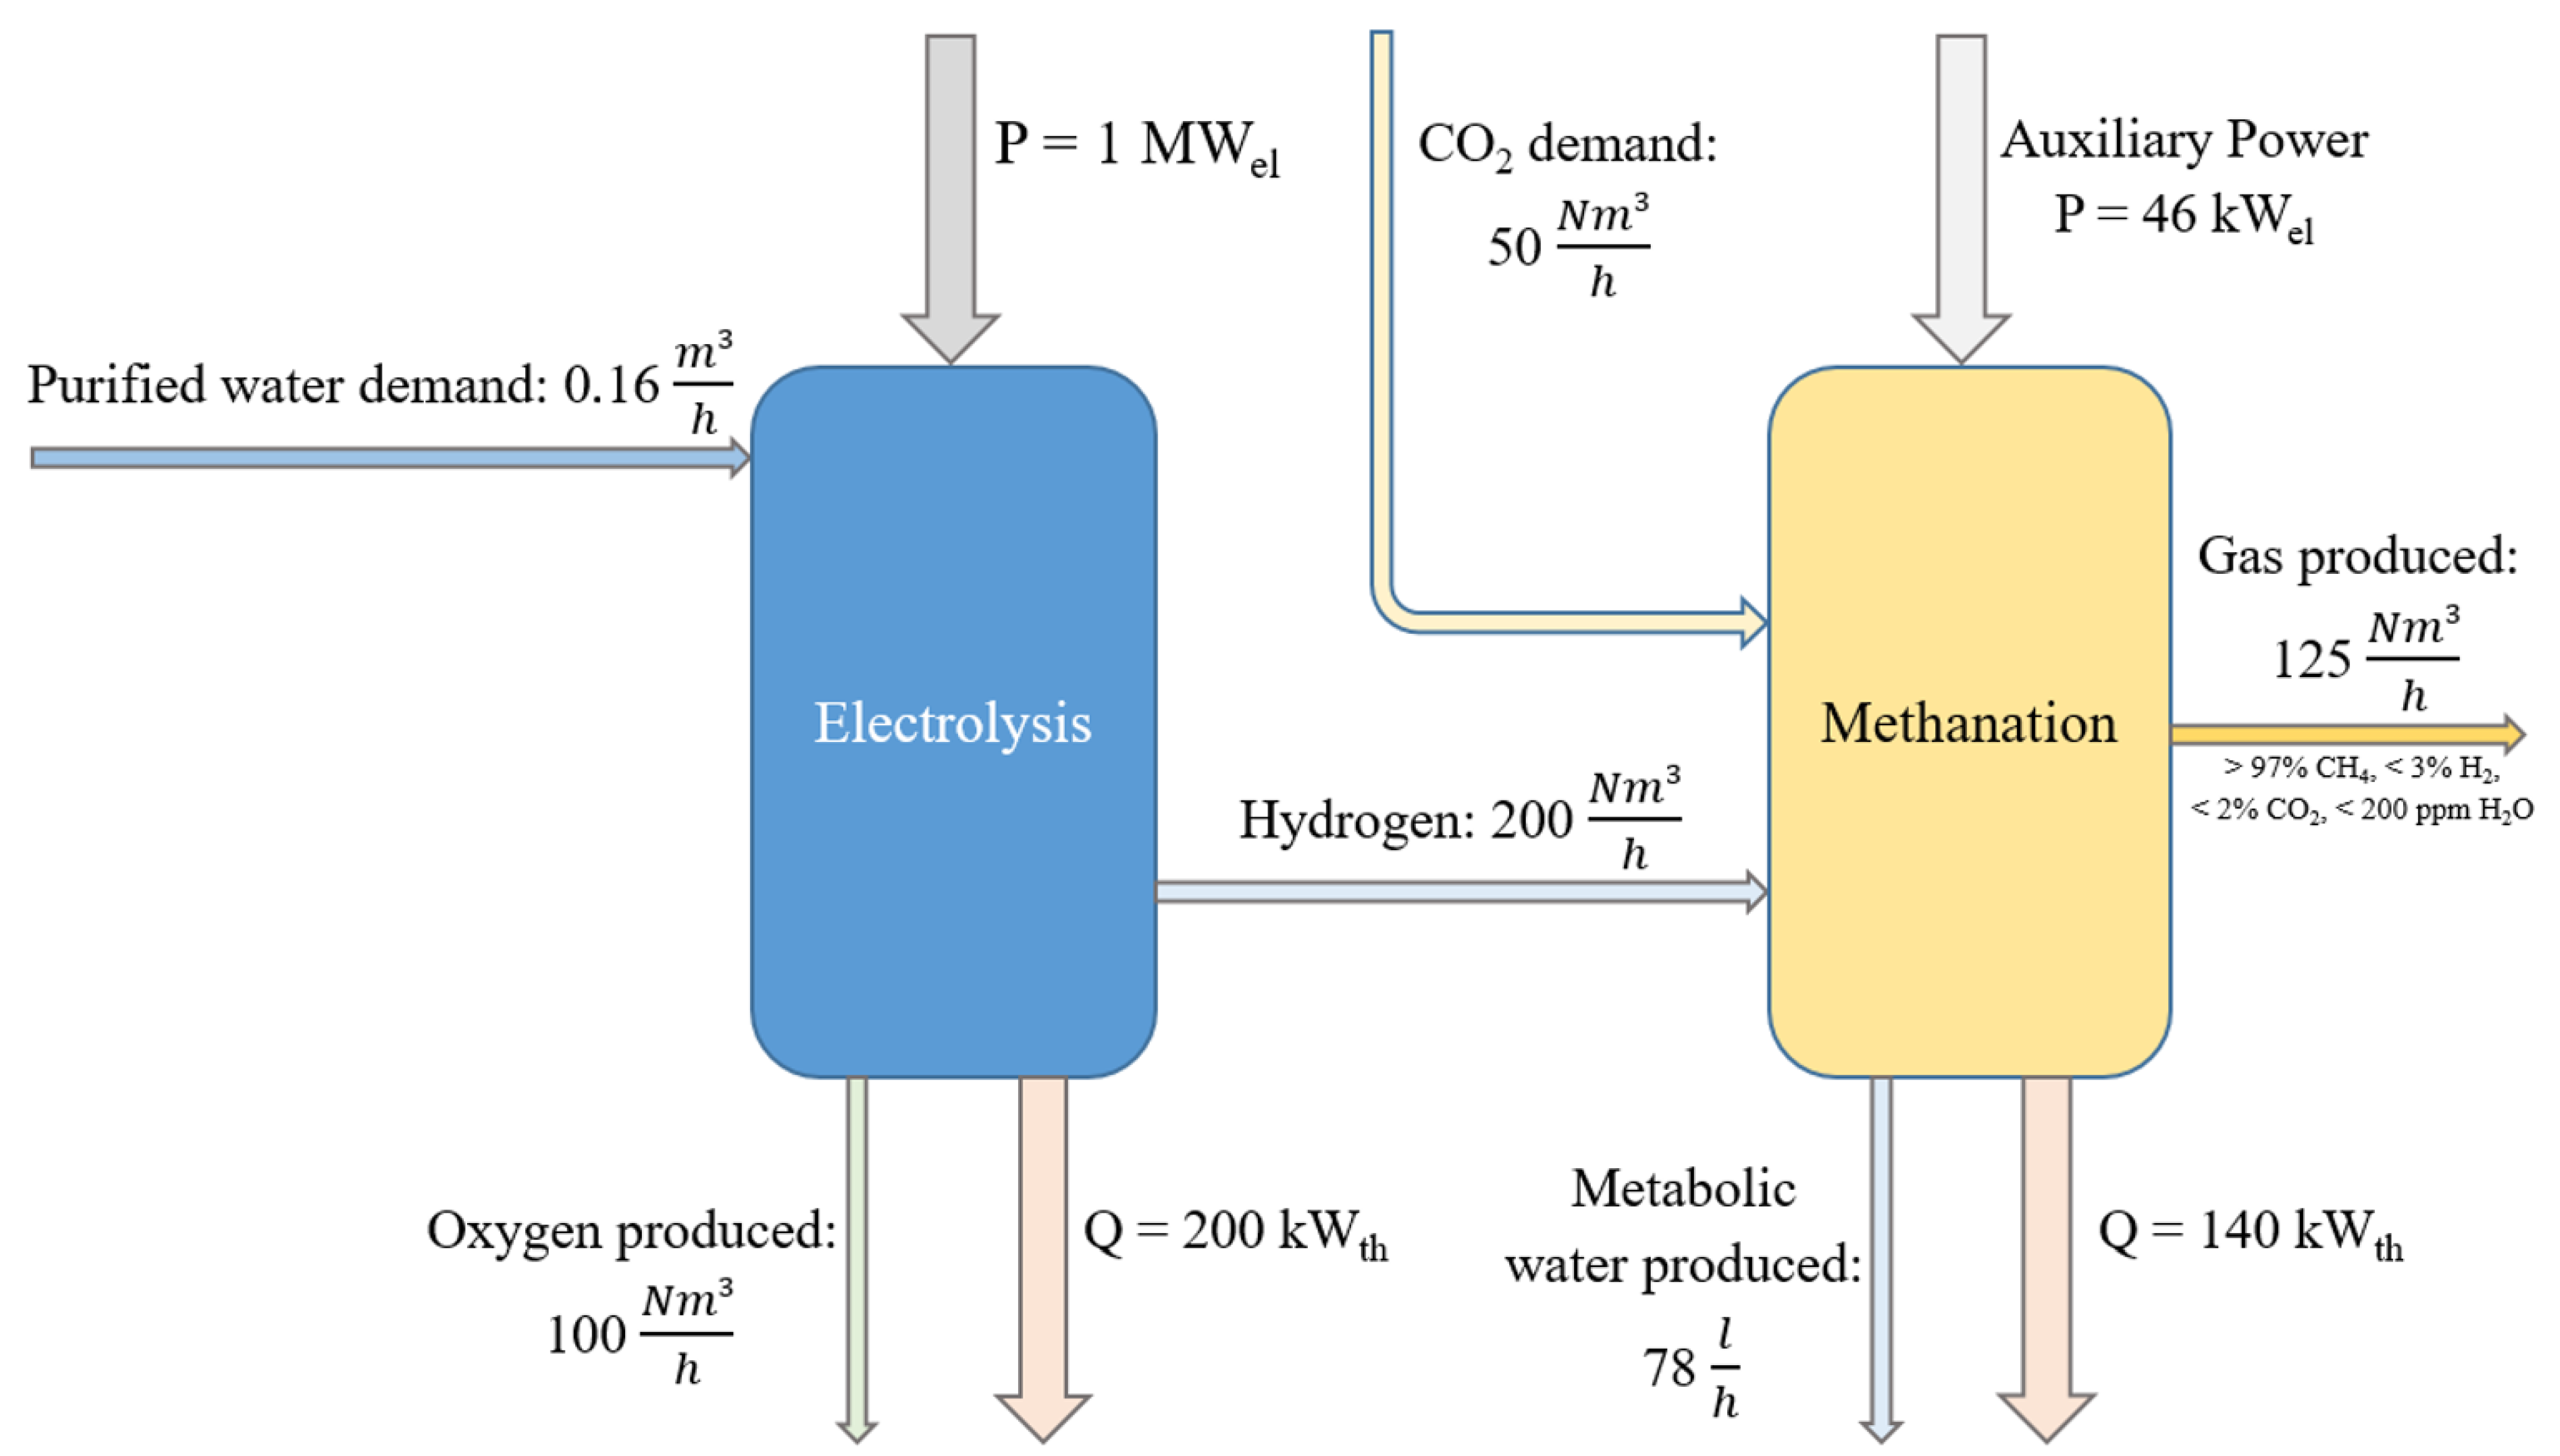
  • Hydrogen production: The (excess) electricity is used for electrolysis;
  • Methane production: The biogas produced in the wastewater treatment plant is fed into the bioreactor together with hydrogen, resulting in the production of methane according to the reaction [70] CO2 + 4H2  CH4 + 2H2O;
  • Injection into the natural gas network: The gas as a final product after hydrogen capture, water vapor removal and cooling, with a methane content of 97% and its other parameters, meets the national requirements for injection into the natural gas network.
The overall energy efficiency of SNG production via the bio-P2M process is 60–70%, depending on technological parameters such as the applied pressure conditions and byproduct utilization. Biogas can be injected into the methanation reactor directly since methane is considered an inert gas for the adapted biocatalyzer. Neither additional carbon dioxide extraction nor a gas separation process is required for bio-P2M technology [70].
The importance of subsidies is also highlighted in the publication by Baena-Moreno et al. (2020) [71], who argued that currently, without a significant increase in energy prices and a large reduction in investment costs, financial support is essential for similar systems.
The results of Csedő et al. (2020) [54] show that standardized 1 MWel bio-P2M technology would be suitable for most wastewater treatment plants. This is in line with the current level of technological readiness of bio-P2M, but rising electricity prices and limited financial resources for wastewater treatment plants would reduce the commercial attractiveness of introducing bio-P2M technology.
On this basis, we make our calculations for 1 MWel bio-P2M technology, noting the impact of economies of scale. Given that significant differences in the investment costs of the various system components can be found in the international literature, our economic evaluation not only looks at the price changes of the main input and output factors but also the impact of capacity utilization on the economics of the system and its return on investment.

3. Materials and Methods

A simplified block diagram of the 1 MWel bio-P2M system (electrolyzer capacity) is shown in Figure 7, containing all the relevant inputs and outputs of the two system elements.
The 1 MWel capacity refers to the capacity of the polymer electrolyte membrane electrolyzer system. The reason for choosing the 1 MWel plant size was that it corresponded to the size of a system that could be installed in a typical wastewater treatment plant, as confirmed by the fact that several P2G investments in Europe (e.g., P2G-Biocat (Denmark), P2G plant Erdgas Schwaben (Germany) and RH2 WKA (Germany)) have already been implemented or planned with this plant size [54,73].
The economic analysis included an investment analysis to show the expectable indicators of the case study in the basic scenario and a sensitivity analysis based on the most probable future scenarios in practice. Then, the competitiveness, the cost structure and the possible reserves of the SNG as the final output would be introduced and explained using unit cost calculations. The following simulation methods will analyze the effects of the inputs and outputs.
In risk analysis, Monte Carlo simulations can be applied to a computer model of a system when the state of the system process is randomly changed [74]. The simulation model works by randomly selecting values based on the probability distributions assigned to each uncertain factor. The random probabilities are then used in each successive trial of the simulation analysis [75]. For this purpose, a special simulation should be used which assigns values to the uncertain factors according to some distribution [76,77]. During the process, the values obtained from this distribution are incorporated into the various results, allowing risk to be understood. Many different types of distributions can be selected to simulate the parameters, of which we chose discrete uniform distributions and triangular distributions. Among the symmetrical probability distributions, the discrete uniform distribution can be characterized as a distribution where a finite number of values are observed with equal probability, and each “n” value has probability “1/n”. This type of continuous distribution has three notable positions: a lower bound “a”, upper bound “b” and mode “m”, where a < b and a ≤ m ≤ b [78]. This distribution is used when all three values are known (minimum, maximum and most probable).
The ranges we used are presented in Table 1, and the most likely values were taken to be the mean values of the indicators.
First, when defining the input variables, the range of values and the type of possible distribution must be specified. This is followed by the definition of the output variables. The different values of the inputs are generated by a random number generator during each run. The number of runs (simulations and experiments) can range from 1000 to 100,000. The final result will be the mean and standard deviation of the outputs, as well as the distribution functions and probabilities.
The simulation software we used to evaluate our results was @RISK 7.6, distributed by Palisade Corporation.
The outputs of the analysis were the net present value (NPV), profitability index (PI), internal rate of return (IRR) and the unit cost of biomethane.
Following the parameters shown in the table, we worked with 5000 iterations. Sensitivity tests were also performed based on the results of the output variables. This involved calculating the Spearman’s rank correlation coefficient and the standardized regression coefficient. The latter coefficient characterizes the effect of the magnitude of the input variables on the different outputs independent of the measure (in standardized form). This can be used to rank the inputs according to their importance. With a positive sign, an increasing input gives an increasing output [79].
The basic data used in our calculation model and the ranges considered in the analyses are summarized in Table 2 (CAPEX) and Table 3 (OPEX).
Table 2 shows the unit costs of the main system components, such as the electrolyzer, the methanation unit and the other necessary system components. By adding the other cost factors related to the investment, the total investment cost for the 1 MWel bio-P2M system is EUR 4,984,000.
Table 3 shows all the operational data used in calculating the investment economics and the unit cost, their range and the source of the basic data. The data used in the basic scenario are highlighted by being underlined.
The participation of similar systems in CO2 emissions trading is limited, and thus this analysis did not take this into account as potential revenue.
There are several ways to determine the interest rate chosen to carry out economic analyses and calculate dynamic indicators. After considering all options, we chose the weighted average cost of capital (WACC) [88]. The discount rate was determined using the formula for the weighted average cost of capital (WACC):
r = WACC = Re × E + Rd × (1 − t) × D
Here, the following definitions apply:
  • Re: cost of equity (i.e., the expected return on investment);
  • Rd: cost of loan (liabilities) (i.e., the interest burden on the loans taken out);
  • E: equity (i.e., shareholders’ investment) as a proportion of the investment cost;
  • D: share of debt in the investment cost (liabilities);
  • t: the company’s marginal tax rate.
As the calculations did not include debt and borrowing, the discount rate to be applied was derived from the cost of equity:
Re = Rf + β × ERP
Here, the following definitions apply:
  • Rf: estimated risk-free nominal return in the target country;
  • β: industry beta;
  • ERP: market risk premium.
The risk-free rate of return was set at 3% based on the Statista database.
To estimate the industry beta, we used the publication of Damodaran (2023a) [89]. The database contains industry-specific beta values for different sectors, which are calculated from the arithmetic average of the individual beta values. Accordingly, the beta for the “Green & Renewable Energy” sector is 0.88.
The equity risk premium (ERP) was also based on the work of Damodaran (2023b) [90], taking into account changes over time. Thus, the expected ERP was set at 5.5%.
Therefore, the expected nominal return on equity is
Re = 3 + 0.88 × 5.5 = 7.84%
The annual increase in the prices of inputs and services as well as outputs and revenues was 3%, considering the long time series price changes of the key system inputs and outputs.

4. Results and Discussion

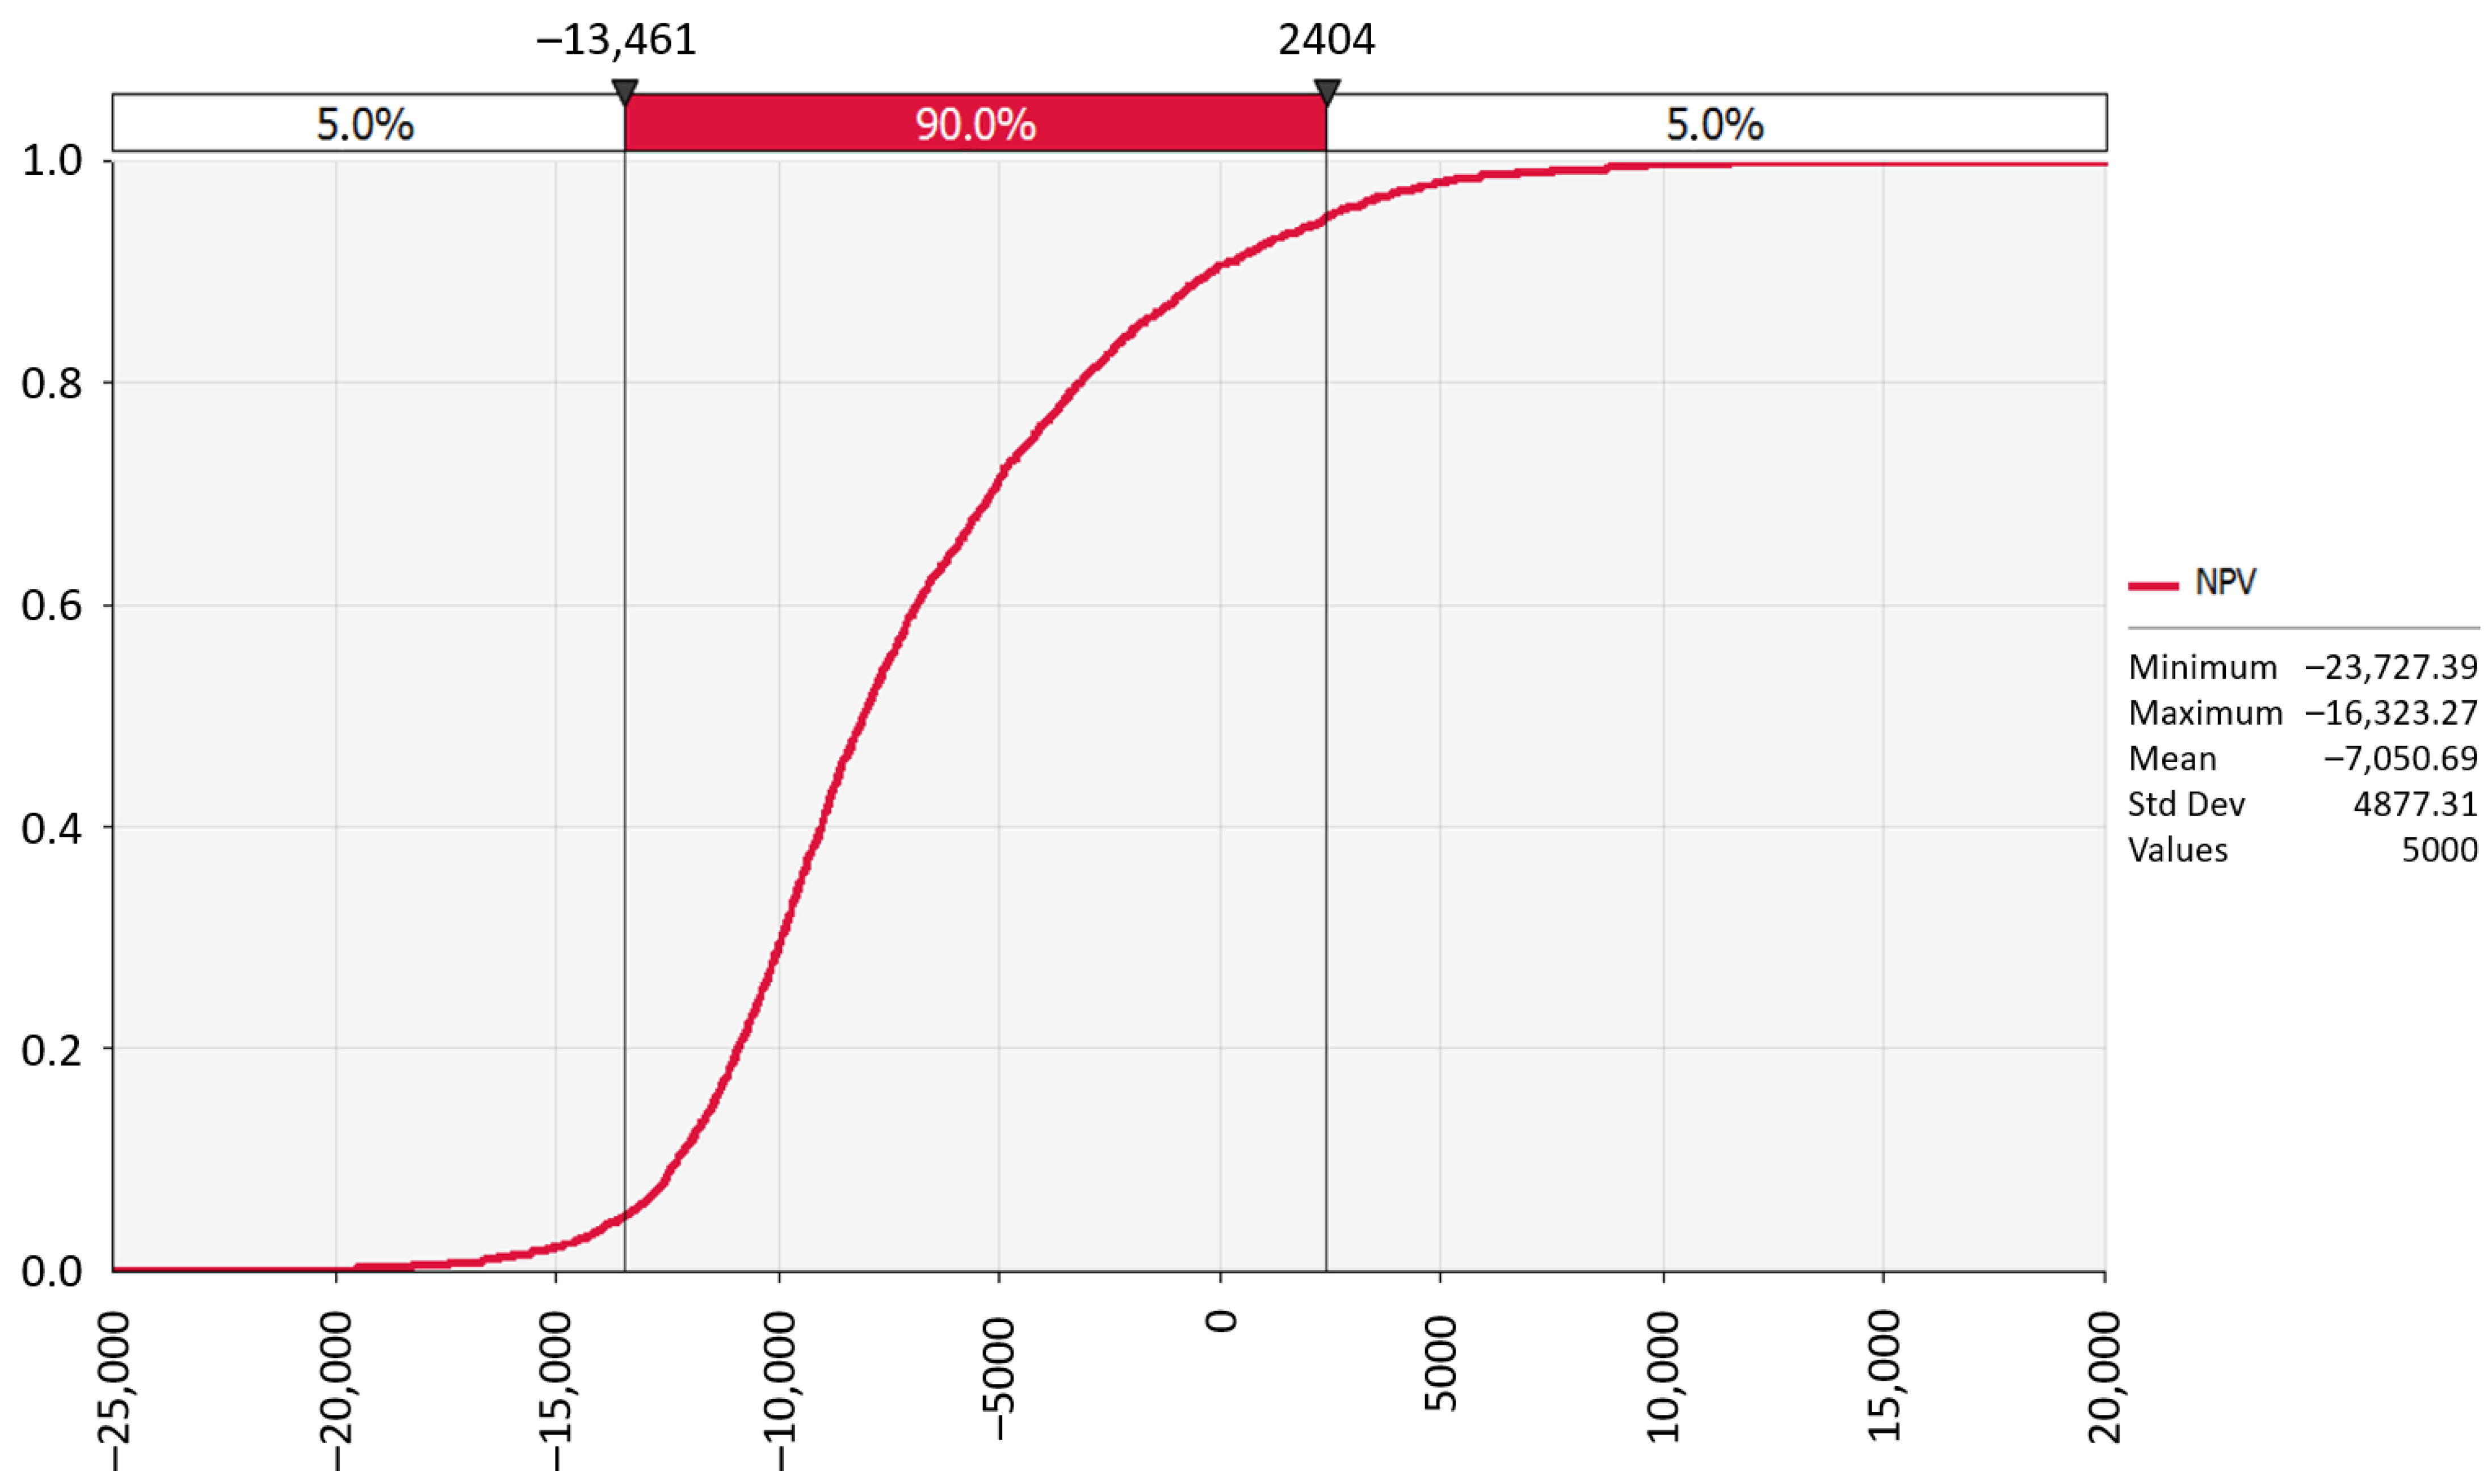
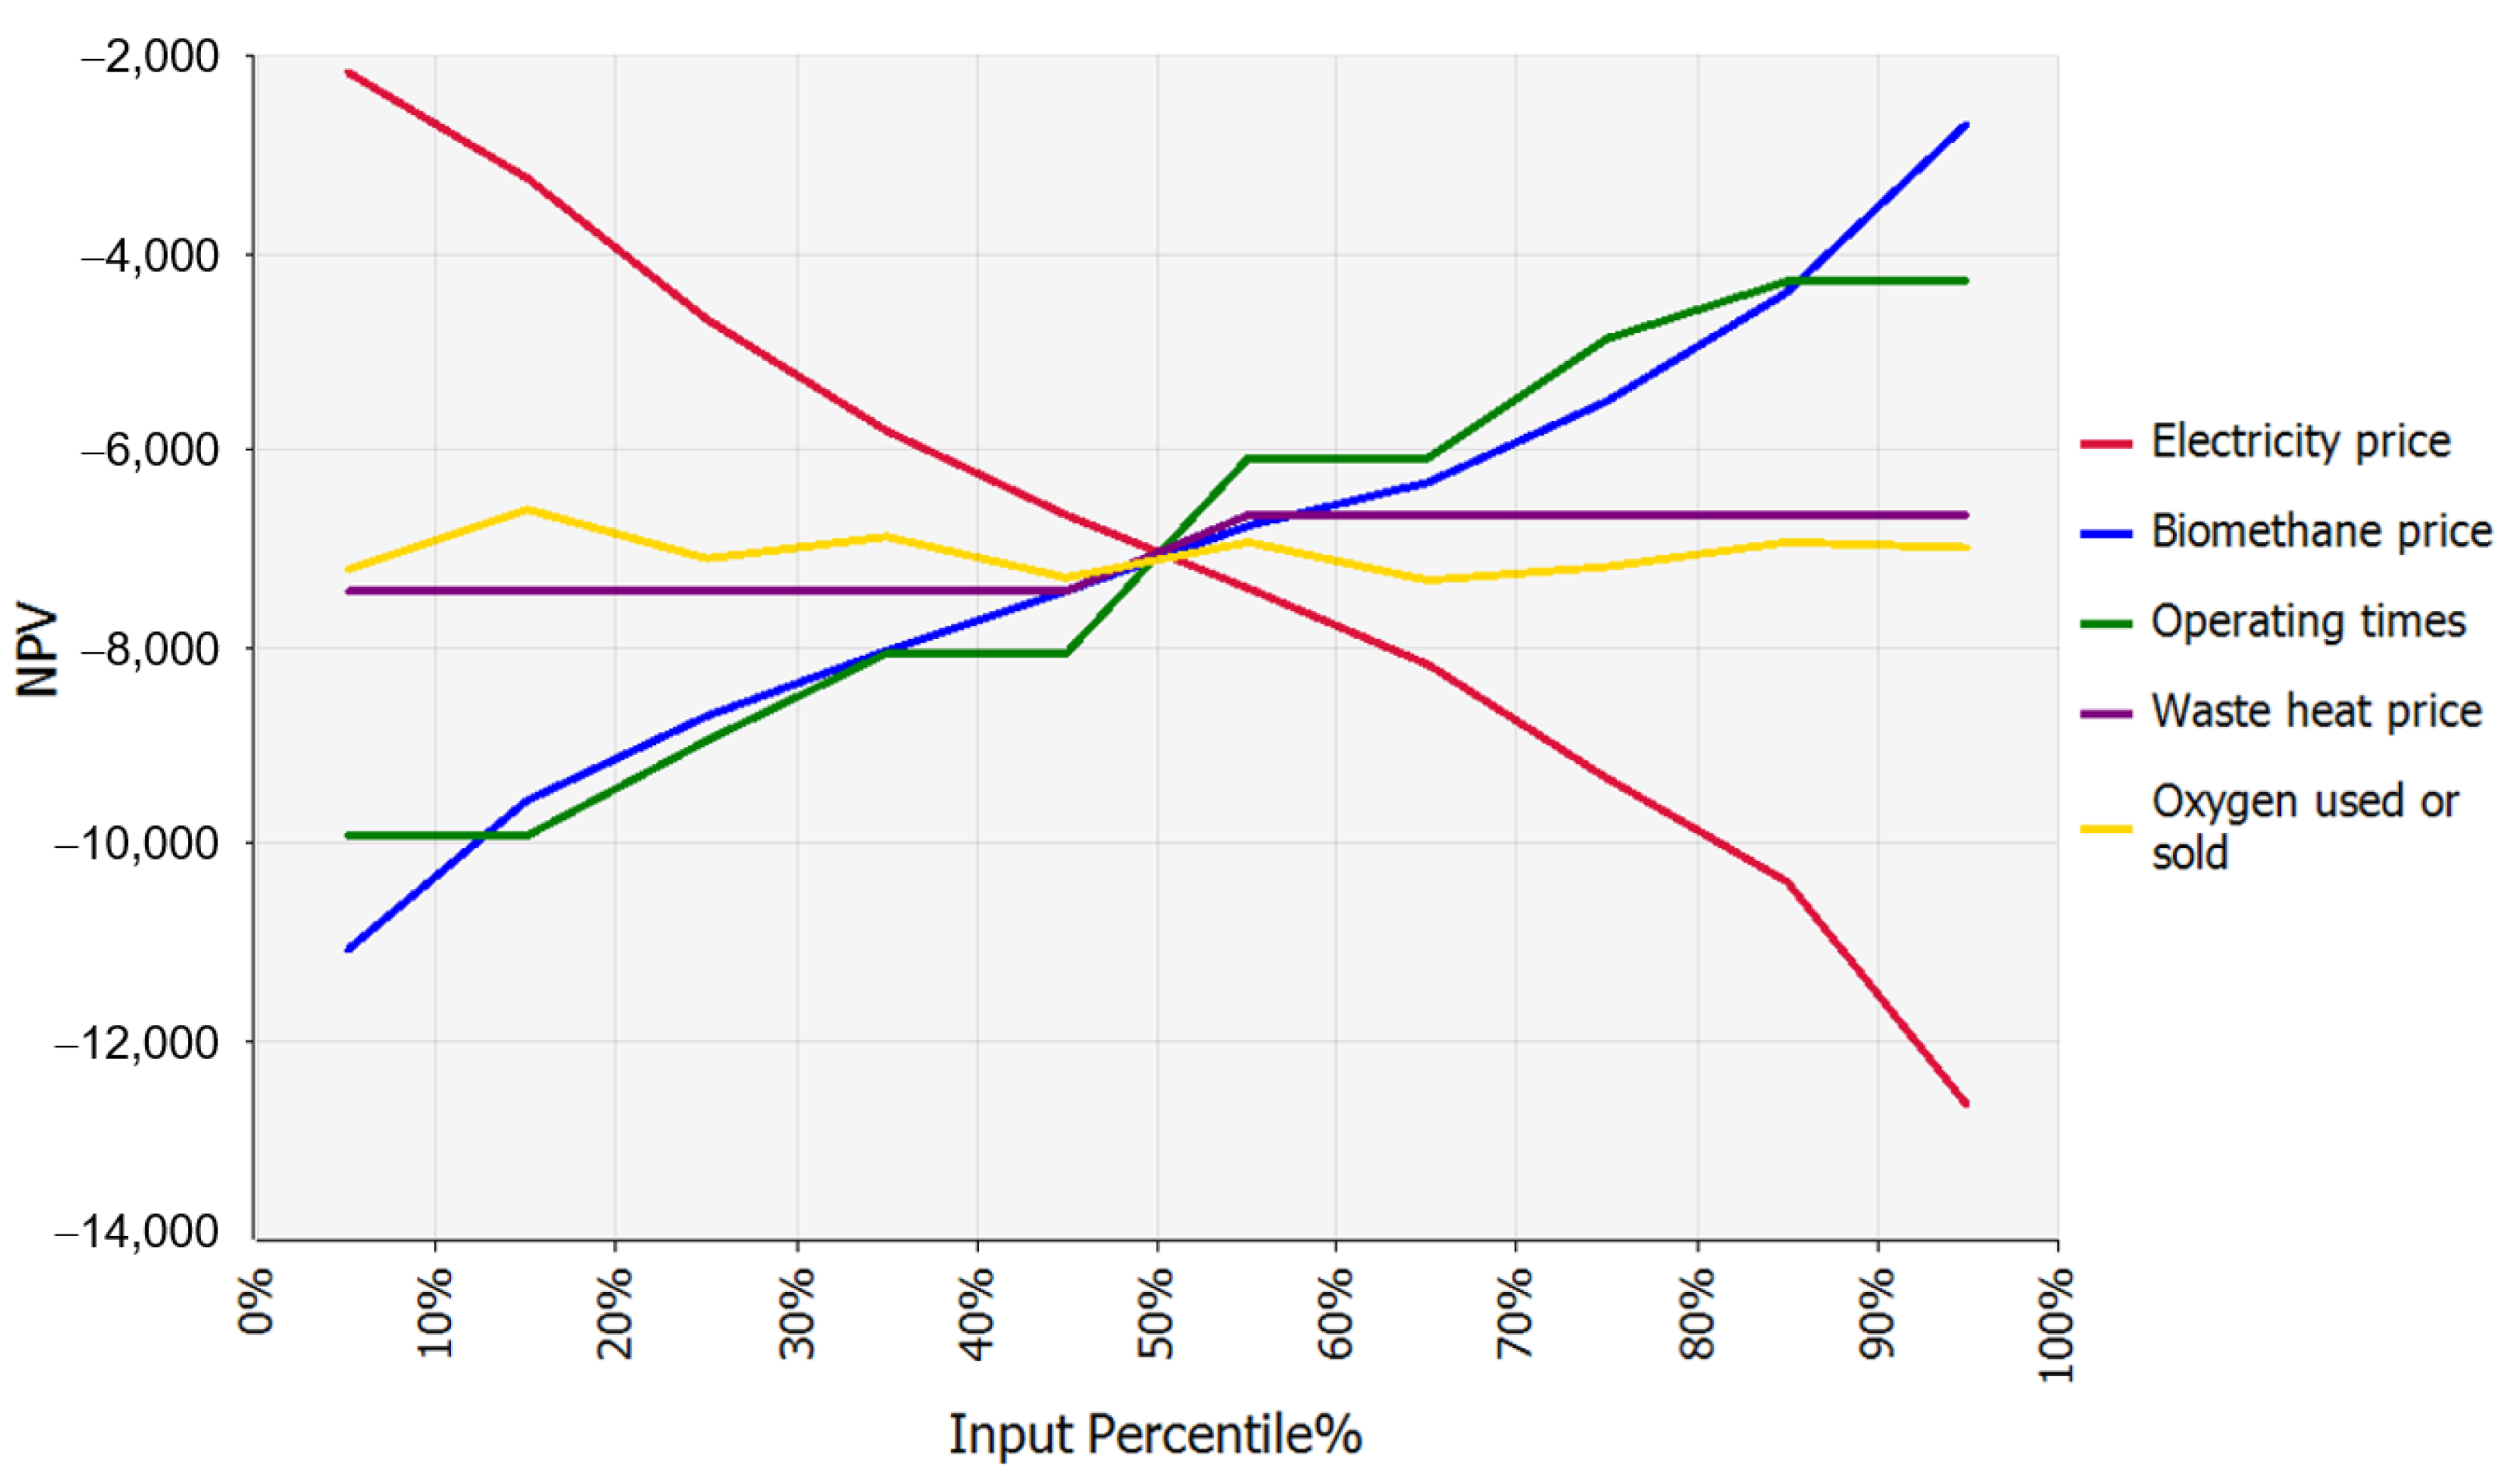
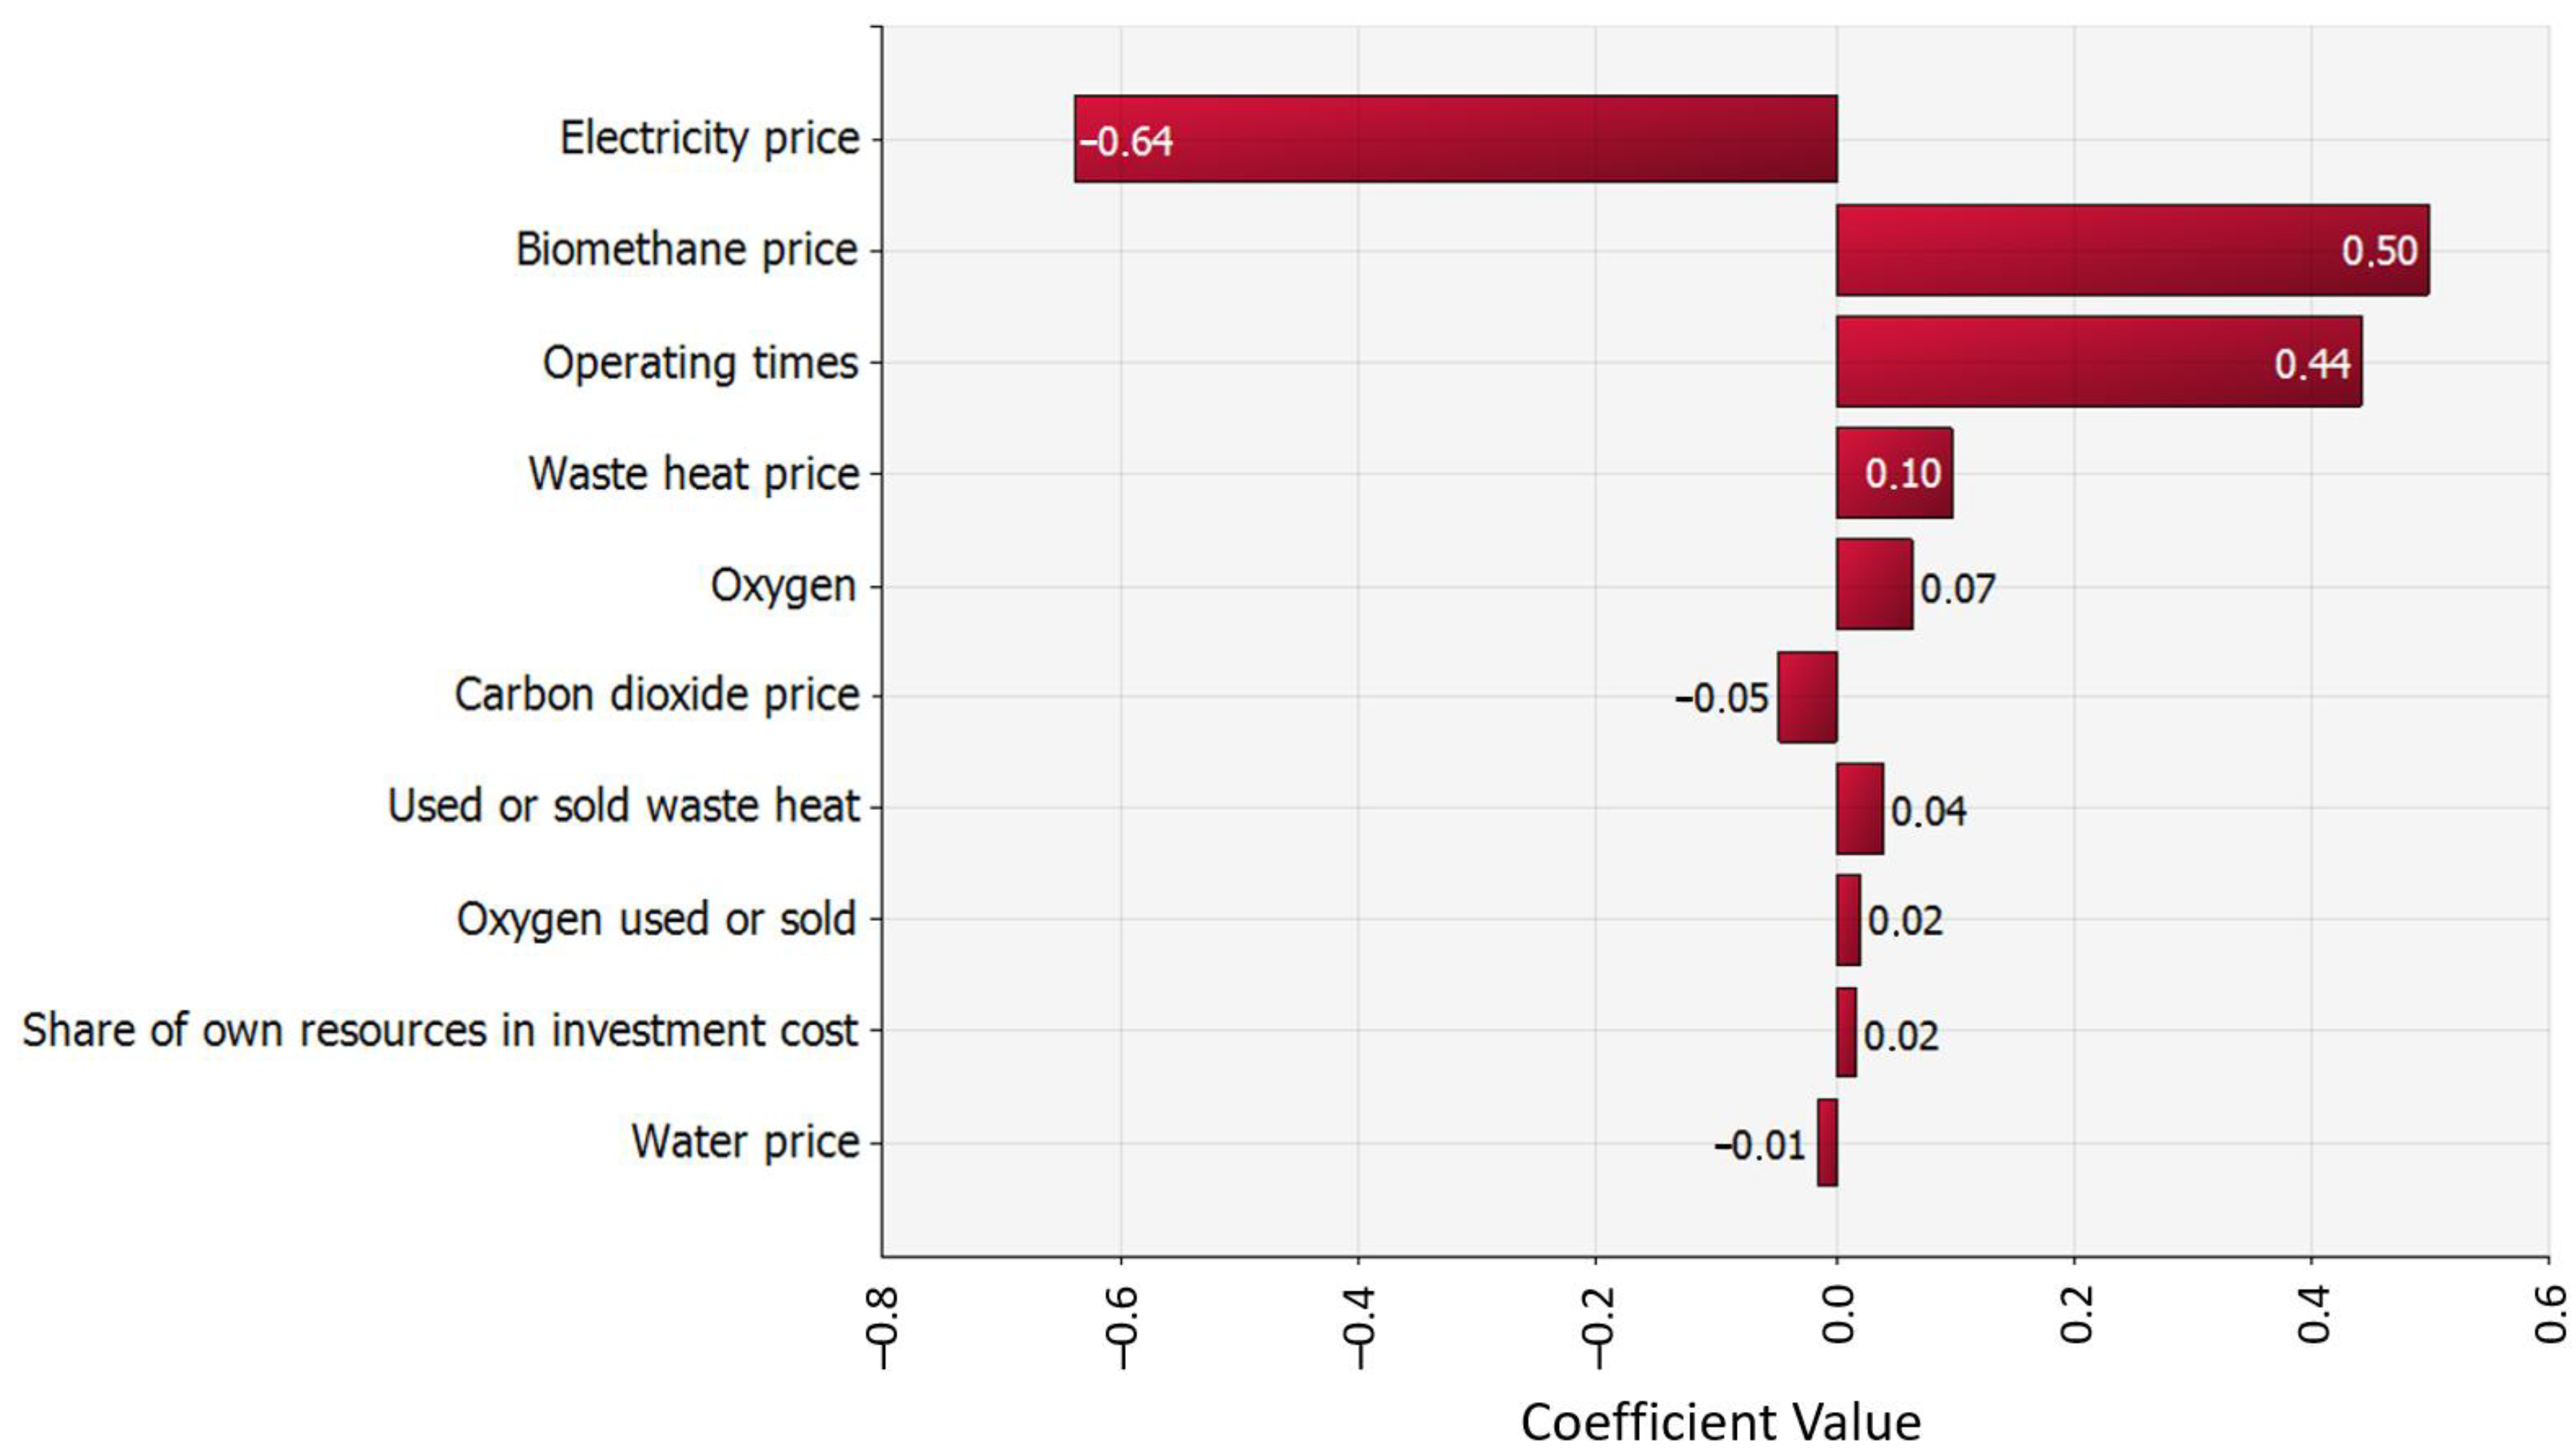
4.1. Investment Analysis

The bio-P2M plant financed by one’s own capital as a base scenario could not be considered a good investment with the parameters considered. Although the cash flow is expected to show a modest surplus in the years of operation, and its nominal value is increasing (EUR 294–370 thousand/year), its present value discounted by the opportunity cost decreased year by year (EUR 270–119 thousand/year), which supports two observations:
  • The expected rate of increase in input and output prices was less than the opportunity cost of our money invested in the operation. This means that it could be used elsewhere with greater returns under the current circumstances.
  • Compared with the investment cost, the annual cash flow surpluses were negligible, and thus the payback was not expected until well beyond the operational lifetime.
The details of the investment analysis for the base scenario are shown in Table 4. From the 15 year life cycle, we included only the year of investment and years 1, 5, 10 and 15 due to space constraints.
As a result, the NPV was negative (EUR −2198 thousand), the money invested in investments and operations was not recovered (PI = 0.56), and the profitability of the operation was about 0 (IRR = −0.09%). This also indicates that if one’s own equity were used, a 44% grant would allow for break-even operation (by investing one’s own money in other ways). This underlines the fact that, with the current technological advancement and economic conditionalities, public involvement is essential for the proliferation of the technology and completing the associated long-term energy storage tasks.
The importance of each revenue and expenditure item and capacity utilization in operations is supported by the sensitivity analyses. When examining 5000 randomly run simulation models, the following can be concluded.
The spider diagram (Figure 8) shows that the increase in the price of electricity as an input had a negative impact on the investment indicators, while the increase in the price of biomethane and the number of hours of operation per year had a positive impact on the same. The effect of the generated oxygen and waste heat was negligible. In the simulation studies, the input and output results were calculated as a result of stochastic processes in the results of each run. This means that, unlike deterministic simulation studies, the input data were involved in the formation of the output according to their respective distributions, and therefore, these results did not always reveal linear changes. A so-called nonlinear stochastic trend depending on the distribution was observed in this case.
The tornado diagram (Figure 9) shows that the electricity price had the largest impact on the NPV (correlation coefficient: −0.66), followed by the biomethane price (0.49) and operating time (0.43), with the latter two causing changes in the same direction.
As can be seen in another tornado diagram (Figure 10), changes in the input or output price per unit caused similar changes in NPV (0.64, +0.50 and +0.44) to the previous figures. For the IRR, the trends and values were quite similar, while for the PI, the role of financing was the determining factor (correlation coefficient: 0.66), followed by electricity (−0.42) and operating time (0.35), while the biomethane price came in last (0.31).
Statistically, there was only a 9% chance that the conditions under consideration would change in a direction and to the degree that would result in an NPV of at least zero, which is a highly significant risk at the entrepreneurial level (Figure 11).
To sum up, the role of financing (public or low-cost equity and state-subsidized credit facilities) for the establishment of P2G plants is inescapable for the entrepreneurial sector. If the risk premium or the industry beta decreases (making future changes more predictable), this could also positively impact the economic perception of P2G investments. The co-movement of electricity prices and natural gas prices negatively affects the rates of return due to the higher impact of the former. Continuous utilization is a basic requirement. This result is still well below the industry’s expectations by default (Damodaran, 2023) [91].

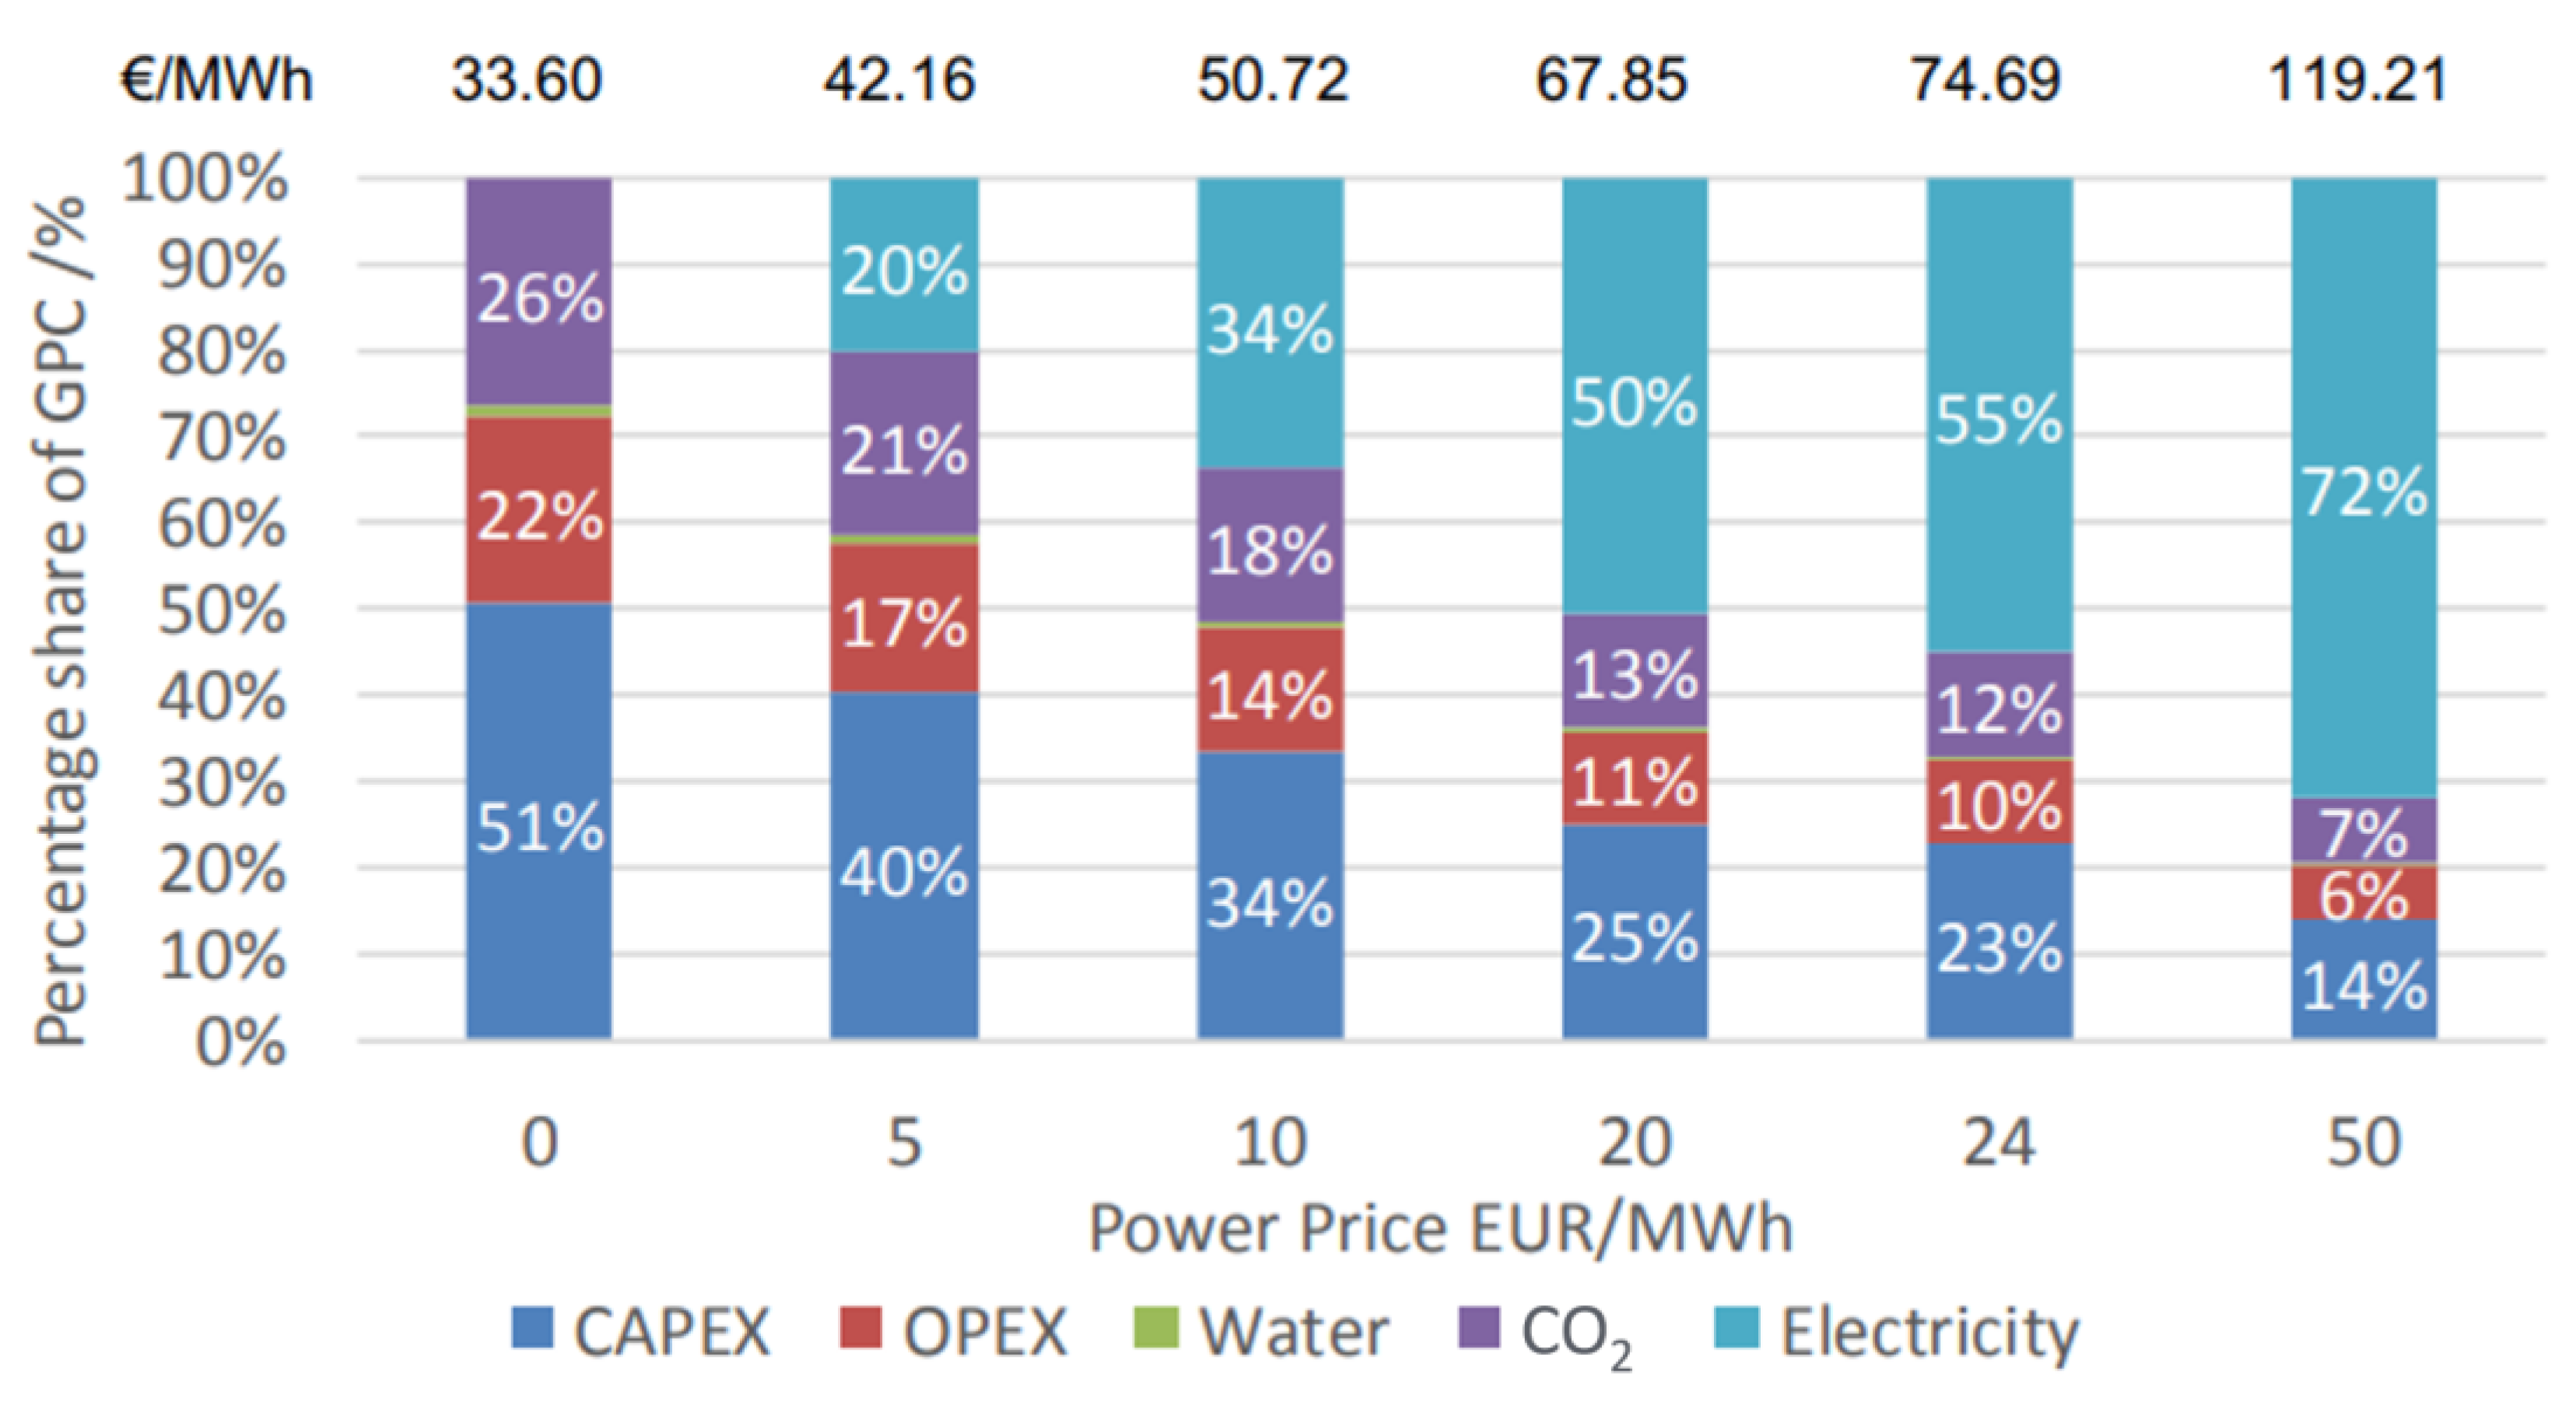
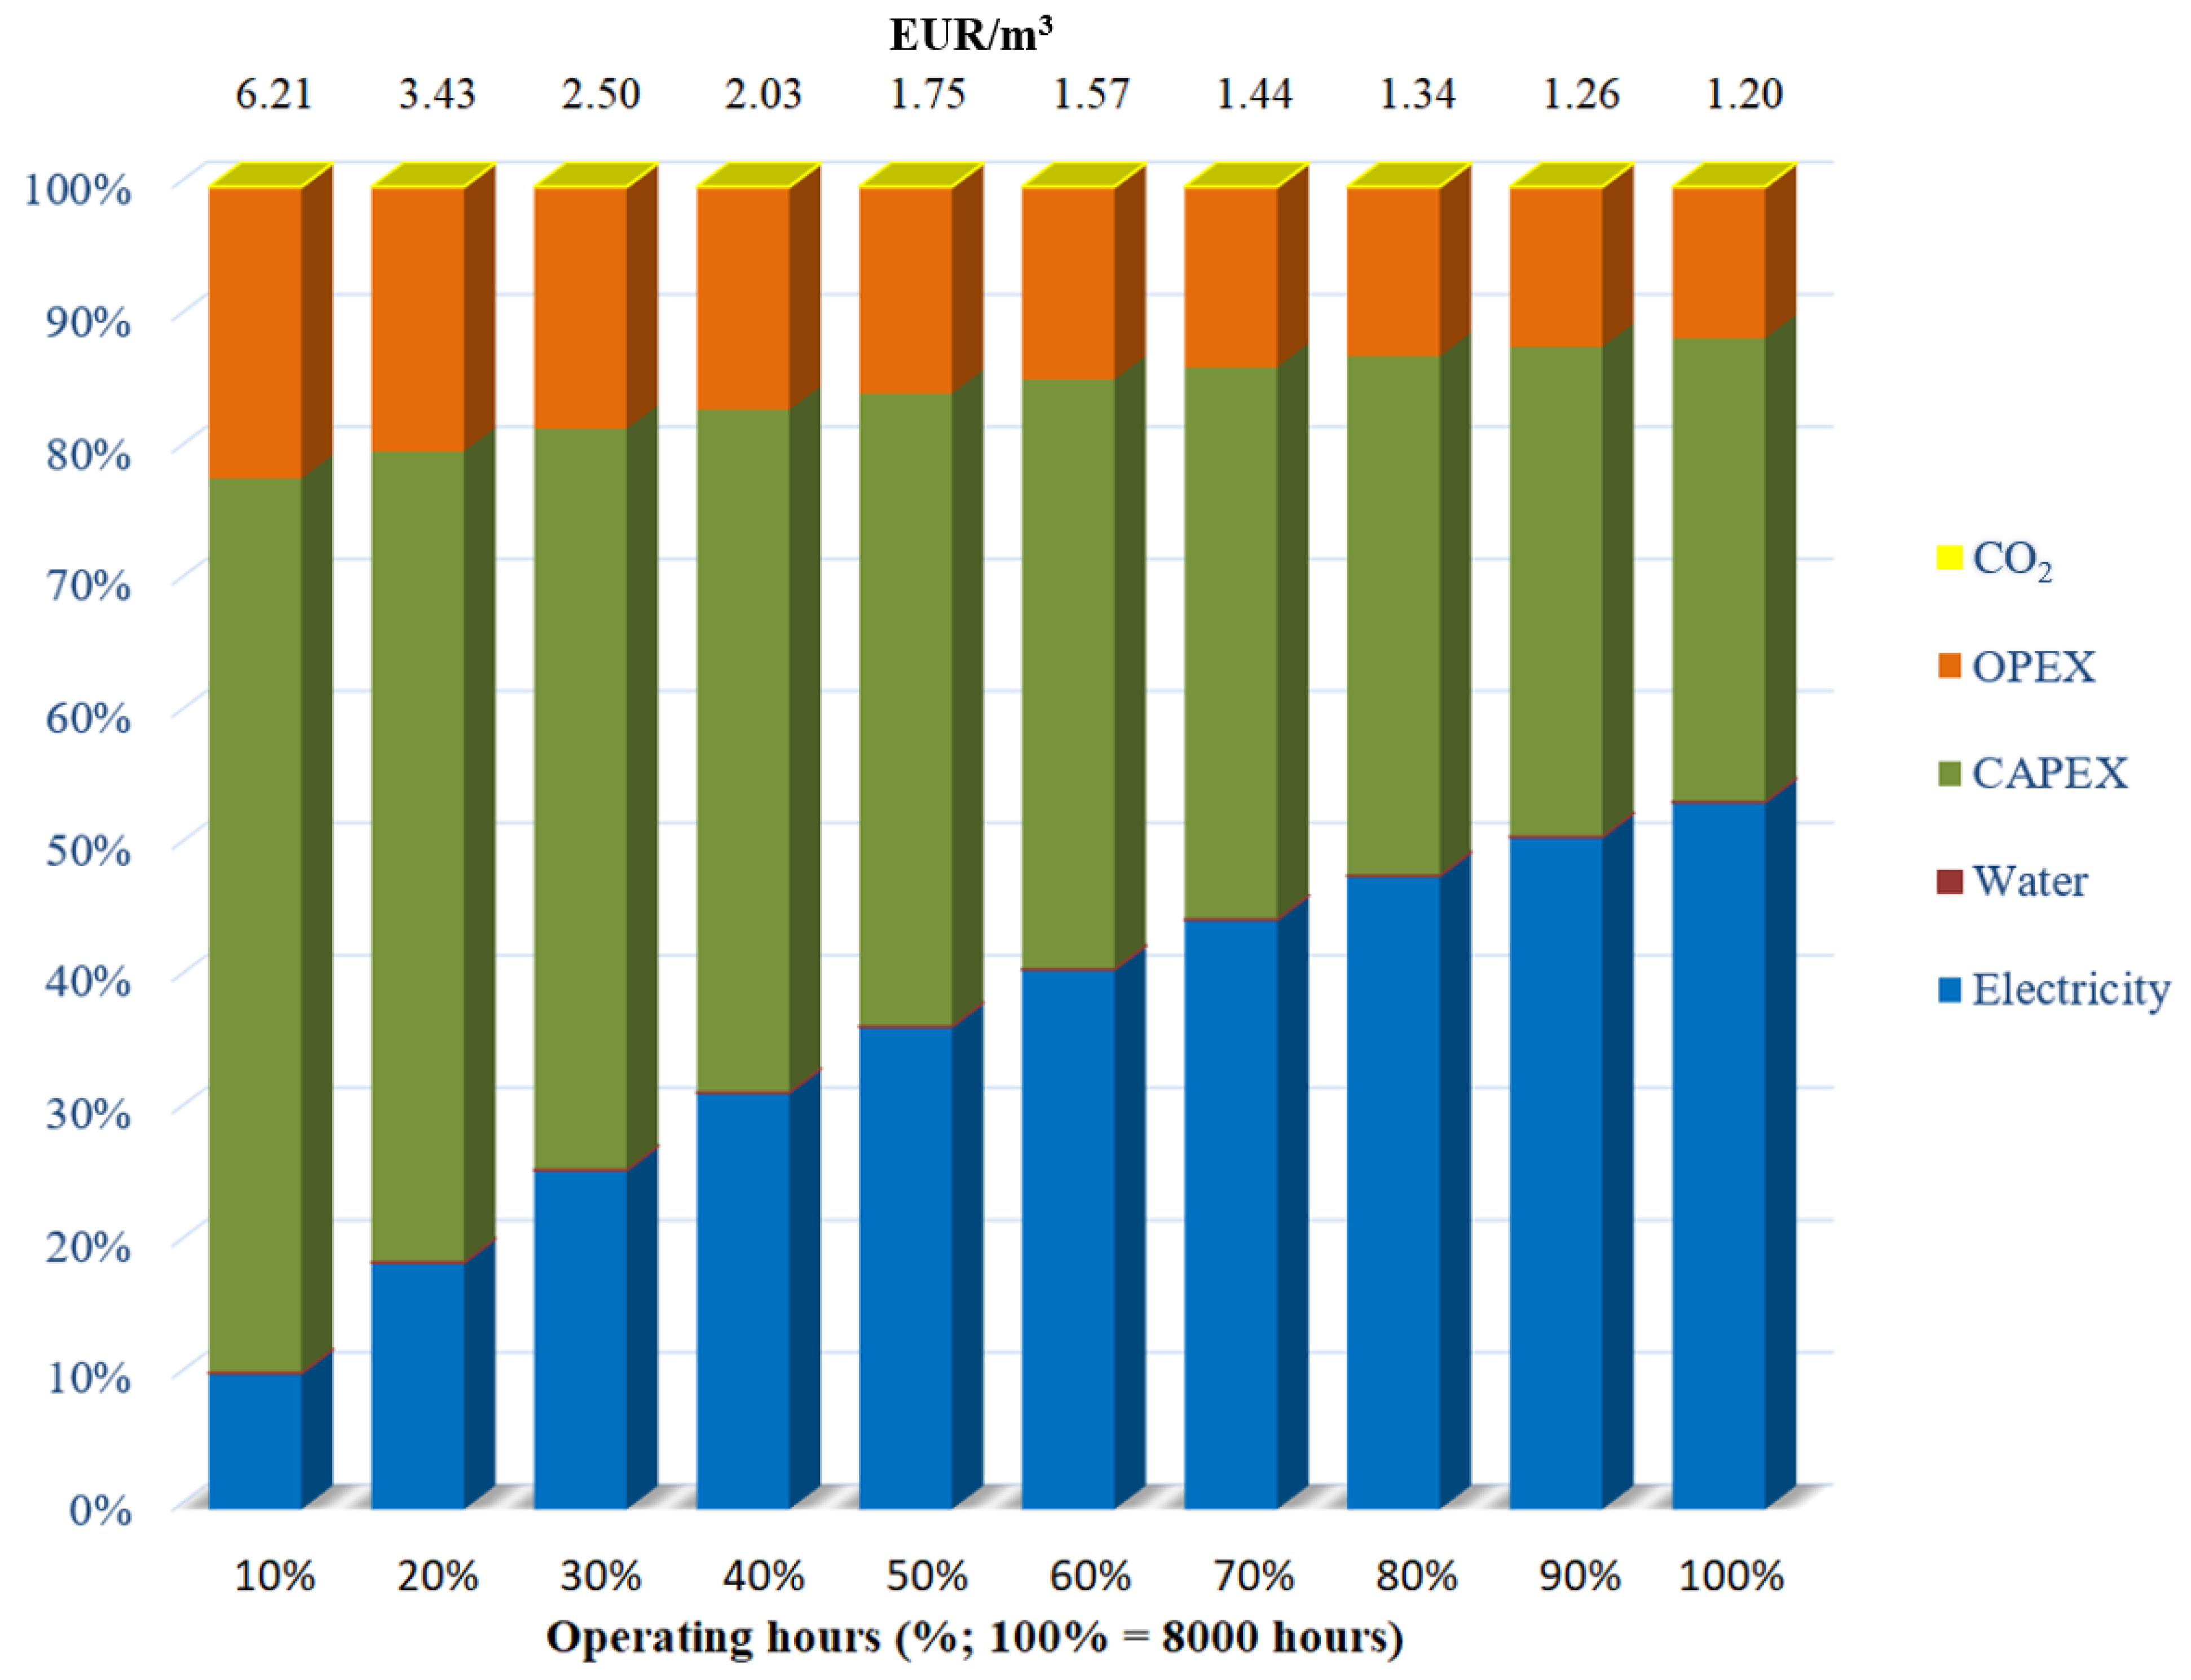
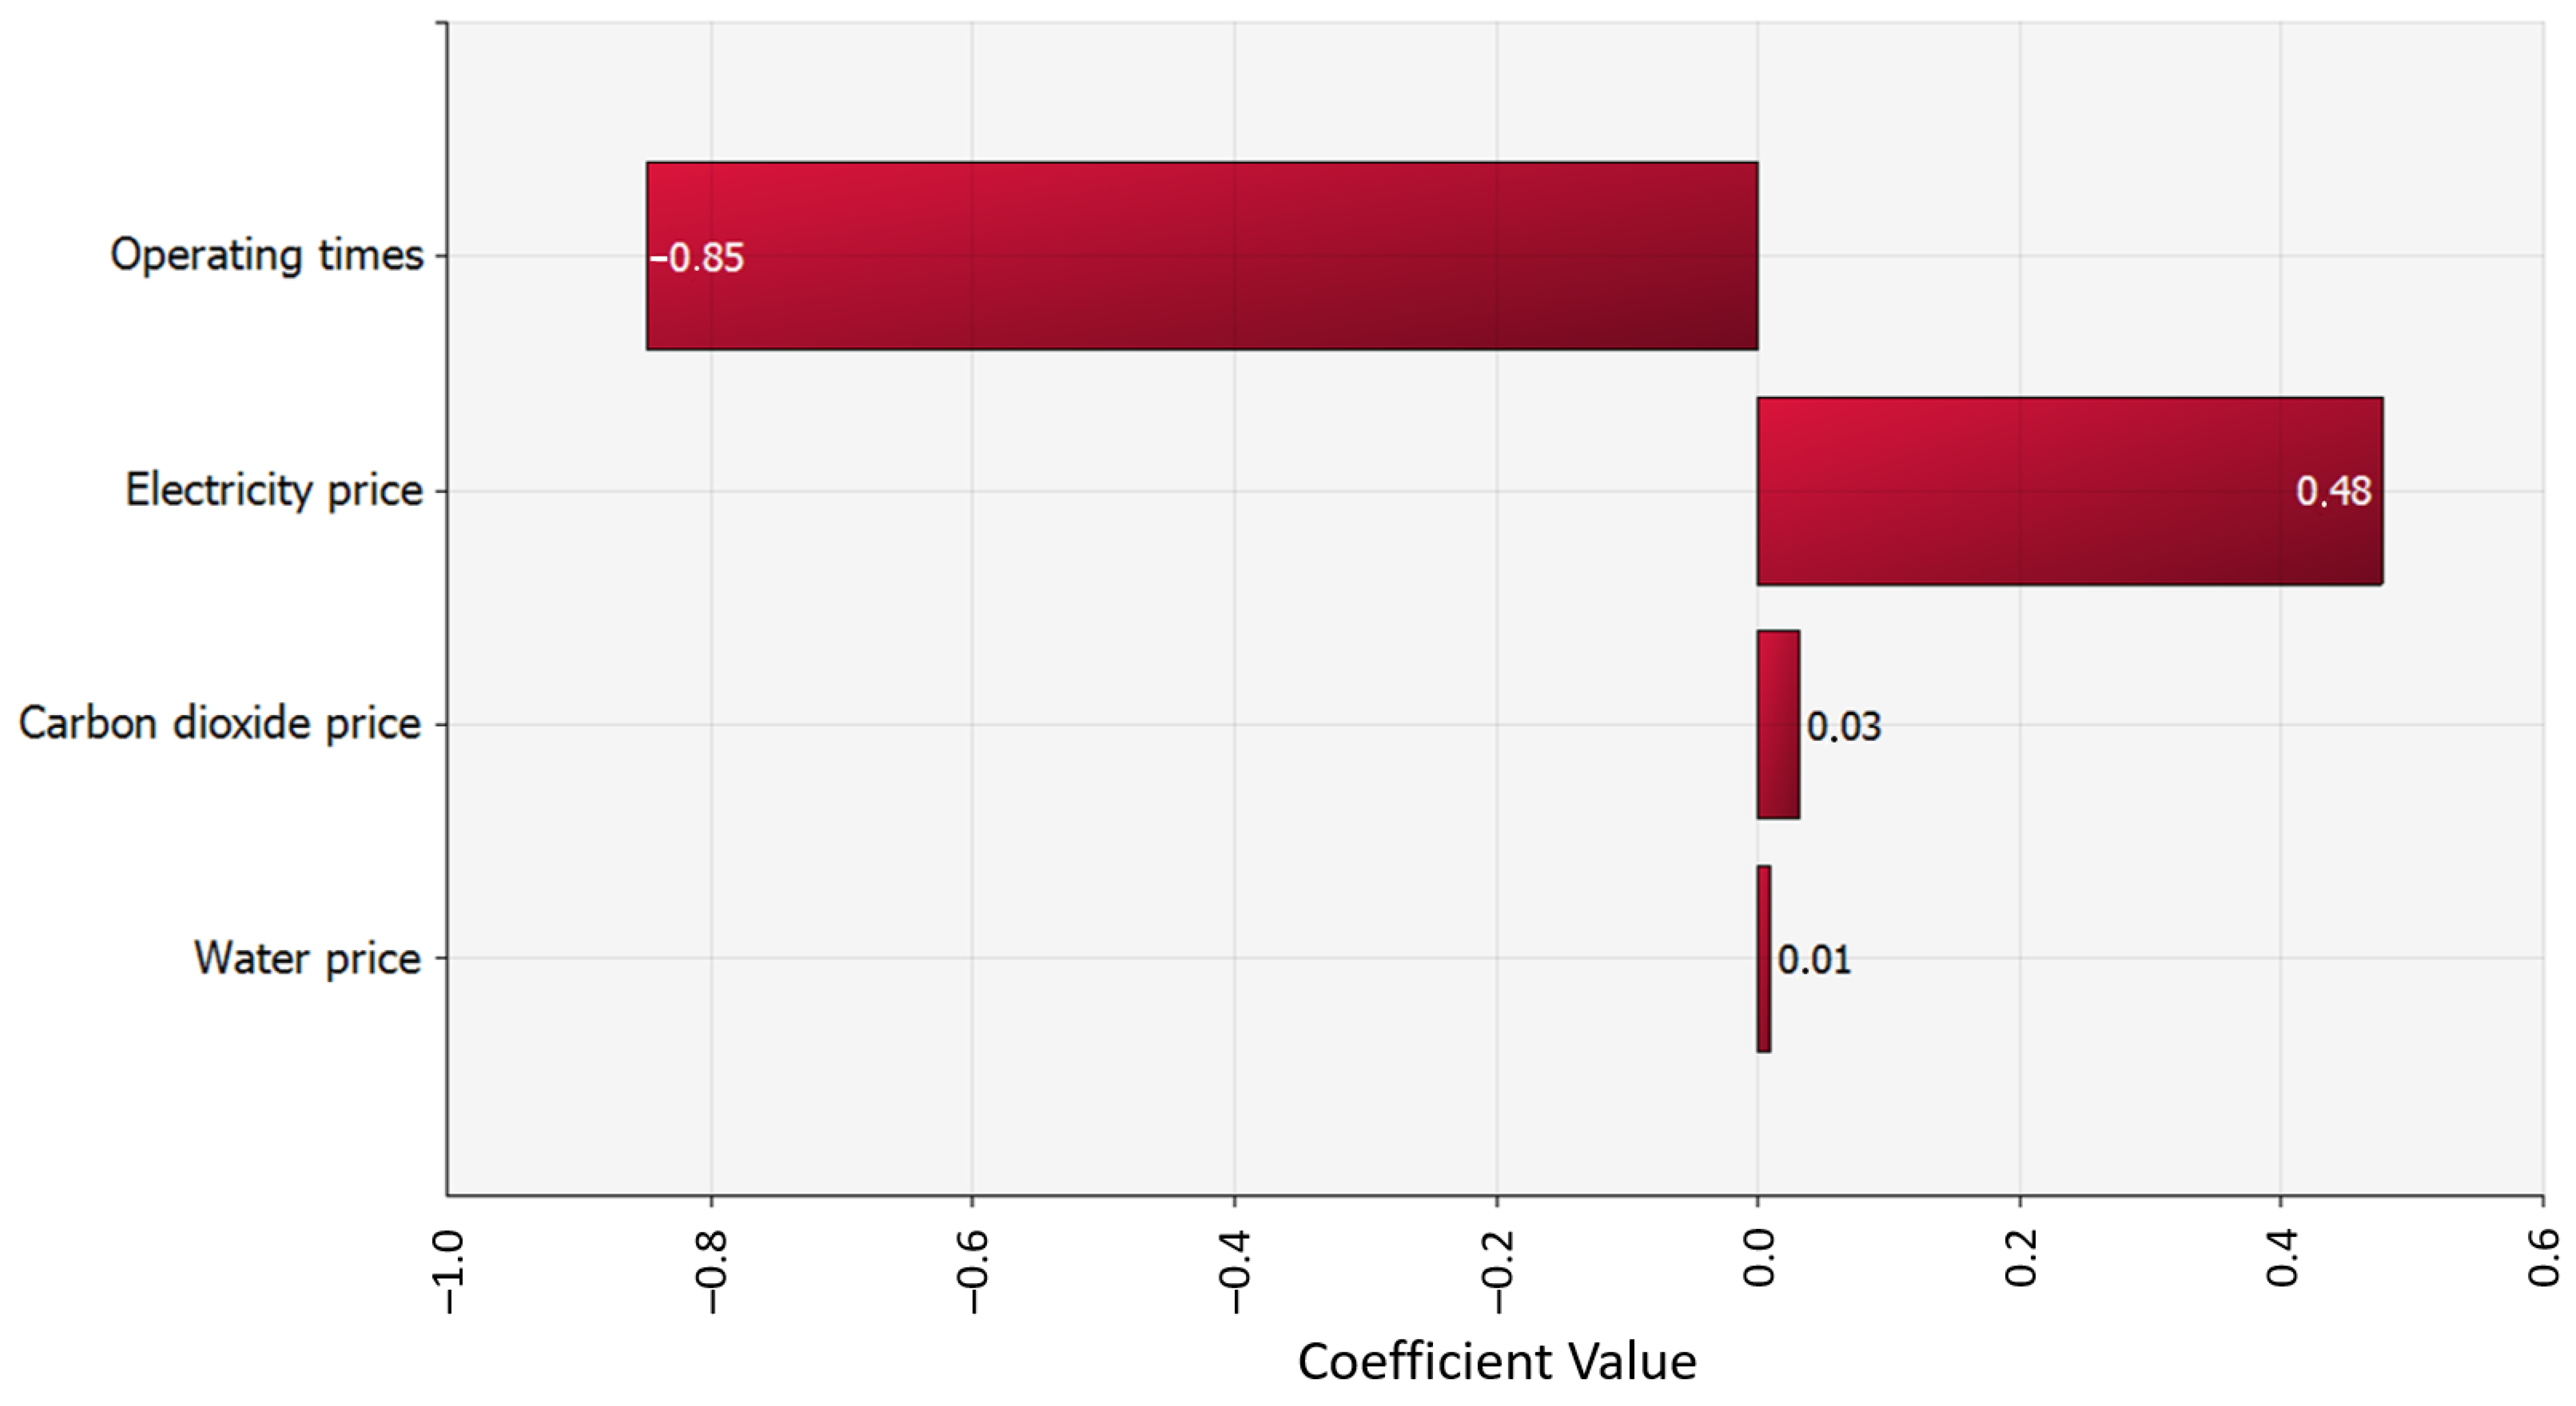
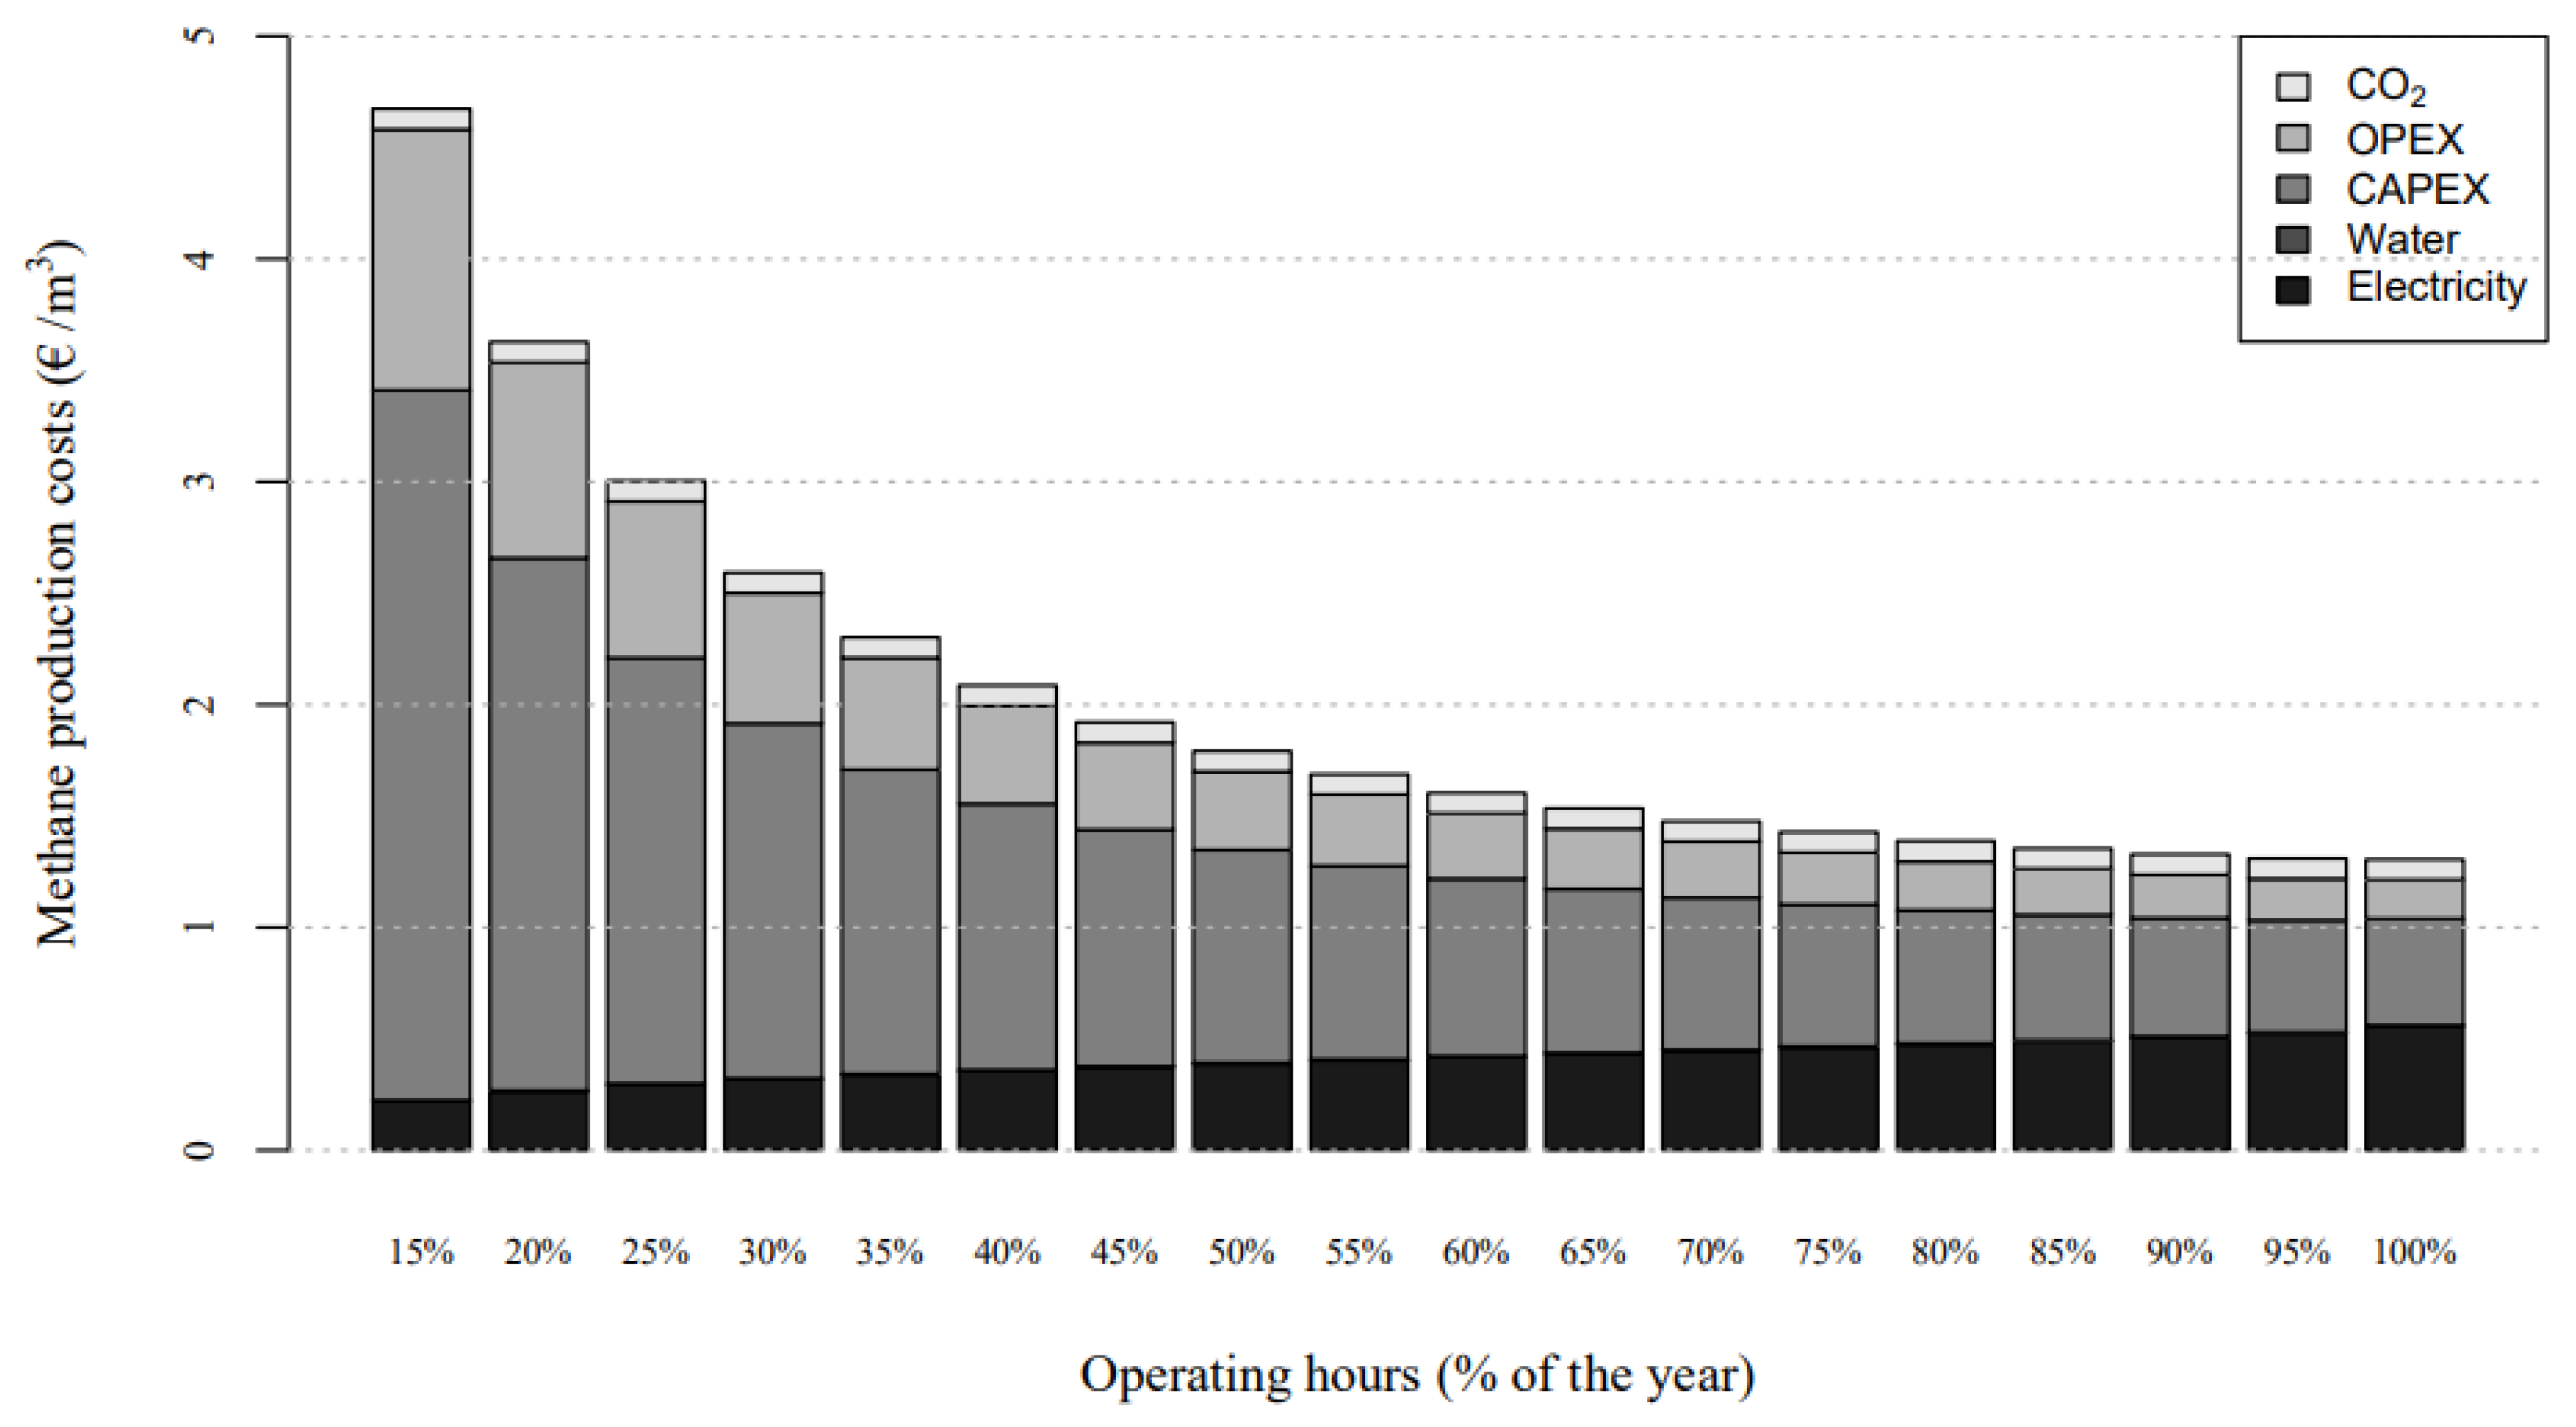
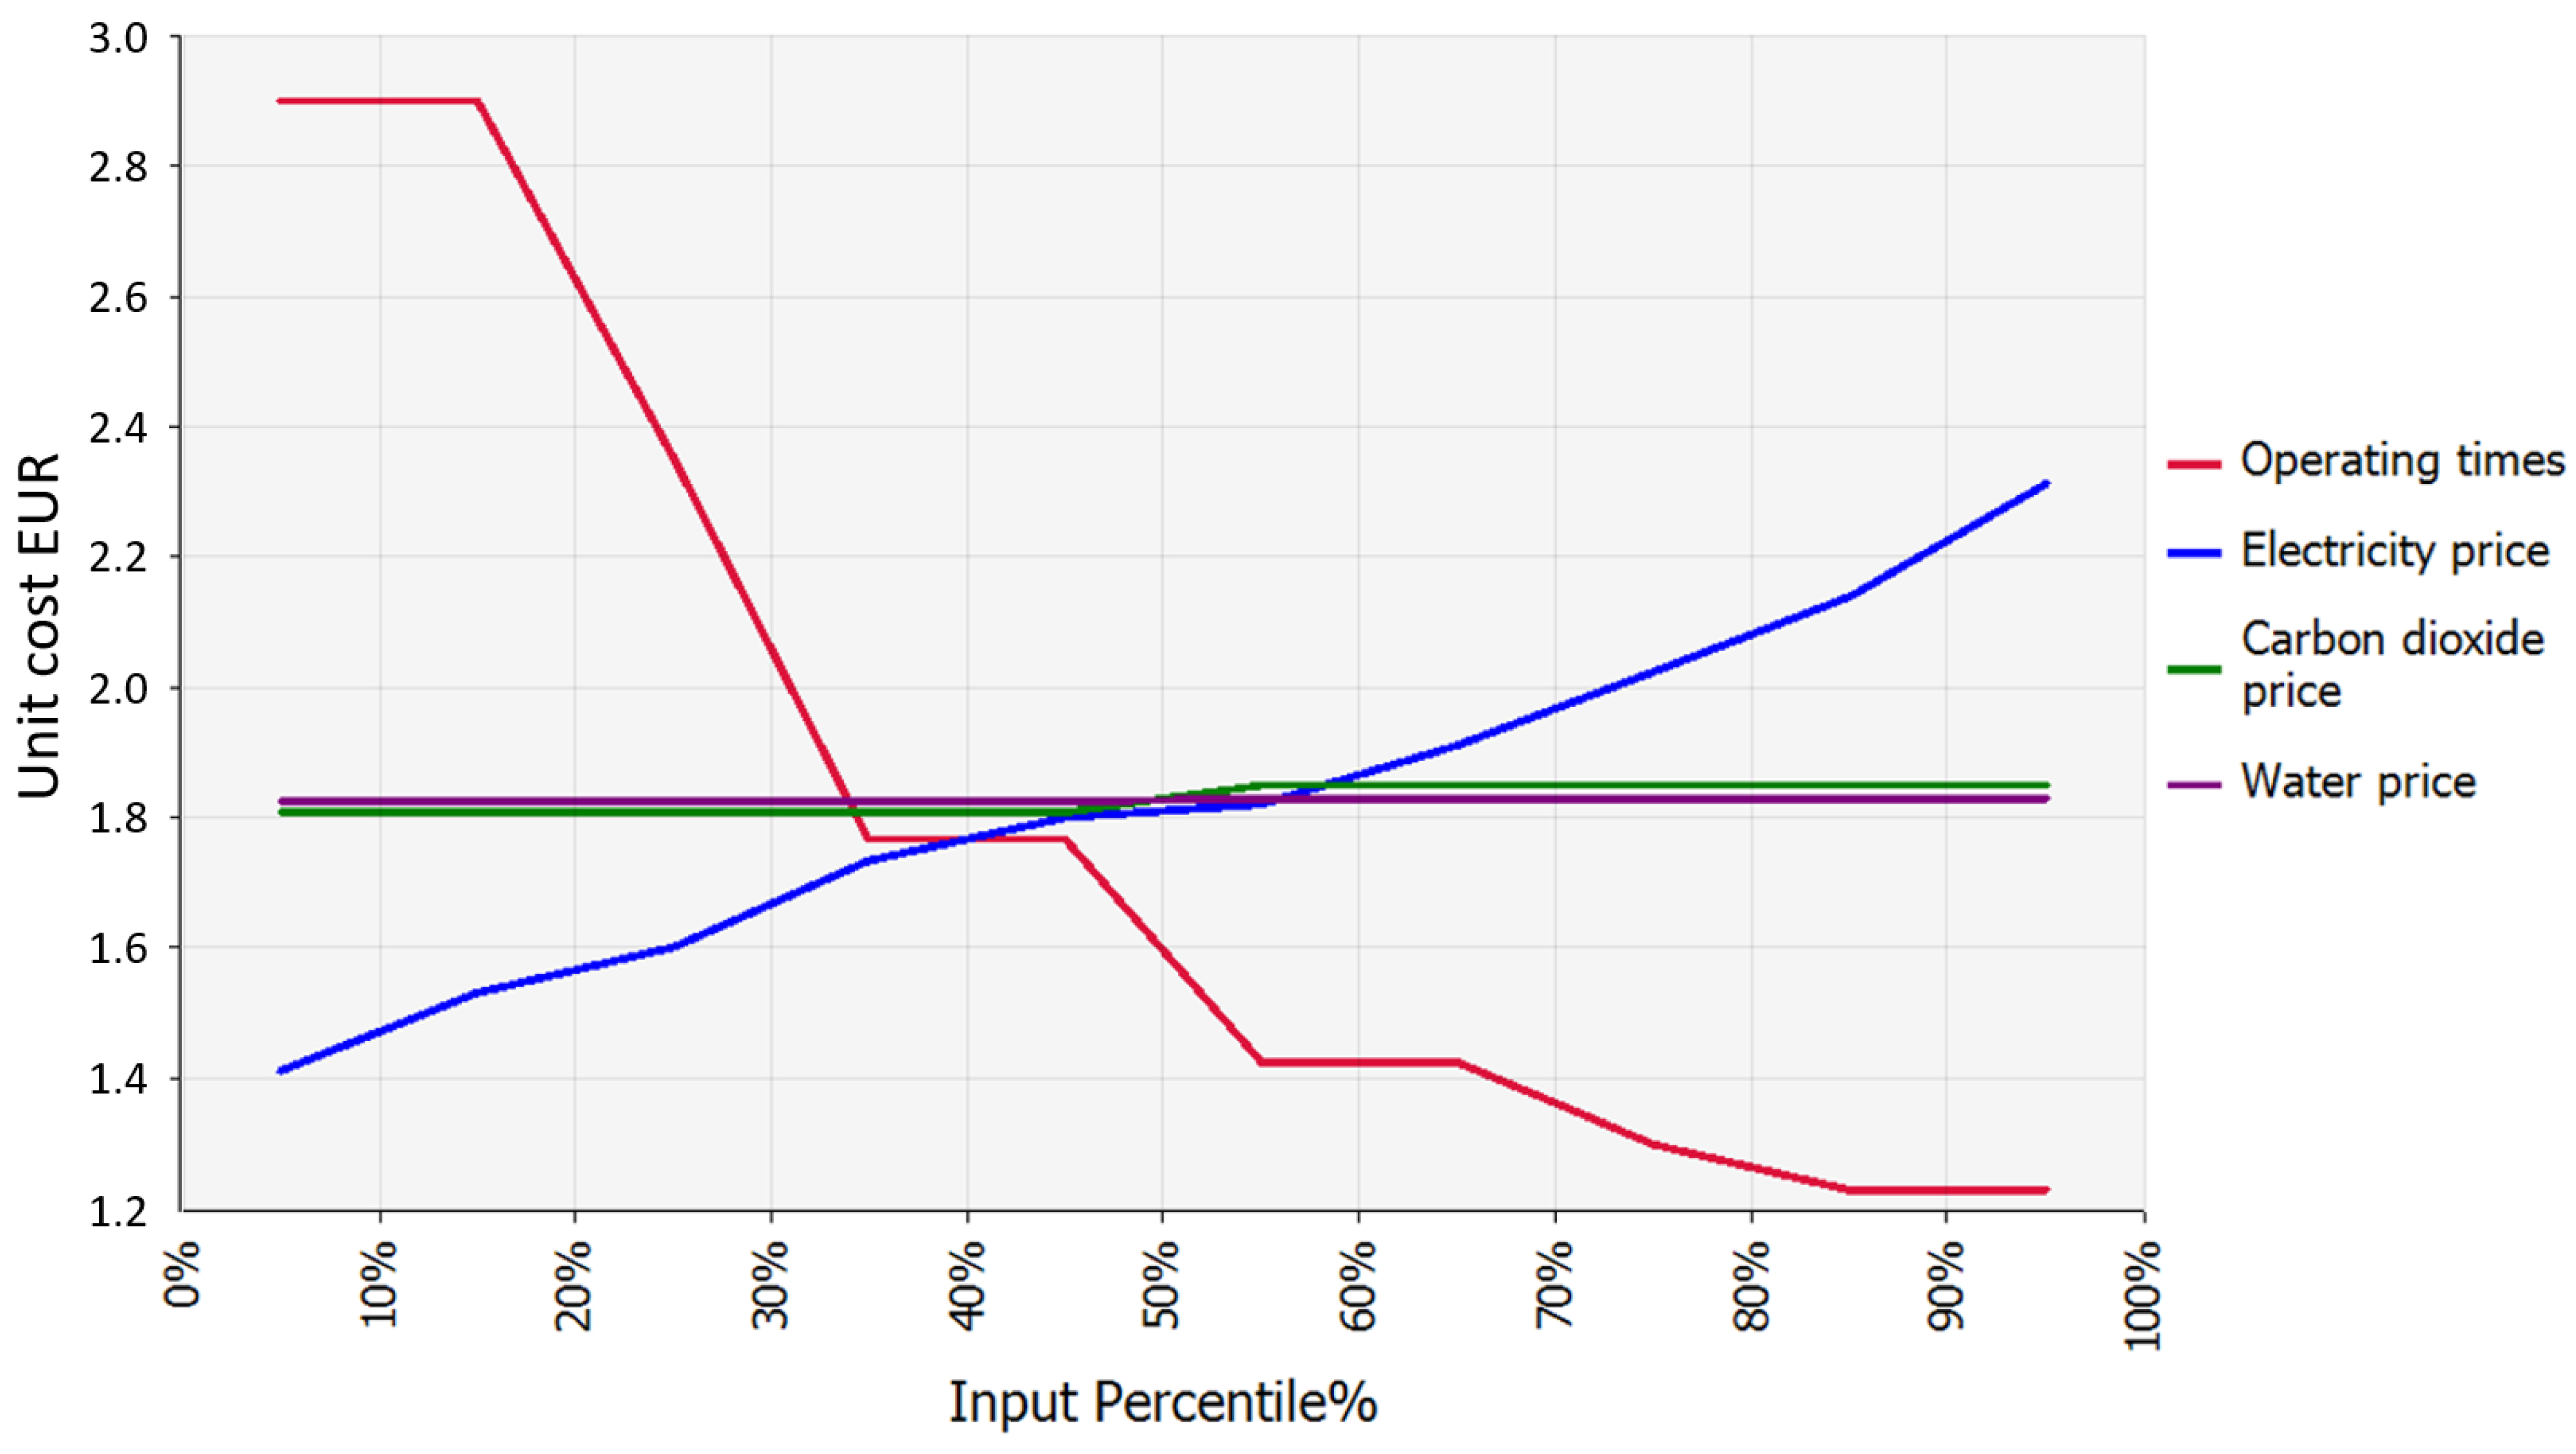
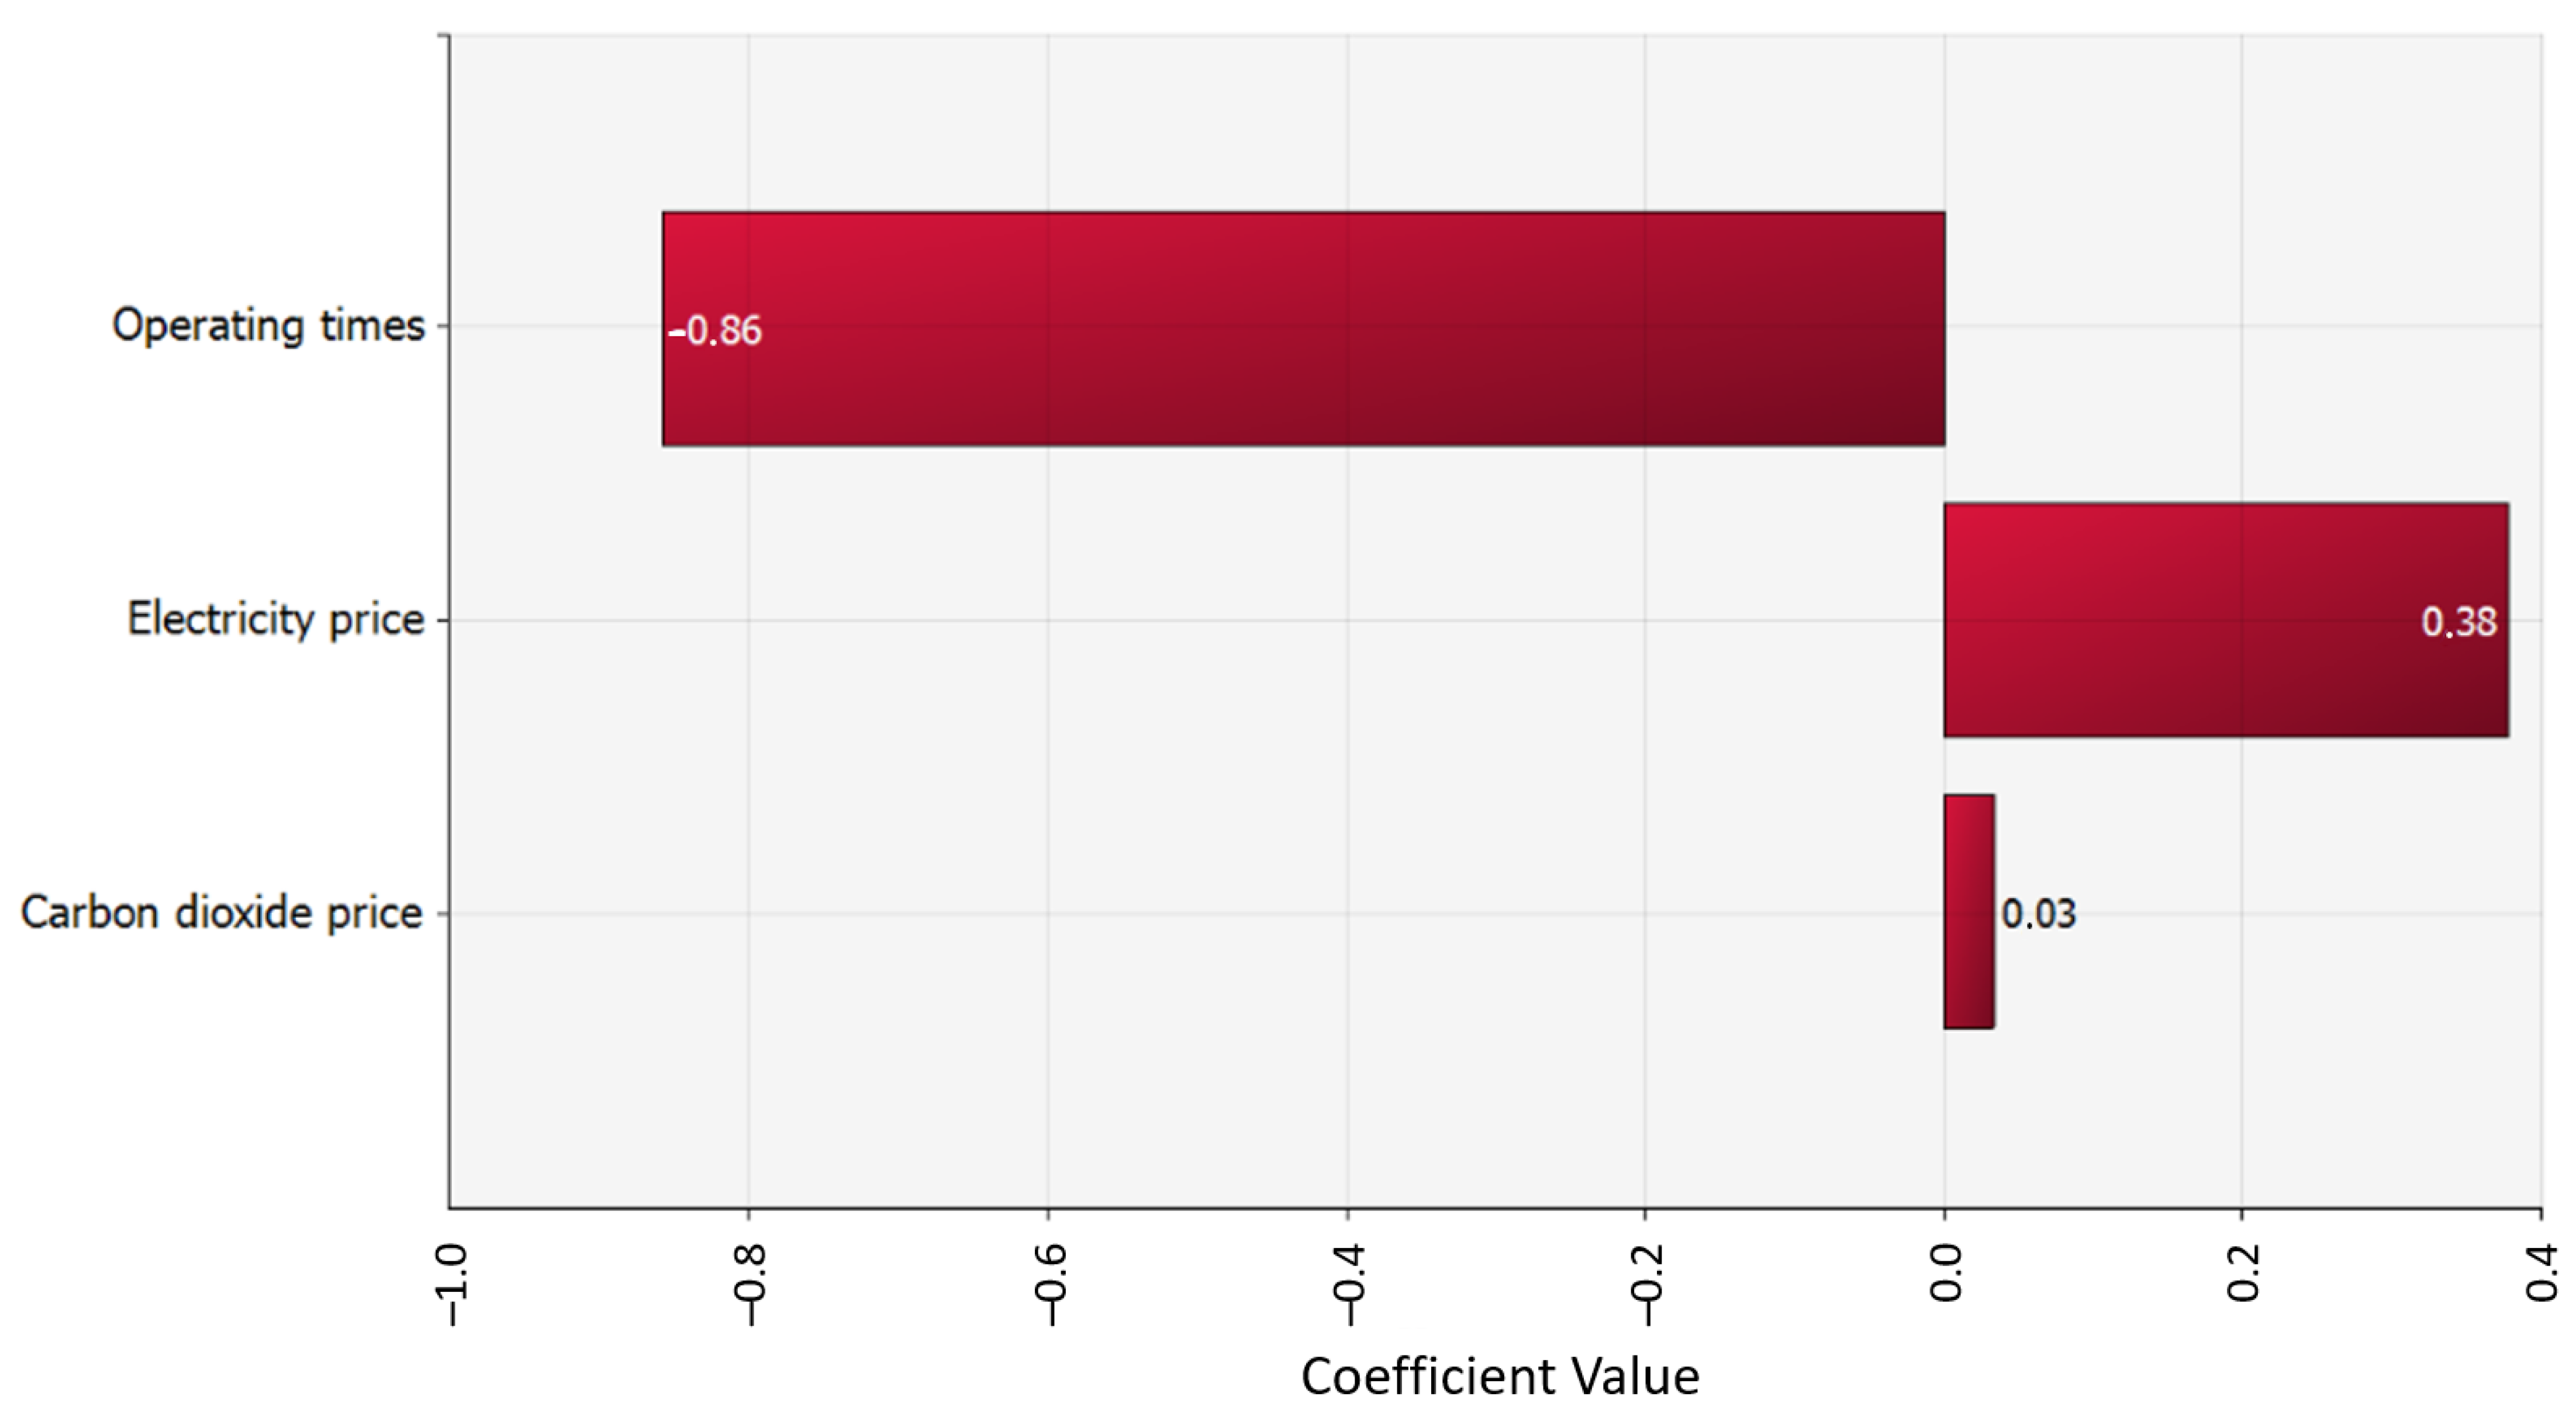
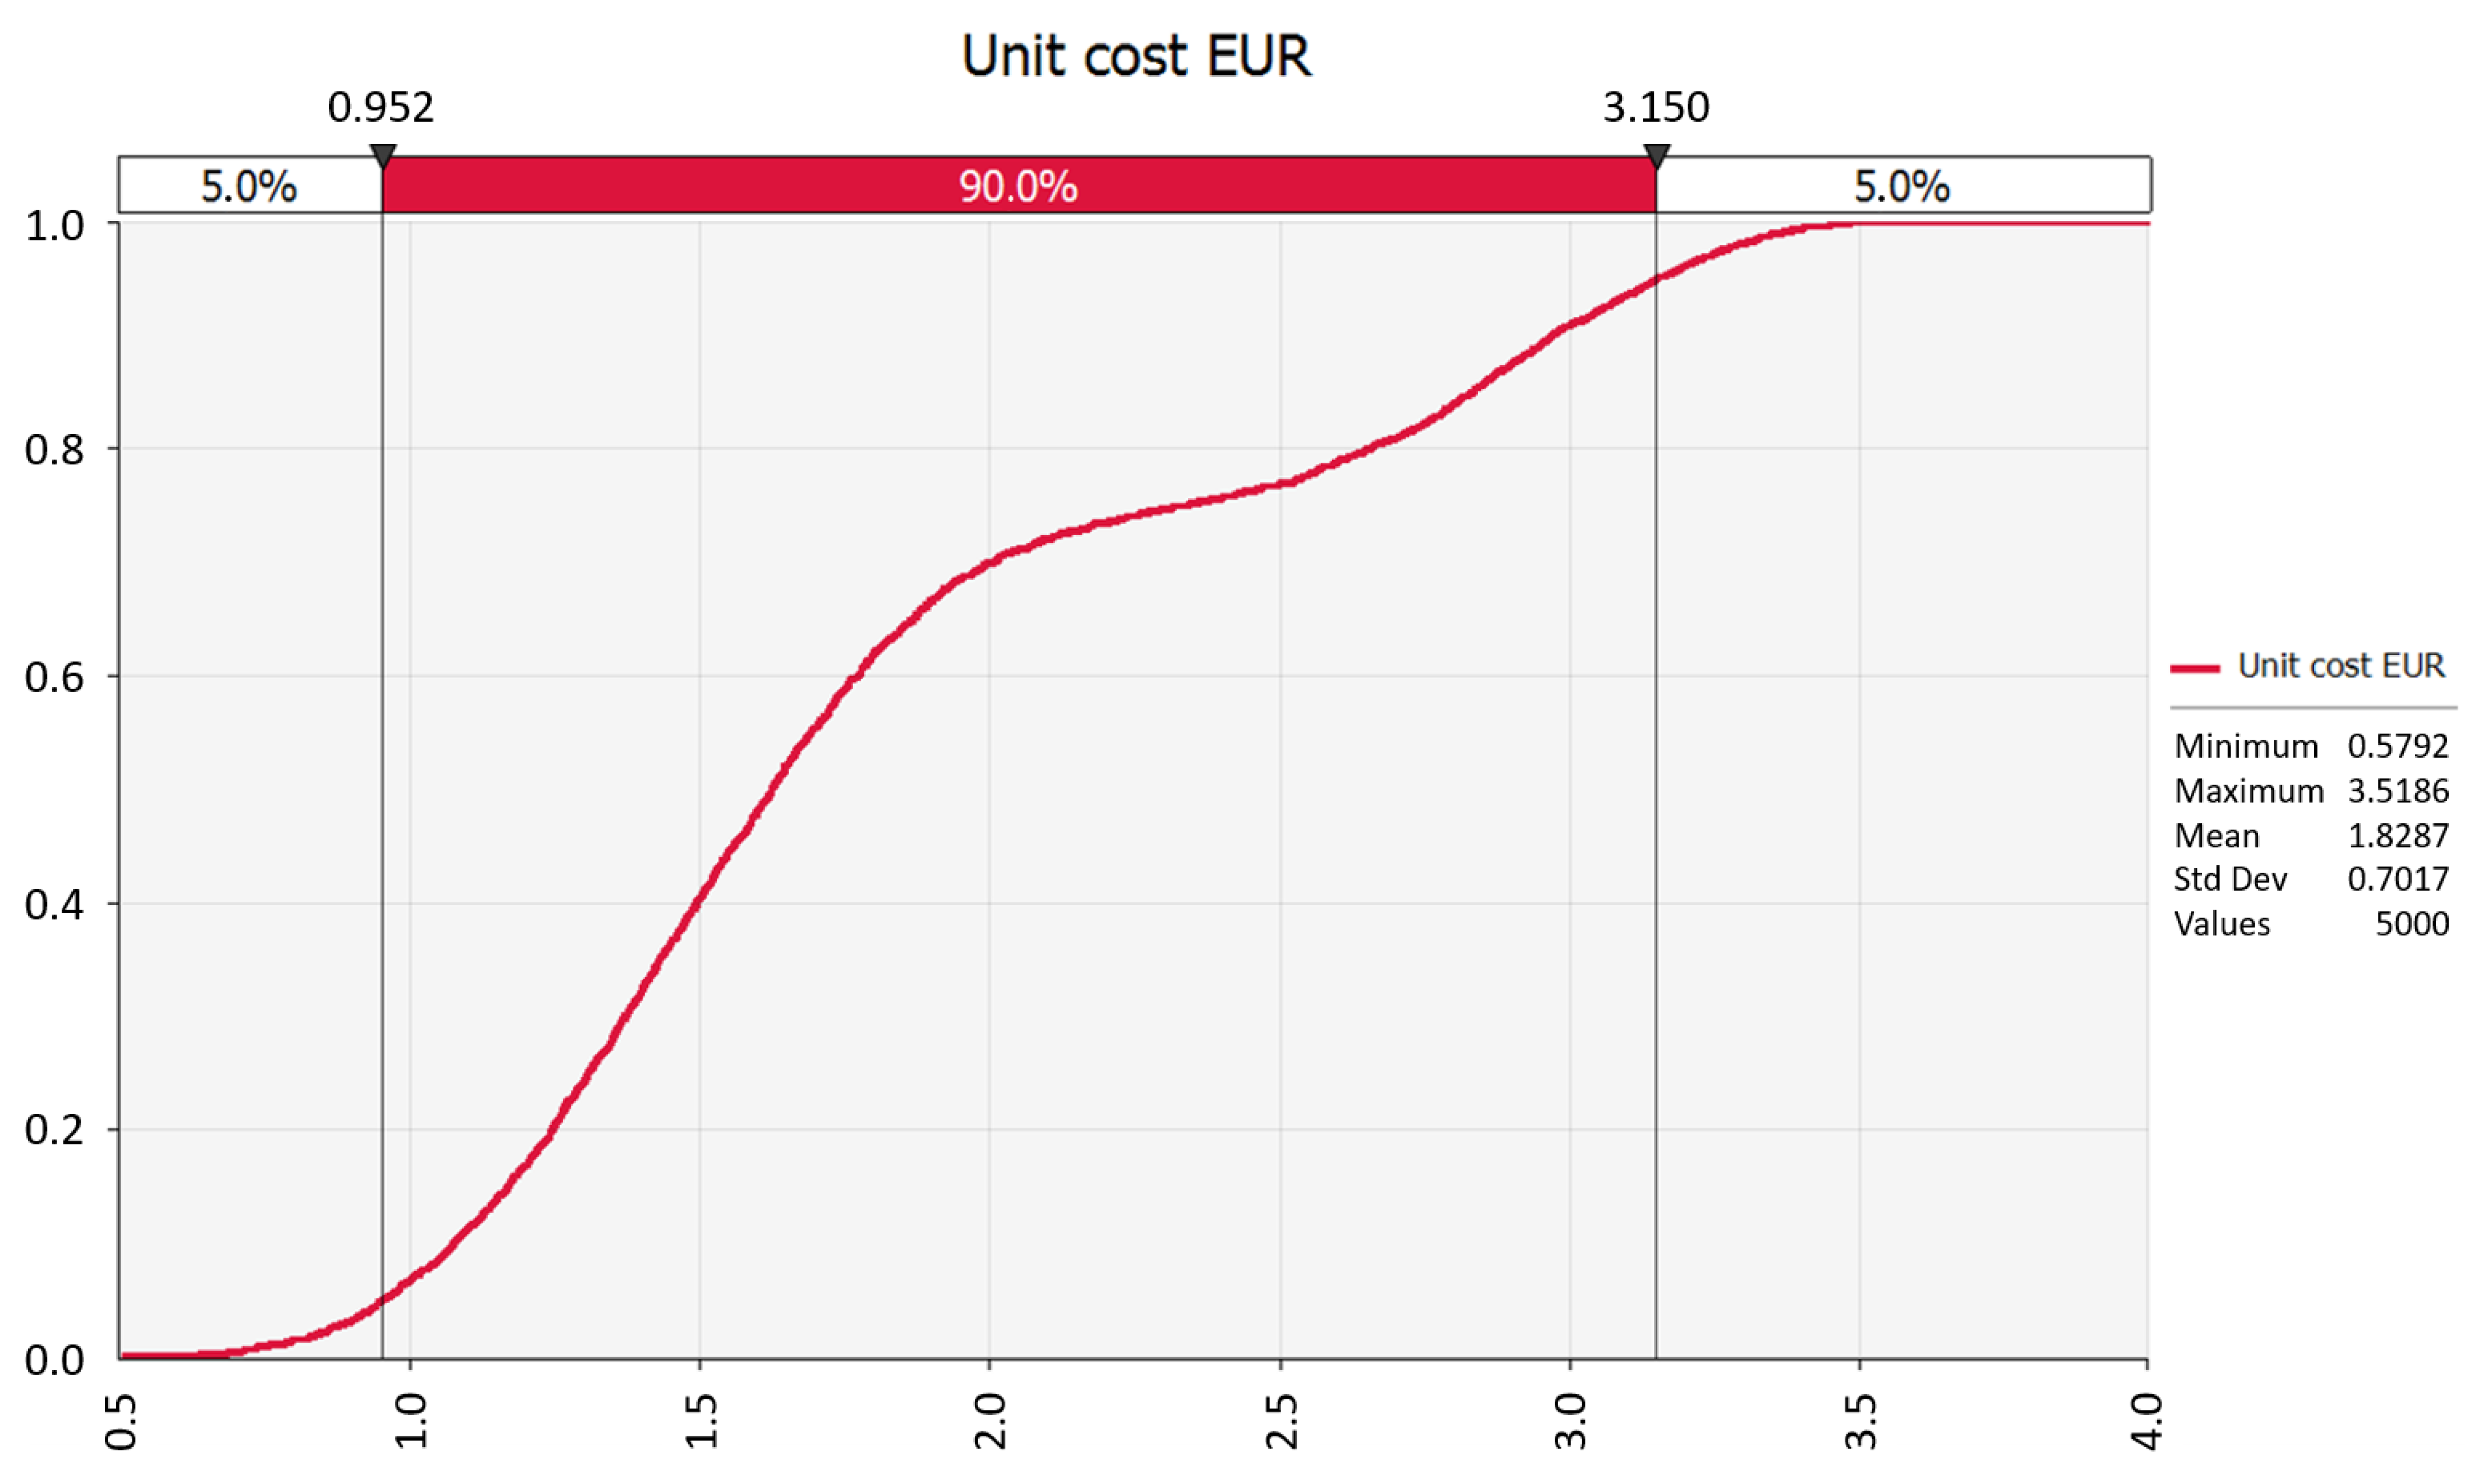
4.2. Unit Cost of Biomethane

The unit cost of biomethane produced from electricity is EUR 1.2/m3 in the base case, which is much higher than the price of natural gas in February 2022 (EUR 0.74/m3 [46]) and the unit cost of biomethane from conventional biogas cleaning (EUR 0.51/m3 [46] and 0.6/m3 [23]).
Figure 12 shows the role of capacity utilization, which had a two-way effect in relation to biomethane production. It had a significant impact on both the magnitude of the unit cost (EUR 1.2/m3 at 100% utilization and 6.21/m3 at 10%) and the evolution of the cost structure. Lower utilization (around 10%) typically occurred when it was used to utilize freely available electricity (smaller amounts, mainly from RES). As the capacity utilization increased, the amount and average cost (expected purchase price) of the consumed electricity increased. These results are generally in line with the findings of Gorre et al. (2019) [50] (Figure 3) and van Leeuwen and Zauner (2018) [51] (Figure 4).
If electricity were available free of charge for the 8000 h annual operating period, then the unit cost achievable in our case study would be reduced to EUR 0.56/m3, which could be nearly equal to the competitive products. This shows that the P2G process could be economical in our days, even without subsidy, if it uses waste electricity.
The values we obtained were close to the SNG unit cost (EUR 1.3/m3) obtained by Bassano et al. (2020) [49] at full capacity utilization and much higher than the SNG unit cost of EUR 0.32/m3 and 1.1/m3 reported by Gorre et al. (2019) [50], where electricity was available at no cost in the first case and at EUR 50/MWh in the second one. The same was case was found when compared to data from Birman et al. (2021) [47] (EUR 0.35–1.1/m3).
The electricity price (53%) and the amortization cost of the investment (CAPEX, 35%) were the main drivers of the unit cost composition. The cost structure was quite similar to the cost structure presented by Bassano et al. (2020) [49] at full utilization, but the share of CAPEX was much lower than the 54–55% considered typical by the EBA (2022) [46], which is a consequence of the different plant capacities.
If the annual utilization is reduced from 8000 to 2000 operating hours, then this changes the unit cost to EUR 2.87/m3, while the CAPEX share of the cost structure increases to 58% and the electricity cost is reduced to essentially the same share as the other operating costs (22% and 19%, respectively). This very poor capacity utilization without a force majeure situation may be mainly due to the fact that the plant only operates when it receives the electricity it needs to operate for free (i.e., when the price of electricity on the spot market falls to zero). The 2000 h annual operating time combined with the free electricity results in a unit cost of EUR 2.23/m3 (of which 75% is CAPEX), which is significantly higher than the unit cost of the base case (i.e., full capacity utilization is more important than the free electricity cost).
In our cost structure, for all electricity prices, CAPEX plays a much larger role and the cost of electricity a smaller role than in the studies of Gorre et al. (2019) [50]. This is likely due to the lower nominal investment cost used in his model and lower electricity prices, which are the result of significant increases in prices in general as well as electricity prices following the extraordinary events that have occurred since then.
However, 8000 h of operation with free electricity would bring the unit cost of SNG to the same level as biomethane from cleaning (EUR 0.56/m3). This suggests that, in principle, it is conceivable to produce biomethane competitively without subsidies only in the most favorable scenarios, in accordance with the statement of Götz et al. (2016) [64]. The sensitivity analysis also supports the previous findings.
The spider diagram in Figure 13 shows that the unit cost was influenced mainly by two items—the operating time and the electricity price—while the impact of the water and carbon prices was practically zero.
The role of the operating time was dominant (correlation coefficient: −0.85) and was largely reflected in the unit cost (regression: −0.86). The price of electricity was the second most important item in accordance with both two indicators (+0.48 and +0.38, respectively) (Figure 14 and Figure 15).
The probability of the unit cost of biomethane obtained by biogas cleaning was practically zero (Figure 16).
On this basis, it can be concluded that, considering the arm’s length principle, SNG produced with P2G is not competitive with either natural gas or biomethane produced from biogas under current conditions. However, P2G is not primarily a process for energy production but first and foremost for energy storage, and therefore the higher unit cost is essentially the cost of electricity storage.
Of course, the use of cheaper electricity has a positive impact on the competitiveness of the process, but its variation should not affect the ongoing performance of the investment, as the CAPEX role is more dominant.

5. Conclusions

A modern review of biogas upgrading technologies related to electricity storage was carried out, and their advantages and disadvantages were identified in this article.
The P2G process allows the recovery of CO2 in biogas (which is worthless for cogeneration and is not always available in a recoverable form in the case of purification) and the storage of electricity, which could relieve the load on the national grid and allows more widespread use of weather-dependent renewable energy sources (sunlight and wind).
While the first step of the process (electrolysis) is undergoing significant development, the resulting hydrogen is less storable (given the current user infrastructure) and usable than the methane that is the end product of the second step.
When evaluating the competitiveness of SNG as a final product from bio-P2M, it is useful to compare it with biomethane from biogas upgrading and with natural gas. Although the composition of both competitors is similar to SNG, biomethane has the advantage in carbon dioxide (from biogas)-to-methane conversion, and regarding natural gas, it has the environmental advantage of a renewable origin. However, in both cases, the long-term storage of electricity is a major advantage of P2G technology, which may justify and make the implementation worth supporting at a higher unit cost.
The case study we examined is uncompetitive without state aid both in terms of return on investment and the cost of gas produced. State involvement would be needed to boost competitiveness in two ways: (1) a 44% non-refundable state subsidy alone would make the plant competitive, in which case green electricity storage (with the market price) would be economically viable, and (2) technology development alone could improve input-output ratios and thus lead to a faster payback.
Although the SNG produced in the process is more expensive than its competitors, full utilization of the plant and the lowest possible price for the electricity used result in significant cost reductions. If both cannot be optimized at the same time, then the former is more important. There is also a small reserve in the increase in natural gas prices and the full utilization of waste heat (e.g., continuous sale for industrial purposes).
The expectable increase in CO2 prices could greatly support the uptake of the process, especially if the P2G process takes into account not only the carbon dioxide available in biogas but also that in industrial gases (fume).
We believe that comparing case studies of plants with different scales of technology, developing technologies in the longer term and public involvement in the short term could lead to a breakthrough in the future uptake of bio-P2M.

Author Contributions

Conceptualization, A.B., P.B. and Z.G.; data curation, P.B. and A.N.; formal analysis, A.B., P.B. and Z.G.; funding acquisition, A.B., Z.C., G.P. and S.K.P.; methodology, A.B., P.B., Z.C., B.S.-S. and Z.G.; project administration, A.B., A.N., Z.C., G.P., S.K.P. and A.S.; resources, A.B., A.N., Z.C., B.S.-S. and Z.G.; software, P.B. and A.N.; visualization, P.B. and Z.G.; writing—original draft, A.B., P.B., A.N. and Z.G.; writing—review and editing, A.B., A.N., Z.C., B.S.-S., G.P., S.K.P., A.S. and Z.G. All authors have read and agreed to the published version of the manuscript.

Funding

This research was funded by the National Research, Development, and Innovation Fund of Hungary, project no. 2019–2.1.13-TÉT_IN-2020-00061 “Waste algae to biogas for clean energy and environment: techno-environmental-economic prospects” in the framework of the 2019-2.1.13-TÉT_IN bilateral scientific collaboration agreement, and project no. TKP2021-NKTA-32, financed under the TKP2021-NKTA funding scheme. Z.C. and B.S.-S. would like to thank Hiventures Zrt./State Fund for Research and Development and Innovation for their investment that contributed to this research. S.K.P. is thankful to the Department of Science and Technology (DST) of the Government of India for financial support under the Indo-Hungarian joint project (Grant No. DST/INT/HUN/P-25-2020).

Data Availability Statement

The data that support the findings of this study are available on reasonable request from the corresponding authors.

Conflicts of Interest

Z.C. performs his research at Corvinus University of Budapest, and founded the innovative startup company Power-to-Gas Hungary Kft. in order to conduct industrial R&D and further develop the technology in pre-commercial and commercial environments. B.S.-S. is CTO of Power-to-Gas Hungary Kft, responsible for its industrial R&D activities. The remaining authors declare that the research was conducted in the absence of any commercial or financial relationships that could be construed as a potential conflict of interest.

References

  1. Makri, E.; Koskinas, I.; Tsolakis, A.C.; Ioannidis, D.; Tzovaras, D. Short Term Net Imbalance Volume Forecasting through Machine and Deep Learning: A UK Case Study. In Proceedings of the Artificial Intelligence Applications and Innovations—AIAI 2021 IFIP WG 12.5 International Workshops, Hersonissos, Greece, 25–27 June 2021; Maglogiannis, I., Macintyre, J., Iliadis, L., Eds.; Springer International Publishing: Cham, Switzerland, 2021; pp. 377–389. [Google Scholar]
  2. Panda, S.; Mohanty, S.; Rout, P.K.; Sahu, B.K.; Parida, S.M.; Samanta, I.S.; Bajaj, M.; Piecha, M.; Blazek, V.; Prokop, L. A Comprehensive Review on Demand Side Management and Market Design for Renewable Energy Support and Integration. Energy Rep. 2023, 10, 2228–2250. [Google Scholar] [CrossRef]
  3. Weidner, S.; Faltenbacher, M.; François, I.; Thomas, D.; Skùlason, J.B.; Maggi, C. Feasibility Study of Large Scale Hydrogen Power-to-Gas Applications and Cost of the Systems Evolving with Scaling up in Germany, Belgium and Iceland. Int. J. Hydrogen Energy 2018, 43, 15625–15638. [Google Scholar] [CrossRef]
  4. Akrami, A.; Doostizadeh, M.; Aminifar, F. Power System Flexibility: An Overview of Emergence to Evolution. J. Mod. Power Syst. Clean Energy 2019, 7, 987–1007. [Google Scholar] [CrossRef]
  5. Binus, J. Planning for Change in the Electric Power Industry: A Primer for Transactive Energy Scenario Development. In Proceedings of the 2019 Portland International Conference on Management of Engineering and Technology (PICMET), Portland, OR, USA, 25–29 August 2019; pp. 1–9. [Google Scholar]
  6. Sinha, P.; Shankar, R.; Vrat, P.; Mathur, S. Power Distribution Reforms: Delhi’s Public–Private Partnership Model: A Boost to the Sector. J. Adv. Manag. Res. 2019, 17, 226–250. [Google Scholar] [CrossRef]
  7. Reitano, A.; Taylor, D.; Greig, K.; Sposato, C. Sustainability, Eco-Innovation and Technology—An Italian Perspective. Int. J. Technol. Mark. 2014, 9, 270–287. [Google Scholar] [CrossRef]
  8. Santecchia, A.; Kantor, I.; Castro-Amoedo, R.; Maréchal, F. Industrial Flexibility as Demand Side Response for Electrical Grid Stability. Front. Energy Res. 2022, 10, 831462. [Google Scholar] [CrossRef]
  9. Lund, P.D.; Lindgren, J.; Mikkola, J.; Salpakari, J. Review of Energy System Flexibility Measures to Enable High Levels of Variable Renewable Electricity. Renew. Sustain. Energy Rev. 2015, 45, 785–807. [Google Scholar] [CrossRef]
  10. De Kinderen, S.; Kaczmarek-Heß, M.; Ma, Q.; Razo-Zapata, I.S. Model-Based Valuation of Smart Grid Initiatives: Foundations, Open Issues, Requirements, and a Research Outlook. Data Knowl. Eng. 2022, 141, 102052. [Google Scholar] [CrossRef]
  11. Mukherji, A.; Thorne, P.; Cheung, W.W.L.; Connors, S.L.; Garschagen, M.; Geden, O.; Hayward, B.; Simpson, N.P.; Totin, E.; Blok, K.; et al. Synthesis Report of the IPCC Sixth Assessment Report (AR6); IPCC: Geneva, Switzerland, 2023. [Google Scholar]
  12. Enerdata. World Energy Consumption Statistics. Available online: https://yearbook.enerdata.net/total-energy/world-consumption-statistics.html (accessed on 4 December 2023).
  13. IEA. International Energy Agency CO2 Emissions in 2022—Analysis. Available online: https://www.iea.org/reports/co2-emissions-in-2022 (accessed on 19 October 2023).
  14. International Energy Agency. World Energy Outlook 2022; International Energy Agency: Paris, France, 2022. [Google Scholar]
  15. Sens, L.; Neuling, U.; Kaltschmitt, M. Capital Expenditure and Levelized Cost of Electricity of Photovoltaic Plants and Wind Turbines—Development by 2050. Renew. Energy 2022, 185, 525–537. [Google Scholar] [CrossRef]
  16. IRENA. Energy Transitions Outlook: 1.5C Pathway (Preview); IRENA: Masdar City, United Arab Emirates, 2021. [Google Scholar]
  17. Bertsch, J.; Growitsch, C.; Lorenczik, S.; Nagl, S. Flexibility in Europe’s Power Sector—An Additional Requirement or an Automatic Complement? Energy Econ. 2016, 53, 118–131. [Google Scholar] [CrossRef]
  18. Rodríguez, R.A.; Becker, S.; Andresen, G.B.; Heide, D.; Greiner, M. Transmission Needs across a Fully Renewable European Power System. Renew. Energy 2014, 63, 467–476. [Google Scholar] [CrossRef]
  19. Lundaev, V.; Solomon, A.A.; Le, T.; Lohrmann, A.; Breyer, C. Review of Critical Materials for the Energy Transition, an Analysis of Global Resources and Production Databases and the State of Material Circularity. Miner. Eng. 2023, 203, 108282. [Google Scholar] [CrossRef]
  20. Baigorri, J.; Zaversky, F.; Astrain, D. Massive Grid-Scale Energy Storage for next-Generation Concentrated Solar Power: A Review of the Potential Emerging Concepts. Renew. Sustain. Energy Rev. 2023, 185, 113633. [Google Scholar] [CrossRef]
  21. Hong, J.; Liang, F.; Yang, H. Research Progress, Trends and Prospects of Big Data Technology for New Energy Power and Energy Storage System. Energy Rev. 2023, 2, 100036. [Google Scholar] [CrossRef]
  22. Magyari, J.; Zavarkó, M.; Csedő, Z. Smart Knowledge Management Driving Green Transformation: A Comparative Case Study. Smart Energy 2022, 7, 100085. [Google Scholar] [CrossRef]
  23. International Energy Agency. Average Costs of Biogas Production Technologies per Unit of Energy Produced (Excluding Feedstock). 2018. Available online: https://www.iea.org/data-and-statistics/charts/average-costs-of-biogas-production-technologies-per-unit-of-energy-produced-excluding-feedstock-2018 (accessed on 28 October 2023).
  24. REKK. Modelling and Analysis of the Domestic Wholesale Electricity Market and Security of Supply up to 2030 under Different Power Plant Scenarios. Available online: https://rekk.hu/elemzes/268/a-hazai-nagykereskedelmi-villamosenergia-piac-modellezese-es-ellatasbiztonsagi-elemzese-2030-ig-kulonbozo-eromuvi-forgatokonyvek-mellett (accessed on 19 October 2023). (In Hungarian).
  25. Blanco, H.; Faaij, A. A Review at the Role of Storage in Energy Systems with a Focus on Power to Gas and Long-Term Storage. Renew. Sustain. Energy Rev. 2018, 81, 1049–1086. [Google Scholar] [CrossRef]
  26. Pintér, G. The Potential Role of Power-to-Gas Technology Connected to Photovoltaic Power Plants in the Visegrad Countries—A Case Study. Energies 2020, 13, 6408. [Google Scholar] [CrossRef]
  27. Hiesl, A.; Ajanovic, A.; Haas, R. On Current and Future Economics of Electricity Storage. Greenh. Gases Sci. Technol. 2020, 10, 1176–1192. [Google Scholar] [CrossRef]
  28. Shchegolkov, A.V.; Shchegolkov, A.V.; Zemtsova, N.V.; Stanishevskiy, Y.M.; Vetcher, A.A. Recent Advantages on Waste Management in Hydrogen Industry. Polymers 2022, 14, 4992. [Google Scholar] [CrossRef]
  29. Stenina, I.; Yaroslavtsev, A. Modern Technologies of Hydrogen Production. Processes 2023, 11, 56. [Google Scholar] [CrossRef]
  30. Statista. Global Power-to-Gas Market Size by Technology. Available online: https://www.statista.com/statistics/1286927/global-power-to-gas-market-size-by-technology/ (accessed on 19 October 2023).
  31. Sharshir, S.W.; Joseph, A.; Elsayad, M.M.; Tareemi, A.A.; Kandeal, A.W.; Elkadeem, M.R. A Review of Recent Advances in Alkaline Electrolyzer for Green Hydrogen Production: Performance Improvement and Applications. Int. J. Hydrogen Energy 2023, in press. [Google Scholar] [CrossRef]
  32. Baldinelli, A.; Barelli, L.; Bidini, G. Sustainable Water-Energy Innovations for Higher Comfort of Living in Remote and Rural Areas from Developing Countries: From Seawater to Hydrogen through Reversible Solid Oxide Cells. J. Clean. Prod. 2021, 321, 128846. [Google Scholar] [CrossRef]
  33. Zhou, L.; Zhang, F.; Wang, L.; Zhang, Q. Flexible Hydrogen Production Source for Fuel Cell Vehicle to Reduce Emission Pollution and Costs under the Multi-Objective Optimization Framework. J. Clean. Prod. 2022, 337, 130284. [Google Scholar] [CrossRef]
  34. Hashemi, S.M.H.; Modestino, M.A.; Psaltis, D. A Membrane-Less Electrolyzer for Hydrogen Production across the pH Scale. Energy Environ. Sci. 2015, 8, 2003–2009. [Google Scholar] [CrossRef]
  35. Chen, C.; Xia, Q.; Feng, S.; Liu, Q. A Novel Solar Hydrogen Production System Integrating High Temperature Electrolysis with Ammonia Based Thermochemical Energy Storage. Energy Convers. Manag. 2021, 237, 114143. [Google Scholar] [CrossRef]
  36. Mukherjee, U.; Maroufmashat, A.; Narayan, A.; Elkamel, A.; Fowler, M. A Stochastic Programming Approach for the Planning and Operation of a Power to Gas Energy Hub with Multiple Energy Recovery Pathways. Energies 2017, 10, 868. [Google Scholar] [CrossRef]
  37. Zeng, J.; Zhang, L.; Zhou, Q.; Liao, L.; Qi, Y.; Zhou, H.; Li, D.; Cai, F.; Wang, H.; Tang, D.; et al. Boosting Alkaline Hydrogen and Oxygen Evolution Kinetic Process of Tungsten Disulfide-Based Heterostructures by Multi-Site Engineering. Small 2022, 18, 2104624. [Google Scholar] [CrossRef] [PubMed]
  38. Zhang, X.; Zhang, L.; Zhu, Y.; Li, Z.; Wang, Y.; Wågberg, T.; Hu, G. Increasing Electrocatalytic Oxygen Evolution Efficiency through Cobalt-Induced Intrastructural Enhancement and Electronic Structure Modulation. ChemSusChem 2021, 14, 467–478. [Google Scholar] [CrossRef]
  39. Jiang, K.; Li, K.; Liu, Y.-Q.; Lin, S.; Wang, Z.; Wang, D.; Ye, Y. Nickel-Cobalt Nitride Nanoneedle Supported on Nickel Foam as an Efficient Electrocatalyst for Hydrogen Generation from Ammonia Electrolysis. Electrochim. Acta 2022, 403, 139700. [Google Scholar] [CrossRef]
  40. Yu, F.; Yu, L.; Mishra, I.K.; Yu, Y.; Ren, Z.F.; Zhou, H.Q. Recent Developments in Earth-Abundant and Non-Noble Electrocatalysts for Water Electrolysis. Mater. Today Phys. 2018, 7, 121–138. [Google Scholar] [CrossRef]
  41. Greene, D.L.; Ogden, J.M.; Lin, Z. Challenges in the Designing, Planning and Deployment of Hydrogen Refueling Infrastructure for Fuel Cell Electric Vehicles. eTransportation 2020, 6, 100086. [Google Scholar] [CrossRef]
  42. Chang, K.; Tran, D.T.; Wang, J.; Prabhakaran, S.; Kim, D.H.; Kim, N.H.; Lee, J.H. Atomic Heterointerface Engineering of Ni2P-NiSe2 Nanosheets Coupled ZnP-Based Arrays for High-Efficiency Solar-Assisted Water Splitting. Adv. Funct. Mater. 2022, 32, 2113224. [Google Scholar] [CrossRef]
  43. Rao, C.N.R.; Lingampalli, S.R. Generation of Hydrogen by Visible Light-Induced Water Splitting with the Use of Semiconductors and Dyes. Small 2016, 12, 16–23. [Google Scholar] [CrossRef] [PubMed]
  44. Herbes, C.; Roth, U.; Wulf, S.; Dahlin, J. Economic Assessment of Different Biogas Digestate Processing Technologies: A Scenario-Based Analysis. J. Clean. Prod. 2020, 255, 120282. [Google Scholar] [CrossRef]
  45. Statista. Natural Gas Commodity Prices in Europe and the United States from 1980 to 2022, with a Forecast for 2023 and 2024. Available online: https://www.statista.com/statistics/252791/natural-gas-prices/ (accessed on 27 October 2023).
  46. European Biogas Association. A Way out of the EU Gas Price Crisis with Biomethane. Available online: https://www.europeanbiogas.eu/a-way-out-of-the-eu-gas-price-crisis-with-biomethane/ (accessed on 21 October 2023).
  47. Birman, J.; Burdloff, J.; De Peufeilhoux, H.; Erbs, G.; Feniou, M.; Lucille, P.-L. Biomethane: Potential and Cost in 2050. Geographical Analysis of Biomethane Potential and Costs in Europe in 2050; ENGIE: La Défense, France, 2021. [Google Scholar]
  48. Pablo-Romero, M.d.P.; Sánchez-Braza, A.; Salvador-Ponce, J.; Sánchez-Labrador, N. An Overview of Feed-in Tariffs, Premiums and Tenders to Promote Electricity from Biogas in the EU-28. Renew. Sustain. Energy Rev. 2017, 73, 1366–1379. [Google Scholar] [CrossRef]
  49. Bassano, C.; Deiana, P.; Vilardi, G.; Verdone, N. Modeling and Economic Evaluation of Carbon Capture and Storage Technologies Integrated into Synthetic Natural Gas and Power-to-Gas Plants. Appl. Energy 2020, 263, 114590. [Google Scholar] [CrossRef]
  50. Gorre, J.; Ortloff, F.; van Leeuwen, C. Production Costs for Synthetic Methane in 2030 and 2050 of an Optimized Power-to-Gas Plant with Intermediate Hydrogen Storage. Appl. Energy 2019, 253, 113594. [Google Scholar] [CrossRef]
  51. Van Leeuwen, C.; Zauner, A. Report on the Costs Involved with PtG Technologies and Their Potentials across the EU; STORE&GO Project, D8.3.; European Research Institute for Gas and Energy Innovation: Bruxelles, Belgium, 2018. [Google Scholar]
  52. Statista. Daily European Union Emission Trading System (EU-ETS) Carbon Pricing from January 2022 to September 2023. Available online: https://www.statista.com/statistics/1322214/carbon-prices-european-union-emission-trading-scheme/ (accessed on 21 October 2023).
  53. Yuan, X.; Chen, L.; Sheng, X.; Liu, M.; Xu, Y.; Tang, Y.; Wang, Q.; Ma, Q.; Zuo, J. Life Cycle Cost of Electricity Production: A Comparative Study of Coal-Fired, Biomass, and Wind Power in China. Energies 2021, 14, 3463. [Google Scholar] [CrossRef]
  54. Csedő, Z.; Sinóros-Szabó, B.; Zavarkó, M. Seasonal Energy Storage Potential Assessment of WWTPs with Power-to-Methane Technology. Energies 2020, 13, 4973. [Google Scholar] [CrossRef]
  55. Statista. Average Monthly Electricity Wholesale Prices in Selected Countries in the European Union (EU) from January 2020 to September 2023. Available online: https://www.statista.com/statistics/1267500/eu-monthly-wholesale-electricity-price-country/ (accessed on 21 October 2023).
  56. Rakos, M.; Szenderak, J.; Erdey, L.; Komives, P.M.; Fenyves, V. Analysis of the Economic Situation of Energy Companies in Central and Eastern Europe. Int. J. Energy Econ. Policy 2022, 12, 553–562. [Google Scholar] [CrossRef]
  57. Härtel, P.; Korpås, M. Demystifying Market Clearing and Price Setting Effects in Low-Carbon Energy Systems. Energy Econ. 2021, 93, 105051. [Google Scholar] [CrossRef]
  58. Hagfors, L.I.; Kamperud, H.H.; Paraschiv, F.; Prokopczuk, M.; Sator, A.; Westgaard, S. Prediction of Extreme Price Occurrences in the German Day-Ahead Electricity Market. Quant. Financ. 2016, 16, 1929–1948. [Google Scholar] [CrossRef]
  59. van Leeuwen, C.; Mulder, M. Power-to-Gas in Electricity Markets Dominated by Renewables. Appl. Energy 2018, 232, 258–272. [Google Scholar] [CrossRef]
  60. Schneider, S. Power Spot Price Models with Negative Prices. J. Energy Mark. 2012, 4, 77–102. [Google Scholar] [CrossRef]
  61. Liu, W.; Wen, F.; Xue, Y. Power-to-Gas Technology in Energy Systems: Current Status and Prospects of Potential Operation Strategies. J. Mod. Power Syst. Clean Energy 2017, 5, 439–450. [Google Scholar] [CrossRef]
  62. Ghafoori, M.S.; Loubar, K.; Marin-Gallego, M.; Tazerout, M. Techno-Economic and Sensitivity Analysis of Biomethane Production via Landfill Biogas Upgrading and Power-to-Gas Technology. Energy 2022, 239, 122086. [Google Scholar] [CrossRef]
  63. Yusuf, N.; Almomani, F. Recent Advances in Biogas Purifying Technologies: Process Design and Economic Considerations. Energy 2023, 265, 126163. [Google Scholar] [CrossRef]
  64. Götz, M.; Lefebvre, J.; Mörs, F.; McDaniel Koch, A.; Graf, F.; Bajohr, S.; Reimert, R.; Kolb, T. Renewable Power-to-Gas: A Technological and Economic Review. Renew. Energy 2016, 85, 1371–1390. [Google Scholar] [CrossRef]
  65. Fambri, G.; Diaz-Londono, C.; Mazza, A.; Badami, M.; Sihvonen, T.; Weiss, R. Techno-Economic Analysis of Power-to-Gas Plants in a Gas and Electricity Distribution Network System with High Renewable Energy Penetration. Appl. Energy 2022, 312, 118743. [Google Scholar] [CrossRef]
  66. Quarton, C.J.; Samsatli, S. Power-to-Gas for Injection into the Gas Grid: What Can We Learn from Real-Life Projects, Economic Assessments and Systems Modelling? Renew. Sustain. Energy Rev. 2018, 98, 302–316. [Google Scholar] [CrossRef]
  67. Marchese, M.; Buffo, G.; Santarelli, M.; Lanzini, A. CO2 from Direct Air Capture as Carbon Feedstock for Fischer-Tropsch Chemicals and Fuels: Energy and Economic Analysis. J. CO2 Util. 2021, 46, 101487. [Google Scholar] [CrossRef]
  68. Lo Basso, G.; Pastore, L.M.; Mojtahed, A.; de Santoli, L. From Landfill to Hydrogen: Techno-Economic Analysis of Hybridized Hydrogen Production Systems Integrating Biogas Reforming and Power-to-Gas Technologies. Int. J. Hydrogen Energy 2023, 48, 37607–37624. [Google Scholar] [CrossRef]
  69. Csedő, Z.; Zavarkó, M. The Role of Inter-Organizational Innovation Networks as Change Drivers in Commercialization of Disruptive Technologies: The Case of Power-to-Gas. Int. J. Sustain. Energy Plan. Manag. 2020, 28, 53–70. [Google Scholar] [CrossRef]
  70. Sinóros-Szabó, B.; Zavarkó, M.; Popp, F.; Grima, P.; Csedő, Z. Biomethane Production Monitoring and Data Analysis Based on the Practical Operation Experiences of an Innovative Power-to-Gas Benchscale Prototype. Acta Agrar. Debreceniensis 2018, 150, 399–410. [Google Scholar] [CrossRef] [PubMed]
  71. Baena-Moreno, F.M.; Sebastia-Saez, D.; Wang, Q.; Reina, T.R. Is the Production of Biofuels and Bio-Chemicals Always Profitable? Co-Production of Biomethane and Urea from Biogas as Case Study. Energy Convers. Manag. 2020, 220, 113058. [Google Scholar] [CrossRef]
  72. Pörzse, G.; Csedő, Z.; Zavarkó, M. Disruption Potential Assessment of the Power-to-Methane Technology. Energies 2021, 14, 2297. [Google Scholar] [CrossRef]
  73. TÜVSÜD. Power-to-Gas Plants in First Commercial Applications. Available online: https://www.tuvsud.com/en/press-and-media/2019/march/power-to-gas-plants-in-first-commercial-applications (accessed on 4 December 2023).
  74. Winston, W.L.; Goldberg, J.B. Operations Research: Applications and Algorithms, 4th ed.; Thomson/Brooks/Cole: Belmont, CA, USA, 2004; ISBN 978-0-534-38058-8. [Google Scholar]
  75. Winston, W.L. Financial Modells Using Simulation Simulation and Optimization; Palisade Corporation: Newfield, NY, USA, 2006. [Google Scholar]
  76. Russel, R.S.; Taylor, B.W. Operations Management, Focusing on Quality and Competitiveness; Prentice Hall: Hoboken, NJ, USA, 1998. [Google Scholar]
  77. Vose, D. Risk Analysis; John Wiley & Sons Ltd.: New York, NY, USA, 2006. [Google Scholar]
  78. Evans, M.; Hastings, N.; Peacock, B. Triangular Distribution. In Statistical Distributions, 3rd ed.; John Wiley & Sons Ltd.: New York, NY, USA, 2000. [Google Scholar]
  79. Moksony, F. Insights and Data. Empirical Verification of Social Science Theories; Aula: Budapest, Hungary, 2006. (In Hungarian) [Google Scholar]
  80. Böhm, H.; Zauner, A.; Goers, S.; Tichler, R.; Kroon, P. Report on Experience Curves and Economies of Scale; STORE&GO Project, D7.5; European Research Institute for Gas and Energy Innovation: Bruxelles, Belgium, 2018. [Google Scholar]
  81. Al-Breiki, M.; Bicer, Y. Techno-Economic Evaluation of a Power-to-Methane Plant: Levelized Cost of Methane, Financial Performance Metrics, and Sensitivity Analysis. Chem. Eng. J. 2023, 471, 144725. [Google Scholar] [CrossRef]
  82. EUROSTAT. Electricity Prices for Non-Household Consumers—Bi-Annual Data (from 2007 Onwards). Available online: https://ec.europa.eu/eurostat/databrowser/view/NRG_PC_205__custom_7690945/default/line?lang=en (accessed on 24 October 2023).
  83. Zauner, A.; Böhm, H.; Rosenfeld, D.C.; Tichler, R. Analysis on Future Technology Options and on Techno-Economic Optimization. Innovative Large-Scale Energy Storage Technologies and Power-to-Gas Concepts after Optimization; STORE&GO Project, D7.7; European Research Institute for Gas and Energy Innovation: Bruxelles, Belgium, 2019. [Google Scholar]
  84. Water Prices Compared in 36 EU-Cities. Water News Europe, 19 March 2021.
  85. GRTgaz. Biomethane. Available online: https://www.grtgaz.com/en/medias/news/biomethane-price-increases (accessed on 24 October 2023).
  86. Padi, R.K.; Douglas, S.; Murphy, F. Techno-Economic Potentials of Integrating Decentralised Biomethane Production Systems into Existing Natural Gas Grids. Energy 2023, 283, 128542. [Google Scholar] [CrossRef]
  87. Intratec. Oxygen Prices—Current and Forecast. Available online: https://www.intratec.us/chemical-markets/oxygen-price (accessed on 24 October 2023).
  88. Hargrave, M. Weighted Average Cost of Capital (WACC) Explained with Formula and Example. Available online: https://www.investopedia.com/terms/w/wacc.asp (accessed on 25 October 2023).
  89. Damodaran, A. Total Beta (Beta for Completely Undiversified Investor). Available online: https://pages.stern.nyu.edu/~adamodar/New_Home_Page/data.html (accessed on 25 October 2023).
  90. Damodaran, A. Equity Risk Premiums (ERP): Determinants, Estimation and Implications—The 2023 Edition 2023; Elsevier: Amsterdam, The Netherlands, 2023. [Google Scholar]
  91. Damodaran, A. Country Risk: Determinants, Measures and Implications—The 2023 Edition 2023; Elsevier: Amsterdam, The Netherlands, 2023. [Google Scholar]
Figure 1. Power-to-gas market size worldwide with a forecast for 2026, divided by technology (in millions of USD). Sourced from [30].
Energies 16 08009 g001
Figure 2. Natural gas commodity prices in Europe and USA (1980–2024) with a forecast for 2023 and 2024 (in USD per million British thermal units). Legend: blue line = European data; orange line = US data. Sourced from [45].
Energies 16 08009 g002
Figure 3. Percentage of CAPEX, OPEX, water, CO2 price and electricity in the unit cost of biomethane. Sourced from [50].
Energies 16 08009 g003
Figure 4. Prime cost of biomethane production as a function of operating hours (capacity utilization). Sourced from [51].
Energies 16 08009 g004
Figure 5. Evolution of the CO2 trading price. Sourced from [52].
Energies 16 08009 g005
Figure 6. Average monthly electricity wholesale prices in selected countries in the European Union (EU) from January 2020 to September 2023 (in EUR per megawatt-hour). Sourced from [55].
Energies 16 08009 g006
Figure 7. Simplified block diagram of the 1 MWel bio-P2M system. Source: own construction based on [54,72].
Energies 16 08009 g007
Figure 8. Mean change in outputs across range of input values regarding NPV (expressed in thousands of EUR). Source: own calculations (2023).
Energies 16 08009 g008
Figure 9. Correlation coefficients (Spearman rank) of the analyzed input and output data on the NPV. Source: own calculations (2023).
Energies 16 08009 g009
Figure 10. Regression coefficients of the analyzed input and output data and the NPV. Source: own calculations (2023).
Energies 16 08009 g010
Figure 11. The summary of the Monte Carlo simulations regarding the value of NPV. Source: own calculations (2023).
Energies 16 08009 g011
Figure 12. The role of capacity utilization in unit cost and cost structure of biomethane. Source: own calculations (2023).
Energies 16 08009 g012
Figure 13. Mean change in outputs across range of input values regarding unit cost (EUR/Nm3). Source: own calculations (2023).
Energies 16 08009 g013
Figure 14. Correlation coefficients (Spearman rank) of the analyzed input and output data on the unit cost. Source: own calculations (2023).
Energies 16 08009 g014
Figure 15. Regression coefficients of the analyzed input and output data on the unit cost. Source: own calculations (2023).
Energies 16 08009 g015
Figure 16. The summary of the Monte Carlo simulations regarding the value of unit cost. Source: own calculations (2023).
Energies 16 08009 g016
Table 1. Intervals and distribution types of indicators and market factors used in the simulation.
IndicatorsIntervals Used in the SimulationType of Distribution
Investment analysis
Share of own capital in investment cost (%)10–30–50–100Discrete uniform distribution
Electricity price (EUR/MWh)0–80–160Triangle distribution
Water price (EUR/m3)0–3Discrete uniform distribution
Carbon dioxide price (EUR/t CO2)0–50Discrete uniform distribution
Biomethane price (EUR/MWh)50–100–150Triangle distribution
Waste heat price (EUR/MWh)0–55Discrete uniform distribution
Oxygen (EUR/Nm3)0–0.15Discrete uniform distribution
Operating hours (hours per year)2000–4000–6000–8000Discrete uniform distribution
Used or sold waste heat (%)0–50–100Triangle distribution
Oxygen used or sold (%)0–50–100Triangle distribution
Unit cost of biomethane
Operating hours (hours per year)2000–4000–6000–8000Discrete uniform distribution
Carbon dioxide price (EUR/t CO2)0–50Discrete uniform distribution
Electricity price (EUR/MWh)0–80–160Triangle distribution
Water price (EUR/m3)0–3Discrete uniform distribution
Table 2. The base case for CAPEX calculation of the examined system.
CategoryItemThousand
EUR
MeasureSource
Components, physical infrastructureElectrolyzer system1.1/kWe[50,51,54,65,68,80]
Methanation system (biological)0.6/kWe
Infrastructure, installation, storage for gas puffer (H2 and CO2) and injection1.1/kWe
OtherProject development, planning, expert services and quality management28%on costs of total components
Tender-specific R&D, software and maintenance tasks50%
Total investment cost (CAPEX) of the 1 MWel system (thousand EUR):4984.0
Share of own capital in investment cost10%–30%–50%–100%
Legend: underlined data = values used in the base case.
Table 3. The base case for operative expenses and revenues of the examined system.
CategoryItemValueMeasureSource
Operation and maintenance costsElectrolysis system4.0%% of CAPEX[50,51,54,81]
Methanation system5.0%
Infrastructure, installation, storage for gas puffer (H2 and CO2) and injection3.5%
Input materials and unit pricesElectricity price0–40–80–120–160EUR/MWh[82,83]
Water0–3EUR/m3[84]
CO20–50EUR/t[83]
Outputs, revenuesBiomethane50–100–150EUR/MWh[54,85,86]
Waste heat0–55EUR/MWh[54,83,87]
Oxygen0–0.15/Nm3
Operation dataOperating hours2000–4000–6000–8000hChangeable cells
Sold or injected biomethane100%/total produced
Used or sold waste heat0%–50%–100%/total produced
Used or sold oxygen0%–50%–100%/total produced
Legend: underlined data = values used in the base case.
Table 4. Details of the investment analysis.
PLANNING OF EXPENDITURES AND REVENUES
(Unit of Measurement: Thousand EUR):
Years
0 (Year of
Implementation)
151015
1. INVESTMENT COST (CAPEX)−4984
2. ANNUAL EXPENDITURES (OPEX)
Operation and maintenance costsElectrolysis system -112112112112
Methanation system -140140140140
Infrastructure, installation, storage for gas puffer (H2 and CO2) and injection -98989898
Input materials and unit pricesElectricity price-640640640640
Water -----
CO2-----
ANNUAL EXPENDITURES (OPEX) IN TOTAL: 990990990990
Annual increase in prices of inputs and services, multiplier 1.0001.0301.1591.3441.558
OVERALL (CAPEX + OPEX) with price increases:−49842010213823202532
3. ANNUAL REVENUES
Outputs, revenuesBiomethane -1000100010001000
Waste heat -75757575
Oxygen -60606060
ANNUAL REVENUES IN TOTAL: 1135113511351135
Annual increase in prices of outputs and revenues, multiplier 1.0001.0301.1591.3441.558
OVERALL REVENUES with price increases: 2304245026602903
CASH FLOW−4984294313339370
Discount factor1.0001.0781.4582.1273.102
NET PRESENT VALUE (NPV):−4984−4711−3771−2871−2198
Source: authors’ own construction.
Disclaimer/Publisher’s Note: The statements, opinions and data contained in all publications are solely those of the individual author(s) and contributor(s) and not of MDPI and/or the editor(s). MDPI and/or the editor(s) disclaim responsibility for any injury to people or property resulting from any ideas, methods, instructions or products referred to in the content.

