Article

Lithium Battery State-of-Health Estimation Based on Sample Data Generation and Temporal Convolutional Neural Network

1
School of Mechatronic Engineering and Automation, Foshan University, Foshan 528200, China
2
Yangtze Delta Region Institute, University of Electronic Science and Technology of China, Huzhou 313098, China
*
Author to whom correspondence should be addressed.
Energies 2023, 16(24), 8010; https://doi.org/10.3390/en16248010
Submission received: 30 October 2023 / Revised: 23 November 2023 / Accepted: 9 December 2023 / Published: 11 December 2023
(This article belongs to the Section D2: Electrochem: Batteries, Fuel Cells, Capacitors)

Abstract

:
Accurate estimation of battery health is an effective means of improving the safety and reliability of electrical equipment. However, developing data-driven models to estimate battery state of health (SOH) is challenging when the amount of data is restricted. In this regard, this study proposes a method for estimating the SOH of lithium batteries based on sample data generation and a temporal convolutional neural network. First, we analyzed the charge/discharge curves of the batteries, from which we extracted features that were highly correlated with the SOH decay. Then, we used a Variational Auto-Encoder (VAE) to learn the features and distributions of the sample data to generate highly similar data and enrich the number of samples. Finally, a temporal convolutional neural network (TCN) was built to mine the nonlinear relationship between features and SOH by combining the source and extended domain data to realize SOH estimation. The experimental results show that the proposed method in this study has less than 2% error in SOH estimation, which improves the accuracy by 64.9% based on its baseline model. The feasibility of using data-driven models for battery health management in data-constrained application scenarios is demonstrated.

1. Introduction

Lithium-ion batteries (LIBs) are widely used in electric vehicles and energy storage systems because of their high energy density, long cycle life, and low environmental pollution [1,2]. However, under long-term cyclic operation, lithium-ion batteries’ state of health (SOH) will decline to a certain extent, mainly manifested as capacity decay, internal resistance increase, and power decrease [3]. The SOH decline is a slow, irreversible, and nonlinear change process due to charge/discharge multiplicity, charge/discharge depth, charge/discharge frequency, and chemical properties [4]. As the SOH of a battery declines, the likelihood of its failure during operation and the risk of thermal runaway gradually increases. Therefore, accurate SOH estimation provides real-time battery health information and early warning of potential risks, ensuring long-term stable operation of the battery system [5].
SOH indicates the health level of a battery’s current performance compared to its initial performance and cannot be directly measured by a sensor. SOH decay is closely related to the historical operating conditions of the battery, where external factors such as charge/discharge multipliers, operating temperatures, and the environment influence the aging process and ultimately lead to different aging paths for the battery. In addition, small internal defects in the manufacturing process of batteries can lead to deviations in their aging behavior, which poses a challenge for SOH monitoring and assessment [6]. In order to realize the effective prediction of battery capacity degradation trajectory, many scholars have proposed different methods from the internal mechanism and external conditions of the battery, and these methods can usually be classified into three categories: the experimental method, the physical modeling method, and the data-driven method [7,8]. The experimental method provides clear and intuitive data based on real-world tests, and its results are highly reliable and especially suitable for battery performance verification under specific conditions. However, the disadvantages of this method are that it is time-consuming, has a high resource overhead, and requires re-experimentation for different battery types or operating conditions, which limits its adaptability [9]. The physical modeling approach is based on the specific physical and chemical processes of the battery; it has a well-defined mechanism, provides accurate predictions for known conditions, and is highly scalable. However, it is a relatively complex modeling process that requires an in-depth understanding of the internal processes of the battery and may involve complex numerical solutions. Second, the physical model is very sensitive to initial conditions and environmental changes, making it necessary to adjust the model in different application scenarios repeatedly. In addition, as battery technology advances, the complexity of the internal mechanisms increases, making the physical model increasingly complex and difficult to respond quickly to the needs of real world applications [10,11]. In contrast, the data-driven approach shows clear advantages. It can learn directly from a large amount of data and is not bound by a specific physical mechanism, thus providing better adaptability and scalability. The data-driven method does not rely on complicated experimental processes. As long as there are enough data, accurate predictions can be made, greatly reducing the complexity of model building. Moreover, with the continuous enhancement of big data and computing power, the data-driven method’s prediction accuracy and application scope are expected to be further improved, making it the preferred method for predicting battery capacity decay trajectories [12,13,14]. Table 1 demonstrates the research results related to SOH estimation using data-driven methods in the last two years. However, data-driven approaches usually require a large amount of data for battery modeling or algorithm initialization. However, in practice, it is often impossible to obtain sufficient historical battery operating data due to the cost of data acquisition and storage [15]. Therefore, it is challenging to build data-driven models to achieve accurate SOH prediction with small amounts of data [16].
In order to solve the data-driven problem of strong data dependence, many scholars use intelligent optimization algorithms to optimize the model’s structure and parameters further to improve the SOH estimation accuracy with the existing data. Li et al. [16] establish a support vector regression (SVR) model to estimate the SOH based on the battery charge/discharge data and propose an improved ant lion algorithm to optimize the model parameters of the SVR to improve the model prediction accuracy further. Chang et al. [17] extracted features highly correlated with SOH attenuation from incremental capacity curves and optimized a wavelet neural network using a genetic algorithm to improve SOH estimation accuracy based on the wavelet neural network. However, although these methods mine the information in limited data by optimizing the model, they do not fundamentally solve the problem of the limited amount of data, so the amount of data still constrains the model’s performance. In this regard, many scholars have proposed a transfer learning approach to solve the problem of model development in the case of a small amount of data through model migration techniques. Deng et al. [18] categorized the battery degradation patterns, chose a reference degraded battery for each class, and trained its SOH estimation model. Finally, the trained model was applied to other batteries by pre-training and fine-tuning, which realized the development of the SOH estimation model even using only a small amount of data from other batteries. Wu et al. [19] trained a support vector regression (SVR) model using iterative migration on 30 source-domain datasets. This method uses only a small amount of target-domain data in combination with source-domain data to realize SOH prediction over the whole life cycle of a battery. However, the above transfer learning methods assume that the training and test data follow the same distribution, and the migration effect of two widely different datasets is often unsatisfactory. Therefore, in practice, models developed based on datasets from one working condition may not be applicable for migration to another working condition due to distributional differences.
Table 1. SOH estimation methodologies published in 2022–2023.
MethodsAuthors, YearNoveltyResult
WOA-ElmanZhang et al. [20], 2023Health features are extracted based on surface temperature, incremental capacity, and differential voltage; SOH estimation using Elman neural network; optimization of Elman neural network parameters using the whale optimization algorithm (WOA).Root mean square error less than 2%
CAE-BiLSTMZhu et al. [21], 2023Health features were extracted directly from the raw data with a convolutional auto-encoder (CAE); SOH estimation was performed using a bidirectional LSTM (BiLSTM) neural network.Mean absolute error less than 2%
VMD-DBO-SVRWu et al. [22], 2023The SOH sequence is decomposed into a series of modal component subsequences by variational modal decomposition (VMD); the subsequences are predicted and reconstructed by support vector regression (SVR); the SVR model parameters are optimized using the dung beetle optimization algorithm (DBO).Average absolute percentage error less than 2%
ECM-TransformerLuo et al. [23], 2023Fitting electrochemical impedance spectra using equivalent circuits model (ECM); health features are extracted from the equivalent circuit parameters, and SOH estimation is performed using a transformer neural network.Mean absolute percentage error less than 1.63%
ECM-ACO-EBMLin et al. [24], 2023Identify the internal resistance during constant-current charging using an equivalent circuit model; the SOH estimation model is built using the explanation boosting machine (EBM); optimization of EBM model parameters using ant colony optimization (ACO) algorithm.Average absolute error less than 1%
EIS-GPRZhou et al. [25], 2022Geometrical properties of the electrochemical impedance spectrum (EIS) are found for the high and medium frequency cases; health features were extracted from the high-frequency and mid-frequency impedance spectra; the SOH estimation model was constructed using Gaussian process regression (GPR).Root mean square error less than 1.12%
AR-RVMFeng et al. [26], 2022A framework for battery SOH prediction was developed based on autoregressive (AR) model; an error compensation mechanism based on isobaric discharge time is constructed using a relevance vector machine (RVM).Root mean square error less than 1%
EM-GWO-IRBFNNWu et al. [27], 2022An empirical model (EM) is proposed to describe the general trend of SOH decay; capacity regeneration of the battery is simulated using an improved radial basis function neural network (IRBFNN) as compensation for the empirical model; optimization of model parameters for IRBFNN using the gray wolf algorithm.Root mean square error less than 1%
To address the above issues, this study proposes a sample data generation and data-driven SOH estimation method for lithium batteries, which realizes the model development in the case of only a small number of samples. First, we analyzed the charge/discharge curves of the battery, from which we extracted features highly correlated with the SOH decay. Next, we use generative self-coding networks to learn the features and distributions of the sample data, thus generating highly similar data and enriching the number of samples. Finally, a temporal convolutional neural network is built to mine the nonlinear relationship between features and SOH by combining the source and extended domain data, thus realizing SOH estimation. The contributions of this study are mainly three points:
(1)
Historical battery operating data were analyzed, from which features related to SOH decay were extracted;
(2)
A Variational Auto-Encoder (VAE) was built to generate data that are highly similar to the samples, which enriches the number of samples and solves the difficulty of model development in the case of a small number of samples;
(3)
A temporal convolutional neural network was built to capture the decaying trajectory of SOH accurately.
The rest of the paper is organized as follows: Section 2 describes the dataset used in this study. Section 3 describes the SOH estimation process by this study’s proposed method. Section 4 validates the effectiveness of the proposed method for SOH estimation. Section 5 summarizes the work of this study.

2. Introduction to the Dataset

2.1. SOH Definition

State of health (SOH) is a key parameter of the battery management system that reflects the current life status of the battery [28]. SOH is defined as shown in Equation (1) [29]:
S O H = Q i Q 0 × 100 %
where Q 0 is the battery’s rated capacity, and Q i is the battery’s current capacity.

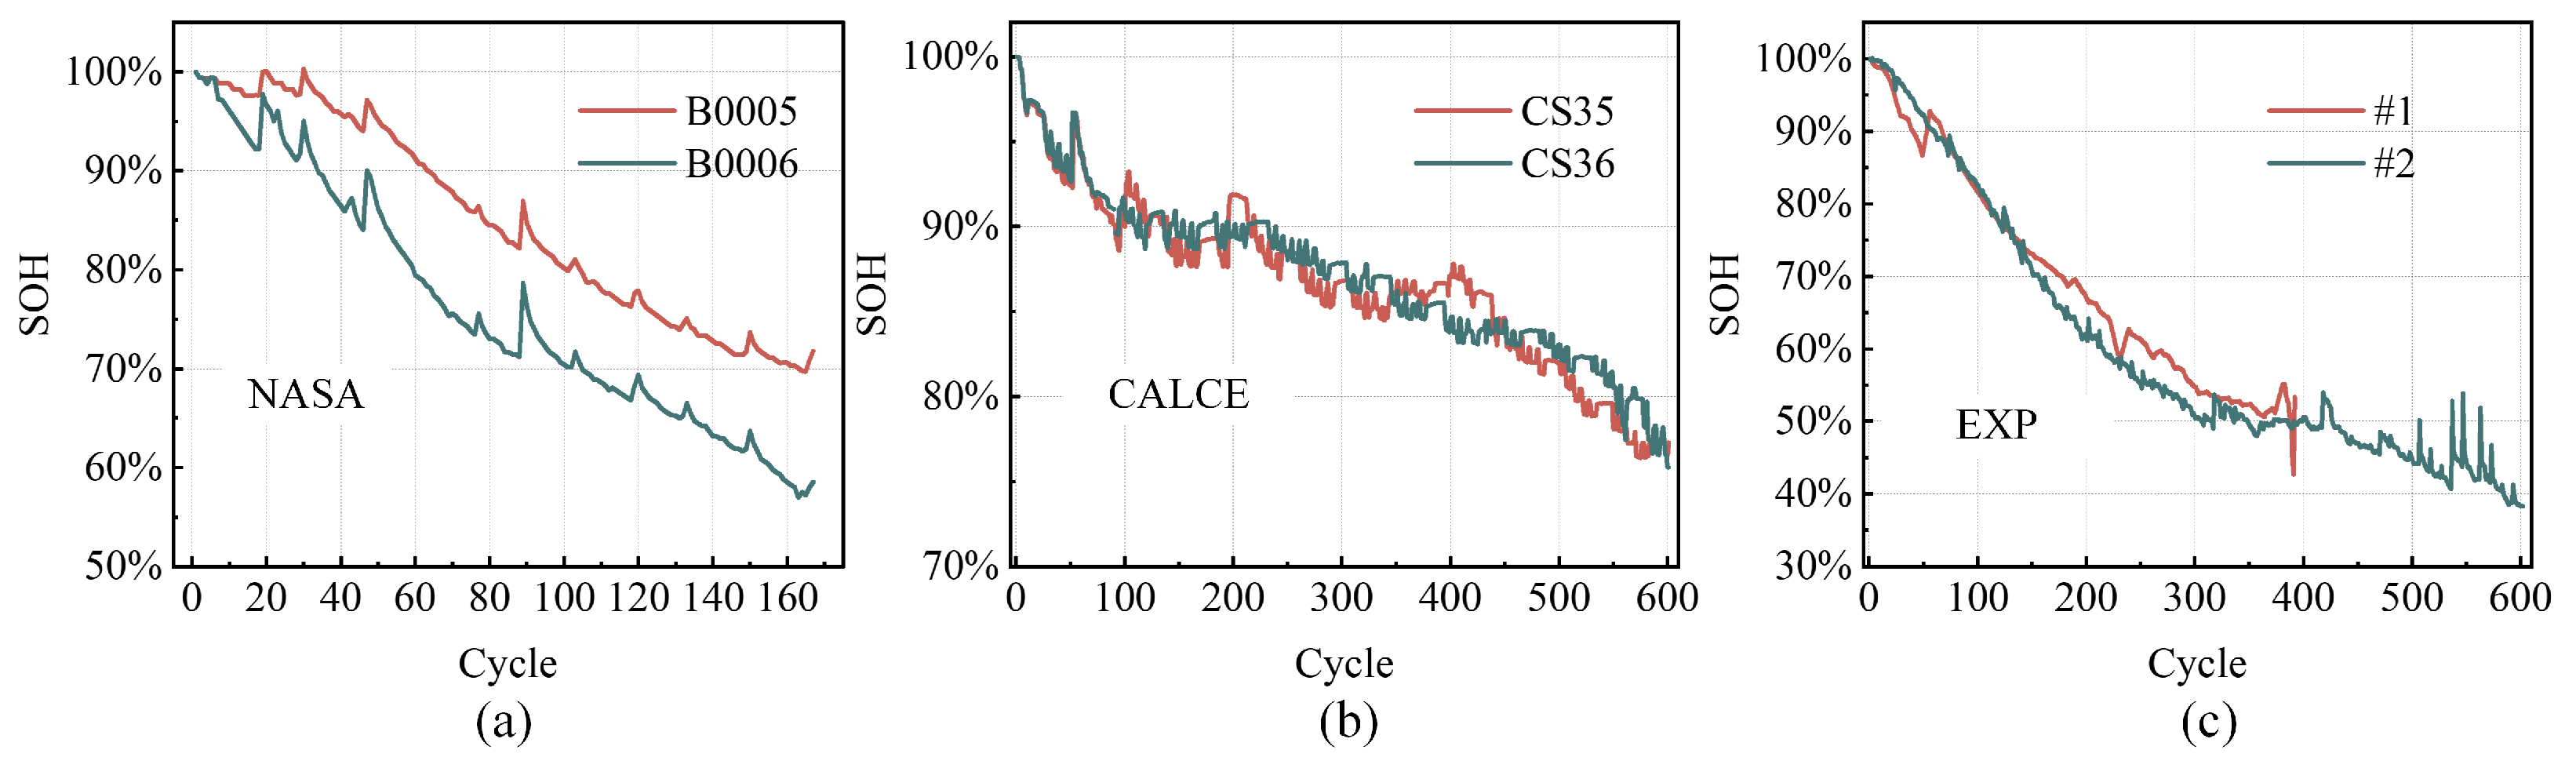
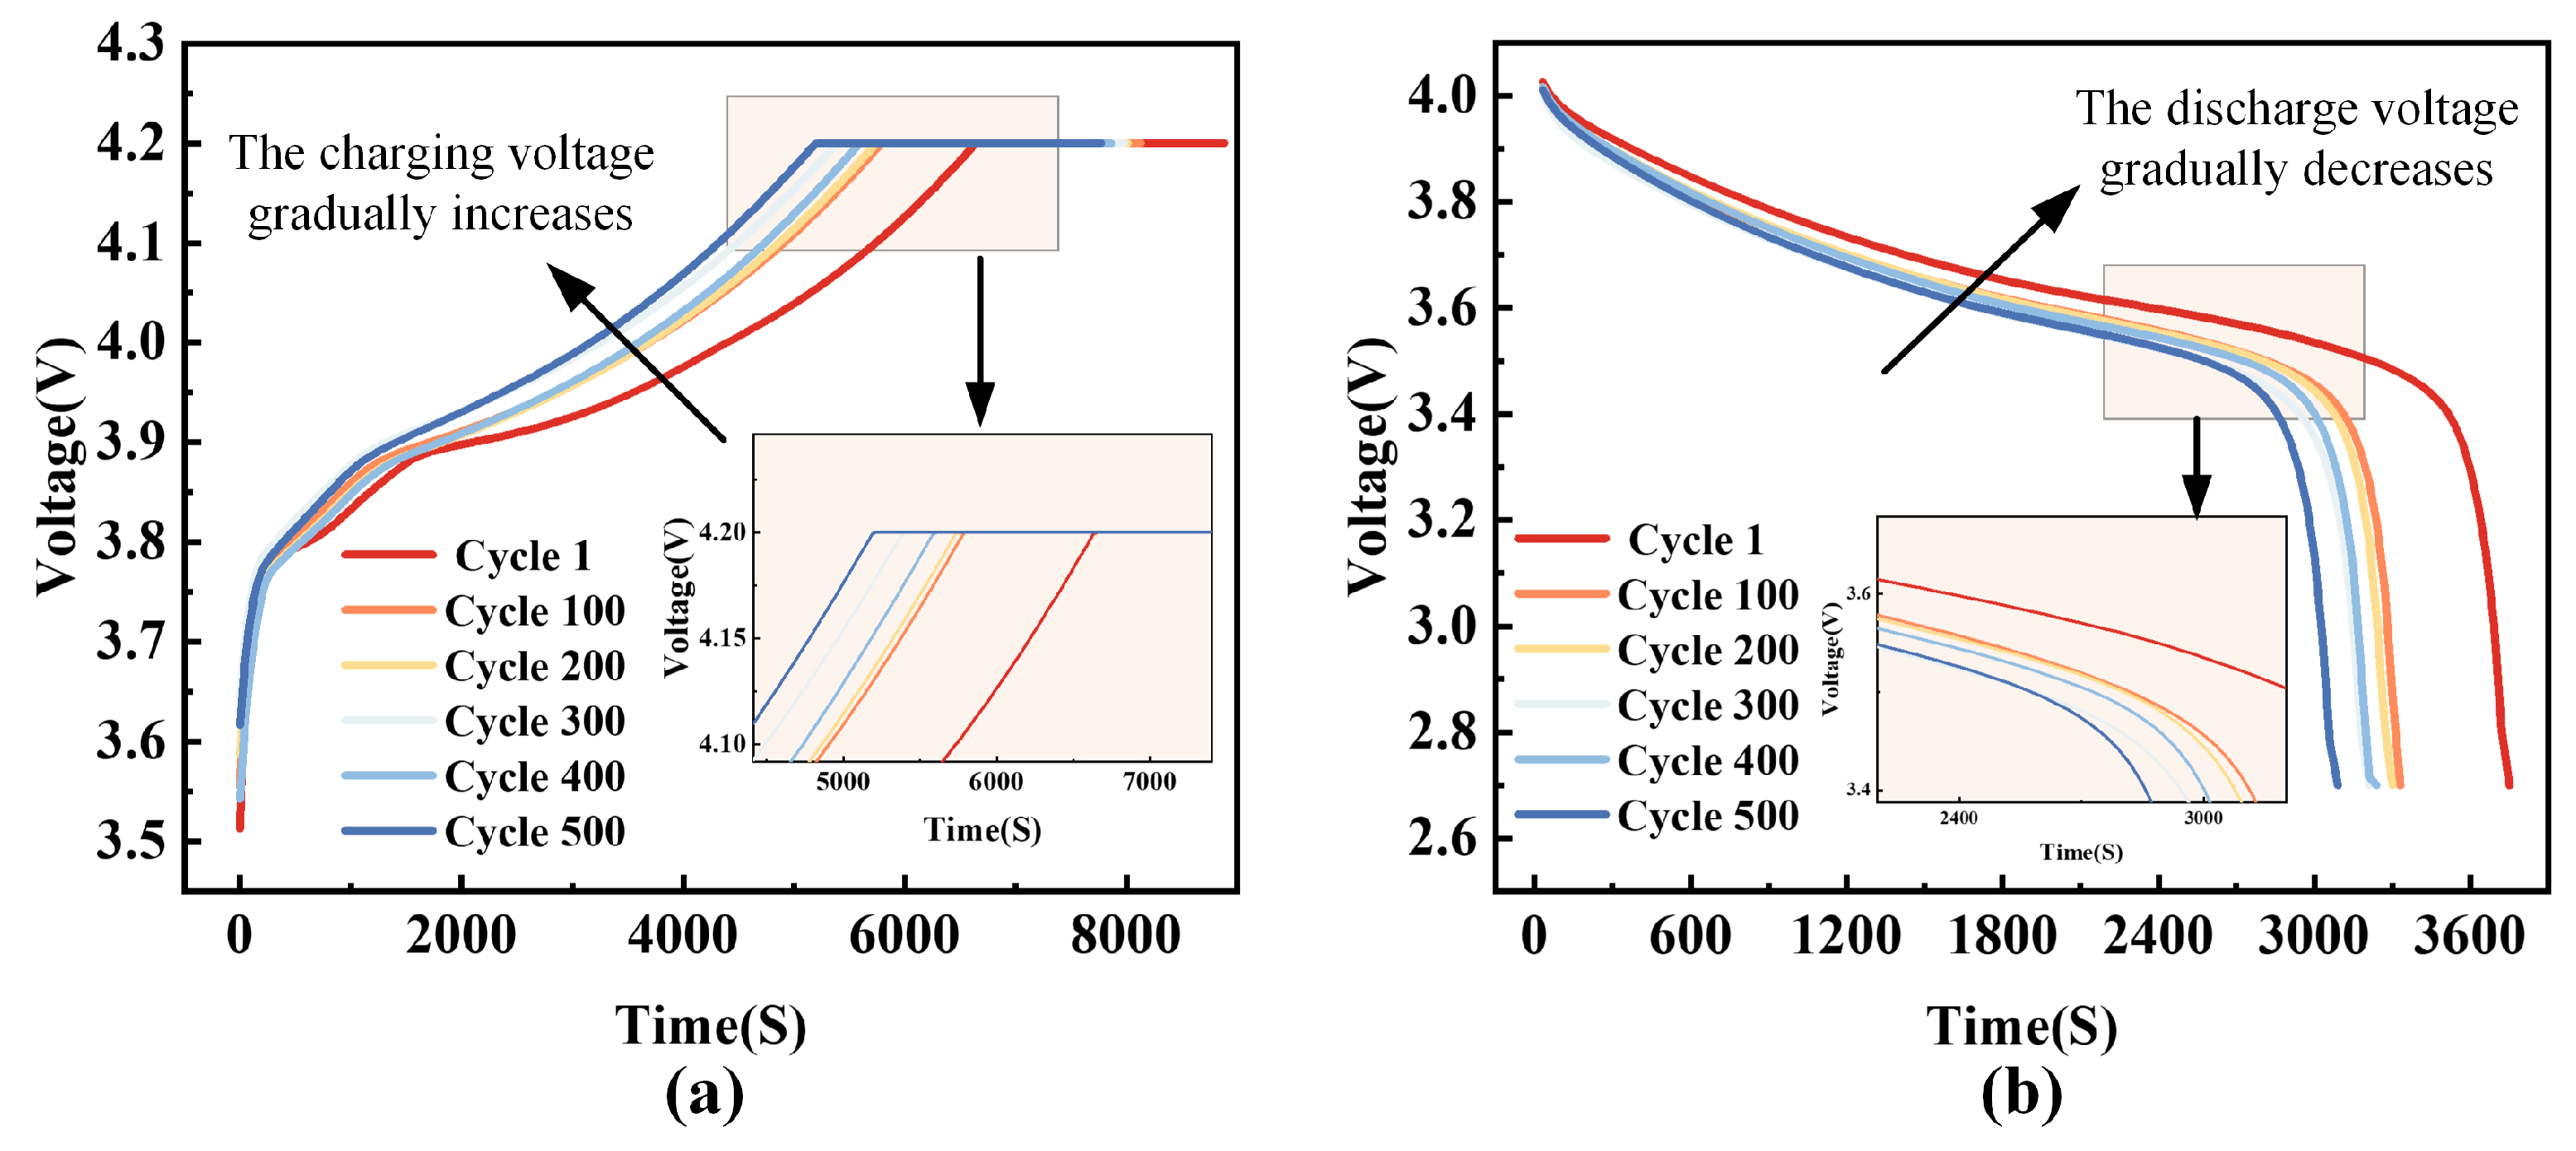
2.2. Battery Dataset

The public datasets from NASA [30] and the Center for Advanced Life Cycle Engineering (CALCE) [31] were selected for this study. In addition, this study also built an experimental platform for battery charge/discharge testing and constructed a battery test dataset.
For the CALCE dataset, the batteries taken in this study are numbered CS2-35 and CS2-36, which have a nominal capacity of 1.1 Ah and are tested for charging and discharging at 24 °C ambient temperature. Both batteries were charged with constant current-constant voltage (CC-CV), first charging at a charge multiplication rate of 0.5 C until the battery voltage reaches a cutoff voltage of 4.2 V and then charging at a constant voltage of 4.2 V until the current drops to 40 mA. Discharging was performed at a discharge multiplication rate of 1 C until the voltage dropped to 2.7 V.
For the NASA dataset, batteries numbered B0005 and B0006 were used in this study, with a nominal capacity of 2 Ah at an ambient temperature of 24 °C. Both batteries were charged in 1.5 A cross-current mode to a voltage of 4.2 V, followed by charging at a constant voltage until the current dropped to 20 mA and discharging at a constant current of 2 A until the voltage of the batteries dropped to 2.7 V and 2.5 V, respectively.
In this study, two commercial 18650 batteries (INR18650-33G) with a nominal capacity of 3.15 Ah and a rated voltage of 3.6 V were also used for the charge/discharge test, and the experimental platform is shown in Figure 1. The experimental platform consists of a power battery hardware-in-the-loop test system (chroma 17020), a thermostatic chamber (JINGHONG), and a data acquisition instrument (keysight 34972A). Both batteries were charged at 1 C to a cutoff voltage of 4.2 V, then charged at a constant voltage of 4.2 V until the current dropped to 0.15 A, and finally discharged at 1 C to a cutoff voltage of 2.5 V.
The variation curves of battery capacity with the number of cycles for the three datasets are shown in Figure 2. All capacities are expressed by converting to SOH via Equation (1). The SOH for all three datasets shows a nonlinear decrease, accompanied by the phenomenon of capacity regeneration. Among them, the NASA dataset has the most pronounced capacity regeneration, and its capacity regeneration has a larger amplitude, while the CALCE dataset exhibits capacity fluctuations within a small range. The test data from the experimental platform of this study had less SOH volatility overall but decayed faster. The above observations reveal the variability in battery degradation and capacity regeneration behavior across different datasets, providing a comprehensive and diverse testing scenario for this study.

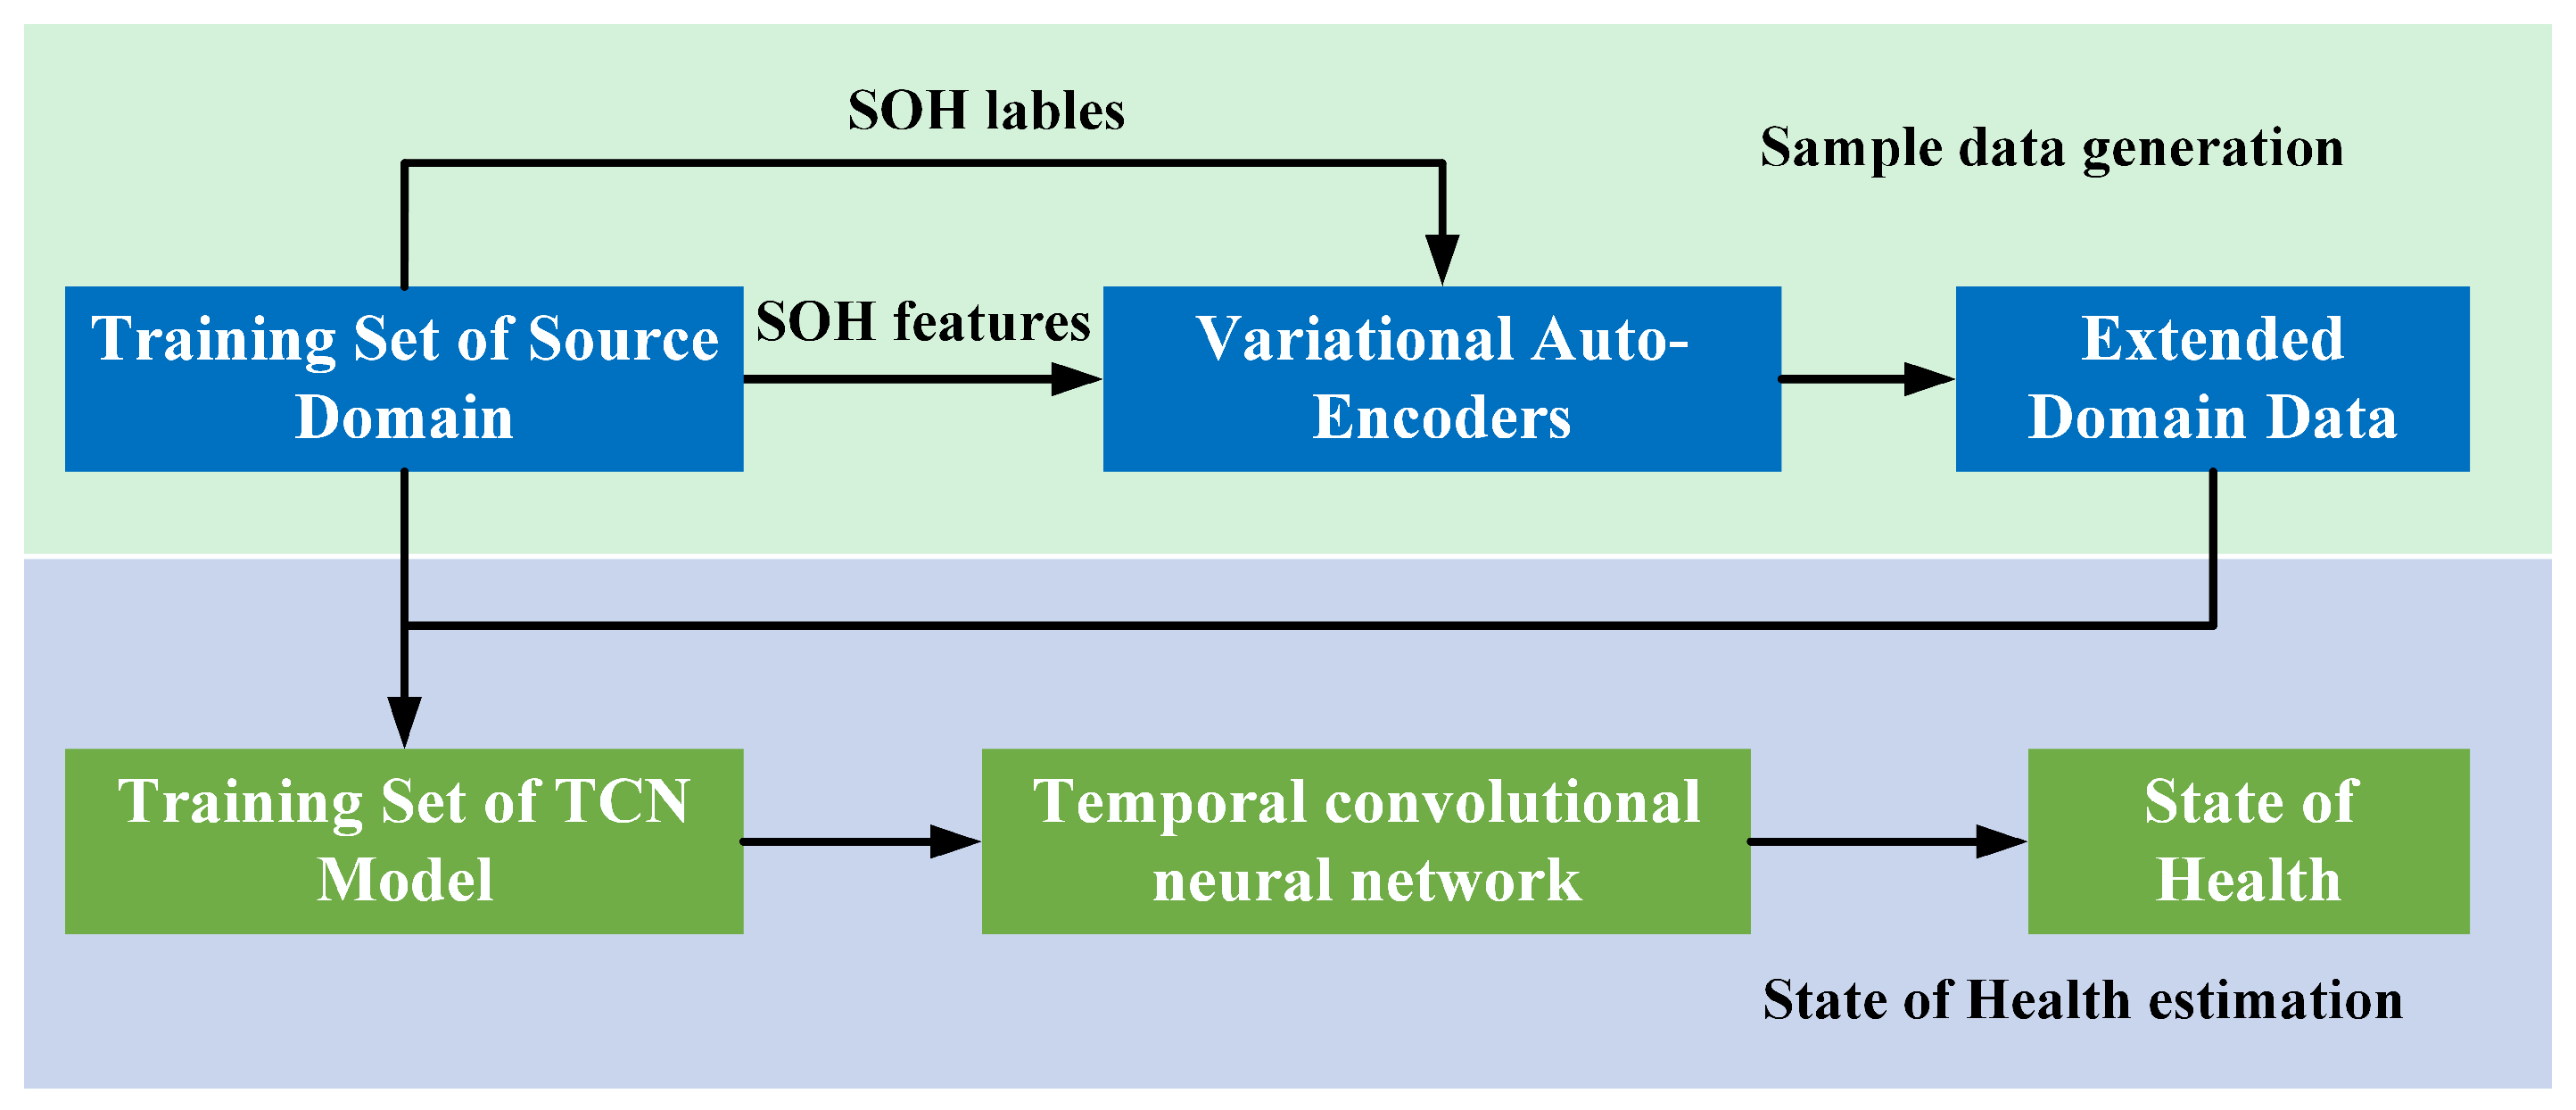
3. SOH Estimation Process

3.1. Feature Extraction

While data such as voltage, current, temperature, and time during the operation of LIBs can be directly measured, battery capacity usually cannot be directly measured. It can only be indirectly estimated by other means. Battery capacity degradation is commonly used to characterize the aging process of a battery, so extracting features from directly measurable data that can characterize battery aging at different scales is critical for estimating battery health [32,33]. In this study, taking the CS35 battery as an example, three features related to its capacity degradation were extracted from the lithium battery charge/discharge dataset. The selected features are as follows:
F1: Constant current charging time (CCCT). As shown in Figure 3a, the graph illustrates the charging voltage curve versus time at 100-cycle intervals. It is not difficult to find that the time for the battery voltage to reach the cutoff voltage gradually decreases with the increased number of cycles. The CCCT change is due to the decay of lithium battery materials, and the shortening of the constant current time indicates the deepening of the battery polarization phenomenon, which reflects the battery’s aging to a certain extent [34].
F2: Average constant current charging voltage (ACCV). As the battery is used, its internal impedance gradually increases due to factors such as electrolyte degradation and structural changes in the active material. When a battery is charged, the increase in internal impedance causes the overall voltage of the battery to rise. As shown in Figure 3a, the discharge voltage curve moves to the upper left as the number of cycles increases so that the average charge voltage can be used as a reverse indicator of battery aging.
F3: Average discharge voltage (ADV). As shown in Figure 3b, the discharge voltage curve moves to the lower left as the number of cycles increases. The average discharge voltage decreases gradually with battery aging, which is consistent with the trend of SOH.

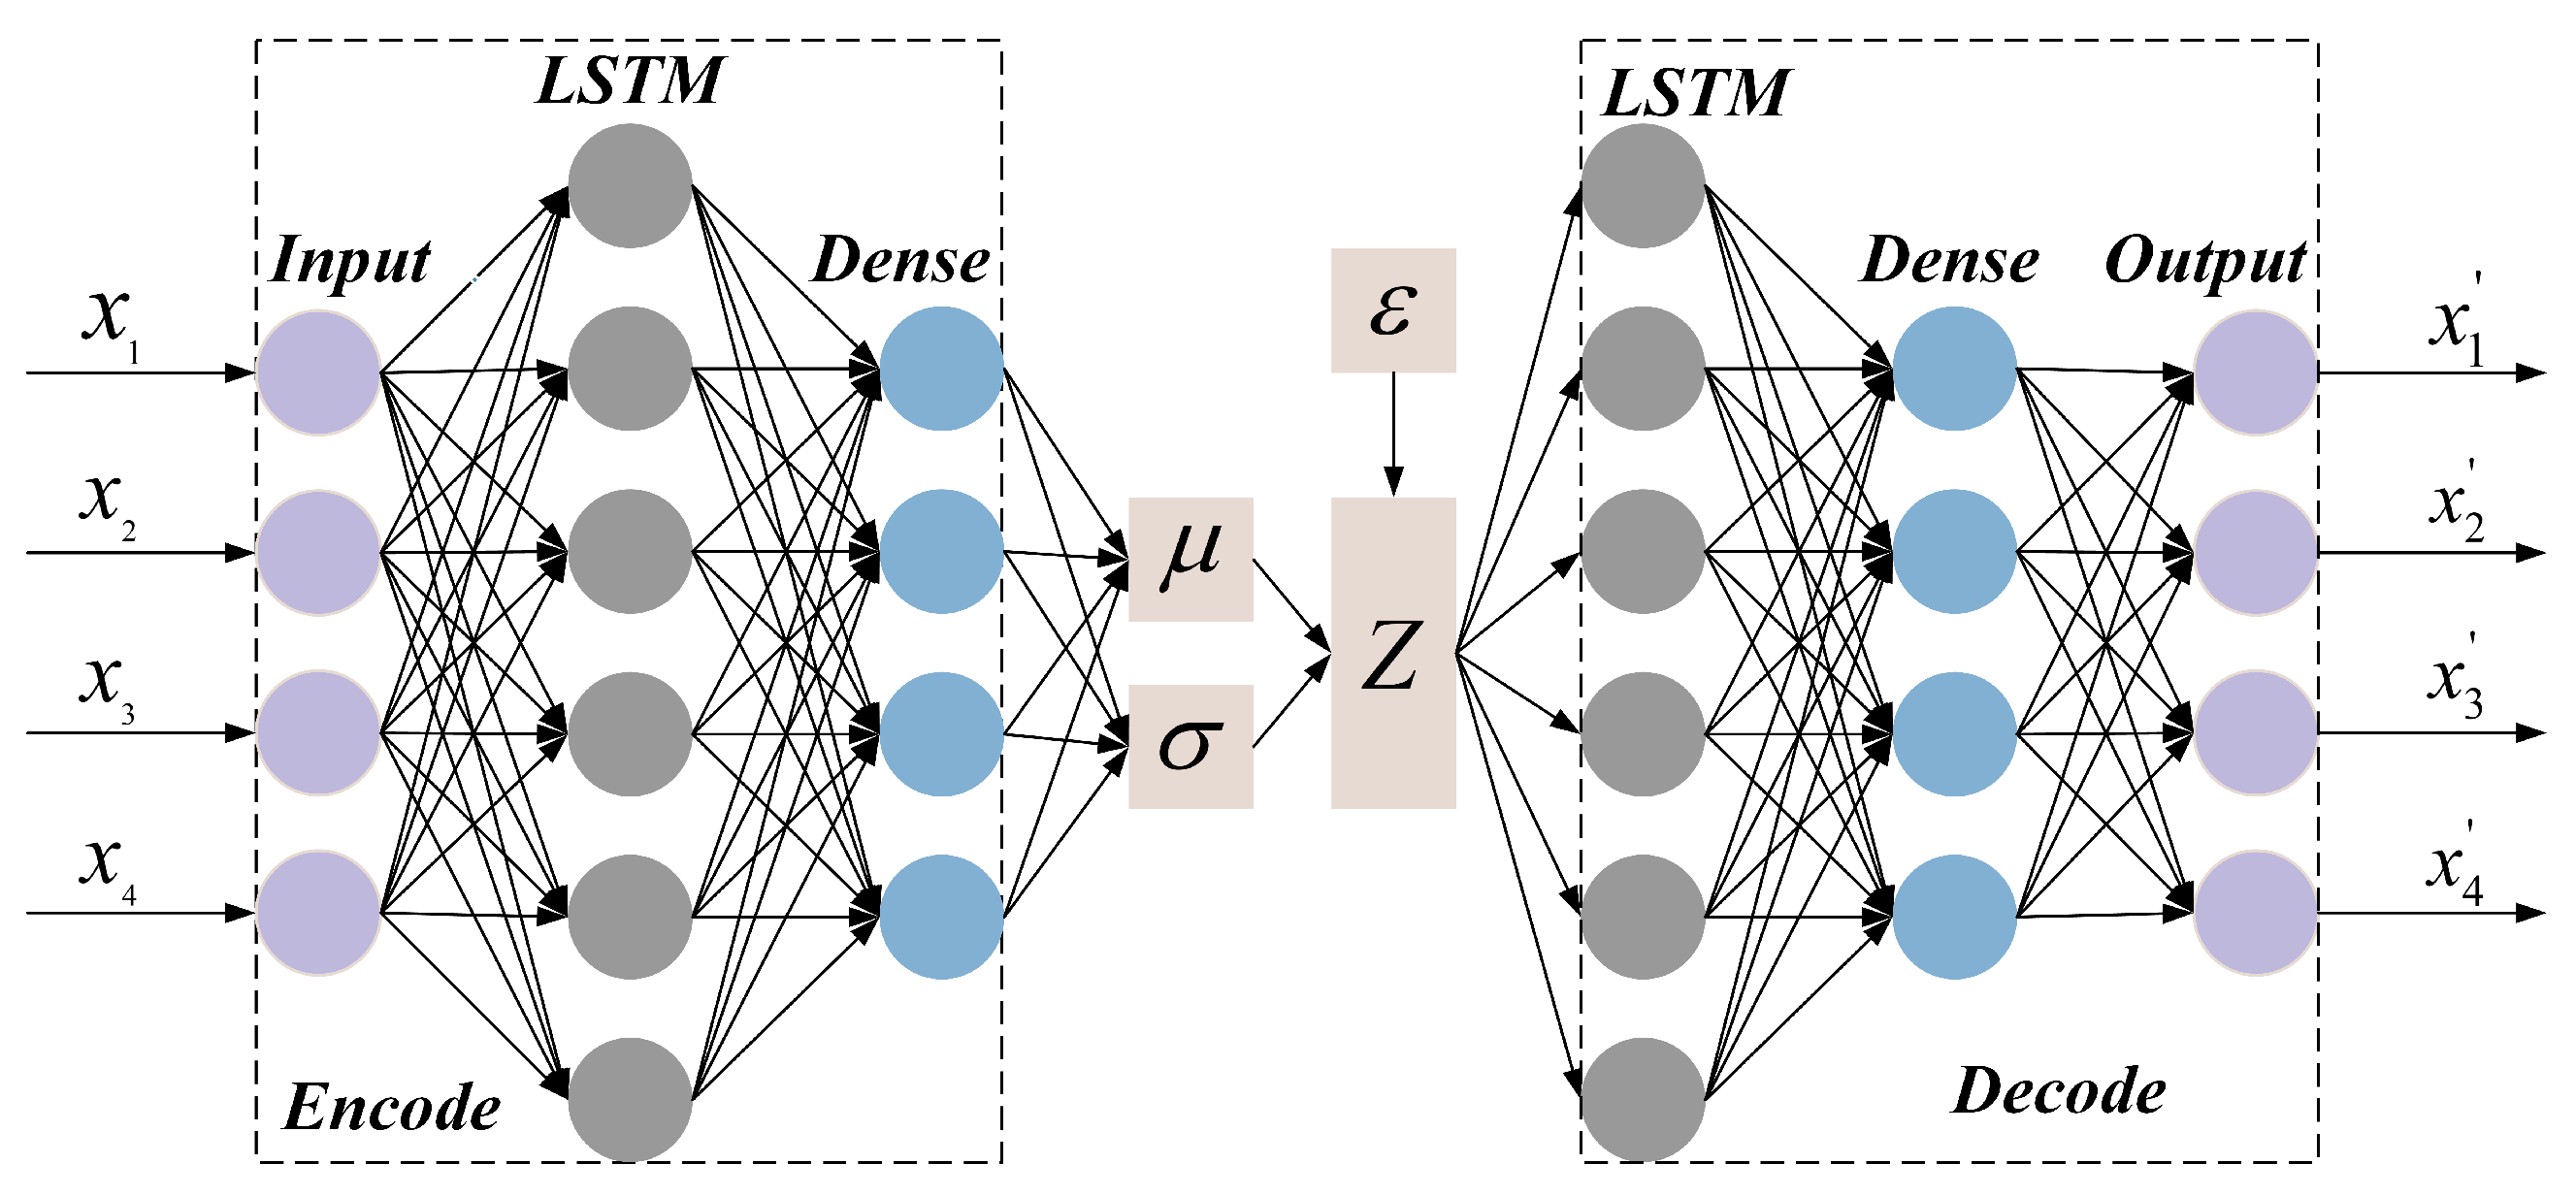
3.2. Variational Auto-Encoder

A Variational Auto-Encoder (VAE) as a form of deep generative modeling is a generative network structure based on the variational Bayes (VB) inference proposed by Kingma et al. [35] in 2014. Unlike the traditional autocoder that describes the latent space through numerical values, it describes the observation of the latent space in a probabilistic way, which has shown great application in data generation.
The variational self-coding network contains encoders and decoders connected in series, as shown in Figure 4. The VAE utilizes two neural networks to model two probability density distributions: one for variational inference of the original input data, which generates variational probability distributions of the hidden variables, known as the inference network, and the other reduces to generate approximate probability distributions of the original data based on the generated variational probability distributions of the hidden variables, known as the generation network. An inference network encodes the input data X into a low-dimensional hidden variable Z that obeys a certain probability distribution. To realize this function, the inference network has to make an approximation to infer the true a posteriori probability p θ Z X concerning the positional parameter θ using a recognition model q φ Z X concerning the parameter φ . Typically, the altered recognition model is preset to an ordinary normal distribution concerning the parameter φ . After determining the recognition model, the hidden variable Z can be obtained by sampling X input data. The generative network can reconstruct the hidden variable Z, which obeys the distribution, in the output data X approximately the same as the input data X by the Bayesian Equation (2):
q φ ( Z X ) p θ ( Z X ) = p θ ( Z X ) p θ ( Z ) p ( X )
where parameter variations control the prior probability p θ Z of the hidden variable Z to a standard normal distribution, which leads to the conditional probability p θ Z X . By sampling the hidden variable Z with the conditional probability, the task of generating an approximation of the input data X can be realized.
Using the Variational Auto-Encoder (VAE) model, we take the three key features extracted in Section 3.1 with the capacity data of the battery as inputs. The VAE is trained to generate new data as outputs highly similar to the original input data in structure and characteristics, thus enriching the sample data.

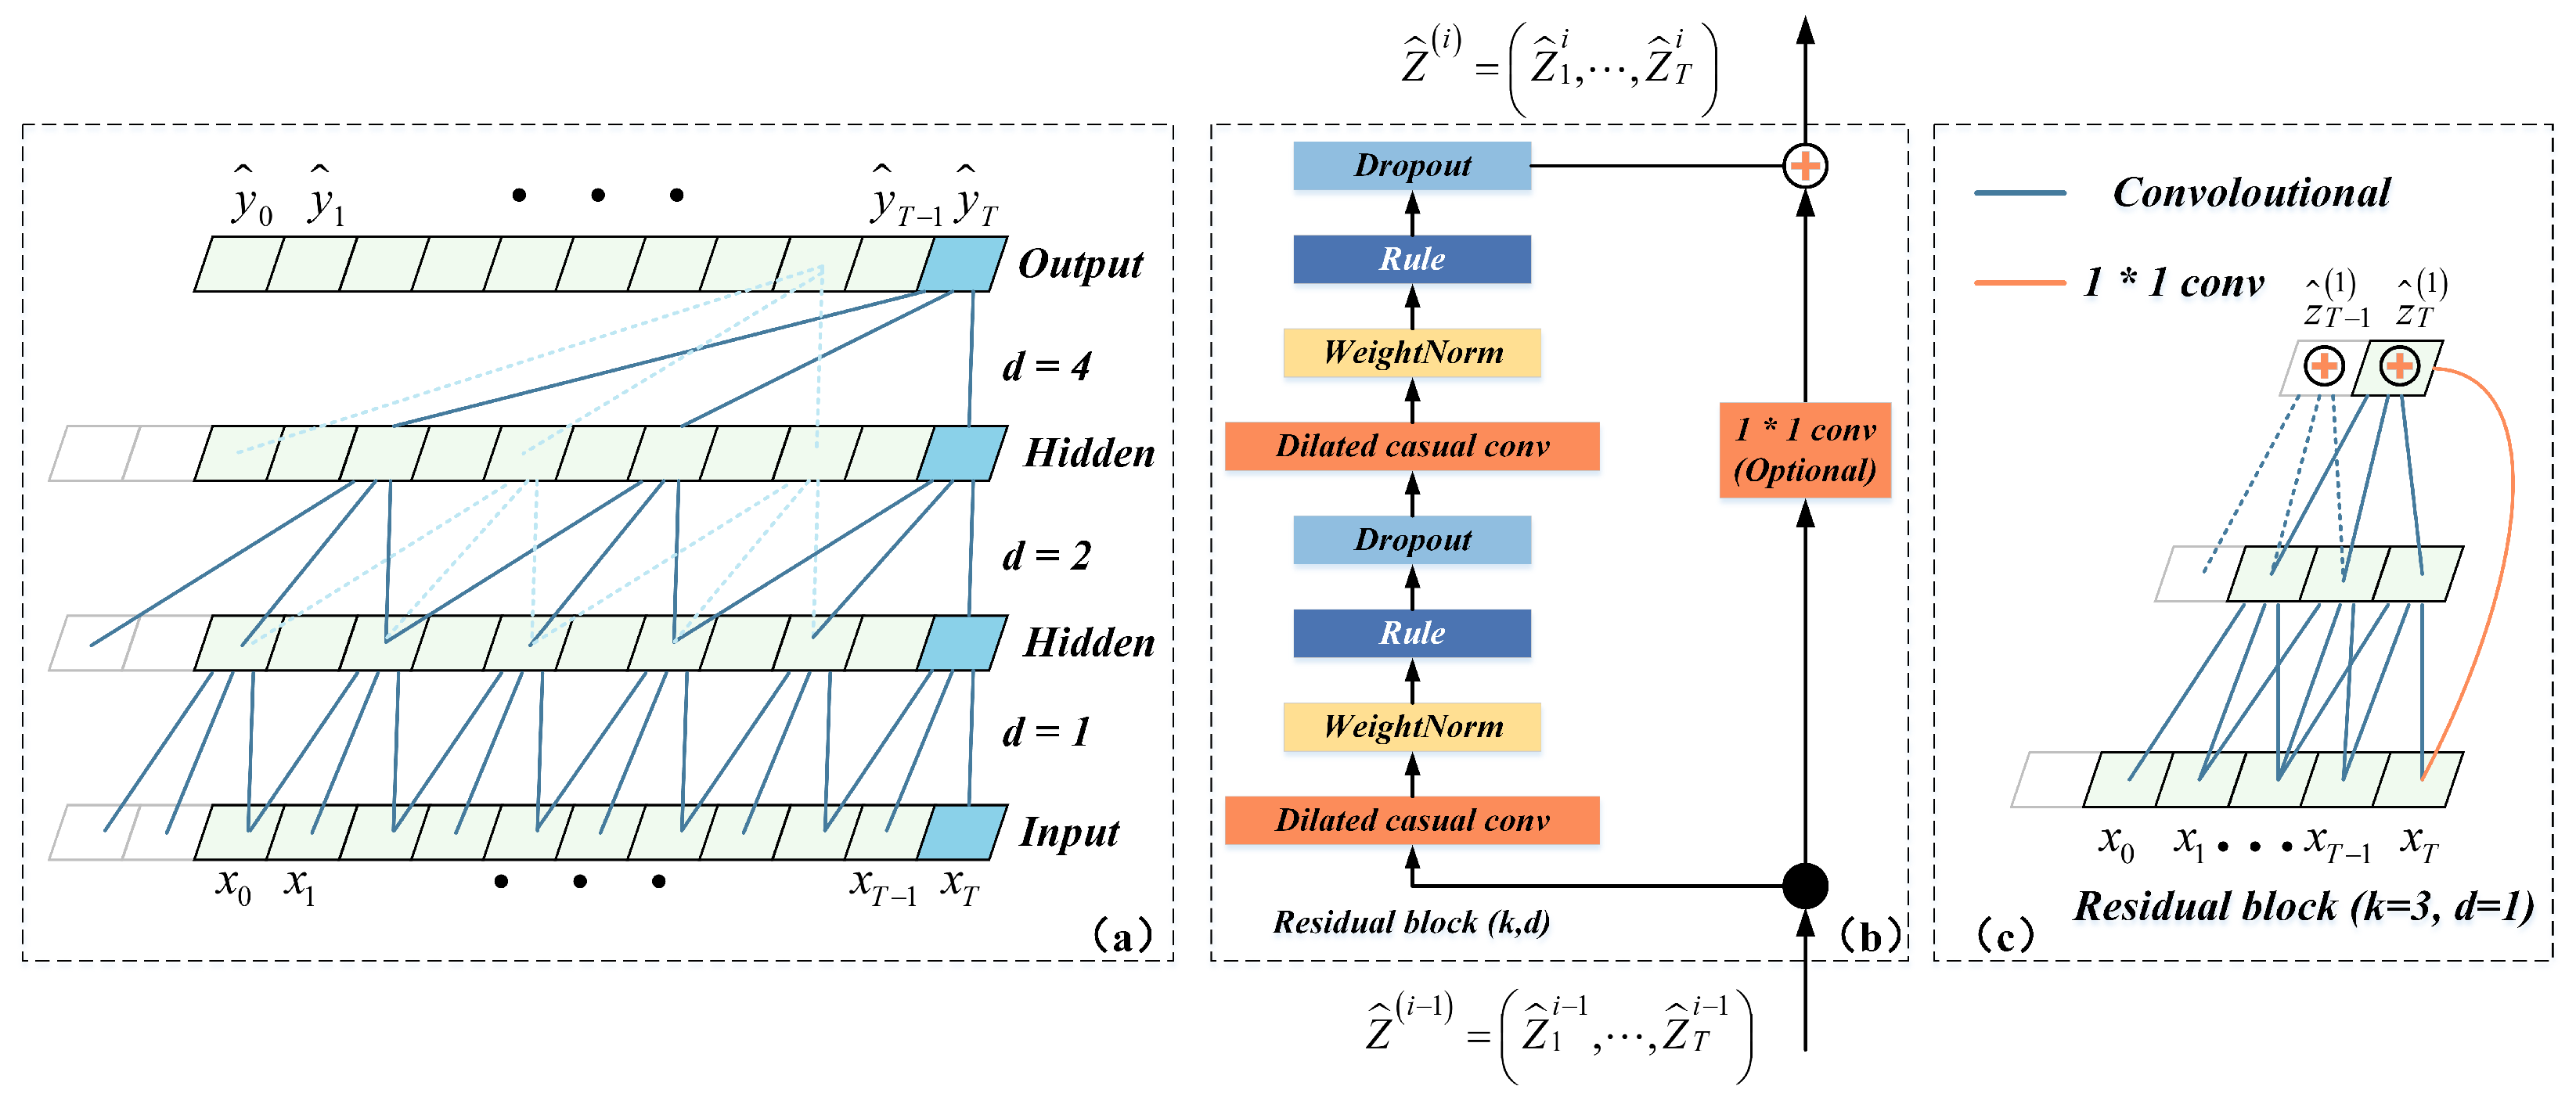
3.3. Temporal Convolutional Network

The temporal convolutional network (TCN) [36] introduces an innovative architecture for sequence data analysis that incorporates key components such as causal convolution, inflationary convolution, and residual modules in its structure. The key to this network is to utilize the features and structure of convolution for time series analysis, which ensures computationally efficient and long-range dependency capture. It enables parallel computation, thus improving training efficiency.
Conventional convolutional layers have a significant problem when dealing with time-series data: they do not consider the temporal order of the data. They may use “future” data to predict the “present”. To solve this problem, the TCN introduces the “causal convolution” mechanism. Causal convolution is a special convolution operation that ensures that the current point in time only extracts features from past information and does not see future data when performing calculations. Causal convolution can be expressed by Equation (3) as:
y t = i = 0 k x t i ω i
where y t represents the output at time t; x is the input sequence; ω is the convolution kernel; and k defines the size of the convolution kernel, which also determines how far into the past the model can see at the current point in time. This mechanism ensures that the model’s predictions are based only on previous events, avoiding the problem of data leakage.
Expansion convolution, which “inflates” the convolution kernel by inserting a fixed number of zeros, increases its width, allowing it to cover a larger range of inputs without increasing the number of parameters or computational complexity. This is shown in Equation (4):
y t = i = 0 k x t d × i ω i
where d is the expansion rate, determining the spacing between each weight in the convolutional kernel. The expansion rate typically increases exponentially as the layers increase, so deeper layers of the network can observe longer temporal distances and thus capture a longer range of dependencies. As shown in Figure 5a, the bottom layer with d = 1 indicates that each point is sampled at the input, and the middle layer with d = 2 indicates that every two points are sampled as input. In general, the higher the layer, the larger the d used. So, inflated convolution makes the size of the effective window grow exponentially with the number of layers. In this way, the convolutional network uses relatively few layers to obtain a large sensory field.
The problem of gradient vanishing or gradient explosion often accompanies the training of deep networks. To solve this problem and accelerate the convergence of the network, the TCN employs a residual structure. As shown in Figure 5b, a basic residual module consists of two convolutional layers and a nonlinear mapping. WeightNorm and Dropout are also added to each layer to regularize the network. Its output is added to the original input to form the final output. This is represented in Equation (5):
Y = T C N ( X ) + X
where T C N ( X ) is the result of input X after it has been causally convolved through two layers, this “jump” connection ensures that the gradient can flow directly to earlier layers, thus avoiding the problem of vanishing gradients and enhancing the expressive power of the model.
Based on the features extracted in Section 3.1, we employ a temporal convolutional neural network (TCN) to model and capture the complex nonlinear relationship between the features and the battery health state. Specifically, the mapping relationship between the health state of the battery and the features can be described by Equation (6):
S O H = f T C N F 1 , F 2 , F 3

3.4. VAE-TCN Model

The data-driven SOH estimation process based on this study is divided into sample generation and SOH estimation, as shown in Figure 6. First, the training set is used as the source-domain data, and the VAE is used to learn in-depth the battery health features and their corresponding SOH labels contained in the source-domain data. The VAE model can accurately capture the intrinsic distribution of battery characteristics through this deep learning approach, generating extended domain data highly similar to the original training data but quantitatively richer. These newly generated data not only enrich the diversity of the dataset but also enhance the basis for subsequent TCN model training. Next, the original source-domain data and the newly generated extended-domain data are efficiently combined and jointly used as the training set for the TCN model to achieve more accurate SOH estimation. This approach can combine the technical characteristics of VAE and TCN models, which not only improves the estimation accuracy of SOH but also enhances the model’s generalization ability to different types of battery data, providing an efficient and reliable analysis tool for battery health management.

4. Results

In order to verify the effectiveness of the method proposed in this study, we first divided the first 20% of the data from each cell into a training set and the last 80% into a test set. Next, we train variational self-coding nets using the training set and generate 100 sets of extended domain data for six batteries. Finally, the source-domain training set is combined with the extended-domain data to train the TCN model to predict the battery health status.
In order to demonstrate the superiority of the models proposed in this study, we compared the effects of the traditional long short-term memory neural network (LSTM) model, the TCN model, and the VAE-TCN model. Among them, the LSTM and TCN are the models trained using only 20% of the data, while the VAE-TCN is the model trained with 20% of the source-domain data after using VAE for data generation. Finally, we also compare the results of the methods proposed in this study with other related literature.

4.1. Evaluation Indicators

In order to quantify the effectiveness of the model in estimating health status, root mean square error (RMSE), mean absolute error (MAE), mean absolute percentage error (MAPE), and coefficient of determination (R2) were selected as evaluation metrics in this study [37]. The formula for the evaluation indicators is as follows:
R M S E = 1 n t = 1 n y t r u t y p r e t 2 M A E = 1 n t = 1 n y t r u t y p r e t M A P E = 100 % n t = 1 n y t r u t y p r e t y t r u t R 2 = 1 t y t r u e t y p r e t 2 t y t r u e t y ¯ t r u e 2
where y t r u and y p r e are the actual and predicted values of the sample t, respectively; y ¯ t r u e is the average of the actual values; and n is the number of samples.

4.2. Experimental Results

All experiments were conducted on the Tensorflow 2.6.0 platform with NVIDIA Geforce RTX 3050 equipped with 4 GB RAM. On six batteries, CS35, CS36, B0005, B0006, #1, and #2, we validated the model proposed in this study to examine its accuracy in recognizing the degradation mechanism of the battery health state. Figure 7 reveals in detail the estimated performance of the VAE-TCN model for these cells. The blue curve represents the true value of SOH from the model, while the orange curve represents the predicted SOH value. From Figure 7, it can be noticed that the predicted curves highly fit the actual data curves. This means that the method proposed in this study can accurately identify the degradation trend of the battery even when only a small amount of data is available.
The capacity degradation trend of the batteries is generally characterized by non-linearity and overall shows a fluctuating downward pattern. The CALCE dataset is particularly interesting, in which the fluctuations are significantly more dramatic. We detail the prediction error metrics for each cell, including RMSE, MAE, MAPE, and R2, in Table 2. For example, in the case of the CS35 cell, its RMSE and MAPE reach 0.0120 and 0.0115, respectively. Significantly, the cell’s prediction accuracy in the early stage is quite high, but the error in the later stage gradually increases as time goes by. The main explanation lies in the relatively gentle decay trend in the early stage, which is highly consistent with the training data and makes the model fit excellently in this stage. As for the CS36 cell, the error metrics RMSE and MAPE are 0.0125 and 0.0120, respectively. This battery has a relatively steady decay rate over its lifetime, and the model fits its overall performance, all showing a high degree of accuracy with no error spikes. Looking further into the NASA dataset, the B0005 battery exhibits an RMSE and MAPE of 0.0073 and 0.0072, making it the sample with the best model predictions. It is commendable that the model successfully captures the capacity regeneration characteristics of this battery, and the prediction curve is almost synchronized with the actual curve with a negligible error. In contrast, the error of the B0006 battery is relatively large, with RMSE and MAPE of 0.0146 and 0.0181, respectively. In the later stages of this battery’s capacity decline, the model predictions are generally low, leading to large prediction errors. The dataset tested on our research experimental platform exhibits a more complex characterization of the capacity decay curves for batteries #1 and #2. Compared to the other samples, there is a clear lack of regularity in the decline curves of these two batteries, which are characterized by multiple large capacity fluctuations. These significant fluctuations make forecasting challenging, hence the relatively large prediction errors for both cells. Specifically, battery #1 has an RMSE of 0.0184, while battery #2 is slightly better than the former, with an RMSE of 0.0170. These data indicate that irregularities in the battery decline curve may significantly impact prediction accuracy.
The above analysis shows that our proposed VAE-TCN model achieves satisfactory accuracy even when only 20% of the training data are used. This efficient performance validates the feasibility of using data-driven models for battery health management in data-constrained application scenarios.

4.3. Model Comparison

In order to highlight the superiority of the models proposed in this study, this study compares the estimation results of the LSTM, TCN, and VAE-TCN models for the SOH of the batteries in the three datasets.
Figure 8 demonstrates the error scatter plots for the six cells; the closer the distribution of the errors is to the diagonal line, indicating a more reasonable error size and distribution. The figure shows that the TCN model exhibits higher accuracy on almost all cells compared to the traditional LSTM model. This demonstrates the superior performance of the TCN in dealing with time-series data such as battery degradation. Notably, the VAE-TCN model formed achieves the best prediction when we introduce the variational self-coding network for data expansion.
Table 3 demonstrates the error metrics for the different models. Specifically, taking the B0005 battery as an example, this battery achieves an RMSE metric of 0.0073 when using the VAE-TCN model, while this metric is 0.0208 when using the TCN model and 0.0394 for the LSTM model. This means that compared to the TCN model, the VAE-TCN achieves a 64.9% improvement in the RMSE metric; compared to the LSTM model, the improvement is even higher at 81.5%. This significant difference further reinforces that with limited data, the VAE-TCN model, augmented with data by incorporating a variational self-coding network, can significantly improve the accuracy of predicting battery health status. In particular, the model can capture the degradation trend of battery capacity more accurately and effectively for complex battery degradation mechanisms, providing a more reliable decision basis for battery health management.
This section validates the superiority of the methodology proposed in this study by comparing the results with other studies. The comparison dimensions include the training set data volume as well as the model prediction accuracy. As can be seen from Table 4, the proposed method in this study is less dependent on the amount of data. Although the amount of training data is much less than the other two studies, the model prediction accuracy can still be comparable to the two.

5. Conclusions

The SOH estimation is a key technology of battery management systems, which is of great significance to ensuring the safe operation of batteries. In this study, we propose a sample data generation and data-driven SOH estimation method for lithium batteries, which solves the problem of difficult data-driven modeling when the amount of data is limited. First, we analyzed the charging and discharging curves of the battery, from which we extracted features highly correlated with SOH decay, namely CCCT, ACCV, and ADV. Next, we use a Variational Auto-Encoder to learn the features and distributions of the sample data, thereby generating extended domain data that are highly similar to the sample. We enrich the number of training samples by combining the extended domain data with the source-domain data as a training set. Finally, a temporal convolutional neural network is built for mining the nonlinear relationship between features and SOH, thus realizing SOH estimation. The results show that the RMSE of the proposed method in this study is minimized to 0.0073, which improves the accuracy by 64.9% based on its benchmark model. The sample data generation enhances the basis for the TCN model training and improves the model’s generalization ability. The datasets used in this study include lithium ternary and lithium cobaltate batteries, demonstrating that the methodology proposed in this study can effectively adapt and process different types of lithium-ion battery data.
In the future, we plan to apply the model to real vehicle operation data, integrate the research in this paper with practical engineering applications, and validate the model’s performance in complex and dynamic real-world environments. At the same time, the model is further optimized through practical applications to improve its usefulness and accuracy in vehicle health monitoring and maintenance, thus making a positive impact in the field of vehicle maintenance and management.

Author Contributions

Conceptualization, F.G.; methodology, W.Z.; software, G.H. and T.L.; validation, A.W.; formal analysis, H.H. (Hancheng He); data curation, H.H. (Haolin Huang); writing—original draft preparation, F.G.; writing—review and editing, A.W. and S.Z.; visualization, G.H.; supervision, W.Z.; funding acquisition, F.G. All authors have read and agreed to the published version of the manuscript.

Funding

This research was funded by General University Innovation Team Project of Guangdong OF FUNDER grant number 2021KCXTD027.

Data Availability Statement

Data will be made available on request.

Conflicts of Interest

The authors declare no conflict of interest.

References

  1. Wu, T.; Huang, Y.; Xu, Y.; Jiang, J.; Liu, S.; Li, Z. SOH Prediction for Lithium-Ion Battery Based on Improved Support Vector Regression. Int. J. Green Energy 2022, 20, 227–236. [Google Scholar] [CrossRef]
  2. Zhang, W.; Qiu, J.; Yin, X.; Wang, D. A Novel Heat Pipe Assisted Separation Type Battery Thermal Management System Based on Phase Change Material. Appl. Therm. Eng. 2020, 165, 114571. [Google Scholar] [CrossRef]
  3. Zhang, Y.; Liu, Y.; Wang, J.; Zhang, T. State-of-Health Estimation for Lithium-Ion Batteries by Combining Model-Based Incremental Capacity Analysis with Support Vector Regression. Energy 2022, 239, 121986. [Google Scholar] [CrossRef]
  4. Zhang, J.; Lee, J. A Review on Prognostics and Health Monitoring of Li-ion Battery. J. Power Sources 2011, 196, 6007–6014. [Google Scholar] [CrossRef]
  5. Chen, Y.; Duan, W.; Ding, Z.; Li, Y. Battery Life Prediction Based on a Hybrid Support Vector Regression Model. Front. Energy Res. 2022, 10, 899804. [Google Scholar] [CrossRef]
  6. Yang, S.; Zhang, C.; Jiang, J.; Zhang, W.; Zhang, L.; Wang, Y. Review on State-of-Health of Lithium-Ion Batteries: Characterizations, Estimations and Applications. J. Clean. Prod. 2021, 314, 128015. [Google Scholar] [CrossRef]
  7. Tang, X.; Liu, K.; Wang, X.; Gao, F.; Macro, J.; Widanage, W.D. Model Migration Neural Network for Predicting Battery Aging Trajectories. IEEE Trans. Transp. Electrif. 2020, 6, 363–374. [Google Scholar] [CrossRef]
  8. Ospina Agudelo, B.; Zamboni, W.; Monmasson, E. Application Domain Extension of Incremental Capacity-Based Battery SoH Indicators. Energy 2021, 234, 121224. [Google Scholar] [CrossRef]
  9. Gu, X.; See, K.; Li, P.; Shan, K.; Wang, Y.; Zhao, L.; Lim, K.C.; Zhang, N. A Novel State-of-Health Estimation for the Lithium-Ion Battery Using a Convolutional Neural Network and Transformer Model. Energy 2023, 262, 125501. [Google Scholar] [CrossRef]
  10. Sun, T.; Wu, R.; Cui, Y.; Zheng, Y. Sequent Extended Kalman Filter Capacity Estimation Method for Lithium-Ion Batteries Based on Discrete Battery Aging Model and Support Vector Machine. J. Energy Storage 2021, 39, 102594. [Google Scholar] [CrossRef]
  11. Chen, Z.; Yang, L.; Zhao, X.; Wang, Y.; He, Z. Online State of Charge Estimation of Li-ion Battery Based on an Improved Unscented Kalman Filter Approach. Appl. Math. Model. 2019, 70, 532–544. [Google Scholar] [CrossRef]
  12. Zhang, J.; Wang, P.; Gong, Q.; Cheng, Z. SOH Estimation of Lithium-Ion Batteries Based on Least Squares Support Vector Machine Error Compensation Model. J. Power Electron. 2021, 21, 1712–1723. [Google Scholar] [CrossRef]
  13. Song, L.; Zhang, K.; Liang, T.; Han, X.; Zhang, Y. Intelligent State of Health Estimation for Lithium-Ion Battery Pack Based on Big Data Analysis. J. Energy Storage 2020, 32, 101836. [Google Scholar] [CrossRef]
  14. Li, S.; He, H.; Zhao, P.; Cheng, S. Health-Conscious Vehicle Battery State Estimation Based on Deep Transfer Learning. Appl. Energy 2022, 316, 119120. [Google Scholar] [CrossRef]
  15. Chen, L.; Wang, H.; Liu, B.; Wang, Y.; Ding, Y.; Pan, H. Battery State-of-Health Estimation Based on a Metabolic Extreme Learning Machine Combining Degradation State Model and Error Compensation. Energy 2021, 215, 119078. [Google Scholar] [CrossRef]
  16. Li, Q.; Li, D.; Zhao, K.; Wang, L.; Wang, K. State of Health Estimation of Lithium-Ion Battery Based on Improved Ant Lion Optimization and Support Vector Regression. J. Energy Storage 2022, 50, 104215. [Google Scholar] [CrossRef]
  17. Chang, C.; Wang, Q.; Jiang, J.; Wu, T. Lithium-Ion Battery State of Health Estimation Using the Incremental Capacity and Wavelet Neural Networks with Genetic Algorithm. J. Energy Storage 2021, 38, 102570. [Google Scholar] [CrossRef]
  18. Deng, Z.; Lin, X.; Cai, J.; Hu, X. Battery Health Estimation with Degradation Pattern Recognition and Transfer Learning. J. Power Sources 2022, 525, 231027. [Google Scholar] [CrossRef]
  19. Wu, J.; Cui, X.; Meng, J.; Peng, J.; Lin, M. Data-Driven Transfer-Stacking-Based State of Health Estimation for Lithium-Ion Batteries. IEEE Trans. Ind. Electron. 2024, 71, 604–614. [Google Scholar] [CrossRef]
  20. Zhang, T.; Wang, Y.; Ma, R.; Zhao, Y.; Shi, M.; Qu, W. Prediction of Lithium Battery Health State Based on Temperature Rate of Change and Incremental Capacity Change. Energies 2023, 16, 7581. [Google Scholar] [CrossRef]
  21. Zhu, C.; Gao, M.; He, Z.; Wu, H.; Sun, C.; Zhang, Z.; Bao, Z. State of Health Prediction for Li-Ion Batteries with End-to-End Deep Learning. J. Energy Storage 2023, 65, 107218. [Google Scholar] [CrossRef]
  22. Wu, C.; Fu, J.; Huang, X.; Xu, X.; Meng, J. Lithium-Ion Battery Health State Prediction Based on VMD and DBO-SVR. Energies 2023, 16, 3993. [Google Scholar] [CrossRef]
  23. Luo, K.; Zheng, H.; Shi, Z. A Simple Feature Extraction Method for Estimating the Whole Life Cycle State of Health of Lithium-Ion Batteries Using Transformer-Based Neural Network. J. Power Sources 2023, 576, 233139. [Google Scholar] [CrossRef]
  24. Lin, M.; Yan, C.; Wang, W.; Dong, G.; Meng, J.; Wu, J. A Data-Driven Approach for Estimating State-of-Health of Lithium-Ion Batteries Considering Internal Resistance. Energy 2023, 277, 127675. [Google Scholar] [CrossRef]
  25. Zhou, Y.; Dong, G.; Tan, Q.; Han, X.; Chen, C.; Wei, J. State of Health Estimation for Lithium-Ion Batteries Using Geometric Impedance Spectrum Features and Recurrent Gaussian Process Regression. Energy 2023, 262, 125514. [Google Scholar] [CrossRef]
  26. Feng, H.; Yan, H. State of Health Estimation of Large-Cycle Lithium-Ion Batteries Based on Error Compensation of Autoregressive Model. J. Energy Storage 2022, 52, 104869. [Google Scholar] [CrossRef]
  27. Wu, J.; Fang, L.; Dong, G.; Lin, M. State of Health Estimation of Lithium-Ion Battery with Improved Radial Basis Function Neural Network. Energy 2023, 262, 125380. [Google Scholar] [CrossRef]
  28. Hu, X.; Xu, L.; Lin, X.; Pecht, M. Battery Lifetime Prognostics. Joule 2020, 4, 310–346. [Google Scholar] [CrossRef]
  29. Wang, Y.; Tian, J.; Sun, Z.; Wang, L.; Xu, R.; Li, M.; Chen, Z. A Comprehensive Review of Battery Modeling and State Estimation Approaches for Advanced Battery Management Systems. Renew. Sustain. Energy Rev. 2020, 131, 110015. [Google Scholar] [CrossRef]
  30. Yang, D.; Zhang, X.; Pan, R.; Wang, Y.; Chen, Z. A Novel Gaussian Process Regression Model for State-of-Health Estimation of Lithium-Ion Battery Using Charging Curve. J. Power Sources 2018, 384, 387–395. [Google Scholar] [CrossRef]
  31. Xu, W.; Wang, S.; Jiang, C.; Fernandez, C.; Yu, C.; Fan, Y.; Cao, W. A Novel Adaptive Dual Extended Kalman Filtering Algorithm for the Li-ion Battery State of Charge and State of Health Co-estimation. Int. J. Energy Res. 2021, 45, 14592–14602. [Google Scholar] [CrossRef]
  32. Tang, T.; Yuan, H. The Capacity Prediction of Li-ion Batteries Based on a New Feature Extraction Technique and an Improved Extreme Learning Machine Algorithm. J. Power Sources 2021, 514, 230572. [Google Scholar] [CrossRef]
  33. Tan, X.; Liu, X.; Wang, H.; Fan, Y.; Feng, G. Intelligent Online Health Estimation for Lithium-Ion Batteries Based on a Parallel Attention Network Combining Multivariate Time Series. Front. Energy Res. 2022, 10, 844985. [Google Scholar] [CrossRef]
  34. Deng, Y.; Ying, H.; E, J.; Zhu, H.; Wei, K.; Chen, J.; Zhang, F.; Liao, G. Feature Parameter Extraction and Intelligent Estimation of the State-of-Health of Lithium-Ion Batteries. Energy 2019, 176, 91–102. [Google Scholar] [CrossRef]
  35. Kingma, D.P.; Welling, M. Auto-Encoding Variational Bayes. arXiv 2022, arXiv:1312.6114. [Google Scholar] [CrossRef]
  36. Bai, S.; Kolter, J.Z.; Koltun, V. An Empirical Evaluation of Generic Convolutional and Recurrent Networks for Sequence Modeling. arXiv 2018, arXiv:1803.01271. [Google Scholar] [CrossRef]
  37. Guo, F.; Huang, G.; Zhang, W.; Liu, G.; Li, T.; Ouyang, N.; Zhu, S. State of Health Estimation Method for Lithium Batteries Based on Electrochemical Impedance Spectroscopy and Pseudo-Image Feature Extraction. Measurement 2023, 220, 113412. [Google Scholar] [CrossRef]
  38. Bao, X.; Chen, L.; Lopes, A.M.; Li, X.; Xie, S.; Li, P.; Chen, Y. Hybrid Deep Neural Network with Dimension Attention for State-of-Health Estimation of Lithium-ion Batteries. Energy 2023, 278, 127734. [Google Scholar] [CrossRef]
  39. Pan, R.; Liu, T.; Huang, W.; Wang, Y.; Yang, D.; Chen, J. State of Health Estimation for Lithium-Ion Batteries Based on Two-Stage Features Extraction and Gradient Boosting Decision Tree. Energy 2023, 129460. [Google Scholar] [CrossRef]
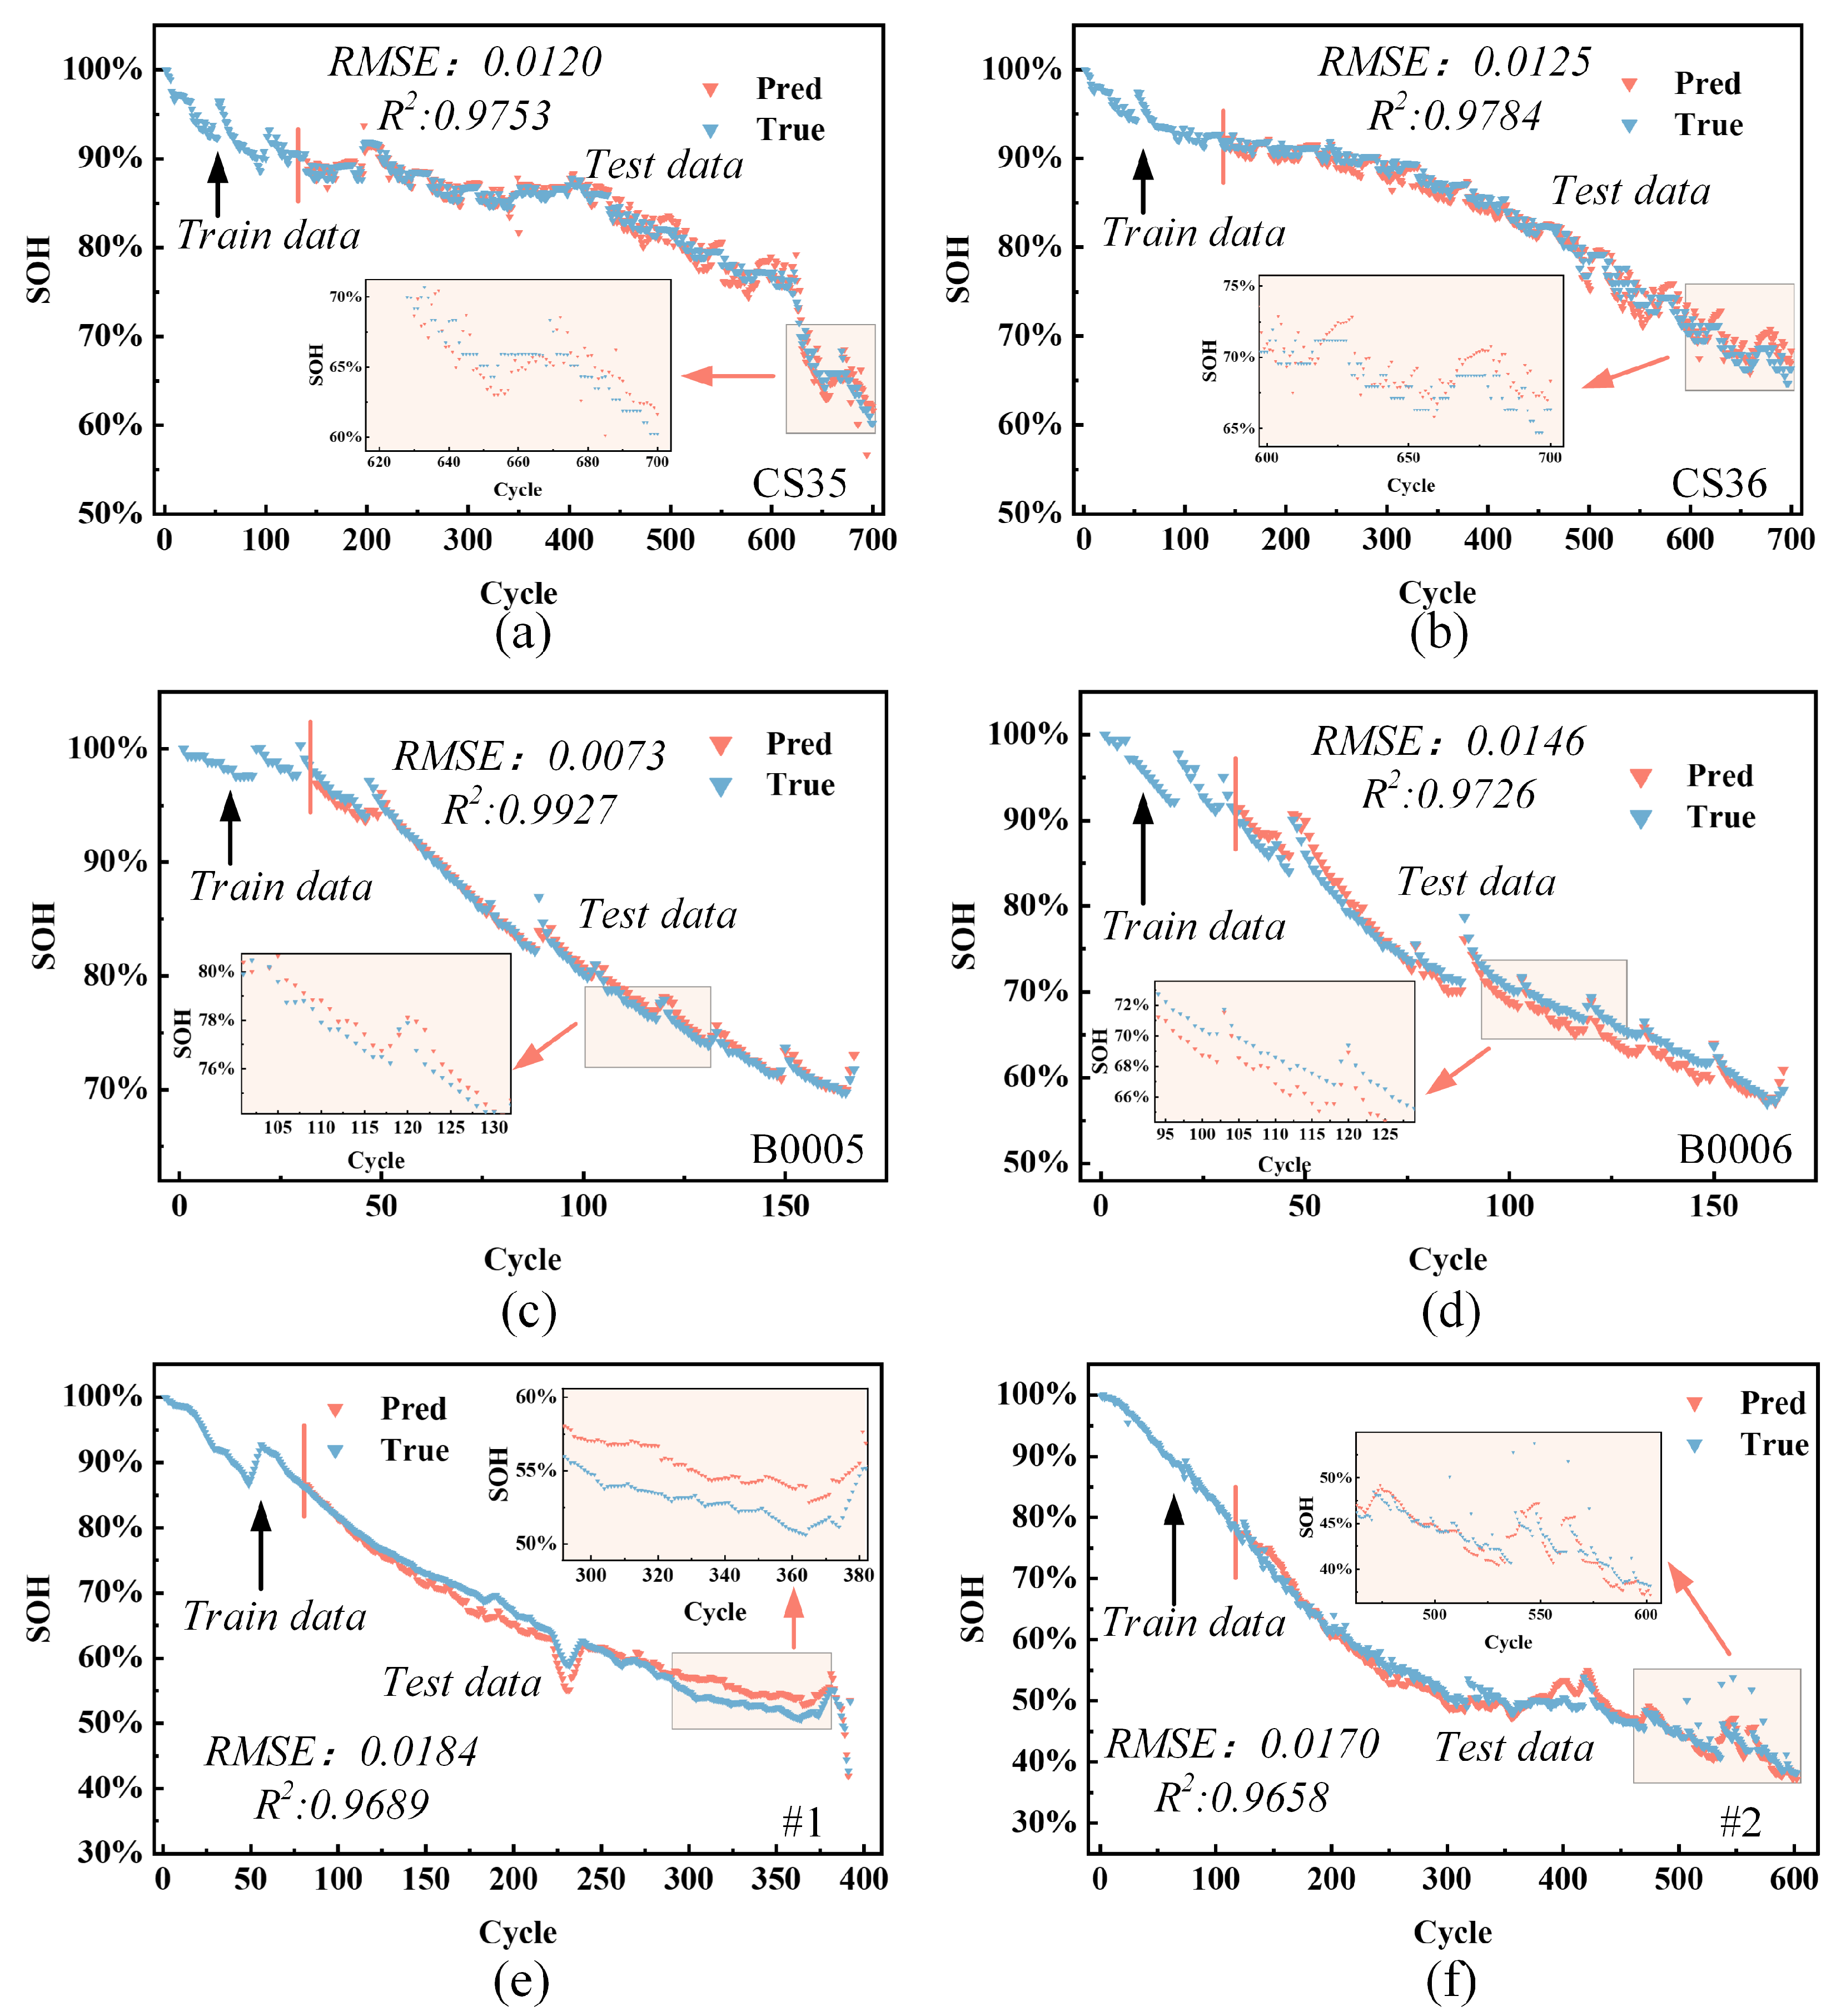
Figure 1. Battery charge/discharge test platform.
Energies 16 08010 g001
Figure 2. SOH decay curves for the three datasets: (a) NASA battery SOH decay curves; (b) CALCE battery SOH decay curves; (c) experimental battery SOH decay curves for this study.
Energies 16 08010 g002
Figure 3. Battery charge/discharge voltage curve: (a) Charging curve. (b) Discharging curve.
Energies 16 08010 g003
Figure 4. Structure of the Variational Auto-Encoder model.
Energies 16 08010 g004
Figure 5. Structural elements of temporal convolutional neural network: (a) Visualization of a stack of causal convolutionar layers; (b) TCN residual block; (c) An example of residual connection in a TCN.
Energies 16 08010 g005
Figure 6. Flow of SOH estimation by combining VAE and TCN.
Energies 16 08010 g006
Figure 7. SOH estimation results: (a) CS35; (b) CS36; (c) B0005; (d) B0006; (e) #1; (f) #2.
Energies 16 08010 g007
Figure 8. Error scatter plots for different models: (a) CS35; (b) CS36; (c) B0005; (d) B0006; (e) #1; (f) #2.
Energies 16 08010 g008
Table 2. The results of SOH estimation by the method proposed in this study.
BatteryAccuracy
RMSEMAEMAPER2
CS350.01200.00890.01150.9753
CS360.01250.00930.01200.9784
B00050.00730.00580.00720.9927
B00060.01460.01290.01810.9726
#10.01840.01560.02600.9689
#20.01700.01340.02600.9658
Table 3. The accuracy of different models in this study.
BatteryModelAccuracy
RMSEMAEMAPER2
CS35LSTM0.02550.01890.02510.8882
TCN0.01920.01210.01650.9367
VAE-TCN0.01200.00890.01150.9753
CS36LSTM0.02370.01640.02230.9215
TCN0.01680.01450.01780.9606
VAE-TCN0.01250.00930.01200.9784
B0005LSTM0.03940.03670.04710.7879
TCN0.02080.01920.02320.9409
VAE-TCN0.00730.00580.00720.9927
B0006LSTM0.03520.03130.04660.8400
TCN0.02030.01750.02510.9467
VAE-TCN0.01460.01290.01810.9726
#1LSTM0.02870.02430.04190.9246
TCN0.02380.01610.02690.9484
VAE-TCN0.01840.01560.02600.9689
#2LSTM0.03960.03540.07400.8117
TCN0.02600.02190.04150.9191
VAE-TCN0.01700.01340.02600.9658
Table 4. Comparison of the methodology proposed in this study with other studies.
MethodologyTraining Set SizeRMSE
CS35B0005
VAE-TCN20%0.01200.0073
Reference [38]70%-0.0068
Reference [39]75%0.01840.0092
Disclaimer/Publisher’s Note: The statements, opinions and data contained in all publications are solely those of the individual author(s) and contributor(s) and not of MDPI and/or the editor(s). MDPI and/or the editor(s) disclaim responsibility for any injury to people or property resulting from any ideas, methods, instructions or products referred to in the content.

