Abstract
Energy and water poverty are two main challenges of the modern world. Most developing and underdeveloped countries need more efficient electricity-producing sources to overcome the problem of potable water evaporation. At the same time, the traditional way to produce energy/electricity is also responsible for polluting the environment and damaging the ecosystem. Notably, many techniques have been used around the globe, such as a photovoltaic (PV) cooling (active, passive, and combined) process to reduce the working temperature of the PV panels (up to 60 °C) to improve the system efficiency. For floating photovoltaic (FPV), water cooling is mainly responsible for reducing the panel temperature to enhance the production capacity of the PV panels, while the system efficiency can increase up to around 30%. At the same time, due to the water surface covering, the water loss due to evaporation is also minimized, and the water evaporation could be minimized by up to 60% depending on the total area covered by the water surfaces. Therefore, it could be the right choice for generating clean and green energy, with dual positive effects. The first is to improve the efficiency of the PV panels to harness more energy and minimize water evaporation. This review article focuses mainly on various PV and FPV cooling methods and the use and advantages of FPV plants, particularly covering efficiency augmentation and reduction of water evaporation due to the installation of PV systems on the water bodies.
Keywords:
photovoltaic (PV); PV cooling; floating PV; FPV cooling; solar energy; efficiency; evaporation 1. Introduction
Energy production is one of the prime reasons for the rise in atmospheric temperature and global warming [1]. The share of energy production from green and cleaner sources (renewable sources) is increasing, as per the data available for the year 2021, this increment is about 28.7% globally [2] and 41% in the European Union (EU) [3].
While coal remained the primary source of the world’s electricity generation and was found to be the most dominant fuel, with 37% of the world’s electricity production in 2019 [4], in 2022, the CO2 emission linked to electricity production and heat generation increased by 1.8%, i.e., around 261 Mt [5].
Notably, a significant part (approximately 39.44%) of the total global population still lives in rural villages, notably in 63 (50% to 86.65%) countries out of 196 [6]. According to the United Nations Development Program (UNDP), nearly 33 out of every 100 people don’t have access to electricity [7], while about 775 million people globally are deprived of electricity [8].
On the other hand, one out of ten people, in total, about 771 million people, don’t have access to clean water [9]. UN reported that the global population may face a 40% shortfall in water by 2030 [10].
According to the report published by [2], among all the green energy generation technologies, solar photovoltaic (PV) will be the most prominent source in terms of the largest installed electricity capacity worldwide by 2027.
While the performance of a PV system is subjective [11,12], as the maximum power produced varies almost linearly with the PV panels’ operating temperature [13], depending on PV module constituents and local climate conditions, the conversion rate of the incident solar radiation to electricity was found to be in the range of 6–20% [14], while the efficiency dropping rate is about 0.5% for each °C rise in temperature as highlighted by Moharram et al. [15] and this phenomenon has been proved experimentally by Benghanem et al. [16].
The overall performance of a PV system [17,18] can be enhanced using various additional improvements, as in Baccoli et al. [19]. The PV panel’s working temperature is a vital factor for PV efficiency. Different cooling techniques have been developed to control the PV panel’s operating temperature to optimize the PV panels and the system’s production capacity.
According to [3], about 29% of the EU-27 territory is subjected to severe water scarcity conditions, while in many parts of the EU, the drought is frequent due to low precipitation, high evaporation, and heatwaves [20]. Notably, in 2008, Lake Baratz, a closed lake situated in north Sardinia (the only natural lake on the Sardinian Island), Italy, was almost dried out due to water losses by evaporation & infiltration, and successive years of low seasonal rainfall [21].
Therefore, to mitigate the problem of water evaporation, many scientists, researchers, and engineers have studied and proposed different techniques, like to cover the water surface with Palm sheets [22], mengkuang mats, pieces of plywood, and galvanized iron corrugated sheets [23], etc., while these efforts reported having saved near about 25–60% of water. Interestingly in the USA, 96 million small high-density polyethylene (HDPE) shade balls were put in the Los Angeles reservoir to minimize water evaporation, and it has been reported that this process can reduce the evaporation by 85–90 percent [24]. The India Today newspaper reported a failed attempt made by a minister in India to save water by putting thermocol (12,000 Euros) on the water surface of the Vaigai dam in India, while the strong winds swept away these sheets within a few hours after putting them [25].
Therefore, floating photovoltaic (FPV) could be a novel way to enhance the panel’s performance with the natural cooling process and, at the same time, minimize the evaporation of valuable potable water [26]. Notably, FPV occupies only 3 GW in the total installed capacity, compared to land-based PV systems, which is more than 700 GW [27].
This review paper summarizes various cooling techniques for PV and methods for installing and cooling FPV that have been studied by researchers worldwide.
The paper is organized as follows: Section 2 underlines various PV cooling techniques. In Section 3 and Section 4, we highlight different important works on active and passive cooling, respectively. Section 5 explains FPV cooling procedures, installation schemes, and how its presence reduces evaporation. Finally, this paper concludes with concluding remarks (Section 6).
2. PV Cooling Techniques
The prime objective of every installed PV project is to optimize the cost to achieve an advantageous return on investment through performance optimization and maximization of the overall production capacity of the PV plant [28].
Therefore, to improve the overall performance of a PV system, the efficiency of each panel needs to be considered. As the PV panel’s working efficiency decreases with the increase in ambient temperature, the working PV cell/panel temperature also rises. Therefore, concerned scientists and researchers around the globe are working on various technologies to minimize the overheated PV panel’s operating temperature to be more efficient.
Broadly three methods of PV cooling processes/techniques can be found in the literature, and these can be categorized (Figure 1) into [29,30]:
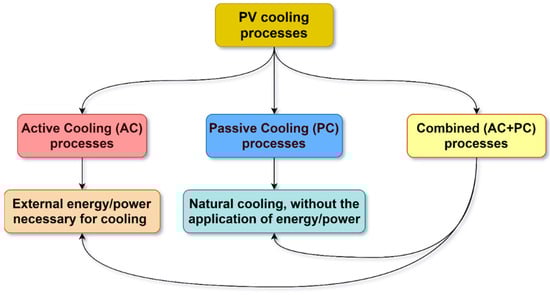
Figure 1.
Schematic diagram of various cooling processes.
- (1)
- The passive cooling process: a natural cooling process wherein no electro-mechanical techniques are necessary for cooling purposes.
- (2)
- The active cooling process: a forced cooling process where external energy is necessary to run electro-mechanical devices to cool down the PV temperature.
- (3)
- The combined (passive + active) cooling process: phenomena of both natural and forced cooling are applied to maximize the PV performance.
Figure 1 schematically represents the abovementioned three types of cooling processes. The advantages and disadvantages of these processes described above are highlighted in Table 1.

Table 1.
Pros and cons of active, passive, and combined cooling systems.
The PV cooling processes can further be characterized based on various cooling mediums or coolants used for cooling purposes like air, water, refrigerant, and Phase Change Materials (PCM) [31]. Natural air motion or forced air movement using a fan is mainly used to cool down the working temperature of the PV panel in an air-based cooling system.
In the case the liquid-based PV cooling, two types of coolants are mainly used water and liquid refrigerants like nano-fluids [32] like Boehmite, Aluminium oxide (Al2O3), Zinc oxide (ZnO), Titanium oxide (TiO2), Magnetite (Fe3O4), Silicone carbide (SiC), and copper oxide (CuO) for lowing the PV working temperature.
Notably, due to the higher heat capacity of the liquid-based coolants than that of air, the liquid-based systems are superiorly improving the overall efficiency of the subjected system compared to the active air-cooling system. This is because, at high working temperature conditions, the air cooling cannot mitigate the rising temperature efficiently; therefore, water or other liquid coolants are used as heat extraction mediums to minimize the operating temperature [33].
Another passive cooling system is the heat pipe (HP) system, and HP is a heat transfer device that uses the concept of thermal conductivity and phase change (latent enthalpy) phenomenon. The system contains fluid capable of removing heat from the source, and then the heat is transmitted to the other end of the system to the thermal energy dissipater.
The use of PCM was found to be used as mainly a passive PV cooling process [34], as well as an active PV cooling process [35]. PCM (organic, inorganic, and eutectic) mainly absorbs and releases thermal energy in a phase transition process (latent heat) while lowering the PV working temperature to enhance performance. Various types of PCM like Paraffin, RT21, RT31, RT35, RT40, RT55, OM32, OM35, PEG600, TH SL35, etc., have been reported to have been used for PV thermal management and can be found in the literature as highlighted in Sivashankar et al. [36].
In literature, coolants like air, water, refrigerants, and PCMs are used as both active, passive, and combined cooling mediums, and their applications are explained in the following sections.
3. Passive Cooling
The passive cooling process can be characterized by heat reduction or elimination from a system without using any external energy or mechanism. In this case, the cooling is achieved through natural convection and/or conduction processes, and therefore, the passive cooling method is practically relatively cheap [37].
Whereas the passive cooling process can be subdivided into:
- Air passive cooling [38]
- Water passive cooling [26,39]
- Conduction cooling (heat pipe and phase-changing material)
3.1. Air as a Cooling Medium
During this process, the temperature of the PV panels is lowered through the natural air convective process.
Mazón-Hernández et al. [38] have used natural air cooling systems to lower the PV temperature. The configuration used (Figure 2) has an air passage below the modified PV panel, and authors reported achieve improvement of power up to 7.5% due to air cooling when the air passage is comparatively larger. This cooling technique has some limitations, like the availability of natural airflow is not uniform or consistently uniform; therefore, efficiency improvement is not obtained as expected.
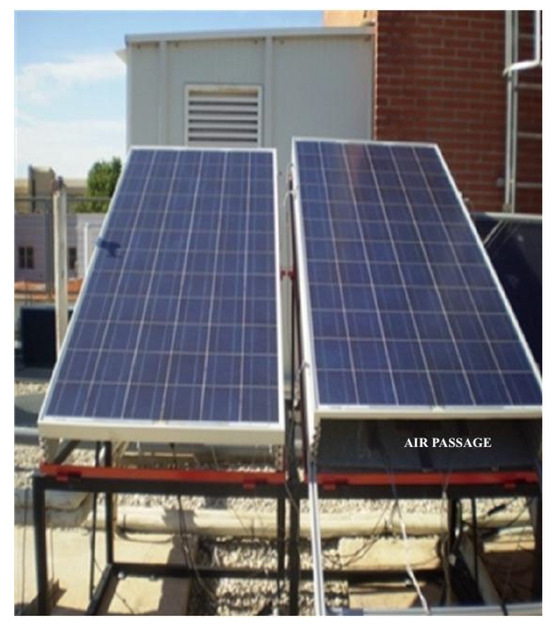
Figure 2.
Passive cooling: natural air cooling [38].
3.2. Water as a Cooling Medium
During this cooling process, the PV panels are generally put above or on water and submerged in water. In contrast, in the first case, the panels’ temperature lowers due to the natural convection cooling process. In contrast, in the second and third cases, the temperature falls due to heat transfer with water.
Rosa-Clot, M tested PV panels’ efficiency by submerging them into a pond at two different depths at 4 cm and 40 cm. The authors have observed an 11% improvement in the panel’s efficiency at a depth of 4 cm, whereas at 40 cm depth, the efficiency improvement was not significant [40].
In another study, Chandrasekar et al. [41] added aluminum heat spreaders, along with cotton wicks and headers, to cool the temperature of the PV panel by around 12%, and the efficiency increased by 14%.
Similar tests were conducted by Abdulgafar et al. [39] by submerging PV panels in distilled water and at different depths. The maximum efficiency increment of 11% has been achieved at a depth of 6 cm. At the same time, the authors have claimed that after this depth, the efficiency starts decreasing due to electrolytic reactions at the electrodes or connections of the PV panel.
Haidar et al. [42] used the evaporation cooling technique, where a piece of cloth was attached to the back of the PV panel, continuously bathed with water, and supplied with a manually controlled rubber tube. This cooling process has achieved a reduction of more than 20% and a maximum increment in electrical power of 14%.
Chandrasekar et al. [43] reported having improved efficiencies of the PV panels through passive cooling with cotton wicks and three types of coolant (water, water + Al2O3, and water + CuO) to reduce the panel’s temperatures by 30%, 17%, and 11%, respectively.
Notably, passive water cooling is a natural and cheaper process as no power input is necessary. Compared with a land-based plant, it has higher investment, and due to the proximity to the water, it can cause faster equipment degradation.
3.3. Passive Cooling with the HP System
Tang et al. [44], authors have fabricated two PV cooling systems using a micro heat pipe array. Air and water have been used in the systems as natural heat removal mediums (Figure 3). In the system with air, the authors noted temperature lowering and an increment of output power and efficiency to be 4.7 °C, 8.4%, and 2.6%, respectively. While with water, temperature and efficiency values obtained were 8 °C, 13.9%, and 3.0%, respectively.
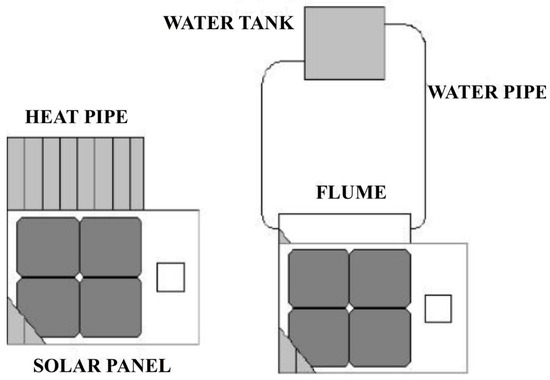
Figure 3.
HP air-cooled system and water-cooled system [44].
3.4. Phase Changing Liquid (PCL) as Cooling Medium
Habeeb et al. [45] have developed a PV/HP cooling system (Figure 4) with four thermosyphon copper HPs. In this case, the PCL is distilled water, and the evaporator filling ratio is 55%. The condenser is placed in a water box equipped with a water flow. Compared with the traditional panel, the PV/HP cooling rate and electrical efficiency increment are 15–36% and 11–14%, respectively.
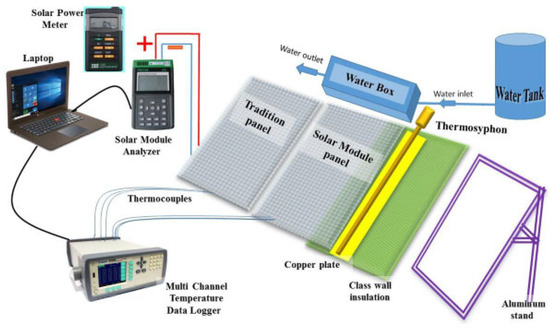
Figure 4.
Combined PV/HP cooling system [45].
Similarly, Kaneesamkandi et al. [46] also used the PV/HP cooling technique to reduce the PV temperature, but only in one thermosyphon copper HP. The working fluid used to fill the HP tube is acetone. The authors do not provide any data regarding the PV electrical efficiency improvement, but they have reported achieving the PV panel’s maximum working temperature drop of 10 °C.
3.5. PCM as Cooling Medium
Hasan et al. [34] developed the PV–PCM passive cooling system (Figure 5), in which the PV panels are integrated with an aluminum heat sink fitted internally with back-to-back vertical aluminum fins and filled with PCM. Two types of PV–PCM systems, (1) a Eutectic mixture of capric-palmitic acid (same stability of a single component, extended temperature range [47]) and (2) Salt hydrate CaCl2·6H2O, PCM2 (organic, more reliable, better for safety and environmentally friendly [48]), were used for the experiment, and the tests were conducted in two different countries. As reported by the authors, on a particular day in Dublin, the temperature dropped by 6 °C to 12 °C for the PCM type-1 system, while the temperature dropped from 9 °C to 21 °C in the PCM type-2 system in Pakistan [34]. Notably, the PV–PCM orientation influences the performance of the cooling process and overall techniques [49]. As highlighted in [50], the PCM can reduce the PV temperature as well as provide an option for energy storage. Also, the authors have highlighted some limitations of the PV–PCM cooling system, like low thermal conductivity, subcooling, convection suppuration from the back of the panel, availability, and cost.
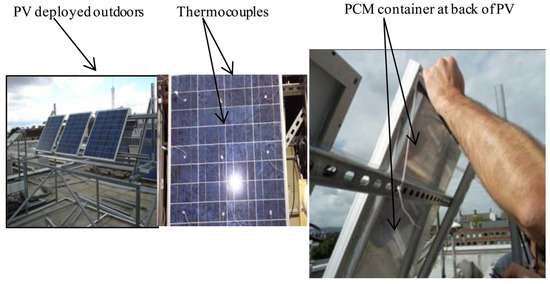
Figure 5.
Aluminum fins and PCM are placed behind the solar panel [34].
Hassan A et al. [35] reported the performance of a passive cooling PV-PCM system, where RT-35HC, an organic paraffin, was used as PCM at the back of the panel under observation (Figure 6). During the cooling process, temperature drop and efficiency increment of 11.9 °C and 9.1%, respectively, were obtained.
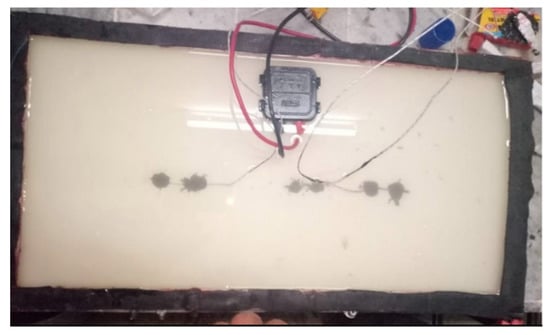
Figure 6.
Molten PCM is placed behind the solar panel [35].
Karthick et al. [51] used binary eutectic PCM (Sodium Sulfate Decahydrate “Na2SO4⋅10H2O” + Zinc Nitrate Hexahydrate “N2O6Zn⋅6H2O”) or passive cooling of the semi-transparent PV system. They compared it with the reference semi-transparent PV system and observed a maximum 12 °C temperature reduction and approximately 3 kW/h more output power generation.
Many researchers have done numerical studies to evaluate the passive PCM cooling process. Similarly, Singh et al. [52] have studied the passive cooling of the PV system with PCM with two different system configurations of PCM aluminum container and without fin (Figure 7). The authors improved electricity generation by 7% and 8% for PCM and finned PCM systems due to lowering the PV temperature. The authors have conducted these studies to evaluate the potentiality of the passive PCM cooling processes (without and with fin) to reduce the PV panels’ working temperature, and to improve the PV panel’s efficiency and overall energy production.
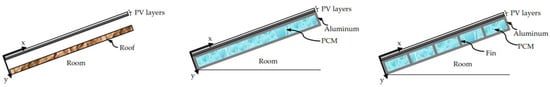
Figure 7.
PCM container with and without fins [52].
3.6. Phase Change Liquid and PCM
Interestingly Diallo et al. [53] designed an innovative photovoltaic thermal (PVT) loop HP and PCM cooling system (Figure 8). Here the refrigerant R-134a has been used in the HP loop to remove the PV temperature, and this heat has been exchanged with the running water, while PCM has been used to store the extra heat. The thermal and electrical efficiencies are measured, whereas the overall efficiency achieved is 28% higher than a conventional system.
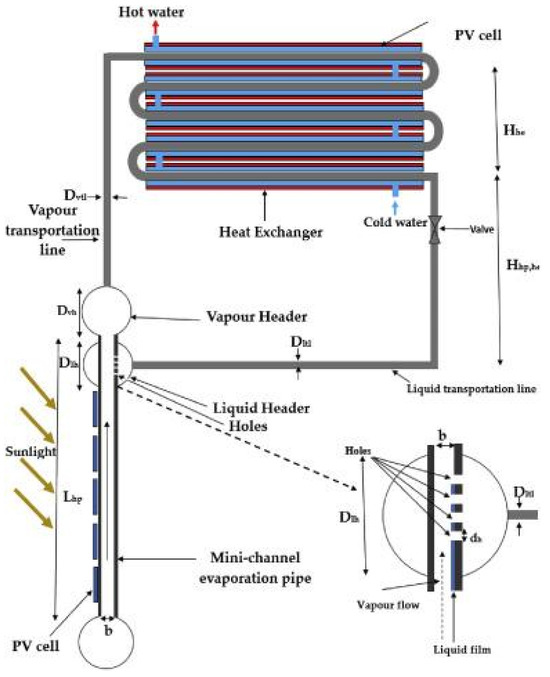
Figure 8.
PVT system with phase change liquid (PCL) and phase change material (PCM) [53].
4. Active Cooling
In the active cooling process, external energy is necessary to power the auxiliary cooling systems. The active cooling techniques predominantly found in the literature are active water cooling [33] and active air cooling systems [38]. They can be defined as a forced-cooling process and external energy necessary to power pumps, fans, etc., during the cooling operations.
4.1. Air as Cooling Medium
In this scheme, the air is forcefully channeled to the PV system. Notably, the performance of these types of systems is much higher than that of natural cooling systems. Several design concepts have been illustrated by researchers concerning airflow patterns in addition to the presence of front glazing to achieve optimum performance of PV modules [33].
Figure 9 demonstrates a forced convection configuration, using a fan underneath the PV panel through an air channel [38]. The authors studied the performance of the PV panel at three different forced air velocities (2 m/s, 3 m/s, and 4 m/s) and achieved an increment of 15% in electrical power while the panel temperature decreased by about 15 °C at the maximum value of air velocity.
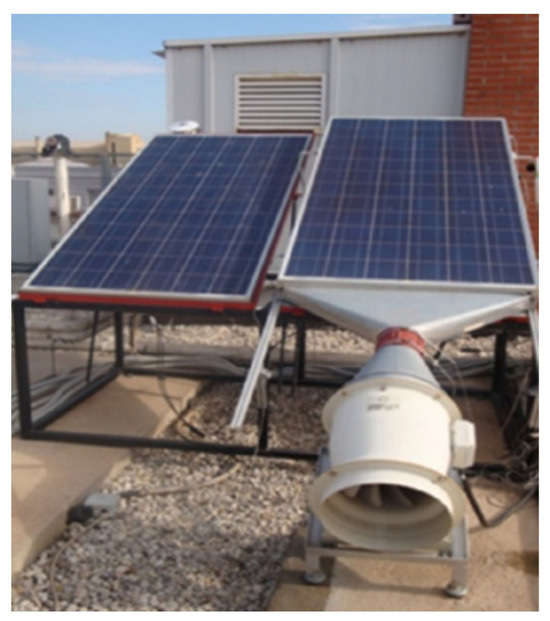
Figure 9.
Active air-cooling using a fan [38].
Choi and Choi [54] constructed an innovative PV/T system with a single-pass double-flow channel and a non-uniform transverse rib, which uses air as a coolant (Figure 10). This system improved with the air mass flow increment, considering thermal and electrical efficiency from 35.2–56.72% and 14.23–14.81%, respectively.
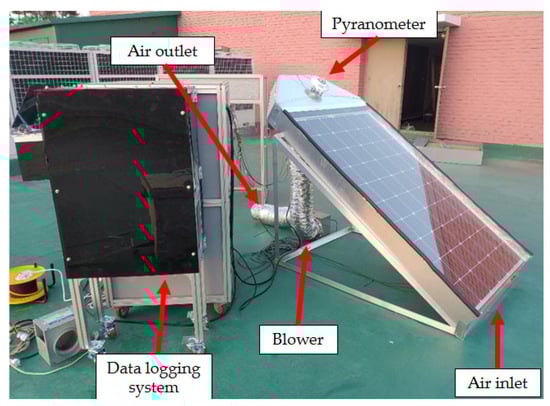
Figure 10.
Active cooling: PV/T air cooling system [54].
Bijjargi et al. [33] highlighted that the active air cooling systems are not satisfactory due to the air’s low density and small heat capacity.
4.2. Water and Other Liquid as Cooling Medium
Notably, Tabaei et al. [55] have studied a PV system coupled with a booster reflector and equipped with a water pump system to cool the PV system with front water cooling (Figure 11). Due to active water cooling, the authors found an improvement in power output of about 42%.
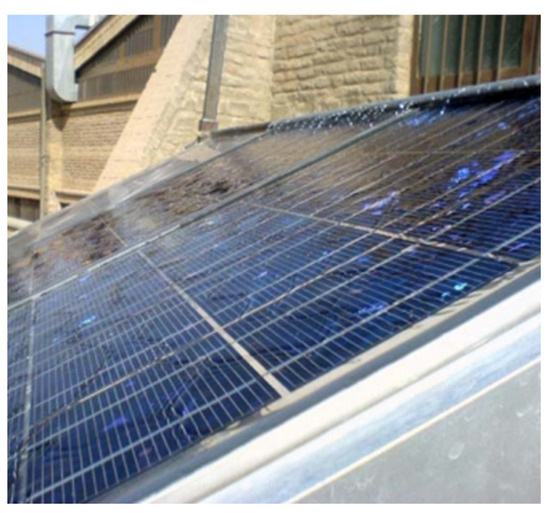
Figure 11.
Active front water cooling [55].
Similarly, Dorobantu and Popescu [56] achieved an electrical yield of about 9.5% by cooling the PV front surface using a thin film of water.
While Hachicha et al. [57] conducted an experiment to analyze three cooling processes. The authors found that due to back, front, and double-side cooling, a reduction in the temperature of the PV panel of 11%, 2%, and 18%, respectively, was achieved when compared with the panel with the cooling system. While efficiency increments of 3.6% and 4% for front cooling and double cooling, respectively.
Ueda Y et al. [58] studied two FPV systems with the same characteristics, of which one was equipped with a forced cooling system. Reservoir water was sprinkled over the PV at an interval of every 10 min. The results demonstrate that a maximum temperature drop and increased electric power generation of 20 °C and 6.8 kWh, respectively, have been achieved due to the cooling effect.
Moharram et al. [15] sprayed water using nozzles placed on the upper part of the PV panel. The system operated for 5 min to spray water; consequently, the panel temperature decreased by 10 °C, while efficiency increased by 12.5%.
Figure 12 shows an active cooling configuration, where the authors placed three water spraying nozzles on top of the PV panel [31]. The system was sprinkled with water with an on-off mode mechanism (30 s on and 180 off), and due to this cooling process, the temperature drop was reported up to 24 °C, and an efficiency increment observed was about 2%.
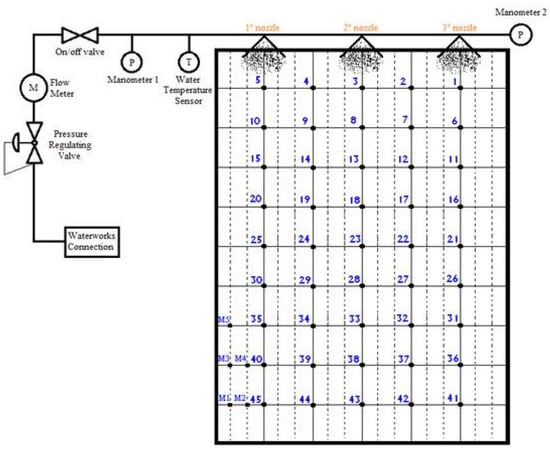
Figure 12.
Active cooling: front water spraying. The numbers refer to the temperature sensor’s name and position on the PV panel, P—pressure gauge, M—flow meter, T—water temperature sensor [31].
Zilli et al. [59] studied the performance of the PV panel equipped with water sprinklers at the back of the panel (Figure 13). The authors used an underwater running pipe to achieve a minimum temperature for the coolant. The sprinklers were manually controlled with a flow limit of 1.3 L/min. They reported an efficiency improvement between 9.09% to 12.17% and power production between 8.48% to 12.26%, depending on the available irradiance.
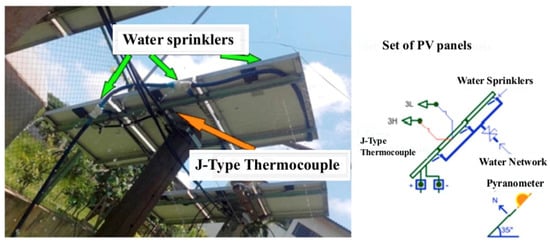
Figure 13.
Active cooling: backwater spraying [59].
Nizetic S. et al. [60] have proposed and studied the PV cooling technique, where the system was equipped with top and bottom faces water sprayers (Figure 14). The authors measured the panel temperature about 30 °C lower for panels subjected to both side cooling and when compared with the not-cooled PV panel. The electric power produced and efficiency increased by 16.3% (effective 7.7%) and 14.1% (effective 5.9%), respectively. Interestingly authors have highlighted that the front-cooling and double-face-cooling systems are more efficient than the back-cooling system.
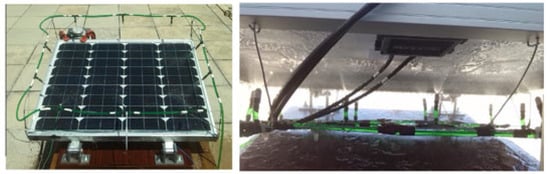
Figure 14.
Active cooling: front and back water cooling [60].
Sargunanathan et al. [61] applied active back and front cooling by spraying and running water on respective surfaces (Figure 15). Improvement in power generation and efficiency 10.70 W and 8.78% for the back cooling, 18.48 W and 15.28% for the front cooling, and 20.56 W and 16.90% for the back + front cooling, with respect to reference PV panel. Whereas reduction in operating temperature of 15.52 °C on average and 18.60 °C maximum for the back cooling, 24.29 °C on average and 28.70 °C maximum for the front cooling, and 15.52 °C on average and 18.6 °C maximum for the back + front cooling, have been observed when compared with reference panel.
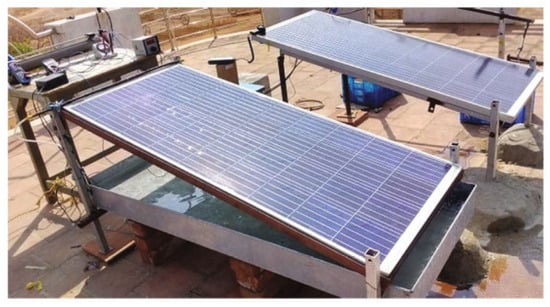
Figure 15.
Active cooling: front and back water cooling of a rooftop plant [61].
Hosseini et al. [62] studied the behavior of a combined photovoltaic/thermal (PV/T) system equipped with a pump system and a heat exchanger. Film of water was passed over the PV panel during this process, some of the water evaporated and was mainly responsible for cooling down the PV panel (Figure 16). The rest of the water-absorbed heat passes through the heat exchanger, where heat is removed. Considering both electrical and thermal energy production, the overall system was more efficient for the combined system.
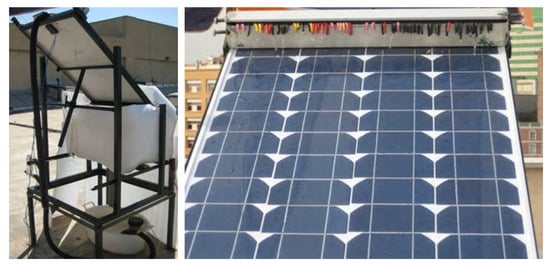
Figure 16.
Active cooling: PV/T front cooling system [62].
Two (PV/T) systems were realized, and their performances were studied by Sathyamurthy et al. [63]. One uses water, while another uses CNT/Al2O3 hybrid nanoparticles (Figure 17) as coolant materials to reduce the PV cells working temperature. Authors reported using a spiral collector to achieve a better heat transfer rate. The application of water and nanoparticles improves the electrical efficiency of the systems. The nano-fluid proved to be the better performer as a coolant, and the overall efficiency improvement is equal to 27.3% compared with the water-based system.
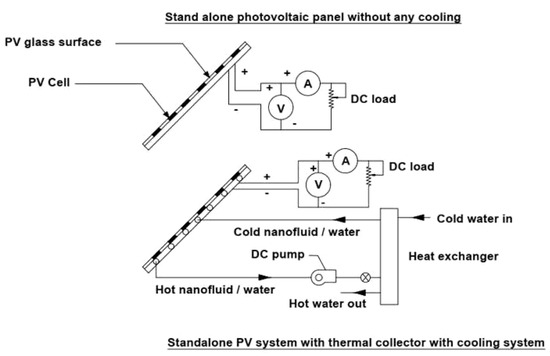
Figure 17.
Active cooling: (PV/T) systems with water and nanoparticles as coolants [63].
4.3. PCM as Cooling Medium
Hassan A et al. [35] have studied two active cooling PCM systems with serpentine (Figure 18) PCM containers. In case 1- “PVT-PCM + water” system, temperature drop and efficiency increment of 16.1 °C and 22.7%, respectively, have been observed. In case 2, the authors studied the “PVT-PCM + nanofluid” system and reported a temperature drop of 23.9 °C and an efficiency increment of 23.9%. While comparing thermal efficiency, the nanofluid is a better performer with 17% higher thermal efficiency than the water-based system.
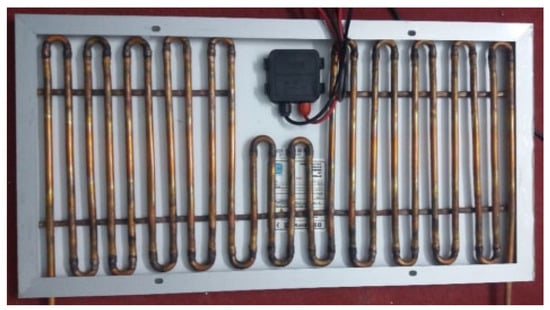
Figure 18.
Active cooling: PCM as a cooling medium [35].
4.4. Thermoelectric Cooling
Thermoelectric cooling (TEC), also known as Peltier cooling, has often been used to cool PV panels’ working temperature. The PV/TEC system combination works as a single unit to transform solar energy into electrical energy [64].
Benghanem et al. 2015 [16] tested the performance of a PV panel when subjected to thermoelectric module (TEM) cooling (Figure 19a). In comparison, they have proposed a solar-driven PV/TEM cooling configuration (Figure 19b), where a separate PV panel powers the TEMs placed behind solar panels. They reported an increment of 0.5% in panel efficiency for every (°C) drop in cell temperature.
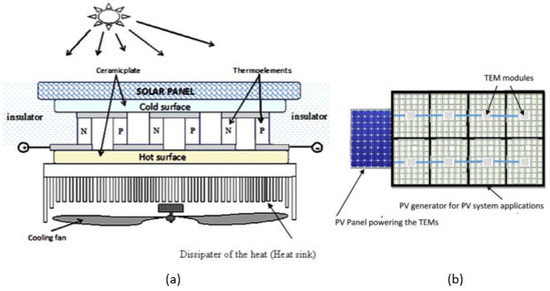
Figure 19.
(a) PV/TEM cooling, and (b) Combined PV/TEM system [16].
Notably, the active cooling methods have many known advantages and disadvantages, which are highlighted in Table 2.
Table 2.
Pros and cons of active cooling methods.
5. Floating PV Cooling Procedures and Evaporation Reduction Evaluation
The FPV systems have become a proven success and have been designed, developed, and installed worldwide. As reported in Offshore Engineer magazine, there is about 2 GW global installed capacity of FPV, which can be found in 2020 [69]. According to the research of Wook Mackenzie, FPV installation capacity will rise to 6 GW [70]; notably, China and India will be the leaders.
The idea to build PV plants over water bodies was mainly born from the desire to overcome the significant social and technical cons related to ground-based PV plants, of which a few critical problems could be highlighted:
- (i)
- Lack of availability of projectable land: Many PV floating projects were built on the waterbody because of a shortage of cultivable lands. As done in the Napa Valley Project in the USA [71].
- (ii)
- Natural Disaster: Earthquakes or tsunamis can potentially destroy any traditional power plant (like the Fukushima Daiichi Accident/nuclear disaster, Japan WNA 2023) and bring havoc to humankind. Notably, green energy sources reduce risks, and interestingly, in the last few years, Japan has had FPV installed to transform its water bodies into energy production fields [72].
- (iii)
- Problem of water evaporation: With the application of FPV on water bodies, it is possible to reduce the loss of water (also potable) due to evaporation [26].
- (iv)
- Negative temperature coefficient: Notably, the efficiency of PV panels decreases with the rise of its operation temperature [15].
Many installation technologies have been experimented with and used for mounting FPV systems; mainly, these can be categorized based on the kind of floats and panels used and already have been mentioned in Sahu et al. [73].
A PV panel(s) can be placed over or on water bodies in many ways, as shown in Figure 20.
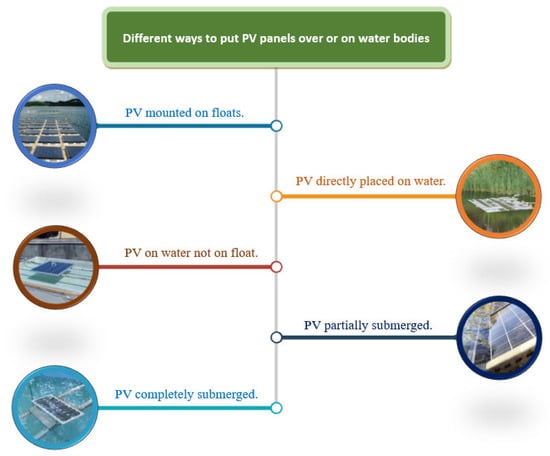
Figure 20.
Passive cooling schemes: PV placed over or on water bodies.
Notably, there are many significant advantages of FPV or putting solar PV panels on or over water surfaces, as reported below:
- (a)
- Increase of panel efficiency and overall production efficiency: The panel’s negative temperature coefficient or the rise in operational temperature of a PV panel can be reduced or checked under control by passive water cooling [26] or through active cooling by spring water on the hot panel.
- (b)
- Water evaporation reduction: Because of the shadowing effect, the water evaporation reduces; thus, water losses can be checked, and the precious water can be used for local use. Majumder et al. [26] reported 30% of water evaporation reduction by covering 17% of the total water surface area.
- (c)
- Dual positive effect: The panel’s efficiency improves; therefore, the electricity production increases, whereas the water evaporation also reduces [26].
- (d)
- Agricultural less land use: By putting solar panels on or over unused water bodies, reservoirs, lakes, water treatment plant reservoirs, and agricultural reservoirs, it is possible to minimize the use of the precious land needed for agriculture or other crucial human use. FPV could be ideal for those countries which are smaller in size and have agriculturally based economies [74].
- (e)
- Early morning production: According to (NRG 2010), due to the mitigation effect, the panels start producing earlier in the winter season. Particularly during winter, the panels (the plant) start producing earlier because the panels defrost 1 h before than in normal conditions.
- (f)
- Water Quality improvement: It has been claimed [73] that water quality improves due to photosynthesis and algae growth reduction.
- (g)
- Reduction in deforestation: By minimizing the PV plants’ land use [73].
- (h)
- CO2 reduction: Some case studies have shown that FPV encourages carbon dioxide reduction [75].
5.1. FPV Efficiency Increment
One can achieve the efficiency of the FPV panels or the system as a whole through passive and/or active cooling. For an FPV system, water in the water bodies is used as a cooling medium, while the same water body acts as a heat sink. Many FPV installation procedures are reported in the literature, with different types of floats and structures used, with various PV panel tilt angles, and, most interestingly, the way of putting/placing PV panels (as shown in Figure 20).
5.1.1. PV Mounted on Floats
Notably, the first FPV system was installed on the “Aichi ike” balancing reservoir in Japan [58]. The authors built two FPV systems and prepared the floats with foamed polystyrene boards and plastic connectors. The panels of the FPV system were placed with a tilt angle of 1.3°, while the panels in the case of the land-based system (Figure 21) have a tilt angle much greater than the FPV system. One of the FPV plants was equipped with an active cooling system, and water was sprayed at an interval of 10 min for 1 min (from morning 8:00–17:00). As highlighted, the FPV systems received 15% less total radiation to the ground-mounted plant. Interestingly in the summer months (May, June, and August), both FPV plants showed better performance than the land-based plant, while August is the only exception for FPV without active cooling. During the total experimental period, the FPV with an active cooling system had a higher yield than the F PV subjected to passive cooling. Notably, in August 2007, the maximum temperature drop of 25 °C was noticed due to water cooling. The generated electric power obtained was 6.8 kWh more for the water-cooled system when compared with the not-cooled system.
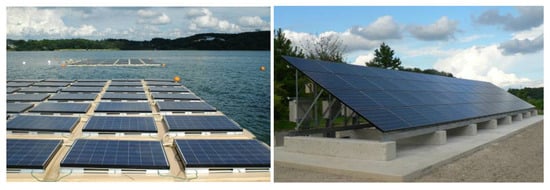
Figure 21.
FPV versus land-based system. Reproduced with permission from [58].
An Italian company NRG Island claimed that their design and technology of the FPV plant (Figure 22) could produce an estimated amount of 5–20% more electricity during summer than that of a ground-mounted plant. This is due to the cooling effect, as the panels have lower working temperatures. Another advantage, as reported by the company, is that during winter, in the FPV, the panels start producing electricity early as they defrost (Italian condition) about 1 h before the panels are installed in normal condition (ground-mounted or roof-top), Therefore, both in summer as well as in winter, the increase in the PV efficiency can be noticed [76].
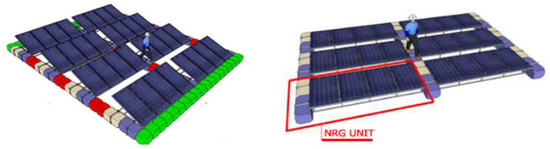
Figure 22.
FPV installation scheme developed by NRG Island company in 2010 [76].
Figure 23 presents an FPV with an aluminum heat sink [77]. PVC pipes were used to build a float, and the PV panel was placed on it. The heat transfer mechanism was constructed using nine hollow square aluminum blocks, and they were attached under the PV panel with adhesive material. The aluminum block and adhesive material used are good conductors of heat. Notably, the aluminum is non-corrosive. The authors tested three different solar radiation ranges for the PV system placed on water. They reported temperature drop and efficiency increment in the range of 1.2–4.0 °C and 0.15–0.19%, 1.4–5.5 °C and 0.05–0.18%, and 1.8–5.6 °C and 0.59–0.76% when the FPV system subjected under 417 W/m2, 667 W/m2 and 834 W/m2 solar radiation for a time interval of 15–60 min. The percentage of power and efficiency increased by 3.61%, 3.79%, 2.88%, 2.82%, and 14.55% and 14.58%, respectively, at previously mentioned solar radiations.
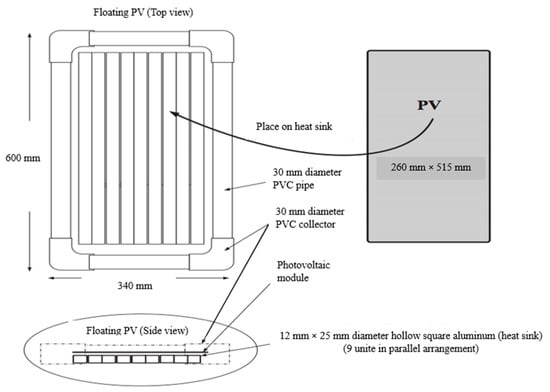
Figure 23.
FPV with an aluminum heat sink [77].
The same research group [78] conducted a similar experiment; however, the floating structure, the aluminum heat sink, and the PV panel size were bigger than their previous work. The authors found about a 15.5% increase in the produced energy for the two-hour test. Notably, the optimum temperature drop of 25 °C was observed with the radiation of 1000 W/m2, while there was a 0.49% drop in efficiency with the increase of 1 °C.
Innovative floating tracking cooling concentrating (FTCC) systems studied by Cazzaniga et al. [79], reported an increase in the annual energy yield by over 30% compared to a land-based system.
Choi 2014 [80] compared the performance of two FPV plants (100 kW and 500 kW) with a ground stand-alone plant (1 MW). For both FPV systems, the PV tilt angle was 33°, while the tilt angle of the ground plant was 30° but all with similar radiation and ambient temperature conditions. As highlighted, the FPV system has shown 11% better generation efficiency than the overland PV system; notably, this performance improvement was due to the passive water-cooling effect, which helped lower the PV working temperature (Figure 24).
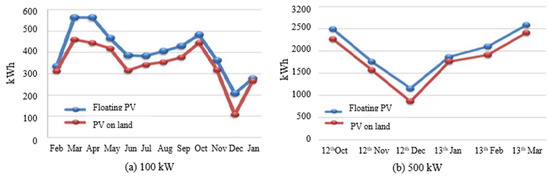
Figure 24.
FPV plants energy production gain due to passive water cooling [80].
The performance of the FPV system (Figure 25) has been compared with a land-based PV system by Lee et al. [81]. The authors used pultruded fiber-reinforced polymeric plastic (PFRP) to build the structural parts. Direct comparison between these two systems has demonstrated an energy increment of approximately 25%.
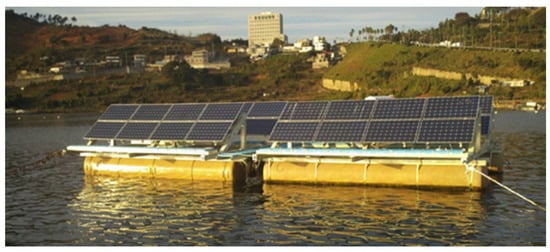
Figure 25.
PV panels mounted on fiber-reinforced polymeric plastic structures placed on a floating system [81].
A tracking FPV (100 kW) has been designed and fabricated by Yoo et al. [82]. The performance of the tracking FPV has been evaluated by comparing it with a land-based system (100 kW), and about 11.97 MWh more energy was produced by the tracking FPV.
Yadav et al. [83] constructed an FPV system and compared its performance with a land-based system. The PV panels were subjected to a solar intensity between 125–945 W/m2. The generating efficiency of the FPV system is about 0.79% when compared with a land-based system.
Durković et al. [84] have proposed a solution by tracking FPV to generate electricity for a nearby aluminum plant. The proposal for tracking sun azimuth and reflectors enables the system to have about 27.68% (FPV) + 4.32% (reflector) more energy production.
Kamuyu et al. [85] compared the FPV and rooftop systems. They reported the FPV system could produce more energy by about 21% annually, notably when module temperatures of both systems are below 40 °C.
5.1.2. PV Directly Placed on Water
Figure 26 presents another innovative type of FPV system without any metallic structure [86]. Interestingly, in this case, the water body has been performed as a heat sink; as highlighted by the authors, no improvement in terms of output was noted.
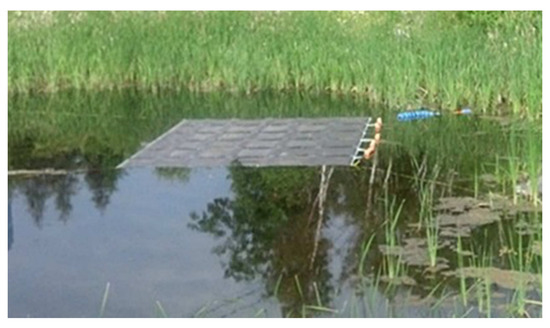
Figure 26.
Innovative PV system on the water surface [86].
5.1.3. PV on Water but Not Float
While Majumder et al. [26] have studied the performance of PV panels by placing the panel above water, Figure 27 presents the PV installation scheme. Notably, the air between the water surface and the panel helped cool down the temperature of the panel. Due to the natural water-cooling process, a relative improvement in efficiency of 17% has been reported.
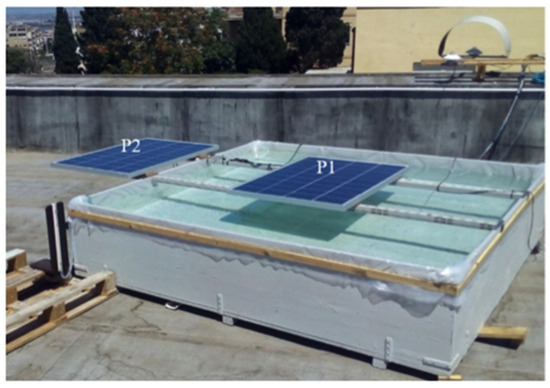
Figure 27.
PV panel P1 placed above the water, and panel P2 placed at ambient condition [26].
Sutanto et al. [87] performed the experiment on two sets of FPV systems, one equipped with a thermosiphon cooling mechanism (Figure 28). They found the efficiency increment of the FPV and FPV with thermosiphon systems to be equal to 4.52% and 7.86%, respectively.
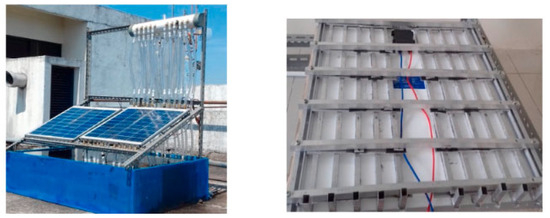
Figure 28.
PV on water equipped with thermosiphon cooling mechanism proposed by [87].
Figure 29 depicts an FPV system that increased its efficiency by 20–28% due to water cooling [88]. Due to the cooling effect, PV front and back temperatures decreased by 2% to 4% and 5% to 11%, respectively.
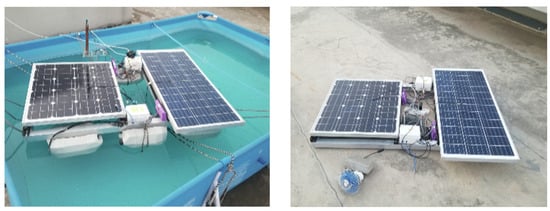
Figure 29.
FPV system versus land-based PV system by [88].
5.1.4. PV Partially Submerged
An important example of combined (active and passive) FPV cooling (Figure 30) was provided by Elminshawy et al. [29], where the wind condition was simulated using a fan. The performance of normal FPV and partially submerged (10% inside water is the submerged ratio) FPV have been evaluated. The authors measured when partially submerged FPV was subjected to various wind speed conditions. The partially submerged (10%) FPV was found to be 11% more efficient when compared with normal FPV. Also, its output power rose with the increase in wind speed, i.e., 20.28% at 15 km/h.
Figure 30.
Passive and active cooling of the FPV system [29].
Elminshawy et al. [89] studied three FPV panels: the reference normal FPV, another submerged FPV, and the last submerged-finned FPV. The aluminum U-shaped fins were attached at the back of the third panel (Figure 31) to act as a passive heat sink, and by submerging 20% of the PV panel inside water, the operating temperature, and the electrical efficiency of it found to be equal to 19.07% and 24.02%, respectively.
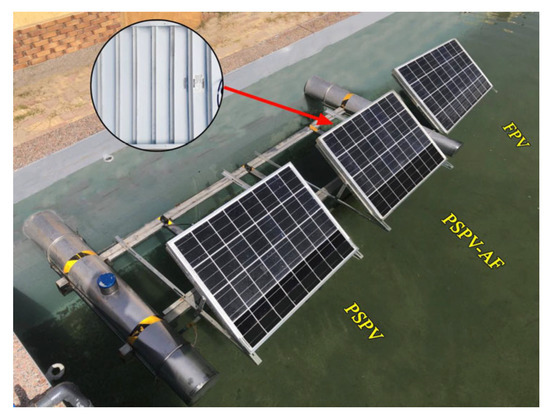
Figure 31.
Partially submerged FPV [89].
Elminshawy et al. [90] studied a partially submerged FPV system (Figure 32). During this campaign, 4%, 12%, and 24% of the PV panels were submerged in water. The reference ground-mounted FPV panels were mounted with a tilt angle of 25°. Results showed that the partially-submerged-FPV system performs better with a 12% submerged ratio for efficiency increment and PV operating temperature reduction. Due to the passive cooling effect, the electricity production and efficiency improved to the ground-mounted panel by 27.31% and 12.20%, respectively.
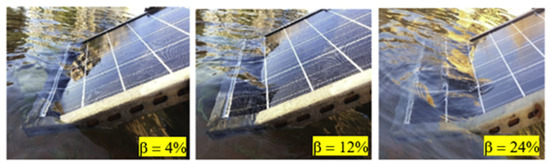
Figure 32.
Partially submerged FPV proposed by [90].
A partially-submerged-FPV system was studied by Elminshawy et al. [91]; however, in this case, the ground-based PV and partially submerged FPV panels were placed at 15° tilt angle, while the PV submerged percentages were chosen as 5%, 10%, and 20% respectively. The authors reported that the partially submerged FPV working temperature reduced approx. 7.9 °C to 10.5 °C when the submerged ratio changed from 5% to 20%, the efficiency gain was reported at 15.6%, 28.4%, and 8.20% at submerged ratios of 5%, 10% and 20%, respectively.
5.1.5. PV Completely Submerged
The performance of a submerged PV system (Figure 33) has been studied by Lanzafame et al. [92]. The authors submerged the PV panels (technologies crystalline and thin film) inside water up to 50 cm; at this maximum depth, power production was reduced by 20% and 10%, respectively, for both technologies. At the same time, authors have reported that efficiency improvements were observed from 10% to 20% of PV panels submerged in shallow water.
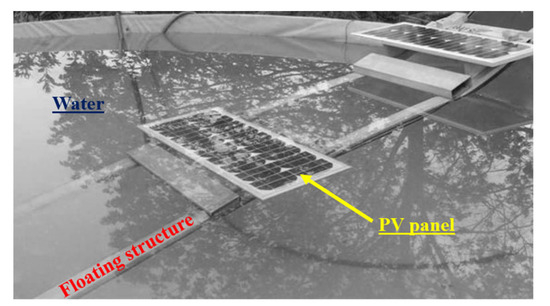
Figure 33.
Completely submerged PV panel.
5.1.6. Mathematical Model
A mathematical model was developed by Tina et al. [93] to evaluate the performance of bifacial and monoracial PV modules installed on the water surface. The model was validated using the experimental data. The authors reported that the production due to passive and active cooling was 3% and 9.7% more for bifacial systems, while 2.6% and 9.5% for monofacial systems, respectively.
A study has been conducted by Liu et al. [94], and the finite element model has demonstrated a difference of 3.5 °C in operating temperature between the FPV cell and a land-based cell. While the probability of efficiency increment of the FPV system is around 1.58–2.00% when compared with the land-based system.
While Sukarno and Kim [95] measured the local temperature trends in four locations of a lake (two in the lake, ground, and dam structure), the authors used this to predict the efficiency and yearly yield of the FPV system. They found the FPV efficiency to be 6.08% higher than the ground-based system.
5.2. FPV Evaporation Reduction
Water evaporation is one of the reasons why scientists, researchers, and various private and public agencies have started studying and analyzing the possibilities of putting PV panels on water bodies. Water evaporation can be minimized significantly when the panels are directly placed on or over the water bodies. Of course, the reduction value is directly proportional to the area covered by the PV system.
In most cases, the impact of the FPV on the evaporation rate has been estimated by calculating the value. Notably, Santos et al. [96] various models like the Penman-Monteith model, Hargreaves–Samani model, Valiantzas model, Linacre (1993) and Linacre (1977) models to estimate the water evaporation and, details about these methods can be found in [97,98,99,100], respectively.
On the other hand, very little information or experimental data is available in the literature related to water evaporation.
Table 3 presents various studies conducted experimentally and analytically to evaluate the water evaporation reduction from the water basin when the water’s surface or water body is covered with PV system(s).
Table 3.
Evaporation reduction due to FPV system application.
6. Conclusions
This review article focuses mainly on various PV and FPV cooling methods and the use and advantages of FPV plants, primarily covering the arguments for the efficiency augmentation and reduction of water evaporation due to installing PV systems on the water bodies. Therefore, FPV installation techniques could mitigate dual challenges today the world is facing, mainly energy and water poverty.
The working temperature of every individual PV panel influences the overall efficiency of a PV system. Therefore, active, passive, or combined cooling processes can help reduce the panel working temperature to enhance the efficiency of the PV panel and the system as a whole.
Many procedures are mentioned in the literature for PV cooling, while either passive or active cooling processes are mainly used for this purpose. A combined (passive or active) approach has also been used in some cases.
There are five ways PV panels can be placed in, on, or over water surfaces, and generally, these types of systems are nominated as FPV systems. There are many notable advantages of the FPV system, which have already been mentioned. In particular, two prime advantages of FPV installation are worth mentioning (1) improvement in the efficiency of the PV panel, therefore enhanced energy productivity, and (2) water evaporation reduction due to covering of water surface.
In passive cooling, the efficiency improvement mainly occurs due to the passive cooling effect of the water below the panels. In contrast, active cooling processes like water spraying can be combined to further reduce panel temperature and enhance PV and FPV system performance. The maximum efficiency improvement of the PV panel can reach up to 30% by partially submerging the PV panel, while water evaporation can reduce more than 60%/year by covering about 50% of the water body. Today, many parts of the world are facing drought-like situations due to the direct and indirect effects of climate change. Notably, shortened rainy periods and evaporation of potable water from water bodies during hot summer months have triggered a cumulative impact to cause water scarcity. Therefore, the results in the literature are enthusiastic and encourage applying the FPV system for green energy production. The implementation of FPV is widespread, but active cooling is rarely utilized. While FPV with cooling can enhance energy production, its high installation cost and limitations hinder commercialization.
Author Contributions
Conceptualization: A.M., R.I., R.B. and G.G.; methodology: A.M., A.K., R.I., C.C.M. and R.B.; validation: A.M. and A.K.; formal analysis: A.M., A.K., R.I. and G.C.; investigation, A.M.; resources, G.G.; data curation, A.M., A.K., C.C.M. and G.G.; writing—original draft preparation: A.M.; writing—review and editing: A.M., A.K., C.C.M., G.C., R.B. and G.G. All authors have read and agreed to the published version of the manuscript.
Funding
This study was carried out within the “e.INS—Ecosystem of Innovation for Next Generation Sardinia” funded by the Italian Ministry of University and Research under the Next-Generation EU Programme (National Recovery and Resilience Plan—PNRR, M4C2, INVESTMENT 1.5—DD 1056 of 23 June 2022, ECS00000038), and under the National Recovery and Resilience Plan (NRRP), of Italian Ministry of University and Research under the Next-Generation EU Programme, Project code CN00000023, DD 1033 of 17 June 2022, CUP F23C22000360001, “Sustainable Mobility Center” (CNMS).
Data Availability Statement
Data sharing not applicable.
Acknowledgments
This article is dedicated to Roberto Innamorati who made significant contributions to this work but passed away before its completion. He will always be remembered for his decisive contribution and valuable insights. The authors thank Andrea Vincis (University of Cagliari) and Michele Losito (University of Cagliari) for administrative and technical support.
Conflicts of Interest
The authors declare no conflict of interest.
References
- Majumder, A.; Achenza, M.; Mastino, C.C.; Baccoli, R.; Frattolillo, A. Thermo-acoustic building insulation materials fabricated with recycled fibers—Jute, Wool and Loofah. Energy Build. 2023, 293, 113211. [Google Scholar] [CrossRef]
- IEA. Renewables. 2022. Available online: https://www.iea.org/reports/renewable-electricity (accessed on 27 June 2023).
- EEA. Water Scarcity Conditions in Europe (Water Exploitation Index Plus) (8th EAP). Available online: https://www.eea.europa.eu/ims/use-of-freshwater-resources-in-europe-1 (accessed on 4 August 2023).
- IEA. World Energy Balances: Overview. Available online: https://www.iea.org/reports/world-energy-balances-overview/world (accessed on 2 October 2023).
- IEA. CO2 Emissions in 2022. Available online: https://www.iea.org/reports/co2-emissions-in-2022 (accessed on 15 October 2023).
- GE—The Global Economy.Com, Rural Population, Percent—Country Rankings, World Bank. 2021. Available online: https://www.theglobaleconomy.com/rankings/rural_population_percent/ (accessed on 18 October 2023).
- UNDP. Housing and Living Conditions. Available online: https://www.teamstoendpoverty.org/wq_pages/en/visages/logement.php (accessed on 18 October 2023).
- IEA. For the First Time in Decades, the Number of People without Access to Electricity is Set to Increase in 2022. 2022. Available online: https://www.iea.org/commentaries/for-the-first-time-in-decades-the-number-of-people-without-access-to-electricity-is-set-to-increase-in-2022 (accessed on 18 October 2023).
- WV World Vision. Global Water Crisis: Facts, FAQs, and How to Help. Available online: https://www.worldvision.org/clean-water-news-stories/global-water-crisis-facts (accessed on 18 October 2023).
- UN World Could Face Water Availability Shortfall by 2030 If Current Trends Continue, Secretary-General Warns at Meeting of High-Level Panel. Available online: https://press.un.org/en/2016/sgsm18114.doc.htm (accessed on 18 October 2023).
- Santhosh, P.; Kathiravan, G.; Jayaram, M.; Deepanraj, M.; Ajhai Kumar, L.; Devipriya, N. IoT Based Supervisory and Diagnosis System for Solar Farm. In Proceedings of the 2023 9th International Conference on Advanced Computing and Communication Systems (ICACCS), Coimbatore, India, 17–18 March 2023; pp. 914–918. [Google Scholar]
- Ramasamy, S.; Baccoli, R.; Meo, S.; Gatto, G.; Kumar, A. Neutral Point Clamped Non-Isolated Three Phase Grid-Integrated PV Inverter Topologies for Leakage Current Reduction. Int. Rev. Electr. Eng. (IREE) 2023, 18, 88. [Google Scholar] [CrossRef]
- Popovici, C.G.; Hudişteanu, S.V.; Mateescu, T.D.; Cherecheş, N.-C. Efficiency Improvement of Photovoltaic Panels by Using Air Cooled Heat Sinks. Energy Procedia 2016, 85, 425–432. [Google Scholar] [CrossRef]
- Dubey, S.; Sarvaiya, J.N.; Seshadri, B. Temperature Dependent Photovoltaic (PV) Efficiency and Its Effect on PV Production in the World—A Review. Energy Procedia 2013, 33, 311–321. [Google Scholar] [CrossRef]
- Moharram, K.A.; Abd-Elhady, M.S.; Kandil, H.A.; El-Sherif, H. Enhancing the performance of photovoltaic panels by water cooling. Ain Shams Eng. J. 2013, 4, 869–877. [Google Scholar] [CrossRef]
- Benghanem, M.; Al-Mashraqi, A.A.; Daffallah, K.O. Performance of solar cells using thermoelectric module in hot sites. Renew. Energy 2016, 89, 51–59. [Google Scholar] [CrossRef]
- Ramasamy, S.; Gatto, G.; Kumar, A. Various Non-Isolated Three Phase grid-integrated PV Inverter Topologies for Leakage Current Reduction—A simulation-based study. In Proceedings of the 2022 IEEE International Power and Renewable Energy Conference (IPRECON), Kollam, India, 16–18 December 2022; pp. 1–6. [Google Scholar]
- Santhosh, P.; Singh, A.K.S.; Ajay, M.; Gaayathry, K.; Haran, H.S.; Gowtham, S. IoT based Monitoring and Optimizing of Energy Utilization of Domestic and Industrial Loads. In Proceedings of the 2021 5th International Conference on Intelligent Computing and Control Systems (ICICCS), Madurai, India, 6–8 May 2021; pp. 393–397. [Google Scholar]
- Baccoli, R.; Kumar, A.; Frattolillo, A.; Mastino, C.; Ghiani, E.; Gatto, G. Enhancing energy production in a PV collector—Reflector system supervised by an optimization model: Experimental analysis and validation. Energy Convers. Manag. 2021, 229, 113774. [Google Scholar] [CrossRef]
- EEA-Europe Drought Impact on Ecosystems in Europe (8th EAP). Available online: https://www.eea.europa.eu/ims/drought-impact-on-ecosystems-in-europe (accessed on 18 October 2023).
- Giadrossich, F.; Niedda, M.; Cohen, D.; Pirastru, M. Evaporation in a Mediterranean environment by energy budget and Penman methods, Lake Baratz, Sardinia, Italy. Hydrol. Earth Syst. Sci. 2015, 19, 2451–2468. [Google Scholar] [CrossRef]
- Alam, S.; AlShaikh, A.A. Use of palm fronds as shaded cover for evaporation reduction to improve water storage efficiency. J. King Saud Univ.-Eng. Sci. 2013, 25, 55–58. [Google Scholar] [CrossRef]
- Benzaghta, M.A.; Mohammed, T.A.; Ghazali, A.H.; Soom, M.A.M. Testing of evaporation reduction methods in humid climates. Proc. Inst. Civ. Eng.-Water Manag. 2013, 166, 207–216. [Google Scholar] [CrossRef]
- Eivanlopez. Available online: https://savewatercaliforniablog.wordpress.com/2015/11/16/shade-balls-keep-water-conservation-rolling-in-california/ (accessed on 18 October 2023).
- Tamil Nadu Minister’s Thermocol Proposal to Prevent Water Loss at Vaigai Dam Fails Miserably. Available online: https://www.indiatoday.in/top-stories/video/tamil-nadu-thermocol-proposal-vaigai-dam-water-evaporation-846088-2017-04-22 (accessed on 29 November 2023).
- Majumder, A.; Innamorati, R.; Frattolillo, A.; Kumar, A.; Gatto, G. Performance Analysis of a Floating Photovoltaic System and Estimation of the Evaporation Losses Reduction. Energies 2021, 14, 8336. [Google Scholar] [CrossRef]
- Almeida, R.M.; Schmitt, R.; Grodsky, S.M.; Flecker, A.S.; Gomes, C.P.; Zhao, L.; Liu, H.; Barros, N.; Kelman, R.; McIntyre, P.B. Floating Solar Power Could Help Fight Climate Change—Let’s Get It Right. Nature 2022, 606, 246–249. [Google Scholar] [CrossRef] [PubMed]
- Krumdieck, S. Transition Engineering: Building a Sustainable Future; CRC Press: London, UK, 2019. [Google Scholar]
- Elminshawy, N.A.S.; Osama, A.; El-Damhogi, D.G.; Oterkus, E.; Mohamed, A.M.I. Simulation and experimental performance analysis of partially floating PV system in windy conditions. Sol. Energy 2021, 230, 1106–1121. [Google Scholar] [CrossRef]
- Ali, H.M. Recent advancements in PV cooling and efficiency enhancement integrating phase change materials based systems—A comprehensive review. Sol. Energy 2020, 197, 163–198. [Google Scholar] [CrossRef]
- Benato, A.; Stoppato, A.; De Vanna, F.; Schiro, F. Spraying Cooling System for PV Modules: Experimental Measurements for Temperature Trends Assessment and System Design Feasibility. Designs 2021, 5, 25. [Google Scholar] [CrossRef]
- Dwivedi, P.; Sudhakar, K.; Soni, A.; Solomin, E.; Kirpichnikova, I. Advanced cooling techniques of P.V. modules: A state of art. Case Stud. Therm. Eng. 2020, 21, 100674. [Google Scholar] [CrossRef]
- Bijjargi, Y.; Kale, S.; Shaikh, K. Cooling techniques for photovoltaic module for improving its conversion efficiency: A review. Int. J. Mech. Eng. Technol. (IJMET) 2016, 7, 22–38. [Google Scholar]
- Hasan, A.; McCormack, S.; Huang, M.; Norton, B. Energy and Cost Saving of a Photovoltaic-Phase Change Materials (PV-PCM) System through Temperature Regulation and Performance Enhancement of Photovoltaics. Energies 2014, 7, 1318–1331. [Google Scholar] [CrossRef]
- Hassan, A.; Wahab, A.; Qasim, M.A.; Janjua, M.M.; Ali, M.A.; Ali, H.M.; Jadoon, T.R.; Ali, E.; Raza, A.; Javaid, N. Thermal management and uniform temperature regulation of photovoltaic modules using hybrid phase change materials-nanofluids system. Renew. Energy 2020, 145, 282–293. [Google Scholar] [CrossRef]
- Sivashankar, M.; Selvam, C.; Manikandan, S. A review on the selection of phase change materials for photovoltaic thermal management. IOP Conf. Ser. Mater. Sci. Eng. 2021, 1130, 012026. [Google Scholar] [CrossRef]
- Cuce, E.; Bali, T.; Sekucoglu, S.A. Effects of passive cooling on performance of silicon photovoltaic cells. Int. J. Low-Carbon Technol. 2011, 6, 299–308. [Google Scholar] [CrossRef]
- Mazón-Hernández, R.; García-Cascales, J.R.; Vera-García, F.; Káiser, A.S.; Zamora, B. Improving the Electrical Parameters of a Photovoltaic Panel by Means of an Induced or Forced Air Stream. Int. J. Photoenergy 2013, 2013, 830968. [Google Scholar] [CrossRef]
- Abdulgafar, S.A.; Omar, O.S.; Yousif, K.M. Improving the efficiency of polycrystalline solar panel via water immersion method. Int. J. Innov. Res. Technol. Sci. Eng. 2014, 3, 8127–8132. [Google Scholar]
- Rosa-Clot, M.; Marco Tina, G. Submerged and Floating Photovoltaic Systems; Academic Press: Cambridge, MA, USA, 2018. [Google Scholar]
- Chandrasekar, M.; Senthilkumar, T. Experimental demonstration of enhanced solar energy utilization in flat PV (photovoltaic) modules cooled by heat spreaders in conjunction with cotton wick structures. Energy 2015, 90, 1401–1410. [Google Scholar] [CrossRef]
- Haidar, Z.A.; Orfi, J.; Kaneesamkandi, Z. Experimental investigation of evaporative cooling for enhancing photovoltaic panels efficiency. Results Phys. 2018, 11, 690–697. [Google Scholar] [CrossRef]
- Chandrasekar, M.; Suresh, S.; Senthilkumar, T.; Ganesh Karthikeyan, M. Passive cooling of standalone flat PV module with cotton wick structures. Energy Convers. Manag. 2013, 71, 43–50. [Google Scholar] [CrossRef]
- Tang, X.; Quan, Z.; Zhao, Y. Experimental Investigation of Solar Panel Cooling by a Novel Micro Heat Pipe Array. Energy Power Eng. 2010, 02, 171–174. [Google Scholar] [CrossRef]
- Habeeb, L.J.; Mutasher, D.G.; Abd Ali, F.A.M. Cooling photovoltaic thermal solar panel by using heat pipe at baghdad climate. Int. J. Mech. Mechatron. Eng. 2017, 17, 171–185. [Google Scholar]
- Kaneesamkandi, Z.; Almalki, M.J.; Sayeed, A.; Haidar, Z.A. Passive Cooling of PV Modules Using Heat Pipe Thermosiphon with Acetone: Experimental and Theoretical Study. Appl. Sci. 2023, 13, 1457. [Google Scholar] [CrossRef]
- Yuan, Y.; Zhang, N.; Tao, W.; Cao, X.; He, Y. Fatty acids as phase change materials: A review. Renew. Sustain. Energy Rev. 2014, 29, 482–498. [Google Scholar] [CrossRef]
- Choo, Y.M.; Wei, W. Salt hydrates as phase change materials for photovoltaics thermal management. Energy Sci. Eng. 2021, 10, 1630–1642. [Google Scholar] [CrossRef]
- Tan, L.; Date, A.; Fernandes, G.; Singh, B.; Ganguly, S. Efficiency Gains of Photovoltaic System Using Latent Heat Thermal Energy Storage. Energy Procedia 2017, 110, 83–88. [Google Scholar] [CrossRef]
- Waqas, A.; Ji, J.; Xu, L.; Ali, M.; Zeashan; Alvi, J. Thermal and electrical management of photovoltaic panels using phase change materials—A review. Renew Sustain. Energy Rev. 2018, 92, 254–271. [Google Scholar] [CrossRef]
- Karthick, A.; Kalidasa Murugavel, K.; Ghosh, A.; Sudhakar, K.; Ramanan, P. Investigation of a binary eutectic mixture of phase change material for building integrated photovoltaic (BIPV) system. Sol. Energy Mater. Sol. Cells 2020, 207, 110360. [Google Scholar] [CrossRef]
- Singh, P.; Khanna, S.; Newar, S.; Sharma, V.; Reddy, K.; Mallick, T.; Becerra, V.; Radulovic, J.; Hutchinson, D.; Khusainov, R. Solar Photovoltaic Panels with Finned Phase Change Material Heat Sinks. Energies 2020, 13, 2558. [Google Scholar] [CrossRef]
- Diallo, T.M.O.; Yu, M.; Zhou, J.; Zhao, X.; Shittu, S.; Li, G.; Ji, J.; Hardy, D. Energy performance analysis of a novel solar PVT loop heat pipe employing a microchannel heat pipe evaporator and a PCM triple heat exchanger. Energy 2019, 167, 866–888. [Google Scholar] [CrossRef]
- Choi, H.-U.; Choi, K.-H. Performance Evaluation of PV/T Air Collector Having a Single-Pass Double-Flow Air Channel and Non-Uniform Cross-Section Transverse Rib. Energies 2020, 13, 2203. [Google Scholar] [CrossRef]
- Tabaei, H.; Ameri, M. Improving the Effectiveness of a Photovoltaic Water Pumping System by Using Booster Reflector and Cooling Array Surface by a Film of Water. Iran. J. Sci. Technol. Trans. Mech. Eng. 2015, 39, 51–60. [Google Scholar]
- Dorobanţu, L.; Popescu, O.M. Increasing the efficiency of photovoltaic panels through cooling water film. UPB Sci. Bull. Ser. C 2013, 75, 223–232. [Google Scholar]
- Hachicha, A.A.; Ghenai, C.; Hamid, A.K. Enhancing the performance of a photovoltaic module using different cooling methods. Int. J. Energy Power Eng. 2015, 9, 1106–1109. [Google Scholar]
- Ueda, Y.; Sakurai, T.; Tatebe, S.; Itoh, A.; Kurokawa, K. Performance analysis of PV systems on the water. In Proceedings of the 23rd European Photovoltaic Solar Energy Conference, Valencia, Spain, 1 September 2008; pp. 2670–2673. [Google Scholar]
- Zilli, B.M.; Lenz, A.M.; de Souza, S.N.M.; Secco, D.; Nogueira, C.E.C.; Junior, O.H.A.; Nadaleti, W.C.; Siqueira, J.A.C.; Gurgacz, F. Performance and effect of water-cooling on a microgeneration system of photovoltaic solar energy in Paraná, Brazil. J. Clean. Prod. 2018, 192, 477–485. [Google Scholar] [CrossRef]
- Nižetić, S.; Čoko, D.; Yadav, A.; Grubišić-Čabo, F. Water spray cooling technique applied on a photovoltaic panel: The performance response. Energy Convers. Manag. 2016, 108, 287–296. [Google Scholar] [CrossRef]
- Sargunanathan, S.; Ramanathan, K.; Mohideen, S.T.; Suresh, S. Enhancing the Performance of the Standalone Rooftop SPV Module during Peak Solar Irradiance and Ambient Temperature by the Active Cooling of the Rear Surface with Spraying Water and the Front Surface with Overflowing Water. Int. J. Photoenergy 2020, 2020, 8826966. [Google Scholar] [CrossRef]
- Hosseini, R.; Hosseini, N.; Khorasanizadeh, H. An Experimental Study of Combining a Photovoltaic System with a Heating System. In Proceedings of the World Renewable Energy Congress, Sweden, Linköping, Sweden, 8–13 May 2011; pp. 2993–3000. [Google Scholar]
- Sathyamurthy, R.; Kabeel, A.E.; Chamkha, A.; Karthick, A.; Muthu Manokar, A.; Sumithra, M.G. Experimental investigation on cooling the photovoltaic panel using hybrid nanofluids. Appl. Nanosci. 2020, 11, 363–374. [Google Scholar] [CrossRef]
- Moshfegh, H.; Eslami, M.; Hosseini, A. Thermoelectric Cooling of a Photovoltaic Panel. In The Role of Exergy in Energy and the Environment; Springer: Cham, Switzerland, 2018; pp. 625–634. [Google Scholar]
- Bland, A.; Khzouz, M.; Statheros, T.; Gkanas, E. PCMs for Residential Building Applications: A Short Review Focused on Disadvantages and Proposals for Future Development. Buildings 2017, 7, 78. [Google Scholar] [CrossRef]
- Roslan, E.; Razak, A. Performance effect of applying paraffin wax on solar photovoltaic backplate. Indones. J. Electr. Eng. Comput. Sci. 2019, 14, 375–380. [Google Scholar] [CrossRef]
- Kim, H.J.; Kiwan, S.; Ahmad, H.; Alkhalidi, A.; Wahib, W.O.; Al-Kouz, W. Photovoltaic Cooling Utilizing Phase Change Materials. E3S Web Conf. 2020, 160, 02004. [Google Scholar]
- Gurevich, Y.G.; Velazquez-Perez, J.E. Peltier Effect in Semiconductors. In Wiley Encyclopedia of Electrical and Electronics Engineering; Wiley: Hoboken, NJ, USA, 2014; pp. 1–21. [Google Scholar]
- OE. Offshore Engineering, Floating Solar Potential is Huge, But Not without Challenges, DNV Says. 2022. Available online: https://www.oedigital.com/news/496467-floating-solar-potential-is-huge-but-not-without-challenges-dnv-says (accessed on 18 October 2023).
- WM. Wood Mackenzie, Global Floating Solar to Top 6GW Threshold by 2031. 2023. Available online: https://www.woodmac.com/press-releases/global-floating-solar-to-top-6gw-threshold-by-2031/ (accessed on 18 October 2023).
- NYT. The New York Times, Solar on the Water. 2011. Available online: https://www.nytimes.com/2011/04/20/business/energy-environment/20float.html (accessed on 18 October 2023).
- WEF—World Economic Forum. How Japan Became the World Leader in Floating Solar Power. 2019. Available online: https://www.weforum.org/agenda/2019/03/japan-is-the-world-leader-in-floating-solar-power/ (accessed on 18 October 2023).
- Sahu, A.; Yadav, N.; Sudhakar, K. Floating photovoltaic power plant: A review. Renew. Sustain. Energy Rev. 2016, 66, 815–824. [Google Scholar] [CrossRef]
- Muñoz-Cerón, E.; Osorio-Aravena, J.C.; Rodríguez-Segura, F.J.; Frolova, M.; Ruano-Quesada, A. Floating photovoltaics systems on water irrigation ponds: Technical potential and multi-benefits analysis. Energy 2023, 271, 127039. [Google Scholar] [CrossRef]
- Ravichandran, N.; Fayek, H.H.; Rusu, E. Emerging Floating Photovoltaic System—Case Studies High Dam and Aswan Reservoir in Egypt. Processes 2021, 9, 1005. [Google Scholar] [CrossRef]
- NRG. NRG Island System. 2010. Available online: https://www.fotovoltaicogalleggiante.com/data_n_layout.html (accessed on 18 October 2023).
- Azmi, M.S.M.; Othman, M.Y.H.; Ruslan, M.H.H.; Sopian, K.; Majid, Z.A.A. Study on electrical power output of floating photovoltaic and conventional photovoltaic. In AIP Conference Proceedings; AIP Publishing LLC: Melville, NY, USA, 2013; pp. 95–101. [Google Scholar]
- Majid, Z.A.A.; Ruslan, M.H.; Sopian, K.; Othman, M.Y.; Azmi, M.S.M. Study on Performance of 80 Watt Floating Photovoltaic Panel. J. Mech. Eng. Sci. 2014, 7, 1150–1156. [Google Scholar] [CrossRef]
- Cazzaniga, R.; Rosa-Clot, M.; Rosa-Clot, P.; Tina, G.M. Floating tracking cooling concentrating (FTCC) systems. In Proceedings of the 2012 38th IEEE Photovoltaic Specialists Conference, Austin, TX, USA, 3–8 June 2012; pp. 000514–000519. [Google Scholar]
- Choi, Y.-K. A Study on Power Generation Analysis of Floating PV System Considering Environmental Impact. Int. J. Softw. Eng. Appl. 2014, 8, 75–84. [Google Scholar] [CrossRef]
- Lee, Y.-G.; Joo, H.-J.; Yoon, S.-J. Design and installation of floating type photovoltaic energy generation system using FRP members. Sol. Energy 2014, 108, 13–27. [Google Scholar] [CrossRef]
- Yoo, J.H.; Kim, S.H.; An, D.J.; Choi, W.C.; Yoon, S.J. Generation Efficiency of Tracking Type Floating PV Energy Generation Structure Using Fiber Reinforced Polymer Plastic (FRP) Members. Key Eng. Mater. 2017, 730, 212–217. [Google Scholar] [CrossRef]
- Yadav, N.; Gupta, M.; Sudhakar, K. Energy assessment of floating photovoltaic system. In Proceedings of the 2016 International Conference on Electrical Power and Energy Systems (ICEPES), Bhopal, India, 14–16 December 2016; pp. 264–269. [Google Scholar]
- Durković, V.; Đurišić, Ž. Analysis of the Potential for Use of Floating PV Power Plant on the Skadar Lake for Electricity Supply of Aluminium Plant in Montenegro. Energies 2017, 10, 1505. [Google Scholar] [CrossRef]
- Charles Lawrence Kamuyu, W.; Lim, J.; Won, C.; Ahn, H. Prediction Model of Photovoltaic Module Temperature for Power Performance of Floating PVs. Energies 2018, 11, 447. [Google Scholar] [CrossRef]
- Trapani, K.; Redón Santafé, M. A review of floating photovoltaic installations: 2007–2013. Prog. Photovolt. Res. Appl. 2014, 23, 524–532. [Google Scholar] [CrossRef]
- Sutanto, B.; Indartono, Y.S.; Wijayanta, A.T.; Iacovides, H. Enhancing the performance of floating photovoltaic system by using thermosiphon cooling method: Numerical and experimental analyses. Int. J. Therm. Sci. 2022, 180, 107727. [Google Scholar] [CrossRef]
- Nisar, H.; Kashif Janjua, A.; Hafeez, H.; Shakir, S.; Shahzad, N.; Waqas, A. Thermal and electrical performance of solar floating PV system compared to on-ground PV system-an experimental investigation. Sol. Energy 2022, 241, 231–247. [Google Scholar] [CrossRef]
- Elminshawy, N.A.S.; El-Damhogi, D.G.; Ibrahim, I.A.; Elminshawy, A.; Osama, A. Assessment of floating photovoltaic productivity with fins-assisted passive cooling. Appl. Energy 2022, 325, 119810. [Google Scholar] [CrossRef]
- Elminshawy, N.A.S.; Mohamed, A.M.I.; Osama, A.; Amin, I.; Bassam, A.M.; Oterkus, E. Performance and potential of a novel floating photovoltaic system in Egyptian winter climate on calm water surface. Int. J. Hydrogen Energy 2022, 47, 12798–12814. [Google Scholar] [CrossRef]
- Elminshawy, N.A.S.; Osama, A.; Saif, A.M.; Tina, G.M. Thermo-electrical performance assessment of a partially submerged floating photovoltaic system. Energy 2022, 246, 123444. [Google Scholar] [CrossRef]
- Lanzafame, R.; Nachtmann, S.; Rosa-Clot, M.; Rosa-Clot, P.; Scandura, P.F.; Taddei, S.; Tina, G.M. Field Experience With Performances Evaluation of a Single-Crystalline Photovoltaic Panel in an Underwater Environment. IEEE Trans. Ind. Electron. 2010, 57, 2492–2498. [Google Scholar] [CrossRef]
- Tina, G.M.; Scavo, F.B.; Aneli, S.; Gagliano, A. Assessment of the electrical and thermal performances of building integrated bifacial photovoltaic modules. J. Clean. Prod. 2021, 313, 127906. [Google Scholar] [CrossRef]
- Liu, L.; Wang, Q.; Lin, H.; Li, H.; Sun, Q.; Wennersten, R. Power Generation Efficiency and Prospects of Floating Photovoltaic Systems. Energy Procedia 2017, 105, 1136–1142. [Google Scholar] [CrossRef]
- Sukarso, A.P.; Kim, K.N. Cooling Effect on the Floating Solar PV: Performance and Economic Analysis on the Case of West Java Province in Indonesia. Energies 2020, 13, 2126. [Google Scholar] [CrossRef]
- Santos, F.R.d.; Wiecheteck, G.K.; Virgens Filho, J.S.d.; Carranza, G.A.; Chambers, T.L.; Fekih, A. Effects of a Floating Photovoltaic System on the Water Evaporation Rate in the Passaúna Reservoir, Brazil. Energies 2022, 15, 6274. [Google Scholar] [CrossRef]
- George, H.H.; Zohrab, A.S. Reference Crop Evapotranspiration from Temperature. Appl. Eng. Agric. 1985, 1, 96–99. [Google Scholar] [CrossRef]
- Valiantzas, J.D. Simplified versions for the Penman evaporation equation using routine weather data. J. Hydrol. 2006, 331, 690–702. [Google Scholar] [CrossRef]
- Linacre, E.T. A simple formula for estimating evaporation rates in various climates, using temperature data alone. Agric. Meteorol. 1977, 18, 409–424. [Google Scholar] [CrossRef]
- Linacre, E. Data-sparse estimation of lake evaporation, using a simplified Penman equation. Agric. For. Meteorol. 1993, 64, 237–256. [Google Scholar] [CrossRef]
- Abdelal, Q. Floating PV; an assessment of water quality and evaporation reduction in semi-arid regions. Int. J. Low-Carbon Technol. 2021, 16, 732–739. [Google Scholar] [CrossRef]
- Mittal, D.; Kumar Saxena, B.; Rao, K.V.S. Potential of floating photovoltaic system for energy generation and reduction of water evaporation at four different lakes in Rajasthan. In Proceedings of the 2017 International Conference On Smart Technologies For Smart Nation (SmartTechCon), Bengaluru, India, 17–19 August 2017; pp. 238–243. [Google Scholar]
- Cazzaniga, R.; Rosa-Clot, M.; Rosa-Clot, P.; Tina, G.M. Integration of PV floating with hydroelectric power plants. Heliyon 2019, 5, e01918. [Google Scholar] [CrossRef] [PubMed]
- Scavo, F.B.; Tina, G.M.; Gagliano, A.; Merlo, L.; Bizzarri, F. Assessment of the evaporation rate in reservoir partially covered by floating photovoltaic plants. In Proceedings of the 2020 11th International Renewable Energy Congress (IREC), Hammamet, Tunisia, 29–31 October 2020; pp. 1–6. [Google Scholar]
- Nagananthini, R.; Nagavinothini, R. Investigation on floating photovoltaic covering system in rural Indian reservoir to minimize evaporation loss. Int. J. Sustain. Energy 2021, 40, 781–805. [Google Scholar] [CrossRef]
- Abd-Elhamid, H.F.; Abdel-Aal, G.M.; Fahmy, M.; Sherif, M.; Zeleňáková, M.; Abd-Elaty, I. Experimental and Numerical Study to Investigate the Impact of Changing the Boundary Water Levels on Saltwater Intrusion in Coastal Aquifers. Water 2022, 14, 631. [Google Scholar] [CrossRef]
- Bei, Y.; Yuan, B.; Wang, Z.; Tang, J. Floating Photovoltaic for the Coal Mining Subsidence Water Area—An Effective Way to Reduce Evaporation. In Proceedings of the 2022 5th International Conference on Energy, Electrical and Power Engineering (CEEPE), Chongqing, China, 22–24 April 2022; pp. 1126–1130. [Google Scholar]
- Abdelgaied, M.; Kabeel, A.E.; Zeleňáková, M.; Abd-Elhamid, H.F. Floating Photovoltaic Plants as an Effective Option to Reduce Water Evaporation in Water-Stressed Regions and Produce Electricity: A Case Study of Lake Nasser, Egypt. Water 2023, 15, 635. [Google Scholar] [CrossRef]
Disclaimer/Publisher’s Note: The statements, opinions and data contained in all publications are solely those of the individual author(s) and contributor(s) and not of MDPI and/or the editor(s). MDPI and/or the editor(s) disclaim responsibility for any injury to people or property resulting from any ideas, methods, instructions or products referred to in the content. |
© 2023 by the authors. Licensee MDPI, Basel, Switzerland. This article is an open access article distributed under the terms and conditions of the Creative Commons Attribution (CC BY) license (https://creativecommons.org/licenses/by/4.0/).