Abstract
In order to solve the problem of randomness and volatility caused by the rapid growth of renewable energy (RE), energy storage systems (ESSs)—as an important means of regulation—can effectively improve the flexible regulation capacity of power systems utilizing a high proportion of RE. Most of the current ESS capacity configuration procedures are carried out based on the typical scenario method or time series production simulation. This method tends to determine the size of the ESS configuration through multiple trial simulations. Uncertainty of simulation prediction data can result in the existence of an excess capacity or lack of configured capacity. In addition, this method reflects the ESS demand under specific targets, but it fails to fully utilize RE generation characteristics. The configuration process lacks the mathematical mechanism of RE consumption, and the calculation process is too complicated. In view of the shortcomings of traditional ESS optimal configuration methods, this paper examines the mathematical mechanism of RE consumption and proposes the ESS optimal configuration analysis method based on “equal area criterion”. First, the principle of RE consumption is analyzed and the “RE consumption characteristic curve” is proposed according to RE characteristics. In addition, a working principle diagram of RE consumption, including ESS, is constructed to visually show the consumption capacity of RE and the working position of ESS. Then, the ESS optimal configuration process, based on the “equal area criterion”, is proposed to achieve an accurate match between ESS capacity demand and RE consumption targets. Finally, the power grid of a region in China is taken as an example. We prove that the proposed method can save 1.41 × 10³ MWh of ESS capacity and provide a more “mathematical” and “convenient” systematic solution for RE consumption and ESS optimization compared to the production simulation method.
1. Introduction
In September 2020, China proposed the concept of “carbon peak and carbon neutrality” (referred to as “dual carbon”) to the world for the first time [1]. Under this goal, RE generation via wind and photovoltaic power will continue to grow rapidly. In January 2022, the National Development and Reform Commission proposed to accelerate the construction of large-scale wind power and photovoltaic power generation bases in western and northern China, focusing on desert areas [2]. Therefore, the RE consumption demand of China is continuing to increase during the “14th Five-Year Plan” period.
The proposed “dual carbon” target makes the development of RE installed capacity more urgent. RE generation is characterized by randomness, volatility, and unpredictability. The key studied issue concerns how to reasonably configure the ESS in order to improve the flexibility and rapid response capability of the power grid for the purpose of realizing the effective consumption of new energy resources [3,4,5].
In addition, there are mutual constraints between the RE installed capacity, the RE utilization rate, and the scale of RE power generation [6,7]. For example, after increasing the RE installed capacity, the proportion of RE power generation will be increased but the utilization rate will be decreased. The economics of ESS investment is also a key issue [8]. If investment in ESS is too large, there will be a serious waste of resources. There is an urgent need to select the appropriate ESS configuration capacity to maximize the technical and economic benefits. Through the analysis of the above, the key challenges and difficulties of this study are summarized, which is also a point of innovation compared with other studies.
These include the following considerations:
- How to describe the constraints between the RE installed capacity, the RE utilization rate, and the proportion of RE power generation from the mathematical mechanism.
- How to visualize the theoretical basis of the way in which RE, generated via the mathematical mechanism, is consumed by ESS.
- How to propose a suitable ESS configuration method to realize the balance between the economy of ESS investment, RE utilization rate, and the proportion of RE generation.
At present, there are several main calculation methods for optimizing the configuration of ESS capacity. These include typical scenario methods [9,10,11,12,13,14], production simulation methods [15,16,17,18,19,20,21,22], and intelligent algorithm optimization methods [23,24,25].
The typical scenario method uses several typical scenarios of load and RE to calculate the ESS configuration capacity [9,10,11,12]. In refs. [9,10,11], the ESS is rationally configured to solve the power fluctuation and intermittency problems caused by large-scale renewable energy generation connected to the grid via setting typical scenarios. However, the typical scenario setting is too simple, resulting in inaccurate ESS configuration results. The influence mechanism of ESS and the combined planning model of a source storage network are constructed in [12,13]. However, there is a lack of analysis of the relationship between ESS configuration and RE consumption capacity. One study [14] uses a Philippine offshore island to optimize the capacity configuration of a hybrid energy system. Aiming for the lowest operating cost of an isolated island power grid, the optimal configuration method of ESS is proposed based on selected typical scenarios.
The typical scenario method covers fewer scenarios, meaning that it cannot reflect various extreme cases of energy storage configuration requirements. The typical scenario method can meet the ESS configuration demand in most scenarios throughout the year, but it cannot reflect the optimal configuration of ESS for systems with a high percentage of RE resources in extreme situations. The results are heavily dependent on the data from the selected scenarios. The uncertainty of simulation prediction data can result in excess capacity or a lack of configured capacity. The result may differ greatly from the actual requirement.
The production simulation method can simulate various power supply conditions and power supply balance by time series under the given system operating boundaries. The ESS capacity demand is finally obtained through time series production simulation [15,16,17,18,19,20,21,22]. It is also the most frequently used calculation method. Evaluating the energy storage capacity requirements under different time scales, a multi-timescale coordinated optimization strategy considering flexible requirements, is proposed using the time series production simulation in [15]. Combined with the sequential Monte Carlo simulation method, a wind farm energy storage optimization configuration method considering energy storage life loss, is proposed in [16]. The operation probability state of photovoltaic power generation and load is obtained using production simulation, and a coordinated planning method of optical storage network based on a probabilistic time series production simulation is proposed in [17]. An improved stochastic production simulation method is used to study the reliability assessment in [18] and RE consumption of multi-energy systems in [19].
However, the production simulation method determines the ESS scale through several tentative simulations, and the complexity and calculation amount increase sharply when the number of traversal scenarios is on the hourly scale. In addition, uncertainty of simulation prediction data can result in the existence of excess capacity or lack of configured capacity, which also occurs in [20,21,22].
In addition, the intelligent optimization algorithm aims to seek the optimal solution to the optimization function of multi-objective ESS configuration [23,24,25]. The INSGA-II algorithm is proposed in [23] to solve the multi-objective configuration optimization model of ESS, aiming for the minimum comprehensive cost and maximum RE utilization rate. The optimal sizing and configuration method of ESS is established considering its stochastic nature using PSO in the distribution network in [24]. To maximize the proportion of RE power generation and minimize the annual investment cost as comprehensive optimization objectives, the multi-objective robust optimization allocation for ESS is proposed via the use of a novel confidence gap decision method in [25].
In the above literature, intelligent algorithms are used to optimize the ESS configuration with the goal of optimizing the performance of certain aspects of the system. This method reflects the ESS demand under specific targets, but it fails to fully utilize the RE generation characteristics. The configuration process lacks the mathematical mechanism of RE consumption. The theoretical basis for ESS absorption RE is not analyzed in the configuration process.
Most of the current ESS capacity configuration methods are carried out based on the typical scenario method or time series production simulation. The typical scenario method is to use typical methods and scenarios to calculate the scale of ESS to reflect the annual demand for ESS configuration. This method can meet the ESS needs of most scenarios throughout the year. However, it cannot reflect the optimal configuration of ESS for a high proportion of RE resources in extreme situations, nor can it reflect the ESS needs when the proportion of RE is very low. This latter method tends to determine the size of the ESS configuration through trialing multiple simulations. Uncertainty of simulation prediction data can result in the existence of excess capacity or lack of configured capacity. In addition, this method reflects the ESS demand under specific targets, but it fails to fully utilize the RE generation characteristics. The configuration process lacks the mathematical mechanism of RE consumption, and the calculation process is too complicated.
The research objective of this paper is to solve the problems of a lack of mathematical basis for ESS absorbing RE, an excess or lack of configured capacity, and a too complicated calculation process. To this end, an ESS configuration method based on “equal area criterion” is provided. The ESS capacity and the RE consumption capacity can be accurately matched by using this provided method to realize the optimal ESS configuration under the established RE consumption target. This method realizes the goal of deep coupling and synergistic planning between ESS and RE consumption for the first time.
Compared with the research in other literature, the contributions of this paper are as follows.
- The power balance model of unconstrained grid with RE is established and statistical features are proposed such as “RE consumption characteristic curve” and “interval guarantee hours”. The constraints between the installed capacity of renewable energy, the utilization rate of renewable energy, and the proportion of renewable energy power generation are described mathematically.
- The working principle diagram of RE consumption including ESS is constructed to visually reveal the systematic principle of how ESSs absorb RE. The “equal area criterion” is proposed for the ESS optimization configuration. A complete set of parameters such as “ESS peak power, ESS capacity, and RE penetration rate” are obtained for different RE consumption scenarios. The ESS capacity and the RE consumption capacity can be accurately matched to realize the optimal ESS configuration under the established RE consumption target.
- The ESS and RE configuration scenarios are obtained based on fitting and interpolation methods in accordance with the known and unknown scenarios of RE installed capacity in the planning year. The configuration scenarios realize the balance between the economics of ESS investment, RE utilization rate, and the proportion of RE generation.
The remainder of this paper is organized as follows. In Section 2, based on the characteristics of RE sources and power grid, the power balance mechanism is analyzed. On this basis, the consumption characteristic curve is constructed to reveal the consumption mechanism of RE. In Section 3, the interval power generation statistical characteristics of RE are extracted and the working principle diagram of RE consumption, including ESS, is constructed to visually show the consumption capacity of RE and the working position of ESS. In Section 4, the “equal area criterion” of ESS optimization configuration is proposed to reveal the systematic principle of ESS absorbing RE. The collaborative configuration process of ESS and RE is proposed in different scenarios. Finally, the power grid of the Q region in China is taken as an example to prove the proposed method reasonable and effective in Section 5.
2. The Consumption Characteristic Curve of RE
Based on the characteristics of RE sources, the power balance mechanism with RE is analyzed as shown in Section 2.1. On this basis, the consumption characteristic curve of RE is constructed, as shown in Section 2.2. This realizes the organic combination of new energy’s own power generation characteristics and system balance.
2.1. Power Balance Model of Unconstrained Grid with RE
The theoretical power of RE PR refers to the maximum power emitted by RE units in their natural and unrestricted states [26]. The absorbed power of RE PS can be expressed as the load PL minus the minimum technical output of conventional thermal power units PTmin for the RE power system without network constraints, as shown in Equation (1). RE will be blocked when the theoretical power of RE exceeds the consumption capacity, as shown in Figure 1.
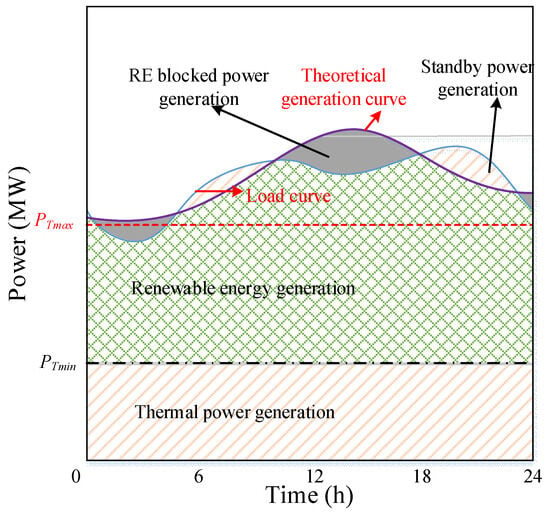
Figure 1.
Power balance model with RE.
In Figure 1, the starting capacity of the conventional thermal power standby units PTmax is calculated using the maximum load PLmax and the system reserve rate α. The maximum load PLmax is obtained by dividing the average load PLave by the system load rate ε. PTmin is determined by PTmax and peak regulation rate β of thermal power, as shown in Equation (2).
Substitute Equation (2) into Equation (1) and integrate both sides of the equation in time to obtain Equation (3)
where ES is the absorbed power generation of RE obtained by integrating PS and EL is the total power generation obtained by integrating PL
where T is the number of hours in one year and PSave is the average absorbed power of RE, as shown in Equation (5).
The penetration rate of RE θ is defined as the ratio of the installed capacity of RE C to PLmax. The consumption capacity of RE x is defined by dividing PSave by C. Then, the consumption capacity of RE x can be calculated according to Equation (6).
The theoretical hours of RE TR are defined as the ratio of the theoretical generation of RE ER to the installed capacity of RE C. Resource coefficient of RE S is defined as the ratio of TR to T. The proportion of RE power generation R can be expressed as follows.
where η is the RE utilization rate. Working on the basis of the above formula, the power balance model of the unconstrained grid with RE is derived and obtained in Equations (6) and (7). If there are network constraints in the planning scenario, the power grid can be divided into several subsystems according to the constraints [27]. The consumption capacity of RE takes the minimum value of the network constraint and the equilibrium constraint. The equilibrium mechanism of each subsystem remains unchanged. The constraints between the installed capacity of renewable energy, the utilization rate of renewable energy, and the proportion of renewable energy power generation are described mathematically.
2.2. The Consumption Characteristic Curve of RE
The theoretical power data of RE are normalized according to the installed capacity at the corresponding time. The normalized theoretical power sequence pj (the per unit value at time j) is obtained. The installed capacity of RE C is divided into m intervals according to different installed ratios. xi represents the consumption capacity of RE under the i interval (i increases from 1 to m). The theoretical power and consumption curve of RE is shown in Figure 2.
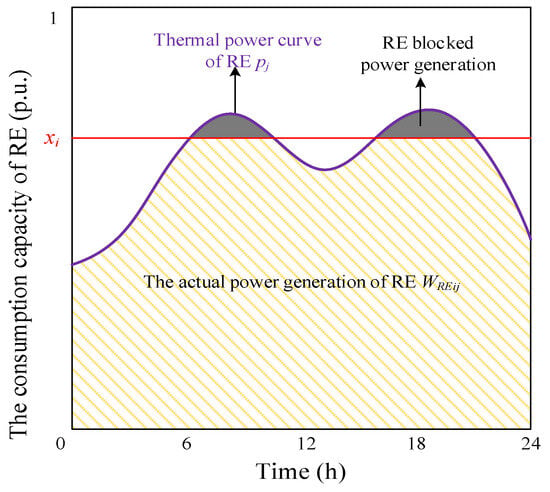
Figure 2.
The theoretical power and consumption curve of RE.
When the theoretical power pj does not exceed the consumption capacity of RE xi, pj is regarded as the actual power of RE PREij at time j. When pj exceeds xi, the excess part cannot be absorbed. xi is regarded as the actual power of RE PREij at time j, as shown in Equation (8).
For the i interval, the RE utilization rate ηi is defined as the ratio of the actual generation to the theoretical generation of RE, as shown in Equation (9).
If variable i is continuously changed between 1 and m, the consumption capacity xi and corresponding RE utilization rate ηi of each group are obtained. Taking xi as the independent variable and ηi as the dependent variable, the consumption characteristic curve of RE can be drawn, as shown in Figure 3. For a defined grid, the reserve rate α, the load rate ε, the peak regulation rate β, and the penetration rate of RE θ are all defined boundary conditions. Therefore, the consumption capacity xi can be calculated according to Equation (1), and the corresponding utilization rate ηi can be obtained according to Figure 3. Thus, the organic combination of RE power generation characteristics and system balance is realized.
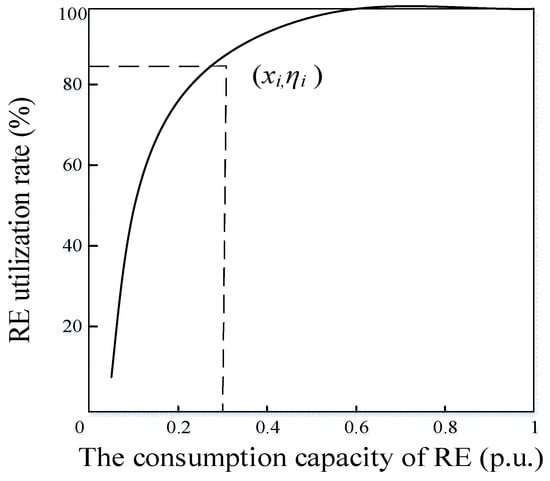
Figure 3.
The consumption characteristic curve of RE.
The analysis of Figure 3 shows that when variable i increases between 1 and m, the installed capacity of RE C increases. According to Equation (6), the penetration rate of RE θ will increase, and the consumption capacity x will decrease. The reduction in consumption capacity x will increase the gap between the theoretical and actual power generation, and ultimately reduce the utilization rate of RE η.
3. Interval Power Generation Characteristics of RE
From the perspective of power system planning and operation, the overall scale of energy storage required to meet the absorbed demand of RE is studied in this paper. The purpose of this study is to propose the total capacity demand and configuration principle of ESS, regardless of ESS type. The ESS will absorb the blocked power of RE, which belongs to a part of the theoretical power of RE. Therefore, the interval power generation characteristics of RE are researched. The number of RE interval guaranteed hours is proposed in Section 3.1. On this basis, the RE consumption guaranteed region is divided in Section 3.2 and the working principle diagram of RE consumption including ESS is constructed in Section 3.3 to visually show the consumption capacity of RE and the working position of ESS.
3.1. The Number of RE Interval Guaranteed Hours
First of all, the RE utilization rate target ηp is set according to relevant policies and regulations [1,2]. The corresponding target of consumption capacity xp is obtained according to the consumption characteristic curve of RE in Figure 2. Therefore, when xi is any consumption capacity between 0 and xp, the number of corresponding daily blocked hours of RE Tdi is defined as the ratio of the daily blocked power generation of RE to C. It can be expressed as Equation (10)
where Dij is the blocked power of RE under the consumption capacity xi at time j, and N is the series length of RE theoretical power. With xi as the lower limit and xp as the upper limit, a group of RE absorbed range is formed, as shown in Figure 4. The number of interval RE generation hours ΔTdi is defined in relation to the number of corresponding theoretical RE generation hours in this interval, as shown in Equation (11)
where Dpj is the blocked power of RE under the consumption capacity target xp at time j, and Tdp is the number of corresponding daily blocked hours.
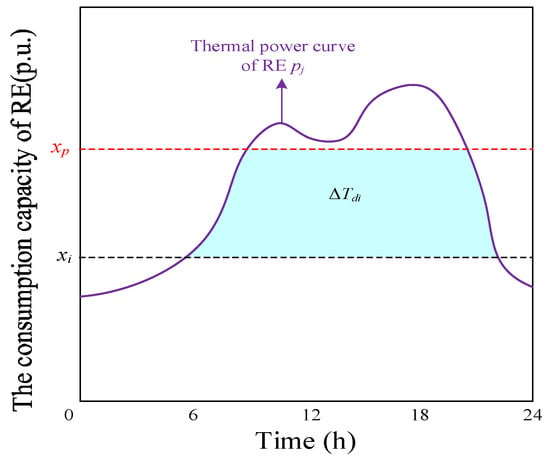
Figure 4.
The diagram of RE consumption range hours.
According to the above method, the daily interval RE generation hours sequence of one year ΔTdi can be statistically obtained, and it is arranged in order from small to large: ΔTdi = [ΔTdi1, ΔTdi2, …, ΔTdin], where ΔTdi1 ≤ ΔTdi2, …, ≤ΔTdin. n is the number of calendar days. The quantile of interval RE generation hours with r% probability Qir is obtained as shown in Equation (12)
where floor [] represents the rounded down function. According to the quantile Qir, the corresponding numerical value is found from ΔTdi, which is the number of interval guaranteed hours Tgir corresponding to the r% probability, as shown in Figure 5. The guarantee rate r% is the proportion of the number of elements exceeding Tgir to the total number of elements in ΔTdi. The guaranteed power generation Egir is defined as the product of Tgir and C, as shown in Equation (13). The guaranteed power generation Egir indicates the stable daily blocked power generation of RE under a certain probability, which can be reliably absorbed by ESS every day.
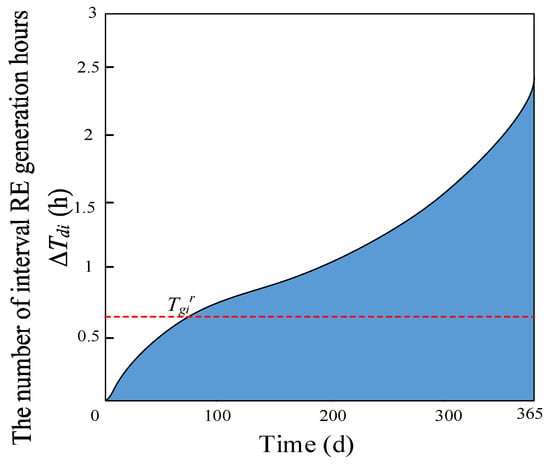
Figure 5.
The diagram of interval RE guaranteed hours Tgir.
3.2. The Division of RE Guaranteed Region
With xi as the lower limit and xp as the upper limit, the number of guaranteed hours Tgir in each interval is counted in order to study the change in Tgir under different consumption capacity of RE. If variable i is continuously changed between 1 and m, the statistical sequence Tgir is arranged from large to small Tgir = [Tg1r, Tg2r, …, Tgmr], where Tg1r ≥ Tg2r, …, ≥Tgmr = 0. The change in Tgir under different consumption capacity of RE is shown in Figure 6.
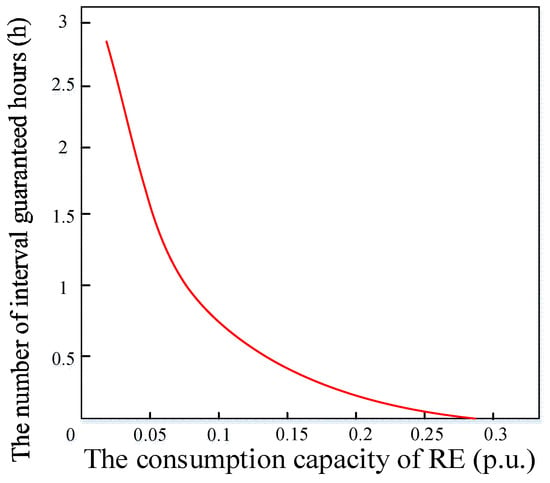
Figure 6.
The diagram of daily interval RE generation hours sequence ΔTdi.
As can be seen from Figure 4 and Figure 6, with the improvement in lower boundary xi, the range of the interval [xi, xk] will be narrowed, and the corresponding ΔTdi, Tgir, and Egir will decrease accordingly. If there exists an integer k that is less than m and satisfies Equation (14), then
where Tgkr is the critical number of interval guaranteed hours corresponding to the r% probability, and xk is the critical value of RE consumption capacity. The sequence [x1, x2, …, xk] is the set of consumption capacity under the requirement of r%, which is called the ‘guaranteed region’. Conversely, the sequence [xk+1, xk+2, …, xm] is called the ‘guaranteed failure region’, as shown in Figure 7.
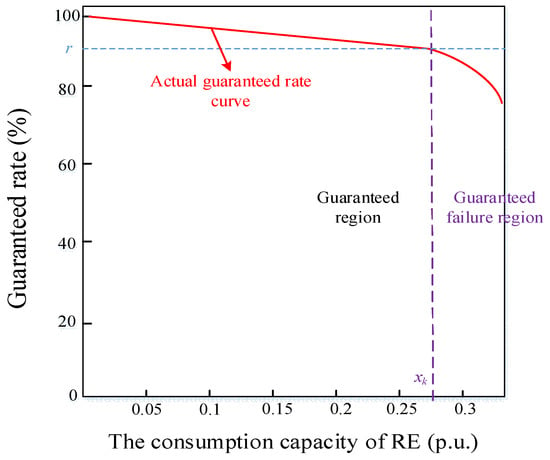
Figure 7.
The diagram of interval RE guaranteed area.
As can be seen from Figure 7, with the improvement in RE consumption capacity, the guaranteed rate r% cannot be met after reaching the critical value xk. It is proved that there is not enough blocked power for the reliable consumption of ESS.
3.3. The Working Principle Diagram of RE Consumption Including ESS
In the guaranteed region, the guaranteed power generation of RE Egir can be absorbed by ESS and released during peak load hours to play a peak role. Therefore, the guaranteed power generation Egir can also replace the starting capacity of the conventional thermal power units when the guaranteed rate r% is large enough. However, the number of interval guaranteed hours Tgir in the guaranteed failure region may be 0 and cannot replace the starting capacity of the conventional thermal power units.
The working principle diagram of the ESS absorbing RE is shown in Figure 8. In Figure 8, x1 represents the initial consumption capacity of RE without considering ESS, which is calculated using Equation (6). In order to achieve the consumption capacity target xp, the number of RE hours absorbed by ESS is required to be the sum of S1 and Si in Figure 8.
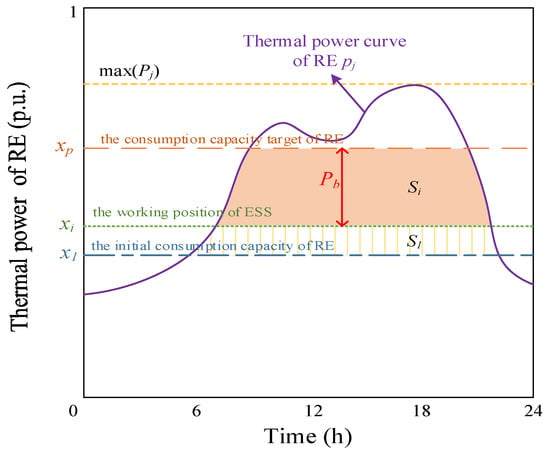
Figure 8.
The working principle diagram of the ESS.
The investment in energy storage will reduce the reserve capacity of thermal power units. Supposing that the consumption capacity of RE xi exists between x1 and xp, the area S1 of the interval surrounded by xi and x1 is exactly equal to the reduced reserve capacity of thermal power units. At this point, xi is called the working position of ESS. xi ~ xp is called the working interval of ESS. When the ESS is working its optimal power operation state, the consumption capacity of RE increases from xi to xp, and the RE utilization rate eventually reaches ηp.
As shown in Figure 8, the role of ESS in RE consumption is mainly reflected in two processes. Firstly, the upgrade from x1 to xi reflects the result of guaranteed power generation Egir replacing the reserve capacity of thermal power units. Secondly, the upgrade from xi to xp reflects the result of ESS absorbing the blocked power generation of RE.
In order to facilitate the analysis, all the variables representing power are standardized according to the installed capacity of RE C; the reserve thermal power capacity replaced by ESS PHir can be calculated as shown in Equation (15)
where λ represents the comprehensive charge and discharge efficiency of ESS, and Tm represents the peak demand time according to load characteristics and power retention requirements [28,29].
After ESS replaces thermal power, the starting capacity of the conventional standby thermal power units is turned into P*Tmax. The RE consumption capacity increases from x1 to xi, and the energy storage working position xi can be calculated as follows.
The energy storage cycle of pumped storage units and electrochemical energy storage basically lasts for 1 to 2 days. Therefore, it is assumed that the total amount of energy charged and discharged within 24 h of energy storage is the same, and the scenario of cross-day operation of energy storage is not considered in this paper. In order to achieve the RE consumption target, the ESS power needs to fully absorb the theoretical power between xi and xp, which is calculated by Equation (17). At this time, the ESS capacity Eb and peak power Pbmax must meet the consumption requirements of the RE maximum blocked day.
4. Optimal Configuration Analysis Method of ESS Based on “Equal Area Criterion”
The ESS configured capacity according to Figure 8 is the maximum value of Si for the whole year. The ESS only runs at full load on the day to fully play the role of RE consumption, which has rich capacity or is partially idle in other periods. Therefore, it is necessary to find a more reasonable ESS capacity allocation method. In Section 4.1, the “equal area criterion” of ESS optimization configuration is proposed to reveal the systematic principle of ESS absorbing RE. The optimal configuration process of ESS is proposed under known or unknown RE installed capacity C scenarios in Section 4.2.
4.1. “Equal Area Criterion” in ESS Optimal Configuration
The number of daily blocked hours of RE Tdi and the number of interval RE generation hours ΔTdi can be calculated from Equations (10) and (11). It is assumed that Tb represents the number of hours after converting the ESS capacity according to the installed capacity of RE C. Three kinds of curves, namely, Tdi, ΔTdi, and Tb, are shown in Figure 9.
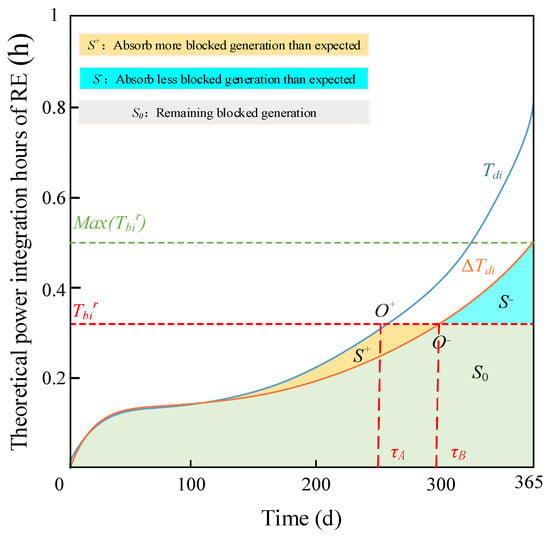
Figure 9.
“Equal area criterion” diagram in ESS optimal configuration.
As can be seen from Figure 9, the intersection point of Tdi and Tb is O+, and the intersection point of ΔTdi and Tb is O−, respectively. Then, the areas of S+ and S− are shown in Equation (18).
The goal of ESS configuration is to absorb all the daily blocked generation that is relatively stable in RE with r% probability throughout the year (that is, the area (S0 + S−) after ΔTdi integration). With O− point as the dividing line, ESS can absorb more blocked generation than is expected on one side and absorb less blocked generation than is expected on the other side. Before O− point, Tb is greater than or equal to ΔTdi; it can absorb an additional area of S+. After O− point, Tb is less than ΔTdi and it can absorb a reduced area of S−. When the amount of absorbed generation by the ESS before and after O− point is equal, the total target of the blocked absorbed generation throughout the year can be guaranteed to remain unchanged. That is called the “equal area criterion”. This method avoids allocating the ESS capacity according to the maximum daily blocked generation of RE (max(Tbr)) and reduces the probability of idle ESS capacity.
The “equal area criterion” is essentially a global optimization method. In addition, the optimal converted hours Tb of the ESS can be found via a one-dimensional search method. As shown in (19), when ΔS takes the minimum value, the optimal converted hours Tbir of the ESS can be found under the consumption capacity xi and the guaranteed rate r%.
Pb = [Pb1, Pb1, …, PbN] is the per unit value of the RE theoretical power on the day τB. The ESS on day τB needs to absorb all the theoretical power of RE between xi and max (Pb) from the working position xi. At this time, RE generation is no longer blocked. The peak ESS power Pbir and ESS time Tbir are shown in Equation (20)
where Ebir represents ESS capacity. The ESS configuration method described in this paper takes the initial consumption capacity of RE x1 as the decoupling point. The ESS configuration depends only on the RE characteristics, and the RE consumption capacity depends only on the power system balance and system parameters. According to this, Tgir, Pbir, and Ebir can be obtained under the given consumption capacity xi and guarantee rate r%.
In the guaranteed area, the ESS can replace thermal standby power start-up. From (6), the initial consumption capacity x1 of RE can be calculated. The working position of energy storage can be calculated using Equation (16). The unit value of substituted thermal power generation Δx is shown in Equation (21).
The corresponding installed capacity C of RE can be further obtained from (21), as shown in Equation (22).
At the same time, there will be a probability of 1 − r% throughout the year that the number of interval hours of RE is insufficient; if this occurs, the means of absorbing thermal power is made up. Since the probability r% is generally higher than 85%, the ESS absorbs the RE range with lower prices for a long time, and the thermal generation with relatively high prices is purchased in a short time. Positive economic benefits can still be obtained throughout the year.
In the guaranteed rate failure area, ESS cannot replace thermal power stably. At this time, the working position of ESS is the initial consumption capacity of RE x1. The installed capacity of RE C is calculated using Equation (23).
If variable i is continuously changed between 1 and m, the lower bound of the corresponding interval xi varies from x1 to xp. For each set of intervals consisting of x1 and xi, the result sets of Tgir, PHir, Tbir, Pbir, and Ebir are calculated from “equal area criterion”, as shown in Equation (24).
The ESS capacity and the RE consumption capacity can be accurately matched to realize the optimal ESS configuration under the established RE consumption target according to Equation (24). Two typical planning scenarios need to be considered. ESS optimization is carried out when the RE installed capacity is known for the year to be planned. On the contrary, it is necessary to carry out the collaborative optimization of RE and ESS.
4.2. Optimized Configuration Process of ESS Based on “Equal Area Criterion”
When the installed capacity of RE C is known, the optimized configuration process of ESS is shown as follows.
- (a)
- The initial consumption capacity of RE x1 is determined from Equation (23) according to the known parameters PLmax, α, β and ε in the planned year.
- (b)
- The ESS working position xi is calculated from Equation (21). It is necessary to determine whether the ESS working position is in the guaranteed rate failure area.
- (c)
- If the ESS working position is in the guaranteed rate failure area, the working position of ESS will be the initial consumption capacity of RE x1.
- (d)
- If the ESS working position is in the guaranteed rate area, taking xi as the independent variable and Tgir as the dependent variable, the function F1 is obtained as shown in (25). The function F2 fitted from the result set of Equation (24) is shown in Equation (25).
- (e)
- The intersection abscissa of the function F1 and F2 is defined as xF, as shown in Figure 10. The various parameters of ESS (Tbir, Pbir, and Ebir) in the planned year can be obtained by interpolating the results in Equation (24). The specific calculation process is shown in Figure 11.
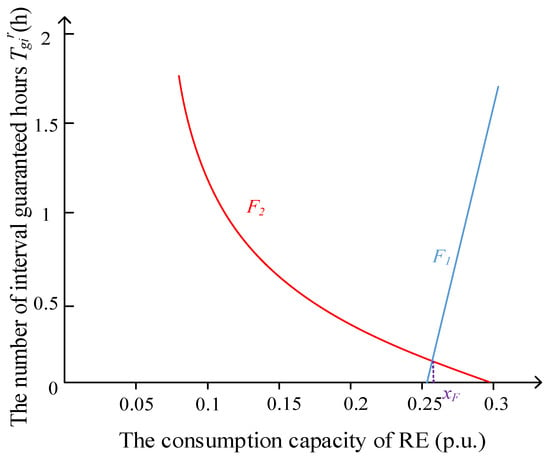 Figure 10. The function F1 and F2.
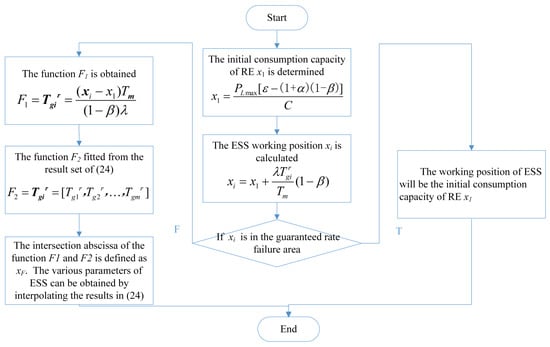 Figure 11. Optimized configuration process of ESS under the known RE capacity.
When the installed capacity of RE C is unknown, the collaborative configuration process of ESS and RE is shown as follows.
- (a)
- The set of initial consumption capacity x1 of RE can be obtained according to λ, β, Tm and the result sets of Equation (24), as shown in Equation (26).
- (b)
- The set of RE installed capacity C can be determined according to the RE consumption capacity calculation method of Equation (6).
- (c)
- The set of RE installed capacity C is converted into the set of RE penetration rate θ according to the planned load.
- (d)
- Taking the working position of ESS xi as the corresponding point, the relationship between ESS capacity and RE penetration rate is established.
At this time, the obtained installed capacity of ESS and RE is the m group solution. According to the desired combination, the installed capacity of RE and the corresponding ESS configuration can be selected. The specific calculation process is shown in Figure 12.
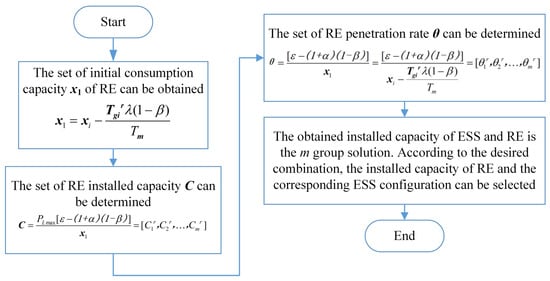
Figure 12.
The collaborative configuration process of ESS and RE under the unknown RE capacity.
5. Case Study
5.1. The Parameter
The power grid of Q region in China is taken as an example for the purpose of proving the proposed method reasonable and effective in Section 5. The required 2025 load and RE theoretical power data are derived from the dispatch energy management system. The load and RE theoretical power data of Q region are shown in Figure A1, Figure A2 and Figure A3, and other parameters are shown in Table 1.

Table 1.
The power system parameters.
5.2. RE Consumption Characteristic Curve Simulation
According to the above data, taking xi as the independent variable and ηi as the dependent variable, the consumption characteristic curve of RE can be drawn. The analysis of Figure 13 shows that when variable i increases between 1 and m, it means that the installed capacity of RE C increases. According to (6), the penetration rate of RE θ will increase, and the consumption capacity x will decrease. The reduction in consumption capacity x will increase the gap between the theoretical and actual power generation, and ultimately reduce the utilization rate of RE η. Therefore, when the consumption capacity of RE is abundant, the utilization rate of RE can reach 100%, meaning that all the RE electricity generated is consumed. However, it has been calculated that the RE utilization rate decreases rapidly when the RE consumption capacity is reduced below 52 percent.
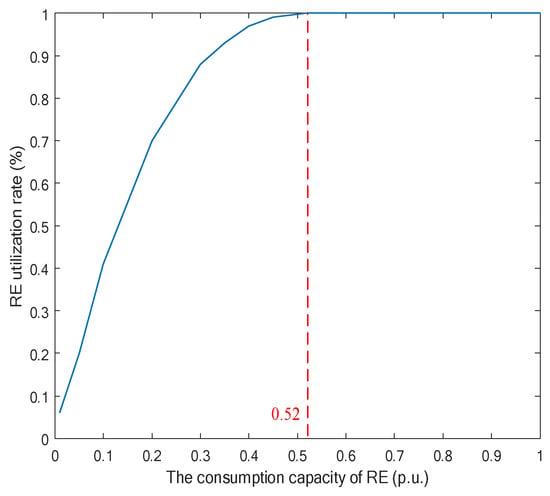
Figure 13.
The consumption characteristic curve of RE in this case study.
In addition, under different wind power and photovoltaic installed ratios, the same installed capacity of RE will affect the RE consumption characteristics curve. The corresponding RE consumption characteristic curve under different RE installed ratios is shown in Figure 14. When the installed ratio of wind power is 20% or above, the RE consumption characteristic curve does not change much. In the opposite scenario, the consumption curve changes significantly. Compared with the same capacity of wind power generation, excessive photovoltaic installed capacity will lead to a reduction in the utilization of RE because it will cause power generation blocking in the noon solar full power generation. Therefore, the RE consumption characteristic curve should be determined according to the given proportion of wind power and photovoltaic installed capacity in the planning year.
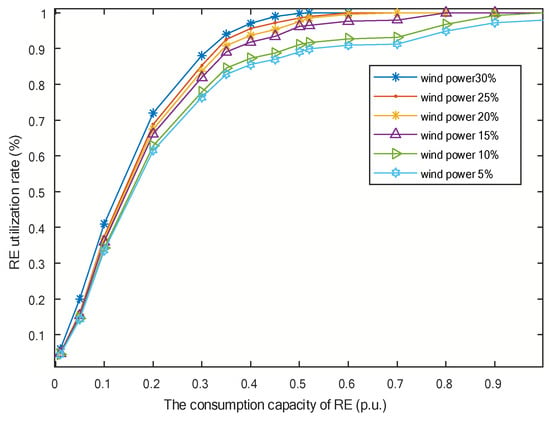
Figure 14.
The corresponding RE consumption characteristic curve under different wind power installed ratio.
5.3. Optimized Configuration of ESS for the Known Installed Capacity of RE
5.3.1. Optimized Calculation Process of ESS Configuration
The planning year boundary adopts the data for 2025; the maximum load PLmax is 2.01 × 10⁴ MW from Figure A1 and the installed capacity of RE is 2.4 × 10⁴ MW. Among them, the installed capacity of wind power is 7.2 × 10³ MW, and the installed capacity of photovoltaic power is 1.68 × 10⁴ MW. The ESS configuration result set from Equation (24) is calculated in Table 2 according to the “equal area criterion” method.

Table 2.
The ESS configuration result set according to the “equal area criterion” method.
From Table 2, it can be seen that increasing the ESS working position of (xi from 0.1 to 0.3) will make the interval of RE blocking power consumption by ESS smaller. Therefore, the variable Tgir, Ebir, and Pbir will decrease with the increase in the ESS working position. When the ESS working position increases to 0.29 (Tgir = 0), it means that the RE consumption capacity has entered the guaranteed failure region according to Figure 7, which will lead to the phenomenon of abandoned wind and solar energy.
The ESS working position is calculated as follows. Firstly, the initial consumption capacity x1 of RE is calculated. According to Equation (29), the initial consumption capacity x1 can be obtained as 0.267 (p.u.). In addition, the critical value of RE consumption capacity is 0.28 (p.u.), according to Table 2, and the initial consumption capacity x1 of RE is within the guaranteed region.
The ESS working position is in the guaranteed rate area, taking xi as the independent variable, Tgir as the dependent variable, the function F1 is obtained as shown in Equation (30). The function F2 fitted from Table 2. The functions F1 and F2 are shown as Figure 15.
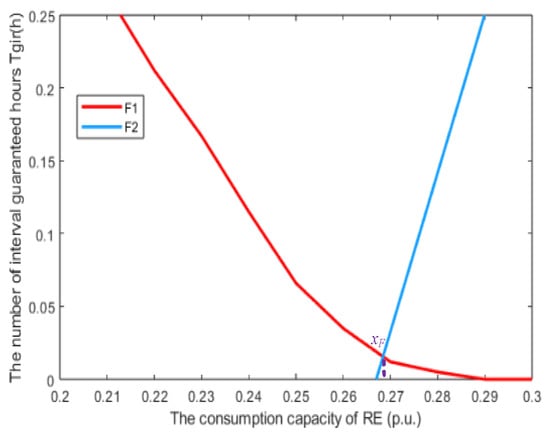
Figure 15.
The intersection abscissa of the function F1 and F2.
The intersection abscissa xF of the functions F1 and F2 is calculated as 0.269 (p.u.). Therefore, the ESS working position is 0.269 (p.u.). The various parameters of ESS (Tb, Pb and Eb) can be obtained by interpolating the results in Table 2. The results of ESS configuration parameters are shown in Table 3.

Table 3.
The results of ESS configuration parameters.
The ESS can still work 6.38 h at peak power, meeting the requirement of 4.5 h of guaranteed supply. Taking the ESS configuration results in Table 3 as an example, the optimal configuration of the “equal area criterion” method is explained, as shown in Figure 16.
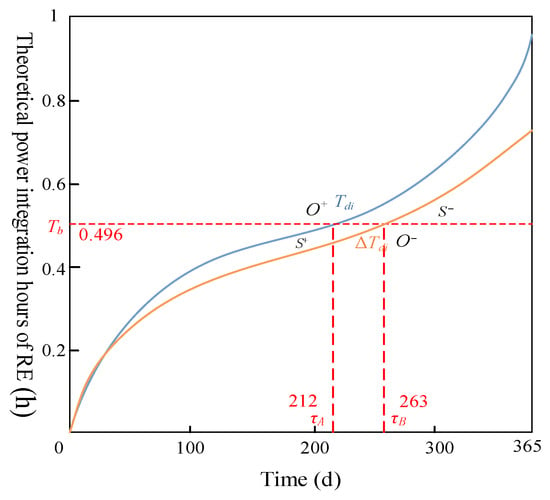
Figure 16.
The configuration process based on “equal area criterion”.
Tdi and ΔTdi are arranged from small to large in Figure 16. The optimal converted hours Tb of the ESS is calculated at 0.496. The goal of ESS configuration is to absorb all the daily blocked generation that is relatively stable in RE, with r% probability throughout the year (that is, the area (S0 + S−) after ΔTdi integration). With O− point as the dividing line, the ESS can absorb more blocked generation than expected on one side and absorb less blocked generation than expected on the other side. Before O− point, Tb is greater than or equal to ΔTdi, being able to absorb an additional area of S+. After O− point, Tb is less than ΔTdi, and it can absorb a reduced area of S−. When the amount of absorbed generation by the ESS before and after O− point is equal, the total target of the blocked absorbed generation throughout the year can be guaranteed to remain unchanged. The method of “equal area criterion” avoids allocating the ESS capacity according to the maximum daily blocked generation of RE and reduces the probability of idle ESS capacity.
The ESS on day τB (τB = 263) needs to absorb all the theoretical power of RE between xi and max (Pb) from working position xi. At this point, RE power generation is no longer blocked. The working principle diagram of the ESS on day τB (τB = 263) is shown in Figure 17. It can be seen that the working position of the ESS varies between 0.269 and 0.347, absorbing all the theoretical power of RE.
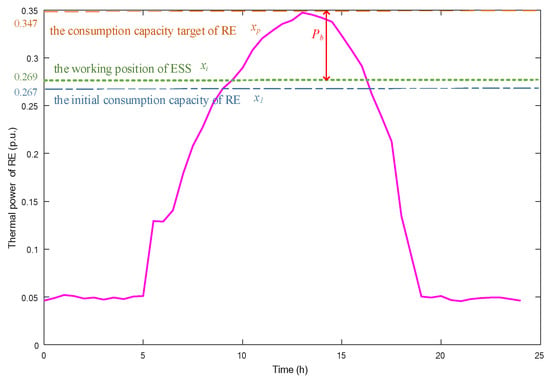
Figure 17.
The working principle diagram of the ESS on day τB.
The simulation results of the configured ESS on day τB (τB = 263) are shown in Figure 18. The ESS is used to absorb RE interval guaranteed generation (8:00–16:20), and then discharge during peak load hours (18:00–21:30). At this time, the RE blocking power absorbed by ESS is just equal to the ESS capacity (1.195 × 10⁴ MWh). The peak charging power of ESS Pb is calculated to be 0.078 (p.u.) (1.872 × 10³ MW).
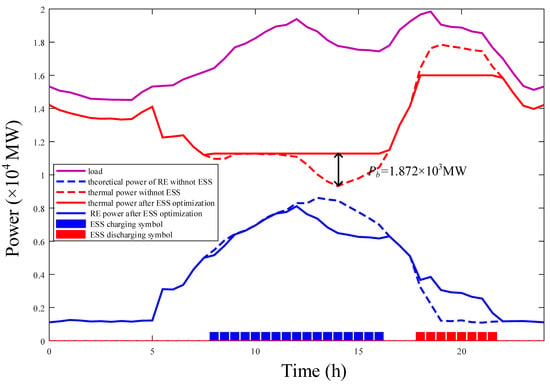
Figure 18.
The simulation results on day τB.
5.3.2. The Comparison between the Proposed Method and Production Simulation
The comparison between the proposed method and the time series production simulation is shown in Table 4. From the results, it can be observed that the proposed method is capable of saving 1.41 × 10³ MWh of ESS capacity compared to the production simulation method. In addition, the time series production simulation method can obtain the ESS capacity configuration through multiple simulation calculations. This process lacks a theoretical basis and relies excessively on the accuracy of forecast data. Deviations in forecast data can result in the existence of excess capacity or a lack of configured capacity. The time series production simulation method requires real-time calculations based on forecast data, and the number of calculations is huge. On the contrary, the relationship between the variables in this proposed method can be mapped by analytical expression or statistical rule. In addition, this technique has the advantage of high calculation efficiency.

Table 4.
The comparison between the proposed method and the time series production simulation.
The curve of ESS capacity obtained using the proposed method and the time series production simulation method is shown in Figure 19 under different RE penetration rates. The proposed method can save 1.41 × 10³ MWh (11.4%) of ESS capacity under current penetration rates compared to the time series production simulation method. As RE penetration increases, so does the gap in its ESS capacity configuration. ESS configured capacity is the maximum shortfall of RE consumption for the whole year in the time series production simulation method.
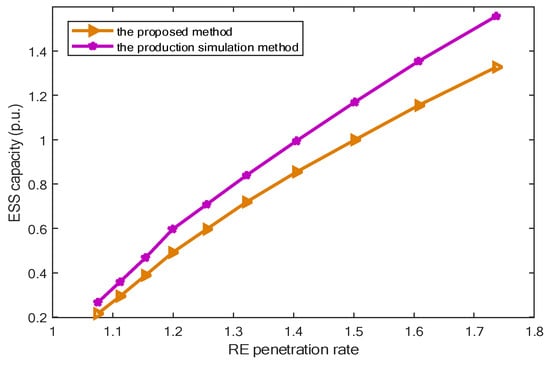
Figure 19.
The compared curve of ESS capacity under different RE penetration rates.
The ESS only runs at full load on the day to fully provide RE consumption, which can either show rich capacity or be partially idle depending on the period. In this proposed method, the equal area optimization of ESS capacity is adopted to reduce the ESS capacity configuration. The ESS absorbs more blocked power than expected on one side and less blocked power than expected on the other side. The total target of the blocked absorbed generation throughout the year can be guaranteed to remain unchanged. The method of “equal area criterion” avoids allocating the ESS capacity according to the maximum daily blocked generation of RE, and reduces the probability of idle ESS capacity. Therefore, the ESS capacity of the proposed method is smaller, and the configuration is more economical and efficient, under the same RE utilization target.
5.4. Collaborative Configuration of RE and ESS for the Unknown RE Installed Capacity
5.4.1. Collaborative Configuration Process of RE and ESS
When the installed capacity of RE is unknown, it is necessary to carry out collaborative planning of ESS and RE. ESS parameters are configured according to the process in Figure 12.
Firstly, the initial consumption capacity set x1 of RE is calculated according to Equation (31).
Then, it is necessary to calculate the set of RE penetration rate θ corresponding to the initial consumption capacity set x1, as shown in Table 5.

Table 5.
Collaborative configuration results of ES and RE (p.u.).
At this time, the desired results are selected from Table 5 to guide the RE and ESS configuration based on the actual situation. The ESS capacity and the RE consumption capacity can be accurately matched to realize the optimal ESS configuration under the established RE consumption target.
5.4.2. The Impact of RE Penetration and Thermal Power Peak Regulation Rate on RE and ESS Collaborative Configuration
In addition, the change in RE penetration rate in relation to ESS capacity and peak power needs to be considered in the collaborative deployment of renewable energy and ESS. As can be seen from Figure 20, when the penetration rate of RE increases, the difficulty of RE consumption increase in concert with the demand for ESS capacity and peak power. Excessive ESS capacity and peak power can lead to dramatic cost increases. Therefore, the selection of the appropriate installed capacity of RE and ESS according to Table 5 and Figure 20 is based on economic and technical requirements.
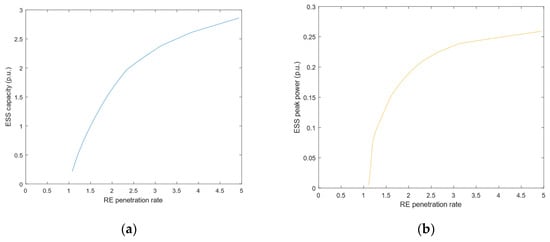
Figure 20.
The impact of RE penetration on ESS configuration. (a) The relationship between ESS capacity and RE penetration rate; (b) the relationship between ESS peak power and RE penetration rate.
The sensitivity analysis of the variable β (the peak regulation rate of thermal power) is shown in Figure 21. It can be seen that the peak regulation rate of thermal power can also have a huge impact on RE and ESS collaborative configuration. Using β data (40%, 40%, 60%) for reference, the system’s ability to handle RE fluctuations is improved, and the demand for ESS is reduced when the thermal power peak regulation rate increases. On the contrary, an excessive regulation rate of thermal power will lead to a large number of thermal power units in hot standby mode, resulting in energy consumption, increased carbon emissions and environmental pollution, and a whole series of problems. Therefore, the collaborative configuration of RE and ESS also needs to consider the maximum regulation capacity of thermal power allowed by the relevant policy.
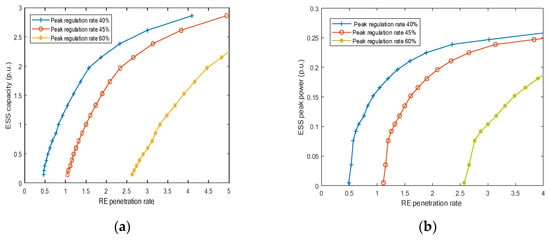
Figure 21.
The sensitivity analysis of thermal power peak regulation rate. (a) The relationship between ESS capacity and RE penetration rate under different β; (b) the relationship between ESS peak power and RE penetration rate under different β.
5.5. Discussion
In this section, a case study of the ESS optimization configuration method based on “equal area criterion” is analyzed for a regional power grid in China. The results show that this method provides a more “mathematical” and “convenient” system solution for RE consumption and ESS optimization compared with the time series production simulation method. The data discussion for this case study proceeds as follows.
- (1)
- The data discussion of the RE consumption characteristic curve
When the consumption capacity of RE is abundant, the utilization rate of RE can reach 100%, meaning that all the RE electricity generated is consumed. However, it has been calculated that the RE utilization rate decreases rapidly when the RE consumption capacity is reduced below 52%. In addition, when the installed ratio of wind power is 20% or above, the RE consumption characteristic curve does not change much. On the contrary, the consumption curve changes significantly. Compared with the same capacity of wind power generation, excessive photovoltaic installed capacity will lead to a reduction in the utilization of RE as it will cause power generation blocking in the noon solar full power generation. Therefore, the RE consumption characteristic curve should be determined according to the given proportion of wind power and photovoltaic installed capacity in the planning year.
- (2)
- The data comparison between the proposed method and the time series production simulation
The proposed method can save 1.41 × 10³ MWh of ESS capacity under current penetration rates. As RE penetration increases, so does the gap in its ESS capacity configuration from Figure 19. The ESS configured capacity is the maximum shortfall of RE consumption for the whole year in the time series production simulation method. The ESS only runs at full load on the day to fully play the role of RE consumption, which moves between rich capacity and being partially idle in other periods. In this proposed method, the equal area optimization of ESS capacity is adopted to reduce the ESS capacity configuration. The ESS absorbs more blocked power than expected on one side and less blocked power than expected on the other side. The total target of the blocked absorbed generation throughout the year can be guaranteed to remain unchanged. The method of “equal area criterion” avoids allocating the ESS capacity according to the maximum daily blocked generation of RE and reduces the probability of idle ESS capacity. Therefore, the ESS capacity of the proposed method is smaller, and the configuration is more economical and efficient under the same RE utilization target.
- (3)
- The impact analysis of RE penetration and thermal power peaking rate on ESS configuration
Figure 20 shows that when the penetration rate of RE increases, the difficulty of RE consumption will increase, and the demand for ESS capacity and peak power will increase at the same time. Excessive ESS capacity and peak power can lead to dramatic cost increases. Figure 21 shows that the system’s ability to handle RE fluctuations will be improved, and the demand for ESS will be reduced when the thermal power peak regulation rate increases. However, an excessive peak regulation rate of thermal power will lead to energy consumption, increased carbon emissions, environmental pollution, and a series of problems. Therefore, it is necessary to rationalize the RE penetration rate and the thermal power peaking rate in order to realize the balance between the economy of ESS investment, RE utilization rate, and the proportion of RE generation.
6. Conclusions and Future Work
6.1. Conclusions
The ESS optimal configuration process based on the “equal area criterion” is proposed to achieve an accurate match between the ESS capacity demand and the RE consumption target. The power grid of the Q region in China is taken as an example. The following conclusions can be drawn from the study and analysis of the study case.
- For a defined grid, the reserve rate α, the load rate ε, the peak regulation rate β, and the penetration rate of RE θ are all defined boundary conditions. Thus, the organic combination of RE power generation characteristics and system balance is realized via the construction of an RE consumption characteristic curve. The power balance model of an unconstrained grid with RE is established and statistical features are proposed such as “RE consumption characteristic curve” and “interval guarantee hours”. The constraints between the installed capacity of renewable energy, the utilization rate of renewable energy, and the proportion of renewable energy power generation are described mathematically. An arithmetic analysis of the RE consumption characteristic curve reveals that the RE utilization rate decreases rapidly when the RE consumption capacity is reduced below 52%. In addition, when the installed ratio of wind power is 20% or above, the RE consumption characteristic curve does not change much.
- The “equal area criterion” is adopted to reduce the ESS capacity configuration. The ESS absorbs more blocked power than expected on one side and less blocked power than expected on the other side. The total target of the blocked absorbed generation throughout the year can be guaranteed to remain unchanged. The method of “equal area criterion” avoids allocating the ESS capacity according to the maximum daily blocked generation of RE and reduces the probability of idle ESS capacity. Therefore, the ESS capacity of this method is smaller, and the configuration is more economical and efficient under the same RE utilization target. The ESS capacity and the RE consumption capacity can be accurately matched to realize the optimal ESS configuration under the established RE consumption target. The proposed method can save 1.41 × 10³ MWh (11.4%) of ESS capacity and the calculation time is reduced from 60 min to 5 min compared to the time series production simulation method.
- The ESS and RE configuration scenarios are obtained based on fitting and interpolation methods in accordance with the known and unknown scenarios of RE installed capacity in the planning year. If the penetration rate of RE increases, the demand for ESS capacity and peak power will increase at the same time in case study results. Excessive ESS capacity and peak power can lead to dramatic cost increases. However, the demand for ESS will be reduced when the thermal power peak regulation rate increases. The increase in peak regulation rate will lead to energy consumption, increased carbon emissions, environmental pollution, and a series of problems. Therefore, it is necessary to rationalize the RE penetration rate and the thermal power peaking rate in order to realize the balance between the economy of ESS investment, RE utilization rate, and the proportion of RE generation.
6.2. Limitations and Future Work
This paper makes a partial contribution to the theoretical study of the optimal allocation of ESS for RE consumption, operating based on “equal area criterion”. However, there are still some limitations in its usage scenarios, and future research can be improved in the following regards:
- The effect of the energy storage type on the optimized configuration of the ESS based on “equal area criterion” is not considered in this study. Adding ESS to the wind power system can effectively suppress random fluctuations and improve the transmission characteristics of wind power. Since it is difficult for a single type of ESS to meet the technical and economic requirements, future work needs to investigate the effects of the combination of different ESS types and their optimal configuration on the RE consumption from the perspective of theoretical analysis. This group has already discussed the optimal economic allocation strategy for ESS under the requirement of wind power intermittency [30] in a previous study. The next step will be to combine the equal area criterion with the comparative analysis of energy storage types to determine optimal allocation of ESS.
- The calculated speed of the ESS-optimized configuration method can continue to be improved by improving the intelligent algorithm. Smarter algorithms can significantly reduce the computation time to accommodate real-time energy storage state adjustments. For example, the backwards induction algorithm [31] can work along with the equal area criterion for energy storage. The machine learning-enhanced bender decomposition approach [32,33] can also be used to solve this calculation.
- The equal area criterion method is mainly used for energy storage allocation from the perspective of RE consumption. The demand-side response and economic analysis of energy storage configuration can be added in the next step. The smart technologies used in [34,35] can be integrated into the method of this paper, allowing the ESS configuration to achieve a balance between technical, economic, and policy.
Author Contributions
All authors contributed to improving the quality of the manuscript. Specifically, Y.L. conceptualized the idea of this research and carried out the theoretical analysis. Z.W. contributed to the designed the methodology and case study, writing and revising the paper. Y.Z. provided important comments on the structure, language, and format of the paper. Y.W. provided the data for the example. L.Z. contributed to the writing and revising of the paper. All authors have read and agreed to the published version of the manuscript.
Funding
This work was supported by the State Grid Science and Technology Project (No.5100-202356023A-1-1-ZN).
Data Availability Statement
Data are contained within the article.
Conflicts of Interest
Authors Yizheng Li, Zhidong Wang and Lang Zhao were employed by the company State Grid Economic and Technological Research Institute Co., Ltd. Author Yao Wang was employed by the company Economic and Technological Research Institute of State Grid Shanxi Electric Power Co., Ltd. The companies had no role in the design of the study; in the collection, analyses, or interpretation of data; in the writing of the manuscript; or in the decision to publish the results. The remaining author declares that the research was conducted in the absence of any commercial or financial relationships that could be construed as a potential conflict of interest.
Nomenclature
| PR | theoretical power of RE | Dij | blocked power of RE under the consumption capacity xi at time j |
| PS | absorbed power of RE | Dpj | blocked power of RE under the consumption capacity target xp at time j |
| PSave | average absorbed power of RE | N | series length of RE theoretical power |
| PL | load | ΔTdi | the number of interval RE generation hours |
| PLmax | maximum load | ΔTdi | daily interval RE generation hours sequence |
| PLave | average load | r% | guarantee rate |
| PTmin | minimum technical output of conventional thermal power units | Qir | the quantile of interval RE generation hours |
| PT max | the starting capacity of the conventional thermal power standby units | Tgir | the number of RE interval guaranteed hours |
| α | system reserve rate | Egir | guaranteed power generation of RE |
| ε | system load rate | Tgir | RE interval guaranteed hours sequence |
| β | peak regulation rate of thermal power | xk | critical value of RE consumption capacity |
| ES | absorbed power generation of RE obtained by integrating PS | Tgkr | critical number of interval guaranteed hours corresponding to the r% probability |
| EL | total power generation obtained by integrating PL | x1 | the initial consumption capacity of RE without considering ESS |
| T | the number of hours in one year | PHir | reserve thermal power capacity replaced by ESS |
| θ | penetration rate of RE | λ | comprehensive charge and discharge efficiency of ESS |
| C | the installed capacity of RE | Tm | peak demand time |
| x | consumption capacity of RE | P*Tmax | the starting capacity of the standby units after ESS replaces thermal power |
| xi | the consumption capacity of RE under i interval | Eb | ESS capacity |
| xp | consumption capacity target of RE | Pbmax | ESS peak power |
| TR | theoretical hours of RE | Tb | the number of hours after converting the ESS capacity Eb |
| ER | theoretical generation of RE | O+ | intersection point of Tdi and Tb |
| R | The proportion of RE power generation | O− | intersection point of ΔTdi and Tb |
| S | Resource coefficient of RE | Tbir | optimal converted hours of ESS under the consumption capacity xi and guaranteed rate r% |
| η | RE utilization rate | Pbir | optimal peak ESS power under the consumption capacity xi and guaranteed rate r% |
| pj | normalized theoretical power at time j | Ebir | optimal ESS capacity under the consumption capacity xi and guaranteed rate r% |
| PREij | actual power of RE under i interval at time j | Δx | the unit value of substituted thermal power generation |
| ηi | RE utilization rate under i interval | xi | the sequence of xi |
| ηp | RE utilization rate target | xF | intersection abscissa of the function F1 and F2 |
| Tdi | the number of daily blocked hours of RE under the consumption capacity xi | C | the sequence of C |
| Tdp | the number of daily blocked hours of RE under the consumption capacity target xp | θ | the set of RE penetration rate |
Appendix A
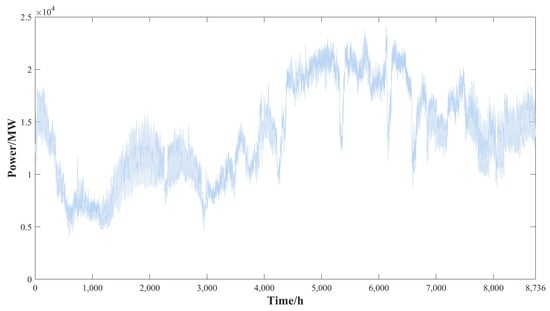
Figure A1.
The load data of Q region.
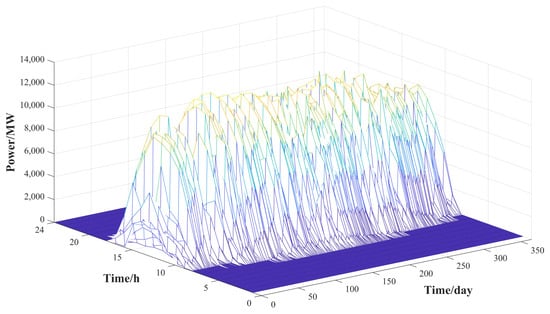
Figure A2.
The photovoltaic power generation data of Q region.
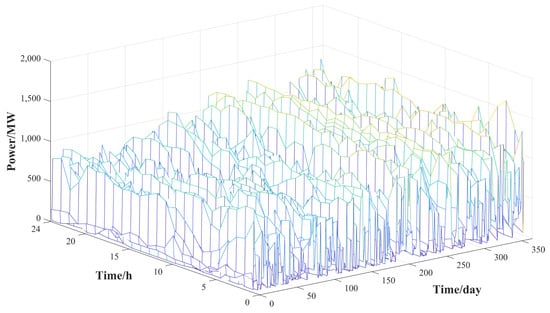
Figure A3.
The wind power generation data of Q region.
References
- National Development and Reform Commission; National Energy Administration; Ministry of Finance; Ministry of Natural Resources; Ministry of Ecological Environment; Ministry of Housing and Urban-Rural Development; Ministry of Agriculture and Rural Development; China Meteorological Administration; State Forestry and Grassland Administration. Notice on Issuing the 14th Five-Year Plan for the Development of Renewable Energy. Available online: https://www.ndrc.gov.cn/xxgk/zcfb/ghwb/202206/t20220601_1326719.html (accessed on 21 October 2021). (In Chinese)
- National Development and Reform Commission; National Energy Administration. Notice of the National Energy Administration of the National Development and Reform Commission on the issuance of the Implementation Plan for the Development of New Energy Storage in the 14th Five-Year Plan. Available online: https://www.ndrc.gov.cn/xxgk/zcfb/tz/202203/t20220321_1319772.html (accessed on 29 January 2022). (In Chinese)
- Tan, K.M.; Babu, T.S.; Ramachandaramurthy, V.K.; Kasinathan, P.; Solanki, S.G.; Raveendran, S.K. Empowering smart grid: A comprehensive review of energy storage technology and application with renewable energy integration. Energy Storage 2021, 39, 102591. [Google Scholar] [CrossRef]
- Zhigang, Z.; Chongqing, K. Challenges and prospects for constructing the new-type power system towards a carbon neutrality future. Proc. CSEE 2022, 42, 2806–2818. [Google Scholar]
- Sufyan, M.; Rahim, N.A.; Aman, M.M.; Tan, C.K.; Raihan, S.R.S. Sizing and applications of battery energy storage technologies in smart grid system: A review. Renew. Sustain. Energy 2019, 11, 14105. [Google Scholar] [CrossRef]
- Ni, J.; Zhang, Y.; Shi, H.; Zhang, G.; Qin, X.; Ding, B. Pumped Storage Quantification in Promoting New Energy Consumption Based on Time Series Production Simulation. Power Syst. Technol. 2023, 47, 2799–2809. [Google Scholar]
- Agajie, T.F.; Ali, A.; Fopah-Lele, A.; Amoussou, I.; Khan, B.; Velasco, C.L.R.; Tanyi, E. A Comprehensive Review on Tech-no-Economic Analysis and Optimal Sizing of Hybrid Renewable Energy Sources with Energy Storage Systems. Energies 2023, 16, 642. [Google Scholar] [CrossRef]
- Mingjie, L.; Guoping, C.; Cun, D.; Zhifeng, L.; Weisheng, W.; Gaofeng, F.N. Research on power balance of high proportion renewable energy system. Power Syst. Technol. 2019, 43, 3979–3986. [Google Scholar]
- Qiu, T.; Xu, B.; Wang, Y.; Dvorkin, Y.; Kirschen, D.S. Stochastic multistage coplanning of transmission expansion and energy storage. IEEE Trans. Power Syst. 2017, 32, 643–651. [Google Scholar] [CrossRef]
- Li, X.; Yao, L.; Hui, D. Optimal control and management of a large-scale battery energy storage system to mitigate fluctuation and intermittence of renewable generations. J. Mod. Power Syst. Clean Energy 2016, 4, 593–603. [Google Scholar] [CrossRef]
- Yu, P.; Wan, C.; Song, Y.; Jiang, Y. Distributed Control of Multi-Energy Storage Systems for Voltage Regulation in Distribution Networks: A Back-and-Forth Communication Frameworks. IEEE Trans. Smart Grid 2020, 12, 1964–1977. [Google Scholar] [CrossRef]
- Yang, X.; Guo, Q.; Liu, X.; Zhou, Z.; Yan, G.; Zhang, H. Source-Storage-Grid Joint Planning Method Considering Coupling Relationship of Wind Power Curtailment Events. Autom. Electr. Power Syst. 2023, 47, 53–60. [Google Scholar]
- Georgiou, S.; Aunedi, M.; Strbac, G.; Markides, C.N. On the Value of Liquid-Air and Pumped-Thermal Electricity Storage Systems in Low-Carbon Electricity Systems. Energy 2020, 193, 116680. [Google Scholar] [CrossRef]
- Tsai, C.T.; Beza, T.M.; Wu, W.B.; Kuo, C.C. Optimal configuration with capacity analysis of a hybrid renewable energy and storage system for an island application. Energies 2020, 13, 8. [Google Scholar] [CrossRef]
- Shang, J.; Liu, J.; Li, G.; Tang, L.; Zhao, J. Coordinated Planning of Photovoltaic, Energy Storage and Distribution Network Based on Probabilistic Time Series Production Simulation. Proc. CSU-EPSA. Available online: https://hfffgc1d129f57bb244a4swfunn9upp9ck6nb5fgfy.eds.tju.edu.cn/kcms2/article/abstract?v=2Wn7gbiy3W-HpktQH0Nwq9_NzfN2sGJ9j4KIwqCpqz2rpBwUSZLjB285M4c5Ix6kVvndRjrfPu0cMmKsJTltK8qjdLwBUnWZWCD1SPPd8UIEqC5f7DM6F_JZKWaMObJ1aWAS3PAk7TA=&uniplatform=NZKPT&language=CHS (accessed on 16 May 2023). (In Chinese).
- Radzi, N.H.; Bansal, R.C.; Dong, Z.Y. An efficient distribution factors enhanced transmission pricing method for Australian NEM transmission charging scheme. Renew. Energy 2013, 53, 319–328. [Google Scholar] [CrossRef]
- Wu, W.; Hu, Z.; Song, Y. Optimal sizing of energy storage system for wind farms combining stochastic programming and sequential Monte Carlo simulation. Power Syst. Technol. 2018, 42, 1055–1062. [Google Scholar]
- Soltani, N.Y.; Nasiri, A. Chance-Constrained Optimization of Energy Storage Capacity for Microgrids. IEEE Trans. Smart Grid 2020, 11, 2760–2770. [Google Scholar] [CrossRef]
- Su, S.; Tan, D.; Li, X.; Li, X.; Chen, Z.; Lian, R.; Lenz, S.; Blaise, K. Multi-time scale coordinated optimization of new energy high permeability power system considering flexibility requirements. J. Electr. Eng. Technol. 2023, 18, 815–828. [Google Scholar] [CrossRef]
- Kodaira, D.; Jung, W.; Han, S. Optimal Energy Storage System Operation for Peak Reduction in a Distribution Network Using a Prediction Interval. IEEE Trans. Smart Grid 2019, 11, 2208–2217. [Google Scholar] [CrossRef]
- Bai, X.; Wu, H.; Yang, S.; Li, Z. Probabilistic production simulation of a wind/photovoltaic/energy storage hybrid power system based on sequence operation theory. IET Gener. Transm. Distrib. 2018, 11, 2700–2706. [Google Scholar] [CrossRef]
- Zhu, R.; Hu, B.; Xie, K.; Zhu, Q.; Zhao, D.; Niu, T.; Li, C.; Sun, Y. Sequential Probabilistic Production Simulation of Multi-energy Power System with Wind Power, Photovoltaics, Concentrated Solar Power, Cascading Hydro Power, Thermal Power and Battery Energy Storage. Power Syst. Technol. 2020, 44, 3246–3253. (In Chinese) [Google Scholar]
- Li, F.; Li, X.; Zhang, B.; Li, Z.; Lu, M. Multi-objective Optimization Configuration of a Prosumer’s Energy Storage System Based on an Improved Fast Nondominated Sorting Genetic Algorithm. IEEE Access 2021, 9, 27015–27025. [Google Scholar] [CrossRef]
- Rathore, A.; Patidar, N.P. Optimal sizing and allocation of renewable based distribution generation with gravity energy storage considering stochastic nature using particle swarm optimization in radial distribution network. J. Energy Storage 2021, 35, 102282. [Google Scholar] [CrossRef]
- Peng, C.; Xiong, Z.; Zhang, Y.; Zheng, C. Multi-objective robust optimization allocation for energy storage using a novel confidence gap decision method. Int. J. Electr. Power Energy Syst. 2022, 138, 107902. [Google Scholar] [CrossRef]
- Byers, C.; Botterud, A. Additional Capacity Value from Synergy of Variable Renewable Energy and Energy Storage. IEEE Trans. Sustain. Energy 2019, 11, 1106–1109. [Google Scholar] [CrossRef]
- Sun, W.; Gong, Y.; Luo, J. Energy storage configuration of distribution networks considering uncertainties of generalized demand-side resources and renewable energies. Sustainability 2023, 15, 1097. [Google Scholar] [CrossRef]
- Q/GDW 11628—2016.S; Guidelines for the Analysis of Power System Accommodation Renewable Energy Capability. Press of State Grid Corporation of China: Beijing, China, 2017. (In Chinese)
- GB/T 31464—2015.s; General Administration of Quality Supervision, Inspection and Quarantine of the People’s Republic of China, Standardization Administration of the People’s Republic of China. Standards Press of China: Beijing, China, 2015. (In Chinese)
- Zhao, L.; Zeng, Y.; Peng, D.; Li, Y. Optimal Economic Allocation Strategy for Hybrid Energy Storage System under the Requirement of Wind Power Fluctuation. In Proceedings of the IEEE Power and Energy Society General Meeting, Orlando, FL, USA, 16 July 2023. [Google Scholar]
- Giannelos, S.; Borozan, S.; Strbac, G. A Backwards Induction Framework for Quantifying the Option Value of Smart Charging of Electric Vehicles and the Risk of Stranded Assets under Uncertainty. Energies 2022, 15, 3334. [Google Scholar] [CrossRef]
- Borozan, S.; Giannelos, S.; Falugi, P.; Moreira, A.; Strbac, G. A Machine Learning-Enhanced Benders Decomposition Approach to Solve the Transmission Expansion Planning Problem under Uncertainty. arXiv 2023, arXiv:2304.07534. [Google Scholar]
- Feng, C.; Zhang, J.; Zhang, W.; Hodge, B.-M. Convolutional neural networks for intra-hour solar forecasting based on sky image sequences. Appl. Energy 2022, 310, 118438. [Google Scholar] [CrossRef]
- Davari, M.M.; Ameli, H.; Ameli, M.T.; Strbac, G. Impact of Local Emergency Demand Response Programs on the Operation of Electricity and Gas Systems. Energies 2022, 15, 2144. [Google Scholar] [CrossRef]
- Giannelos, S.; Borozan, S.; Aunedi, M.; Zhang, X.; Ameli, H.; Pudjianto, D.; Konstantelos, I.; Strbac, G. Modelling Smart Grid Technologies in Optimisation Problems for Electricity Grids. Energies 2023, 16, 5088. [Google Scholar] [CrossRef]
Disclaimer/Publisher’s Note: The statements, opinions and data contained in all publications are solely those of the individual author(s) and contributor(s) and not of MDPI and/or the editor(s). MDPI and/or the editor(s) disclaim responsibility for any injury to people or property resulting from any ideas, methods, instructions or products referred to in the content. |
© 2023 by the authors. Licensee MDPI, Basel, Switzerland. This article is an open access article distributed under the terms and conditions of the Creative Commons Attribution (CC BY) license (https://creativecommons.org/licenses/by/4.0/).