Article

Numerical Investigation of Unsteady Rotor–Stator Interaction Mechanism and Wake Transportation Characteristics in a Compressor with Non-Uniform Tip Clearance Rotor

1
School of Aero-Engine, Shenyang Aerospace University, Shenyang 110136, China
2
School of Power and Energy, Northwestern Polytechnical University, Xi’an 710072, China
*
Author to whom correspondence should be addressed.
Energies 2023, 16(23), 7907; https://doi.org/10.3390/en16237907
Submission received: 4 November 2023 / Revised: 24 November 2023 / Accepted: 29 November 2023 / Published: 4 December 2023
(This article belongs to the Special Issue Computational Fluid Dynamics in Gas Turbines)

Abstract

:
This study aims to numerically investigate a transonic compressor by solving the unsteady Reynolds-averaged Navier–Stokes equations. The flow mechanisms related to unsteady flow were carefully examined and compared between rotors with non-uniform tip clearance (D1) and small-value tip clearance (P1). The unsteady flow field near the 50% and 95% blade span characterized by unsteady rotor–stator interaction was analyzed in detail for near-stall (NS) conditions. According to the findings, the perturbation of unsteady aerodynamic force for the stator is much bigger than that of the rotor. At the mid-gap between the rotor and stator, the perturbation of tangential velocity of the D1 scheme in the rotor and stator frame is reduced. At the rotor’s outlet region, the perturbation intensity is divided into three main perturbation regions, which are respectively concentrated in the TLV near the upper endwall, the corner separation at the blade root, and the wake of the whole blade span. Through the analysis of the wake transportation characteristics, it was found that when the wake passes through the stator blade surface, the wake exerts a substantial influence on the flow within the stator passage. It further leads to notable pressure perturbations on the stator’s surface, as well as affecting the development and flow loss of the boundary layer. The negative jet effect induces opposite secondary flow velocity on both sides of the wake near the stator’s surfaces. Therefore, the velocity at a specific point on the stator’s suction surface will decrease and then increase. Conversely, the velocity at a particular point on the pressure surface will increase and then decrease.

1. Introduction

Axial flow compressors are limited by rotor dynamic instability under low mass flow conditions, which makes the flow field structure non-uniformity and decreases the compressor’s performance. Therefore, some technologies that improve compressor efficiency, total pressure ratio, and stability margin have been applied to the design of compressors [1,2,3]. In the region of rotor tip and rotor–stator interaction, unsteady flow is very obvious. There are complex flow phenomena near the rotor tip clearance and stator blades of a transonic compressor, such as leakage flow, passage shock waves, boundary layer separation, and rotor–stator interaction, which enhance unsteady perturbations and reduce the compressor’s stability. Vortex breakdown is highly likely to be the main cause of low-momentum flow generation near the blade tip [4,5,6], while the wake is the main cause of downstream stator perturbation. Therefore, it is essential to analyze the flow field characteristics in the region of rotor/stator interaction.
It is difficult to predict the interaction between blade rows in a transonic compressor, as the strong unsteady flow under transonic conditions brings nonlinear aerodynamic characteristics and strong coupling of blade interactions, and the perturbation between the rotor and stator blades in turbomachinery mainly consists of low viscous potential flow perturbation and viscous wake perturbation. Smith and Key [7] conducted an investigation on an axial compressor, and results showed that under different timing configurations, the blade row undergoes different types of unsteady flow, including tip leakage flow or corner separation flow. Kerrebrock [8] and Tweedt et al. [9] conducted an investigation on the process of blade row interaction involving wake chopping and transport. The wake, upon hitting the blade’ LE downstream, is effectively divided into two segments. Subsequently, these wake segments undergo reorientation, deformation, and dissipation as they are transported through the blade passages. Zante et al. [10] discovered that the decay of the rotor’s wake has the characteristics of mixing effect and stretching effect. Liu [11] emphasized the significant impact of rotor–stator interaction on the prediction of the multi-stage axial compressors’ performance. Based on the above research, the influence of rotor–stator interaction cannot be ignored when predicting compressor performance.
In addition, many studies have shown that the TLV has a significant impact on the compressors’ performance [12,13,14]. Especially, the TLV at the tip of the rotor interacts and converges with the wake on the upper endwall, and then periodically sweeps through the downstream stator. They jointly flow toward the stator passage, causing unsteady perturbation on the stator blades [15]. Mao et al. [16] found in his study of curved swept rotor blades that, in a stage environment, the TLV at the rotor blade tip and the separation region at the root enters the stator blade passage along with the rotor blade wake, causing strong unsteady perturbation on the stator blade tip and root, resulting in significant unsteady aerodynamic parameters on the stator blade surface. Wu et al. [17] and Zhang et al. [18] used an unsteady method to investigate the flow structure of a single rotor tip clearance. The unstable breaking of the TLV initiated the onset of a spike-type stall in the tip clearance, causing passage blockage. Based on the above analysis, weakening the strength of the TLV and its mixing with the wake is an effective method to weaken the rotor–stator interaction.
In recent years, many studies have found that adjusting the rotor tip clearance value can effectively control the TLV and BLS (rotor wake), thereby improving the flow field in the endwall [19,20,21,22]. Fu et al. [23] pointed out that increasing the rotor tip clearance value helps in suppressing vortex and wake phenomena. thereby reducing rotor aerodynamic perturbations. Foley [24] found that the variation of blade tip clearance value changed the distribution of the blade’s loading, and the mixing of blade tip leakage vortex and the wake weakened. Gao et al. [25] pointed out that when the tip clearance value decreases, the leakage flow’s intensity in the clearance decreases. Zhang et al. [26] adjusted the rotor tip clearance value and analyzed it using numerical simulation methods. The findings indicated that reducing tip clearance value can suppress TLV intensity and weaken the BLS of the stator. In summary, reducing rotor tip clearance value can improve compressor performance. However, the phenomenon of rotor–stator interaction in transonic compressors, particularly in the scheme of small tip clearances, has not been widely studied.
Compared with previous studies on rotor–stator interaction in transonic compressors, there has been less research on rotor–stator interaction in compressor’s rotor with small value tip clearance and non-uniform tip clearances. Through the above analysis, in this study, a numerical analysis of the mechanism of the unsteady rotor–stator interaction of a single-stage compressor is conducted. The flow mechanism between small tip clearance rotors and non-uniform tip rotors is analyzed. Section 2 introduces the numerical method and verifies its accuracy. Section 3 analyzes the rotor–stator flow field structure in the 50% and 95% blade span, with a focus on studying the unsteady aerodynamic force perturbation, static pressure distribution on the blade surface, and the mechanism of rotor–stator interference. Finally, the main conclusions were summarized (Section 4).

2. Numerical Method Validation and Research Object

2.1. Research Object’s Geometric Parameters

The paper conducts a numerical investigation on the rotor blades using NASA Stage 35 [26,27,28] as the research subject. NASA Stage 35 consists of 36 rotor blades and 46 stator blades. It has a hub-tip radius ratio of 0.7, a rotor aspect ratio of 1.19, and a stator aspect ratio of 1.26. The designated rotation speed is 17,188.7 RPM, with a flow rate of 20.188 kg/s. The stage pressure ratio is 1.820, and the isentropic efficiency is 0.828. The structure diagram for the compressor computing passage and mesh has been generated using the IGG/Autogrid-5 module, as depicted in Figure 1. Each module employs the O4H structured grid topology, with a butterfly grid topology being used in the blade tip gap. Grid blocks are completely matched and a periodic complete matching connection is used in the circumferential direction of a single channel, while mesh refinement is carried out. The first layer’s cell width was set to set at 3 × 10⁻⁶ mm, ensuring that y+ is less than 3.5 [29], as illustrated in Figure 2.

2.2. Computational Fluid Dynamic Method and Validation

NUMECA was used for the unsteady numerical simulation. The FINE/TURBO program in NUMECA was used as the solver to cope with the unsteady Reynolds-averaged Navier–Stokes equations, and the Spalart Allmaras turbulence model was taken for numerical calculation and solution. The dual time-stepping method is introduced for numerical calculations. Domain scaling method is used. The transition between the rotor and stator is performed using the transfinite interpolation method. The space discretization of the control equation system adopts a second-order upwind scheme supplemented by the flux difference splitting method. In order to ensure solidity the chord length of the stator has been reduced, so a reduced 3:4 passage model is adopted for unsteady numerical research. According to reference [30], the physical time step is set to 3.23 × 10⁻⁶ s, each passage has 30 physical steps, and 20 virtual time steps are set under each physical time step. All solid walls were provided under adiabatic and no-slip conditions. The total pressure at the compressor inlet was set to 1.01325 MPa. The total temperature was set to 288.15 K. Average static pressure was set at the stator outlet. Using the steady calculation results as the initial field for unsteady calculations saves computational time.
To ensure calculation accuracy is not affected by the mesh size, we established varying numbers of single-channel meshes including 1,000,000, 1,500,000, 2,250,000, 2,500,000, 2,800,000, and 3,000,000 grid cells. Figure 3 illustrates how the compressor performs near the choking point, NPS, and PEP as the mesh size increases. Referring to Figure 3, it is apparent that the three parameters remain relatively stable as the number of single-channel grids approaches 2.25 million. Hence, it may be deemed that the condition of grid independence has been fulfilled.
Figure 4 illustrates the comparison of the numerical results (2.25 million grid cells) under different rotation speeds and experimental data [27,28], further verifying the numerical simulation accuracy. The upper half of Figure 4 demonstrates the contrast between simulation results and experimental results regarding isentropic efficiency. Meanwhile, the other half of Figure 4 illustrates the comparison of the total pressure ratio (π* represents total pressure ratio). When comparing the curves in Figure 4, it is evident that the maximum error in total pressure ratio is 1.28% at 100%Ncor, 1.63% at 90%Ncor, and 1.49% at 70%Ncor, respectively. Furthermore, their maximum errors in isentropic efficiency are 2.61%, 2.44%, and 2.33%. The simulation results were all within an acceptable range of errors. Wang [31] points out that the different rotation ranges of the rotor hub have a significant influence on the numerical results. As the hub’s rotation range decreases, the choking flow rate increases. When the hub rotates, the velocity at the boundary layer’s bottom parallel to the mainstream direction is very small, while the velocity perpendicular to the mainstream direction is very large. The flow at the root of the blade is at a high attack angle, resulting in a decrease in mass flow rate.
Figure 5 displays the comparison between the CFD and the experimental data at the design point. Figure 5a displays the relative Mach number at the rotor outlet; Figure 5b displays the distribution comparison of the absolute Mach number at the stage outlet. The numerical data exhibited consistency with the experimental data. The numerical data for the relative Mach number of the rotor outlet near the blade tip and the absolute Mach number of the stage outlet were lower than the experimental results. The primary factor is likely the tendency of the turbulence model to overestimate the losses resulting from TLV. Nevertheless, the overall numerical data demonstrate good alignment with the experimental values in the spanwise direction.
Figure 6 shows the comparison of the total pressure and total temperature ratio at the design point between the numerical and the experimental values. The calculated and experimental values along the spanwise direction are consistent in Figure 6. The numerical results near the blade tip correspond to a slightly lower total pressure ratio and a slightly higher total temperature ratio. The major factor leading to physical mechanism inaccuracies might be the tendency of turbulence models to overestimate the losses caused by TLV.

2.3. Three-Dimensional Structure of Small Value and Non-Uniform Blade Tip Clearance

Two different clearance structures were obtained by modifying the designed blade tip clearance structure (0.408 mm). The maximum tip clearance after modification was 0.408 mm, and the minimum tip clearance was 0.204 mm, as displayed in Figure 7. Figure 7a shows the structure of small value tip clearance, 0.204 mm (P1). Figure 7b shows the non-uniform tip clearance (D1), where 50–100% of the chord length is the expansion section. Red represents rotor blade, and cyan represents tip clearance mesh.

3. Numerical Results and Discussion

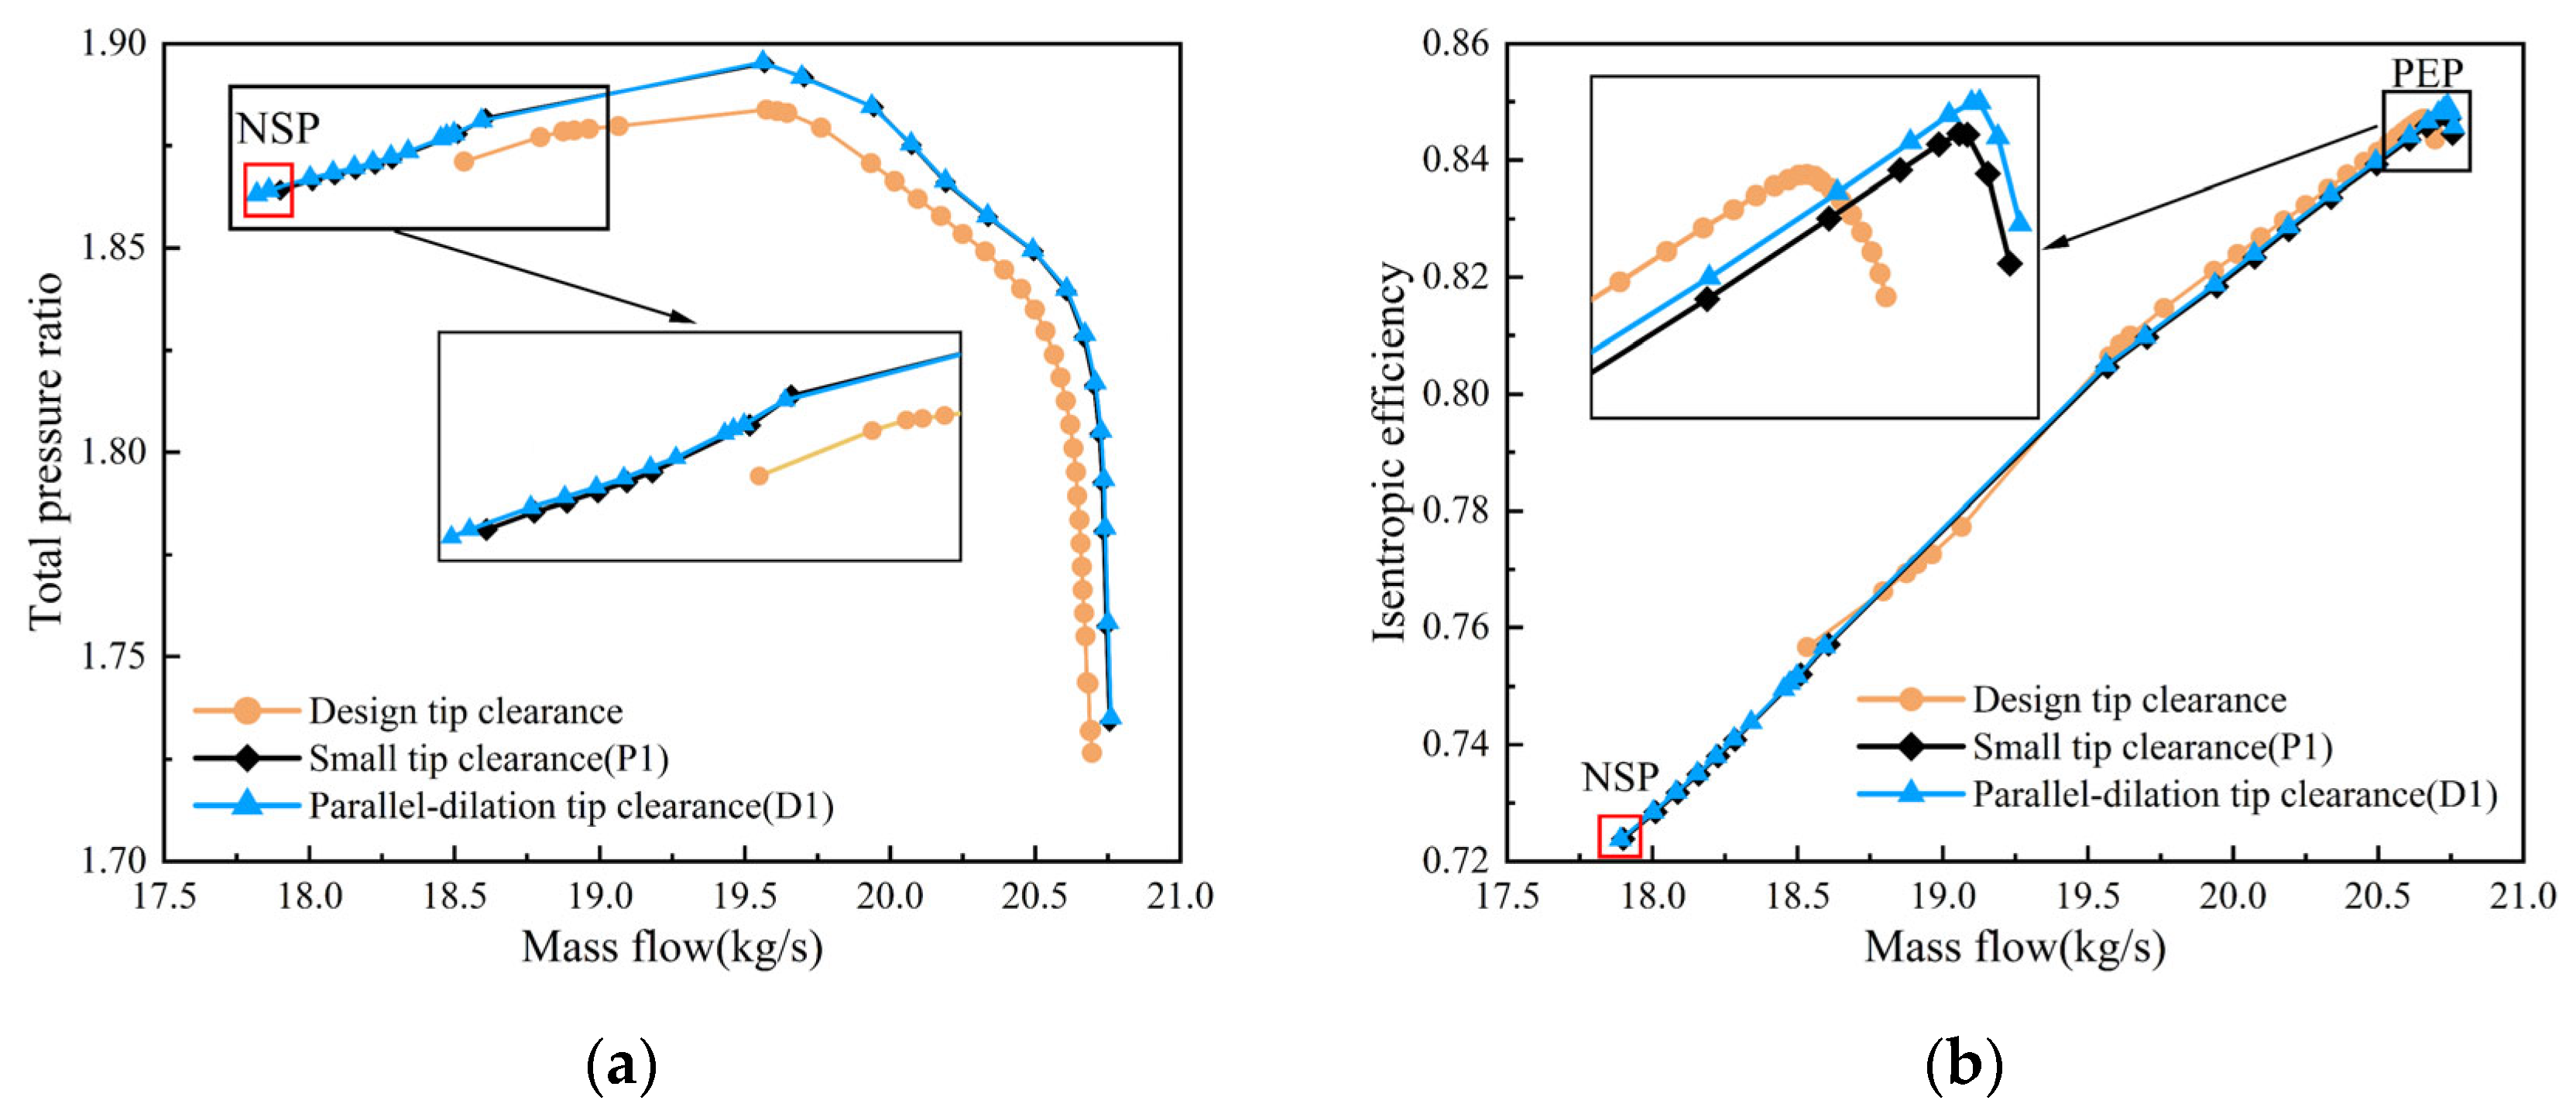
3.1. Time-Averaged Performance of Compressors with Non-Uniform and Small Value Tip Clearance

Figure 8 displays the time-averaged performance characteristic curves of compressors with different tip-clearance schemes. The changing of total pressure ratio and efficiency with mass flow rate can be explained. Compared to the design tip clearance scheme, the P1 scheme and D1 scheme notably enhanced the airflow field in the tip region, increased the flow rate at the compressor choking point, broadened the stability margin range, improved the peak efficiency, and significantly altered the total pressure ratio. Compared to the P1 scheme, the D1 scheme has almost no impact on the flow rate at the choking point, except under near-stall conditions where the D1 scheme exhibits a lower flow rate than the P1 scheme. Under high mass flow conditions, compared with the P1 scheme compressor, the D1 scheme compressor has improved efficiency and total pressure ratio. This is because the D1 scheme has a smaller blade surface area of the rotor, resulting in lower friction losses. Under small flow rate conditions, the efficiency and total pressure ratio of the D1 scheme compressor are higher compared to the P1 scheme. D1 scheme rotor has higher blade loading potential and reduces secondary flow. From 
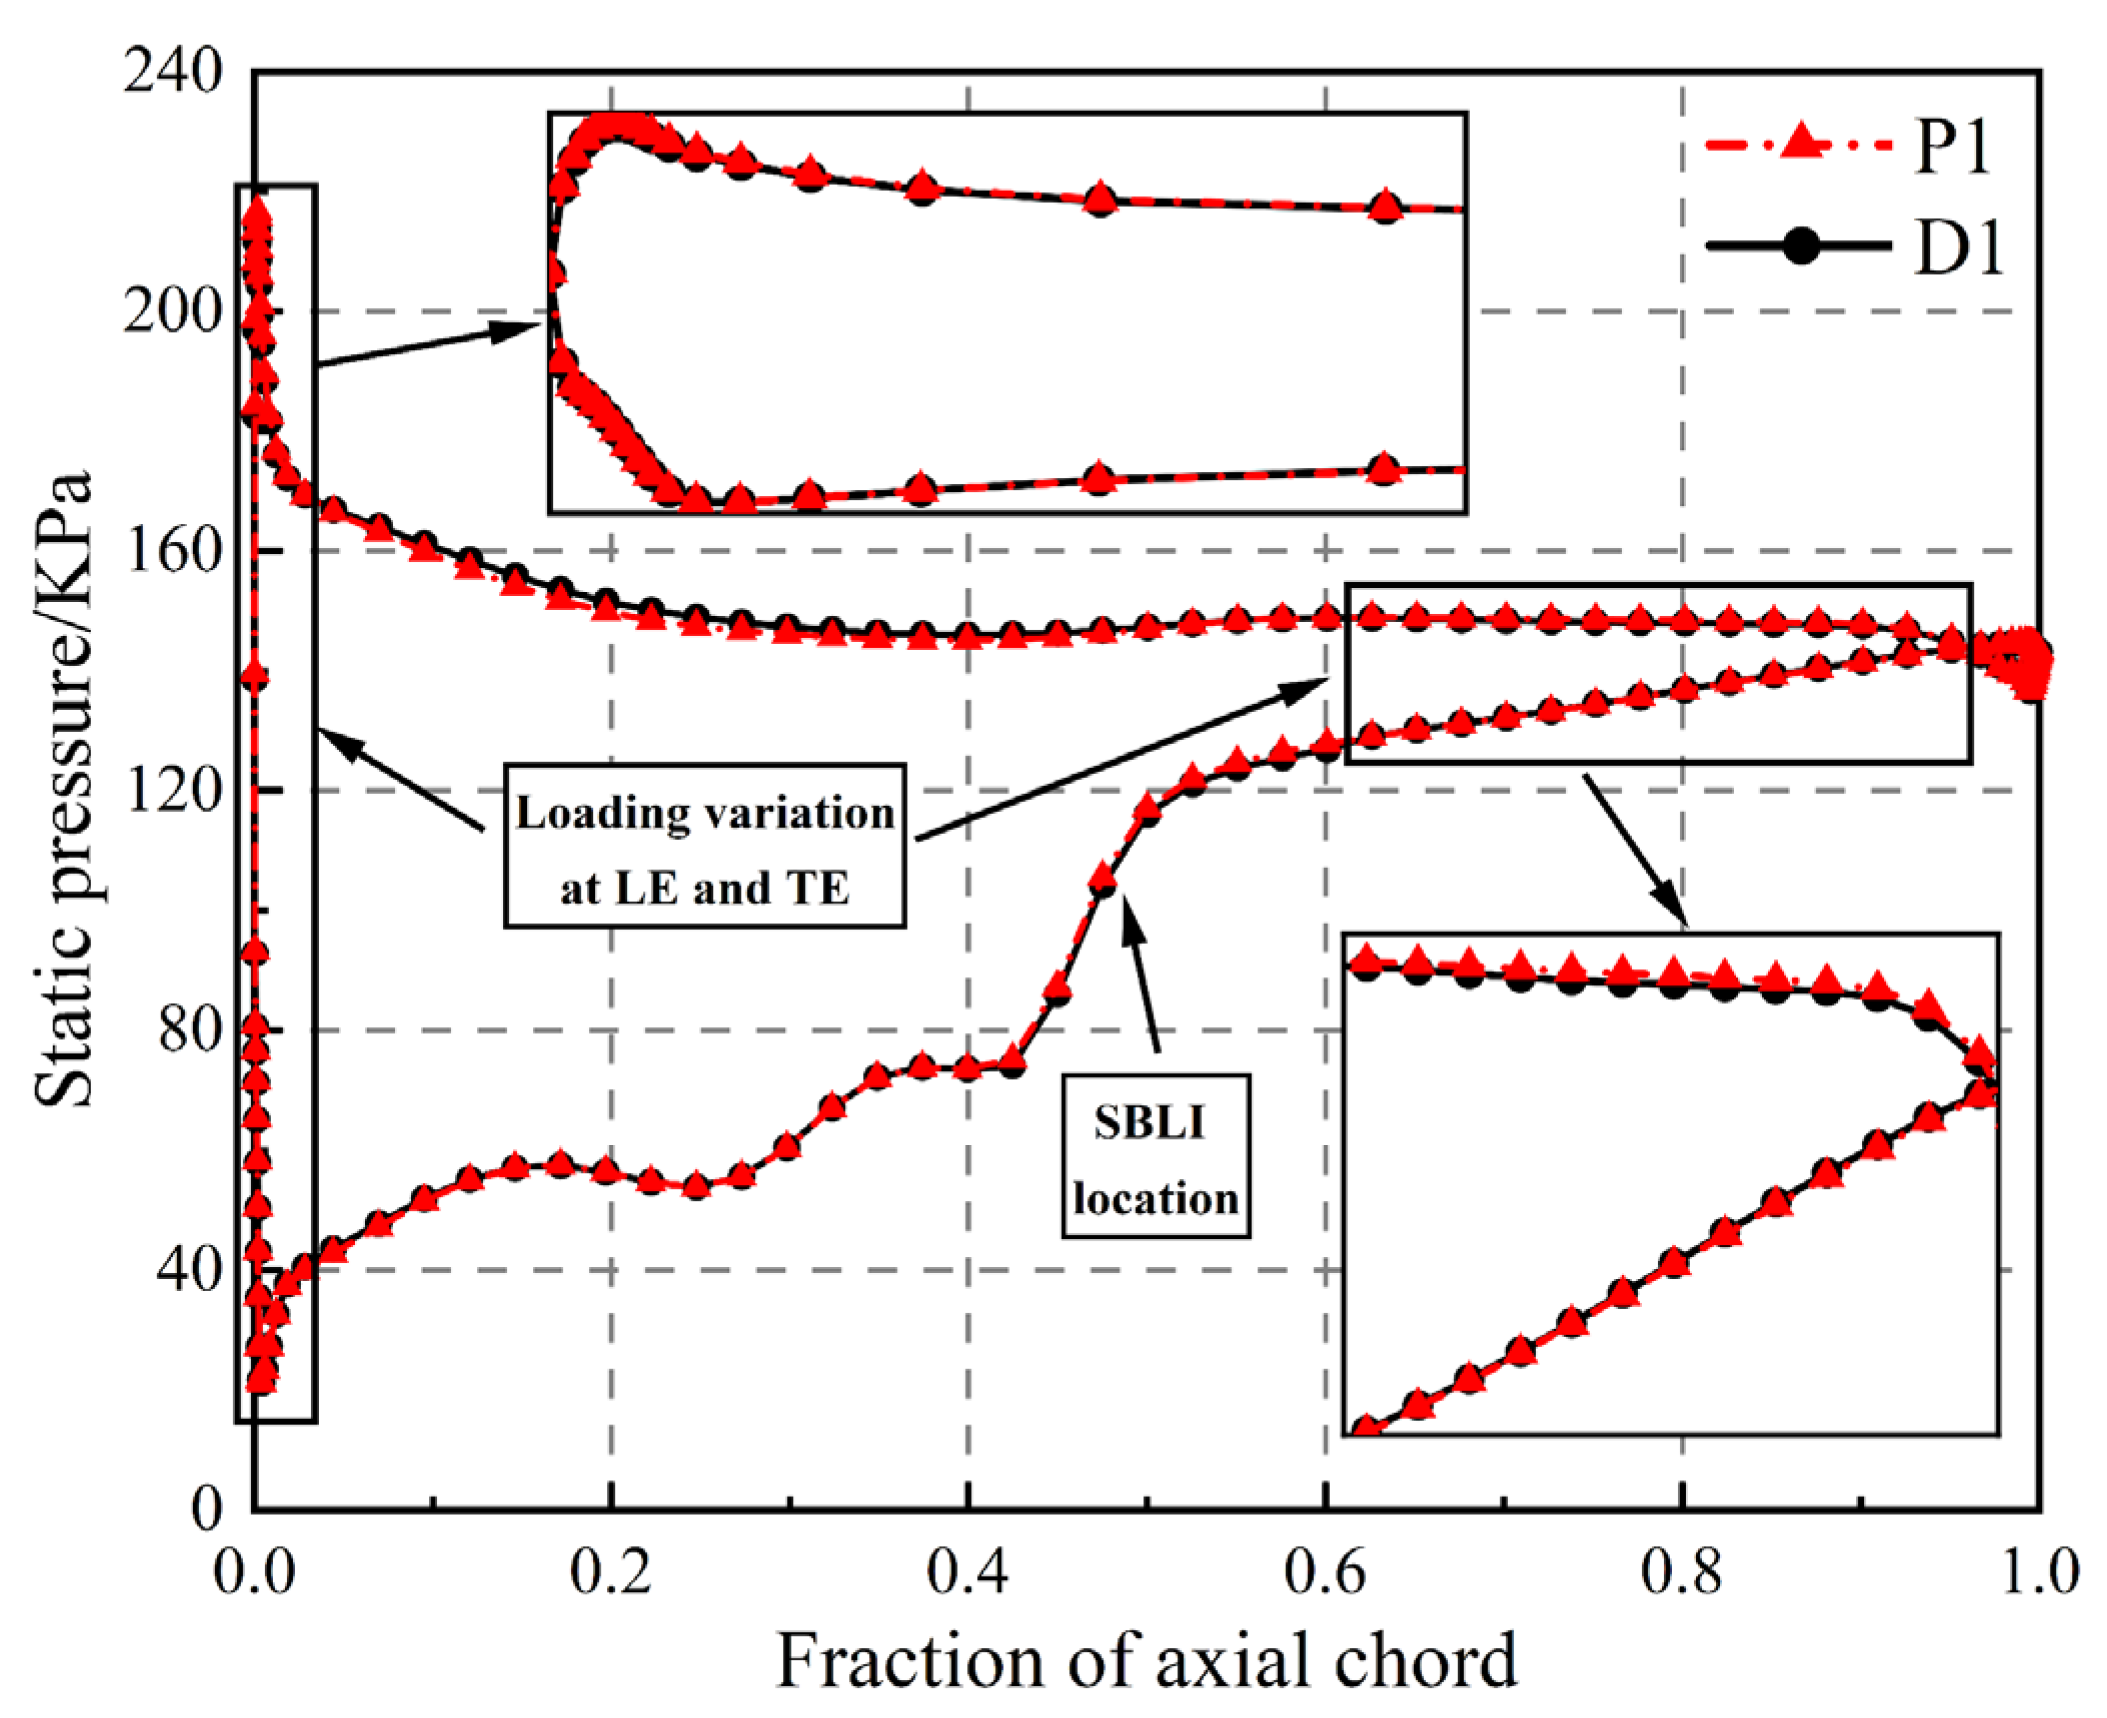
Figure 9, it is evident that the D1 scheme exhibits an increase in blade loading and static pressure when compared to the P1 scheme compressor. This increase occurs within the axial chord length range of 0.2 to 0.6 of the rotor. Additionally, there is a slight decrease in the blade’s loading and static pressure within the range of the LE and TE of the rotor. More significantly, the position of SBLI on the rotor’s SS shifts downstream, effectively weakening the wake effect.
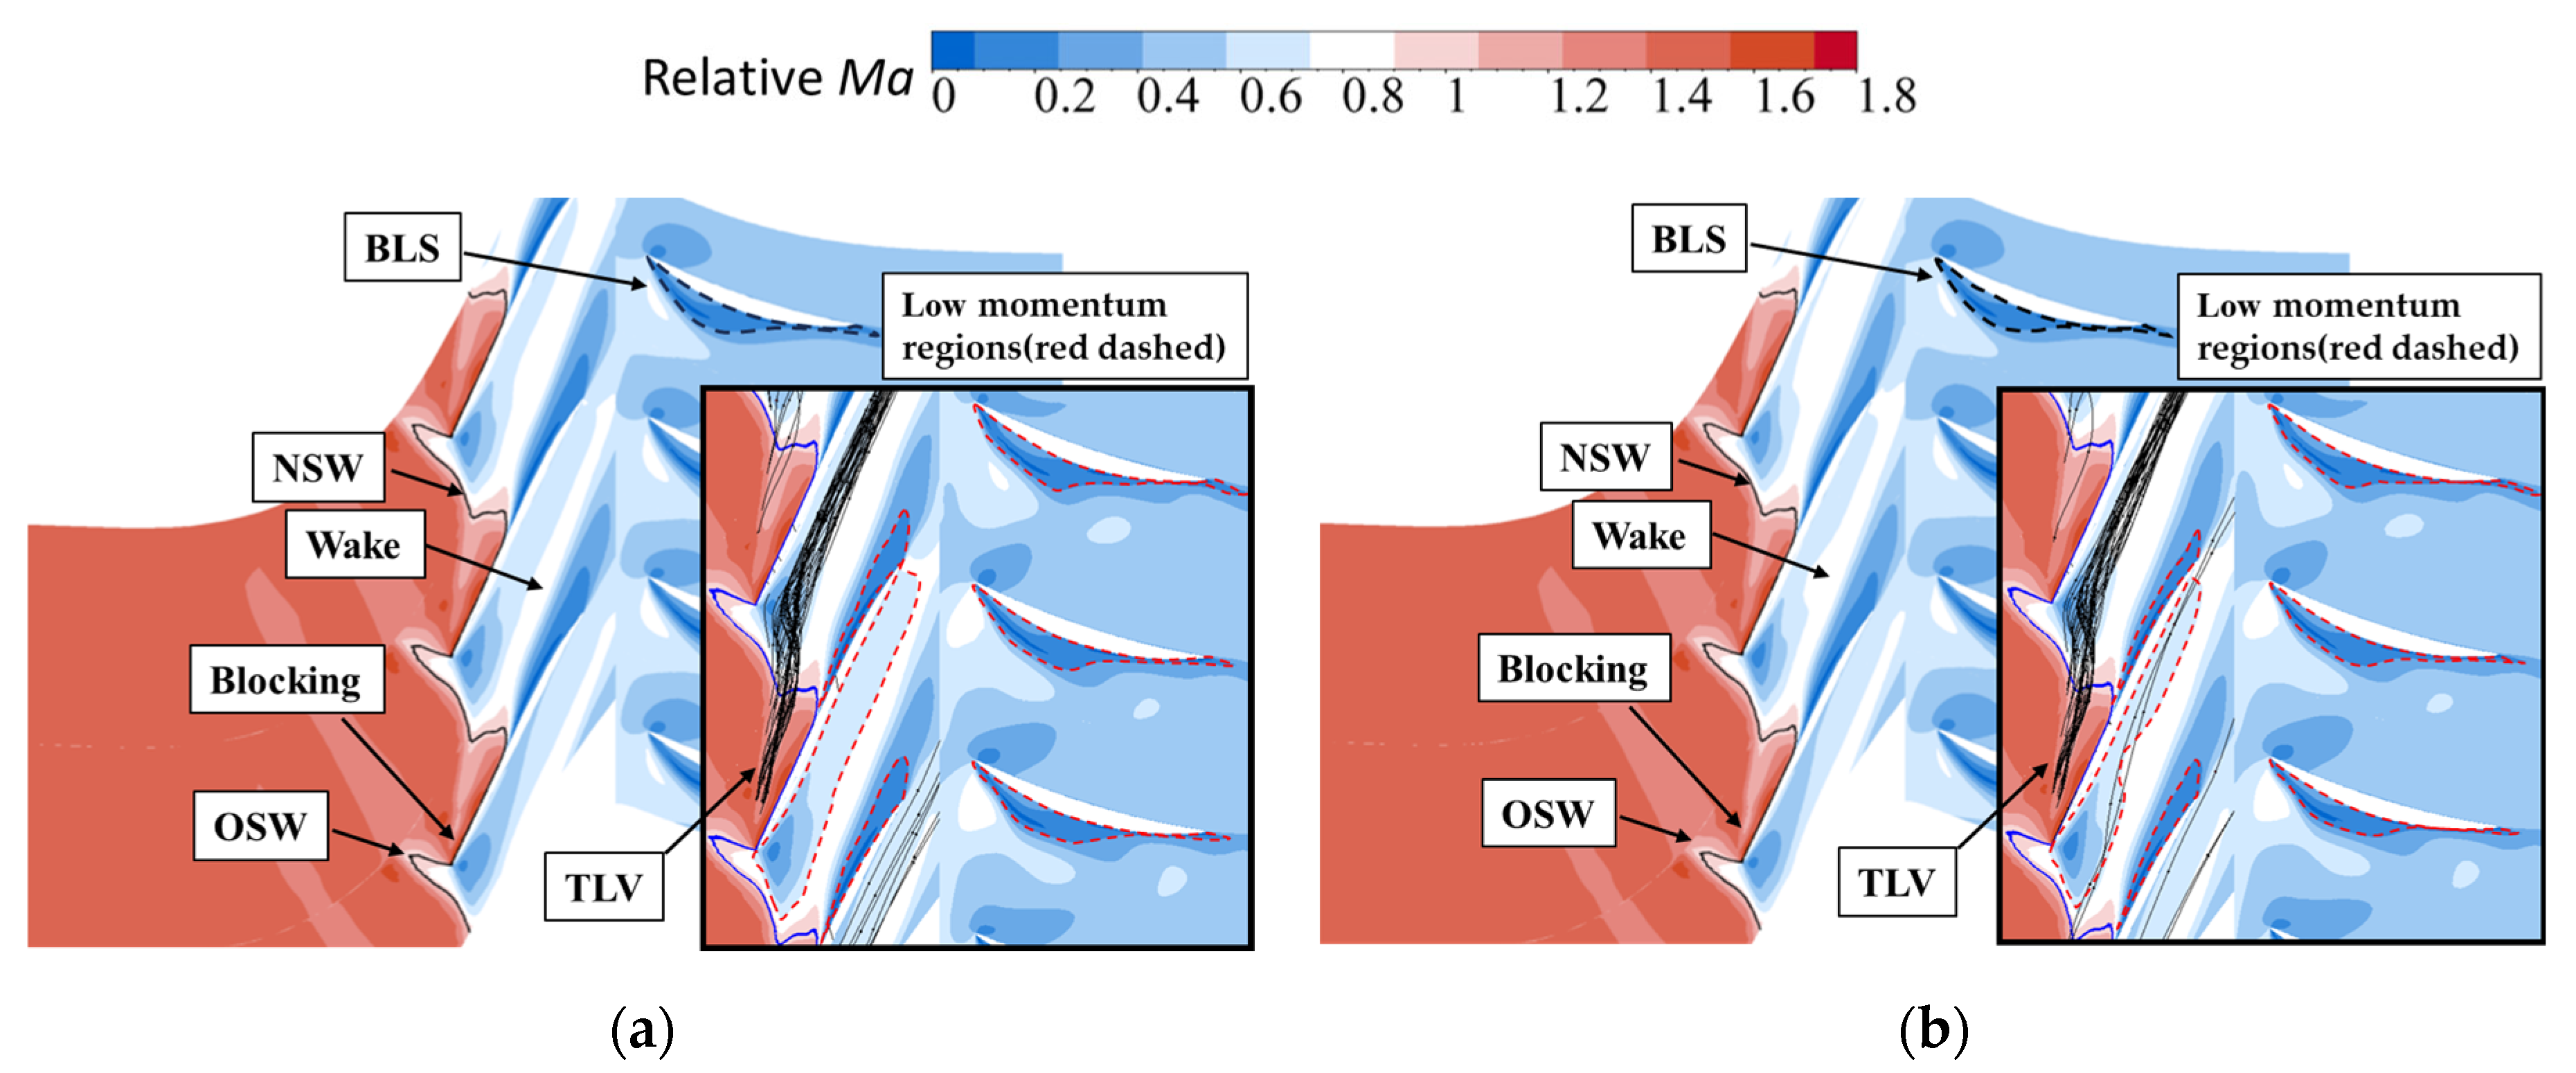
Figure 10 displays the time-averaged Mach number at 99% blade height at the NSP. An oblique shock wave (OSW) and a normal shock wave (NSW) are observed in the rotor channel at 99% blade height. The interaction between the NSW and the suction boundary layer leads to flow separation occurring on the SS, known as the “wake”. In addition, the interaction between shock and TLV leads to a reduction in the momentum of TLV. Furthermore, a region of low momentum is noted after the shock, causing blockage of the rotor passage. By using the D1 scheme, both low-momentum regions were reduced after the shock wave. This suggests a decrease in the interaction between the shock and the TLV/BLS. In addition, due to the weakening of the wake, the BLS of the stator’s surface is weakened.
This study considered an operating condition, namely the NS condition, to further investigate the mechanism of rotor–stator interaction and wake transportation characteristics of the P1 and D1 compressor schemes. Under the NS conditions, the flow point with the same stall limit as the compressor under the design tip clearance scheme in the experiment was selected, which is 18.20 kg/s.

3.2. Unsteady Aerodynamic Force Perturbation and Shedding Vortex Frequency on Blade Surface

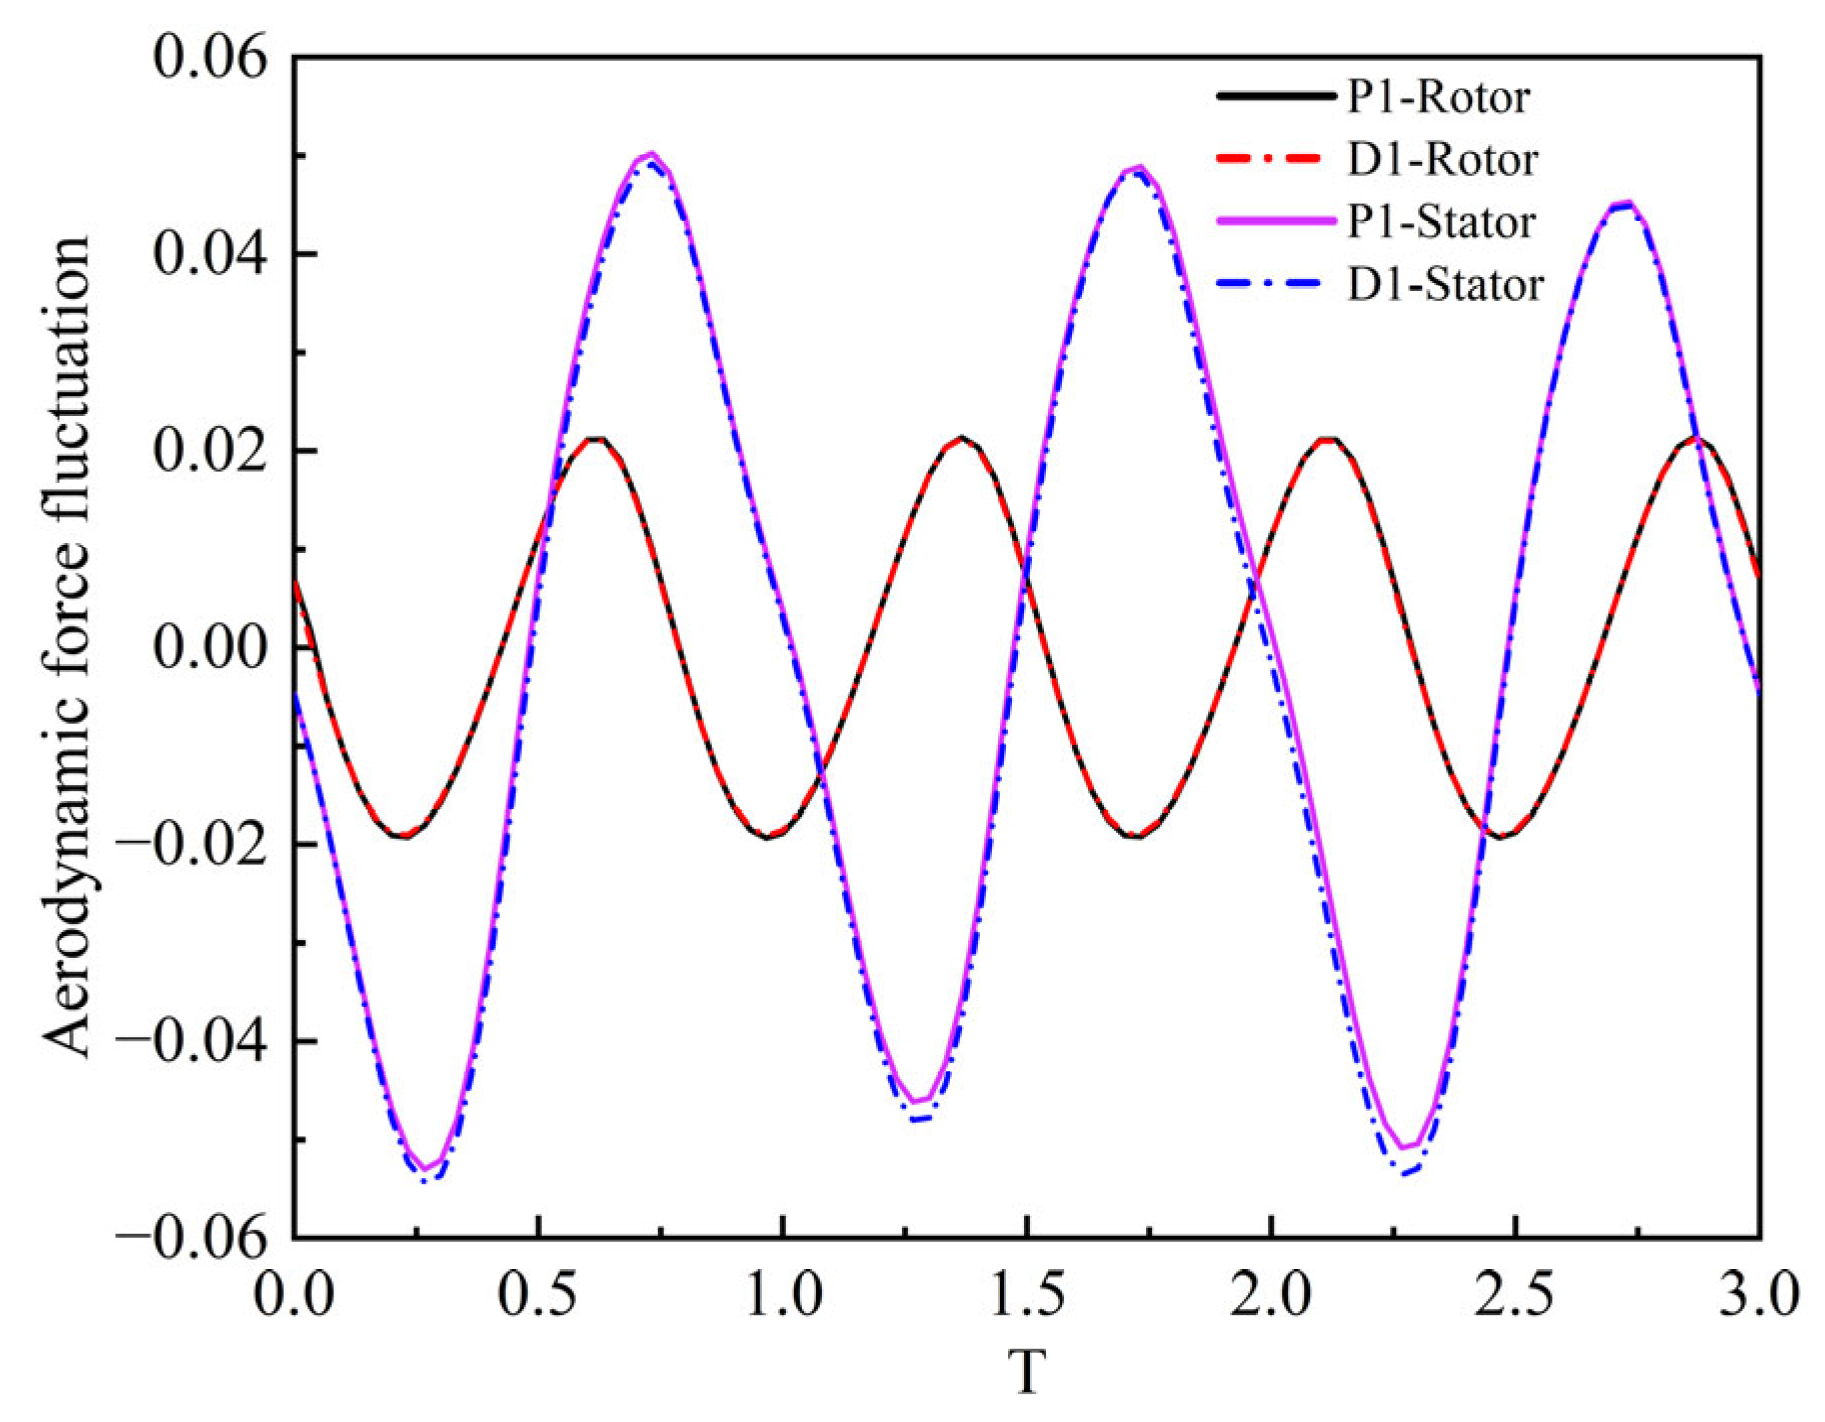
Figure 11 represents the perturbation amplitude of the unsteady aerodynamic force (UAF) between the rotor and stator. F represents the unsteady aerodynamic forces (blade surface per unit length), ignoring the influence of viscous shear stress [32,33] (compared to pressure fluctuations, the influence of viscous shear force is relatively small, and the influence of higher-order components is relatively small). The UAF is the combined force of axial and tangential unsteady aerodynamic forces. The axial UAF (Fx) and tangential UAF (Fy) are obtained by integrating the static pressure on the blade surface along the axial and tangential directions of the blade surface, respectively (Equations (1)–(3)).
F x = Ω P n × i d s
F y = Ω P n × j d s
F = F x 2 + F y 2
where P denotes the static pressure on the blade surface; n denotes the unit vector of the outer normal of the blade surface; i and j are unit vectors in the axial and tangential directions; S is the surface area of the blade, and Ω denotes surface of the blade (including the pressure surface and suction surface). F ¯ denotes the time-averaged UAF; F F ¯ / F ¯ is the UAF perturbation. According to the figure, it is found that there are pulsations in the UAF of both blades.
Firstly, the UAF perturbations of the rotor mainly come from the periodic potential flow perturbations of the stator, and propagate from the rotor trailing edge to the upstream, causing periodic perturbations in the pressure of the rotor surface, resulting in periodic changes in aerodynamic and other characteristic parameters. When the potential flow at the rotor outlet is facing the passage of the downstream stator blade, the resistance from the downstream is the smallest, and the pressure acting on the pressure surface of the rotor’s TE is the lowest. At this point, the aerodynamic force reduces to a minimum value. When potential flow at the rotor’s outlet is facing the downstream stator LE, the resistance from the downstream is the highest, and the pressure acting on the TE of the rotor’s PS increases, at which point the aerodynamic force increases to a maximum value.
Secondly, for the stator, the rotor’s wake interference, as well as secondary flow interference in the TLV and root separation region, are the main causes of periodic perturbations in the aerodynamic characteristic parameters of the stator blade. The maximum aerodynamic force of the stator blades occurs when the rotor’s wake sweeps over the stator’s LE, while the minimum aerodynamic force occurs when the rotor’s wake enters from the middle of the stator passage. This is because the negative jet effect inside the wake increases the attack angle at the stator’s LE, causing an elevation of the stator’s instantaneous loading and pressure difference and the pressure difference between the PS and the SS. Therefore, the aerodynamic force also increases.
Thirdly, comparing the UAF perturbation on the surface of the rotor and stator, it was found that the stator’s potential flow effect has a relatively low perturbation intensity on the UAF perturbation of the rotor, and the UAF perturbation of the stator is much greater than that of the rotor. This is because the unsteady perturbation of the wake and secondary flow on the stator is much greater than the potential flow interference on the rotor.
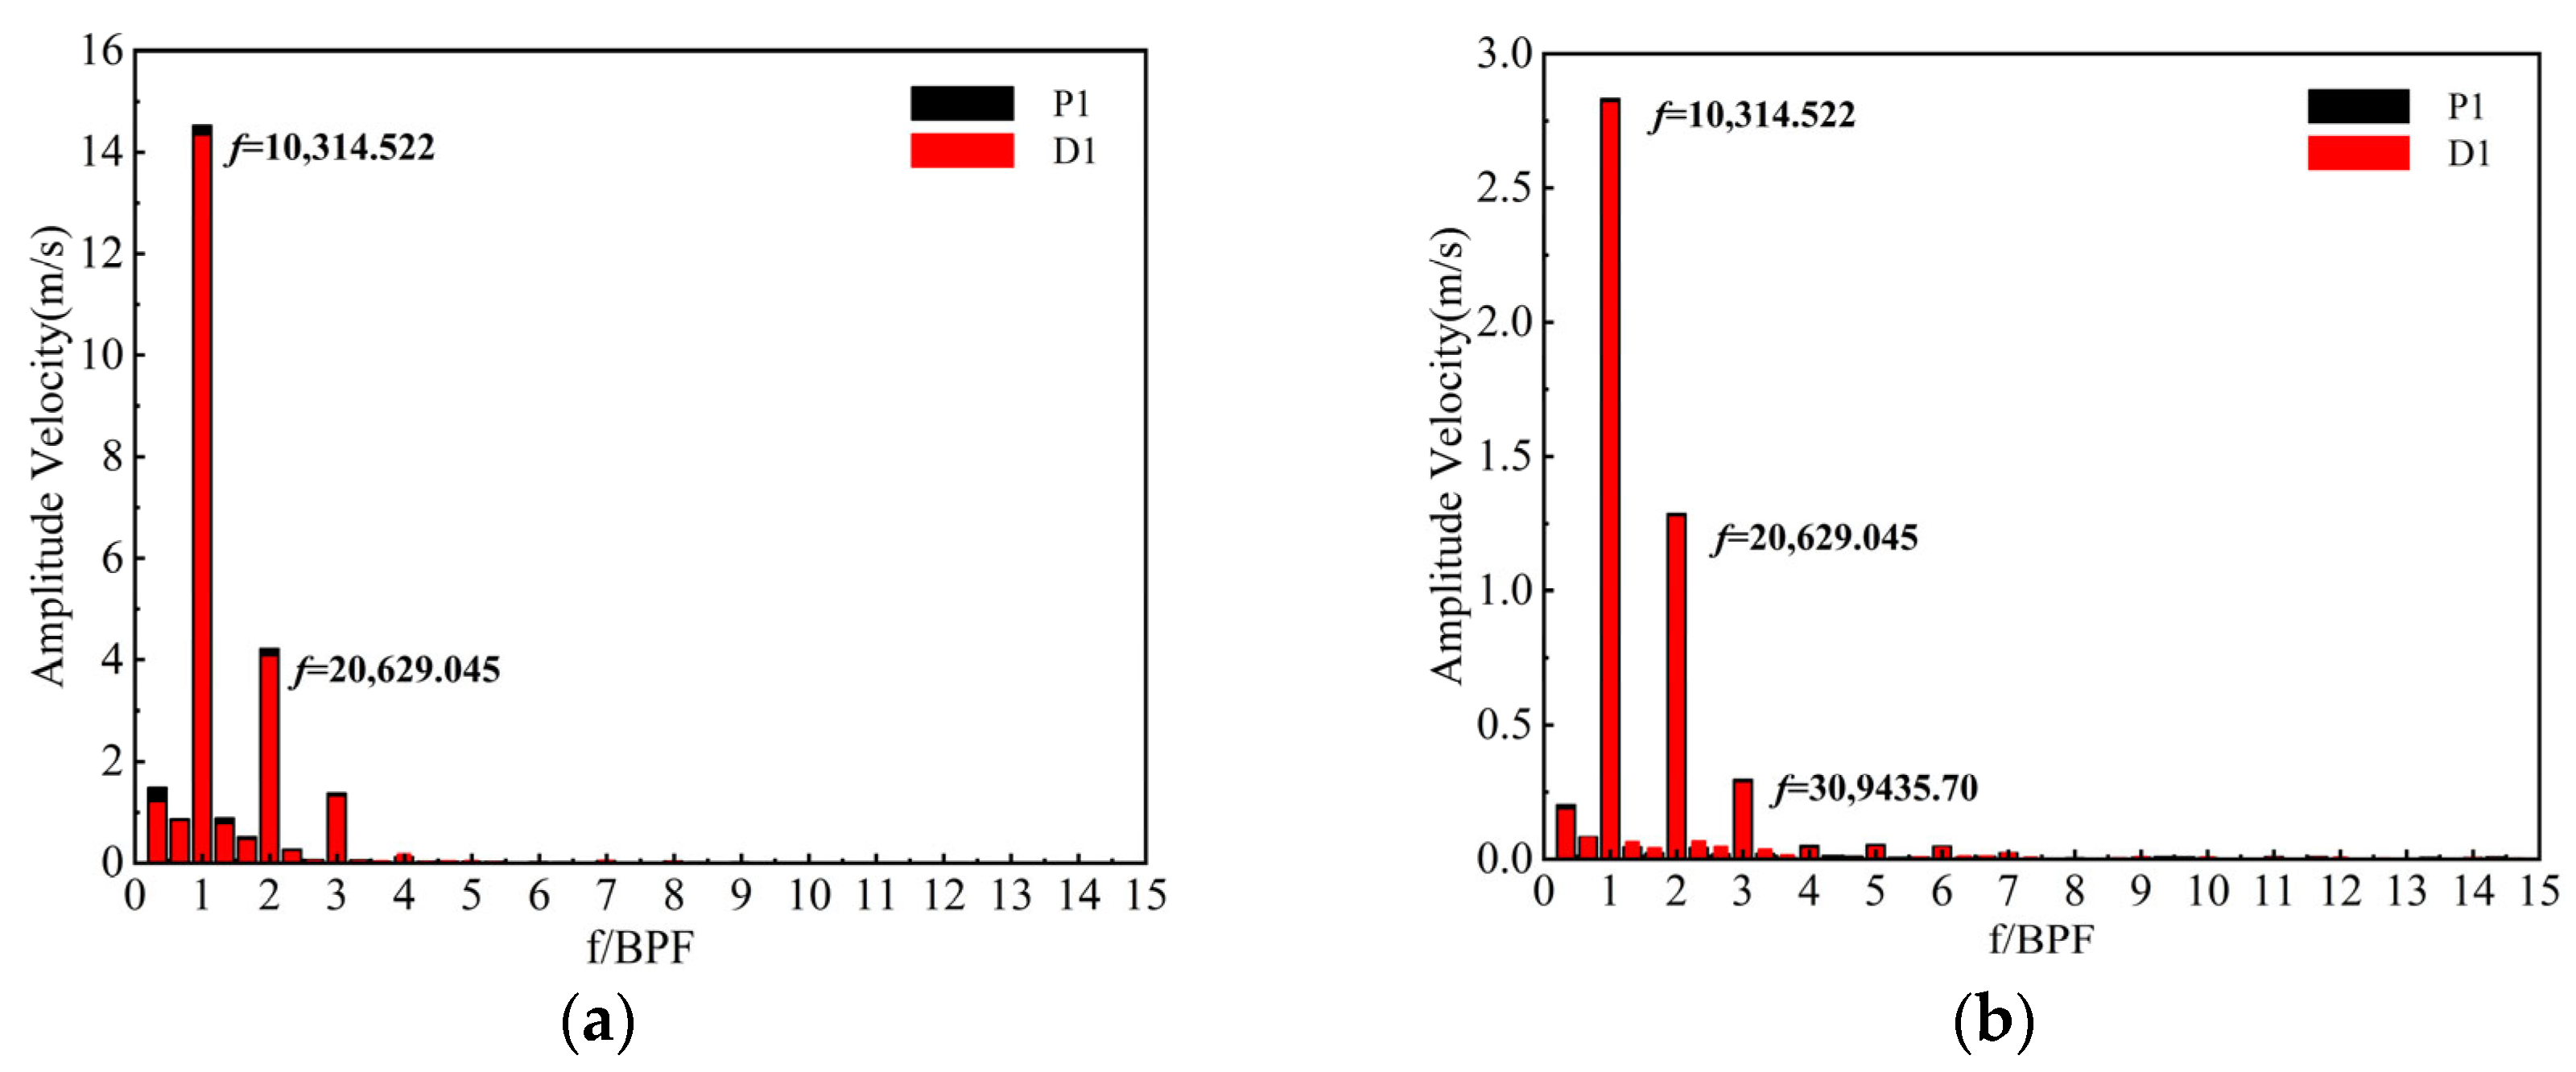
Figure 12 displays the frequency spectrograms of separation and shedding vortex on the stator’s surface. Figure 12a denotes the spectrogram of the separation vortex at the LE of the SS, and Figure 12b denotes the spectrogram of the TE shedding vortex. By performing discrete Fourier decomposition on the axial velocity of the separation and shedding vortex on the stator SS, the main frequency of the separation and shedding vortex is 10,314.522 Hz, and the secondary frequency is 20,629.045 Hz, namely 1BPF and 2BPF. Compared with the P1 scheme, the amplitude of the separation vortex’s main frequency and the shedding vortex’s main frequency decreases in the D1 scheme, indicating that the BLS of the stator SS is weakened and the strength of the shedding vortex is reduced.

3.3. Unsteady Static Pressure of Stator Blade under Non-Uniform and Small-Value Tip Clearances

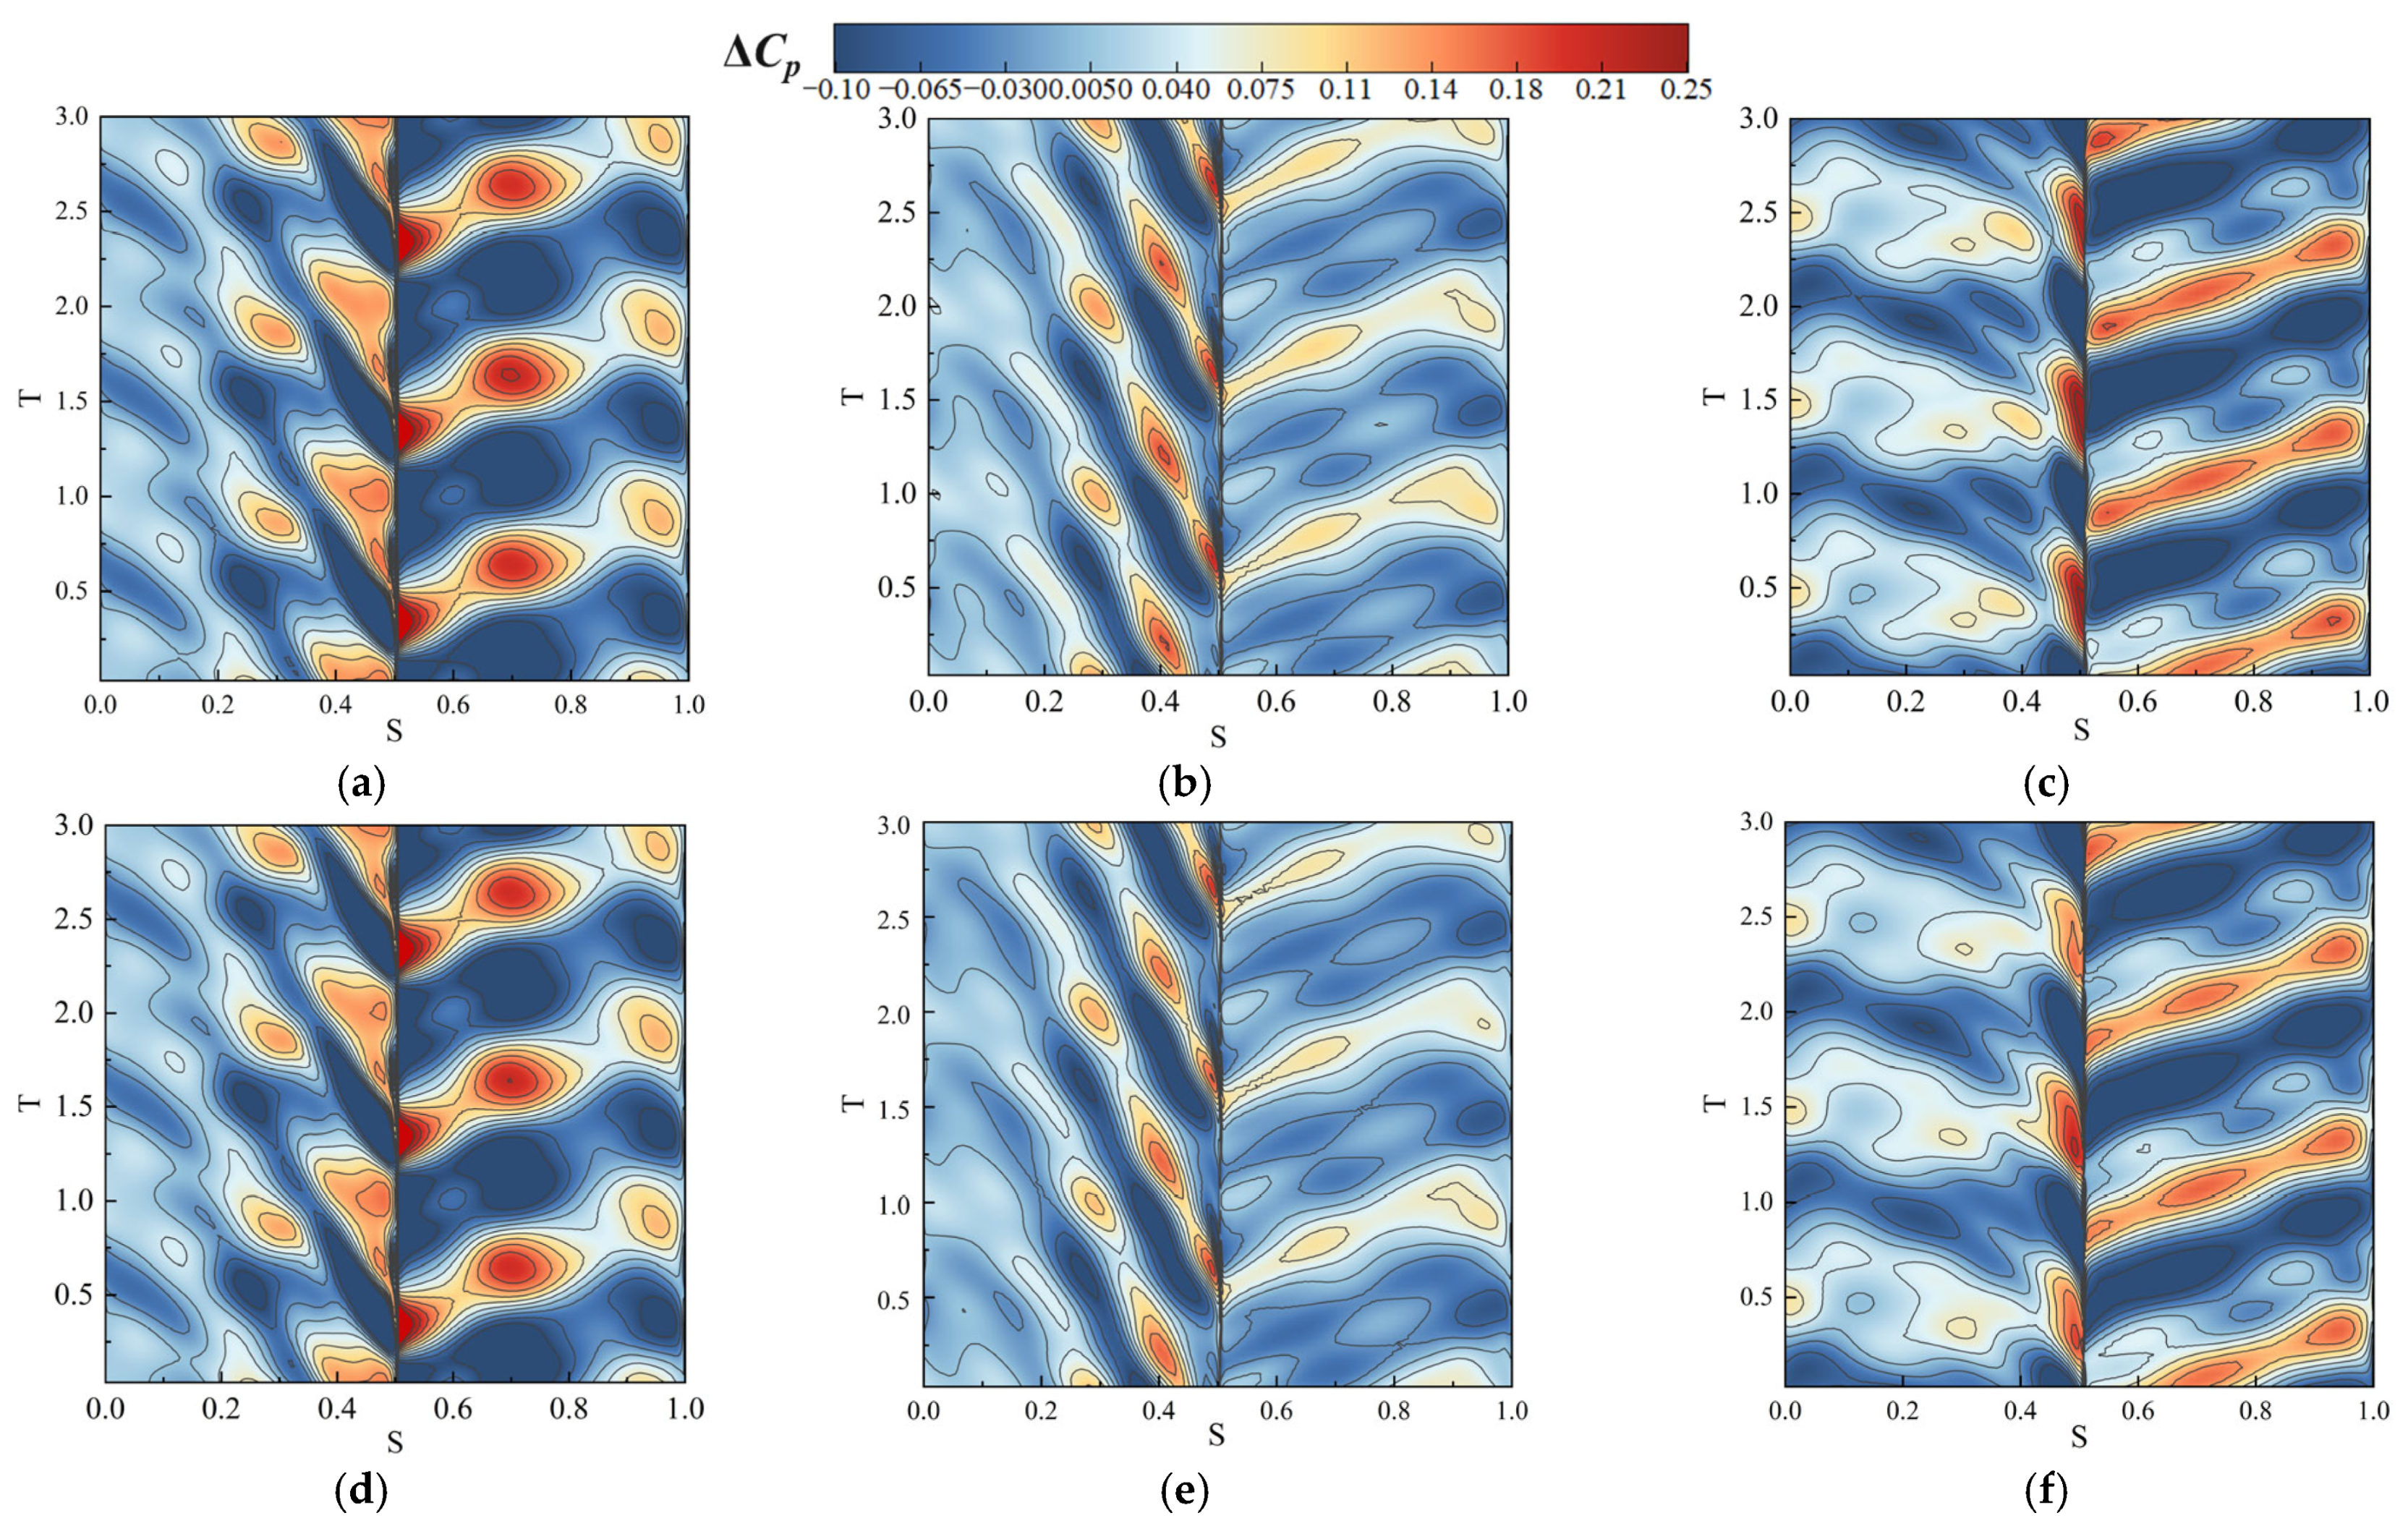
To intuitively reflect the amplitude and range of static pressure perturbation, Figure 13 shows the space-time distribution of the static pressure perturbation on the SS and PS of the 5%, 50%, and 95% blade span sections of the stator. The abscissa represents the normalized length of the blade surface, and the origin of the coordinate is the TE point of the SS. Point S = 0.5 represents the stator blade LE, while S = 1 represents the pressure surface TE. The vertical ordinate represents the rotor rotation period. The static pressure perturbation refers to the discrepancy between the instantaneous pressure coefficient and the pressure coefficient that has been averaged over time. The static pressure perturbation can be defined as follows:
C P = P P 0 / 0.5 ρ ν 2
Δ C P = C p C p 0
where P0 represents the total pressure at the stator inlet, P represents the blade surface pressure, 0.5ρV2 represents the inlet dynamic pressure, and Cp0 represents the time-average pressure coefficient. According to Figure 13, it was discovered that the amplitude of the pressure perturbation at the stator’s LE is the greatest, primarily resulting from the periodic sweep of the wake. The alternating distribution of high and low-pressure regions on the stator’s SS and PS is a result of the unsteady perturbation generated by the upstream rotor’s wake, secondary flow, and potential flow. This phenomenon demonstrates excellent periodicity. The position of the high-pressure perturbation zone in the three sections of the stator blades of the P1 and D1 schemes has not changed significantly, but the perturbation intensity of the D1 scheme has decreased.
Firstly, at 5% blade span, both the SS and PS of the stator blade have long diffuser sections, and both exhibit strong pressure perturbations in the diffuser section. And the perturbation in the depressurization section is weaker when the favorable pressure gradient is large.
Secondly, at 50% blade span, the maximum loading on the pressure surface moves to the position of 20% chord length, and there are two positions with severe static pressure perturbation on the PS and SS at this blade span, both located in the diffuser section and at the intersection of the depressurization section and the diffuser section.
Thirdly, at 95% blade span, the strongest static pressure perturbation on the SS still occurs in the diffuser section and at the intersection of the depressurization section and the diffuser section. The maximum loading position on the pressure surface further moves toward the middle of the chord length, and the most severe static pressure perturbation occurs in the pressure reduction section with a lower favorable pressure gradient.
In summary, the stator blade’s SS and PS, as well as the position at the intersection of the depressurization section and the diffuser section, are more susceptible to static pressure perturbation. Moreover, when the favorable pressure gradient of the depressurization section is low, the static pressure perturbation is also severe, while the fast depressurization section with a high favorable pressure gradient has weaker static pressure perturbation. This indicates that the intensity of unsteady perturbations on the blade surface is intricately associated with the arrangement of pressure loading.
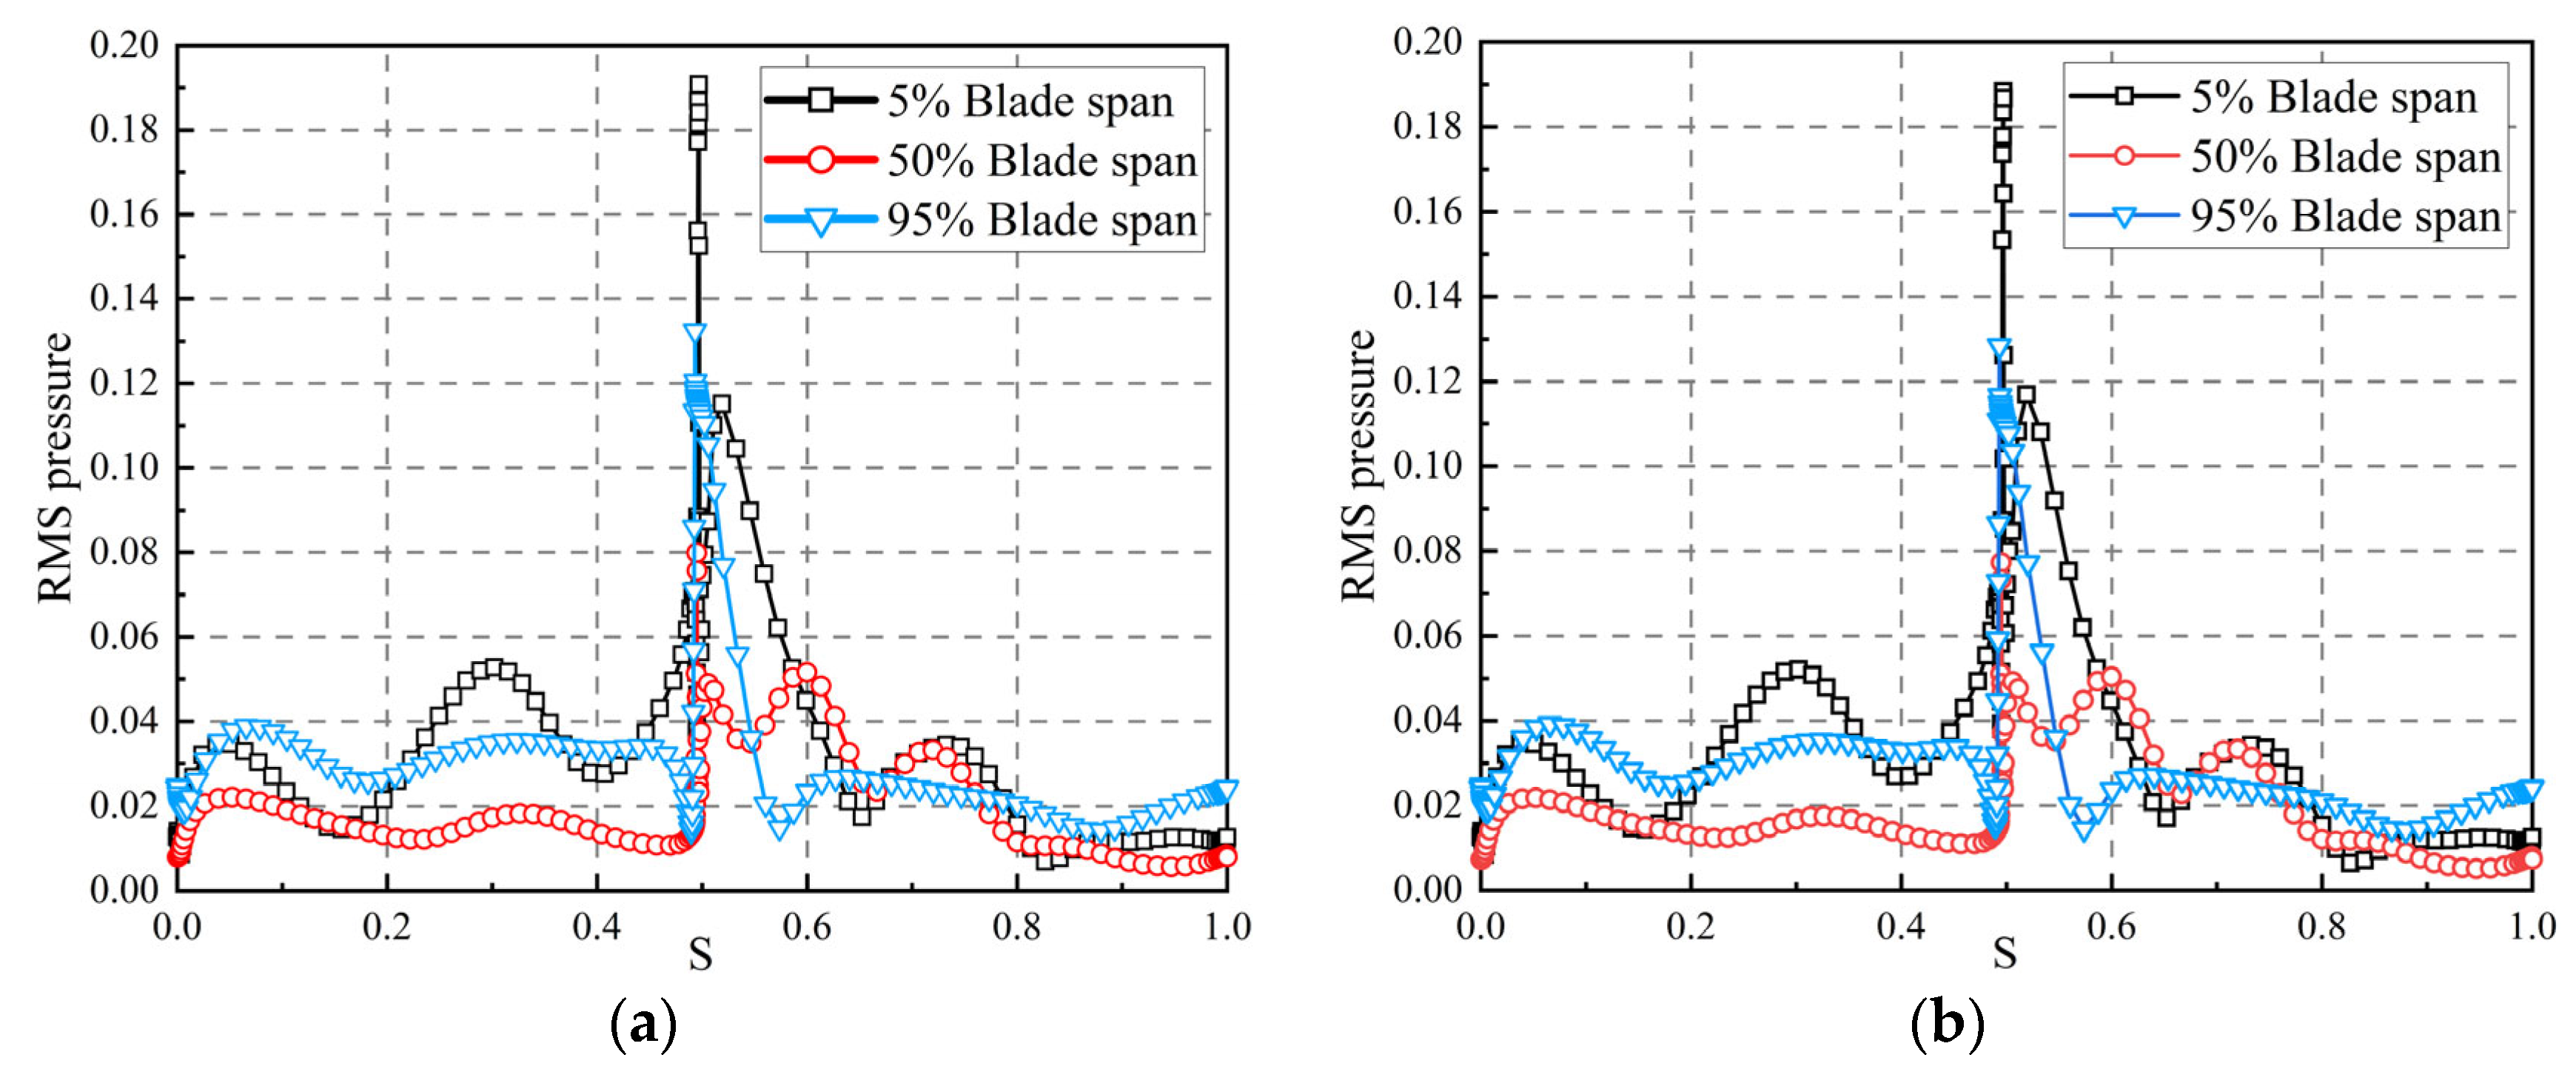
To accurately compare the intensity of pressure perturbation on the stator surfaces, Figure 14 demonstrates the distribution of the root mean square (RMS) pressure perturbation along the axial chord length of the three blade span sections for the stator blade. The x-axis denotes the relative position of the blade surface. Specifically, the range of S = 0–0.5 corresponds to the pressure surface, while S = 0.5–1 designates the suction surface. According to the figure, it is found that the maximum static pressure perturbation at the stator blade LE. The amplitude of static pressure perturbation at the LE of the stator blade at 5% blade span far exceeds the amplitude of static pressure perturbation at the LE of 50% blade span and 95% blade span, making the radial distribution of static pressure perturbation at the stator blade LE very uneven, which is not conducive to ensuring the strength of the stator blade LE. Compared with the P1 scheme, the static pressure perturbation at the 5% blade span of the stator blade LE in the D1 scheme is weakened. This is because the D1 scheme reduces the separation loss at the rotor root and corner separation, reducing the pulsation intensity in the wake and corner separation region at the rotor root, and weakening the static pressure perturbation at the leading edge of the stator blade root; The static pressure perturbation at the 50% blade span of the stator blade’ LE in the D1 scheme is weakened, which is because the rotor boundary layer separation in the D1 scheme is weakened, resulting in a weakening of the pulsation intensity in the wake area in the mid-span of the rotor, which weakens the static pressure perturbation in the mid-span of the stator blade; The static pressure perturbation at the 95% blade span of the D1 scheme is significantly reduced because the shock wave intensity at the rotor blade tip is reduced, boundary layer separation loss and leakage loss are also reduced in the D1 scheme. Therefore, the intensity of the tip leakage vortex and wake at the rotor blade tip are significantly reduced, resulting in a significant reduction in the static pressure perturbation at the LE of the stator blade tip.
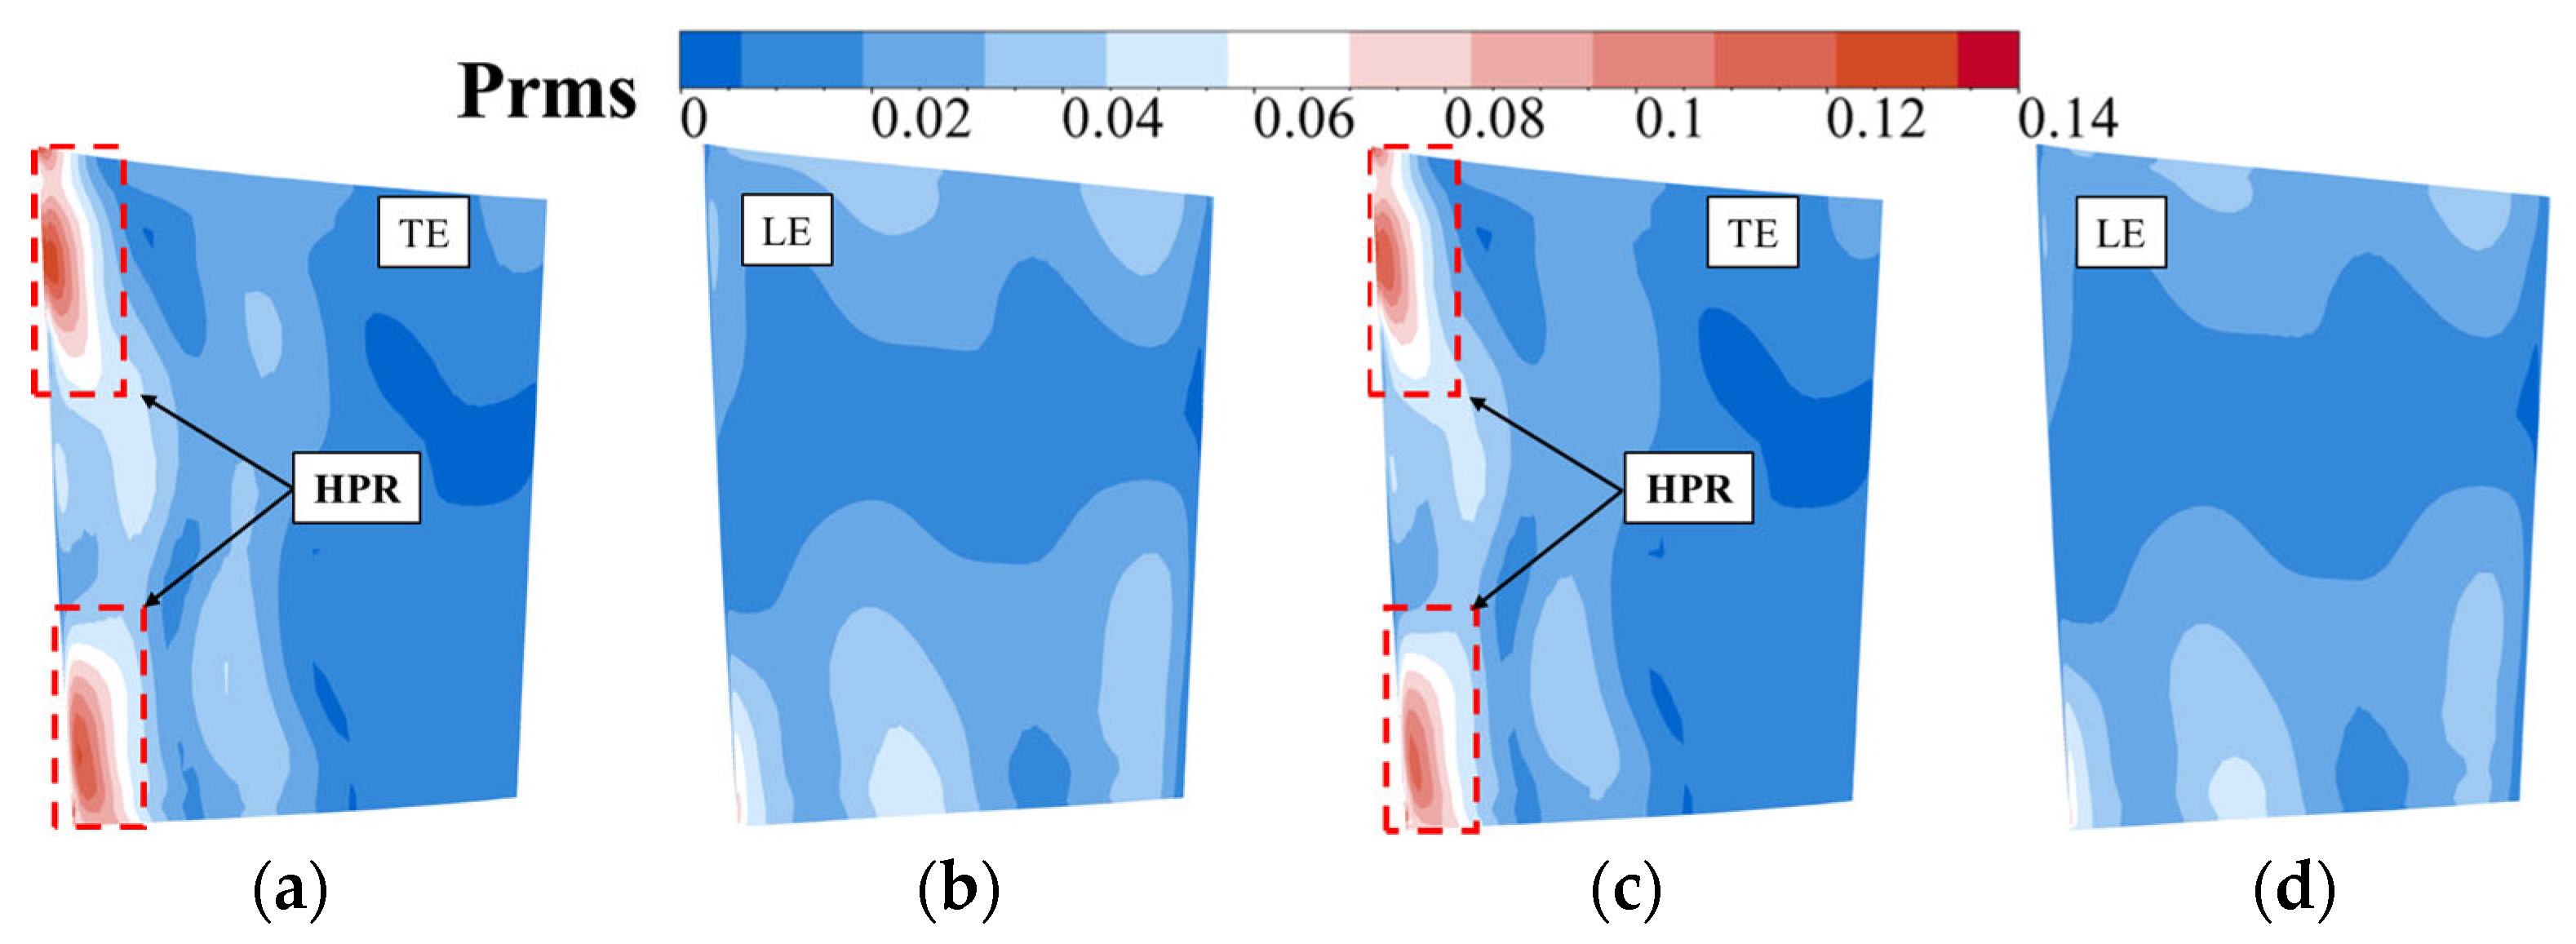
Figure 15 shows the RMS pressure on the stator surface. From the figure, it is evident that the LE experiences the greatest perturbation on the stator surface. Moreover, the perturbation amplitude on the suction surface surpasses that found on the PS. The unsteady perturbations at the tip and root of the stator’s PS and SS are more severe, and the stator mid-span is only disturbed by the upstream rotor wake, so the root mean square pressure is lower than at the blade tip and root. This is related to the different turbulence intensities along the radial direction of the wake and the flow on the rotor endwall. As shown in the figure in Section 3.4, there are three high turbulence regions at the rotor outlet: tip leakage vortex, root separation region, and wake. Moreover, the root and tip of the rotor are the core regions with the highest turbulence intensity in the wake region. Therefore, the stator blade tip is affected by the joint perturbation of the TLV at the rotor blade outlet and the turbulent core area of the wake, while the stator blade root is affected by the perturbation of the separation region at the rotor blade root and the turbulent core area of the wake. Compared to the P1 scheme, the D1 scheme reduces the area of high-pressure perturbation at the stator blade LE, which can ensure the strength of the stator blade.
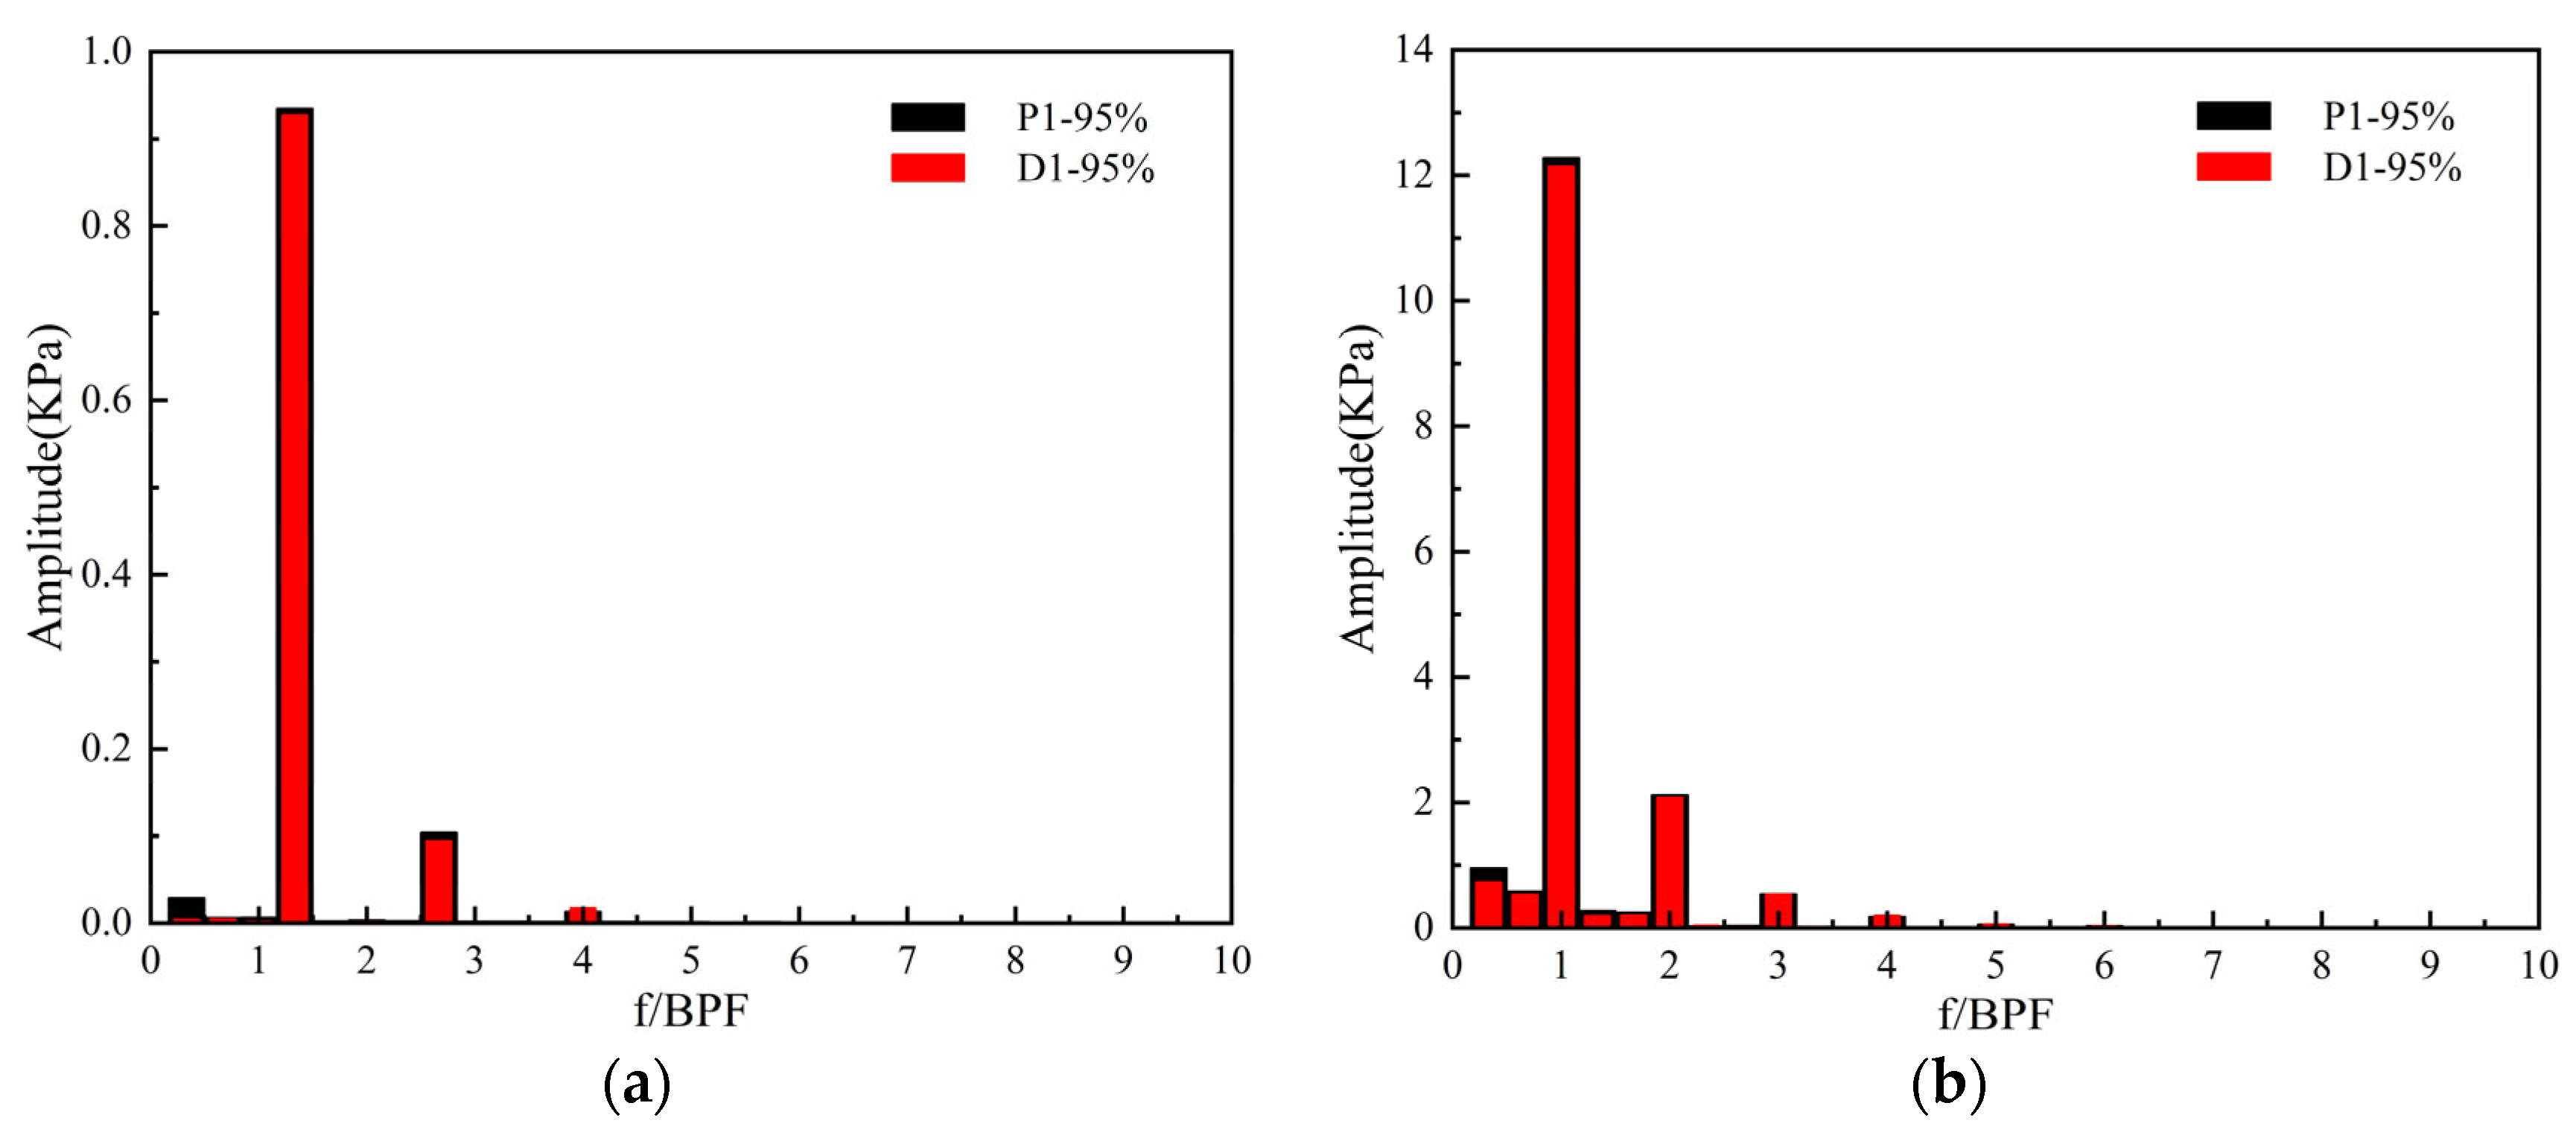
Figure 16 displays the static pressure spectrograms near the rotor’s TE and the stator’s LE of the P1 and D1 schemes at 95% blade span. It is evident that the primary frequency of the stator blade aligns with the passing frequency of the rotor blade, which is 10,313.2 Hz. The main frequency at the rotor TE is different from the blade passing frequency, which is 13,752.69 Hz. The static pressure perturbation on the rotor surface is mainly affected by the potential flow of the stator. Compared to the P1 scheme, the amplitude of the stator blade in the D1 scheme is reduced. It can also be seen that compared to the amplitude at the stator LE, the amplitude at the rotor TE decreases less, and the amplitude is lower. This indicates that the impact of the stator’s potential flow on the rotor TE is more significant compared to the effect of the wake on the stator LE, which decreases. Due to the attenuation of the upstream wake and the weakening of tip leakage vortex strength, the pressure interference on the stator LE is weakened.

3.4. Rotor–Stator Interaction Mechanism and Wake Transportation Characteristics

Liu [34] pointed out that in the rotor-stator axial gap of a compressor, the amplitude of velocity perturbation is generally large, and studying velocity perturbation in the rotor-stator axial gap is important. 
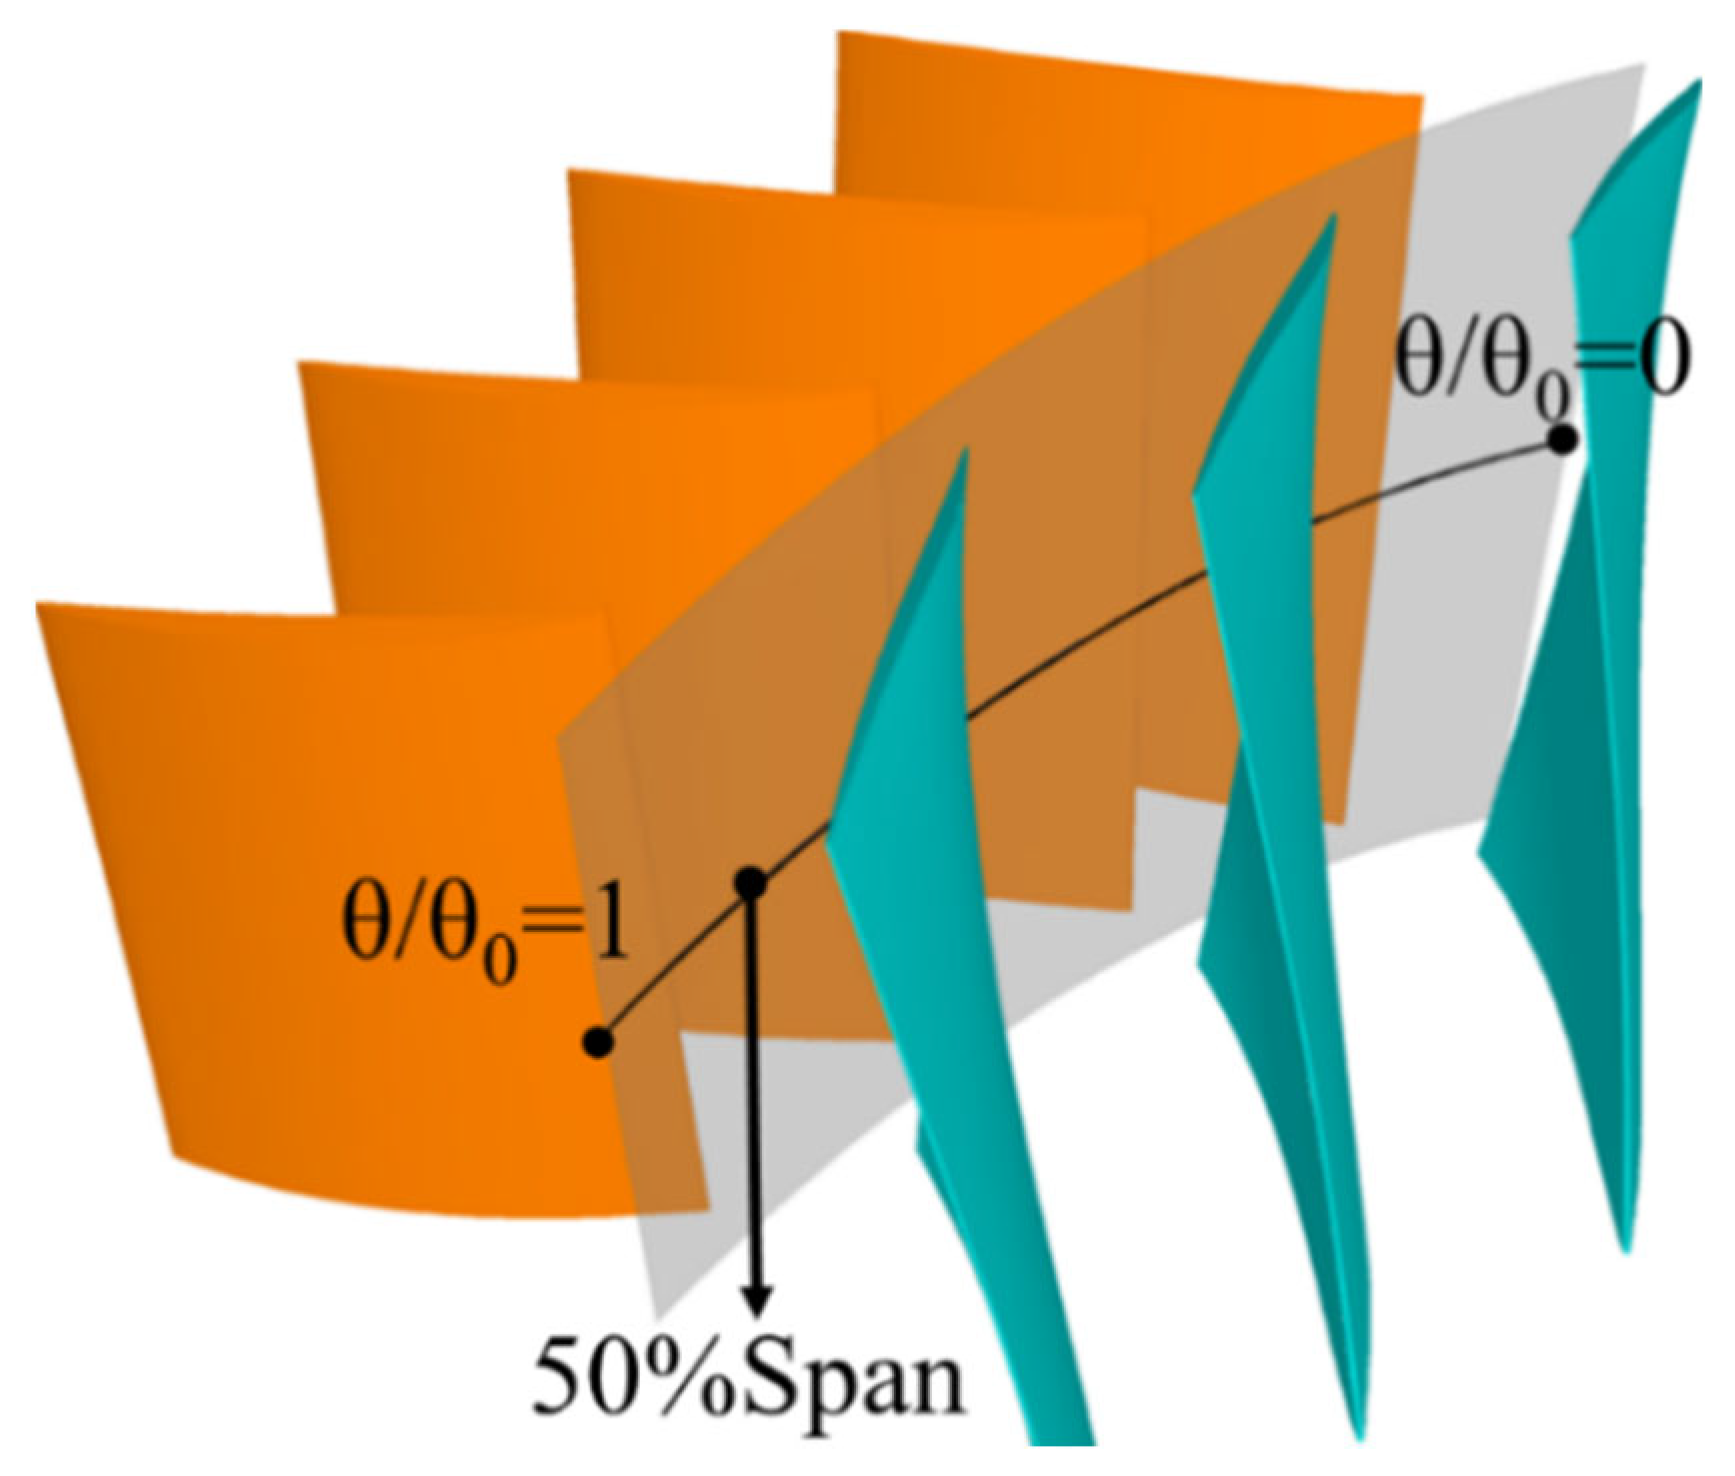
Figure 17 shows the sample line position at the axial gap at 50% span (this sample line is extracted in the post-processing software CFview 11.2 and obtained through the grid point J direction for extracting instantaneous tangential velocity data). Orange represents the stator blades, and cyan represents the rotor blades. 
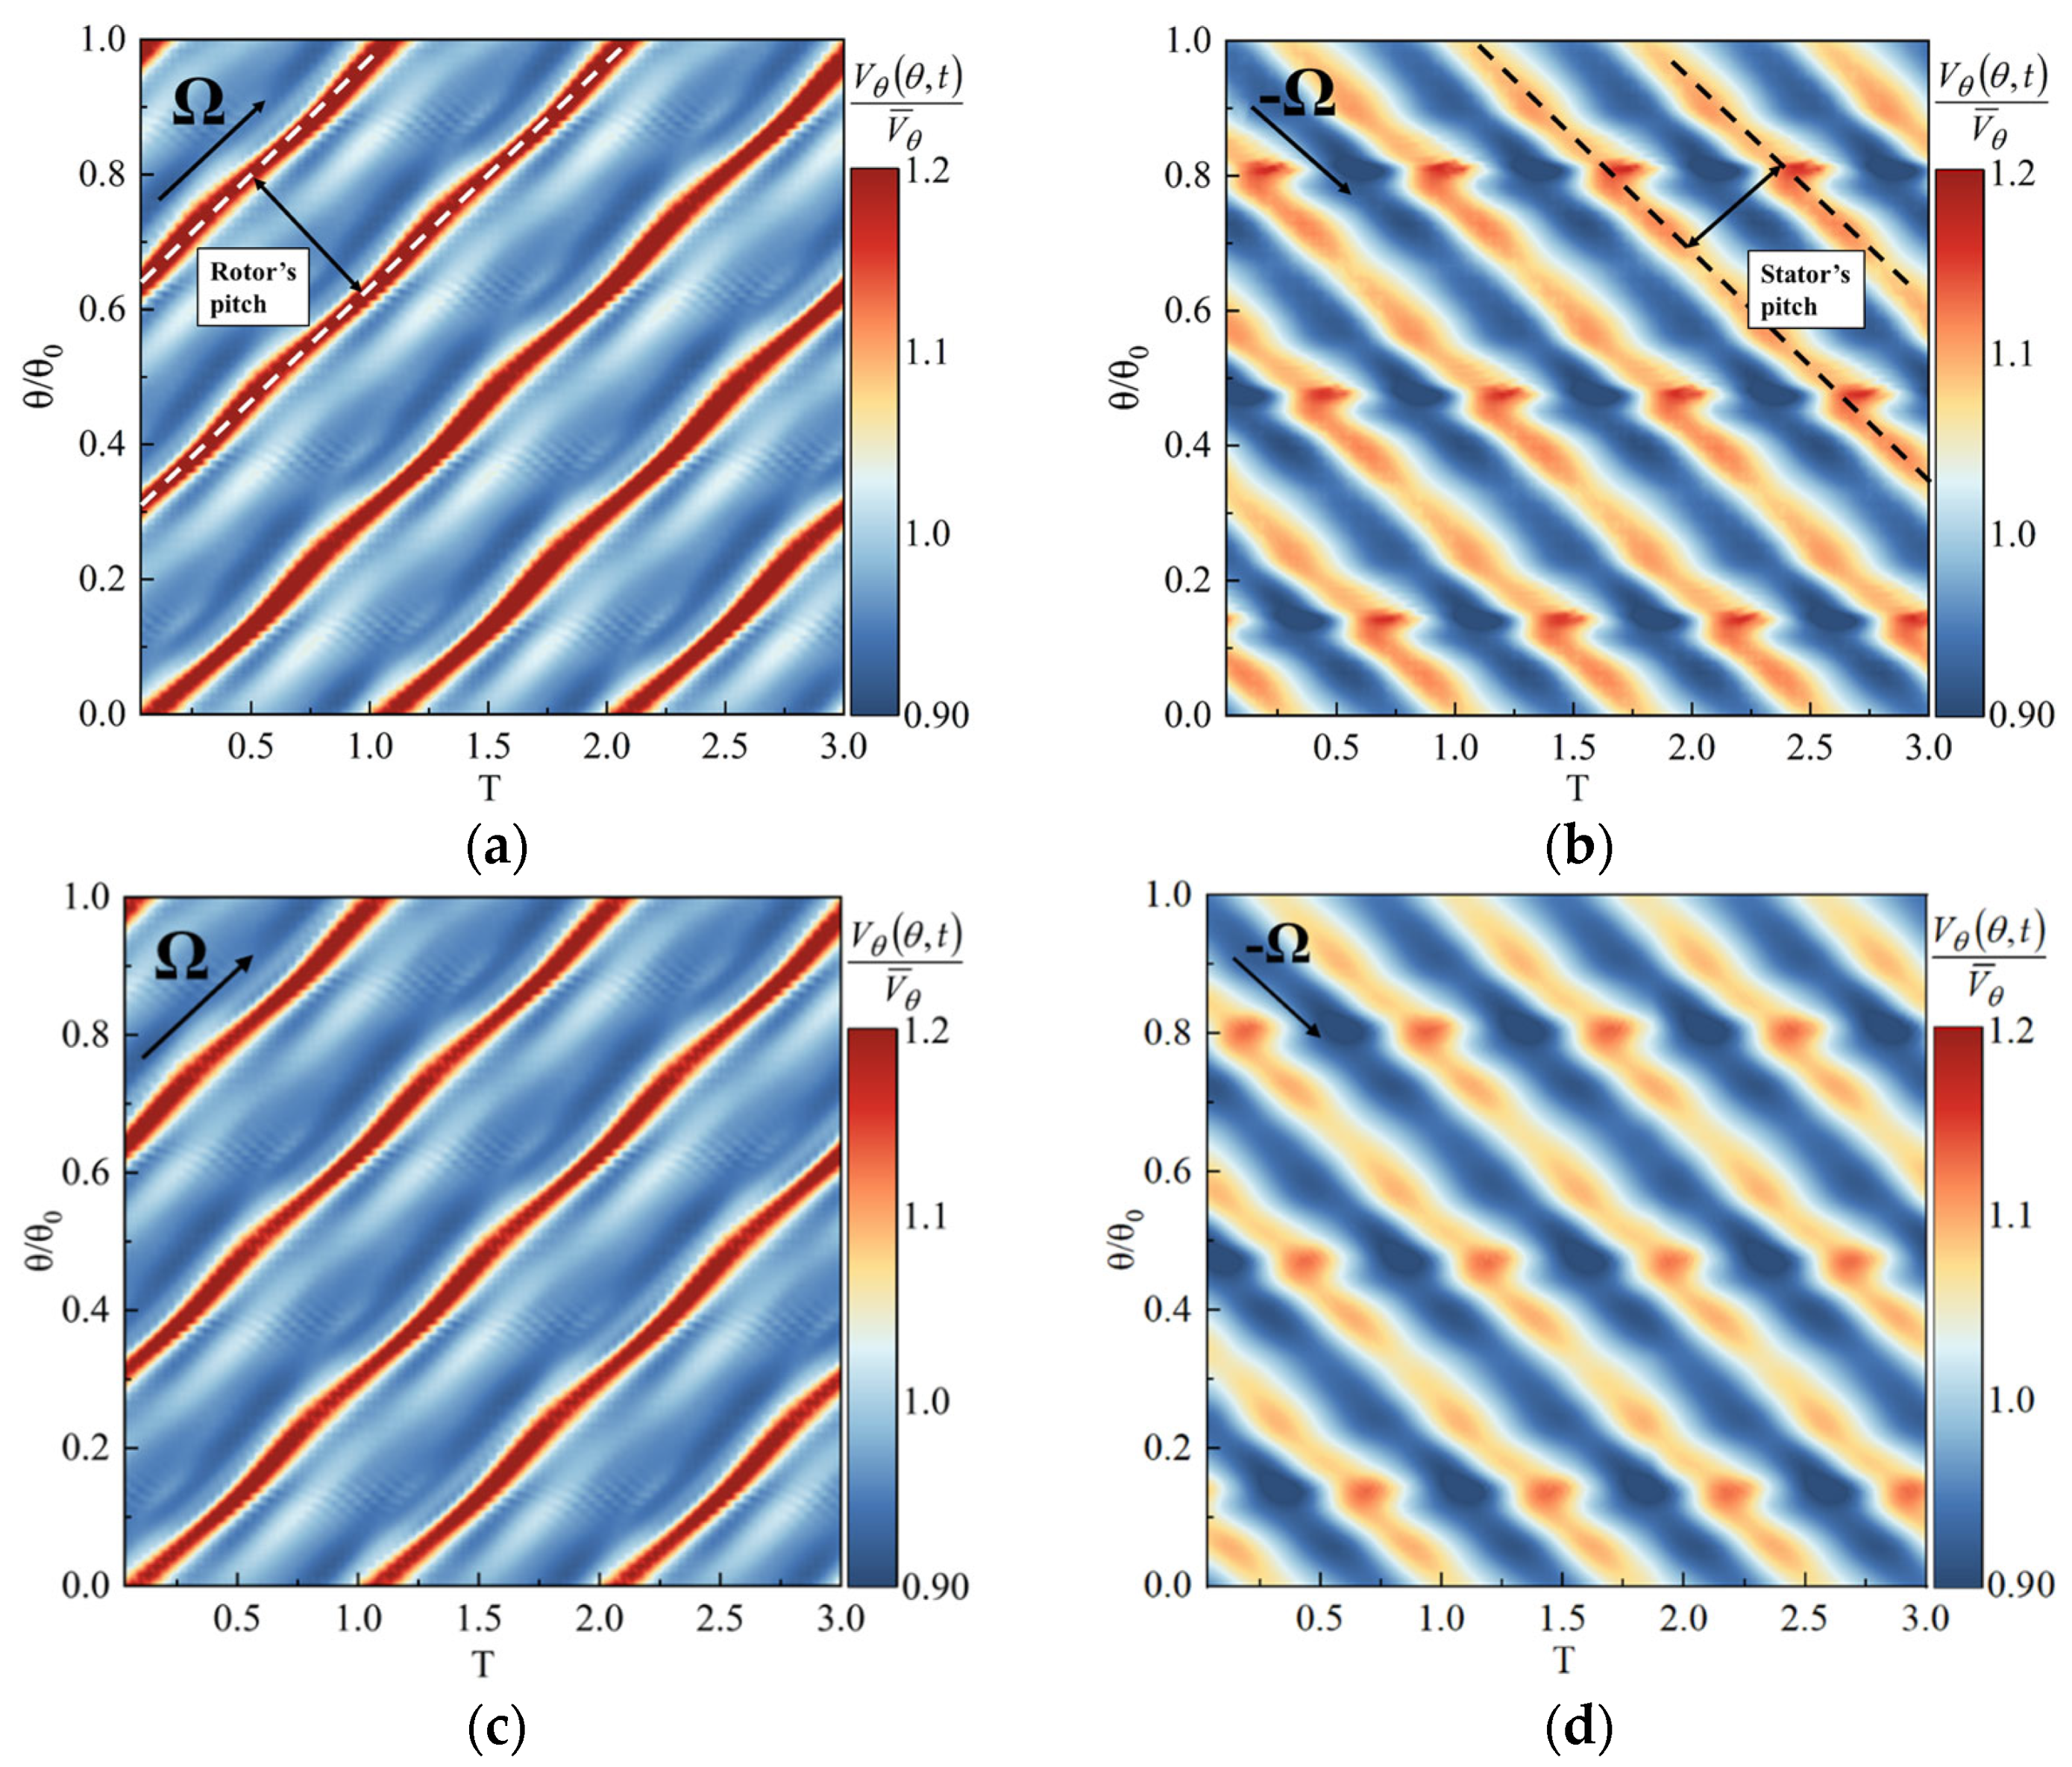
Figure 18 shows the space-time map of the non-dimensional tangential velocity at the rotor-stator axial gap at 50% blade span. Figure 18a,c show the space-time map of the non-dimensional tangential velocity in the stator frame, and Figure 18b,d show the space-time map of the non-dimensional tangential velocity in the rotor frame.
According to Figure 18a, it is found that the velocity perturbation period in space is equal to the rotor’s pitch (the distance between two adjacent high fluctuation areas in Figure 18), and the propagation direction aligns with the direction of rotor rotation. This is caused by the velocity perturbation in the stator frame, which is mainly induced by the wake. The tangential velocity in the wake of the rotor frame is higher than the main flow velocity, and the velocity perturbation significantly increases at a special space location near the stator LE. According to Figure 18b, it is found that the velocity perturbation period in space is equal to the stator blade pitch, and the propagation direction is opposite to the rotor rotation direction. This is caused by velocity perturbations in the rotor frame, which are mainly caused by the potential flow of the stator. More importantly, at a special space location near the rotor TE, velocity perturbations increase.
The above phenomenon indicates that the rotor wake is nonperiodic within a rotor pitch and is significantly influenced by the potential flow of the downstream stator. The interaction between the wake and the stator potential flow will enhance the velocity perturbations of the wake. Compared to the P1 scheme, the velocity perturbations in the rotor and stator frame under the D1 scheme are weakened, indicating that the wake in the rotor blade mid-span is weakened, and the impact of the stator’s potential flow on the rotor is also reduced.
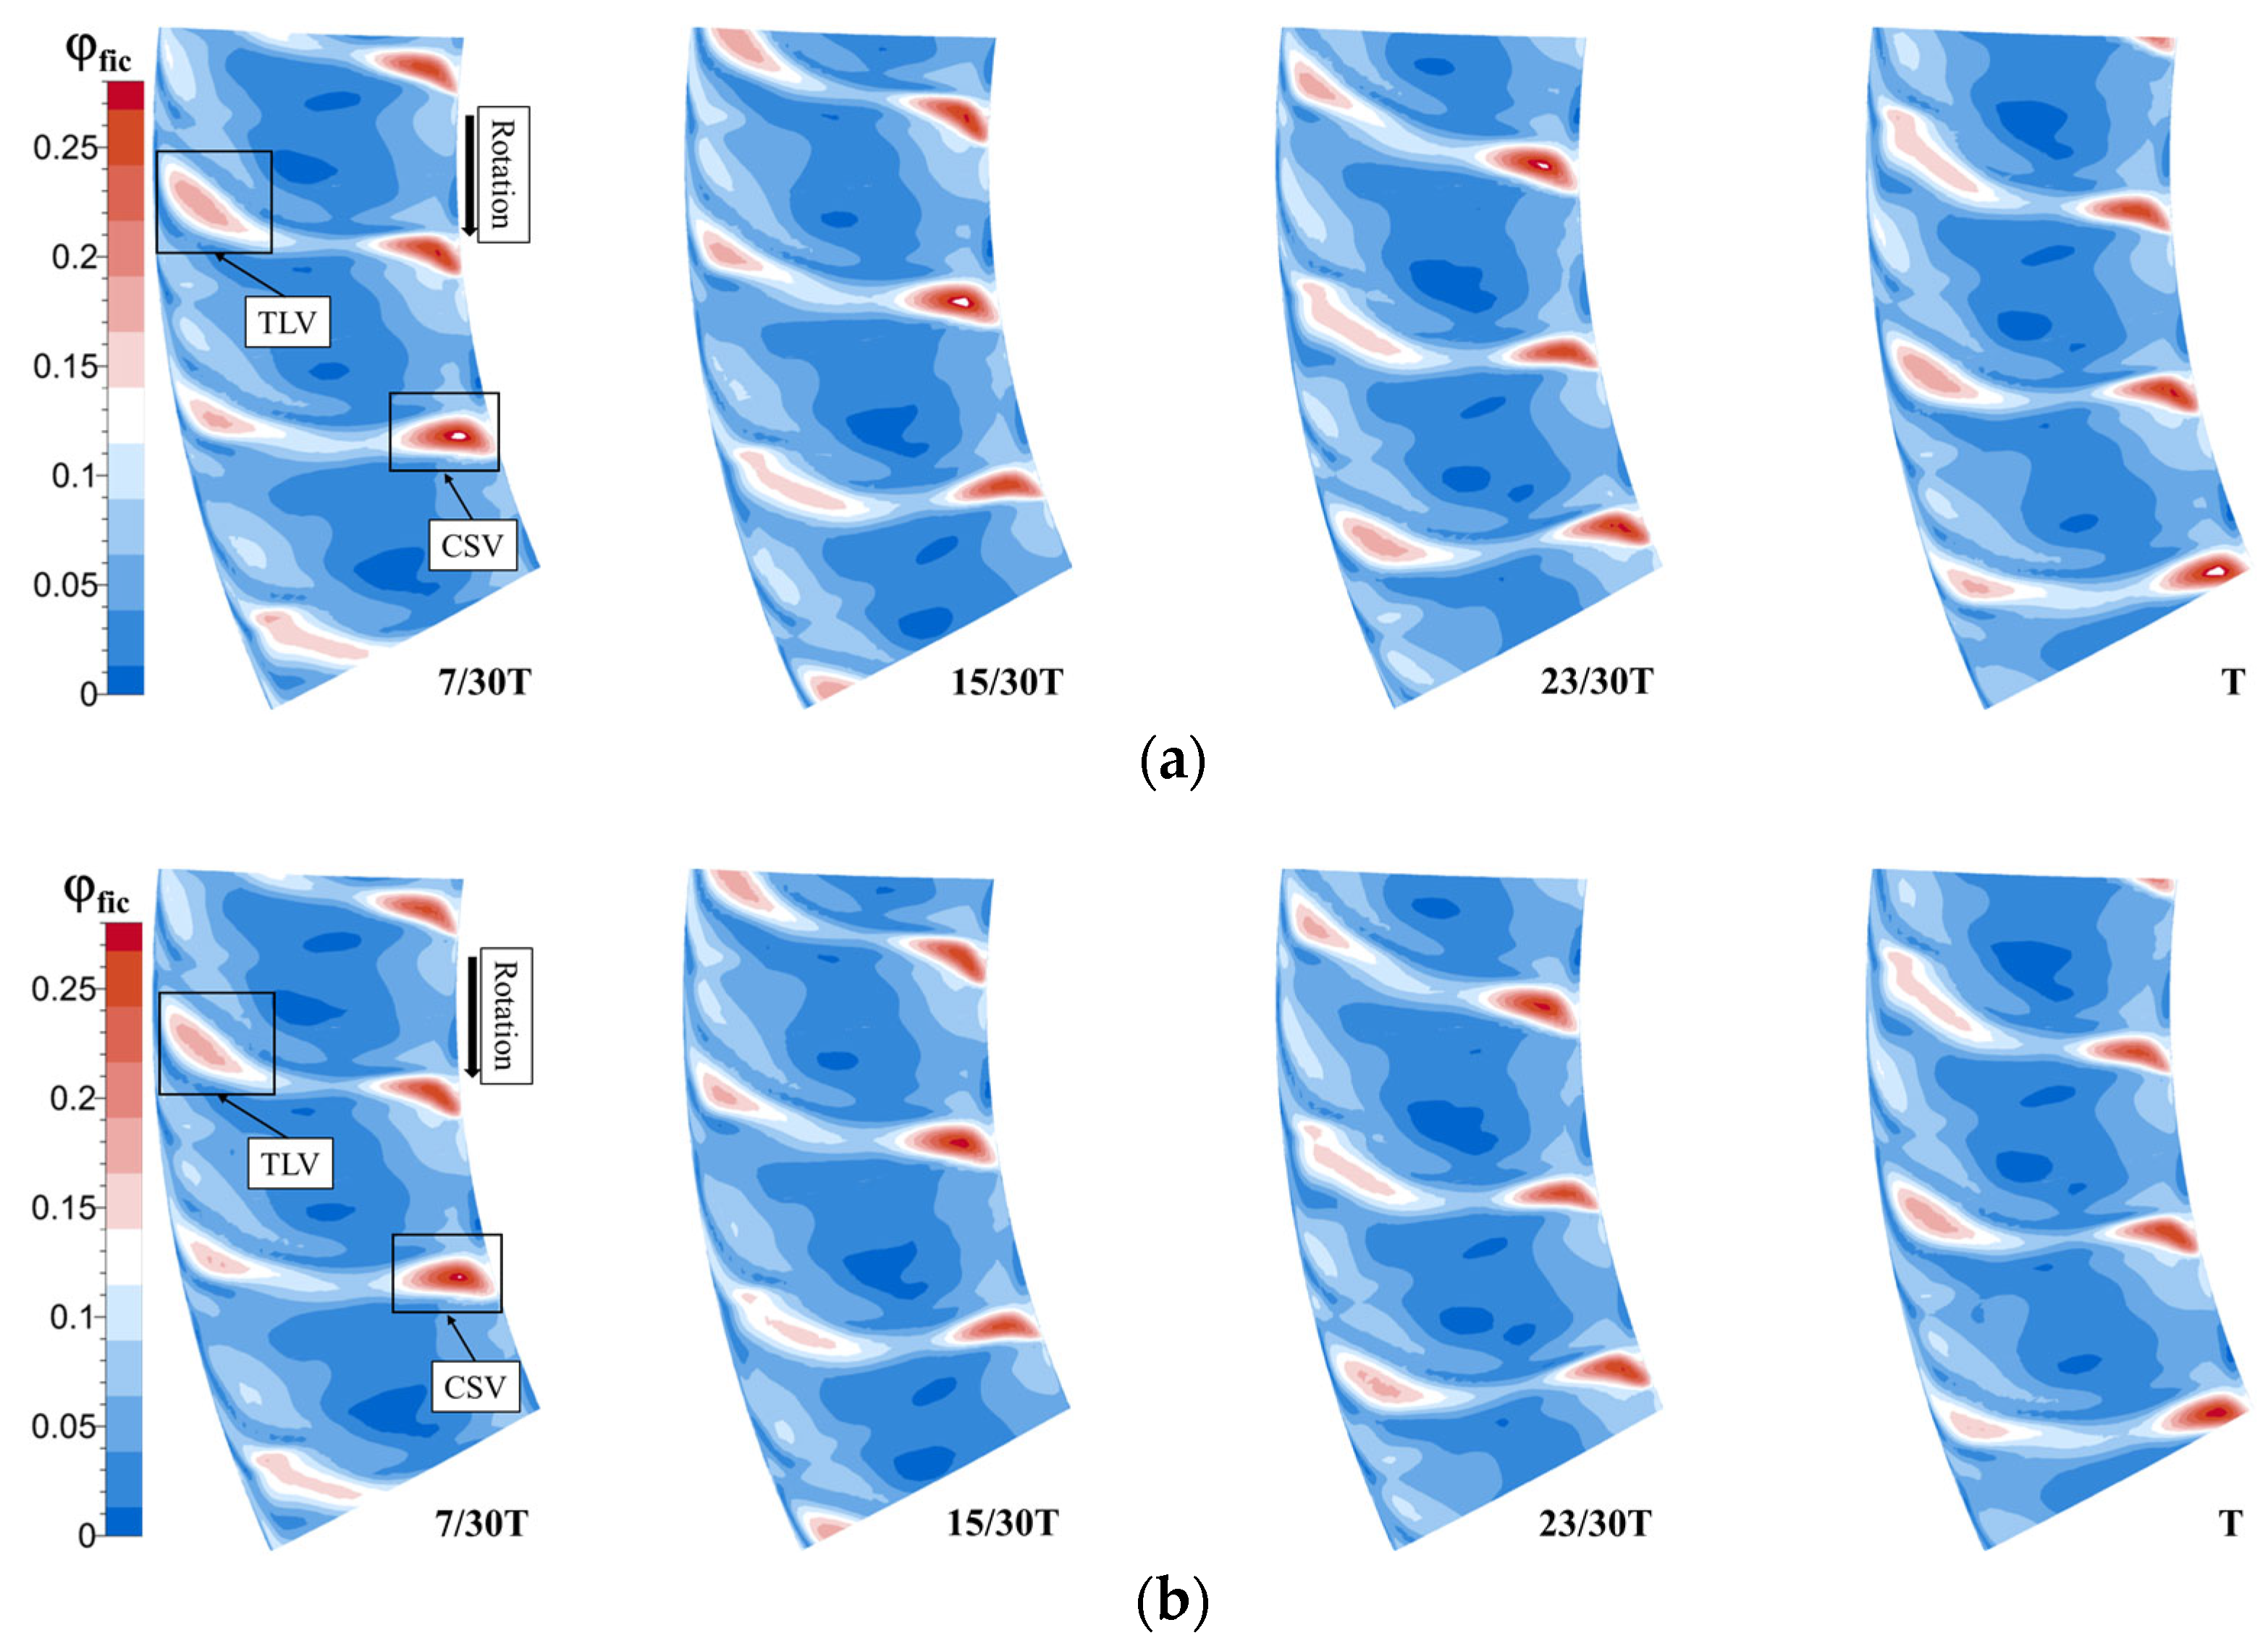
Figure 19 represents the interspersing of the perturbation intensity at the rotor outlet. This variable can represent the intensity of unsteady perturbation, and the formula for the perturbation intensity is defined as follows:
φ fic = W i , j , k W i , j , k 2 / U t i p
where W i , j , k is the instantaneous velocity in three directions, W ¯ i , j , k is the time-averaged velocity in three directions, and Utip represents the blade tip velocity. According to the figure, it is found that the flow field at the outlet undergoes synchronous periodic changes with the rotation of the rotor, and there are mainly three high pulsation regions at the rotor outlet: the TLV at the blade’s tip, the corner separation at the blade’s root, and the wake distributed along the entire blade span. These three high perturbation regions are the primary sources of unsteady perturbation to the stator blades. The TLV and root corner separation are mixed with the rotor wake on the upper and lower endwalls, respectively, and then periodically sweep through the stator passage, resulting in more complex secondary flow and stronger turbulence perturbation in the endwall region of the stator passage. Compared to the P1 scheme, the D1 scheme weakens the TLV and CSV, thus weakening the unsteady perturbation on the stator blades.
Under near-stall conditions, the instability in the 50% span passage of the stator blade is primarily caused by the rotor’s wake. The wake possesses a lower axial velocity and higher tangential velocity compared to the main flow, resulting in a higher flow angle and higher instantaneous flow angle. 
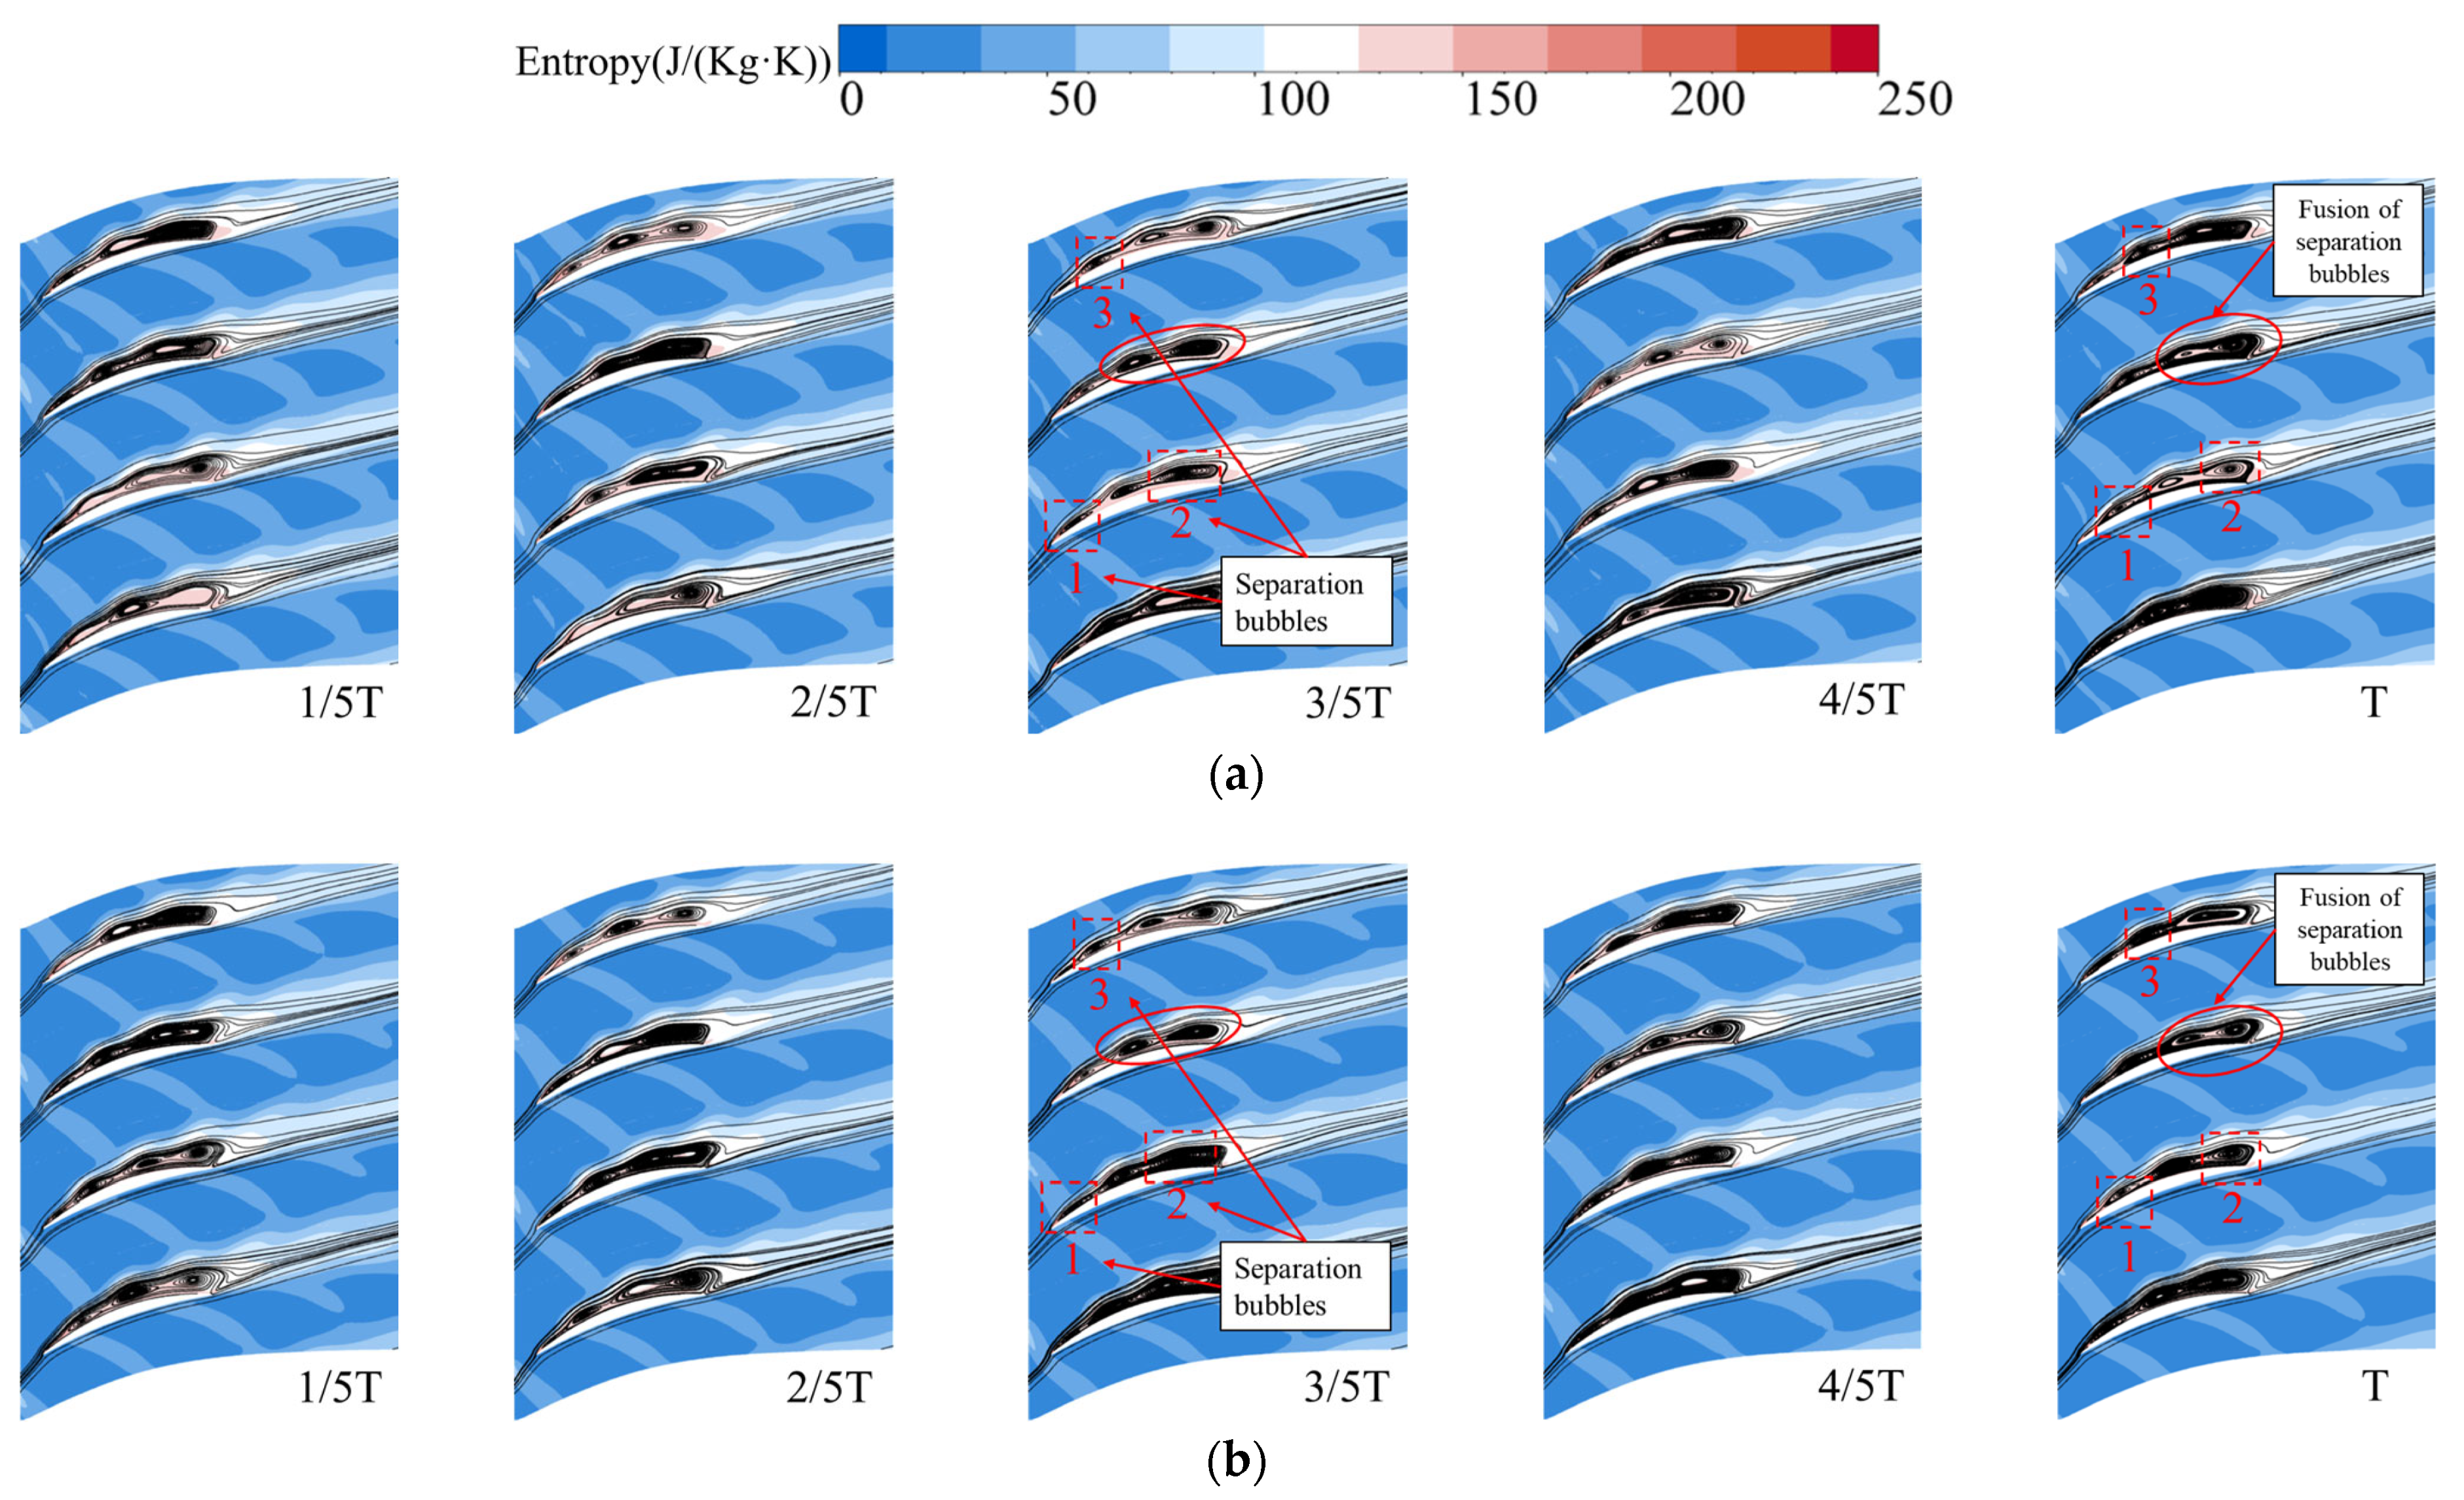
Figure 20 displays the instantaneous wake at the 50% span of the stator blade. T represents the rotor blade rotation period. In one rotor period T, the rotor’s wake has entered the stator passage and is divided into two segments by the stator blade LE. These two segments then propagate downstream independently, and the separation bubbles also appear. More significantly, the wake just entering the stator passage induces separation bubbles attached to the SS due to the negative jet effect at the LE. These separation bubbles interact with the boundary layer, exacerbating the BLS. As the wake is transported into the channel, separation bubbles from other positions are also carried downstream. At time T, the separation bubbles formed at 3/5 T move downstream, indicating that the speed of the bubble is lower than the wake in the main flow, causing an increase in its size. The fusion of separation bubbles (red ellipse line) can be observed. Compared with the P1 scheme, it was found that the wake width in the stator passage of the D1 scheme decreased, the BLS on the SS weakened, and the separation bubble size decreased.
In addition, according to Figure 20, it is found that the rotor wake significantly widens during downstream transportation, mainly due to two reasons: the adverse pressure gradient in the stator blade passage causes the rotor wake to expand, increasing the wake width. Due to the negative jet effect, the velocity loss in the wake region causes the low-momentum fluid in the region to have convective velocity pointing toward the stator blade pressure surface, causing the wake to accumulate on the PS and increasing the wake width. Due to the higher flow velocity on the SS in comparison to the PS, as the wake moves downstream, one end on the SS progresses faster than the other end on the PS, causing the wake to stretch and gradually tilt.
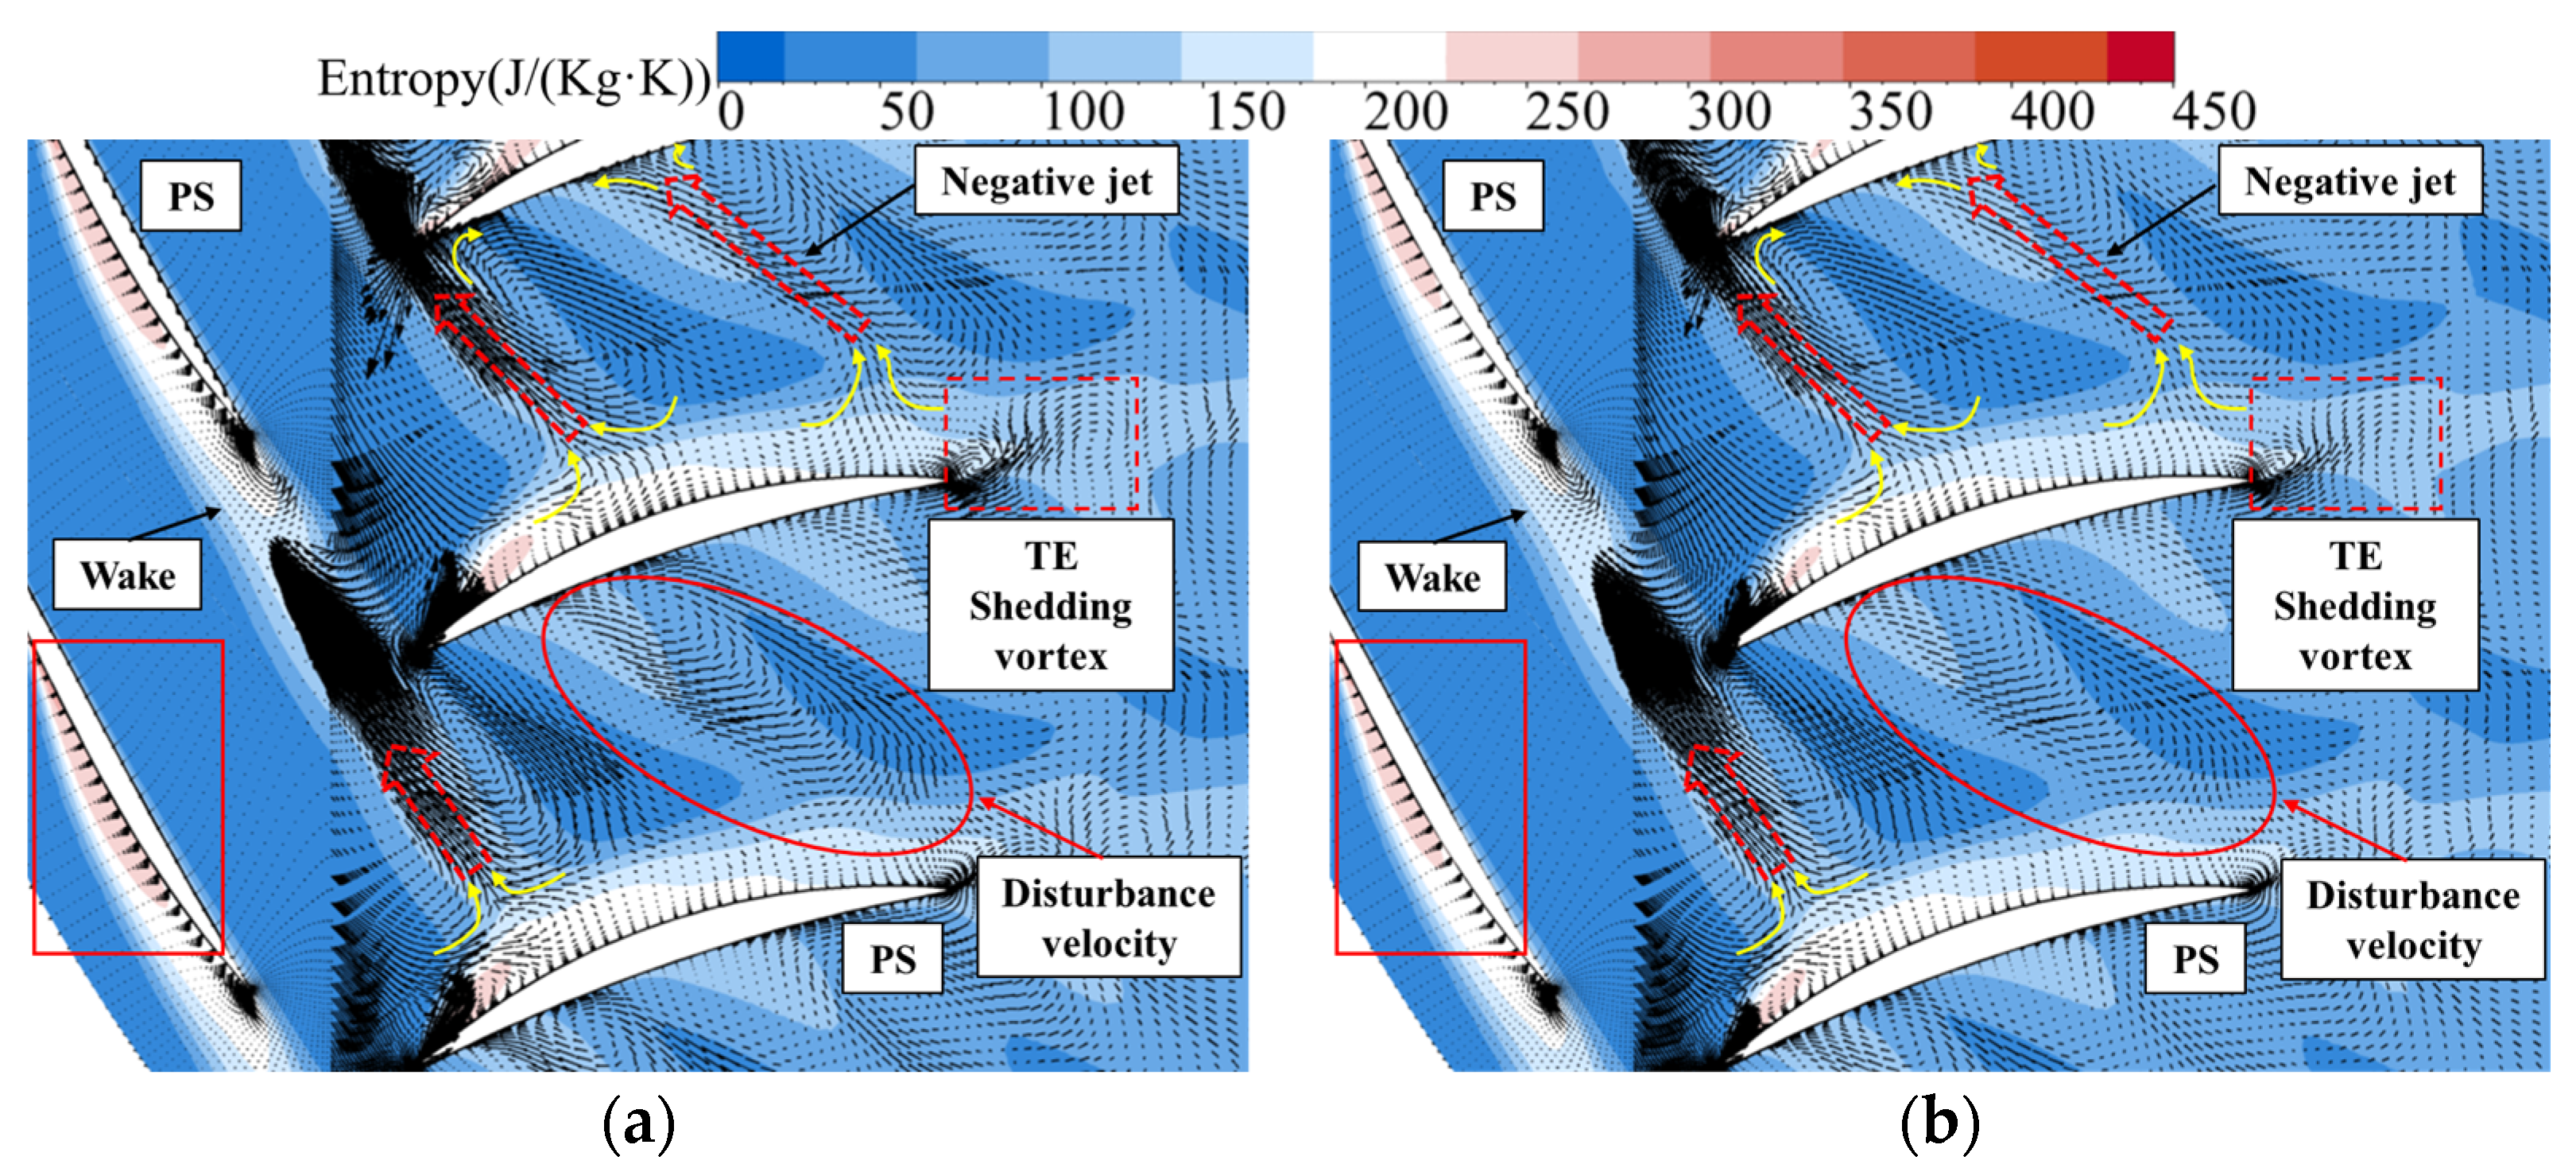
Figure 21 displays the unsteady flow field of rotor–stator interaction at 95% blade span. The rotor rotates over 0.5 T. The perturbation velocity and entropy were selected for analysis. Perturbation velocity [35] is equal to the difference between the instantaneous velocity vector and the time-averaged velocity vector, and its formula can be expressed as:
W P V = W W ¯
where W P V and W denote the disturbance velocity and the instantaneous velocity, respectively, and denote the time-averaged velocity. The rotor wake is split into two segments upon impact with the stator LE. As shown in Figure 20 and Figure 21, the wake segment displays elevated entropy levels and displays traits associated with negative jets. The disturbance velocity in the wake section of the same stator channel flows from the SS of one blade to the PS of another blade. Due to the negative jet’s suction effect near the SS (when the jet is located at a distance from the SS), the free flow is drawn toward the wake along the SS, both upstream and downstream. A contrasting flow pattern is evident at the PS, leading to the generation of a reverse jet flow in both the upstream and downstream directions on the PS. In the region between two adjacent wake segments, the opposing direction of the free stream and the negative jet leads to the formation of vortex pairs. Stretching and broadening of the wake were also observed at 95% blade span. More significantly, it is worth noting that the perturbation velocity experiences a noticeable decline as the wake advances toward the blade’s TE., and shedding vortex is observed at the blade TE.
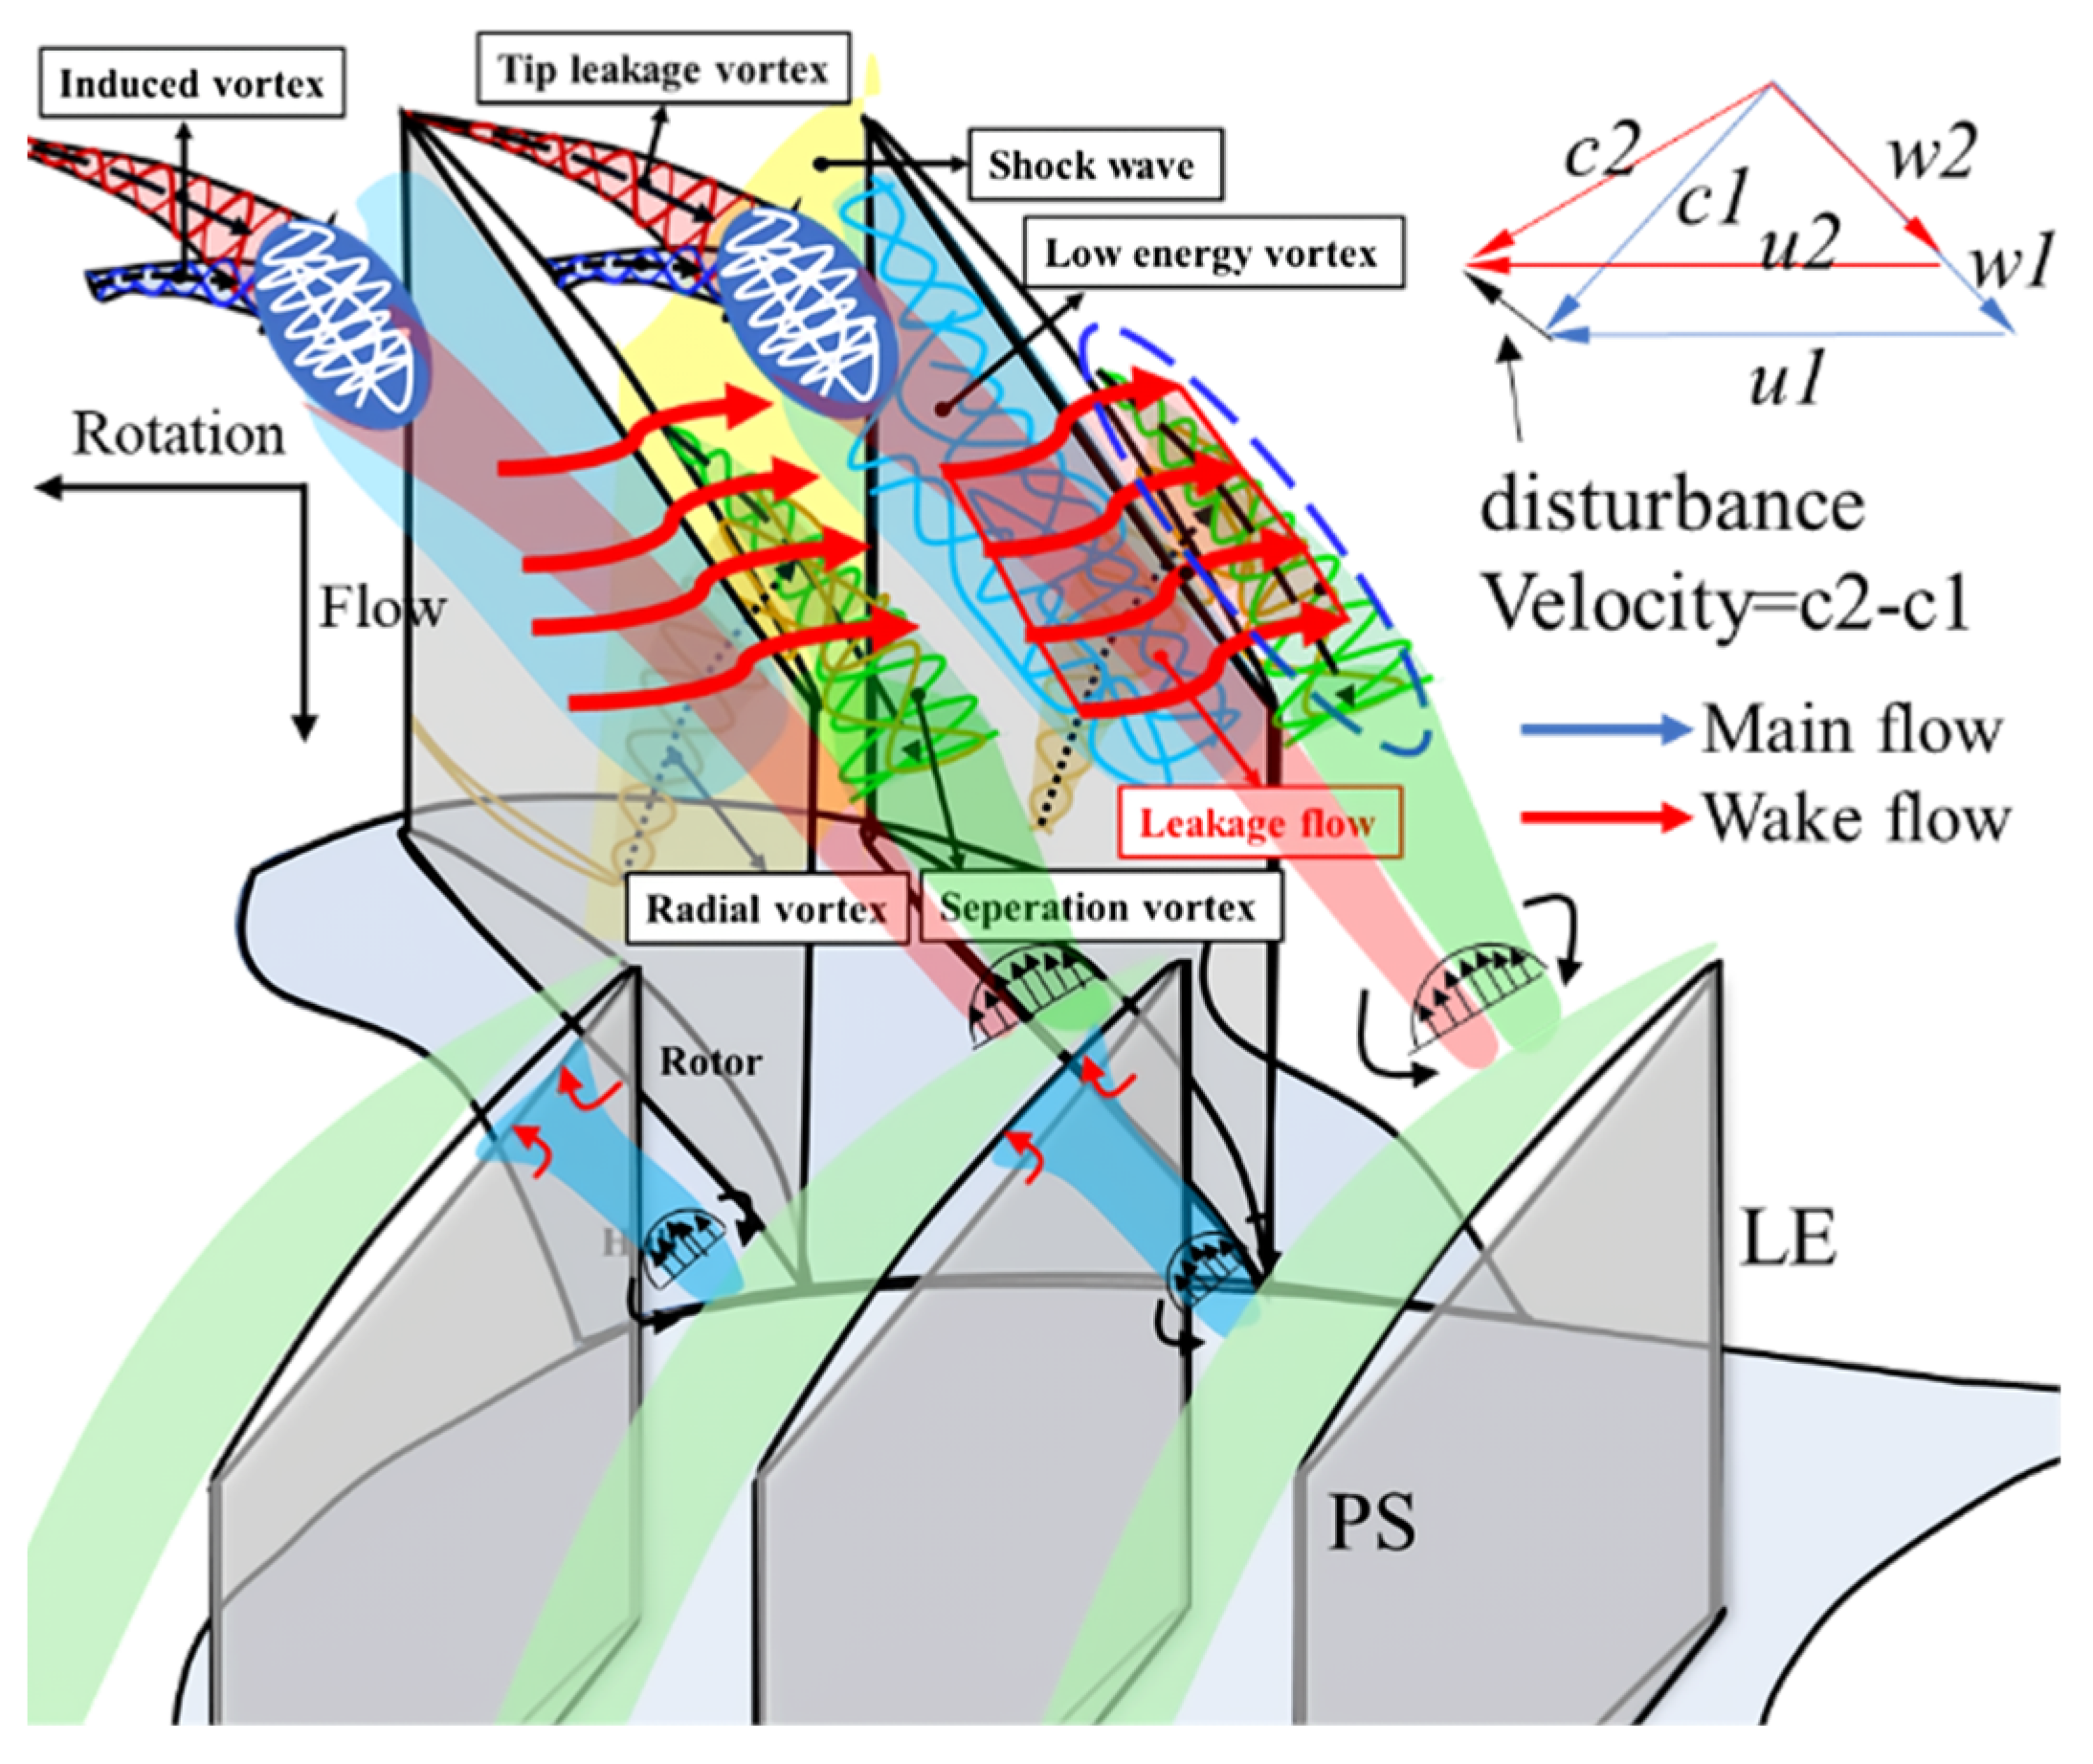
In the single-stage compressor, the velocity loss of the wake and the strong turbulence intensity inside interfere with the downstream stator blades, resulting in strong unsteady aerodynamic parameters on the blade’s surface. The mechanism of rotor–stator interaction at the elementary stage is shown in Figure 22 and the wake is formed by the convergence of the boundary layers of the rotor PS and SS at the TE. The pressure and velocity of the main flow are much larger than those in the wake region, which is the main part of the loss. From the velocity triangle, it is evident that the velocity in the wake is significantly lower than the main flow, causing the absolute velocity of the wake at the stator blade inlet to deflect toward the stator blade pressure surface, and increasing the inlet attack angle when sweeping past the stator blade LE. The rotor wake will be cut into two segments by the stator blade LE, and the two segments will propagate downstream independently of each other.
The magnitude and direction of the absolute velocity vector inside the wake and the main flow absolute velocity vector are different, so when the wake transports toward the downstream stator passage, there will be a perturbation velocity relative to the main flow. The perturbation velocity is the difference between the wake absolute velocity vector and the main flow absolute velocity vector, and the direction is from the SS to the PS. The airflow with perturbation velocity in the wake will move toward the PS by the SS while being transported downstream and eventually gather at the PS. Therefore, airflow will also enter the wake area on the stator’s SS region to replace the airflow moving toward the PS. This phenomenon is called the negative jet effect.
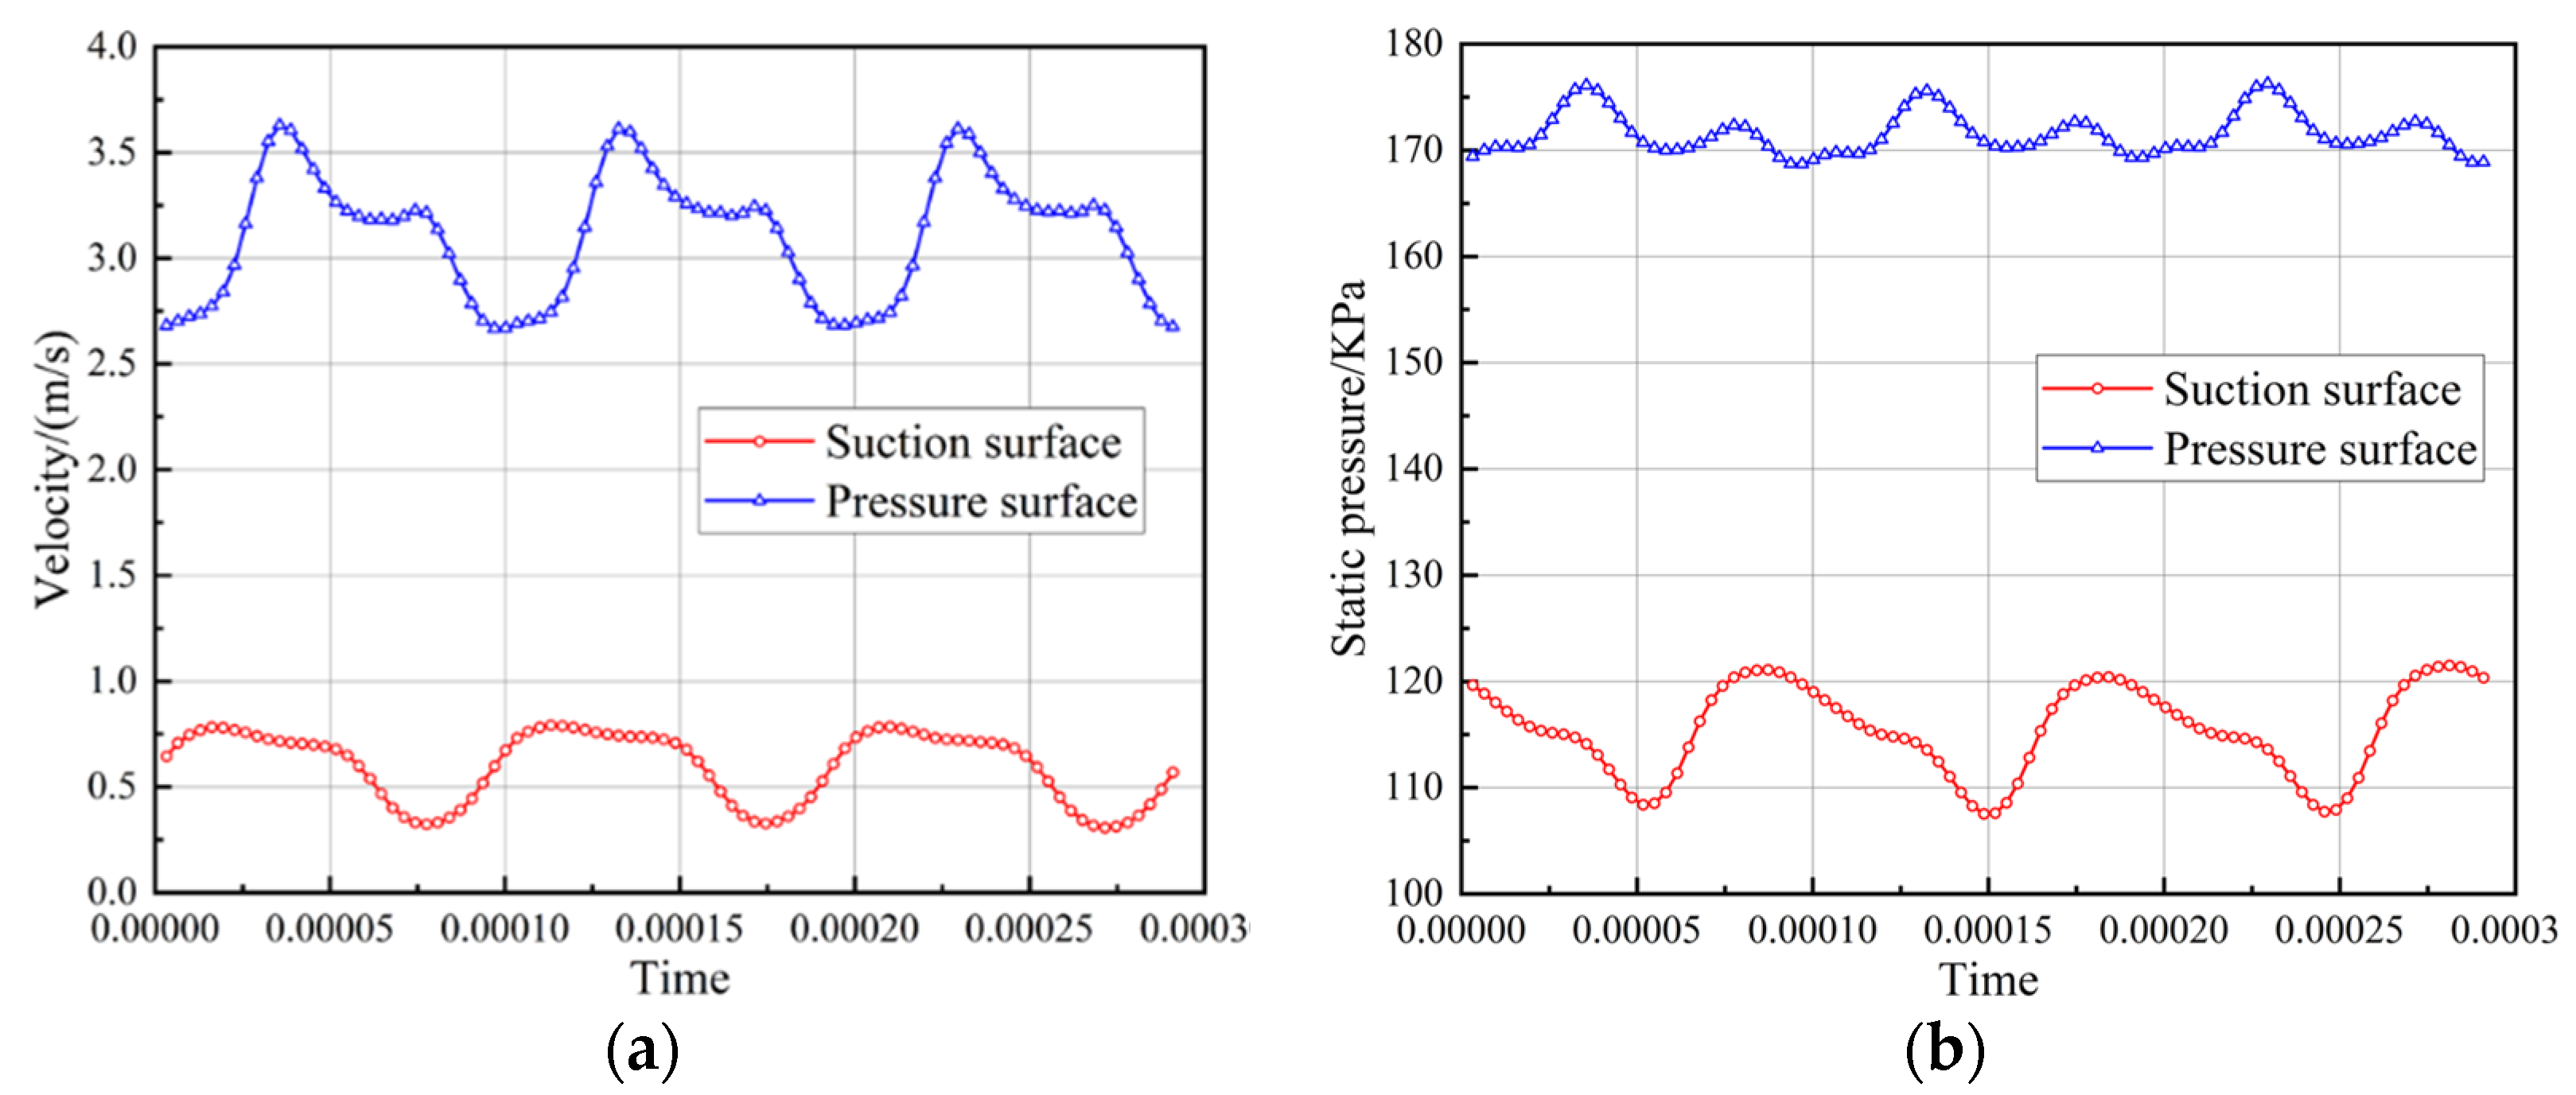
As shown in Figure 23, the negative jet effect has a significant impact on the pressure and velocity distribution on the stator surface. When the wake sweeps over the stator blade surface, the airflow upstream and downstream of the wake on the SS is sucked into the wake section as a supplement to the airflow flowing toward the pressure surface. Therefore, the upstream and downstream of the wake at the suction surface will generate a secondary flow velocity (black curved arrow) pointing from the wake outside to the wake inside. The secondary flow velocity of the wake upstream near the stator LE is the same as that of the mainstream, so the velocity increases. The secondary flow velocity at the wake downstream is opposite to the mainstream, so the velocity decreases. On the other hand, at the pressure surface, the airflow inside the wake flows out from the wake inside, resulting in a secondary flow velocity (red curve arrow) pointing from the wake inside to the wake outside at the wake’s upstream and downstream. The secondary flow velocity of the wake upstream of the PS is opposite to the mainstream, so the velocity decreases. The secondary flow velocity of the wake downstream is the same as that of the mainstream, so the velocity increases. So when the wake sweeps over the stator passage, the velocity at a specific point (at fixed geometric points that are recognized through spatial coordinate points) on the stator SS will first decrease and then increase (when the centerline of the wake just passes through the point), while the velocity at a specific point on the PS will first increase and then decrease. Due to the airflow entering the wake region on the SS to replace the airflow in the wake moving toward the PS, the pressure at a specific point on the SS will first decrease and then increase. Due to the continuous accumulation of airflow on the PS, the pressure at a specific point on the PS first increases and then decreases.

4. Conclusions

A numerical simulation was conducted on a transonic compressor to understand the mechanism of rotor–stator interaction more comprehensively. The instantaneous flow field was comparatively analyzed under NSP conditions. A comparison was made between compressors with small-value tip clearance and compressors with non-uniform tip clearance to determine the results. The conclusions are as follows:
(1)
For small value tip clearance (P1) and non-uniform tip clearance (D1) rotor compressors, compared to the effect of stator potential flow on the static pressure distribution at the rotor TE, the effects of rotor tip leakage vortex, wake, and root corner separation flow on the static pressure distribution at the stator LE is more significant. It was also found that the interference of unsteady aerodynamic forces on the stator is much greater than that on the rotor. After applying the non-uniform tip clearance D1 scheme, the potential impact of the rotor on the stator is reduced due to the reduced intensity of tip leakage vortex, wake, and blade root corner separation.
(2)
At the blade’s mid-span, the nondimensional tangential velocity perturbation in the axial gap between the rotor and stator is very large. In the stator and rotor frame, the velocity perturbation period is equal to the rotor blade or stator blade pitch, and the propagation direction is different. Moreover, inside the wake, due to strong shear action, the flow loss and entropy value increase. Due to the induction effect of the negative jet, separation bubbles are generated on the stator blade suction surface, leading to intensified boundary layer separation in this region.
(3)
At 95% blade span, in the region between two adjacent wake segments, the free stream propagates oppositely with the negative jet, and consequently generates vortex pairs. The perturbation velocity amplitude of the D1 scheme is smaller than the perturbation velocity of the P1 scheme. The rotor–stator interaction mechanism in a stage environment is mainly reflected in the negative jet effect, which in turn affects the unsteady pressure and velocity perturbation on the stator surface.

Author Contributions

Conceptualization, Z.L. and Q.W.; Data curation, Z.L. and G.Z.; Formal analysis, Z.L. and Q.W.; Funding acquisition, G.Z and Z.C.; Investigation, Z.L. and Z.X.; Methodology, Z.L.; Supervision, G.Z.; Writing—original draft, Z.L.; Writing—review and editing, Z.L. and G.Z. All authors have read and agreed to the published version of the manuscript.

Funding

This research was sponsored by the foundation of the National Key Laboratory of Science and Technology on Aerodynamic Design and Research (No. 614220121050125).

Data Availability Statement

The data are available from the corresponding author on reasonable request.

Conflicts of Interest

The authors declare no conflict of interest.

Nomenclature

AbbreviationsSymbols
LELeading edgeSSurface area
TETrailing edgeρDestiny
NSPNear stall point Δ C P Static pressure perturbation
PEPPeak efficiency pointPStatic pressure
SBLIShock/boundary layer interactionPrmsRoot mean square of pressure
OSWOblique shock wave CpStatic pressure coefficient
NSWNormal shock waveφffcPerturbation intensity
PSPressure surfacecAbsolute velocity
SSSuction surfaceuRotation velocity
TLVTip leakage vortexwRelative velocity
BLSBoundary layer separationTPeriod within one rotor pitch
BPFBlade passing frequencyθTangential direction
CSVCorner separation vortexCp0pressure coefficient
HPRHigh pressure regionP0Stator inlet total pressure
DLFDouble leakage flowΩBlade surface
RMSRoot mean squareiAxial direction
NcorCorrected rotation speedjTangential direction
P1Small-value tip clearance W Instantaneous velocity
D1Non-uniform tip clearance0.5ρV2Inlet dynamic pressure
UAFUnsteady aerodynamic forces

References

  1. Zhang, H.; Wu, Y.; Li, Y.; Yu, X.; Liu, B. Control of Compressor Tip Leakage Flow Using Plasma Actuation. Aerosp. Sci. Technol. 2019, 86, 244–255. [Google Scholar] [CrossRef]
  2. Ding, S.; Chen, S.; Wang, S. Flow Mechanism of Self-Recirculating Casing Treatment in a Low-Reaction Transonic Compressor Rotor. Aerosp. Sci. Technol. 2022, 130, 107925. [Google Scholar] [CrossRef]
  3. Zhang, H.; Liu, W.; Wang, E. Effect of Inverse Blade Angle Slots on a Transonic Rotor Performance and Stability. Aerosp. Sci. Technol. 2020, 96, 105596. [Google Scholar] [CrossRef]
  4. Zhou, K.; Zhou, C. Unsteady Effects of Vortex Interaction on Tip Leakage Vortex Breakdown and its Loss Mechanism. Aerosp. Sci. Technol. 2018, 83, 363–371. [Google Scholar] [CrossRef]
  5. Cao, Z.; Zhang, X.; Zhang, F. Tip Leakage Vortex and its Breakdown Mechanism in Aspirated Compressor Cascades Designed with Conventional Method and Curvature Induced Pressure Recovery Concept. Aerosp. Sci. Technol. 2021, 113, 106692. [Google Scholar] [CrossRef]
  6. Wang, B.; Wu, Y.; Yang, F. Intermittent Breakdown of the Tip Leakage Vortex and the Resultant Flow Unsteadiness in the Tip-Region of a Subsonic Compressor Cascade. Aerosp. Sci. Technol. 2021, 113, 106679. [Google Scholar] [CrossRef]
  7. Smith, N.R.; Key, N.L. A Comprehensive Investigation of Blade Row Interaction Effects on Stator Loss Utilizing Vane Clocking. J. Turbomach. 2018, 140, 071004. [Google Scholar] [CrossRef]
  8. Kerrebrock, J.L.; Mikolajczak, A.A. Intra-Stator Transport of Rotor Wakes and Its Effect on Compressor Performance. J. Eng. Gas Turbines Power 1970, 92, 359–368. [Google Scholar] [CrossRef]
  9. Tweedt, D.L.; Okiishi, T.H.; Hathaway, M.D. Mul-tistage Compressor Stator/Rotor Interaction. J. Propuls. Power 1985, 1, 449–455. [Google Scholar] [CrossRef]
  10. Zante, D.; Adamczyk, J.J.; Strazisar, A.J. Wake Recovery Performance Benefit in a High-Speed Axial Compressor. J. Turbomach. 2002, 124, 275–284. [Google Scholar] [CrossRef]
  11. Liu, A.; Ju, Y.; Zhang, C. Parallel Rotor/Stator Interaction Methods and Steady/Unsteady Flow Simulations of Multi-Row Axial Compressors. Aerosp. Sci. Technol. 2021, 116, 106859. [Google Scholar] [CrossRef]
  12. Zhang, C.; Ji, L.; Zhou, L. Effects of Different Blended Blade Tip and Winglets on Aerodynamic and Aero-acoustic Performances of Diagonal Fans. Aerosp. Sci. Technol. 2020, 106, 106200. [Google Scholar] [CrossRef]
  13. Kan, X.; Lu, H.; Zhong, J. Topological Characterization of Vortex Structures on a Transonic Compressor Stator during the Stalling Process. Proc. Inst. Mech. Eng. Part G J. Aerosp. Eng. 2016, 230, 566–580. [Google Scholar] [CrossRef]
  14. Liu, Y.; Yu, X.; Liu, B. Turbulence Models Assessment for Large-Scale Tip Vortices in an Axial Compressor Rotor. J. Propuls. Power 2008, 24, 15–25. [Google Scholar] [CrossRef]
  15. Mao, M.; Song, Y.; Wang, Z. Numerical Investigation of the Unsteady Flow in a Transonic Compressor with Curved Rotors. Chin. J. Aeronaut. 2008, 21, 97–104. [Google Scholar] [CrossRef]
  16. Mao, M.; Song, Y.; Wang, Z. Numerical Research on Influence of Rotor-Stator Interactions in Transonic Compressor. J. Aerosp. Power 2007, 22, 1468–1474. [Google Scholar] [CrossRef]
  17. Wu, Y.; An, G.; Wang, B. Numerical Investigation into the Underlying Mechanism Connecting the Vortex Breakdown to the Flow Unsteadiness in a Transonic Compressor Rotor. Aerosp. Sci. Technol. 2019, 86, 106–118. [Google Scholar] [CrossRef]
  18. Zhang, Y.; Lu, X.; Chu, W. Numerical Investigation of the Unsteady Tip Leakage Flow and Rotating Stall Inception in a Transonic Compressor. J. Therm. Sci. 2010, 4, 310–317. [Google Scholar] [CrossRef]
  19. Mao, X.; Liu, B. The Effect of Tip clearance on the First Rotating Stall Stage in Contra-Rotating Compressor. J. Aero-Naut. Astronaut. Aviat. 2015, 47, 283–296. [Google Scholar] [CrossRef]
  20. Dong, X.; Zhang, Y.; Zhang, Z. Effect of Tip Clearance on the Aeroelastic Stability of a Wide-Chord Fan Rotor. J. Eng. Gas Turbines Power 2020, 142, 091010. [Google Scholar] [CrossRef]
  21. Ciorciari, R.; Lesser, A.; Blaim, F. Numerical Investigation of Tip Clearance Effects in an Axial Transonic Compressor. J. Therm. Sci. 2012, 21, 109–119. [Google Scholar] [CrossRef]
  22. Xiang, J.; Jorg, S.; Duan, F. Numerical Study of the Tip Clearance Flow in Miniature Gas Turbine Compressors. Aerosp. Sci. Technol. 2019, 93, 105352. [Google Scholar] [CrossRef]
  23. Fu, Z.; Wang, Y.; Jiang, X. Tip Clearance Effects on Aero-elastic Stability of Axial Compressor Blades. J. Eng. Gas Turbines Power 2015, 137, 012501. [Google Scholar] [CrossRef]
  24. Foley, A.C.; Ivey, P.C. Measurement of Tip-Clearance Flow in a Multistage, Axial Flow Compressor. J. Turbomach. 1996, 118, 211–217. [Google Scholar] [CrossRef]
  25. Gao, L.; Li, X.; Feng, X. The Effect of Tip Clearance on the Performance of Contra-Rotating Compressor. In Proceedings of the ASME Turbo Expo 2012: Turbine Technical Conference and Exposition, Copenhagen, Denmark, 11–15 June 2012; pp. 197–206. [Google Scholar]
  26. Zhang, B.; Mao, C.; Wu, X. Effects of Tip Leakage Flow on the Aerodynamic Performance and Stability of an Axial-Flow Transonic Compressor Stage. Energies 2021, 14, 4168. [Google Scholar] [CrossRef]
  27. Reid, L.; Moore, R.D. Design and Overall Performance of Four Highly-Loaded, High-Speed Inlet Stages for an Advanced High-Pressure-Ratio Core Compressor; 1978-TP-1337; NASA: Washington, DC, USA, 1978. [Google Scholar]
  28. Reid, L.; Moore, R.D. Performance of Single-Stage Axial-Flow Transonic Compressor with Rotor and Stator Aspect Ratios of 1.19 and 1.26, Respectively, and with Design Pressure Ratio of 1.82; 1978-TP-1338; NASA: Washington, DC, USA, 1980. [Google Scholar]
  29. Zhang, B.; Liu, B.; Mao, X. Effect of Hub Clearance of Cantilever Stator on Aerodynamic Performance and Flow Field of a Transonic Axial-Flow Compressor. Proc. Inst. Mech. Eng. Part G J. Aerosp. Eng. 2021, 235, 2193–2207. [Google Scholar] [CrossRef]
  30. Zhang, B.; Liu, B.; Mao, X. Combined Control of Variant Clearance and Casing Aspiration on Tip Flow Field and Instability of a Transonic Compressor. Aerosp. Sci. Technol. 2022, 127, 107702. [Google Scholar] [CrossRef]
  31. Wang, Z.; Fan, Z.; Jiang, X. Comparison Among Three Models for Compressor Internal Flow. J. Aerosp. Power 2017, 32, 1195–1206. [Google Scholar] [CrossRef]
  32. Wang, Z.; Hu, J.; Wang, Y. Effects of Upstream Rotor on the Aerodynamic Force of Downstream Stator Blades. Trans. Nanjing Univ. Aeronaut. Astronaut. 2006, 23, 94–101. [Google Scholar] [CrossRef]
  33. Wang, Z.; Zhao, X. Inviscid and Viscous Simulations of Wake Unsteady Decay Process. J. Eng. Thermophys. 1999, 20, 313–316. [Google Scholar] [CrossRef]
  34. Liu, Y.; Wei, X.; Tang, Y. Investigation of Unsteady Rotor–Stator Interaction and Deterministic Correlation Analysis in a Transonic Compressor Stage. J. Turbomach. 2023, 145, 071004. [Google Scholar] [CrossRef]
  35. Cao, Z.; Zhang, F.; Zhang, X. Comparative Study of Unsteady Flow Mechanisms for Swept and Radially Stacked Rotors in a Dual-Stage Counter-Rotating Compressor. Proc. Inst. Mech. Eng. Part C J. Mech. Eng. Sci. 2022, 236, 11180–11195. [Google Scholar] [CrossRef]
Figure 1. Compressor computing passage.
Energies 16 07907 g001
Figure 2. y+ contours: (a) Rotor SS; (b) Rotor PS.
Energies 16 07907 g002
Figure 3. Comparison of compressor performance parameters with different mesh sizes.
Energies 16 07907 g003
Figure 4. Compressor curves comparison between experimental and CFD data.
Energies 16 07907 g004
Figure 5. Ma number curves comparison between experimental and CFD data: (a) Rotor outlet; (b) Stator outlet.
Energies 16 07907 g005
Figure 6. Comparison of the total pressure and total temperature ratio at the design point.
Energies 16 07907 g006
Figure 7. Tip clearance schemes of the rotor: (a) Small-value tip clearance P1; (b) Non-uniform tip clearance D1; (c) Mesh structure P1; (d) Mesh structure D1.
Energies 16 07907 g007
Figure 8. Time-averaged performance characteristic curves of compressors with different tip-clearance schemes: (a) Total pressure ratio; (b) Isentropic efficiency.
Energies 16 07907 g008
Figure 9. Static pressure distribution, time-averaged results.
Energies 16 07907 g009
Figure 10. The time-averaged Mach number at 99% blade span: (a) P1 scheme; (b) D1 scheme.
Energies 16 07907 g010
Figure 11. The perturbation amplitude of the UAF.
Energies 16 07907 g011
Figure 12. The frequency spectrograms of separation and shedding vortex: (a) Separation vortex; (b) Shedding vortex.
Energies 16 07907 g012
Figure 13. The space-time interspersing of the static pressure perturbation on different blade span heights: (a) P1 5% height; (b) P1 50% height; (c) P1 95% height; (d) D1 5% height; (e) D1 50% height; (f) D1 95% height.
Energies 16 07907 g013
Figure 14. The distribution of the root mean square (RMS) pressure perturbation along the axial chord length: (a) P1 scheme; (b) D1 scheme.
Energies 16 07907 g014
Figure 15. The distribution of RMS pressure on the stator surface: (a) P1 SS; (b) P1 PS; (c) D1 SS; (d) D1 PS.
Energies 16 07907 g015
Figure 16. Static pressure spectrograms near the rotor TE and the stator LE: (a) Rotor TE; (b) Stator LE.
Energies 16 07907 g016
Figure 17. Location of the sample line at mid-gap.
Energies 16 07907 g017
Figure 18. Non-dimensional tangential velocity at the rotor-stator axial gap at 50% blade span: (a) P1 stator frame; (b) P1 rotor frame; (c) D1 stator frame; (d) D1 rotor frame.
Energies 16 07907 g018
Figure 19. The distribution of the perturbation intensity at the rotor outlet: (a) P1 scheme; (b) D1 scheme.
Energies 16 07907 g019
Figure 20. Instantaneous entropy contour and streamline in the stator passage at the middle blade span: (a) P1 scheme; (b) D1 scheme.
Energies 16 07907 g020
Figure 21. Unsteady flow field of rotor–stator interaction at 95% blade span: (a) P1 scheme; (b) D1 scheme.
Energies 16 07907 g021
Figure 22. The mechanism of rotor–stator interaction.
Energies 16 07907 g022
Figure 23. Unsteady pressure and velocity perturbation distributed on the stator surface: (a) Velocity perturbation; (b) Pressure perturbation.
Energies 16 07907 g023
Disclaimer/Publisher’s Note: The statements, opinions and data contained in all publications are solely those of the individual author(s) and contributor(s) and not of MDPI and/or the editor(s). MDPI and/or the editor(s) disclaim responsibility for any injury to people or property resulting from any ideas, methods, instructions or products referred to in the content.

