

Analysis of the Flow Capacity of Variable Cycle Split Fans at the Middle Speed


Abstract
1. Introduction
2. Research Object and Numerical Method
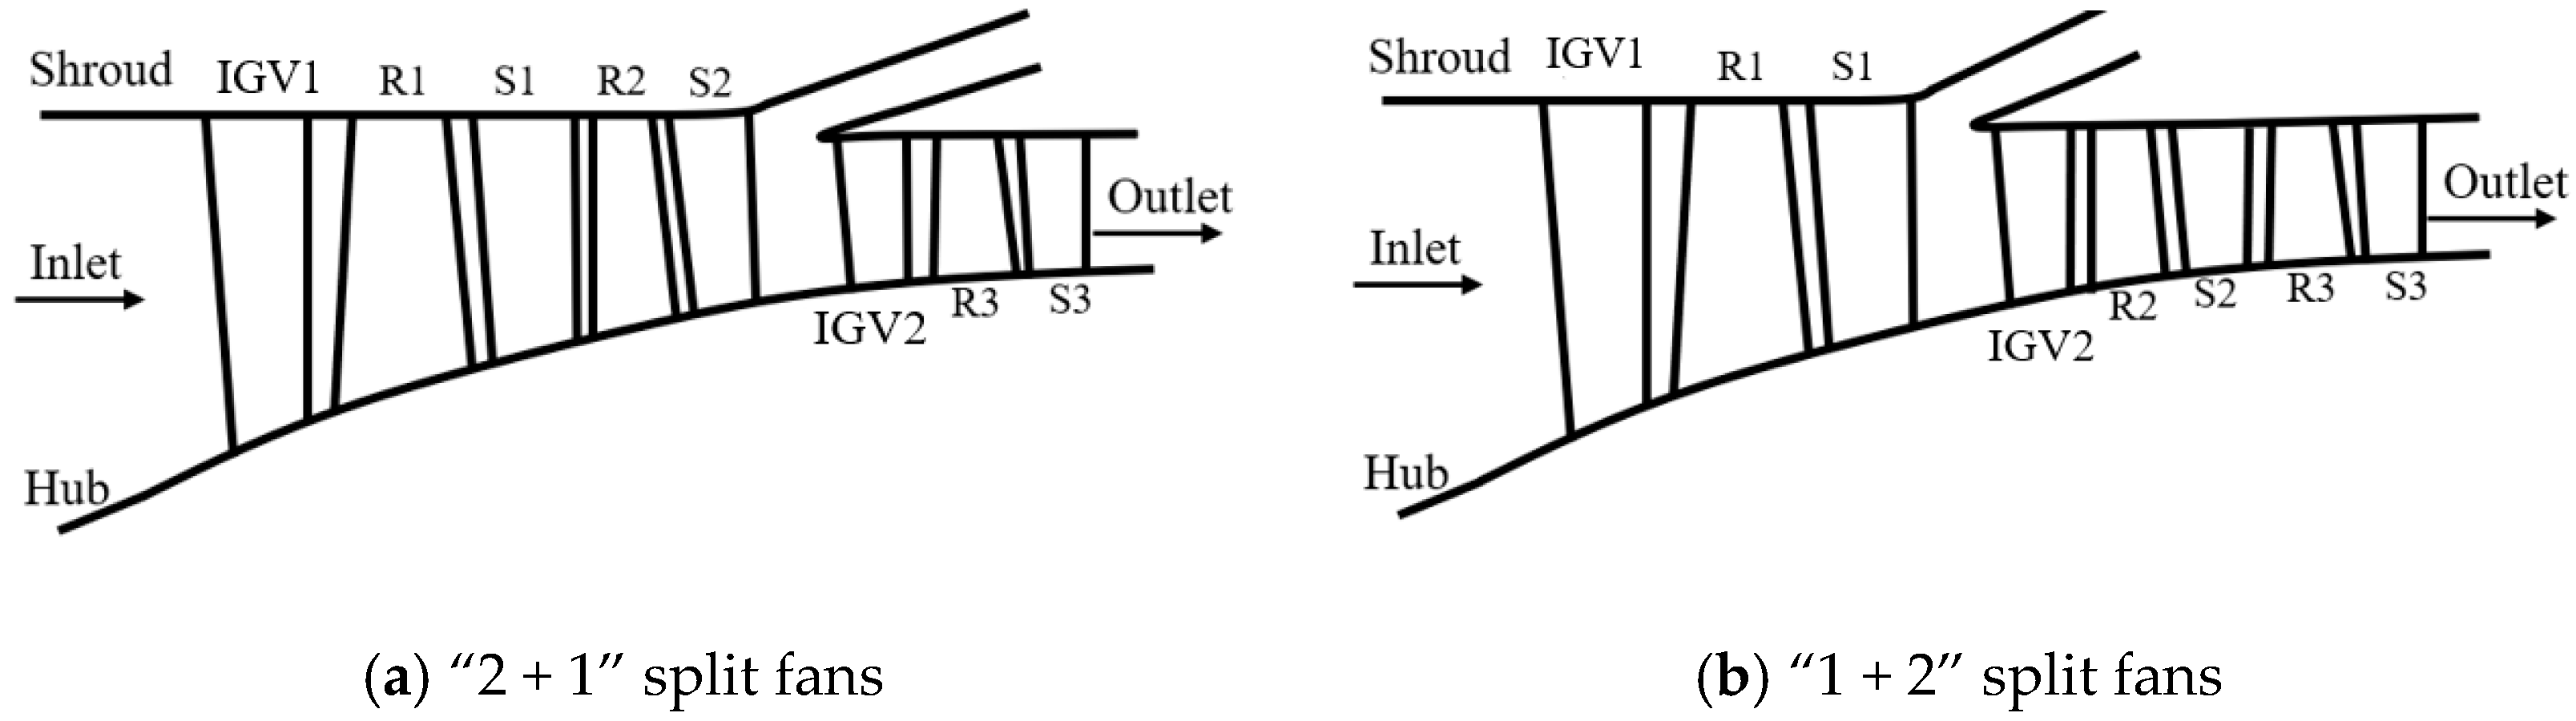
2.1. Research Object
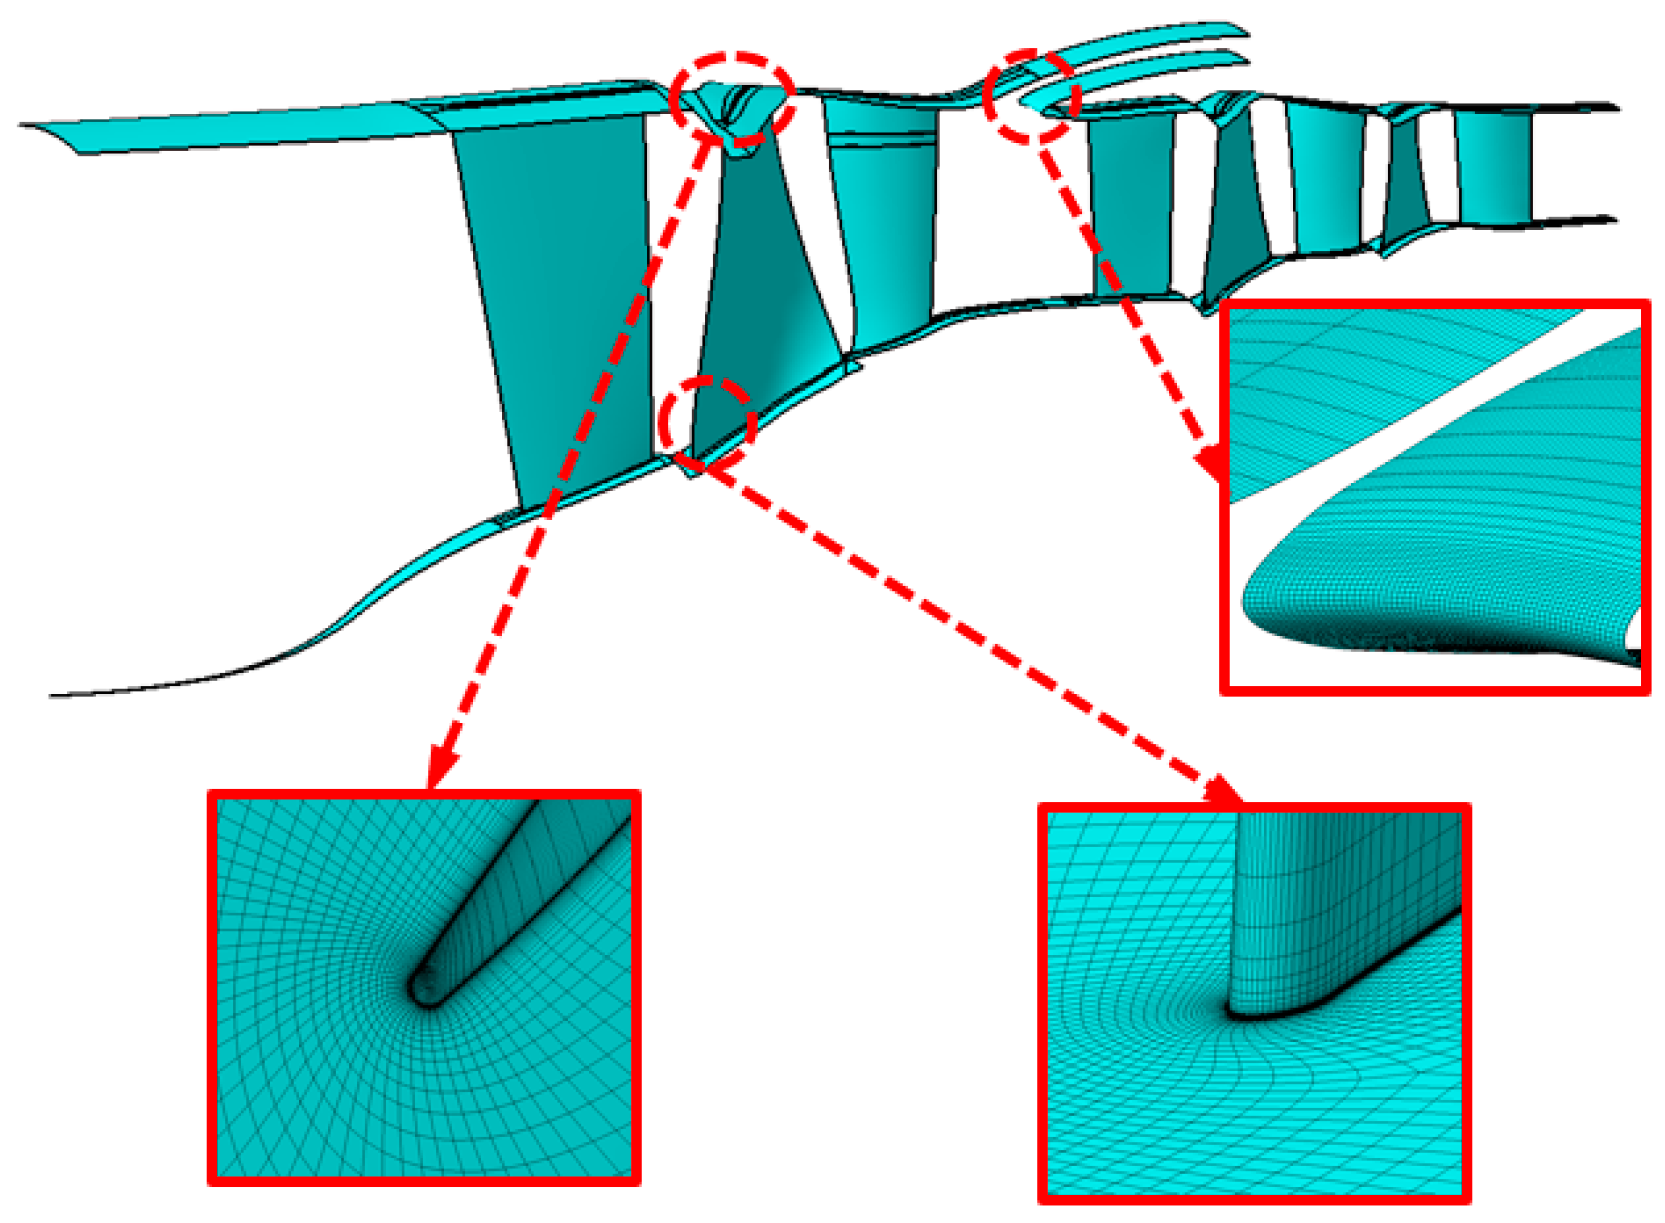
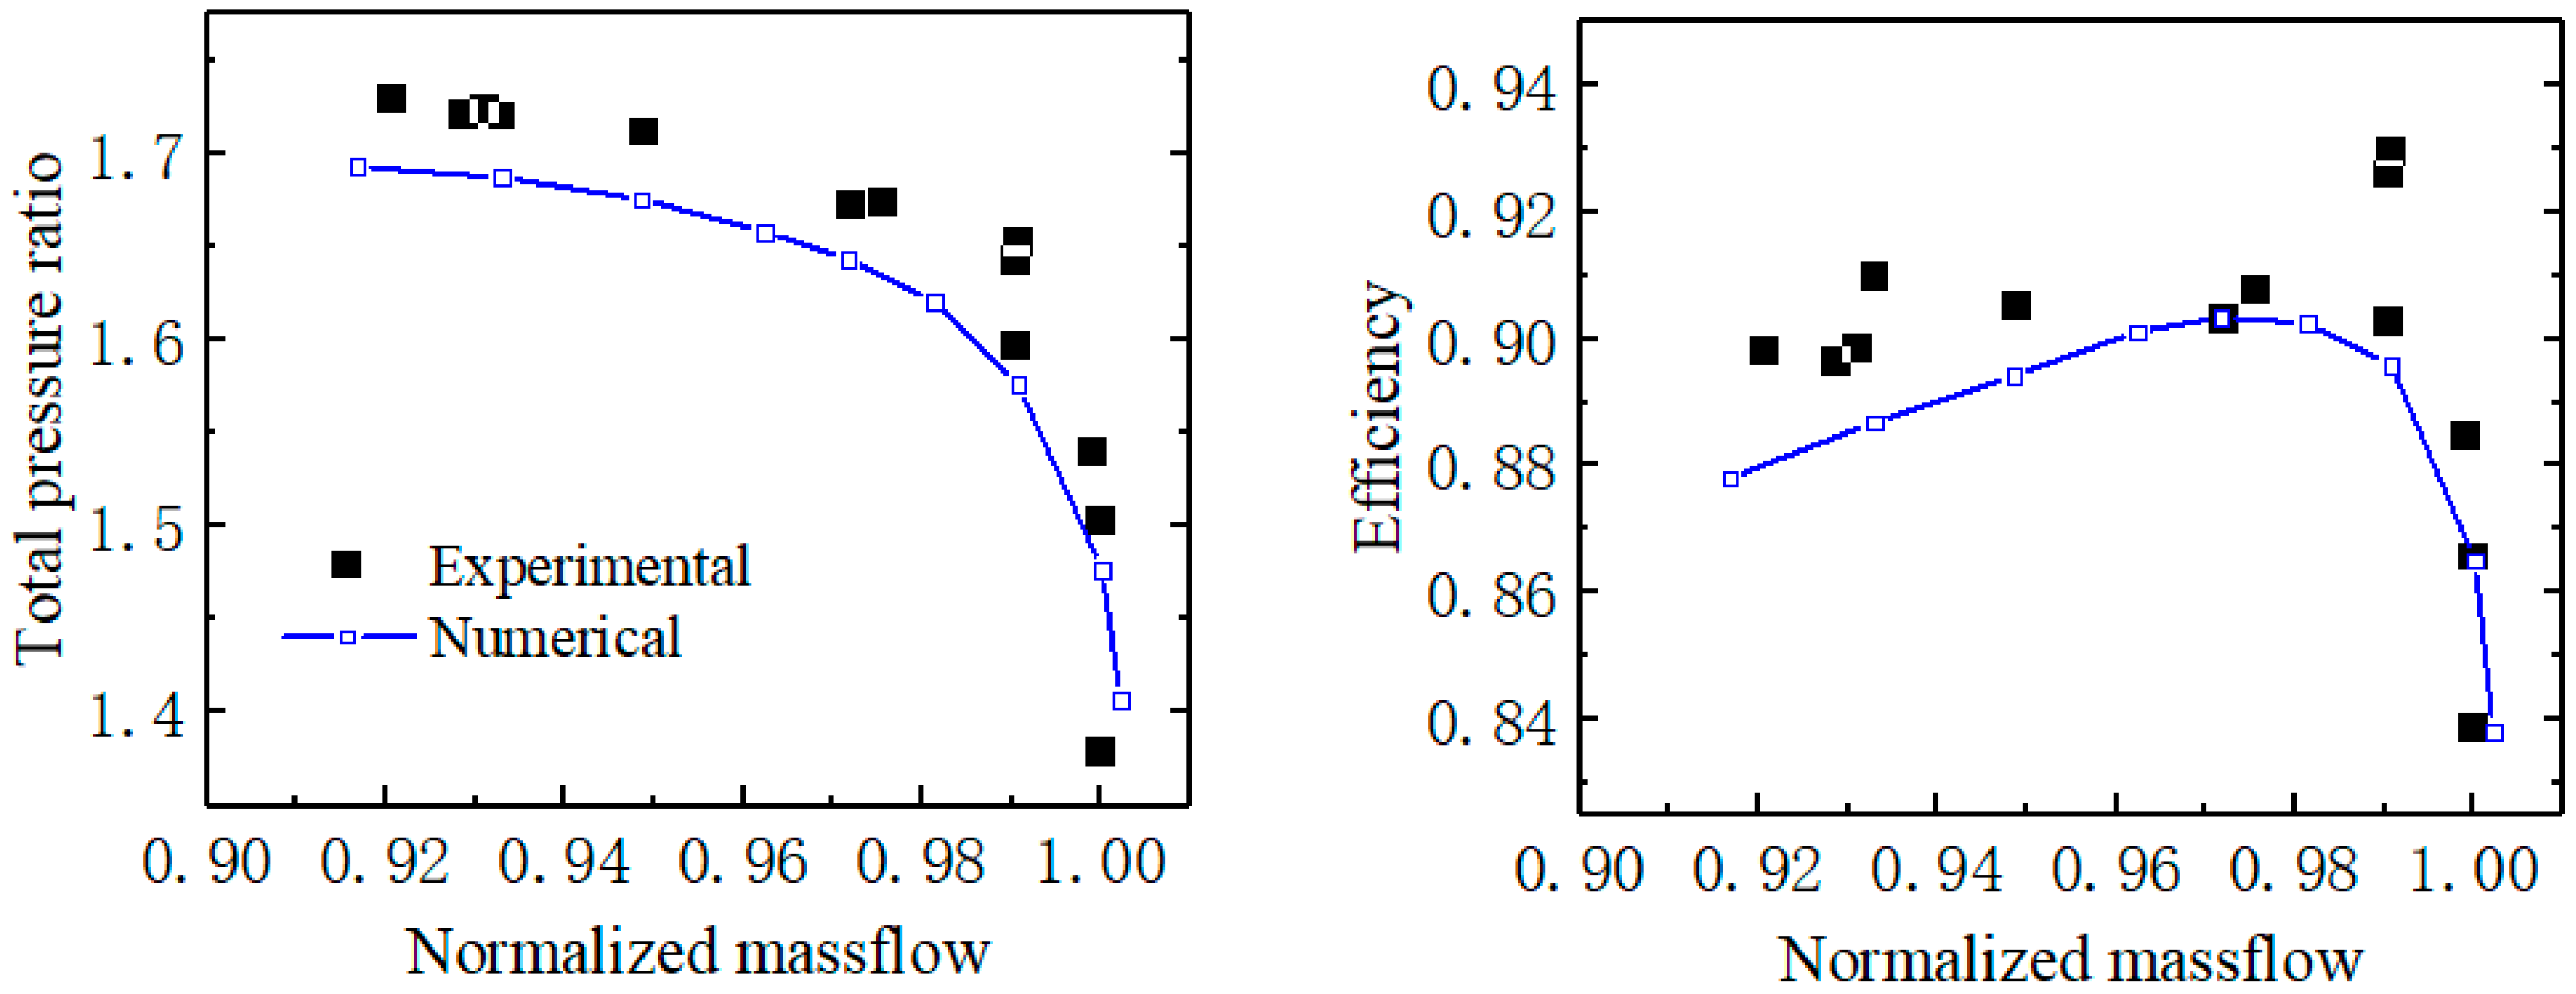
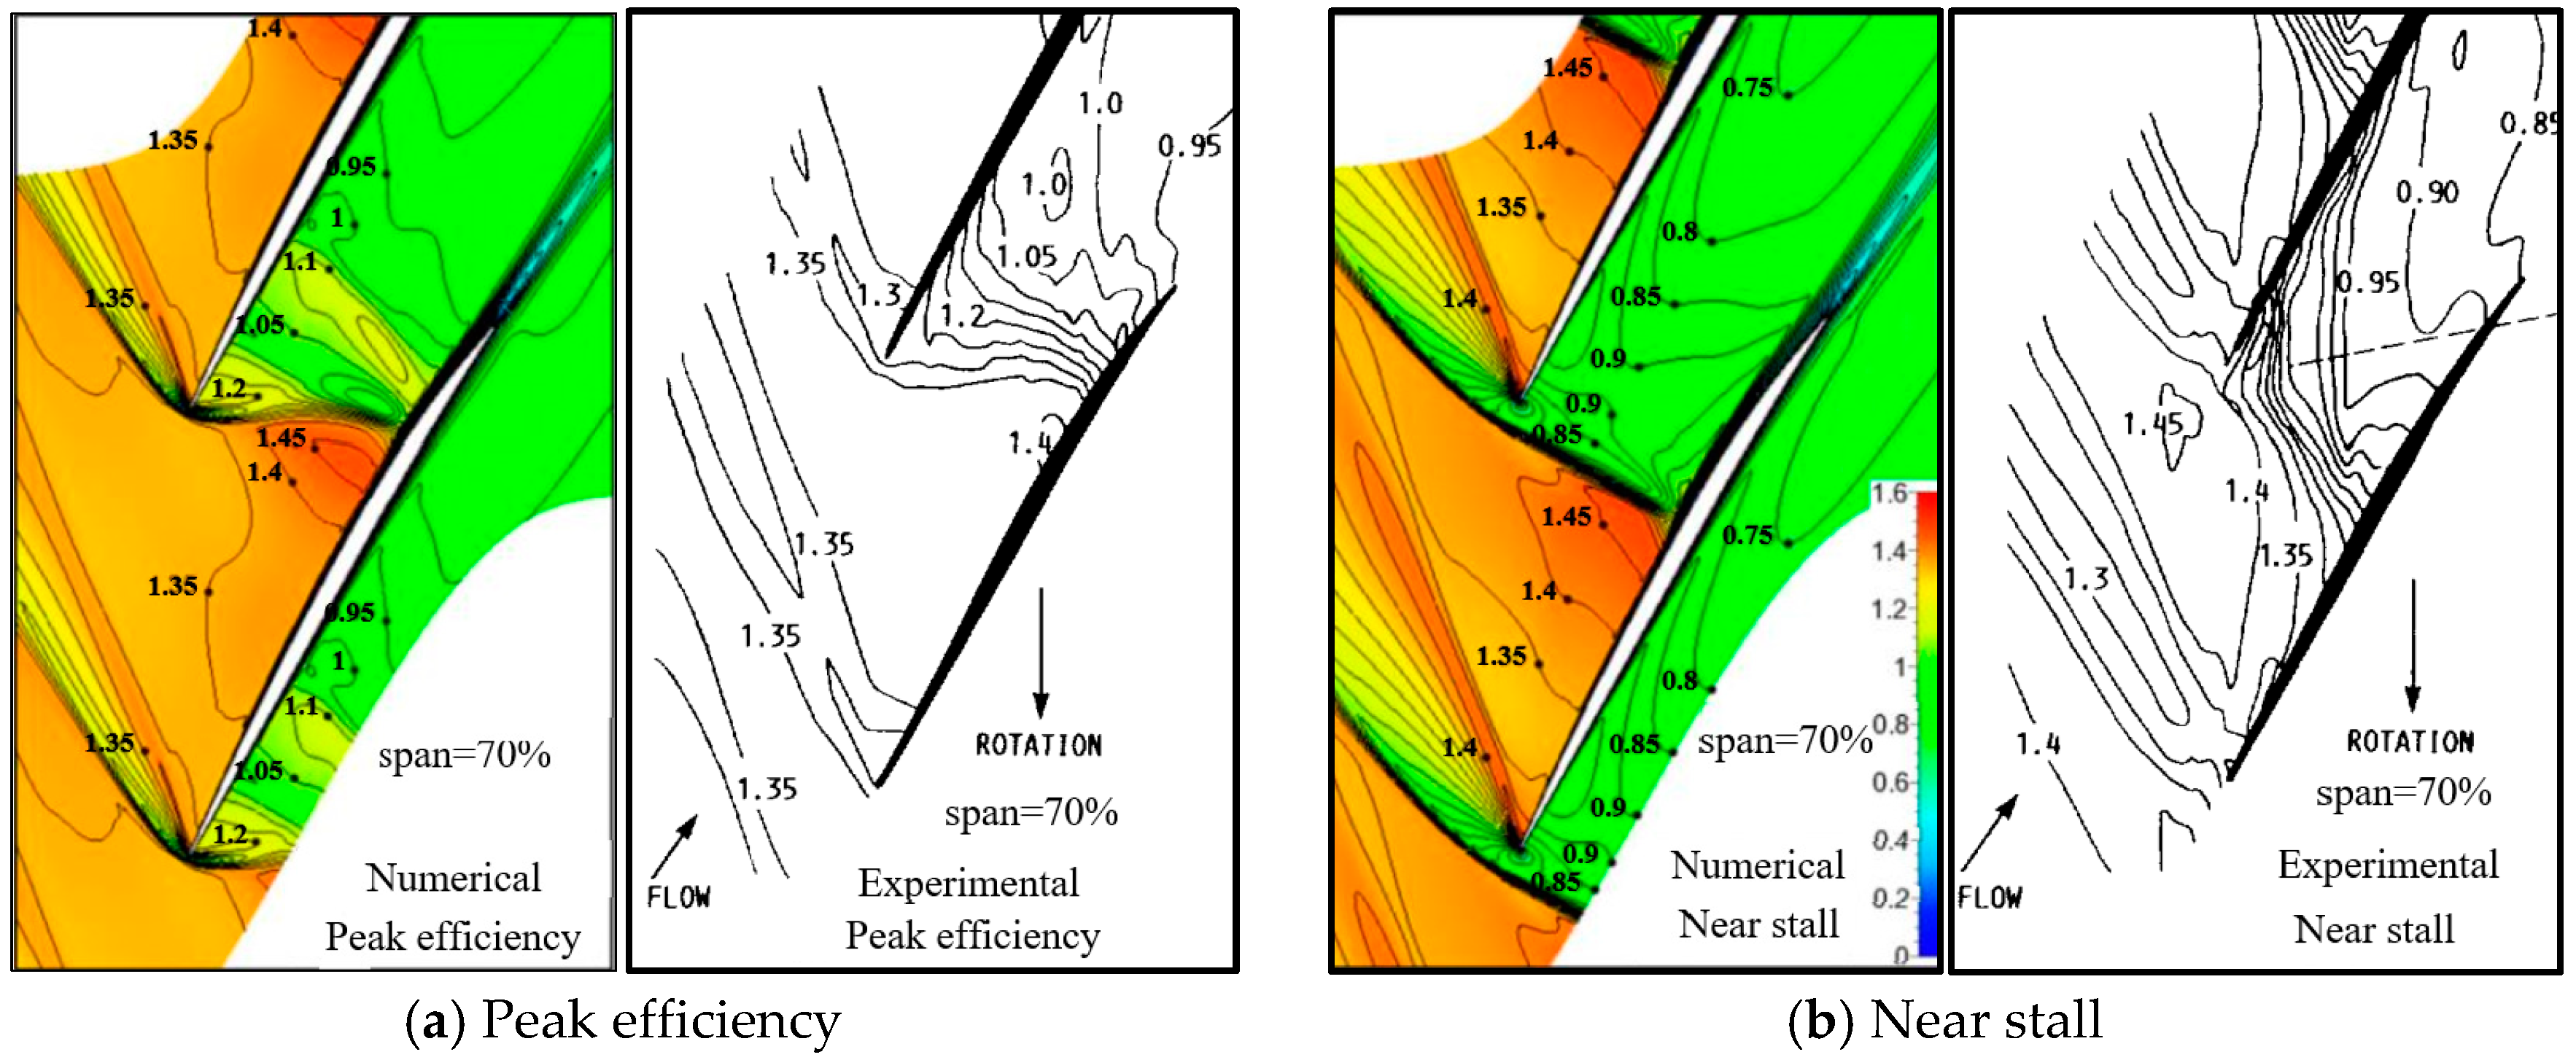
2.2. Numerical Method
3. Variation in Aerodynamic Characteristics of the Different Split Fans with Bypass Ratios at the Middle Speed
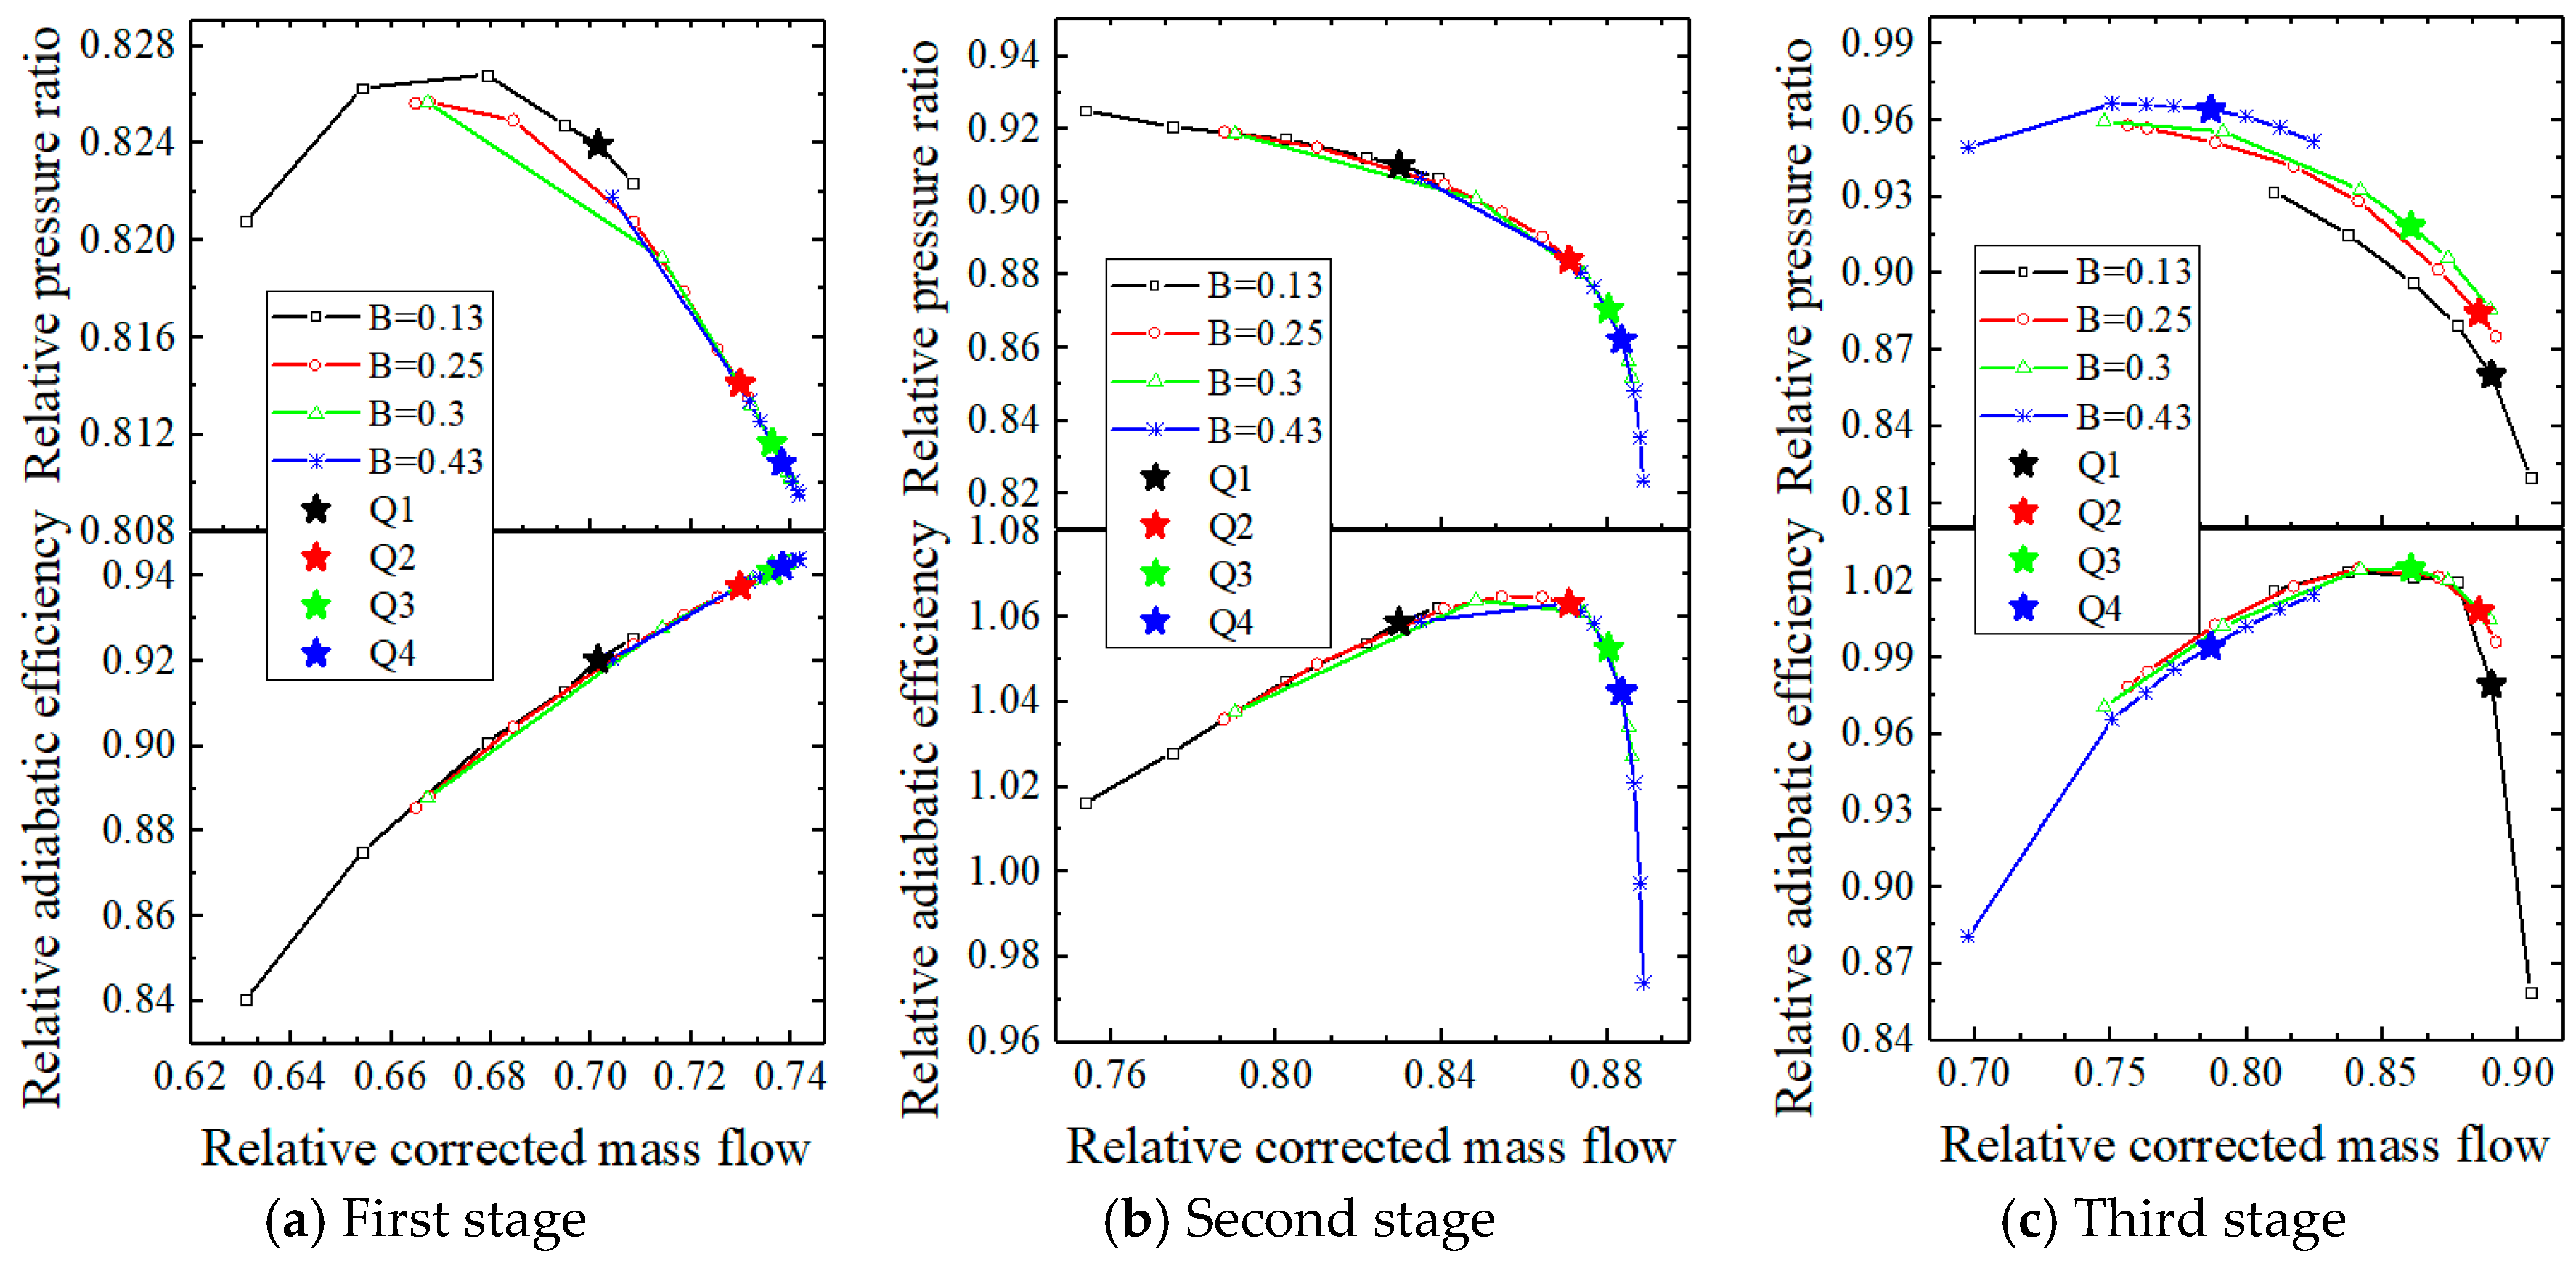
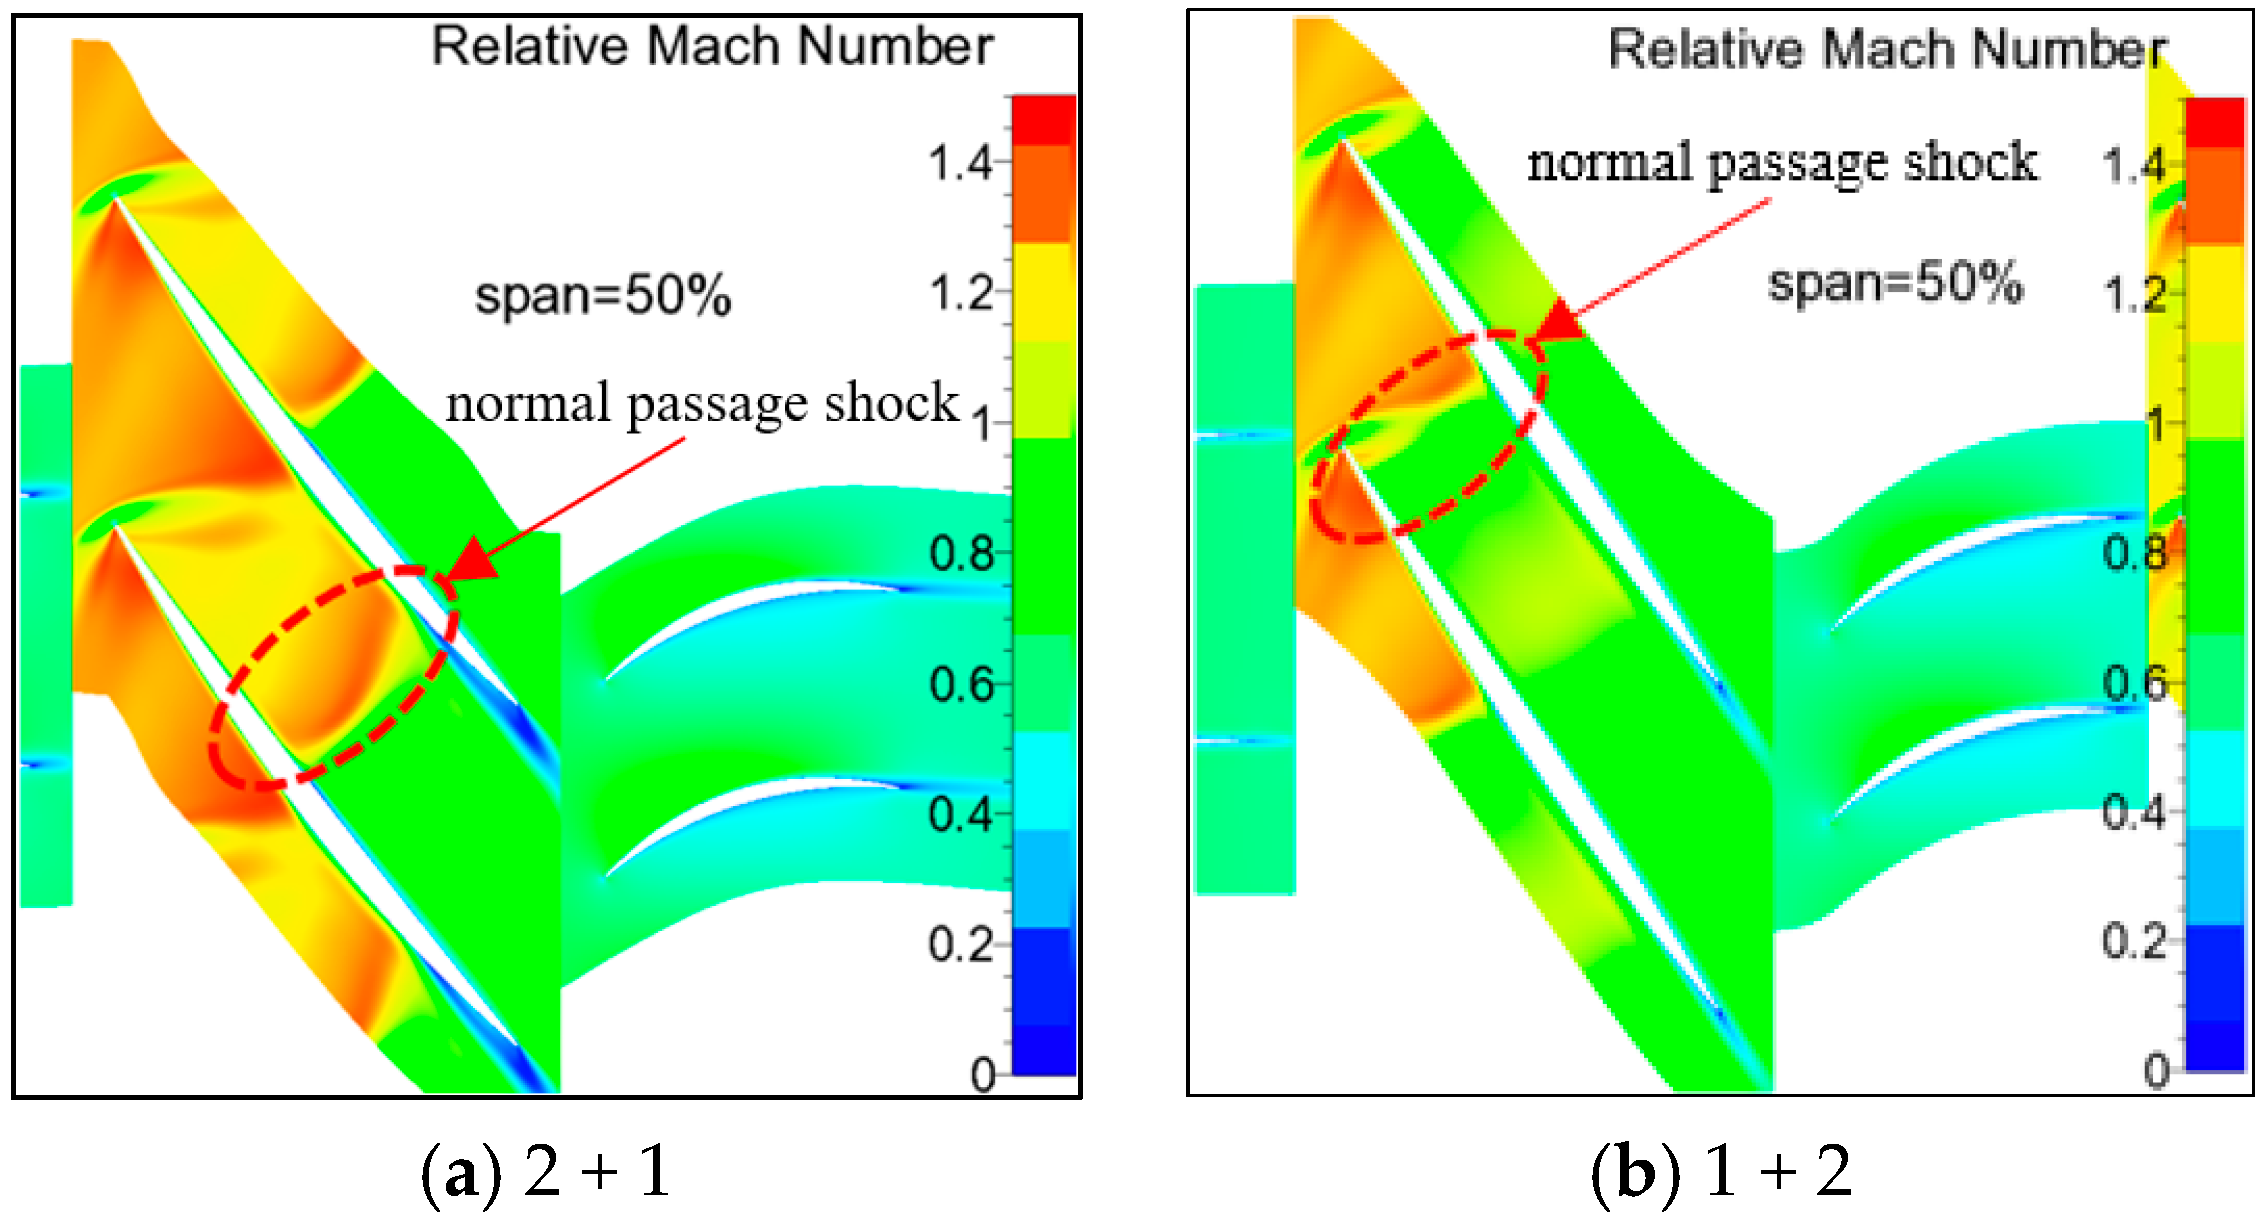
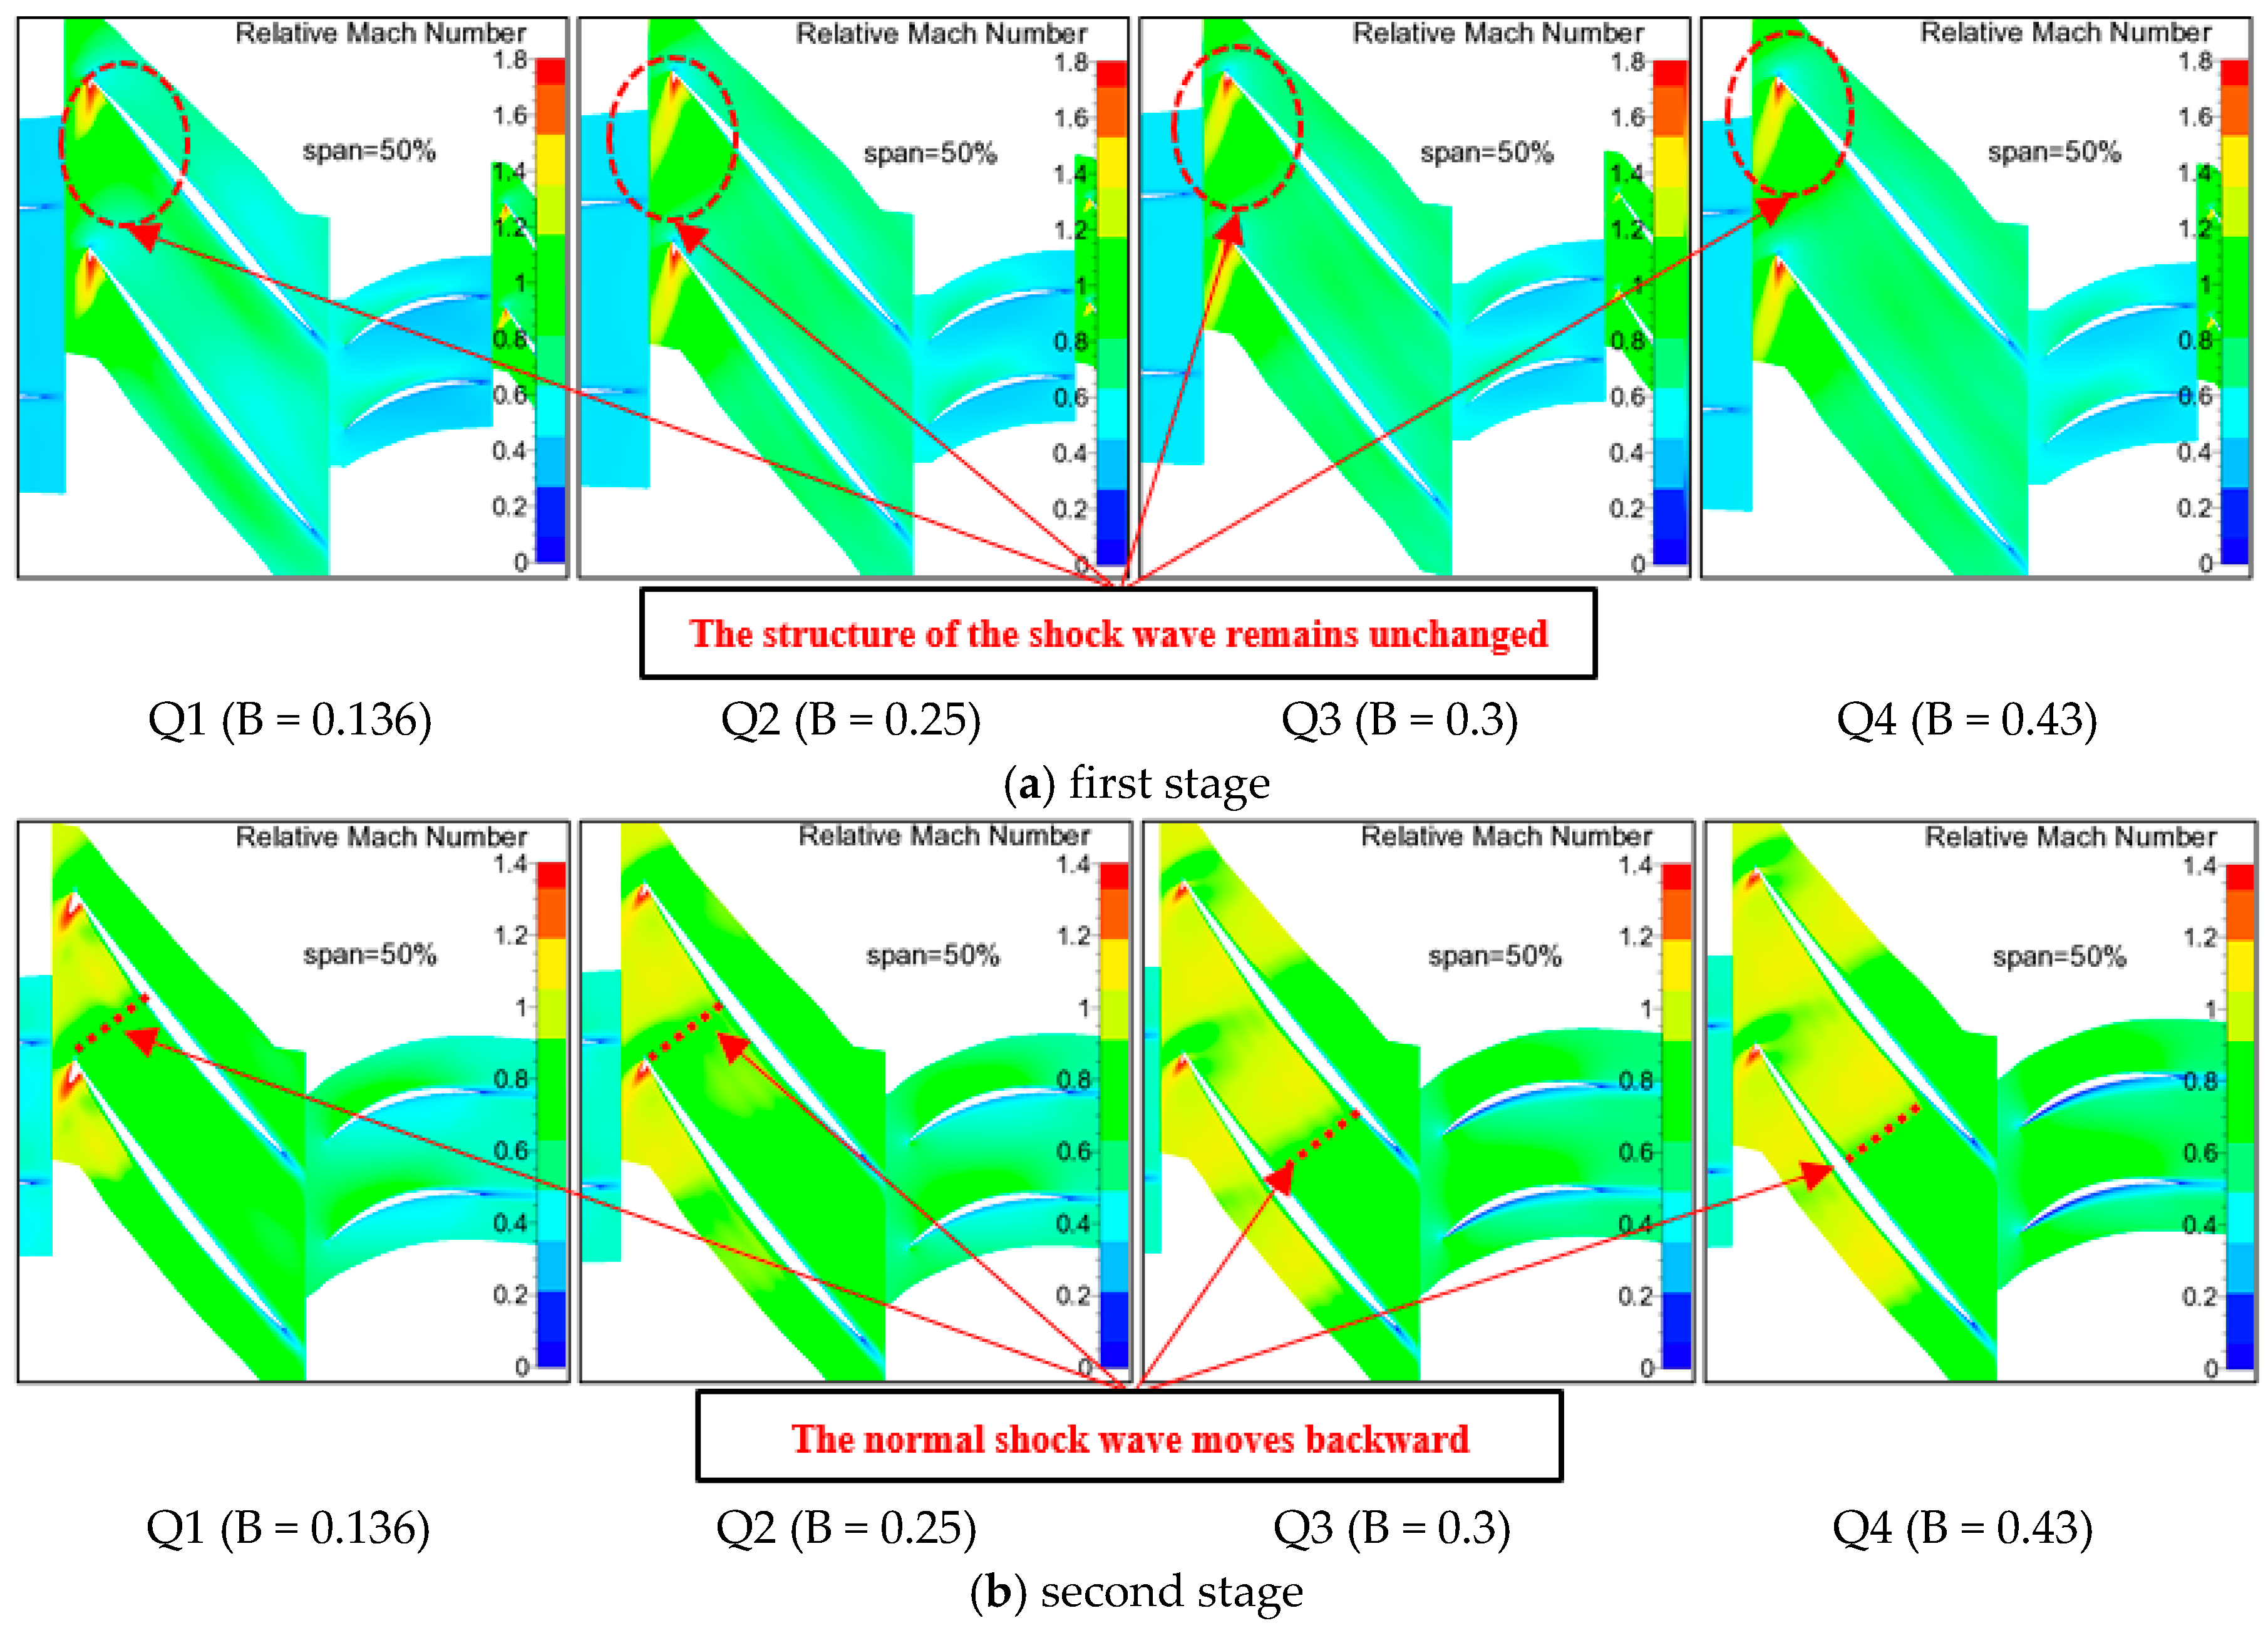
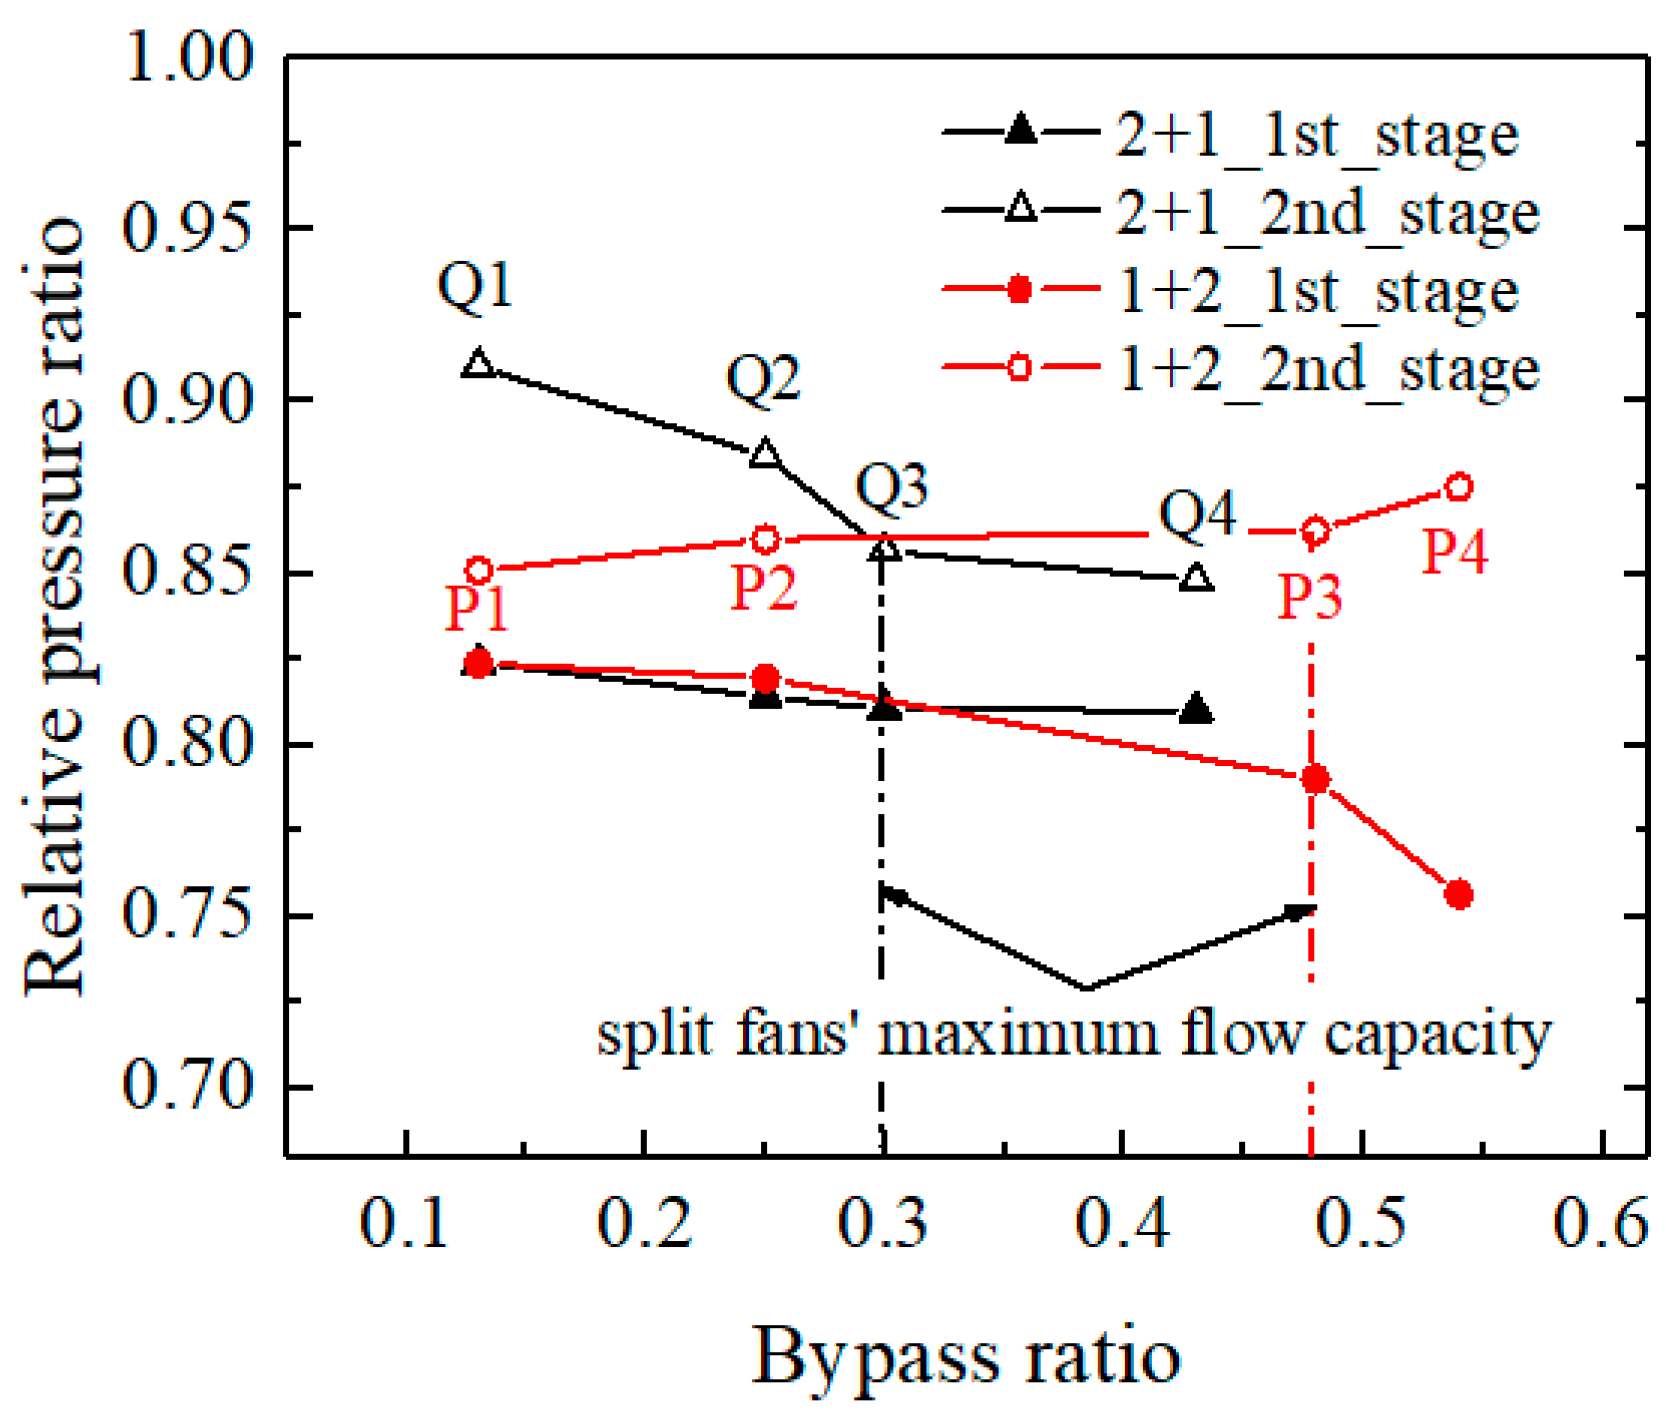
3.1. Variation in Aerodynamic Characteristics of the “2 + 1” Split Fans with Bypass Ratios
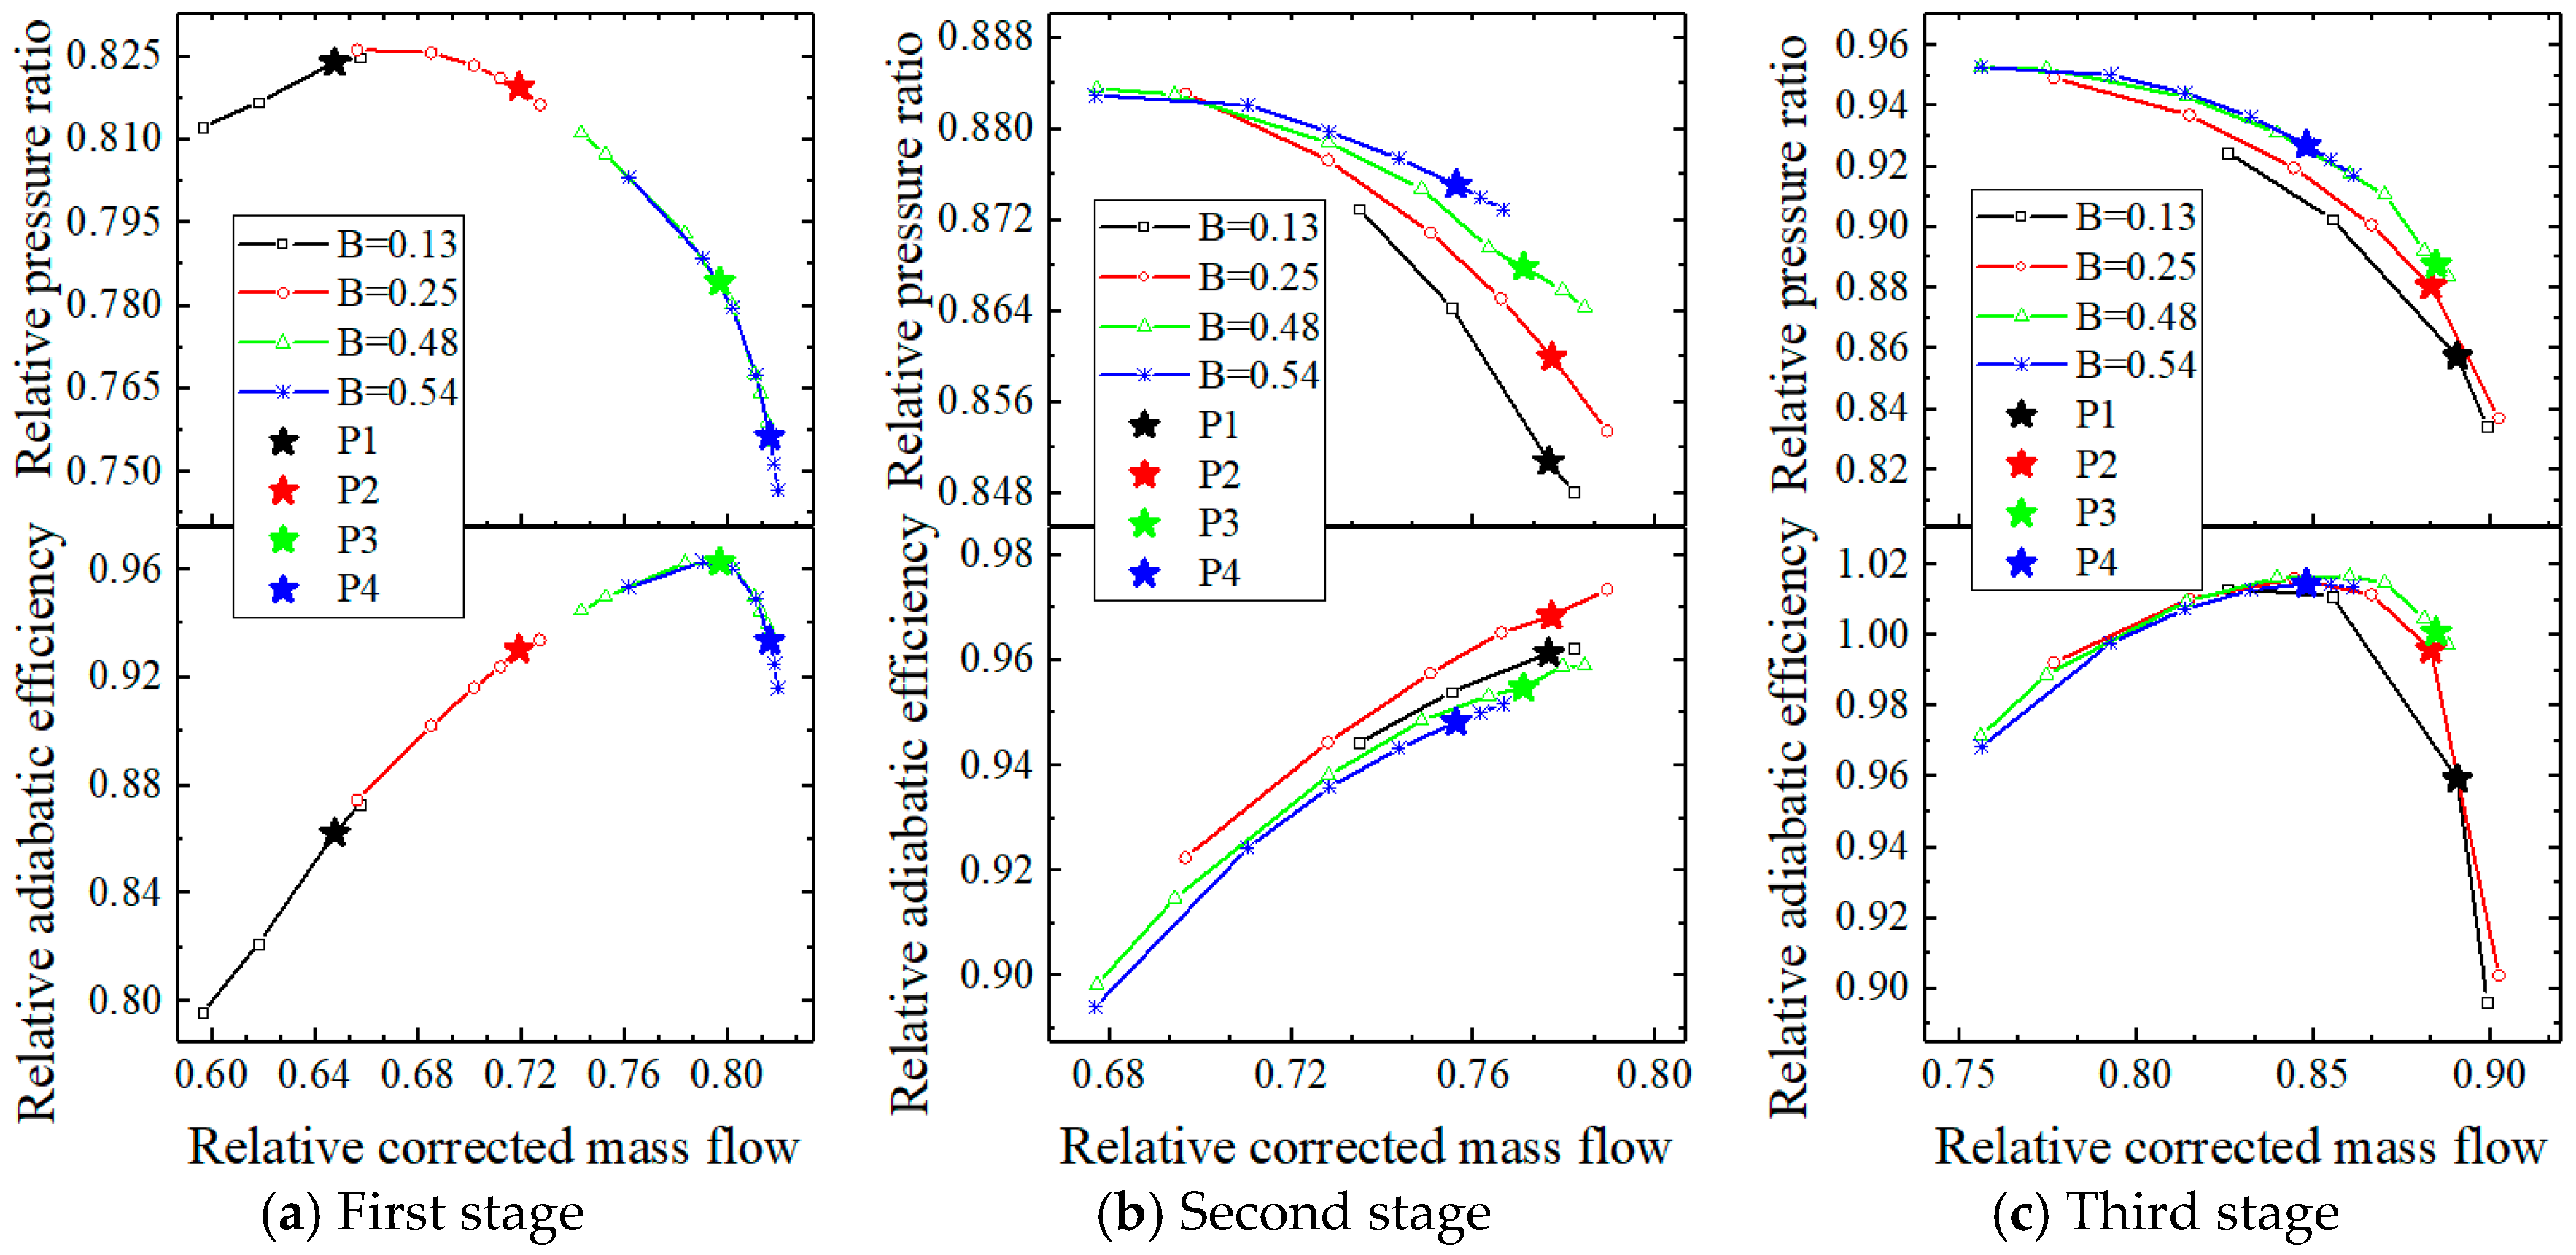
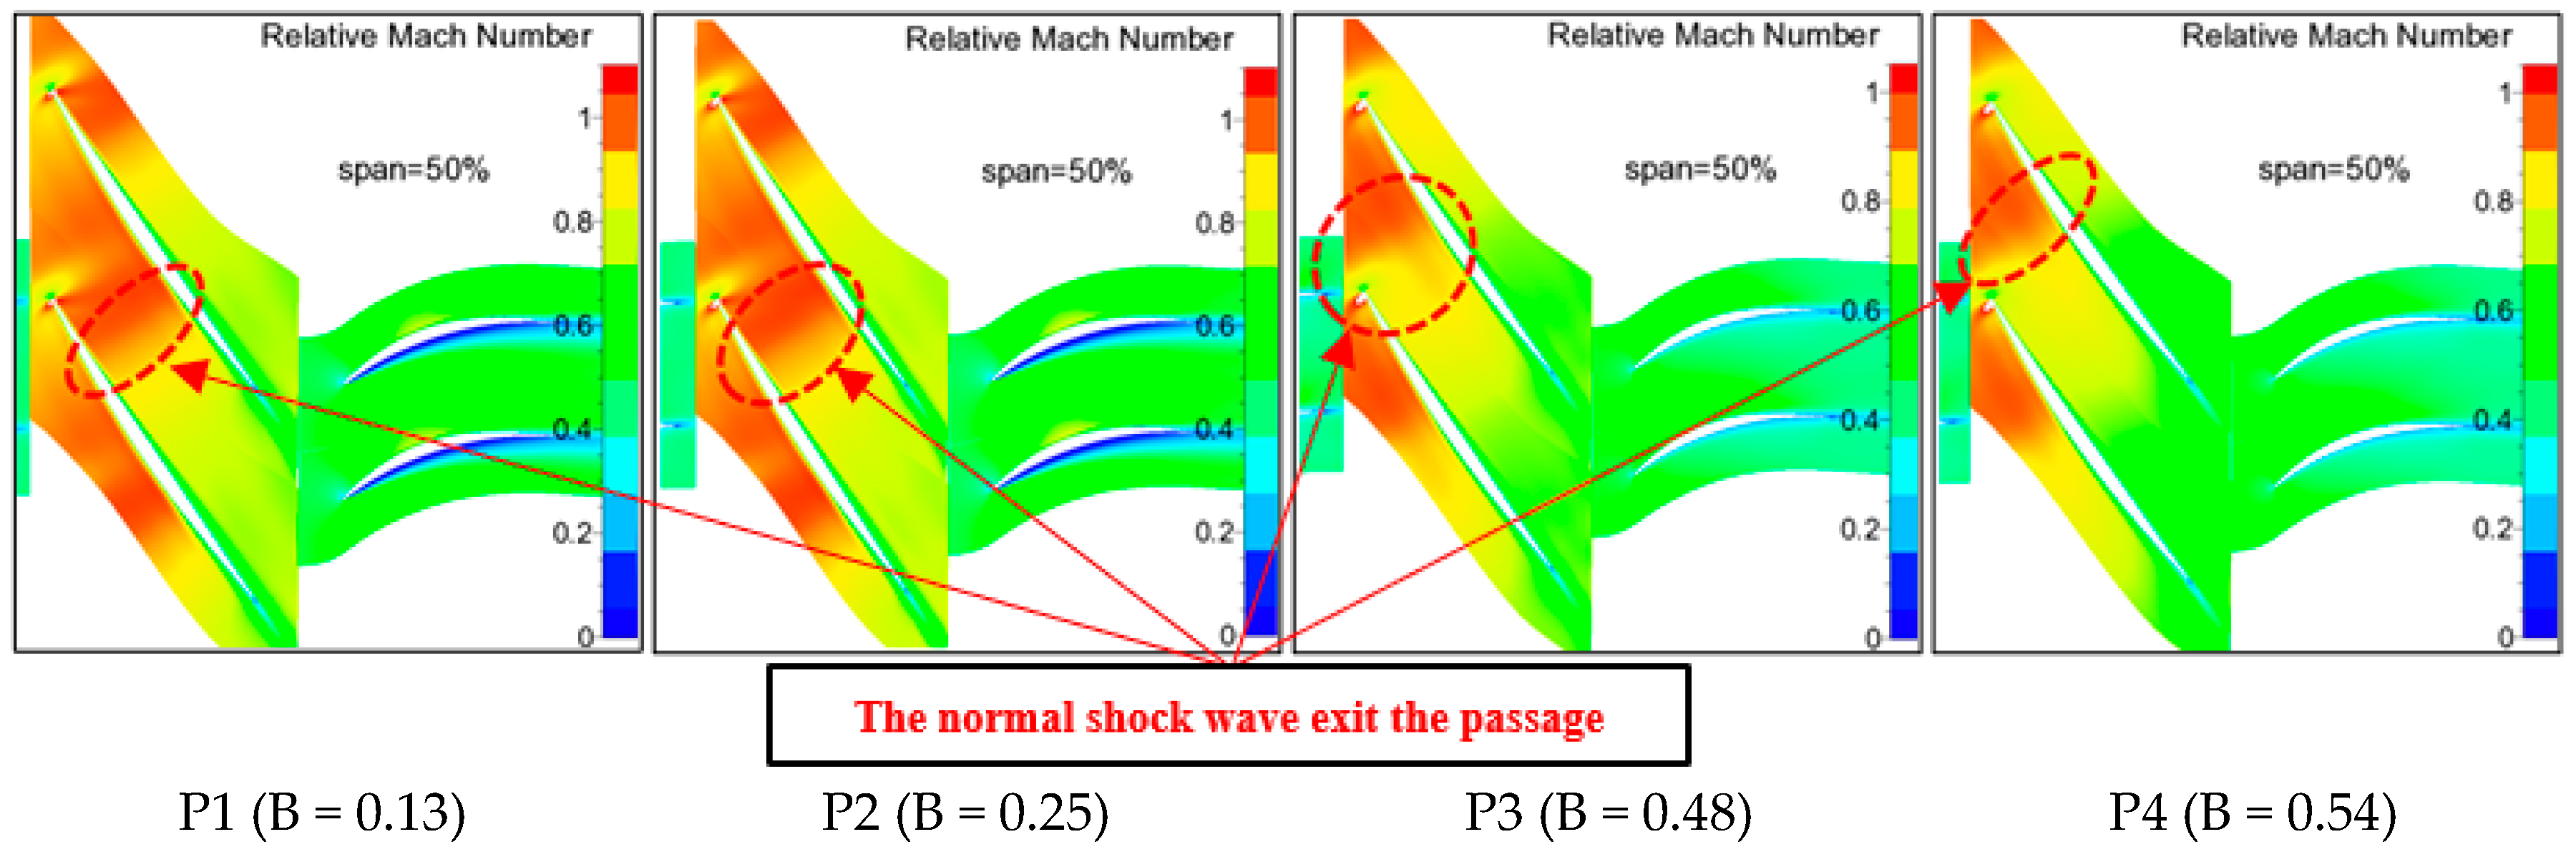
3.2. Variation in Aerodynamic Characteristics of the “1 + 2” Split Fans with Bypass Ratios
4. Analysis of the Flow Capacity of the Different Split Fans
4.1. Analysis of the Flow Capacity of the Split Fans with a Small Bypass Ratio
4.2. Analysis of the Maximum Flow Capacity of the Split Fans
4.3. Analysis of the Rate of Change in the Flow Capacity for the Split Fans
5. Analysis of the Efficient–Stable Operating Regions of the Different Split Fans
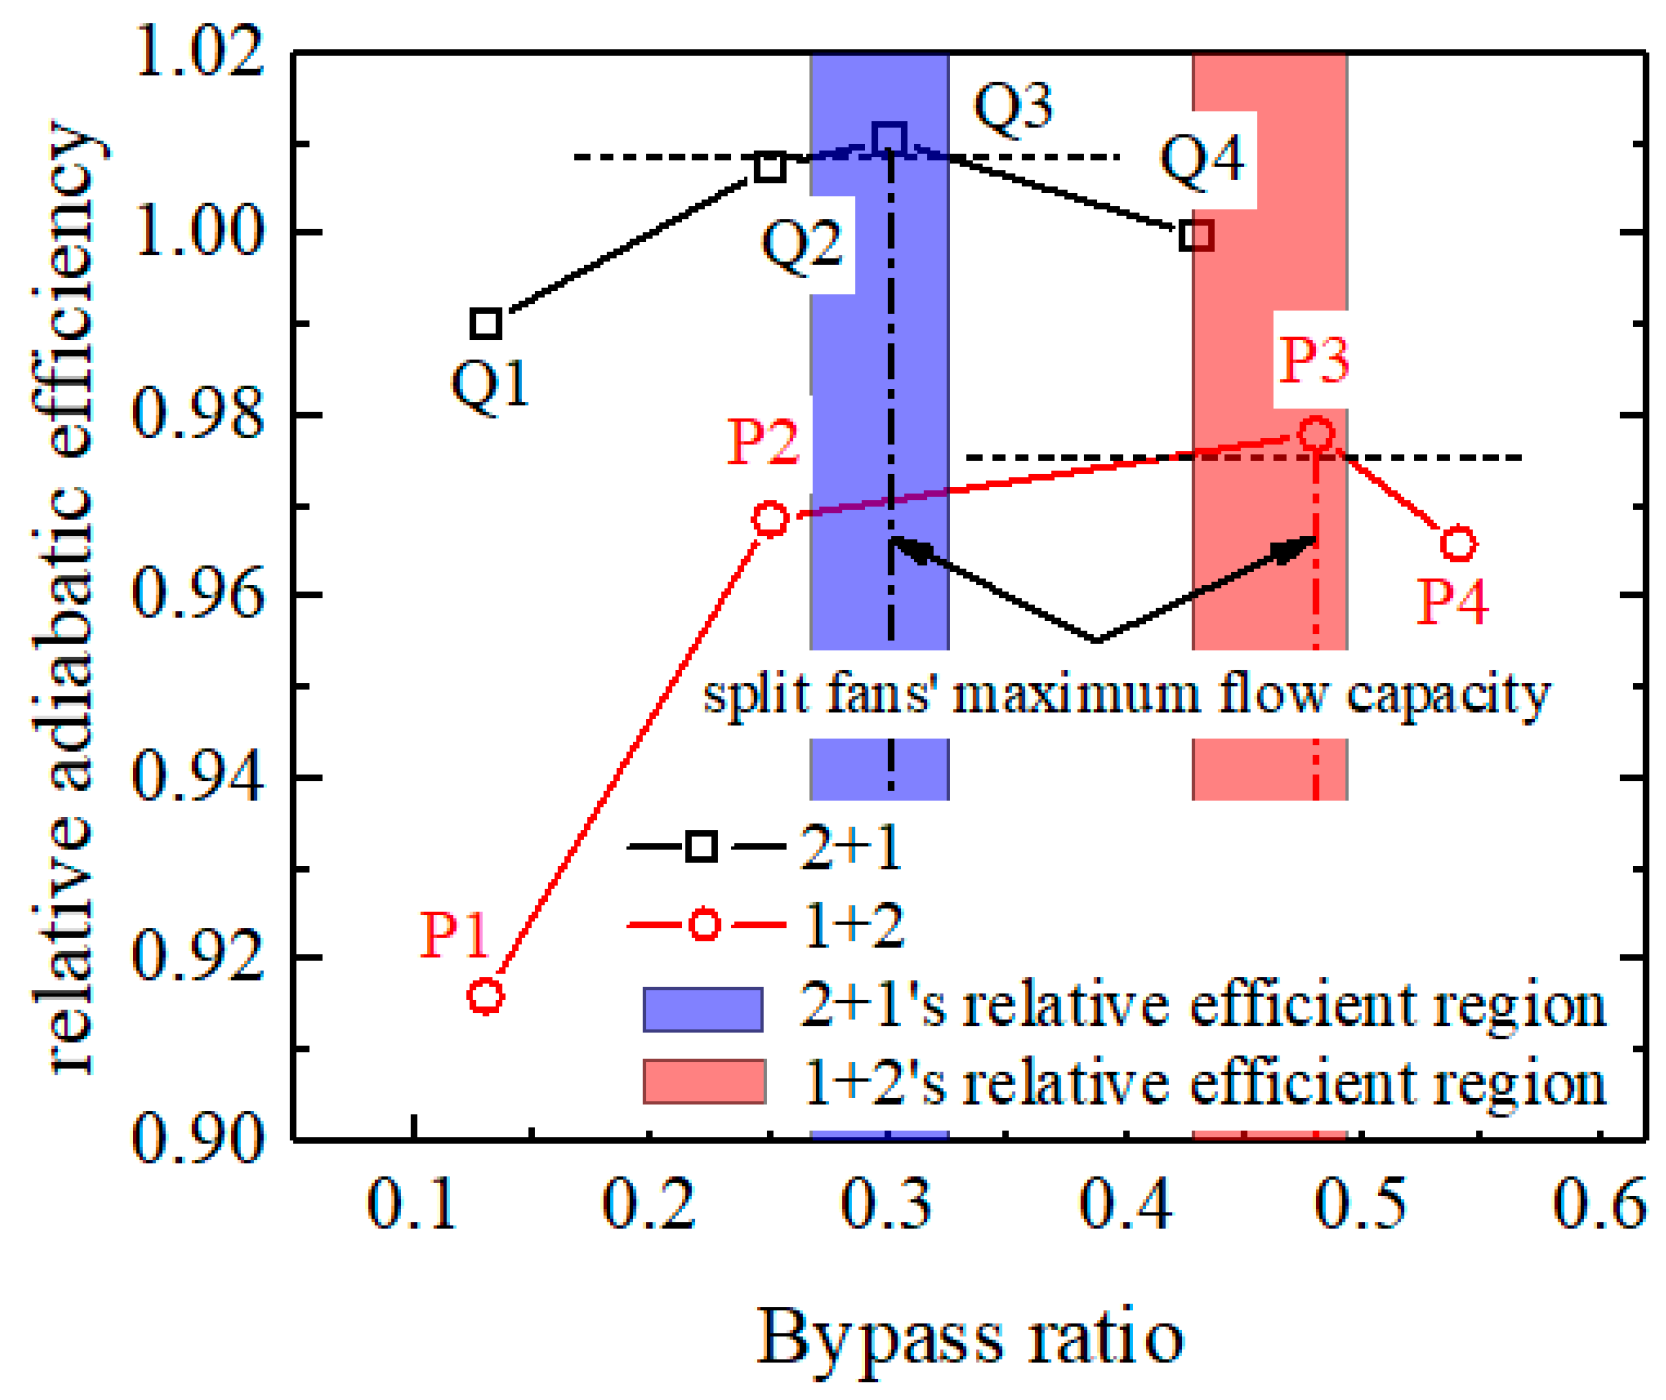
5.1. Variation in the Efficiency of the Split Fans with Bypass Ratios
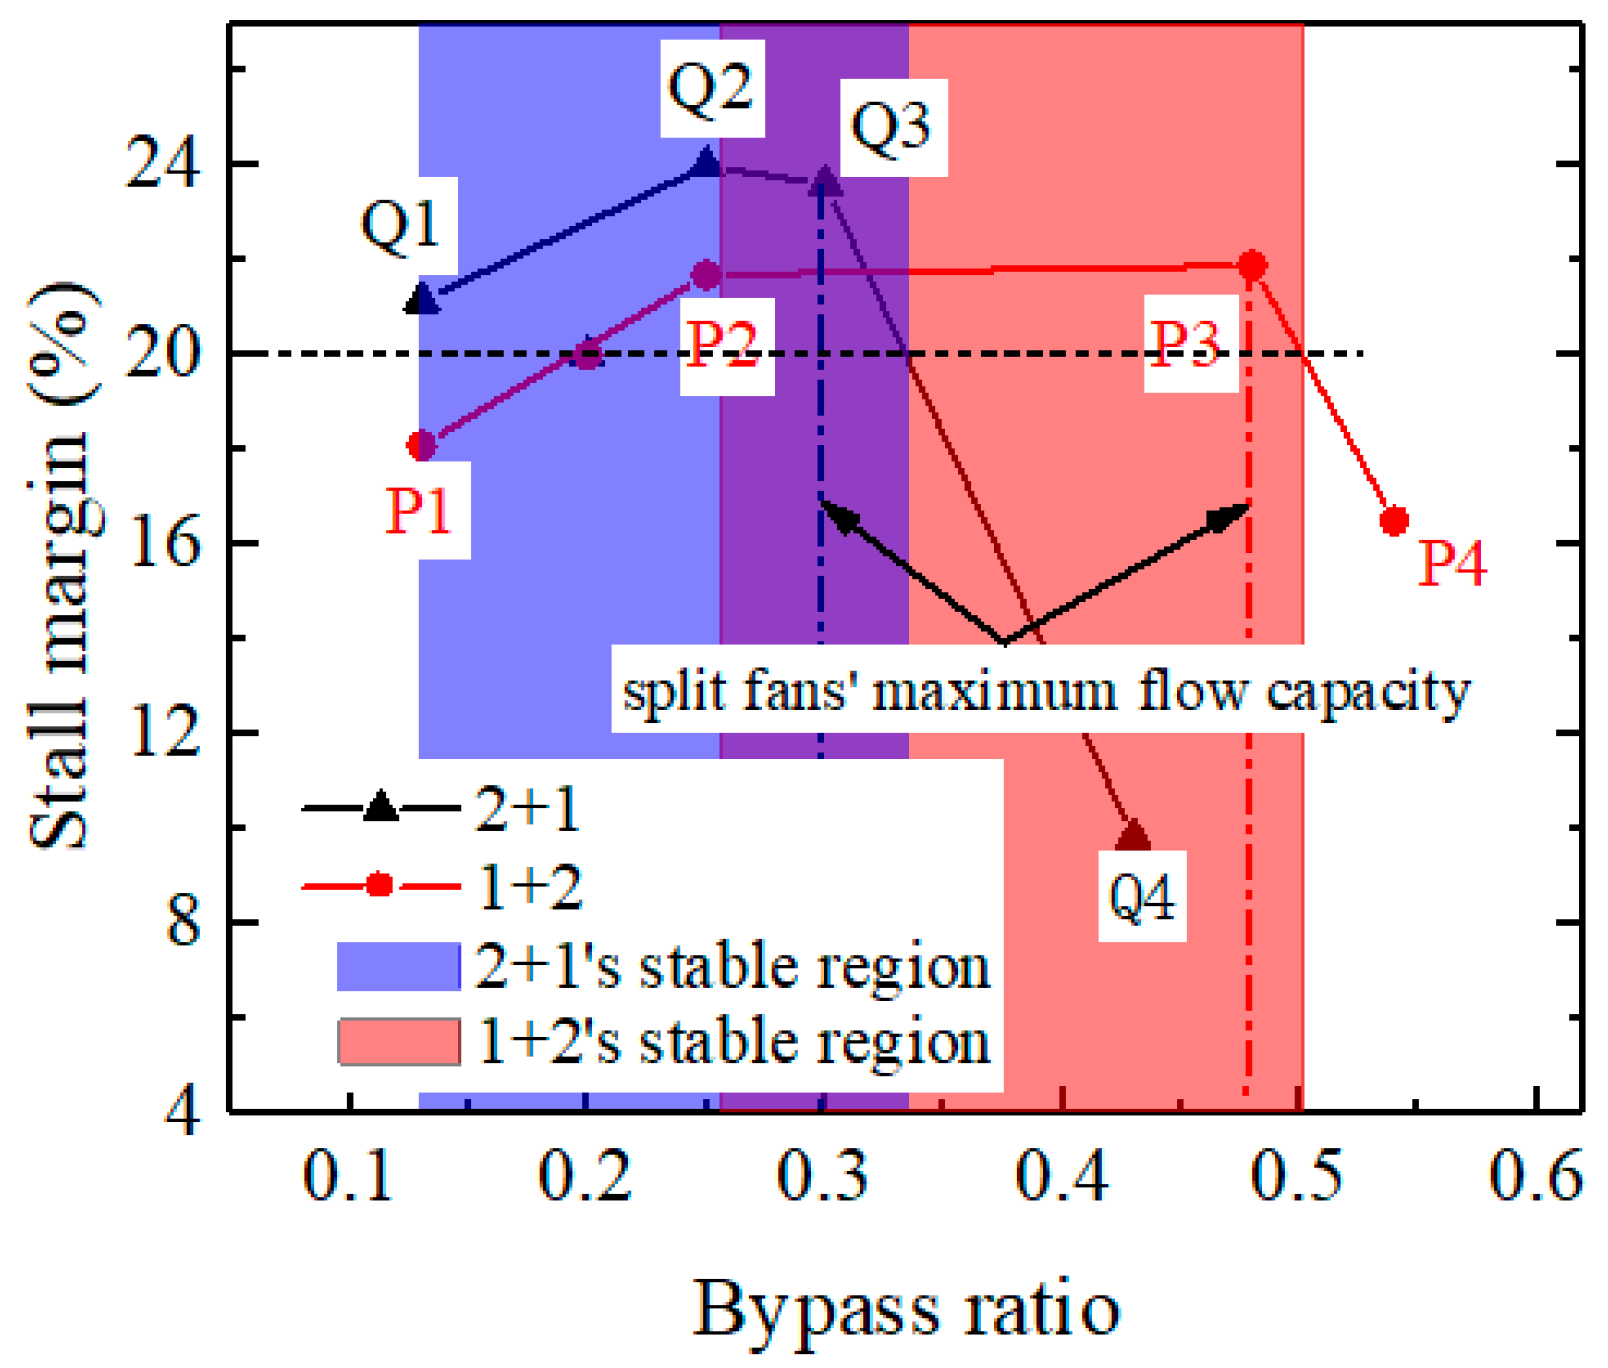
5.2. Variation in the Stall Margin of the Split Fans with Bypass Ratios
5.3. The Optimal Bypass Ratio of the Different Split Fans
5.4. Mechanism Analysis of the Optimal Bypass Ratio of the Split Fans
6. Conclusions
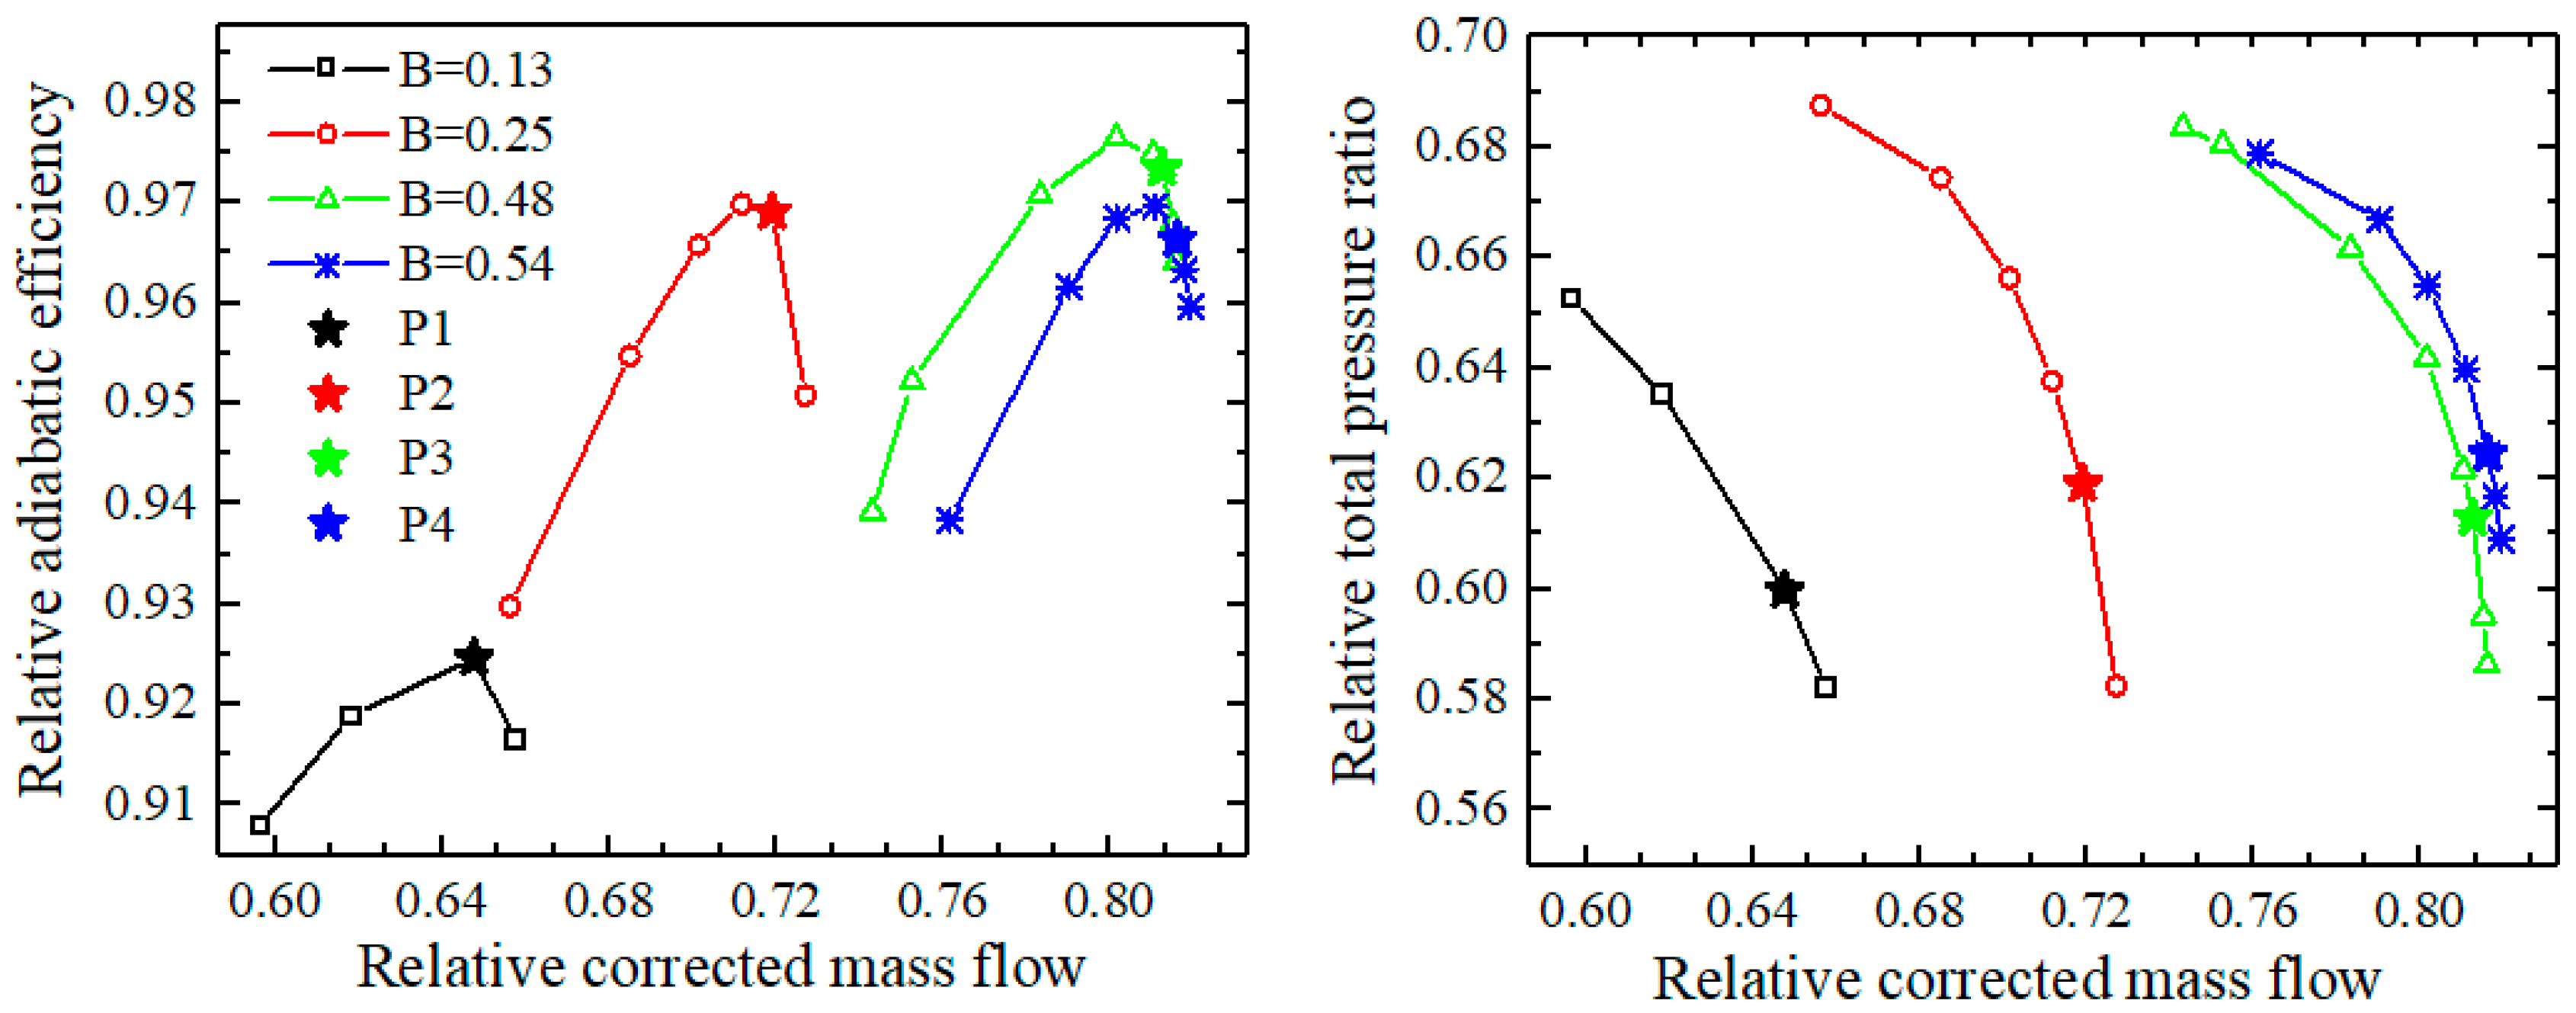
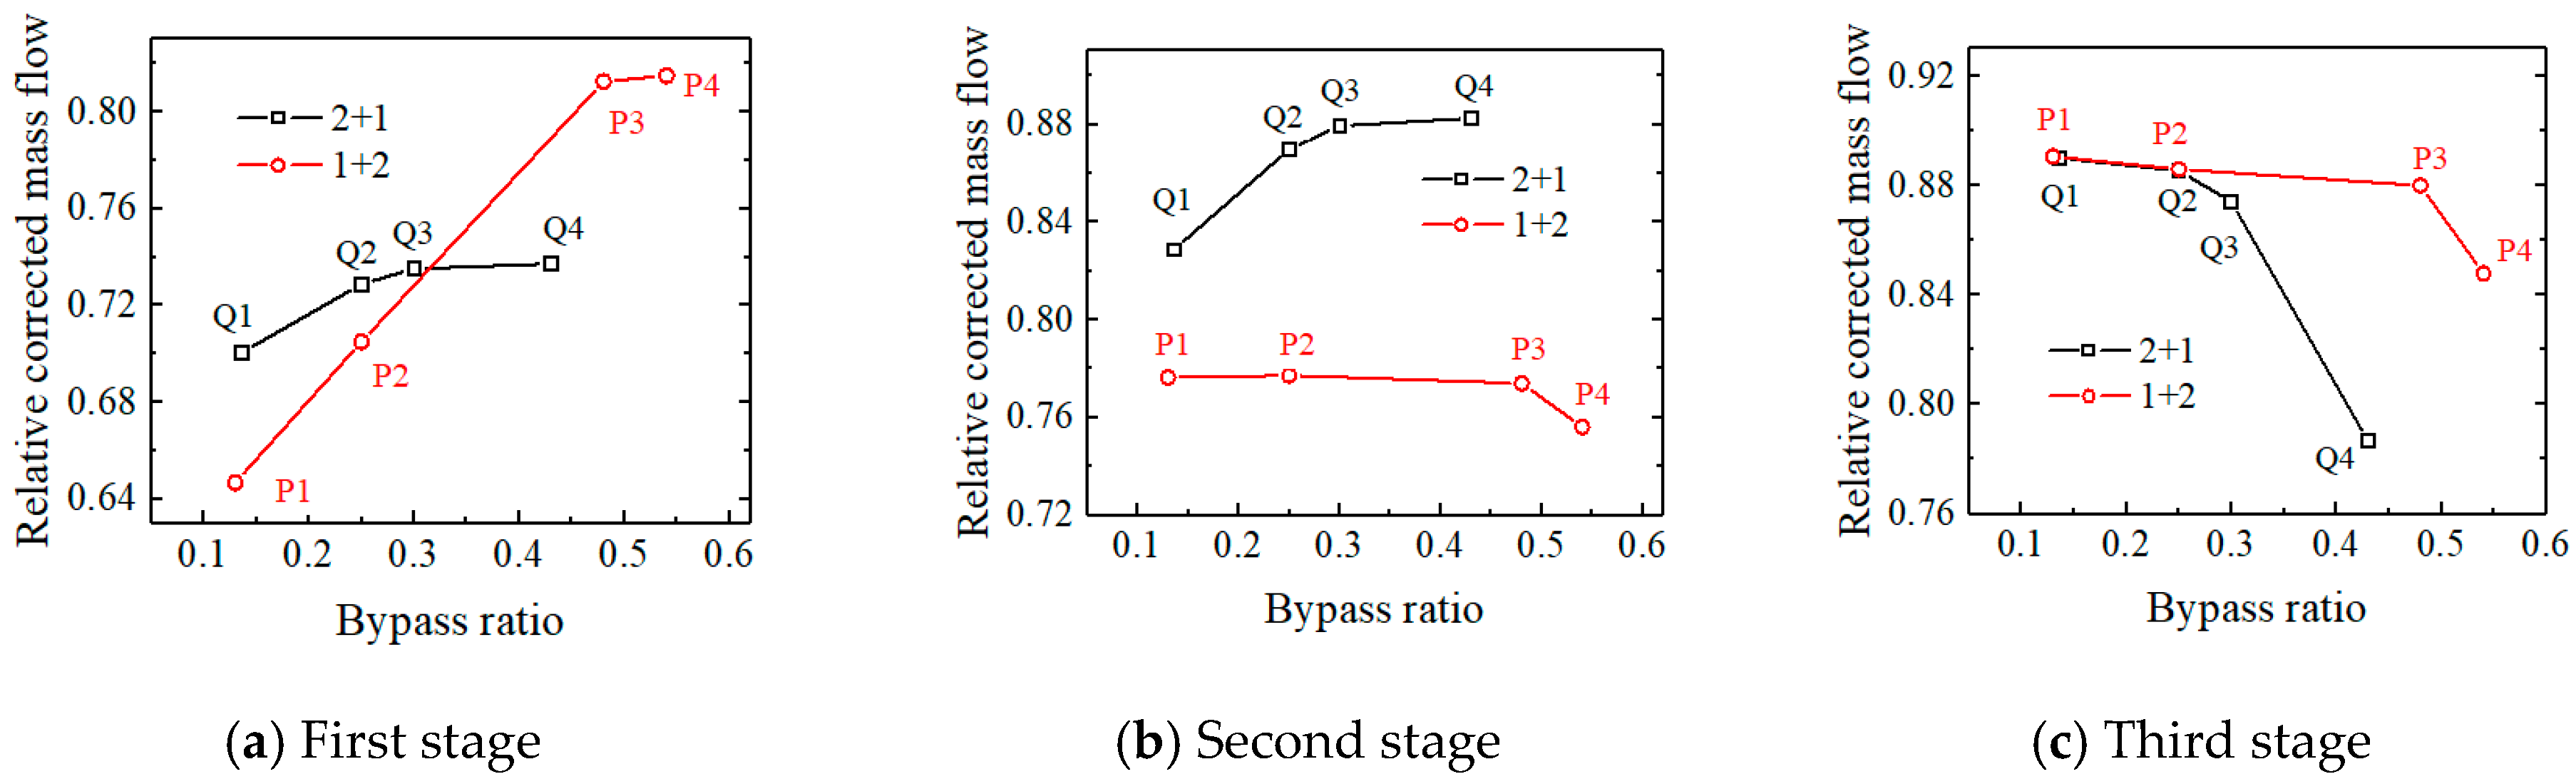
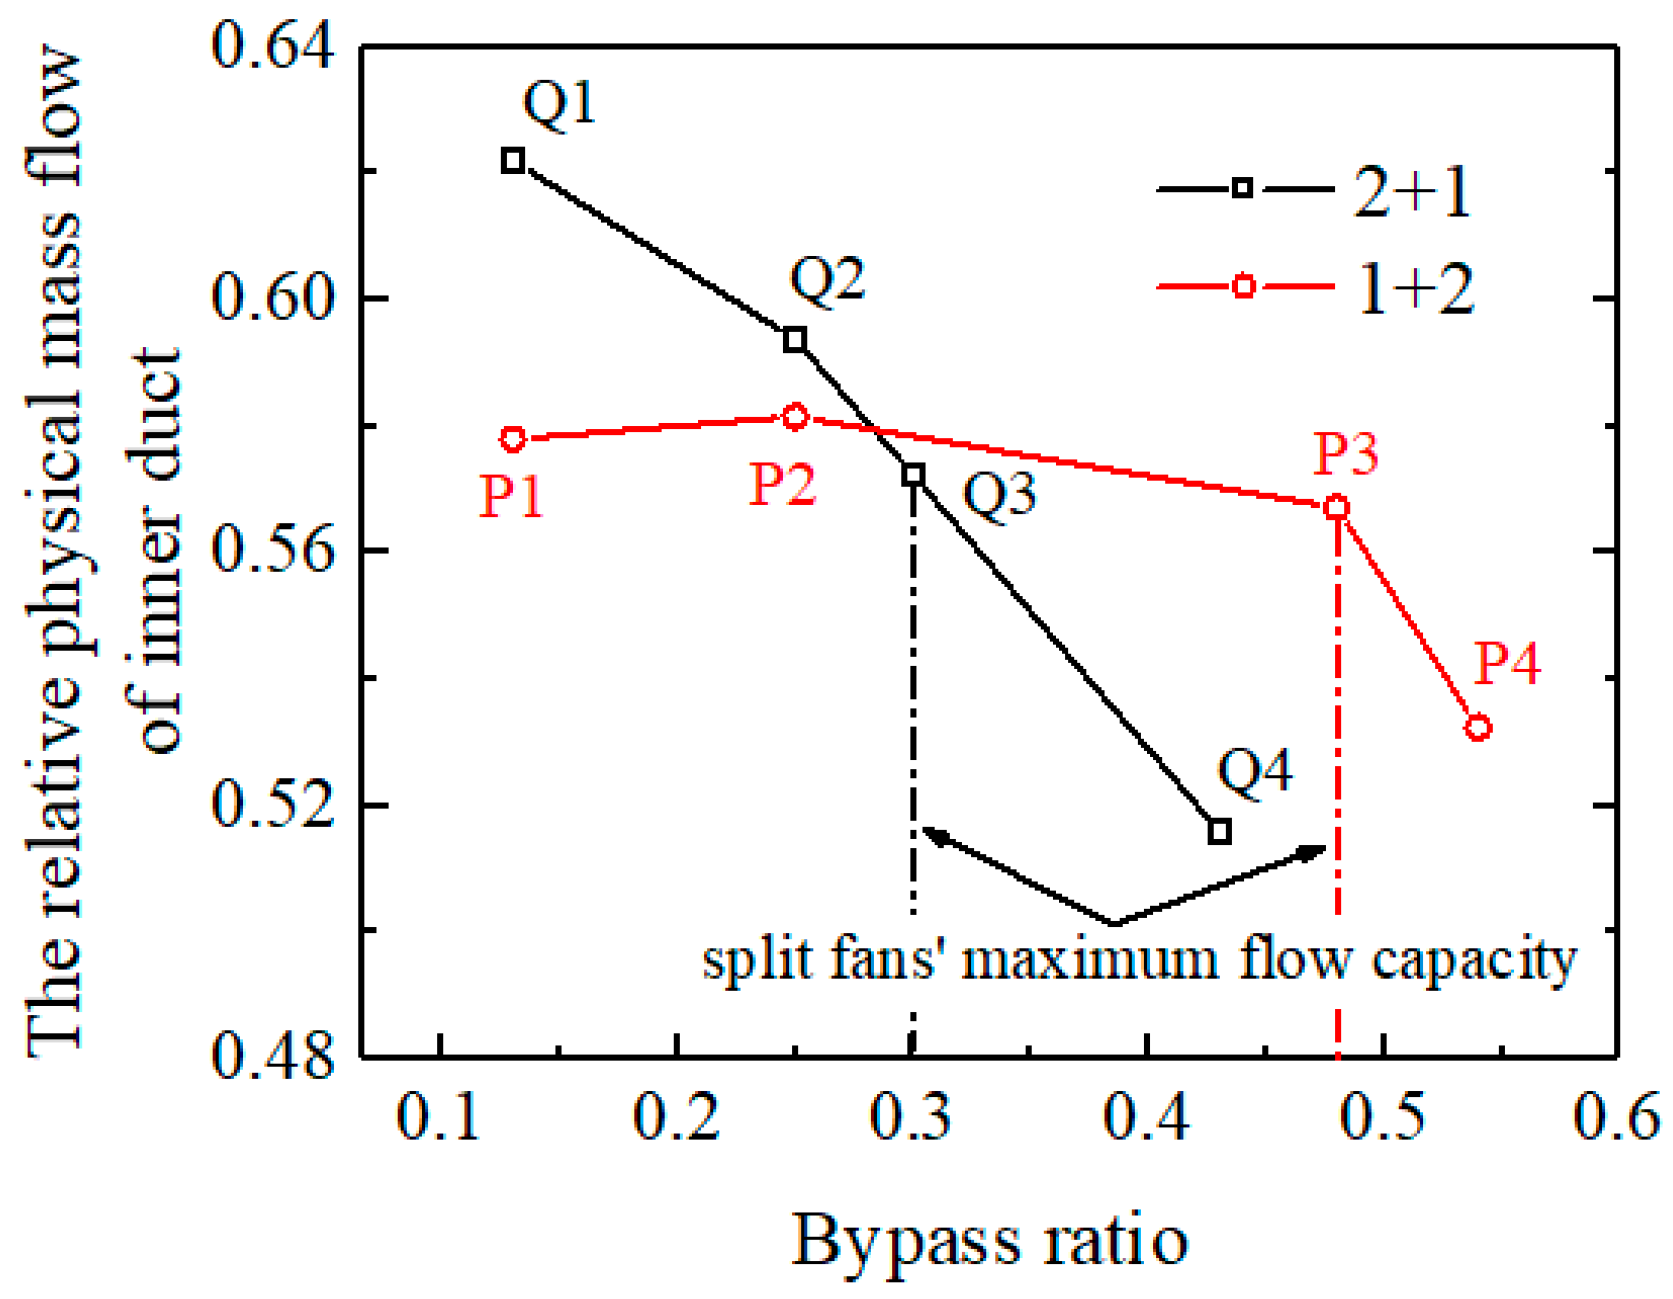
- The peak efficiency of both types of split fans exhibits an increasing trend followed by a subsequent decrease as the bypass ratio increases at 80% rpm. Moreover, the flow capacity initially shows an increase for these fans until it reaches a critical bypass ratio, beyond which it remains constant. Specifically, the “2 + 1” split fans achieve a maximum flow capacity at a bypass ratio of 0.3, while for the “1 + 2” split fans, it occurs at 0.48.
- Under the condition of a small bypass ratio at 80% rpm, the first two stages of the two split fans are close to stall, while the third stage fan is choked, and the total inlet parameters of the third stage of the “2 + 1” split fans with a higher matching pressure ratio of the second stage fan are higher. Consequently, the “2 + 1” split fans can achieve a greater flow capacity. Under the condition of the high bypass ratio at 80% rpm, the first stage of the “1 + 2” front fan experiences flow choking, while the second stage of the “2 + 1” front fan also undergoes flow choking, but the first stage remains close to stall. Obviously, only when the first stage reaches a choking state can the split fans achieve a greater maximum flow capacity. Therefore, the maximum flow capacity of the “1 + 2” split fans is greater than or equal to that of the “2 + 1” split fans.
- As the bypass ratio increases, the flow capacity of the front fan of the split fans also increases, causing its operating points to shift toward the deep choking state at the lower right of the characteristic line. Consequently, there is a decrease in the matching pressure ratio for the front fan and subsequently, a reduction in the total inlet pressure for the rear fan. The reduction in the matching pressure ratio is more pronounced for the front fan of the “2 + 1” split fans compared to that of “1 + 2” split fans, resulting in a faster decline in the physical mass flow within the inner duct and a significantly lower rate of increase for the corresponding flow capacity of the split fans.
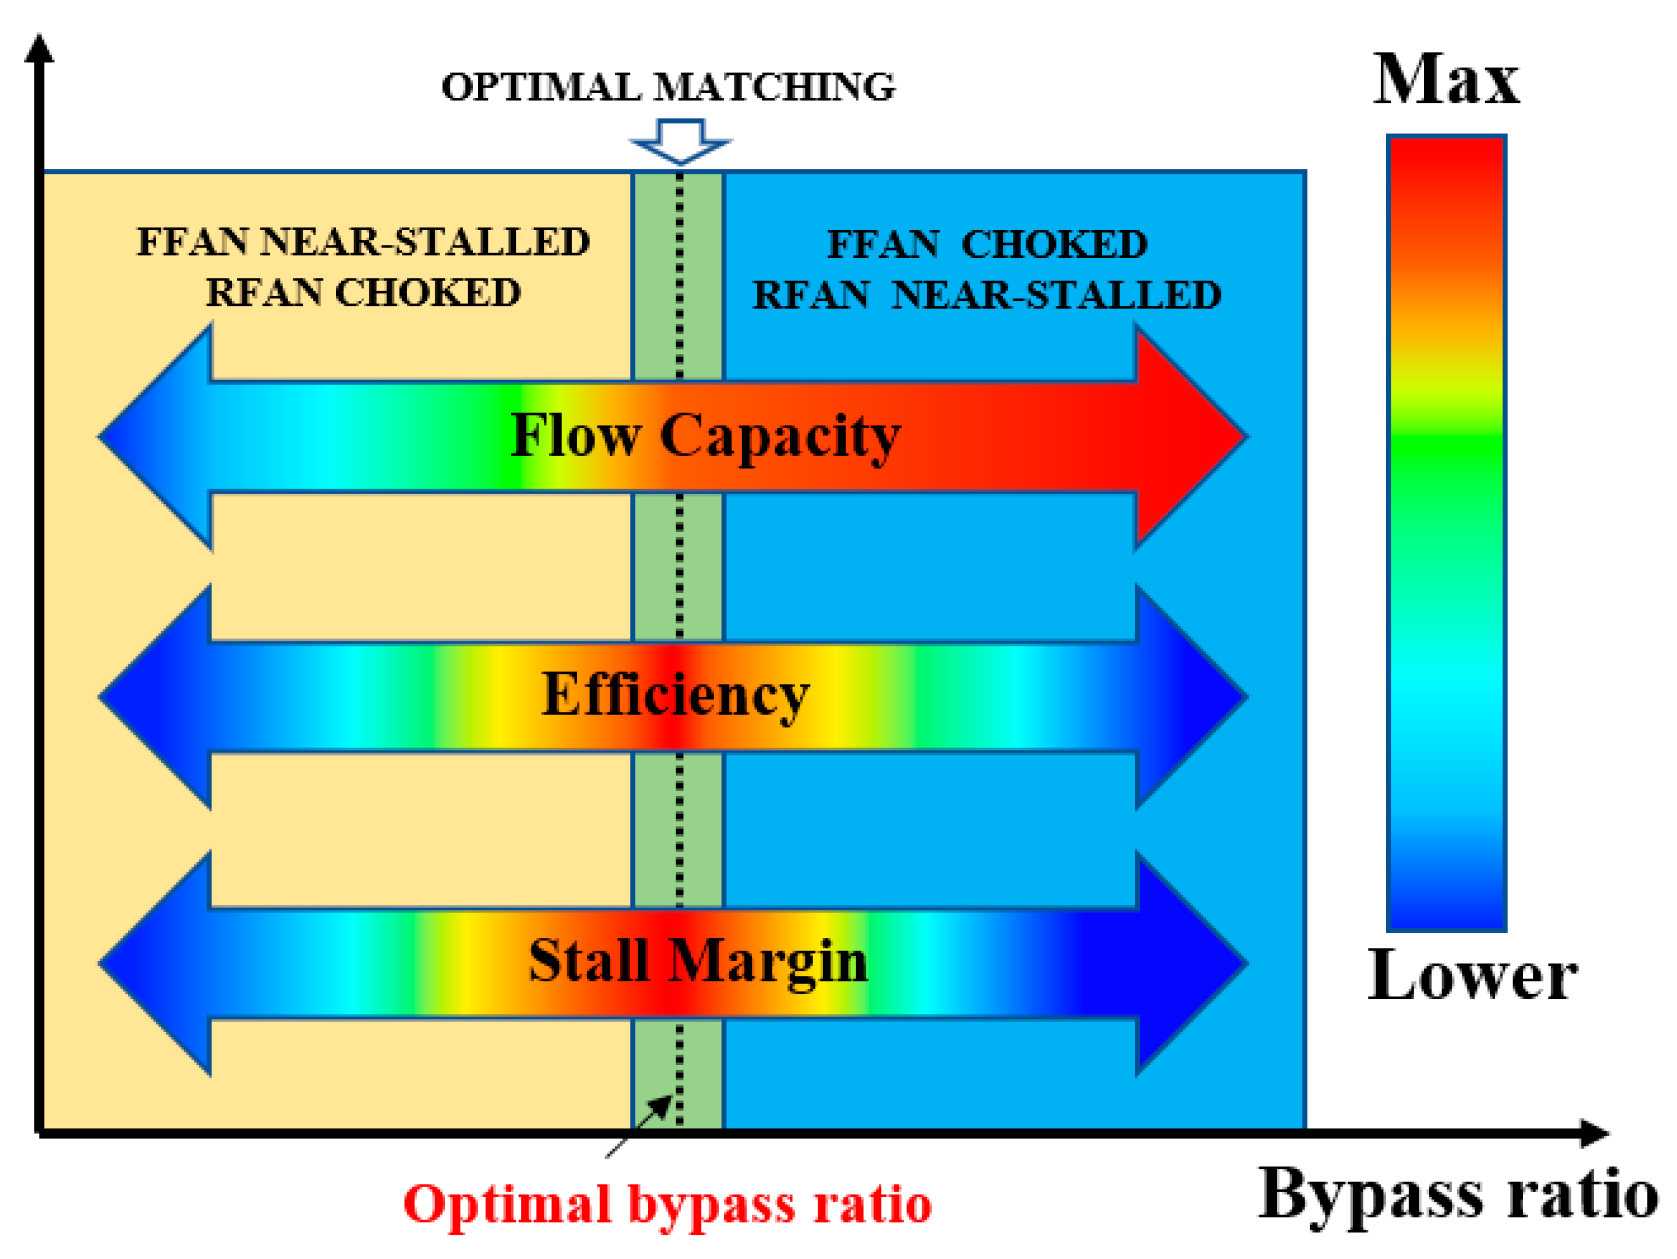
- When the flow capacity of the split fans reaches its maximum, the matching state of the front and rear fans achieves optimal performance—with rotors and stators at all stages being nearly perfectly matched near the best incidences. Consequently, both the efficiency and stall margin approach their peak values at this point. Simultaneously, the corresponding bypass ratio represents the optimal bypass ratio for the split fans.
Author Contributions
Funding
Data Availability Statement
Conflicts of Interest
Nomenclature
| π | Total pressure ratio |
| θ | Total temperature ratio |
| η | Adiabatic efficiency |
| k | Turbulence kinetic energy |
| B | Bypass ratio |
| Mass flow rates of the bypass | |
| Mass flow rates of the inner duct | |
| rpm | Revolutions per minute |
| Inlet guide vane | |
| Rotor | |
| Stator | |
| “1 + 2” or “2 + 1” | Configuration of split fans |
| FFAN | Front fan |
| RFAN | Rear fan |
| P1~P4\Q1~Q4 | Operating points |
| NUMECA | 3D CFD simulation software package |
References
- Simmons, R.J. Design and Control of a Variable Geometry Turbofan with an Independently Modulated Third Stream; The Ohio State University: Columbus, OH, USA, 2009. [Google Scholar]
- Li, B.; Chen, M.; Zhu, Z.L. Steady Performance Investigation on Various Modes of an Adaptive Cycle Aero-Engine. J. Propuls. Technol. 2013, 34, 1009–1015. [Google Scholar]
- Chen, M.; Zhang, J.; Tang, H.L. Performance Analysis of a Three-Stream Adaptive Cycle Engine during Throttling. Int. J. Aerosp. Eng. 2018, 2018, 9237907. [Google Scholar] [CrossRef]
- Han, J.; Wang, J.K.; Liang, C.Y.; Su, G.Y. Thrust performance optimization calculation and analysis of triple bypass variable cycle engine. J. Aerosp. Power 2018, 33, 338–344. [Google Scholar]
- Allan, R.D. General Electric Company Variable Cycle Engine Technology Demonstrator Program. In Proceedings of the 15th Joint Propulsion Conference, Las Vegas, NV, USA, 18–20 June 1979. [Google Scholar]
- Liu, Q.; Li, G.T.; Huang, H.C. Matching Simulation on Cycle Parameter of Triple Bypass Variable Cycle Engine. Aeroengine 2016, 42, 51–54. [Google Scholar]
- Qi, H.B.; Huang, S.Z.; Wang, W.L.; Ding, C.X.; Chang, Y.B. Adaptive cycle engine performance design based on inlet/engine matching concept. Gas Turbine Exp. Res. 2016, 29, 5–10. [Google Scholar]
- Giffin, R.G.; Ciokajlo, J.J.; Dunbar, L.W. Compressor Splitter for Use with a Forward Variable Area Bypass Injector. U.S. Patent 5680754, 28 October 1997. [Google Scholar]
- Zheng, J.C.; Chen, M.; Tang, H.L. Matching mechanism analysis on an adaptive cycle engine. Chin. J. Aeronaut. 2017, 30, 706–718. [Google Scholar] [CrossRef]
- Zheng, J.C.; Tang, H.L.; Chen, M.; Zhang, Y.J.; Zhuge, W.L. Operating Modes Performance Comparison Research in Typical Working Conditions on an Adaptive Cycle Engine. J. Eng. Thermophys. 2022, 43, 1743–1750. [Google Scholar]
- Vdoviak, J.W.; Ebacker, J.A. VCE test bed engine for supersonic cruise research. NASA Conf. Publ. 1979, 2108, 347–356. [Google Scholar]
- Yang, X.F.; Sun, T.L.; Meng, D.J.; Yin, H.B.; Wang, Y.M. Aerodynamic design method for core-driven fan stage considering multiple modes. Acta Aeronaut. Astronaut. Sin. 2024, 45, 128625. [Google Scholar]
- Liu, B.J.; Jia, S.F.; Yu, X.J. Numerical Study of the Characteristics of a Variable Cycle Compressor. J. Eng. Thermophys. 2016, 37, 1850–1855. [Google Scholar]
- Huang, L.; Zhang, J.; He, X.D.; Li, Q.H.; Chu, W.L.; Xiao, S.L. The matching performance research of core driven fan stage and compressor. J. Aerosp. Power 2023. Available online: https://kns.cnki.net/kcms2/detail/11.2297.V.20230717.1008.001.html (accessed on 22 February 2024).
- Ma, C.Y.; Hou, M.J.; Wang, H.; Gao, J. Matching Performance Prediction Between Core Driven Fan Stage and High Pressure Compressor. Int. J. Turbo Jet-Engines 2021, 38, 101–114. [Google Scholar] [CrossRef]
- Shi, H. A Parametric Blade Design Method for High-Speed Axial Compressor. Aerospace 2021, 8, 271. [Google Scholar] [CrossRef]
- Strazisar, A.J.; Wood, J.R.; Hathaway, M.D.; Suder, K.L. Laser Anemometer Measurements in a Transonic Axial-Flow Fan Rotor; Lewis Research Center, NASA: Cleveland, OH, USA, 1989; p. 214.


| “2 + 1” Split Fans | “1 + 2” Split Fans | |||||
|---|---|---|---|---|---|---|
| Stage 1 | Stage 2 | Stage 3 | Stage 1 | Stage 2 | Stage 3 | |
| Loading coefficient, ψ (–) | 0.245 | 0.270 | 0.257 | 0.245 | 0.283 | 0.261 |
| Flow coefficient, φ (–) | 0.624 | 0.529 | 0.536 | 0.624 | 0.534 | 0.506 |
| Degree of reaction, DR (–) | 0.828 | 0.827 | 0.740 | 0.830 | 0.856 | 0.760 |
| Tangential velocity—tip (m/s) | 508 | 482 | 456 | 508 | 474 | 456 |
| Hub-to-tip ratio (–) | 0.37 | 0.61 | 0.76 | 0.37 | 0.64 | 0.74 |
| Bypass ratio (–) | 0.13 | 0.13 | ||||
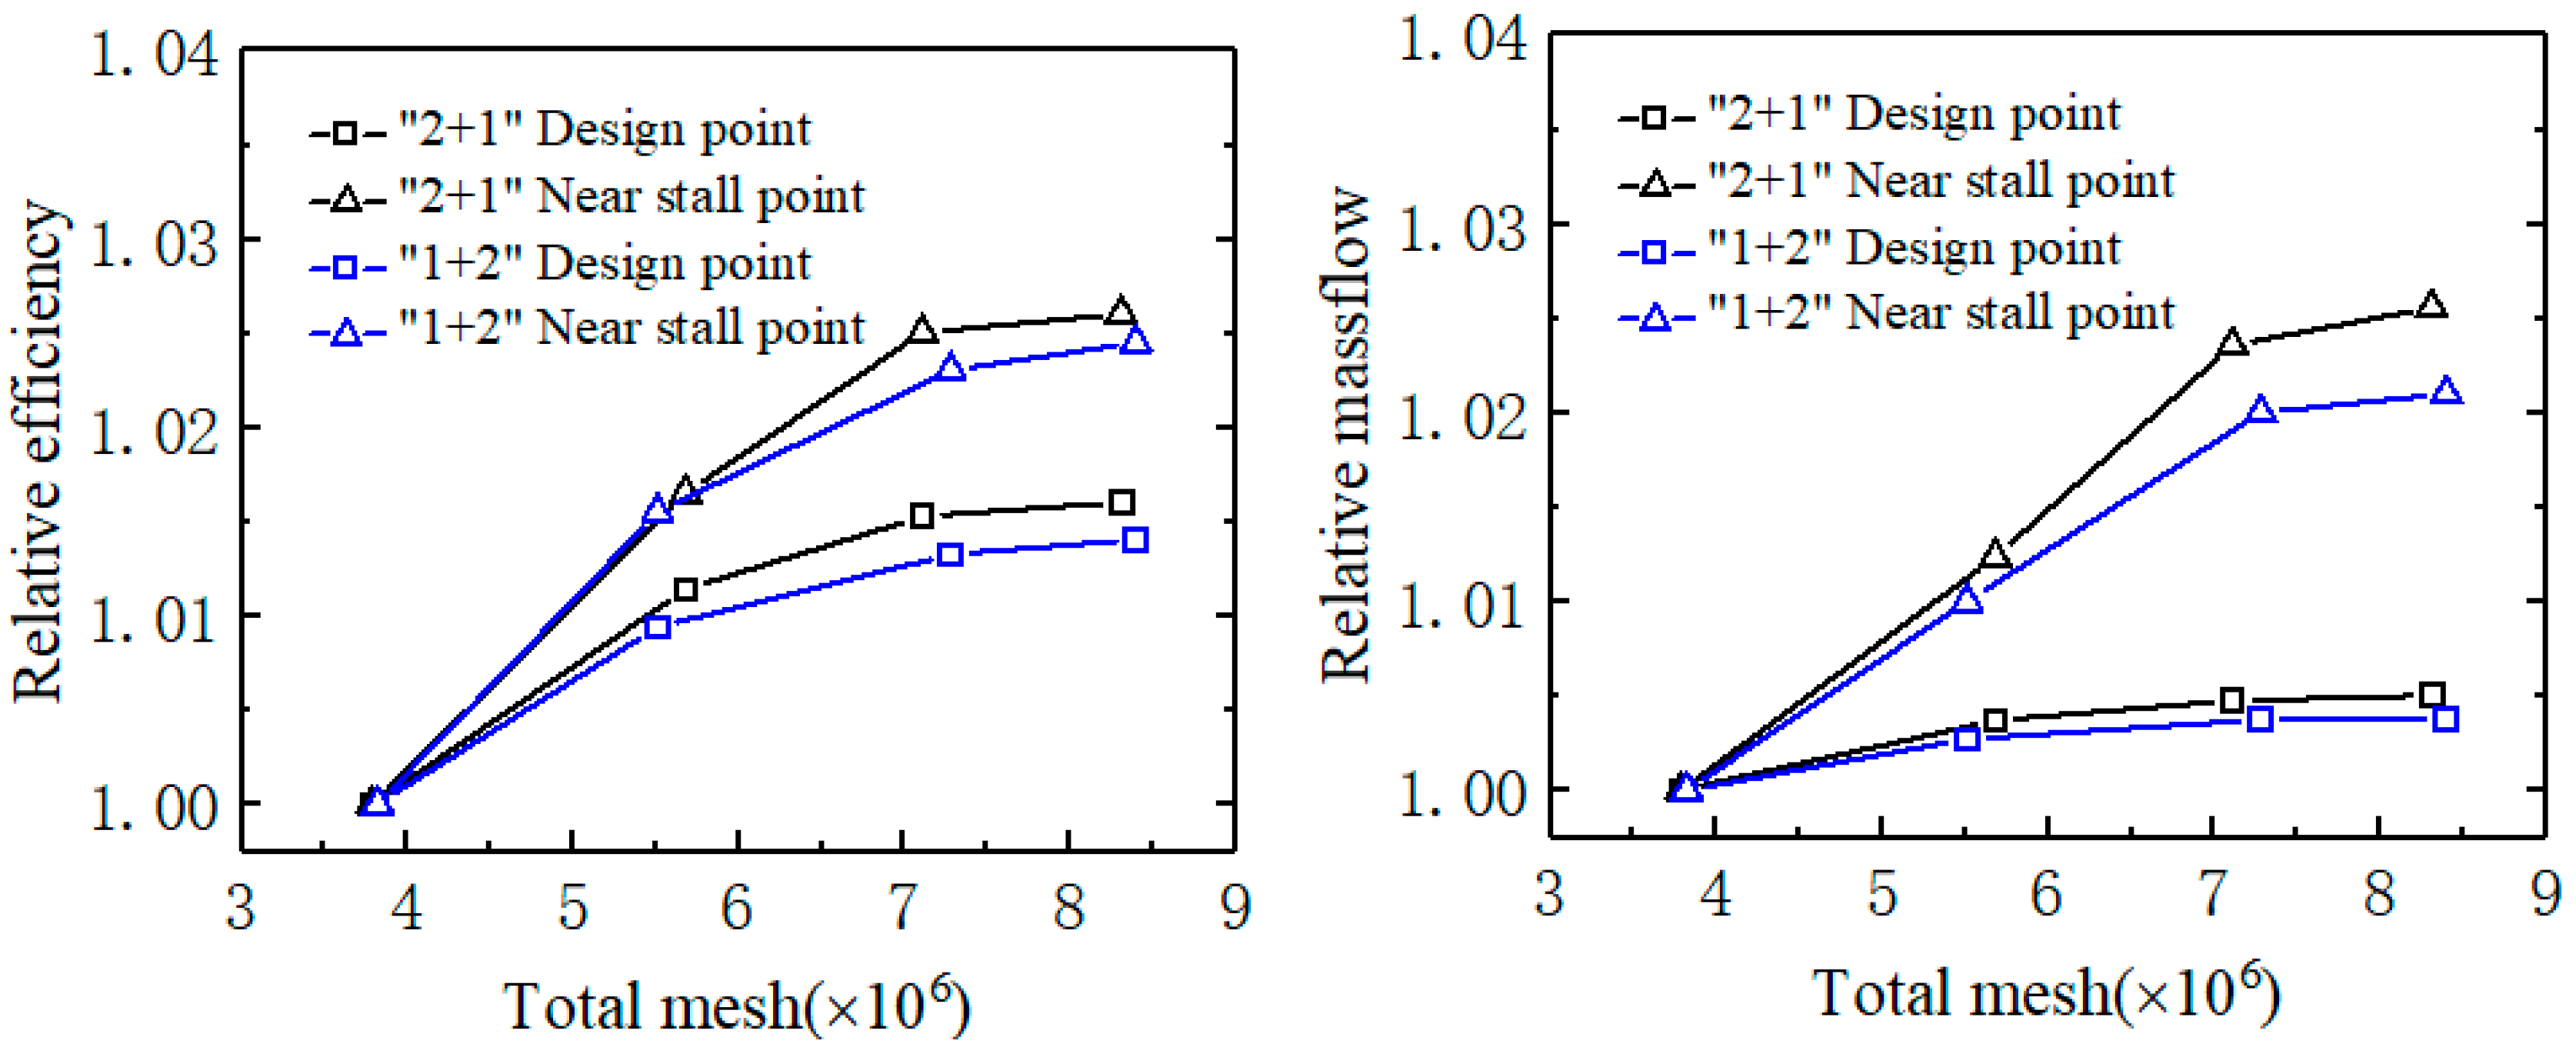
| “2 + 1” Split Fans (×106) | “1 + 2” Split Fans (×106) | |
|---|---|---|
| Grid 1 | 3.79 | 3.82 |
| Grid 2 | 5.68 | 5.51 |
| Grid 3 | 7.11 | 7.28 |
| Grid 4 | 8.31 | 8.40 |
Disclaimer/Publisher’s Note: The statements, opinions and data contained in all publications are solely those of the individual author(s) and contributor(s) and not of MDPI and/or the editor(s). MDPI and/or the editor(s) disclaim responsibility for any injury to people or property resulting from any ideas, methods, instructions or products referred to in the content. |
© 2024 by the authors. Licensee MDPI, Basel, Switzerland. This article is an open access article distributed under the terms and conditions of the Creative Commons Attribution (CC BY) license (https://creativecommons.org/licenses/by/4.0/).
Share and Cite
An, G.; Zhou, R.; Yu, X.; Liu, B.; Wu, G. Analysis of the Flow Capacity of Variable Cycle Split Fans at the Middle Speed. Energies 2024, 17, 1194. https://doi.org/10.3390/en17051194
An G, Zhou R, Yu X, Liu B, Wu G. Analysis of the Flow Capacity of Variable Cycle Split Fans at the Middle Speed. Energies. 2024; 17(5):1194. https://doi.org/10.3390/en17051194
Chicago/Turabian StyleAn, Guangfeng, Rui Zhou, Xianjun Yu, Baojie Liu, and Guanghan Wu. 2024. "Analysis of the Flow Capacity of Variable Cycle Split Fans at the Middle Speed" Energies 17, no. 5: 1194. https://doi.org/10.3390/en17051194
APA StyleAn, G., Zhou, R., Yu, X., Liu, B., & Wu, G. (2024). Analysis of the Flow Capacity of Variable Cycle Split Fans at the Middle Speed. Energies, 17(5), 1194. https://doi.org/10.3390/en17051194