Article

Practical Challenges in Nanofluid Convective Heat Transfer Inside Silicon Microchannels

Department of Mechanical Engineering, Division of Applied Mechanics and Energy Conversion (TME), KU Leuven, B-3001 Leuven, Belgium
*
Author to whom correspondence should be addressed.
Energies 2023, 16(23), 7885; https://doi.org/10.3390/en16237885
Submission received: 29 October 2023 / Revised: 26 November 2023 / Accepted: 28 November 2023 / Published: 2 December 2023
(This article belongs to the Special Issue Energy Performance of Nanofluids Used for Heat Transfer Applications)

Abstract

:
Despite numerous studies on nanofluids in microchannel heat sinks (MCHSs), they are not yet commercialized due to long-term stability issues and high maintenance costs. Therefore, this study explores the impact of nanofluids and nanoparticle clustering on single-phase convective heat transfer inside microchannels under laminar conditions. Water and commercially available water-based nanosuspensions, including Al 2 O 3 -water (30–60 nm), TiO 2 -water (5–30 nm), and polystyrene-water (50 nm), are circulated through silicon MCHS having rectangular channels integrated into a closed flow loop. To assess the in situ and real-time nanoparticle clustering during heat transfer experiments, Light Extinction Spectroscopy (LES) is applied as a non-intrusive measurement technique on nanofluids without any fluid sampling. Our findings reveal the appearance of nanofluid discoloration with no measurable increase in heat transfer coefficient. This unexpected change is attributed to the interplay of abrasion, erosion, and corrosion phenomena, likely triggered by the clustering of nanoparticles within the silicon microchannels—a novel insight into the complex dynamics of nanofluid behavior (an increase in the De Brouckere mean diameter from 11 nm to 107.3 nm over a 2.5 h period for TiO 2 nanoparticles). The resulting material loss could not be mitigated by altering the nanoparticle material, which may impede heat transfer enhancement under tested conditions.

1. Introduction

Nanofluids offer groundbreaking possibilities for state-of-the-art cooling systems owing to their distinctive thermophysical characteristics. Their ability to adjust thermal conductivity, viscosity, surface tension, and surface wettability [1,2] has elevated their status as potential coolants for various heat transfer processes, such as in spray cooling [3], compact heat exchangers [4], and microchannel heat sinks [5]. Nevertheless, inconsistencies in research findings postpone their adoption in the industrial sector. Additionally, some other practical challenges, i.e., stability in the long term [6], material wear [7,8,9,10], clogging [11], or recycling and reusability [12] stand against their commercialization. Furthermore, the pressure drop should also be taken into account to have a fair evaluation of the performance improvement.
Focusing specifically on microchannel heat sinks (MCHSs), nanofluids present a promising solution for enhancing the performance of these miniature cooling systems. In particular, Al 2 O 3 -water is the most cost-effective and widely tested nanofluid type [13,14] with low particle concentrations to promote better nanosuspension characteristics [15]. Ajeeb et al. [16] performed an experimental investigation with water and ethylene glycol/water-based Al 2 O 3 nanofluids in a compact plate heat exchanger and evaluate their energy performance. Accordingly, up to a 27.8% increase in Nusselt number is obtained for the 0.2 vol.% Al 2 O 3 nanofluid in water, accompanied by a modest increase in pressure drop up to 8%. Marseglia et al. [17] studied the flow-boiling of pure fluids and nanofluids for cooling applications in MCHSs, utilizing a stainless steel sheet placed beneath the MCHS. Their experimental campaign offers low-concentrated nanofluids as a more cost-effective solution than a two-phase flow. While they report sedimentation of Al 2 O 3 nanoparticles on the stainless steel sheet and within the syringe, it is worth noting that the relatively short duration of their experiments may not comprehensively address practical concerns, such as material wear. While the benefits of nanofluids as heat transfer enhancers are well-documented in the literature, critical challenges such as non-uniform particle dispersion and particle fouling need further exploration beyond thermal performance [18]. Depending on their hardness, clustered nanoparticles might cause surface scratches, and suspensions containing submicron Al 2 O 3 particles are frequently utilized in mechanical abrasive polishing [19]. Material loss due to the clustered nanoparticles can impact the heat transfer performance of the nanofluids, as well as trigger the particle fouling and clogging of the passages [20]. In other words, the phenomena of abrasion–erosion–corrosion of nanofluids in thermal systems may bring concerns for their long-term use [21]. Furthermore, Akram et al. and Alawi et al. discussed, in their review papers [22,23], that erosion occurring on the walls complicates the use of nanofluids in solar collectors for long-term use.
To the best of the authors’ knowledge, the work of Sommers and Yerkes [24] is the sole research paper that has documented nanofluid discoloration (Al 2 O 3 -propanol) after prolonged circulation in the flow loop, which intensifies with increased flow rates and temperatures. Their experiments showed that nanofluid exhibits no heat transfer enhancement in such conditions. Furthermore, they reported a degraded thermal performance of the nanofluid with increasing discoloration.
In this paper, we demonstrate the nanofluid discoloration and significant material loss from silicon MCHS during closed-loop experiments, resulting from the coupling of nanoparticle clustering and tribological effects. Since nanoparticle clustering is the prominent phenomenon that motivated this research, the convective heat transfer measurements are coupled with the in situ and real-time LES measurements. The first indication of nanoparticle clustering is observed through the loss of transparency of the nanosuspension. Furthermore, the clustering is evident in the LES measurements, as reflected in the transmittance profiles and the De Brouckere mean diameter D 43 .

2. Materials and Methods

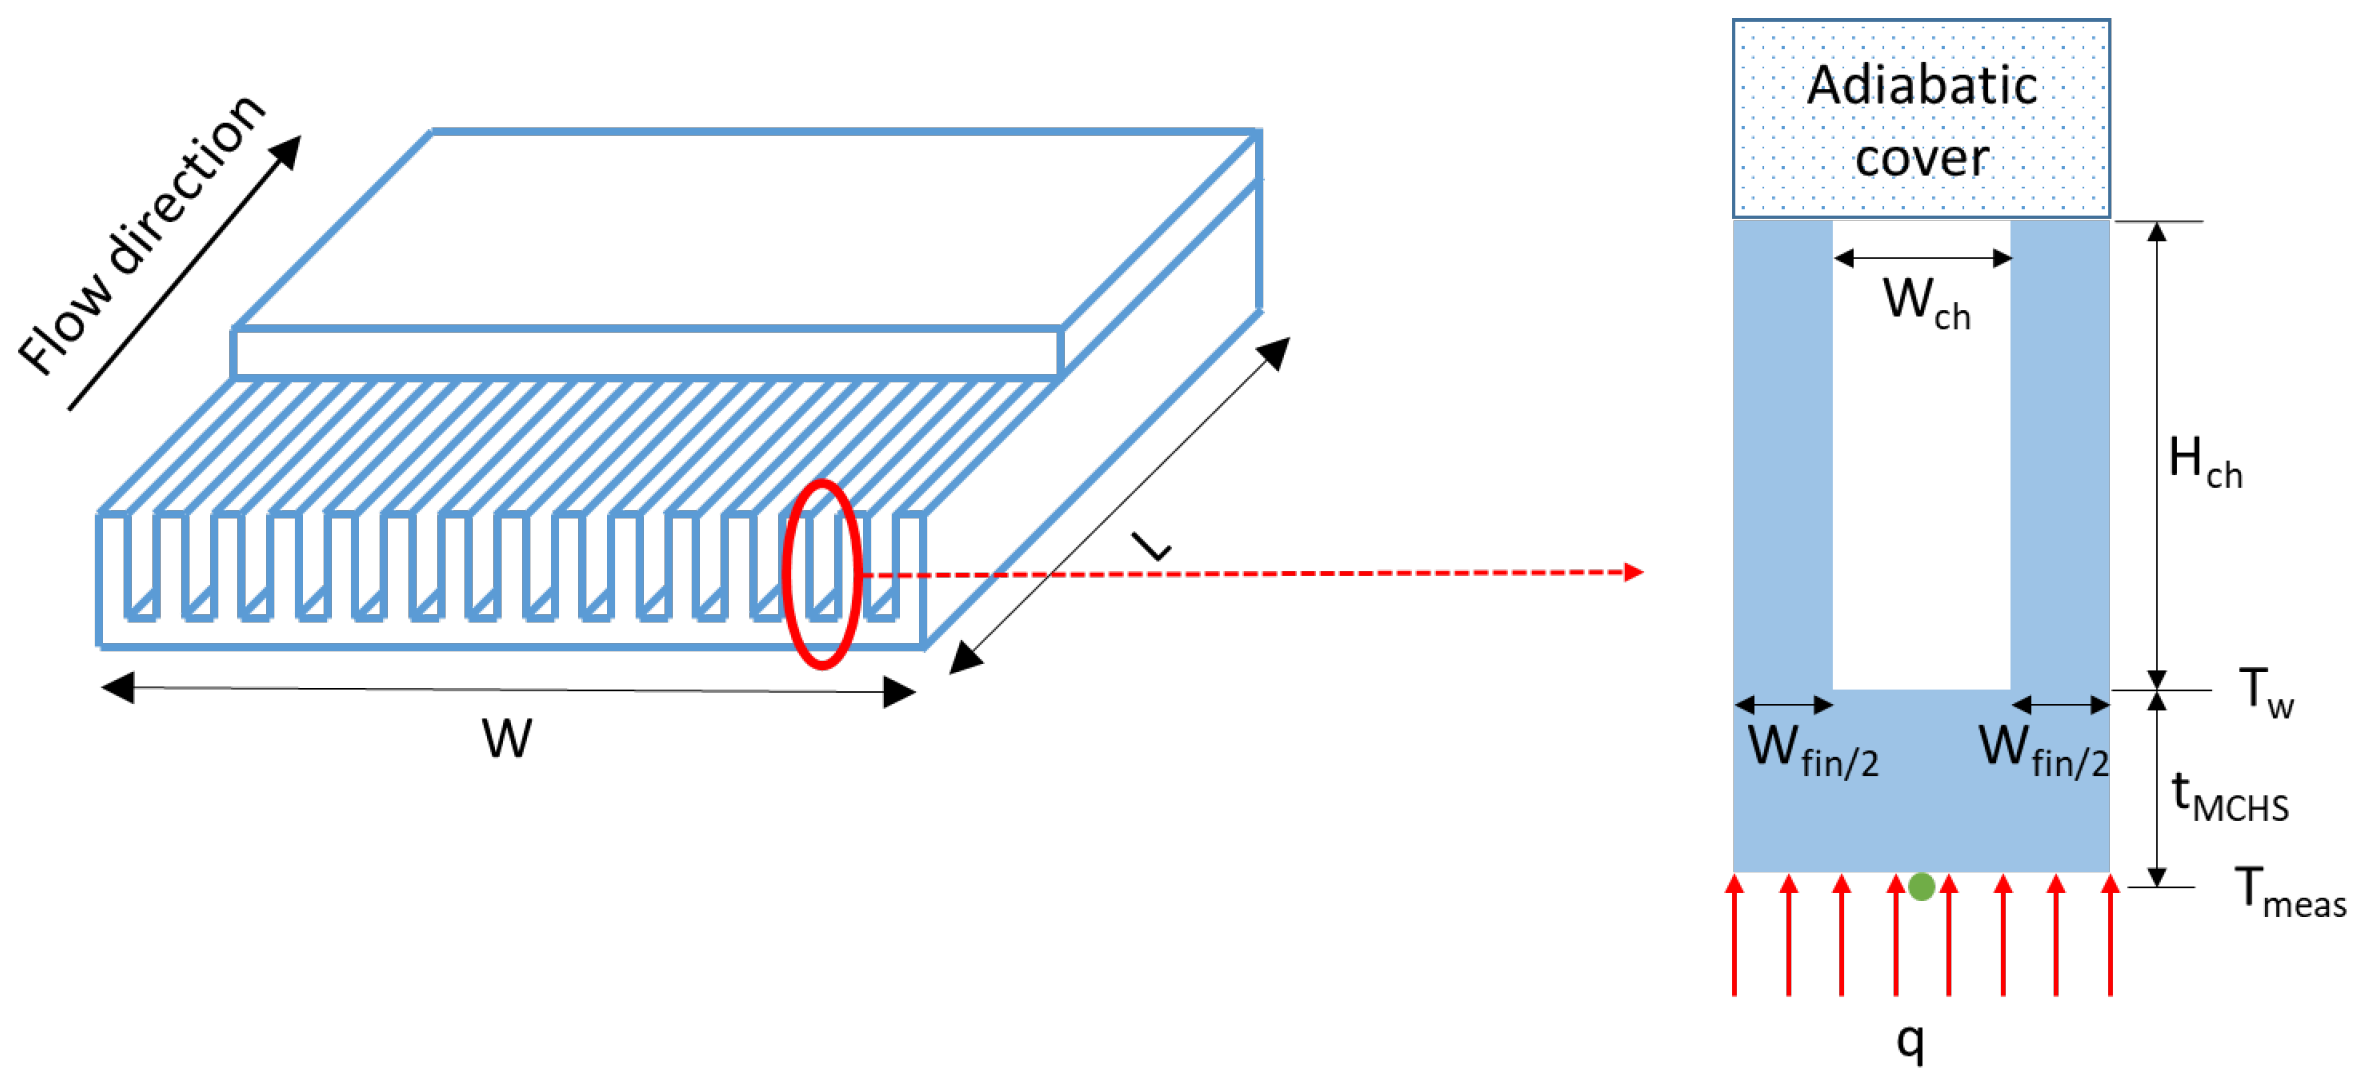
2.1. Single-Phase Heat Transfer Calculations Inside the MCHSs

The hydraulic diameter D h of a straight rectangular channel is given in Equation (1):
D h = 4 W c h H c h 2 ( W c h + H c h ) ,
where W c h is the width of the channels and H c h is the channel height (see Figure 1).
If heat is provided to the system as electrical power (Joule effect) from the bottom of the MCHS, this can be calculated as in Equation (2):
q = q e l e c · A h e a t ,
where q is the total supplied heat to the system, q e l e c is the electrically supplied heat flux, and A h e a t is the top projected area of the heated surface. The fluid flowing inside the microchannels carries heat away, functioning as a heat sink. Hence, the measured enthalpy change of the cooling fluid q e f f can be written as follows in Equation (3):
q e f f = m ˙ C p ( T f , o u t T f , i n ) ,
where m ˙ is the mass flow rate of the fluid, C p corresponds to the heat capacity of the fluid, and T f , i n and T f , o u t represent the fluid temperatures at the inlet and the outlet of the MCHS, respectively. If the heat losses to the surrounding are negligibly small, the electrical power input approximates the change in the fluid enthalpy, i.e., q q e f f . The convective heat transfer from the microchannels to the coolant is calculated using the analytical fin technique in Equation (4) [20,25,26,27]:
q e f f = h ( W c h + 2 η H c h ) L N ( T w , a v e T f , a v e ) ,
where h is the global convective heat transfer coefficient, L is the channel length, N is the number of channels inside the MCHS, η is the fin efficiency, T w , a v e denotes the average wall temperature, and T f , a v e designates the average of the fluid temperatures at the inlet and the outlet of the MCHS (see Equation (5)).
T f , a v e = T f , i n + T f , o u t 2 .
By assuming there is an adiabatic cover on top of the MCHS, h can be obtained using an iterative process, and the fin efficiency can be defined in Equation (6):
η = tanh ( m H c h ) ( m H c h ) ,
where m in Equation (7) is the fin parameter given as:
m = h k M C H S ( W f i n / 2 ) ,
where k M C H S is the thermal conductivity of the MCHS material. Next, the correction on the inner wall temperatures of the MCHS should be considered. Based on the 1D heat conduction assumption and thanks to the high thermal conductivity of the MCHS material (silicon in this work), the measured wall temperatures T m e a s are corrected as T w in Equation (8) [28,29]:
T w = T m e a s q e f f t M C H S A h e a t k M C H S ,
where t M C H S symbolizes the MCHS thickness. Moreover, the thermal conductivity values inserted in the 1D heat conduction model are evaluated based on the local temperatures via a polynomial fit for the thermal conductivity of silicon [30]:
k S i = 0.002117 · T S i 2 1.969 · T S i + 547.7 ,
where the silicon temperature T S i is in Kelvin and the fit is valid between 273 and 400 K. If the heat losses are sufficiently small and the supplied heat flux is constant, then a linear variation in the stream-wise direction x in the bulk fluid temperature T f can be obtained owing to the energy balance [28] (see Equation (10)).
T f ( x ) = T f , i n + ( T f , o u t T f , i n ) x L .
Finally, the Reynolds number R e within the MCHS can be calculated using Equation (11):
R e = m ˙ D h N A c h μ ,
where μ is the fluid viscosity and A c h denotes the cross-sectional area perpendicular to the flow direction.

2.2. Thermophysical Properties of the Nanofluids

Since the nanofluids tested for the heat transfer applications are generally relatively dilute and the nanoparticles are ultra-fine, a fluid-like behavior of the nanofluid (as a single-phase fluid) can be assumed [31]. More in particular, by assuming no slip motion between the nanoparticles (discontinuous phase) and the base fluid (continuous phase), together with the local thermal equilibrium between them, the nanofluid can be treated as a pure fluid. Consequently, the continuity, momentum, and energy equations for the pure fluids can be directly extended for the nanofluids [32]. In other words, no considerable change in the physical and chemical properties, i.e., the figure of merits, is expected using nanofluids in comparison with water as the base fluid [33].
The thermophysical properties of the nanofluids (subscript n f ) are very often derived based on the properties of the nanoparticles (subscript s ) and of the base fluid (subscript b f ) at the mean bulk temperature, i.e., T f , a v e [31,34,35,36]. The density of the nanofluid ρ n f (effective density) can be estimated using Equation (12), which is based on mixing theory:
ρ n f = ρ s ϕ + ρ b f ( 1 ϕ ) ,
where ϕ is the nanoparticle concentration in volume. For the dynamic viscosity μ n f (effective viscosity), various correlations are employed in the literature for nanofluids. The Einstein’s model [37] in Equation (13) is the most widely implemented one for dilute suspensions:
μ n f = μ b f ( 1 + 2.5 · ϕ ) .
For the heat capacity of the nanofluids C p n f , the mixing theory can also be used in the form of Equation (14) [38,39]:
C p n f = ϕ ( ρ s C p s ) + ( 1 ϕ ) ( ρ b f C p b f ) ρ n f .
The Hamilton–Crosser approximation [35] in Equation (15) can be applied for the thermal conductivity of the nanofluids k n f (effective thermal conductivity):
k n f = k s + 2 k b f 2 ϕ ( k b f k s ) k s k b f + 2 + ϕ k b f k s k b f .
The measured heat capacity and thermal conductivity values of water-based nanofluids (0.01–0.3 vol.%) are reported very close to that of water in the literature [40,41].

2.3. Experimental Setup

Figure 2 illustrates the schematic of the flow loop and its integration with a Light Extinction Spectroscopy (LES) system. The LES technique is capable of measuring the size distribution of nanoparticles in situ and in real time [42,43,44,45]. In this work, it is operated to evidence the presence of nanoparticle clusters or any loss of the nanofluid stability.
A magnetically driven compact gear pump (MICROPUMP, Inc.) circulates the fluid and comprises a pump head (GJ-N23.JF1SJ, PPS gear) and a body (I-DRIVE type 76003). Its cavity-style design offers a smooth, continuous, and pulseless fluid delivery with excellent chemical resistance. The mass flow rate is measured using a Coriolis mass flow meter (CORI-FLOW™ M54) with high accuracy and fast response. The measurement range lies between 1 kg/h to 100 kg/h, and the percentage of reading (RD) accuracy of the mass flow meter is given as ±0.2% RD for liquids. The device is calibrated with water prior to the experimental campaign ( R 2 > 0.99 ). The heating unit consists of a copper block (Goodfellow, O.F.H.C. copper with thermal conductivity of 399 W/m·K), featuring the contact area (12 × 12 mm 2 ) with the MCHS, surrounded by four heating elements (OHMITE TEH140M3R00FE, 3- Ω resistance each). The heating elements are screwed into the copper block and serially soldered to each other, i.e., the total resistance of ≈12 Ω . Then, the copper block and the heating elements are all covered with glass wool for the thermal insulation inside a PMMA frame. A thin film of high thermal conductivity paste (RS PRO Silicone Thermal Grease, 5 W/m·K) is applied between the copper block and the MCHS to minimize the thermal contact resistance at their interface.
The pressure drop across the microchannels is acquired via a differential pressure transducer (Validyne DP15, wet-wet capability) with the carrier demodulator (Validyne CD15, 10 Volts DC span). The diaphragm 3–48 (pressure range between 0 and 550 kPa) is used during the tests and is calibrated prior to the experimental campaign ( R 2 > 0.99 ). The measurement accuracy is reported as ±0.25% RD, both for liquids and gasses. The excess gas in the measurement cavities is released by the bleed screws to prevent discrepancies.
The fluid temperatures at the MCHS inlet and outlet are measured using calibrated T-type thermocouples with a diameter of 500 μ m from OMEGA Engineering (SCP-SS-020-G-2 with grounded junction). Three additional T-type thermocouples with a diameter of 200 μ m (Hyp0-33-1-t-g-60-smpw-m) are equidistantly placed over the heater surface—located at the beginning, middle, and end of the surface—to be correlated with the MCHS wall temperature via 1D heat conduction assumption. All thermocouples are calibrated in advance by using a Mercury thermometer (precision of 0.1 K) in a constant temperature oil bath (FLUKE 7320 calibration bath with a temperature range of −20–150 °C). The calibrations of each thermocouple guarantee R 2 > 0.99 .
To maintain a constant temperature at the MCHS inlet, a heat exchanger (HEX) is employed to remove excess heat from the flow loop. After evaluating various heat exchangers, borosilicate glass is chosen for its ability to prevent material loss and destabilization of the nanofluid. The upper and lower sections of the heat exchanger are connected to a thermal bath (JULABO 200f, cooling/heating circulator with an embedded pump flow capacity of 15 L/min) for temperature adjustments.
The signals, including the gear pump control, are acquired via an NI C-DAQ-9178 chassis (National Instrument). To have a constant mass flow rate, a proportional-integral-derivative (PID) controller is designed and embedded into the LabView 2018 software to adjust the pump control voltage based on the mass flow meter data to avoid misleading results due to the voltage drift of the pump.
To investigate the possible nanoparticle clustering during the heat transfer experiments, a flow-through cuvette with an optical path length of L = 100 μ m (Hellma® absorption cuvette, Suprasil® Quartz, chamber volume 6.2 μ L) is placed after the MCHS test section. Due to the fragility of the cuvette, the flow rate within the cuvette is reduced using a bypass. Additionally, the insensitivity of water transparency to temperature within the range of experimental conditions is verified by comparing light intensity at different temperatures (17–64 ° C). The data acquisition for the LES measurements is carried out using the OceanView 2.0.8 software (Ocean Insight).
The reliability and accuracy of the convective heat transfer measurements are evaluated by preliminary tests using deionized (DI) water as the working fluid. These tests allow us to determine the heat losses (limited to 15%) and minimize them by taking correct insulation precautions. Hence, this forms the basis for comparing the results with nanofluids and validates the testing methodology. To guarantee repeatability, water measurements are conducted three times under the same conditions and in a temperature-controlled laboratory, i.e., T a m b = 21 ± 1 ° C. All acquired signals also include the transient regime, but only the data within the steady state are considered for the calculations of the convective heat transfer coefficient h S S .
If the flow loop is not entirely filled or if the trapped air condenses, there appear to be some bubbles in the system. Hence, special attention is paid during the filling procedure, and the DI water is degassed in the sonic bath before the experiments. In the closed-loop system, the quantity of fluidic connectors and the pipe lengths are minimized to prevent leakages. This approach ensures using small quantities of nanofluid and simplifies the system’s cleaning process. In addition, flow within microchannels typically remains laminar, as fully turbulent conditions are rarely encountered in heat transfer applications [46]. This also assures that the structural limits of the MCHS are not exceeded due to high-pressure drops. Plus, the contribution of the conduction in the heat transfer performance for laminar flows can become more prominent compared to that of turbulent flows [26]. To avoid destabilizing the nanofluids, the supplied heat should be limited since the additives (surfactants/polymers) are typically sensitive to the operating temperature [6]. Consequently, it is reasonable to assume that the thermophysical properties of the nanofluids remain constant during the experiments.

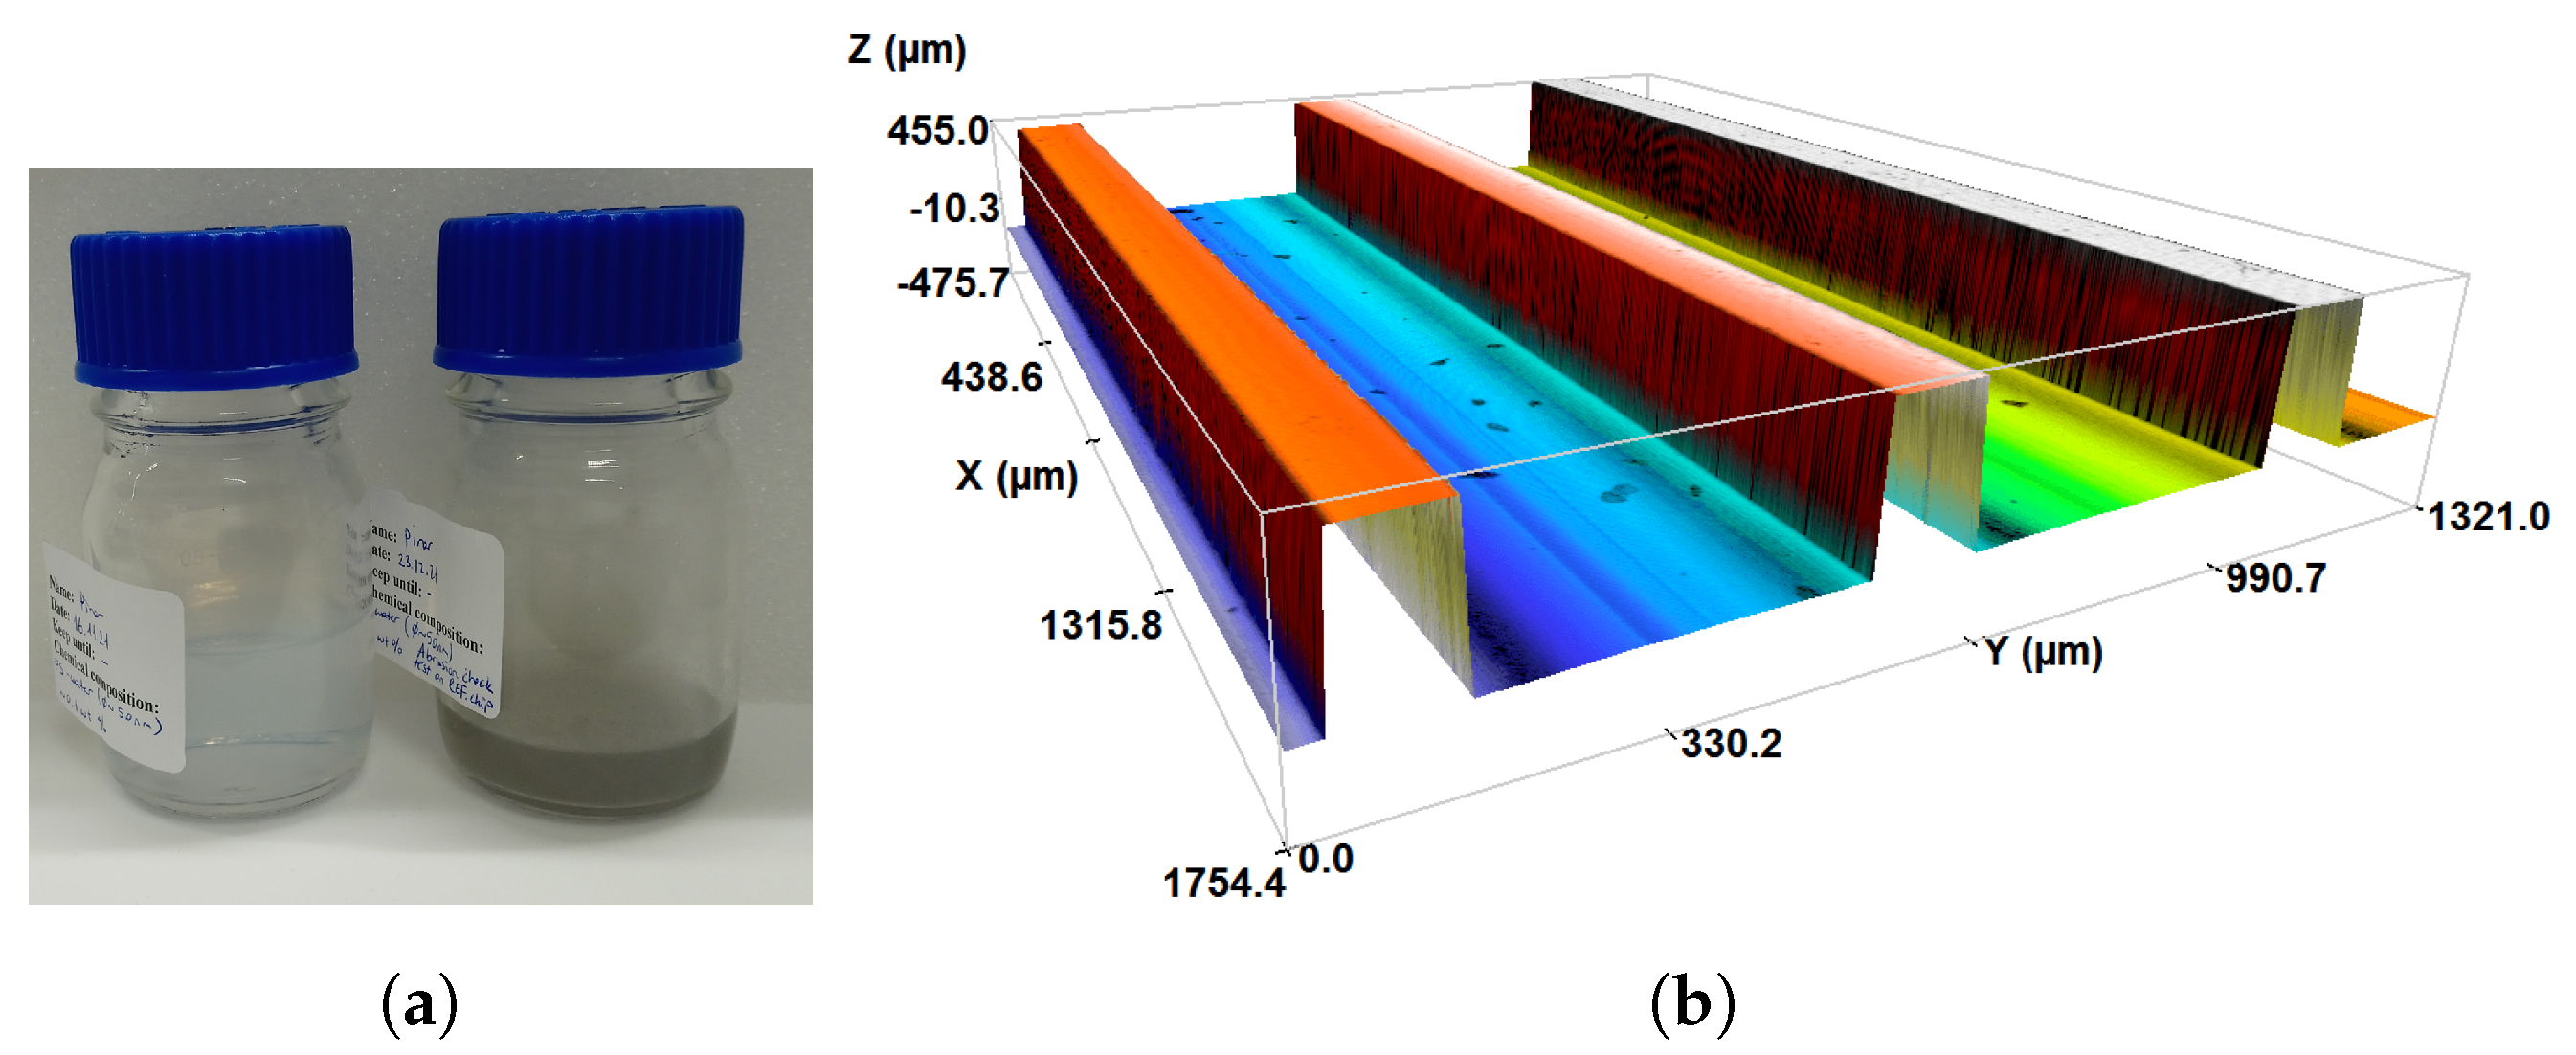
2.4. Properties of the MCHS

The MCHSs are fabricated using the deep reactive ion etching technique on pure silicon (Si). The silicon base is sealed with a glass cover by compression to provide optical access in case of particle deposition. The unit contains straight channels and plenums upstream and downstream to evenly distribute the flow among the microchannels and better mix the flow at the exit [25]. The lateral channel dimensions are precisely measured using a microscope (OLYMPUS BX51WI regular fixed stage microscope) with ×5 and ×10 lenses (see Table 1). The tolerances on the channel and fin dimensions are less than 3 μ m. The MCHS is sandwiched between insulation materials, such as a Plexiglas block and a PVC (PolyVinylChloride) cover, both possessing very low thermal conductivity (0.1–0.25 W/(m·K)) compared to that of the silicon. The only possible heat losses could happen at the glass top surface of the MCHS through natural convection and radiation. Still, the heat losses due to these two modes can be neglected due to the low wall temperature and heat transfer coefficient [47]. An insulation layer of Kapton tape is also applied to the top surface to minimize these losses further.

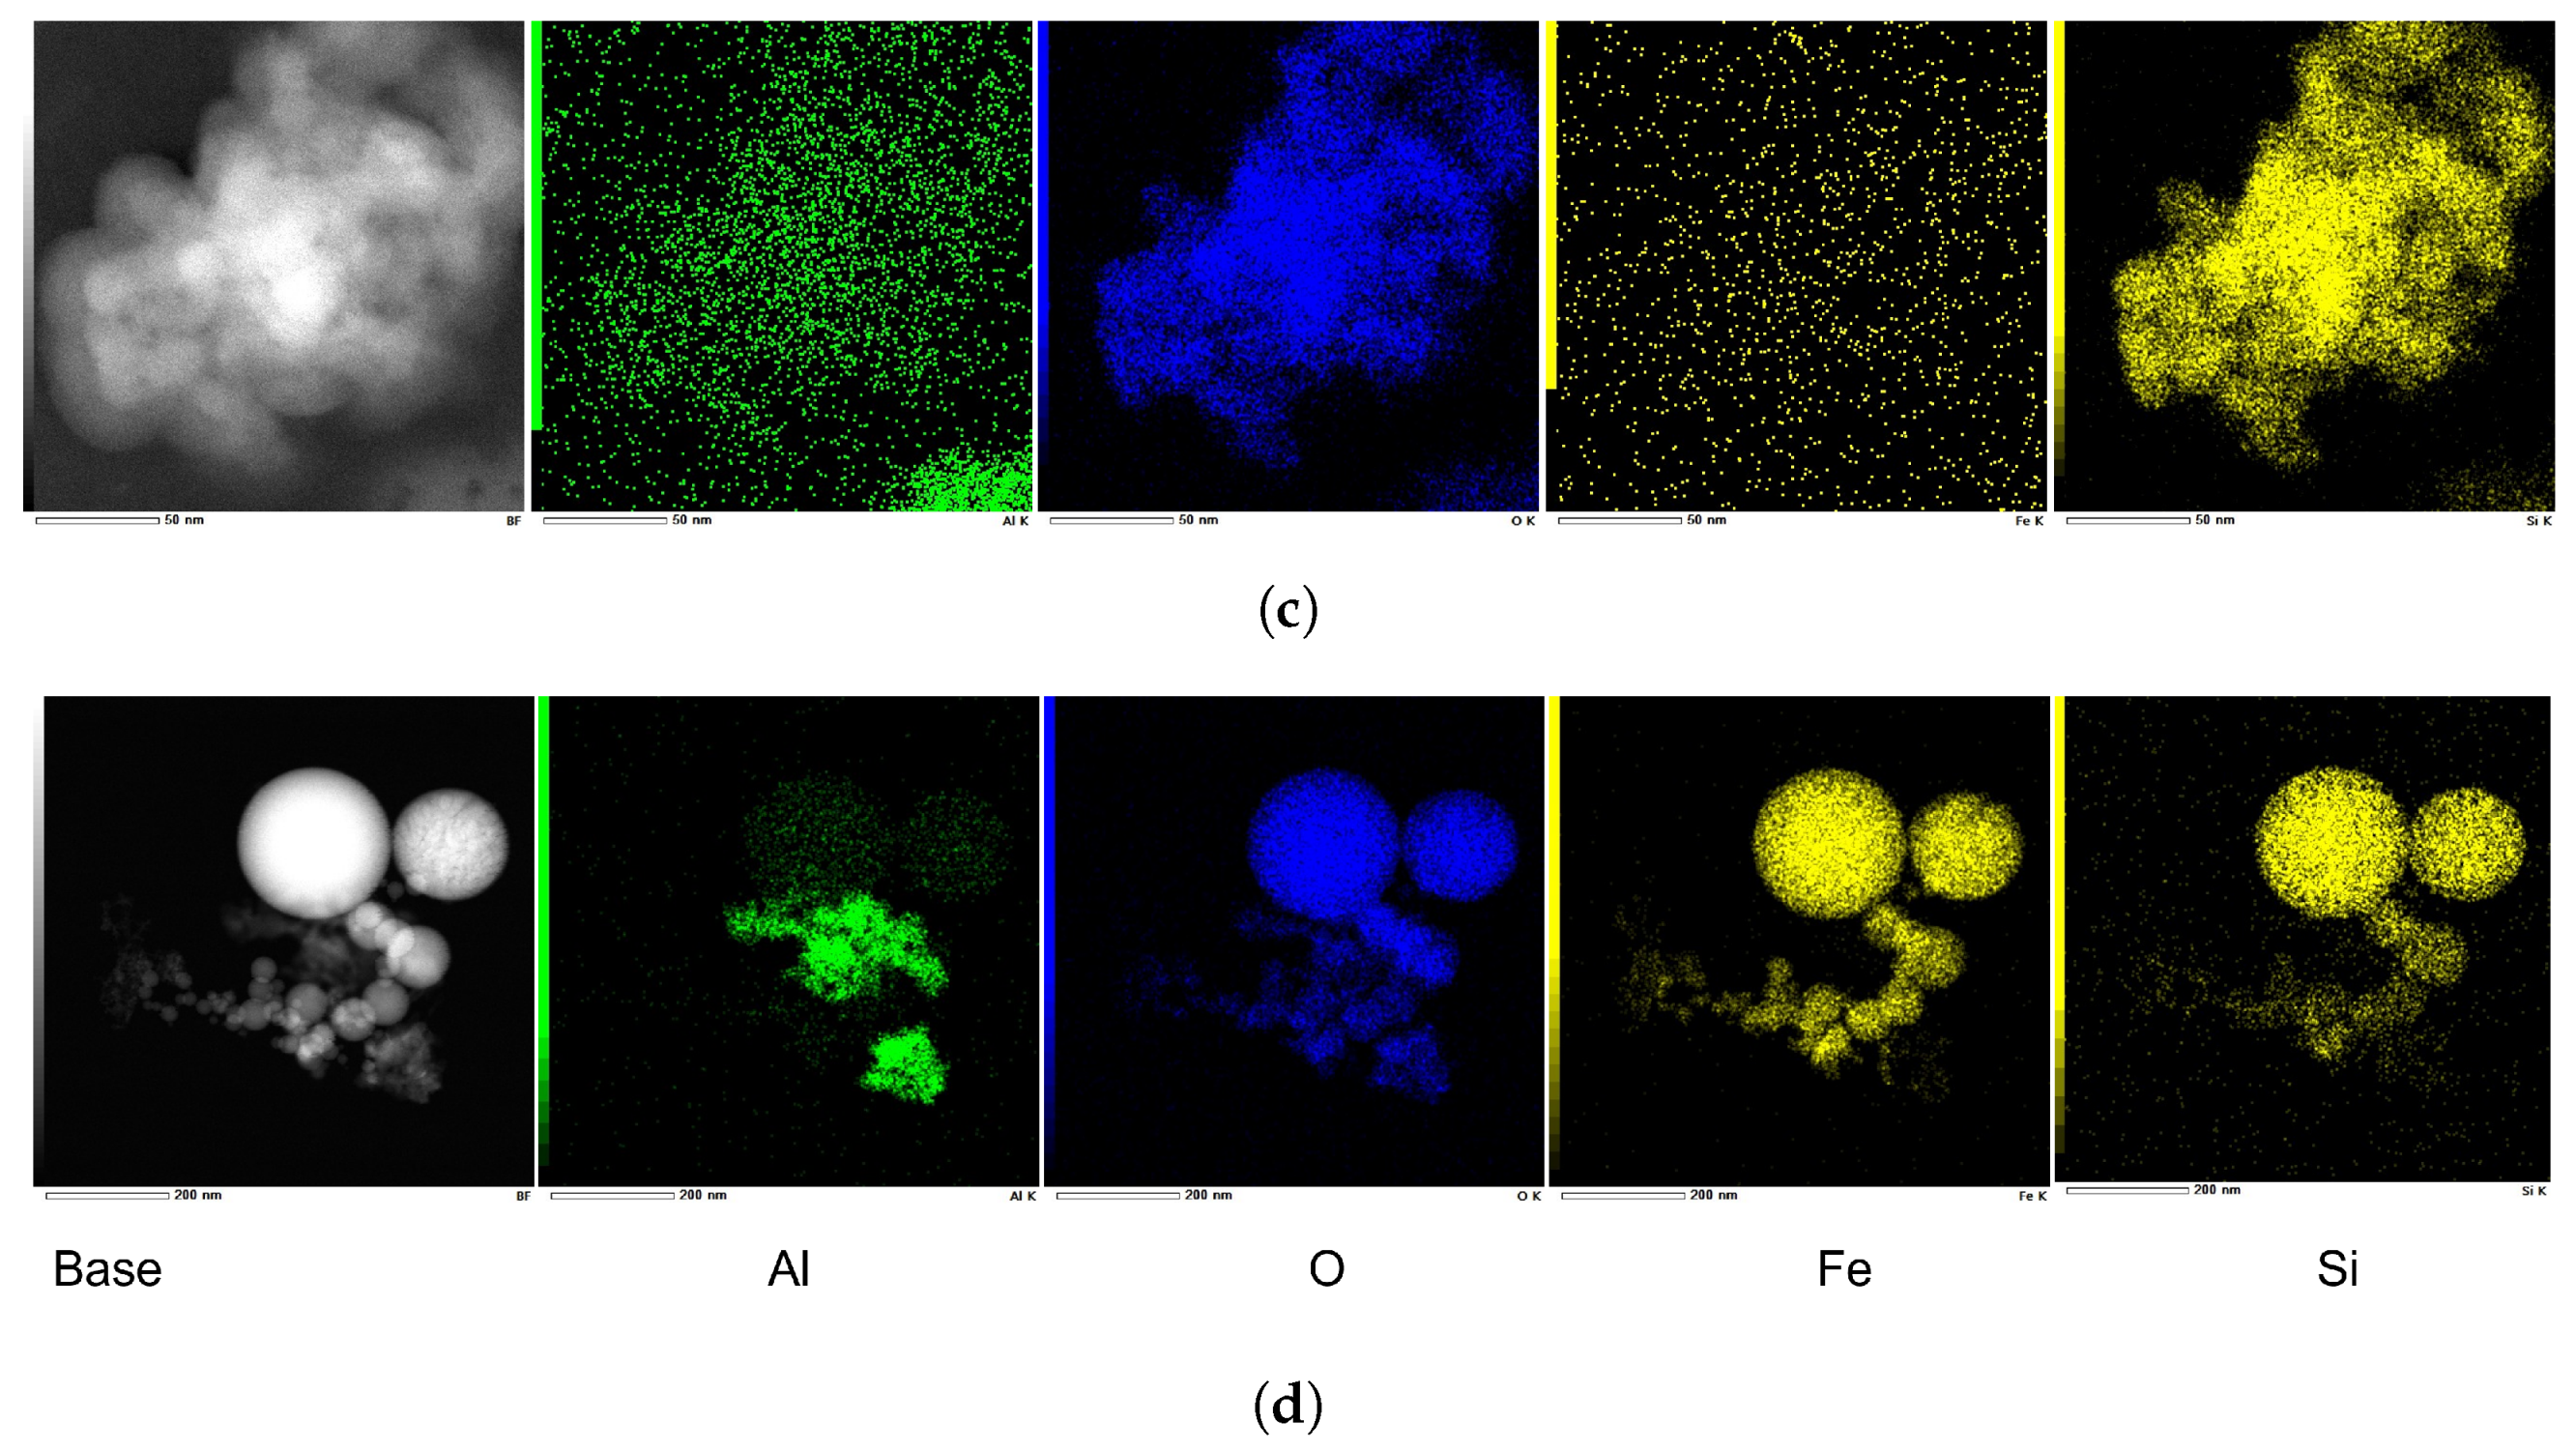
2.5. Nanofluid Preparations and Characterization

The following stable nanofluids are used in this study:
  • Al 2 O 3 -water suspension (Sigma-Aldrich, 20 wt.% in water with dispersing agents (type unknown), 30–60 nm particle size range (45 nm particle size according to TEM analysis), white color).
  • TiO 2 -water suspension (IOLITEC, Anatase, 15 wt.% in water, 5–30 nm (TEM)). It is claimed by the manufacturer that no dispersant is present and the nanoparticle stability is reached via the pH variation. Moreover, no visible sedimentation is encountered.
  • Polystyrene-water suspension (MICROMOD, Micromer, plain surface, mono-disperse: 50 nm, 10 mg/mL).
The desired concentrations are prepared by diluting samples from the primary bottle in DI water. Before the dilution, the bottle containing the most concentrated nanofluid is exposed to the vortex mixer for a couple of minutes and then is placed in the sonic bath for 15 min. After dilution, the sample is maintained in the sonic bath (VWR, Elma, S 100H) for 1 h in the sweep mode before the experiments to eliminate particle clustering and sedimentation. The measured thermophysical properties of nanofluids are listed in Table 2. The effective density is measured using a pycnometer (BlauBrand, Gay-Lussac pattern, 10.109 mL), and viscosity measurements are conducted with a rheometer (ARES-G2, double-walled Couette cell, shear rates between 1 and 100 s 1 ) with an uncertainty of ±3%. The viscosity measurements exhibit a Newtonian behavior for the tested nanofluids, consistent with the literature for concentrations ranging from 0.2 to 3 vol.% [36,48,49,50]. Given the minimal differences in the thermophysical properties of the nanofluids and the base fluid, the derived values for the figure of merit show minimal variance.

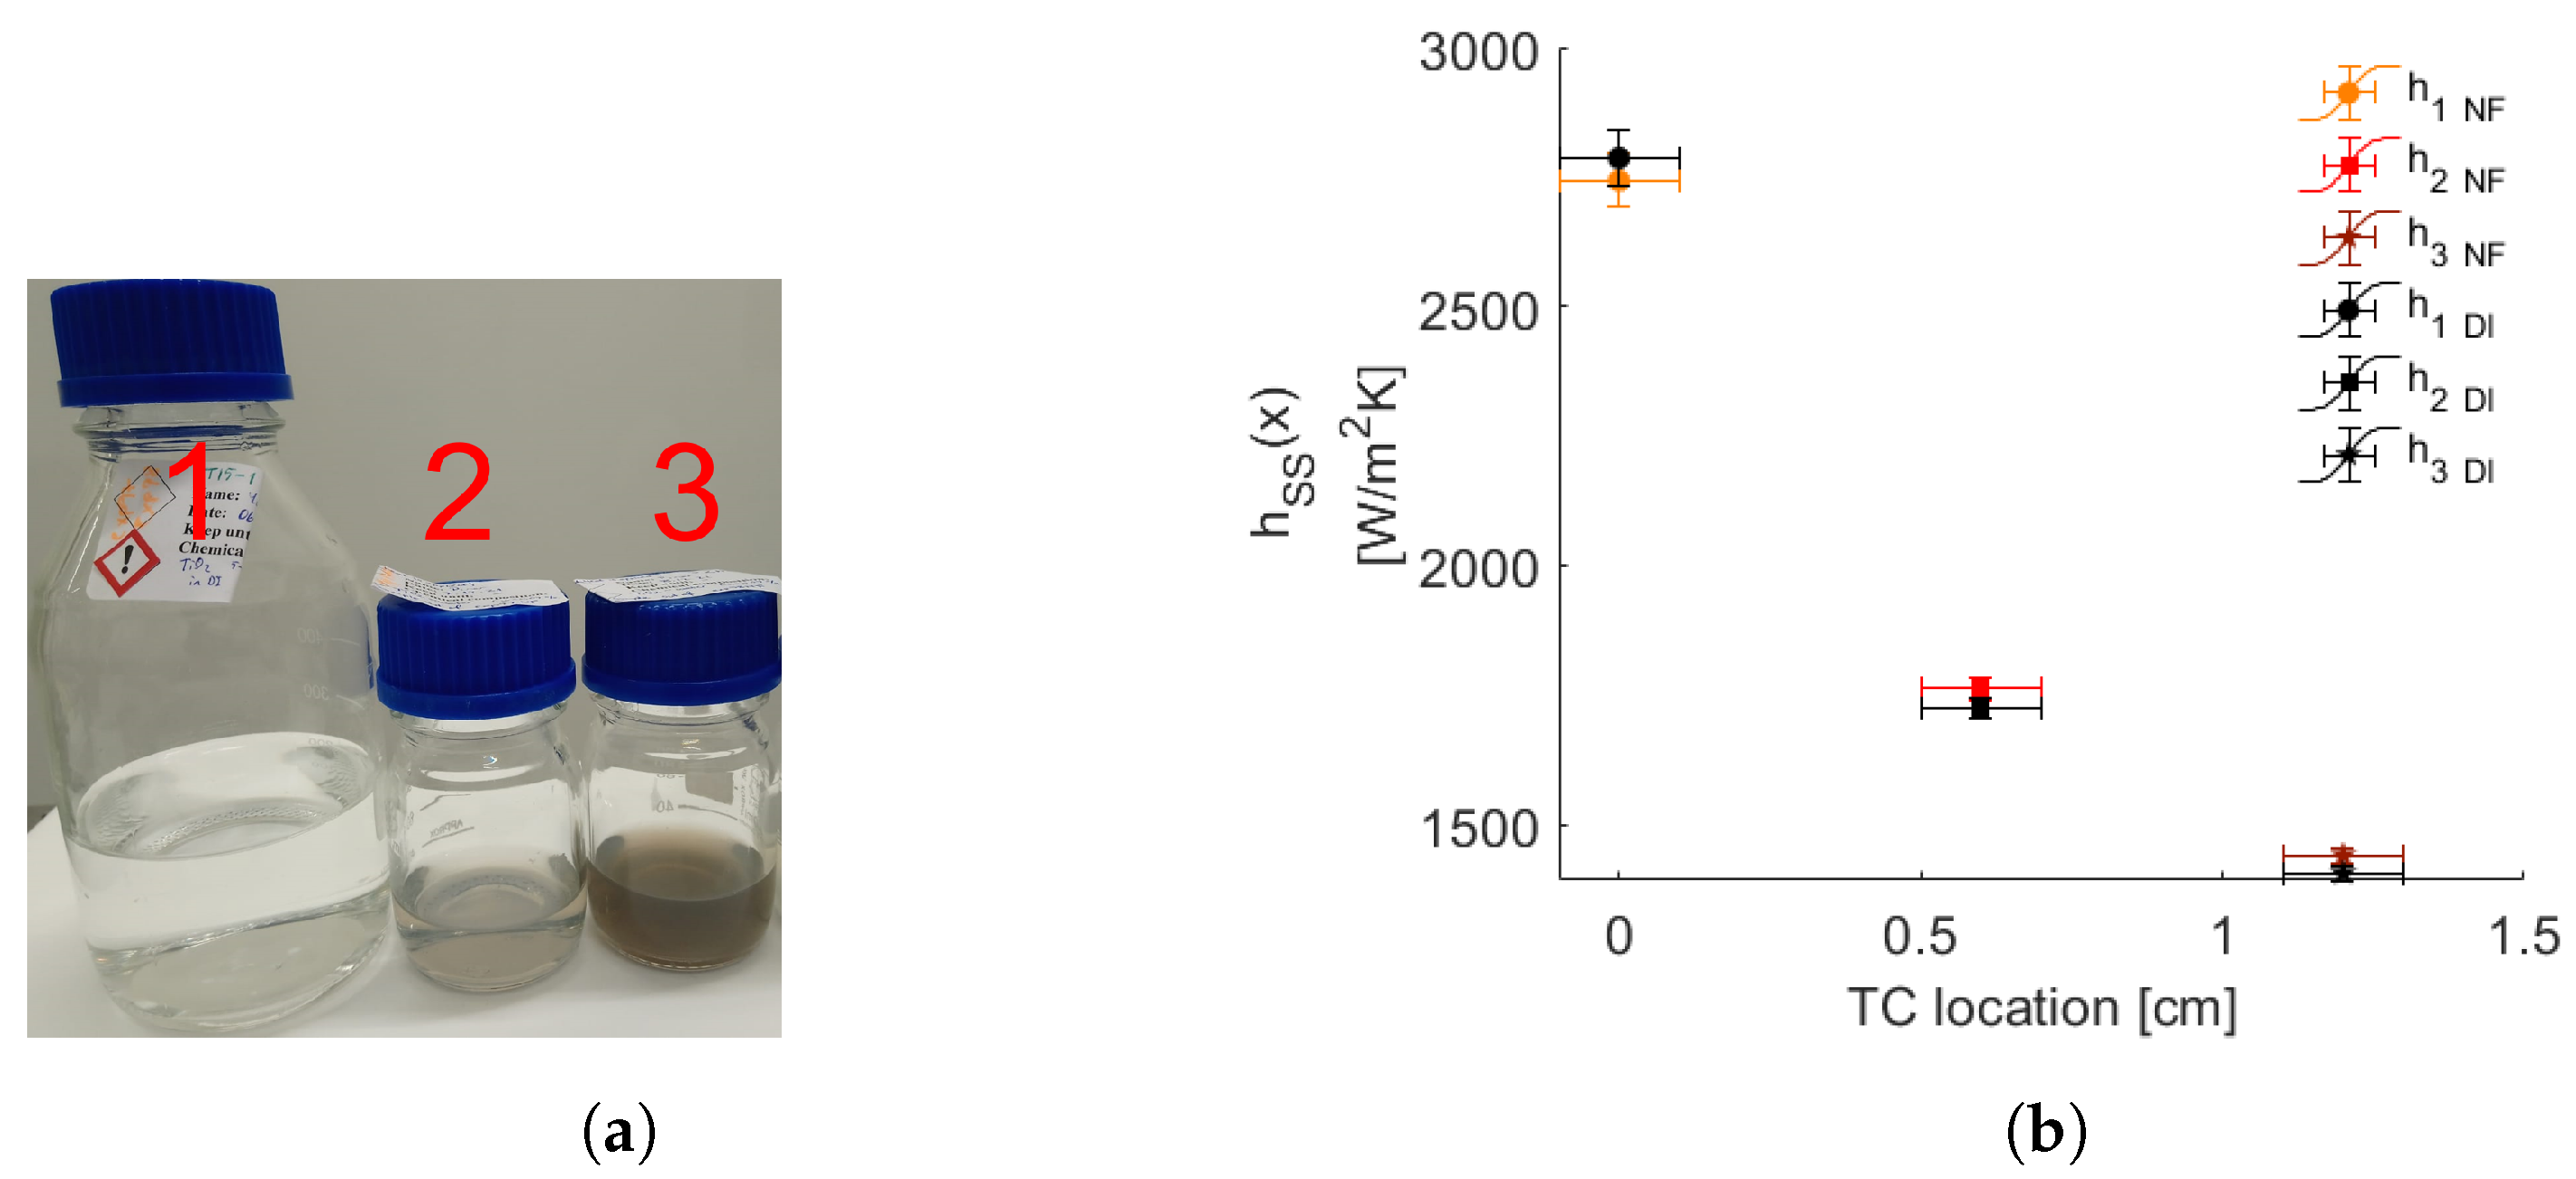
2.6. Uncertainty Analysis

The measurement uncertainties could be relatively large due to small channel dimensions and slight temperature differences between the channel walls and the fluid [26]. The uncertainties on the convective heat transfer coefficient are expected to be higher at the inlet side and gradually decrease along the channel direction [51]. The uncertainty analysis is quantitatively carried out following the methodology proposed by Moffat [52]. While the primary source of uncertainties lies in the measurements of wall and fluid temperatures, other factors are also taken into account, except for the fin efficiency. The thermocouples are calibrated to further reduce the uncertainty on h (precision of 0.1 K + 0.03 K calibration uncertainty, in total 0.11 K). Some uncertainties, such as the thickness of the thermocouple and the thickness of the thermal paste, are not explicitly addressed here but can act as a bias since geometrical uncertainties remain constant during experiments with the same MCHS. The sufficient number of samples enables us to disregard random errors in these calculations. As a result, δ h is found to be less than 5% of the convective heat transfer coefficient under steady-state conditions. Uncertainties on the Reynolds number are calculated in a similar way, with viscosity measurements being the dominant source of uncertainty. All in all, after calculating all the contributions, δ R e is determined to be less than 3%.

3. Results and Discussion

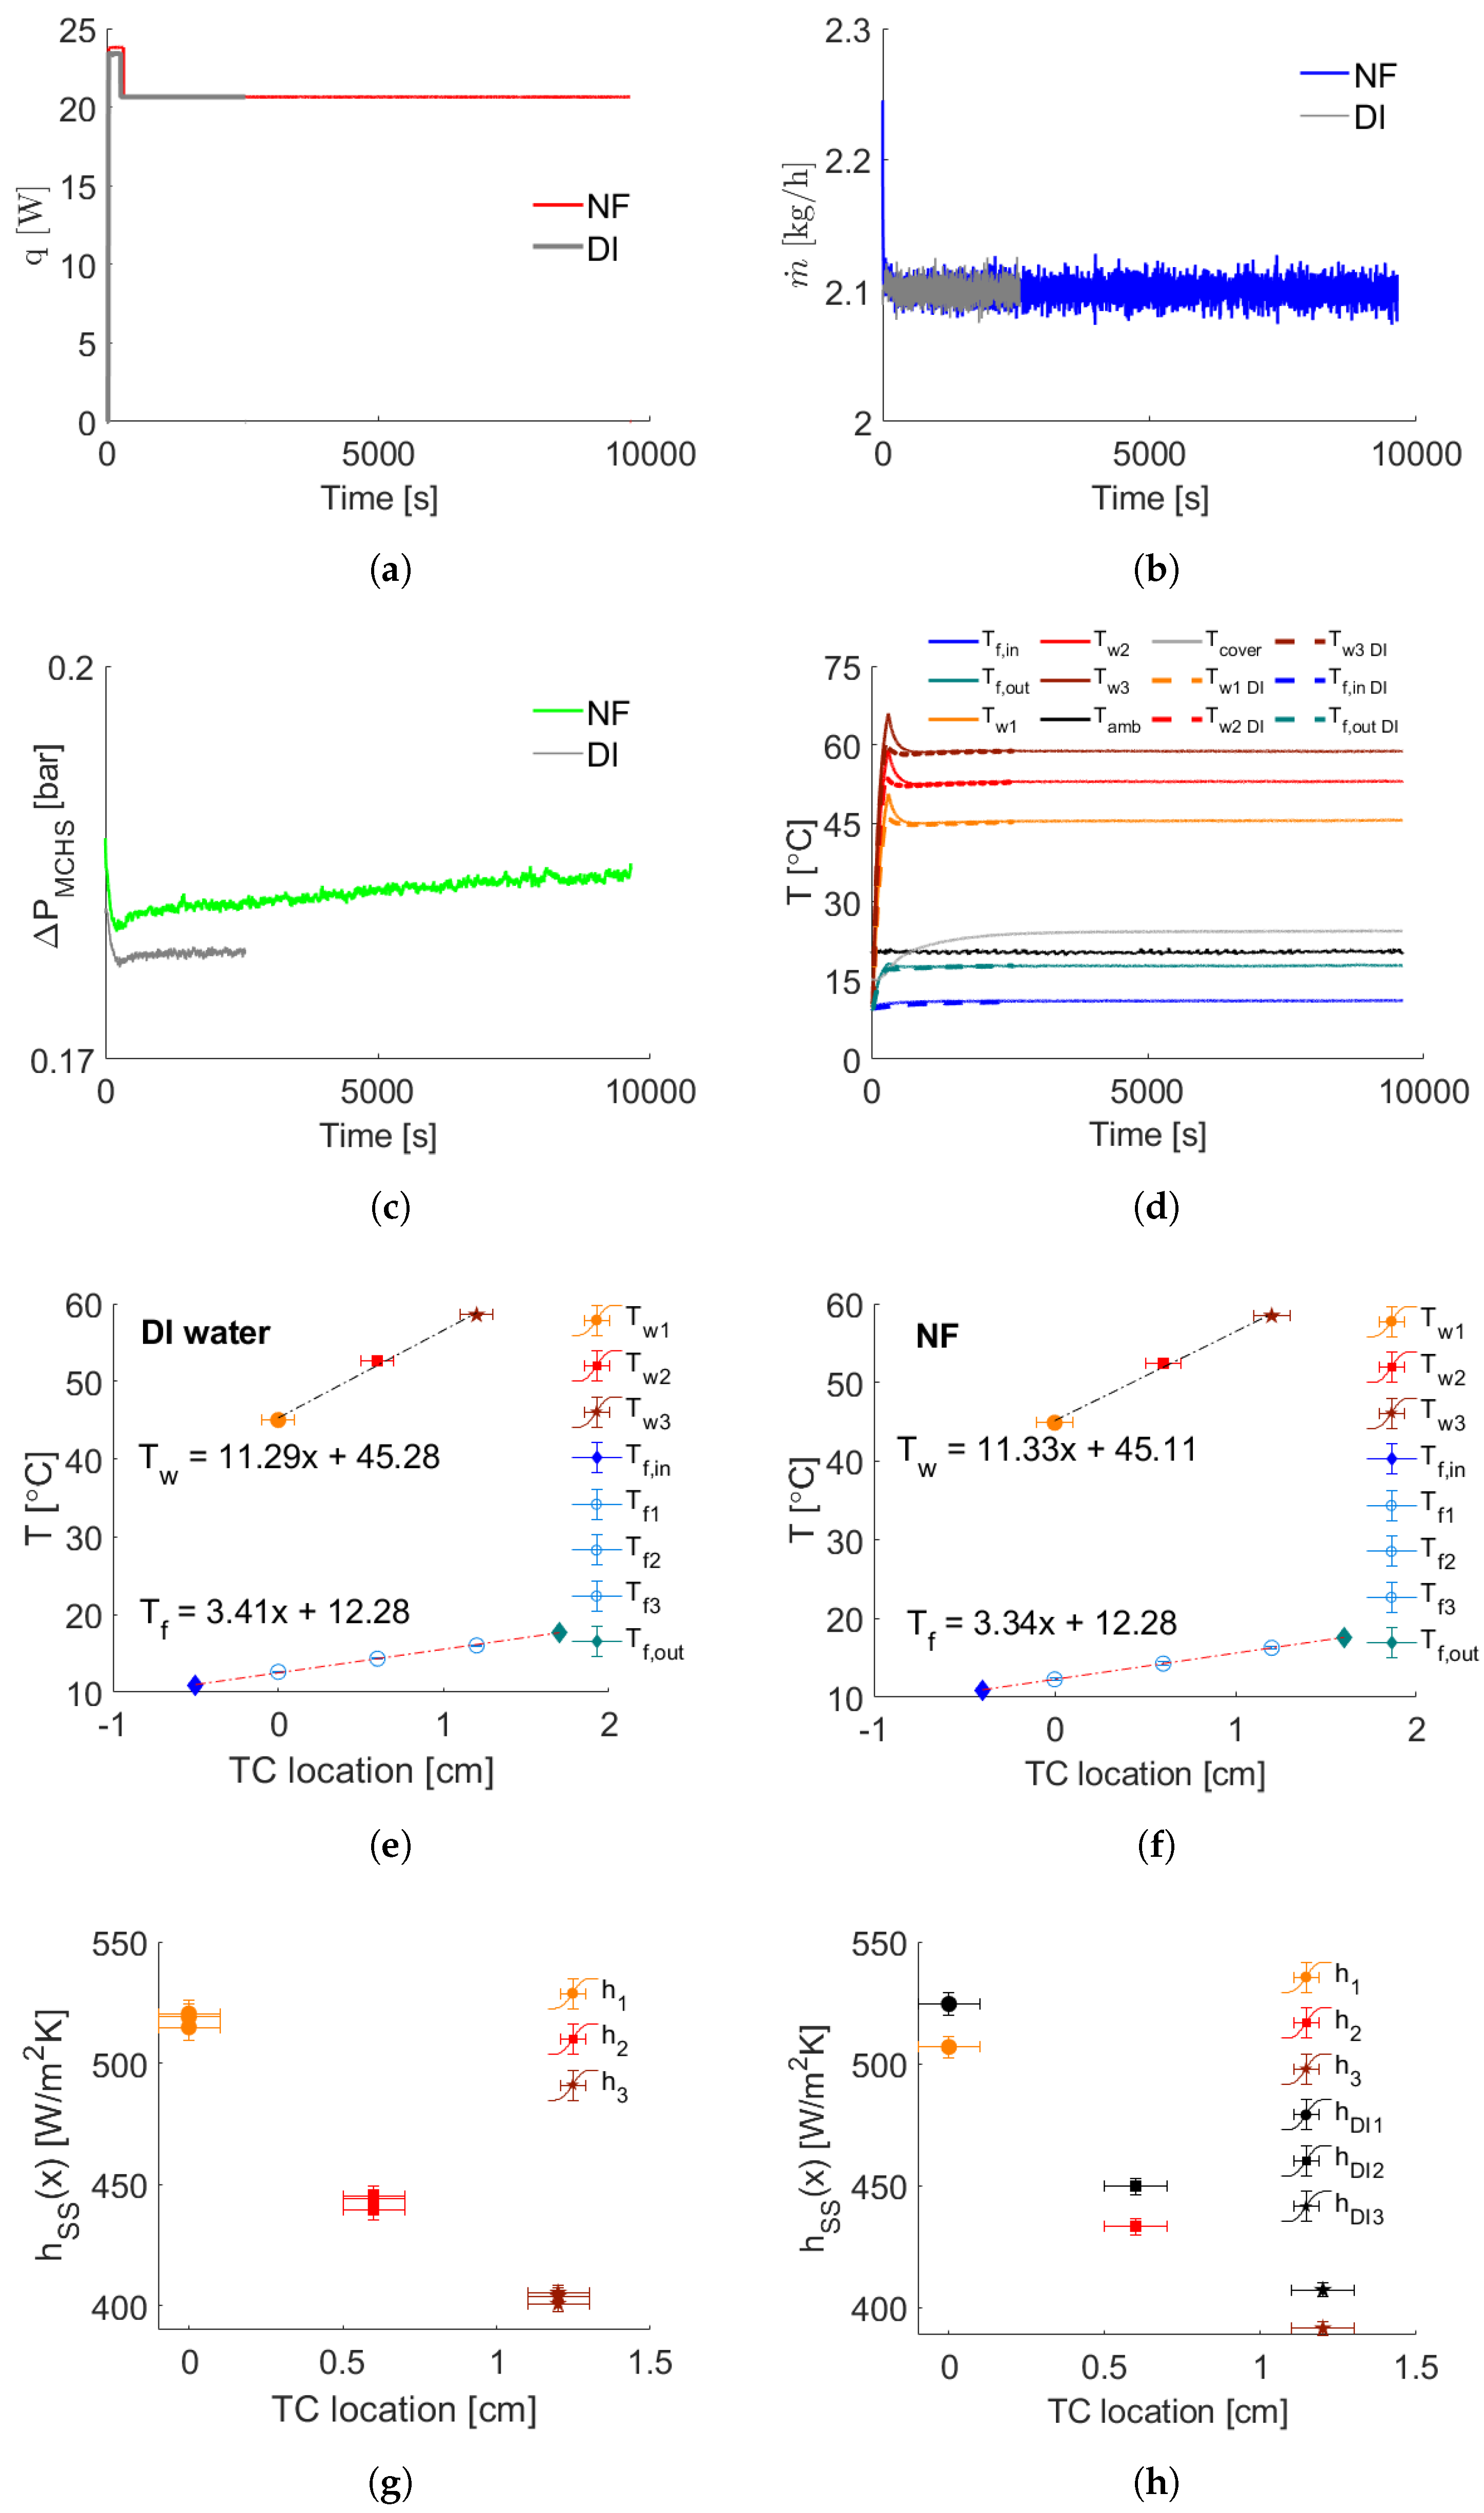
3.1. Experiments with DI Water

Figure 3 displays representative data acquired using water and compares it with the Al 2 O 3 -water nanofluid. The power supplied from the DC power supply, the mass flow rate, the pressure drop across the MCHS, and the fluid and wall temperature profiles over time are illustrated through Figure 3a–d, respectively. Initially, a higher heat pulse is applied (see Figure 3a) to shorten the transition period of the heating unit, followed by a constant value. The initial temperature of the system is arranged to be at 10 °C using the HEX, explaining why all temperature values start from that point in Figure 3a. It is noteworthy that the system reaches a steady-state condition after 1000 s for all sensor data. Figure 3e depicts the steady-state values of the fluid and wall temperatures for the case of water. As expected, the maximum wall temperature is measured downstream of the heated surface, and the fluid temperature increases while flowing through the MCHS. In Figure 3g, the steady-state local convective heat transfer coefficients h S S and the repeatability experiments are demonstrated, with the highest h S S occurring upstream.

3.2. Experiments with Al 2 O 3 -Water Nanofluid

Immediately after the water experiment and capturing of the reference light intensity for the LES technique, the flow loop is drained and dried. Subsequently, the system is quickly filled with the nanofluid, and the change in light intensity, attributed to the presence of nanoparticles, is recorded in the cuvette when the fluid is at rest. Then, the same protocol explained for the water experiments is followed. Figure 3 expresses the comparative results of the heat transfer experiment using the Al 2 O 3 -water nanofluid at 1 wt.% with respect to DI water (DI in the legends means deionized water and NF designates nanofluid). It is observed in Figure 3d that the temperature profiles of the nanofluid converge to those of water at the steady state, yielding no remarkable heat transfer enhancement. Indeed, the heat transfer performance of Al 2 O3-water nanofluid is found to be inferior to water when comparing their h S S values, as shown in Figure 3h. This observation contradicts a significant portion of the existing literature. Nevertheless, it is hard to conclude from the results listed in Table 3 whether heat transfer enhancement or deterioration occurs with nanofluids compared to water since the differences are within the uncertainty range, and no discernible trend could be captured.
The pressure drop across the MCHS for the Al 2 O 3 -water nanofluid is slightly higher than the water experiment (see Figure 3c). This observation aligns with findings in the literature, indicating that the pumping power remains within reasonable limits even at the highest tested particle concentration (1 wt.%) when compared to the water case. However, it is noteworthy that the pressure drop during the nanofluid experiment exhibits a monotonically increasing trend over time, in contrast to the constant pressure obtained in the water experiment. This discrepancy raises suspicions about internal dynamics within the flow loop, suggesting the formation and circulation of larger particles. To investigate that, the LES acquisitions are carried out throughout the heat transfer experiments, and exemplary transmittance spectra are demonstrated in Figure 4. The temporal transmittance spectra exhibit minimal variations, particularly in the shorter wavelength range. This behavior indicates the stability of the Al 2 O 3 nanoparticles in water within the testing period. Nevertheless, the LES results for the De Brouckere mean diameter within the wavelength range of 200–600 nm all give approximately D 43 = 221 nm, which vastly differs from the given particle size of 45 nm according to the company’s CoA (Certificate of Analysis).
The discoloration of the Al 2 O 3 -water nanofluid, transitioning from white to grayish, is clearly illustrated in Figure 5a,b. The discoloration becomes more pronounced when the measurement takes longer or is conducted at a higher Re number due to the greater material removal. Unfortunately, it is not possible to identify the materials present in the system by using the LES technique. To support the claim of material loss and detect the presence of removed material, the nanofluid samples obtained after the heat transfer experiment are centrifuged and dried so that SEM imaging (JEOL JSM-6010LV Low Vacuum Scanning Electron Microscope) is performed (see Figure 5c,d).
Although Figure 5d supports the presence of removed material, in which a micrometric size particle is observed, this is still not a strong proof of the presence of tribological effects. Therefore, scanning TEM imaging (sTEM) and EDS mapping (Energy Dispersive X-ray Spectroscopy) are executed (JEOL JEM-ARM200F Cs-Corrected electron microscope) on the same dried sample. EDS is a powerful technique that chemically characterizes a sample by a chemical elemental analysis [53,54]. In other words, the percentage of the existing high atomic number elements can be identified in the sample. Its working principle, Moseley’s Law, can be explained as follows. After the core electrons are ejected from the atom by the X-rays, the electron hole is filled by a higher energy electron that releases some energy during the relaxation [55]. This released energy is in the form of light, and the frequency of the released light is unique for each element in the periodic table and correlated with their atomic number.
Even though the mean diameter is reported as 45 nm (TEM) and the particles are supposed to be spherical according to the nanofluid’s CoA, the observed characteristics deviate significantly, as illustrated in the sTEM images in Figure 6a. That is, the particles have random shapes, and they do not follow the given diameter. There are even Al 2 O 3 particles with one dimension being larger than 400 nm. The EDS mapping in Figure 6b–d reveals the presence of elements, and their similarity and overlap with the base image provide insights into possible molecular combinations. For instance, the counts of Al and O elements in Figure 6b imply the presence of the Al 2 O 3 molecule in the sample. Likewise, Figure 6c mainly traces the Si and O elements, which could either be single or combined as a molecule, supporting the material loss occurring in the silicon microchannels. Last but not least, it is very likely that there is contamination, since nanorods and Fe-based materials are detected (Fe and O atoms map well with the base image in Figure 6d). Nevertheless, the abrasion phenomenon is not encountered on the pump’s gears as opposed to a literature study [8]. This might be due to the tested lower particle concentrations, harder gear material, and shorter experimenting time with respect to that study. After the tests with the Al 2 O 3 -water nanofluid, other types of water-based stable nanofluids are evaluated. To prevent material loss attributed to hardness, softer materials than silicon are selected for the nanoparticles. Consequently, anatase TiO 2 and polystyrene nanoparticles are chosen, both of which are softer than Al 2 O 3 and silicon in their bulk forms.

3.3. Experiments with TiO 2 -Water Nanofluid

These experiments are performed following the same procedure applied for the Al 2 O 3 -water nanofluid experiments. First, the LES measurements are carried out on the diluted sample (0.1 wt.%) in the cuvette when the fluid is at rest to confirm the given data by the manufacturer. According to the LES technique, the De Brouckere mean diameter D 43 = 11 nm confirms the particle mono-dispersity with a peak (complex refractive index spectra belong to [56,57]). Since these nanoparticles in the base fluid are very small (5–30 nm), the nanofluid appears transparent at the initial concentration, as well as its dilution (see bottle 1 in Figure 7a). Next, the heat transfer experiments are conducted on the MCHS with the barcode 2–1 in Table 1, at m ˙ = 25 kg/h (Re = 424), since all three 1–1 MCHSs got broken during the long measurement campaigns (>10 h). The samples collected after the heat transfer experiments are labeled as 2 and 3, in which the nanofluid discoloration and material loss are observed again. As the experiment with the sample stored in bottle 3 takes longer (≈103 min vs. ≈31 min), discoloration becomes more apparent despite having the same boundary conditions, i.e., the same Reynolds number and fluid inlet temperature. Additionally, no heat transfer enhancement is obtained for these experiments, as shown in the thermal performance comparison given in Figure 7b.
To focus only the tribological aspects of TiO 2 nanoparticles without supplied heat, another test is carried out at a higher concentration (0.5 wt.%). For the LES technique, sixteen light intensity profiles are acquired over a 2.5 h period and the resultant transmittance spectra are plotted in Figure 8. The transmittance varying at both the shorter and the longer wavelengths can already give a hint about the formation of nanoparticle clusters. Indeed, analyzing these transmittance profiles, an increasing De Brouckere mean diameter D 43 from 11 nm to 107.3 nm over time in the flow loop is observed. However, the presence of large removed materials (above the micrometric scale) cannot be captured by the LES technique, since their size falls outside its measurement range. It is also interesting to notice a strong non-linear behavior of the clustering phenomenon that should be further investigated.

3.4. Experiments with PS-Water Nanosuspension

To further examine the material loss, the polystyrene-water (PS-water) nanosuspension is tested as a last check. First, the diluted sample (0.1 wt.%) is prepared and put into the cuvette when the fluid is at rest to perform the LES measurements. The LES results give D 43 = 71 nm, which differs a bit from the documented size of 50 nm and might be due to the deviations of the input refractive indices than the real ones (complex refractive index spectra belong to [57,58]). Moreover, no heat is applied to the system as PS is a thermoplastic material. Nonetheless, material loss is still observed, as can be seen in Figure 9a. The left bottle contains the initially diluted nanosuspension, whereas the right one shows significant discoloration only after 1 h of testing. A deeper investigation of an unused MCHSs via a non-contact 3D optical profiler (SENSOFAR, S-Neox) reveals that the surface finish of the channel walls may lack needed refinement (see Figure 9b). That is, the reactive ion etching technique in silicon does not yield a completely smooth surface in our case, which may trigger the erosion–corrosion phenomena. This might explain the unexpected material loss with a PS-water nanosuspension even having a smaller hardness value. It should be noted that these profiles have to be taken directly on the silicon part of the MCHS where the glass top part is partially removed/broken. Thus, it is impossible to repeat these tests before and after the heat transfer experiments.

4. Conclusions and Remarks

An extensive experimental campaign is performed in a silicon MCHS using commercial water-based nanosuspensions. No remarkable heat transfer enhancement is obtained with the nanofluids at different particle concentrations, which contradicts a large part of the literature. Two distinct phenomena emerge during the experiments: nanoparticle clustering and tribological effects, i.e., the material loss even at low Reynolds numbers due to the combined phenomena of abrasion, erosion, and corrosion. Even though different types of nanoparticle materials are tested, the same behavior is encountered and cannot be overcome by any means for the silicon channels used in this study. In fact, the material loss could also be one of the reasons for the discrepancies seen in the literature with the use of nanofluids, even under the same or similar experimental conditions. Besides, due to the removed material in the flow loop, there might be some unintended changes in the Re number over time (e.g., some increase in the fluid viscosity over time, and some changes in the hydraulic diameter), particularly for very long experiments.
The discoloration of the nanofluid is visible to the naked eye, as well as seen under the microscope imaging. Plus, the material loss can be realized from the increase in the pressure drop during the experiments. The LES technique has also supported the formation of in situ nanoparticle clustering in the flow loop. Thus, the direct replacement of traditional coolants with nanofluids in the case of silicon microchannels with unrefined surface finish does not seem straightforward. The material loss would be unwelcome from the maintenance point of view. It could be prevented by choosing stainless steel for the microchannel material, but then the thermal conductivity would drastically drop compared to that of copper- or silicon-based microchannels. Apart from that, elaborative work on the coating of the microchannels and a better surface finish can help suppress the material loss from the channel walls. In addition, studies on pH variation can be conducted not only to have passivation for the corrosion but also to control the nanoparticle clustering. For example, even if a surfactant helps to stabilize the nanoparticles, it might not be convenient for the passivation against corrosion and may even trigger the corrosion [59]. The same idea of obtaining the base fluid from filtering would help to check the corrosion and to decouple its effect from the coupled erosion–corrosion phenomena.

Author Contributions

Conceptualization, P.E. and M.R.V.; methodology, P.E.; investigation, P.E. and Y.T.A.; software, P.E. and Y.T.A.; writing—original draft preparation, P.E., Y.T.A. and M.R.V.; writing—review and editing, P.E., Y.T.A. and M.R.V.; supervision, M.R.V. and Y.T.A.; funding acquisition, M.R.V. All authors have read and agreed to the published version of the manuscript.

Funding

This work was supported by the Interne Fondsen KU Leuven/Internal Funds KU Leuven (C3/21/029).

Institutional Review Board Statement

Not applicable.

Informed Consent Statement

Not applicable.

Data Availability Statement

Data are contained within the article.

Acknowledgments

We would like to express our gratitude for the in-kind support received from various research groups at KU Leuven: Erin Koos, Anja Vananroye, and Yanshen Zhu for the access to the SMaRT labs and SEM measurements; Jin Won Seo and Bensu Altintas Tunca for the sTEM and EDS measurements; Martine Baelmans for the microchannels; Sylvie Castagne and Balasubramanian Nagarajan for the microchannel depth measurements; and FabLab for any customized products.

Conflicts of Interest

The authors declare no conflict of interest. The funders had no role in the design of the study; in the collection, analyses, or interpretation of data; in the writing of the manuscript, or in the decision to publish the results.

References

  1. Aksoy, Y.T.; Liu, L.; Abboud, M.; Vetrano, M.R.; Koos, E. Role of Nanoparticles in Nanofluid Droplet Impact on Solid Surfaces. Langmuir 2023, 39, 12–19. [Google Scholar] [CrossRef] [PubMed]
  2. Hu, M.; Zhou, J.; Li, Y.; Zhuo, X.; Jing, D. Effects of the surface wettability of nanoparticles on the impact dynamics of droplets. Chem. Eng. Sci. 2021, 246, 116977. [Google Scholar] [CrossRef]
  3. Aksoy, Y.T.; Cornelissen, H.; Eneren, P.; Vetrano, M.R. Spray Cooling Investigation of TiO2-Water Nanofluids on a Hot Surface. Energies 2023, 16, 2938. [Google Scholar] [CrossRef]
  4. Ajeeb, W.; Murshed, S.S. Nanofluids in compact heat exchangers for thermal applications: A State-of-the-art review. Therm. Sci. Eng. Prog. 2022, 30, 101276. [Google Scholar] [CrossRef]
  5. Liang, G.; Mudawar, I. Review of single-phase and two-phase nanofluid heat transfer in macro-channels and micro-channels. Int. J. Heat Mass Transf. 2019, 136, 324–354. [Google Scholar] [CrossRef]
  6. Chen, X.; Xiong, Z.; Chen, M.; Zhou, P. Ultra-stable carbon quantum dot nanofluids for direct absorption solar collectors. Sol. Energy Mater. Sol. Cells 2022, 240, 111720. [Google Scholar] [CrossRef]
  7. Safaei, M.; Mahian, O.; Garoosi, F.; Hooman, K.; Karimipour, A.; Kazi, S.; Gharehkhani, S. Investigation of Micro- and Nanosized Particle Erosion in a 90° Pipe Bend Using a Two-Phase Discrete Phase Model. Sci. World J. 2014, 2014, 740578. [Google Scholar] [CrossRef]
  8. Celata, G.P.; D’Annibale, F.; Mariani, A.; Sau, S.; Serra, E.; Bubbico, R.; Menale, C.; Poth, H. Experimental results of nanofluids flow effects on metal surfaces. Chem. Eng. Res. Des. 2014, 92, 1616–1628. [Google Scholar] [CrossRef]
  9. Sha, J.Y.; Ge, H.H.; Wan, C.; Wang, L.T.; Xie, S.Y.; Meng, X.J.; Zhao, Y.Z. Corrosion inhibition behaviour of sodium dodecyl benzene sulphonate for brass in an Al2O3 nanofluid and simulated cooling water. Corros. Sci. 2019, 148, 123–133. [Google Scholar] [CrossRef]
  10. Eneren, P.; Aksoy, Y.T.; Vetrano, M.R. Experiments on Single-Phase Nanofluid Heat Transfer Mechanisms in Microchannel Heat Sinks: A Review. Energies 2022, 15, 2525. [Google Scholar] [CrossRef]
  11. Li, Y.; Dahhan, O.; Filipe, C.D.M.; Brennan, J.D.; Pelton, R.H. Deposited Nanoparticles Can Promote Air Clogging of Piezoelectric Inkjet Printhead Nozzles. Langmuir 2019, 35, 5517–5524. [Google Scholar] [CrossRef] [PubMed]
  12. Ajeeb, W.; Murshed, S.M.S. Pool Boiling Heat Transfer Characteristics of New and Recycled Alumina Nanofluids. Nanomaterials 2023, 13, 1040. [Google Scholar] [CrossRef] [PubMed]
  13. Devendiran, D.K.; Amirtham, V.A. A review on preparation, characterization, properties and applications of nanofluids. Renew. Sustain. Energy Rev. 2016, 60, 21–40. [Google Scholar] [CrossRef]
  14. Colangelo, G.; Favale, E.; Milanese, M.; de Risi, A.; Laforgia, D. Cooling of electronic devices: Nanofluids contribution. Appl. Therm. Eng. 2017, 127, 421–435. [Google Scholar] [CrossRef]
  15. Zhang, H.; Shao, S.; Xu, H.; Tian, C. Heat transfer and flow features of Al2O3-water nanofluids flowing through a circular microchannel - Experimental results and correlations. Appl. Therm. Eng. 2013, 61, 86–92. [Google Scholar] [CrossRef]
  16. Ajeeb, W.; da Silva, R.R.T.; Murshed, S.S. Experimental investigation of heat transfer performance of Al2O3 nanofluids in a compact plate heat exchanger. Appl. Therm. Eng. 2023, 218, 119321. [Google Scholar] [CrossRef]
  17. Marseglia, G.; De Giorgi, M.; Pontes, P.; Solipa, R.; Souza, R.; Moreira, A.; Moita, A. Enhancement of microchannel heat sink heat transfer: Comparison between different heat transfer enhancement strategies. Exp. Therm. Fluid Sci. 2024, 150, 111052. [Google Scholar] [CrossRef]
  18. Byrne, M.D.; Hart, R.A.; da Silva, A.K. Experimental thermal-hydraulic evaluation of CuO nanofluids in microchannels at various concentrations with and without suspension enhancers. Int. J. Heat Mass Transf. 2012, 55, 2684–2691. [Google Scholar] [CrossRef]
  19. Sun, Y.L.; Tang, S.Y.; Xu, Y.; Liu, Z.G.; Lu, W.Z.; Li, J.; Zuo, D.W. Study on dispersion property of sub-micro α-Al2O3 powders in water suspension by physical-chemical process. Integr. Ferroelectr. 2017, 178, 42–51. [Google Scholar] [CrossRef]
  20. Lee, J.; Mudawar, I. Assessment of the effectiveness of nanofluids for single-phase and two-phase heat transfer in micro-channels. Int. J. Heat Mass Transf. 2007, 50, 452–463. [Google Scholar] [CrossRef]
  21. Farhana, K.; Kadirgama, K.; Rahman, M.; Ramasamy, D.; Noor, M.; Najafi, G.; Samykano, M.; Mahamude, A. Improvement in the performance of solar collectors with nanofluids—A state-of-the-art review. Nano-Struct. Nano-Objects 2019, 18, 100276. [Google Scholar] [CrossRef]
  22. Akram, N.; Sadri, R.; Kazi, S.N.; Zubir, M.N.M.; Ridha, M.; Ahmed, W.; Soudagar, M.E.M.; Arzpeyma, M. A comprehensive review on nanofluid operated solar flat plate collectors. J. Therm. Anal. Calorim. 2020, 139, 1309–1343. [Google Scholar] [CrossRef]
  23. Alawi, O.A.; Kamar, H.M.; Mallah, A.; Mohammed, H.A.; Kazi, S.; Che Sidik, N.A.; Najafi, G. Nanofluids for flat plate solar collectors: Fundamentals and applications. J. Clean. Prod. 2021, 291, 125725. [Google Scholar] [CrossRef]
  24. Sommers, A.D.; Yerkes, K.L. Experimental investigation into the convective heat transfer and system-level effects of Al2O3-propanol nanofluid. J. Nanoparticle Res. 2010, 12, 1003–1014. [Google Scholar] [CrossRef]
  25. Qu, W.; Mudawar, I. Experimental and numerical study of pressure drop and heat transfer in a single-phase micro-channel heat sink. Int. J. Heat Mass Transf. 2002, 45, 2549–2565. [Google Scholar] [CrossRef]
  26. Peyghambarzadeh, S.; Hashemabadi, S.; Chabi, A.; Salimi, M. Performance of water based CuO and Al2O3 nanofluids in a Cu-Be alloy heat sink with rectangular microchannels. Energy Convers. Manag. 2014, 86, 28–38. [Google Scholar] [CrossRef]
  27. Sarafraz, M.; Nikkhah, V.; Nakhjavani, M.; Arya, A. Thermal performance of a heat sink microchannel working with biologically produced silver-water nanofluid: Experimental assessment. Exp. Therm. Fluid Sci. 2018, 91, 509–519. [Google Scholar] [CrossRef]
  28. Renfer, A.; Tiwari, M.K.; Tiwari, R.; Alfieri, F.; Brunschwiler, T.; Michel, B.; Poulikakos, D. Microvortex-enhanced heat transfer in 3D-integrated liquid cooling of electronic chip stacks. Int. J. Heat Mass Transf. 2013, 65, 33–43. [Google Scholar] [CrossRef]
  29. Sarafraz, M.; Nikkhah, V.; Nakhjavani, M.; Arya, A. Fouling formation and thermal performance of aqueous carbon nanotube nanofluid in a heat sink with rectangular parallel microchannel. Appl. Therm. Eng. 2017, 123, 29–39. [Google Scholar] [CrossRef]
  30. Bejan, A.; Kraus, A. Heat Transfer Handbook; Number v. 1 in Heat Transfer Handbook; Wiley: Hoboken, NJ, USA, 2003. [Google Scholar]
  31. Xuan, Y.; Roetzel, W. Conceptions for heat transfer correlation of nanofluids. Int. J. Heat Mass Transf. 2000, 43, 3701–3707. [Google Scholar] [CrossRef]
  32. Buongiorno, J. Convective Transport in Nanofluids. J. Heat Transf. 2005, 128, 240–250. [Google Scholar] [CrossRef]
  33. Sivakumar, A.; Alagumurthi, N.; Senthilvelan, T. Experimental investigation of forced convective heat transfer performance in nanofluids of Al2O3/water and CuO/water in a serpentine shaped micro channel heat sink. Heat Mass Transf. 2016, 52, 1265–1274. [Google Scholar] [CrossRef]
  34. Khanafer, K.; Vafai, K.; Lightstone, M. Buoyancy-driven heat transfer enhancement in a two-dimensional enclosure utilizing nanofluids. Int. J. Heat Mass Transf. 2003, 46, 3639–3653. [Google Scholar] [CrossRef]
  35. Hamilton, R.L.; Crosser, O.K. Thermal Conductivity of Heterogeneous Two-Component Systems. Ind. Eng. Chem. Fundam. 1962, 1, 187–191. [Google Scholar] [CrossRef]
  36. Zeinali Heris, S.; Etemad, S.; Nasr Esfahany, M. Experimental investigation of oxide nanofluids laminar flow convective heat transfer. Int. Commun. Heat Mass Transf. 2006, 33, 529–535. [Google Scholar] [CrossRef]
  37. Einstein, A. Investigations on the Theory of Brownian Movement; Dover Publication: New York, NY, USA, 1956; pp. 1–18. [Google Scholar]
  38. O’Hanley, H.; Buongiorno, J.; McKrell, T.; wen Hu, L. Measurement and Model Validation of Nanofluid Specific Heat Capacity with Differential Scanning Calorimetry. Adv. Mech. Eng. 2012, 4, 181079. [Google Scholar] [CrossRef]
  39. Aksoy, Y.T.; Zhu, Y.; Eneren, P.; Koos, E.; Vetrano, M.R. The Impact of Nanofluids on Droplet/Spray Cooling of a Heated Surface: A Critical Review. Energies 2021, 14, 80. [Google Scholar] [CrossRef]
  40. Aksoy, Y.; Castanet, G.; Eneren, P.; García-Wong, A.; Czerwiec, T.; Caballina, O.; Vetrano, M. Experimental investigation of the influence of nanoparticles on droplet spreading dynamics and heat transfer during early stage cooling. Exp. Therm. Fluid Sci. 2023, 149, 111023. [Google Scholar] [CrossRef]
  41. Hwang, K.S.; Jang, S.P.; Choi, S.U. Flow and convective heat transfer characteristics of water-based Al2O3 nanofluids in fully developed laminar flow regime. Int. J. Heat Mass Transf. 2009, 52, 193–199. [Google Scholar] [CrossRef]
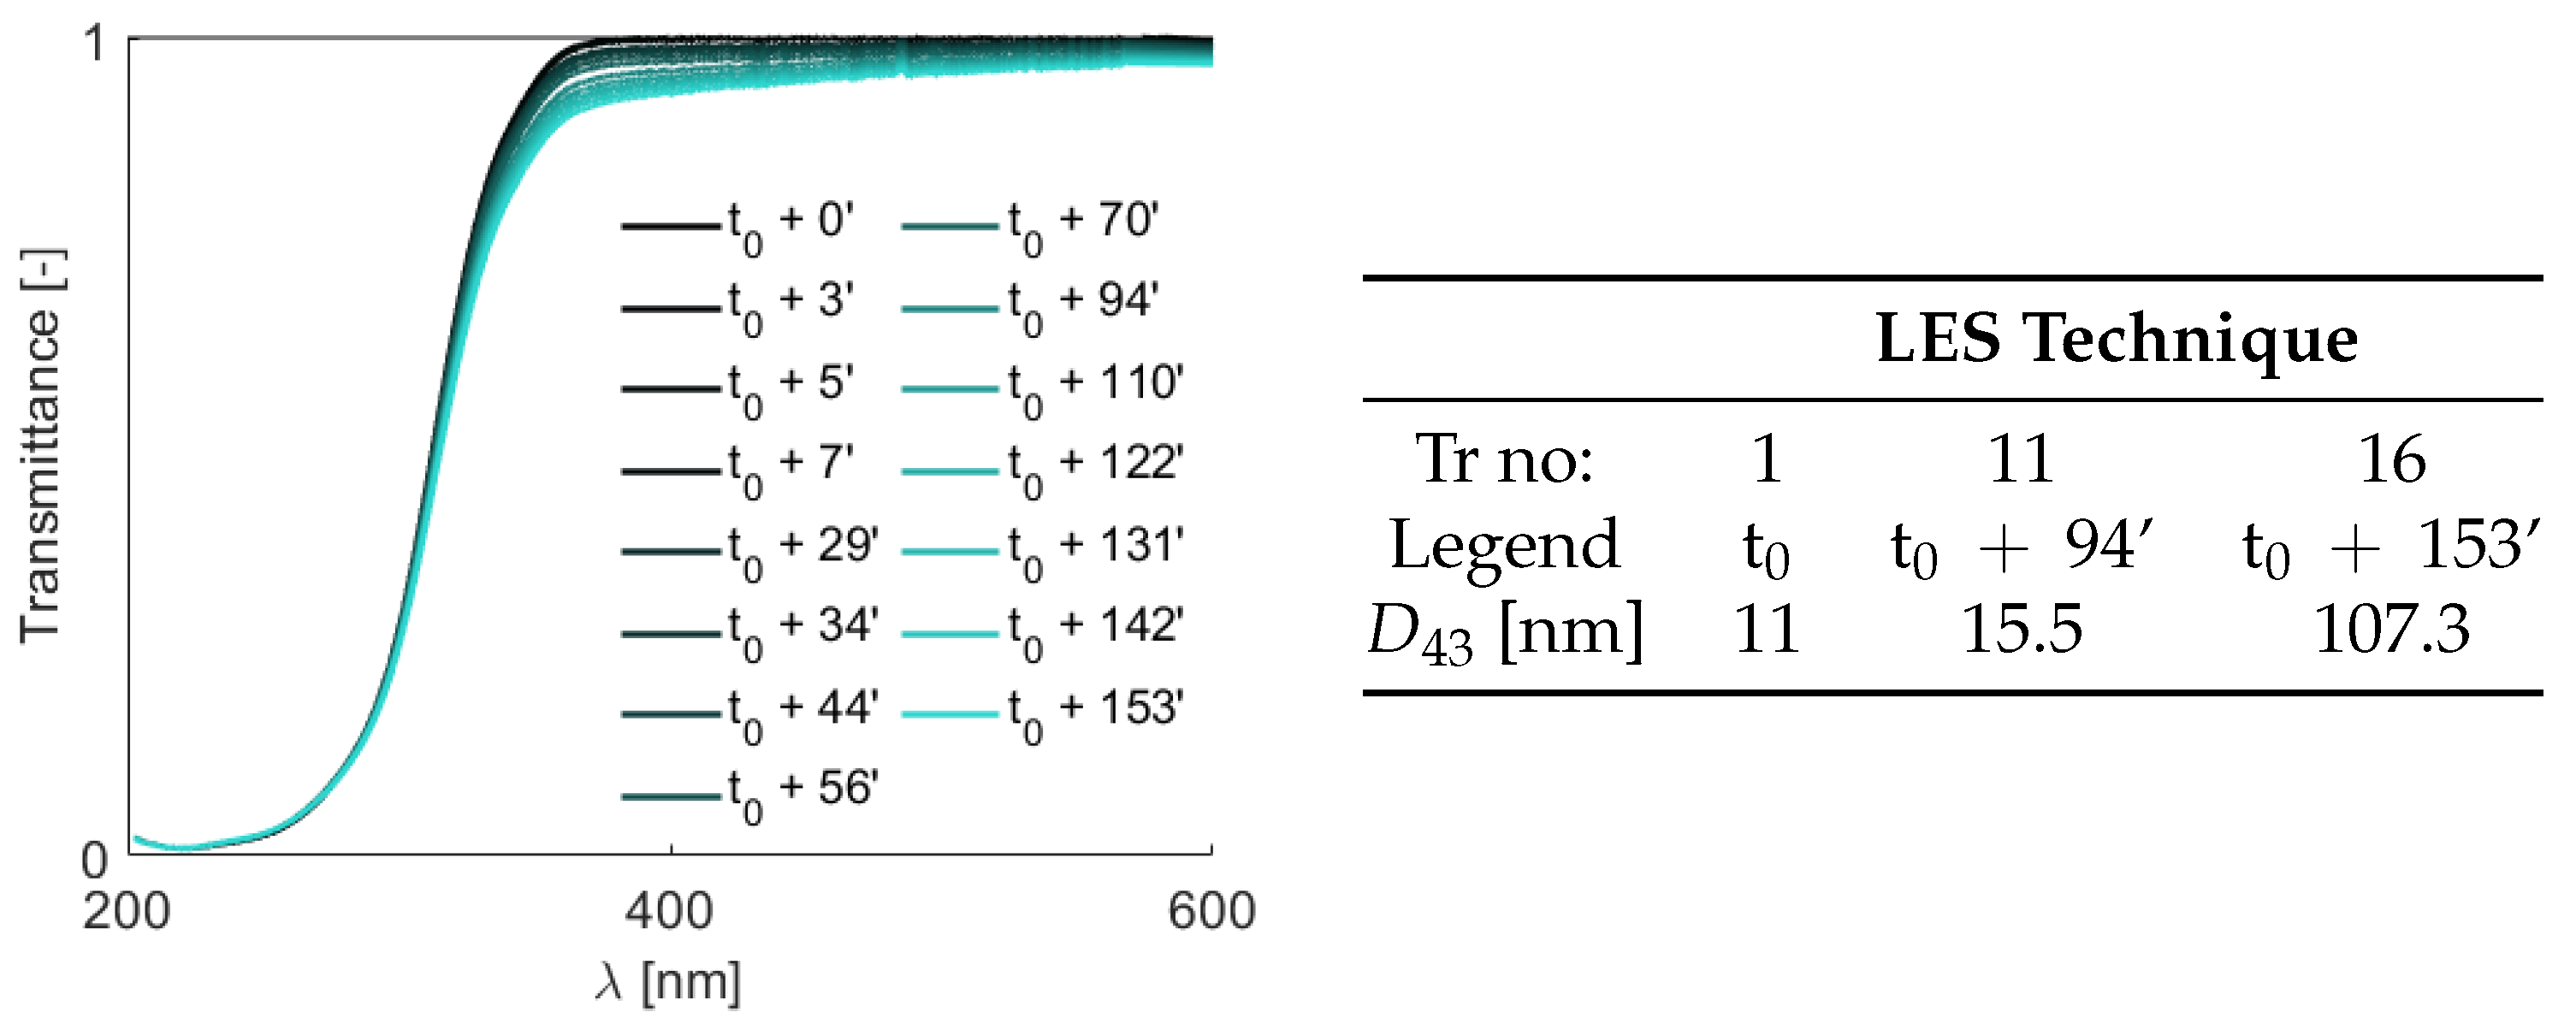
  42. Barbosa, S.; Onofri, F.R.A.; Couëdel, L.; Woźniak, M.; Montet, C.; Pelcé, C.; Arnas, C.; Boufendi, L.; Kovacevic, E.; Berndt, J.; et al. An introduction to light extinction spectrometry as a diagnostic for dust particle characterisation in dusty plasmas. J. Plasma Phys. 2016, 82, 615820403. [Google Scholar] [CrossRef]
  43. Horvath, I.; Colinet, P.; Vetrano, M. Assessment of the light extinction spectroscopy technique for submicron particle characterization. Powder Technol. 2016, 291, 375–382. [Google Scholar] [CrossRef]
  44. Eneren, P.; Aksoy, Y.T.; Zhu, Y.; Koos, E.; Vetrano, M.R. Light extinction spectroscopy applied to polystyrene colloids: Sensitivity to complex refractive index uncertainties and to noise. J. Quant. Spectrosc. Radiat. Transf. 2021, 261, 107494. [Google Scholar] [CrossRef]
  45. Eneren, P.; Sergievskaya, A.; Aksoy, Y.T.; Umek, P.; Konstantinidis, S.; Vetrano, M.R. Time-resolved in situ nanoparticle size evolution during magnetron sputtering onto liquids. Nanoscale Adv. 2023, 5, 4809–4818. [Google Scholar] [CrossRef] [PubMed]
  46. Bergman, T. Effect of reduced specific heats of nanofluids on single phase, laminar internal forced convection. Int. J. Heat Mass Transf. 2009, 52, 1240–1244. [Google Scholar] [CrossRef]
  47. Chein, R.; Chuang, J. Experimental microchannel heat sink performance studies using nanofluids. Int. J. Therm. Sci. 2007, 46, 57–66. [Google Scholar] [CrossRef]
  48. Anoop, K.; Sadr, R. nPIV velocity measurement of nanofluids in the near-wall region of a microchannel. Nanoscale Res. Lett. 2012, 7, 284. [Google Scholar] [CrossRef] [PubMed]
  49. Halelfadl, S.; Adham, A.M.; Mohd-Ghazali, N.; Maré, T.; Estellé, P.; Ahmad, R. Optimization of thermal performances and pressure drop of rectangular microchannel heat sink using aqueous carbon nanotubes based nanofluid. Appl. Therm. Eng. 2014, 62, 492–499. [Google Scholar] [CrossRef]
  50. Aksoy, Y.; Eneren, P.; Koos, E.; Vetrano, M. Spreading-splashing transition of nanofluid droplets on a smooth flat surface. J. Colloid Interface Sci. 2022, 606, 434–443. [Google Scholar] [CrossRef]
  51. Jung, J.Y.; Oh, H.S.; Kwak, H.Y. Forced convective heat transfer of nanofluids in microchannels. Int. J. Heat Mass Transf. 2009, 52, 466–472. [Google Scholar] [CrossRef]
  52. Moffat, R.J. Describing the uncertainties in experimental results. Exp. Therm. Fluid Sci. 1988, 1, 3–17. [Google Scholar] [CrossRef]
  53. Lapauw, T.; Tunca, B.; Potashnikov, D.; Pesach, A.; Ozeri, O.; Vleugels, J.; Lambrinou, K. The double solid solution (Zr, Nb)2(Al, Sn)C MAX phase: A steric stability approach. Sci. Rep. 2018, 8, 12801. [Google Scholar] [CrossRef] [PubMed]
  54. Tunca, B.; Lapauw, T.; Delville, R.; Neuville, D.R.; Hennet, L.; Thiaudière, D.; Ouisse, T.; Hadermann, J.; Vleugels, J.; Lambrinou, K. Synthesis and Characterization of Double Solid Solution (Zr,Ti)2(Al,Sn)C MAX Phase Ceramics. Inorg. Chem. 2019, 58, 6669–6683. [Google Scholar] [CrossRef] [PubMed]
  55. Goldstein, J.; Newbury, D.; Joy, D.; Lyman, C.; Echlin, P.; Lifshin, E.; Sawyer, L.; Michael, J. Scanning Electron Microscopy and X-ray Microanalysis; Springer: New York, NY, USA, 2003; Volume XIX, ISBN 0306472929. [Google Scholar]
  56. Siefke, T.; Kroker, S.; Pfeiffer, K.; Puffky, O.; Dietrich, K.; Franta, D.; Ohlídal, I.; Szeghalmi, A.; Kley, E.B.; Tünnermann, A. Materials Pushing the Application Limits of Wire Grid Polarizers further into the Deep Ultraviolet Spectral Range. Adv. Opt. Mater. 2016, 4, 1780–1786. [Google Scholar] [CrossRef]
  57. Segelstein, D.J. The Complex Refractive Index of Water. Master’s Thesis, University of Missouri-Kansas City, Kansas City, MI, USA, 1981. [Google Scholar]
  58. French, R.; Winey, K.; Yang, M.; Qiu, W. Optical Properties and van der Waals-London Dispersion Interactions of Polystyrene Determined by Vacuum Ultraviolet Spectroscopy and Spectroscopic Ellipsometry. Aust. J. Chem. 2007, 60, 251–263. [Google Scholar] [CrossRef]
  59. Bubbico, R.; Celata, G.P.; D’Annibale, F.; Mazzarotta, B.; Menale, C. Experimental analysis of corrosion and erosion phenomena on metal surfaces by nanofluids. Chem. Eng. Res. Des. 2015, 104, 605–614. [Google Scholar] [CrossRef]
Figure 1. Schematic of a straight rectangular MCHS (left) and an isolated channel (right).
Energies 16 07885 g001
Figure 2. Schematic of the closed flow loop, in which heat transfer experiments take place, coupled with the LES measurements.
Energies 16 07885 g002
Figure 3. Heat transfer experiment on 1–1 MCHS at Re = 27 using Al 2 O 3 -water NF at 1 wt.%, wrt. DI water. (a) The supplied heat q, (b) the mass flow rate m ˙ , (c) the pressure drop across the MCHS Δ P , (d) the temperature profiles T (dashed lines: DI water), (ef) the wall and fluid temperature values at steady state for DI water and NF, respectively, (g) repeatability on DI water for steady-state convective heat transfer coefficients h S S , and (h) their comparison with NF.
Energies 16 07885 g003
Figure 4. Temporal transmittance profiles of the the Al 2 O 3 -water nanofluid (1 wt.%) as a function of wavelength λ , with the legend indicating the time of each measurement relative to the initial one.
Energies 16 07885 g004
Figure 5. The abrasion–erosion–corrosion phenomena and discoloration of the Al 2 O 3 -water nanofluid after heat transfer experiments. (a) Samples from experiments with different testing durations, (b) sedimentation in the same bottles after 4 h, (c) SEM imaging of chunks of Al 2 O 3 nanoparticles, and (d) an example of the removed material.
Energies 16 07885 g005
Figure 6. (a) sTEM imaging after the heat transfer experiment with the Al 2 O 3 -water nanofluid. (bd) EDS elemental mapping for the existing elements on the dried sample, including Al, O, Fe, and Si.
Energies 16 07885 g006aEnergies 16 07885 g006b
Figure 7. (a) The presence of discoloration and material loss due to the TiO 2 -water nanofluids (0.1 wt.%), which are circulated in the flow loop for heat transfer experiments. Bottle 1: diluted TiO 2 -water nanofluid before heat transfer experiments. Bottle 2 and 3: samples after heat transfer experiments, ≈31 min, and ≈103 min, respectively. (b) The comparison of the convective heat transfer coefficients at steady state for water and the TiO 2 -water nanofluid (0.1 wt.%).
Energies 16 07885 g007
Figure 8. Temporal transmittance profiles of the TiO 2 -water nanofluid (0.5 wt.%) as a function of wavelength λ , with the legend indicating the time of each measurement relative to the initial one. Some of the LES results in terms of D 43 .
Energies 16 07885 g008
Figure 9. (a) The presence of discoloration and material loss due to the PS-water nanosuspension (0.1 wt.%). The left bottle represents the initial diluted suspension before it is circulated, while the right one is just after the testing in the flow loop without heating. (b) 3D optical profile of unused 2–1 MCHS demonstrating the surface finish of some channels.
Energies 16 07885 g009
Table 1. Geometrical properties of the silicon MCHSs, referred to as 1–1 and 2–1, illustrated in Figure 1. The upper figure represents the silicon MCHS with a glass cover on top, while the lower one displays the microscope image showing the microchannels.
Energies 16 07885 i001Properties1–12–1
Number of channels (N)6040
Channel width ( W c h ) [ μ m]100200
Fin width ( W f i n ) [ μ m]100100
Energies 16 07885 i002Channel height ( H c h ) [ μ m]565565
Hydraulic diameter ( D h ) [ μ m]170297
MCHS thickness ( t M C H S ) [ μ m]140140
Channel length (L) [ μ m]12,00012,000
Heat sink width (W) [ μ m]12,00012,000
Table 2. Measured properties of Al 2 O 3 -water and TiO 2 -water NFs at different concentrations.
WaterAl2O3-Water NFTiO2-Water NF
NP Concentration [wt.%]00.20.30.510.10.5
Density kg m 3 996.4998.8999.91002.21008.1997.1999.5
Viscosity mPa · s 11.02
Table 3. Comparison of the heat transfer performance of the Al 2 O 3 -water nanofluid at various particle concentrations with respect to DI water on 1–1 MCHS at Re = 27.
Particle Concentration
h SS  [W/(m 2 · K)]0.2 wt.%0.3 wt.%0.5 wt.%1 wt.%
Water452.3454.7469.3460.1
NF458.6438.4484.9441.6
Difference(+1.4%)(−3.6%)(+3.3%)(−4.0%)
Disclaimer/Publisher’s Note: The statements, opinions and data contained in all publications are solely those of the individual author(s) and contributor(s) and not of MDPI and/or the editor(s). MDPI and/or the editor(s) disclaim responsibility for any injury to people or property resulting from any ideas, methods, instructions or products referred to in the content.

