Article

Assessment of Suitability for Long-Term Operation of a Bucket Elevator: A Case Study

Faculty of Mechanical Engineering, Wrocław University of Science and Technology, Wybrzeże Wyspiańskiego 27, 50-370 Wrocław, Poland
Energies 2023, 16(23), 7852; https://doi.org/10.3390/en16237852
Submission received: 24 October 2023 / Revised: 23 November 2023 / Accepted: 28 November 2023 / Published: 30 November 2023

Abstract

:
Bucket elevators generally operate on a 24/7 basis, and for this reason, one of the main requirements is their high reliability. This reliability can be ensured, among other things, by assessing the technical condition of drive assemblies and working assemblies and taking appropriate measures. Carrying out diagnostic measurements enables periodical monitoring of those mechanisms. Vibroacoustic methods are usually employed in operating conditions to measure vibration velocity and acceleration at specific points, and are used as diagnostic signals. This paper presents the results of tests of the intensity of vibrations generated in the drive unit of a large industrial bucket elevator. The analysis of the results in the time domain and frequency domain served as the basis for evaluating the suitability of the drive, and thus the elevator, for long-term operation.

1. Introduction

Bucket elevators belong to a group of technical devices that are usually operated 24/7 and, therefore, must be highly durable and reliable. This applies in particular to drive assemblies and working assemblies (chains and buckets) in these devices.
Even the smallest damage to these assemblies, or their failure, usually has severe and costly consequences, leading to the shutdown of the elevator, which, in the case of power plants, causes significant disruptions in the boiler supply system.
For this reason, the technical condition of bucket elevator drive assemblies (as well as other assemblies) should be periodically inspected or monitored continuously.
One of the crucial conditions for achieving the normative duration of failure-free operation of bucket elevators, as declared by the manufacturer, is compliance with the guidelines outlined in the technical and operating documentation. These guidelines relate, among other things, to the timing of periodic inspections and possible repairs. Despite compliance with these rules, however, there are cases in which:
  • The time of failure-free operation is shorter than the normative time, and therefore, the technical condition of the device is unacceptable;
  • Repairs and overhauls undertaken before the expiration of the normative time are not justified, as the technical condition of the device is still acceptable.
These situations are mainly due to randomly varying properties of components and quality of assembly, randomly varying operating loads and varying operating conditions (predominantly negative environmental influences). The most significant examples of varying properties of components are material imperfections and resulting heterogeneity and improperly conducted heat treatment. The most important example of varying quality of assembly is mounting inaccuracy. Performing repairs or replacements in specialized workshops is sometimes not cost-effective. In such cases, the work is carried out in real conditions, making accessing the tooling on specialized workstations difficult or even impossible. That increases the risk of assembly errors.
Because of the above, it is reasonable to use in-service diagnostics involving the evaluation of a machine or equipment in binary-state categories: fit or unfit (sometimes the concept of an intermediate state is used: conditionally fit).
Diagnosing machine drive assemblies, especially in real operating conditions, is difficult and is often performed using vibroacoustic methods, i.e., based on the evaluation of vibration intensity at selected points (usually located at bearing nodes) of these assemblies.
The sources of vibrations in the drive systems of bucket conveyors are as follows:
  • Vibrations generated by the operation of power transmission assemblies. Components that are the most significant sources of vibrations include drive motors, gears (bearings, shafts, gears) and couplings;
  • Vibrations resulting from the kinematics and dynamics of the working assemblies of this type of conveyor. The primary sources of vibrations are the bucket chain, buckets and sprockets.
Regardless of where they occur, vibrations can be structural, technological or operational.
Structural vibrations are caused by the kinematics of bucket conveyors, which operate cyclically. The typical vibration spectrum of an operating bucket conveyor includes the frequency of the intake/discharge and the frequency of the links passing through the chain wheel, with the linear speed of the chain periodically varying (pulsating) despite the constant angular speed of the drive sprocket. In addition, during the operation of a bucket conveyor, vibrations occur in the housing, which is usually a thin-walled box structure.
Technological vibrations, on the other hand, are caused by all kinds of manufacturing inaccuracies and assembly errors (e.g., chain manufacturing errors, inaccuracies in the seating of buckets on the bucket chain, etc.).
Operational vibrations are caused by the degradation of components of the working system (especially wear and damage to links and sprockets, increased clearances in chain kinematic pairs and bucket attachment points, corrosion, loss of lubricants, etc.). The intensity of these vibrations increases as the degradation progresses. Therefore, vibrations caused by operational factors are the basis for diagnosing the technical condition of bucket conveyors (as well as other machinery and equipment).
Wear and tear processes cause deterioration in the operating characteristics of the machinery, among other things, especially vibroacoustic ones. At the same time, during the so-called run-in period, the vibration level initially decreases and then gradually increases. During further operation, the level of mechanical and acoustic vibrations increases gradually until a certain point, at which point this increase changes its character to rapid and can continue until failure occurs. In this way, vibroacoustic processes signal early enough the impending failure state of a component, assembly or entire machine. For this reason, they can be called failure-oriented process signals.
Using vibroacoustic methods based on the measurement and analysis of mechanical vibrations and/or acoustic vibrations can thus be an effective way of recognizing the stage of wear of the machine or equipment under investigation.
Based on many years of experience, values or threshold ranges of indicators of the intensity of vibroacoustic processes have been determined for typical (most commonly used in practice) types of machine components and subassemblies, defining the boundaries between technical states: acceptable, conditionally acceptable and unacceptable.
Vibrations are considered one of the most valuable quantities in assessing the technical condition of drive units. For this reason, diagnostics based on the analysis of vibroacoustic signals supported by appropriate analyses of obtained data play a crucial role in the maintenance of modern machines. Research on such diagnostic methods was the subject of many works, among others [1,2,3,4,5].
One disadvantage of the vibroacoustic diagnostic method is the susceptibility of the signal to interference from various other sources of vibration and noise [6]. The problem of signal disturbance while diagnosing complex machines and mechanisms is widespread. That is because different parts of those assemblies, like transmissions, bearings or motors, generate different signals, which can influence the results of observations. For example, one should consider vibrations coming from the meshing of gears while assessing the technical state of bearings. Such problems with signal interference have led to the development of different filtering methods [7].
One of the approaches to increase the effectiveness of the resulting assessment is to analyze different indicators within one signal. The processing and extraction of useful signal features are crucial for proper diagnosis.
Vibration velocity and acceleration are used as diagnostic signals. Plenty of parameters can be acquired in such diagnostic procedures, and among them, there are three domains in which those indicators are obtained: time, time–frequency and frequency domains [8,9,10].
The most valuable indicators in the time domain include RMS, peak, mean, kurtosis, crest factor and impulse factor [7,9,11,12,13,14,15,16,17,18].
Moreover, in the case of vibroacoustic diagnostics, additional diagnostically relevant information can be obtained via the time-frequency domain analysis. The most popular techniques based on such an approach include fast Fourier transform and Fourier analysis [4,9,19,20,21,22]. Wavelet analysis is another significant transformation in this domain [9,15,16,21,23,24,25,26]. By using these methods, we can study vibroacoustic signals in depth and, therefore, evaluate the technical state of a given machine.
The last of the abovementioned domains is the frequency domain. As in the case of the time-frequency domain, we use the Fourier analysis and fast Fourier transform [9,27].
One of the main advantages of using simple diagnostic indices is that they are relatively easy to obtain by measurement. This approach is often sufficient, especially for certain types of machine components or machines with simple kinematic and functional structures. For example, peak velocity and vibration acceleration coefficients are helpful in diagnosing rolling bearings. In turn, the RMS value of vibration velocity is used to classify the vibration condition of rotating machinery.
Spectral analysis of signals is a more sophisticated tool for analyzing diagnostic signals and, when combined with the analysis of the kinematics of the machine under study, offers more possibilities than a simple time-domain analysis. The basis of spectral analysis is a narrowband spectrum of the signal (FFT spectrum) or a broadband spectrum (e.g., in 1/3 octave bands).
Narrowband analysis is used, among other things, to identify the characteristic frequencies of the machine under test in order to detect specific defects, e.g., rotational frequencies of shafts, interlocking frequencies, etc. On the other hand, broadband (1/3 octave) analysis is, for example, the basis for a general evaluation of the technical condition of drive units—according to the guidelines of ISO-10816-3 [28].
It is also possible to perform a diagnostic assessment by applying a probabilistic approach based on the relevant quantiles Qp of vibration signals (where p is the assumed confidence level).
What should be highlighted is that the simultaneous use of several diagnostic observation methods can be very beneficial in formulating the correct technical condition assessment. In some cases, concurrent measurements and analysis of different signals lead to better diagnoses than using the same signals separately. This is the case because the applied diagnostic methods have different sensitivities to changes in the technical condition of the machine under observation. However, the utilization of various diagnostic methods simultaneously is more demanding and requires more financial resources. Hence, if it is possible and economically justified, in condition monitoring, it is recommended to use different signals at the same time, e.g., vibration, electrical and acoustic signals. More detailed information about such an approach can be found in [22,29,30].
It should be added that improper maintenance of steering and control systems in electrical drives can hinder the operation of entire machines and introduce additional vibrations. Those vibrations negatively influence the technical condition of the whole system and can interfere with vibroacoustic signals and, therefore, impede the diagnosing of other elements. That is why some works focus on improving the operation of electrical motors and lowering their vibrations [31,32].

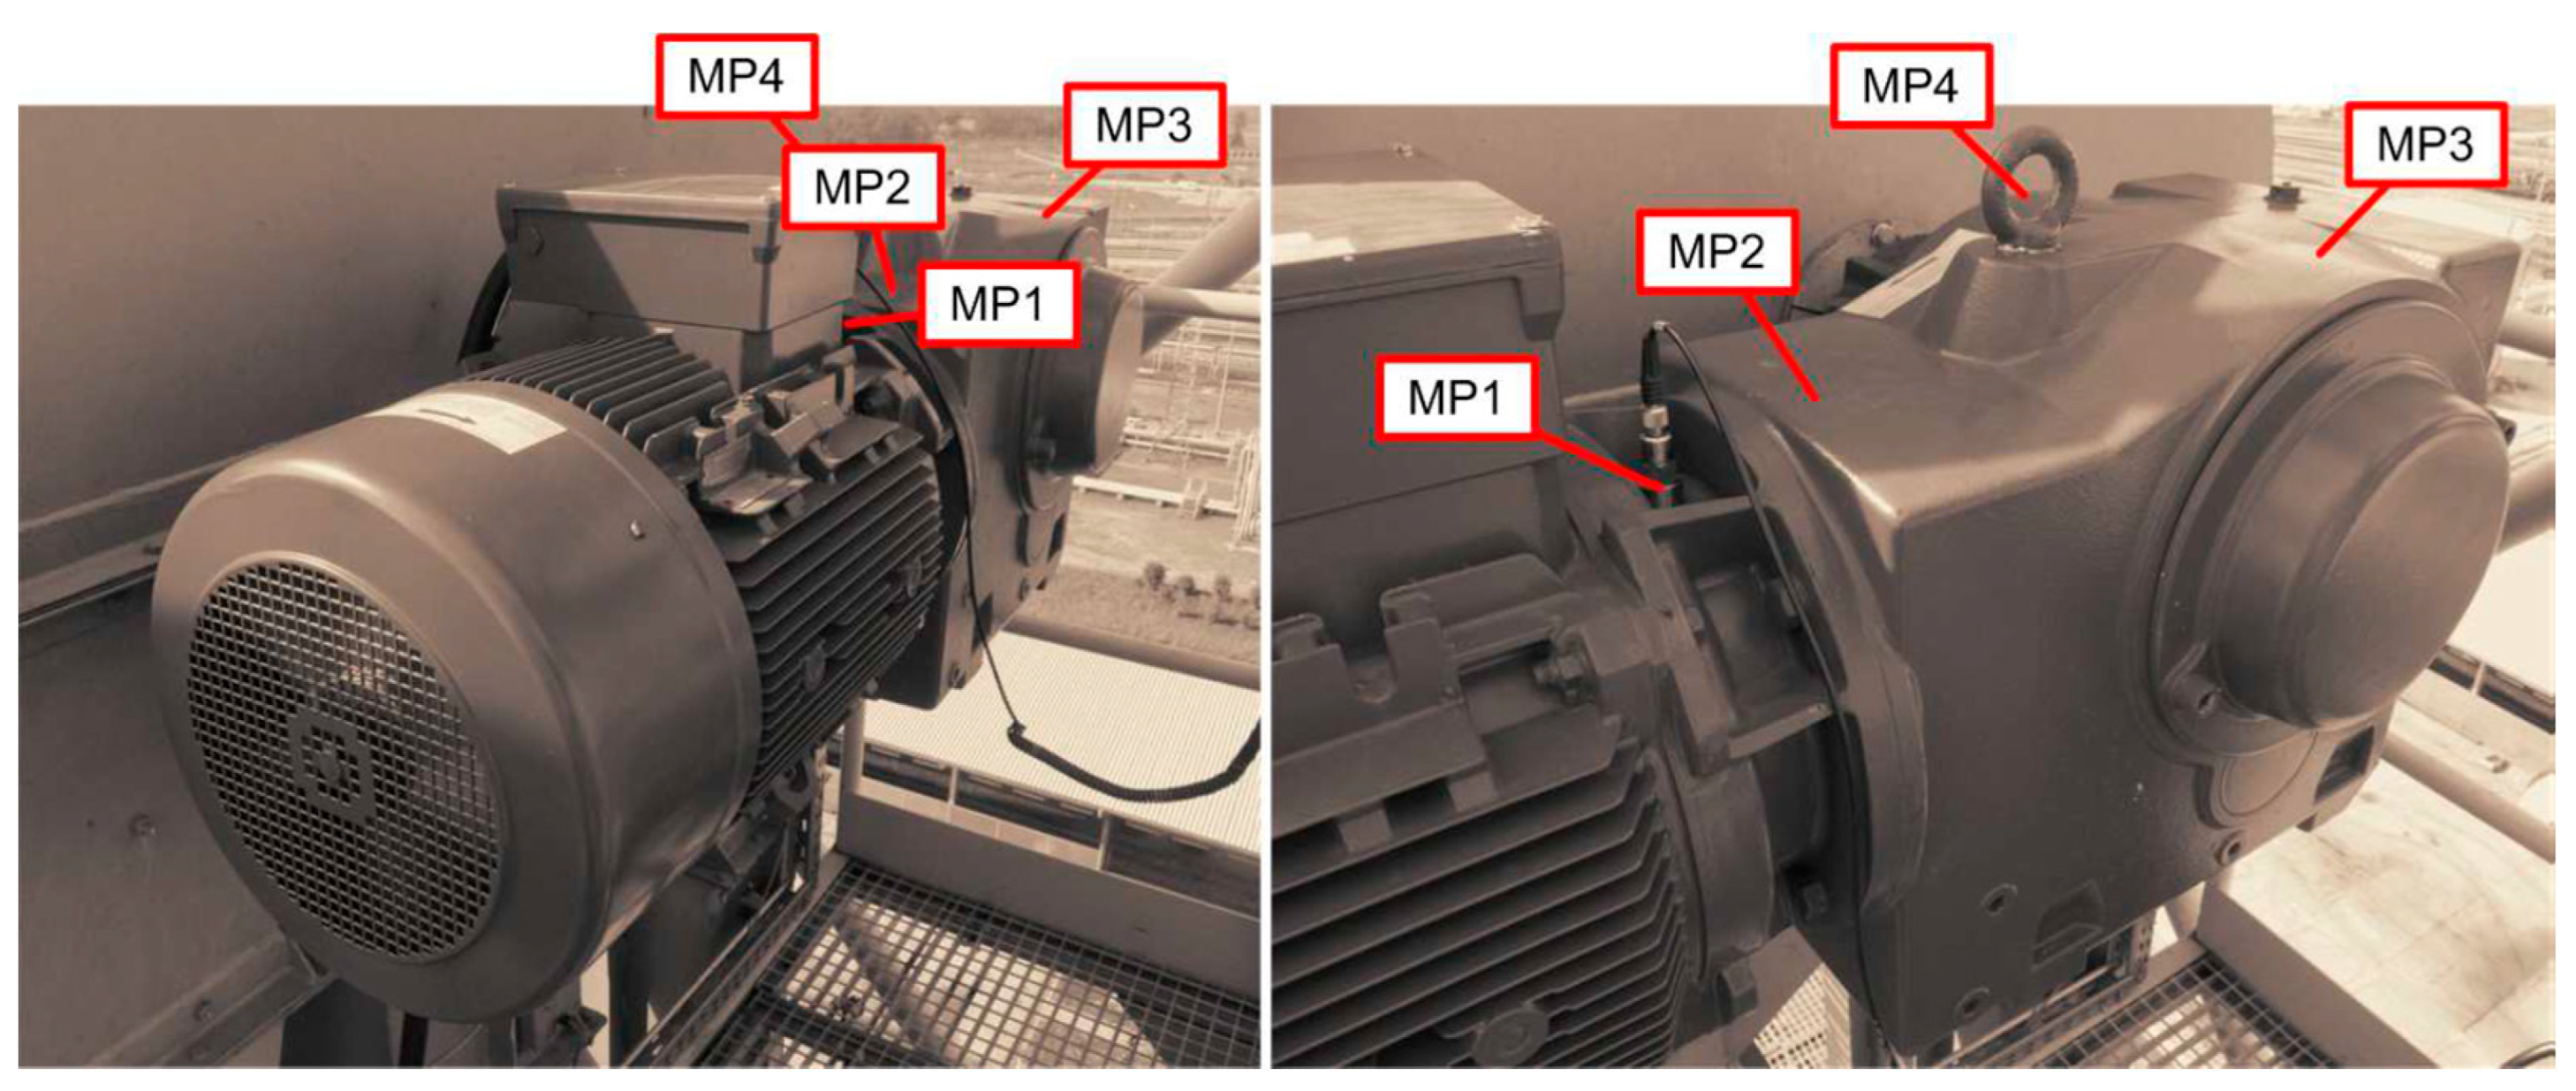
2. Materials and Methods

Considering the numerous advantages of diagnosing the technical condition of machinery based on the analysis of vibration signals, it was decided to use vibroacoustic signals to evaluate the suitability of the tested drive units for long-term operation.
In this study, I applied a comparative evaluation method that meant I could quickly assess the tested elevators under actual operating conditions. Measurements were made based on the ISO 10816-3 and PN-ISO 8579-2:1996 [33] standards, and broadband analysis of the obtained signals was used.
The object of research was a bucket elevator, which is a real technical system operating 24/7 in a fuel feeding line under industrial conditions.
This elevator, designated for this article as BE#3, has four times the capacity (400 m3/h) and three times the drive power (45 kW) compared to BE#1 and BE#2—two twin bucket elevators that were the subject of research presented in [18].
The primary objective of the diagnostic study of the BE#3 elevator was to evaluate the vibration intensity level in the drive unit and, on this basis, assess its suitability for further long-term operation in a continuous operation system.
In this study, the vibroacoustic diagnostic method was applied by making vibration measurements at four selected points of the drive unit, i.e., at two points on the housing of the bearing nodes of the input high-speed shaft and two points in the bearing nodes of the output slow-speed shaft. The distribution of the measurement points is shown in Figure 1.
The vibration and acoustic signals were measured and saved in real time into the internal memory of both measuring instruments. Then, the files were downloaded for a later, more detailed analysis.
One of the characteristic features of the drive assembly of the BE#3 elevator under study is the suspension of the gearbox on the drive shaft of the bucket chain and the elastic support of the motor on a platform attached to the elevator housing. This solution ensures the static determinability of the foundation system of the drive unit. However, the vibrations of the elevator casing (made of thin-walled sheet) are transmitted to the drive unit, which can make it difficult to properly assess the actual vibration severity at the “MP” test points.

3. Methods of Assessment of Vibration Severity

Diagnostic tests in real operating conditions, especially tests carried out on large machines or equipment, are challenging due to, among other things, the considerable height at which measurements are made (30 m or higher).
The literature proposes two main approaches to the diagnostic evaluation of vibration severity and classification of the technical condition of machinery on this basis.
In the USA, the preferred diagnostic measures are mainly peak values of vibration velocity and acceleration and dimensionless quantities such as the crest factor. Examples of this include the widely used Blake guidelines [34].
On the other hand, in European countries (under ISO recommendations), vibration RMS velocity is generally used as a diagnostic measure. For example, ISO-10816-3 introduces four categories of technical conditions depending on the RMS value of vibration velocity (the total RMS vibration velocity).
As highlighted in paper [18], the RMS value is generally considered an appropriate measure for steady-state signals, while the peak value is more appropriate for a signal whose average level is relatively low but does occasionally have pulses [35]. The crest factor is recommended and used in particular by Bruel&Kjaer Co. (Nærum, Denmark) as an indicator for assessing the condition of rolling-element bearings [36].
With this in mind, the research and analysis of the vibration intensity of the BE#3 bucket elevator under study was carried out independently using the following approaches:
  • Analysis in the time domain;
  • Analysis in the frequency domain.

3.1. Method of Assessment of Vibration Severity Based on the Analysis of Peak Values of Signals in the Time Domain

The concept of evaluating the intensity of vibrations in the drive unit of the BE#3 bucket elevator was implemented in two variants and was based on the use of the following diagnostic indicators:
  • Classic measures, i.e., RMS and peak values of vibration velocity and vibration acceleration;
  • Dimensionless factors: the crest factor (the ratio of peak to RMS) and the impulse factor (the ratio of peak to mean) of vibration velocity and vibration acceleration.
The first approach evaluates vibration intensity by comparing the experimentally obtained peak velocity values vPeak or/and aPeak with the values of the corresponding limits recommended by Blake [34]. The technical condition is then placed into one of the following categories: “D”, “C”, “B”, “A” or “AA” (Table 1). Class “C” is considered the condition of optimum economy (optimum performance). That is the assessment from Blake’s analysis. The quality of the evaluated object is at an acceptable level, and at the same time, its production did not involve high costs, thanks, for example, to the not-very-restrained requirements for manufacturing accuracy.
In evaluating technical conditions using the Blake method, the so-called “C” is considered. The effective vibration is determined as the measured vibration velocity or acceleration multiplied by a service factor. The service factor is assumed to be 1.0 for typical noncritical machinery.
In the second approach, vibration intensity is evaluated by comparing the values of dimensionless indicators, the crest factor of velocity Cv and the crest factor of acceleration Ca (most often), with those recommended by the literature.
The crest factor of acceleration is the most straightforward measure of impulsiveness of vibration and usually indicates the condition of many rolling-element bearings [36]. The crest factor of acceleration typically starts at the level of 3.0 when the bearings are in good condition, and the signal has no impulsive components.
For new rolling bearings, the crest factor is usually in the range Ca = 3.5 ÷ 5.5 and the impulse factor Ia = 4.0 ÷ 6.5. The crest factor Ca < 8 (or the impulse factor Ia < 12) characterizes bearings in good operating condition, while for the values Ca > 16 (or the value Ia > 24), the bearing is eligible for replacement [35]. If Ca = 8÷16 or Ia = 12 ÷ 24, the bearings can be used with certain limitations (e.g., under reduced load).
However, it should be considered that in the initial phase of damage development, peaks appear in the vibration signal, which initially causes an increase in the crest factor. In the later stage of damage development, the RMS component of the signal (the denominator in the definition of the crest factor) usually also increases, which can consequently cause a decrease in the crest factor. At a later stage, signal and crest factor peak values tend to stabilize.
A similar feature to the crest factor is kurtosis, which is also recommended as a good fault indicator and is used for gear diagnostics.

3.2. Methods of Assessment of Vibration Severity Based on the Spectral Analysis of Signals

The vibration severity in the frequency domain is analyzed based on the broadband (1/3 octave) vibration velocity and acceleration spectra measured on the bearing housings.
According to the guidelines of ISO-10816-3 standard (Table 2), vibration severity is assessed by RMS velocity values. Four states are distinguished: good (“A”), acceptable (“B”), acceptable under restricted conditions (“C”) and not acceptable (“D”).
It should be highlighted that, in the opinions of some, the recommendations of ISO-10816-3 are too restrictive as they refer solely to new drive units tested on unique stands, where the influence of additional environmental vibrations can be kept to a minimum or isolated.

3.3. Method of Assessment of Vibration Severity in the Probabilistic Approach to Signal Analysis

Since the vibrations generated in the power unit are random variables, the analysis of diagnostic signals should be performed in probabilistic terms.
This approach allows us to assign a certain probability to the indicators of diagnostic signals that are used as symptoms of the technical condition. For example, the confidence intervals or vibration velocity quantiles determined for the required confidence level can be used as indicators.
Such an option is impossible in a deterministic approach to the analysis of diagnostic signals.
Generally, the statistical distributions of signal values are unknown but it is most often assumed that they have a normal distribution. However, this assumption is not always justified since histograms of diagnostic signals from monitored machines generally have right-skewed distributions [37].
Such an approach consists of the following stages:
  • The measured vibration signals are assumed to be random variables and then their statistical distributions are estimated;
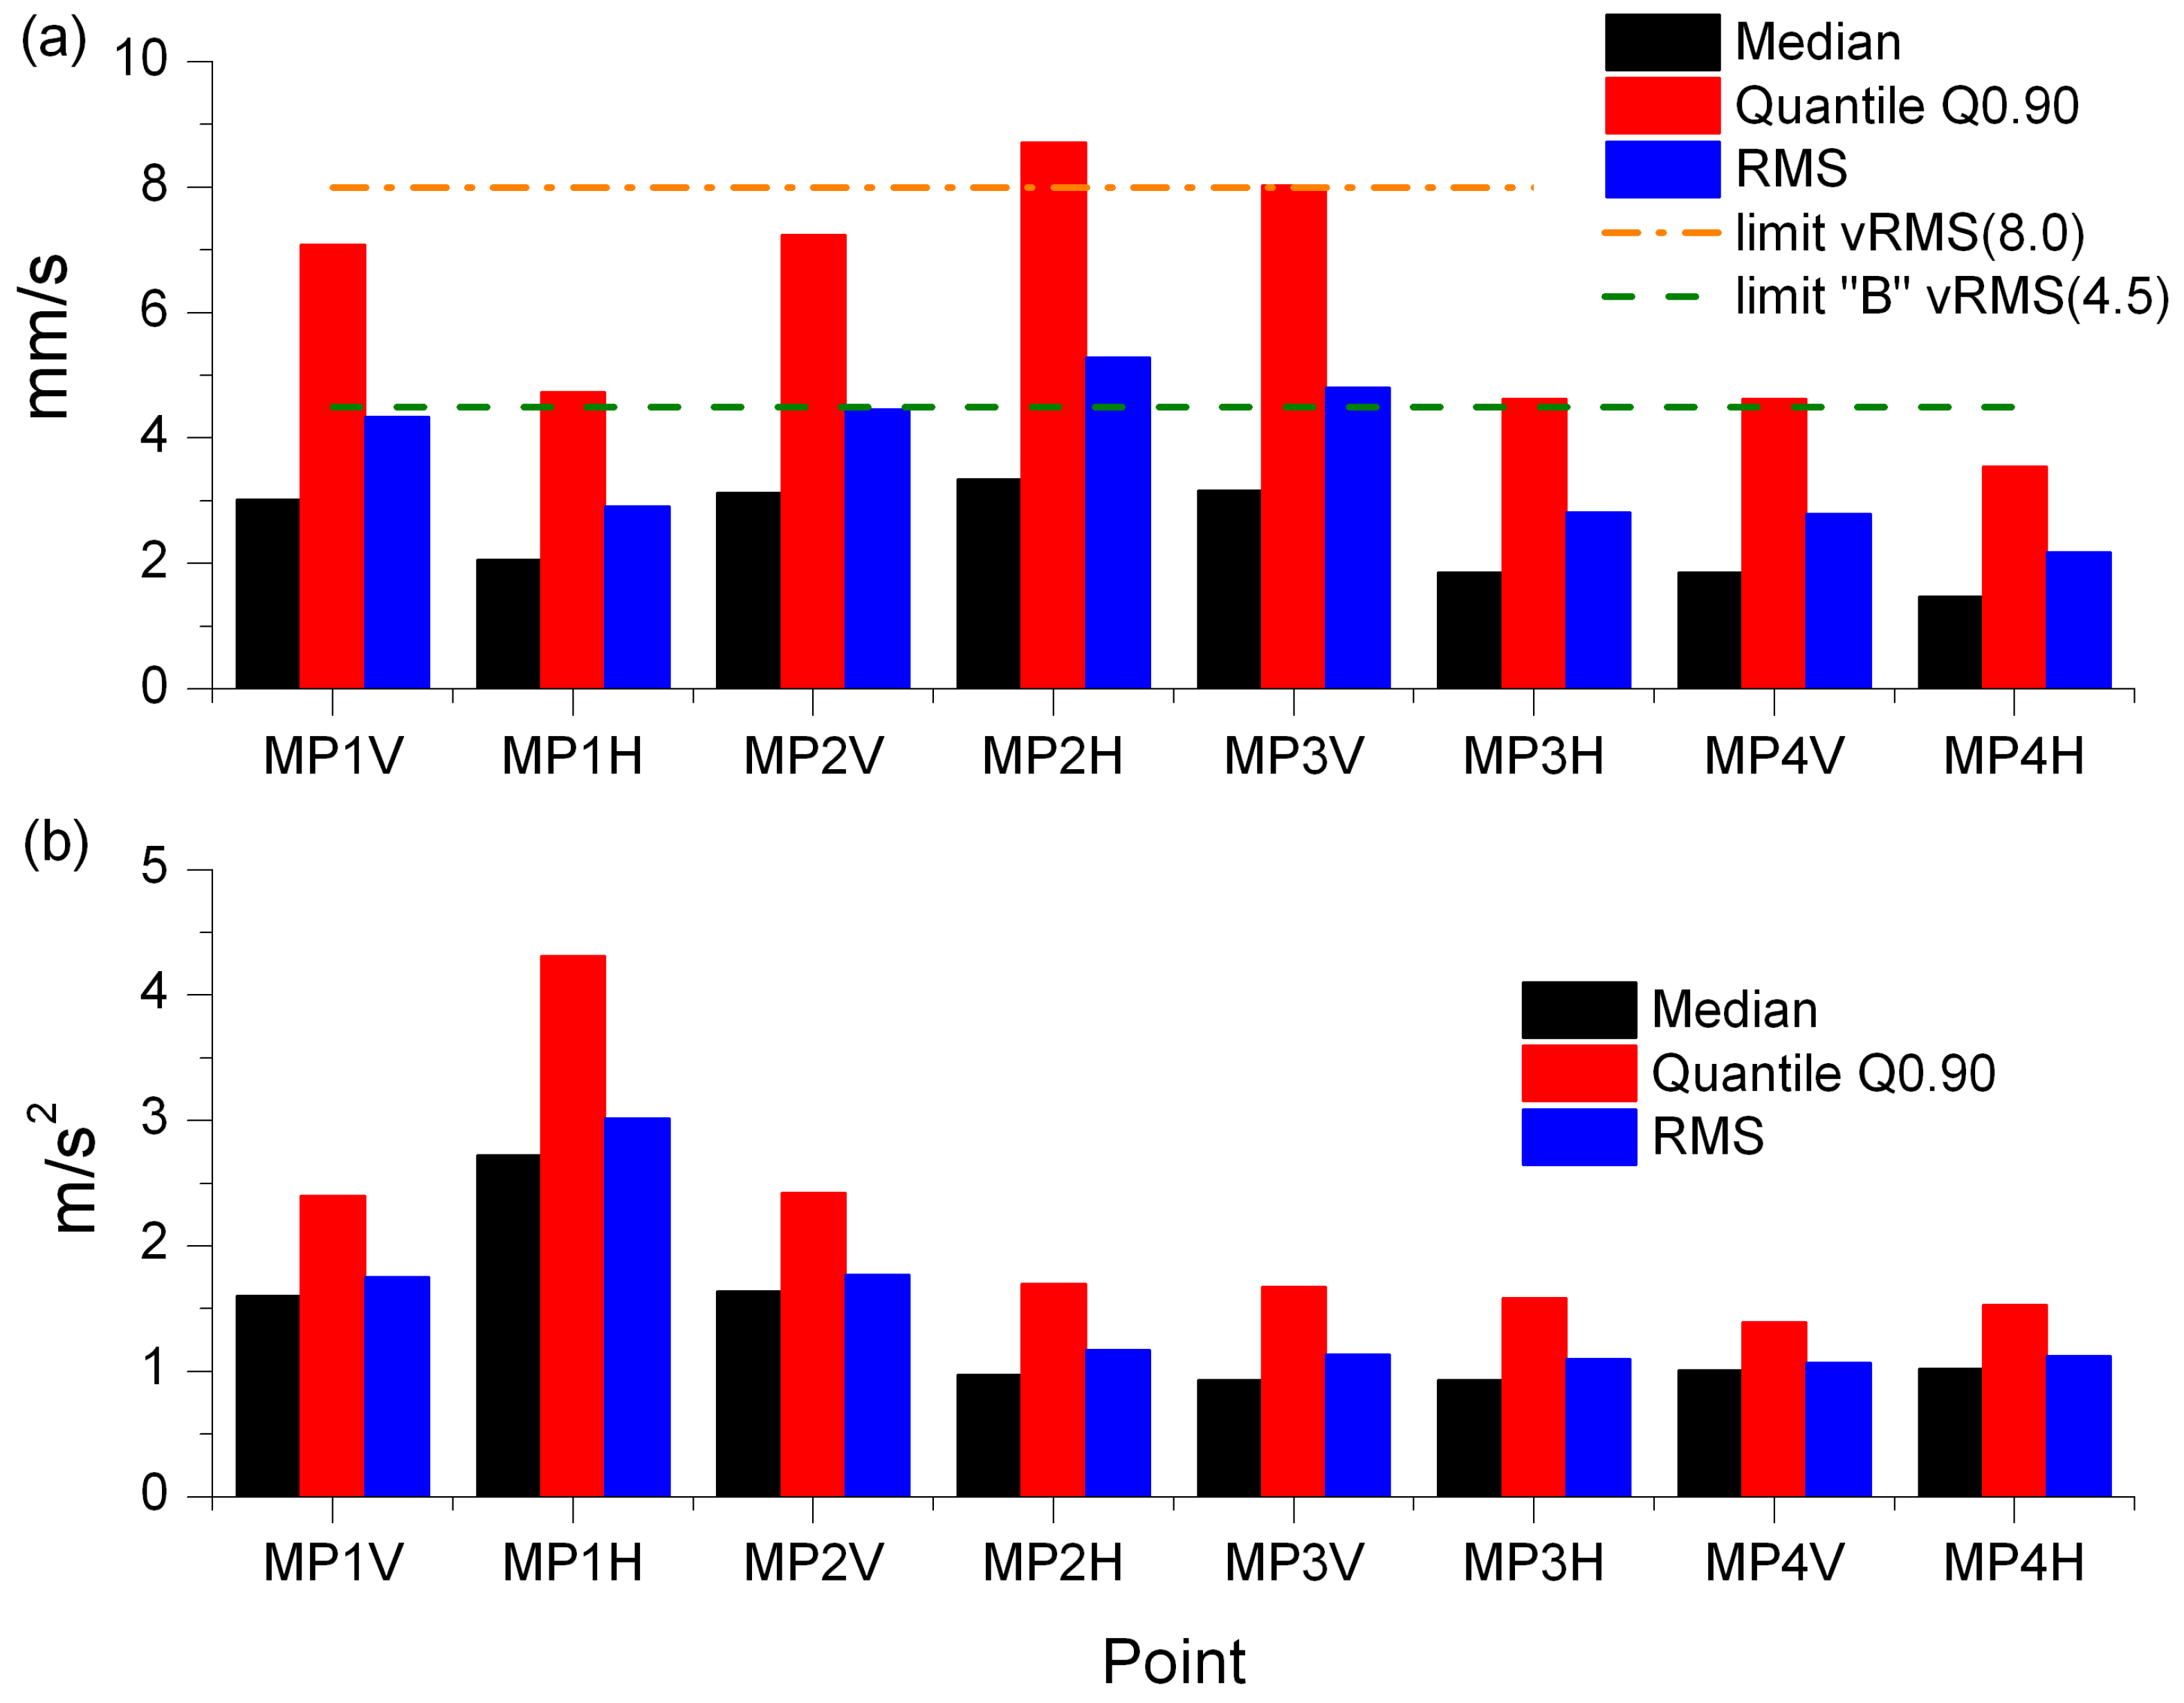
  • The vibration severity is determined from the calculated quantiles Qp of the measured signals, with p being the assumed confidence level;
  • The limits of the analyzed signals are the basis for determining the technical condition of the equipment under study.
The measured signals can be both vibration velocities and accelerations.
To assess the technical condition of a given drive unit, the determined quantile values are compared with the limit values.
A drive system is considered fit for further operation when the following relationships are met:
Q p ( v ) v RMS ( Limit ) ; Q p ( a ) a RMS ( Limit )
where vRMS(Limit) and aRMS(Limit) are acceptable levels of vibration and acceleration, respectively.
According to the ISO-10816-3 standard, the values of Qp can be compared with the upper limit of zone “B” (Table 2). If less demanding requirements are assumed, the values of Qp can be compared with the higher value vRMS = 8.0 mm/s.

4. Results and Discussion

Following the recommendations of the ISO-10816-3 standard, this research was carried out during the operation of the BE#3 bucket elevator in the following conditions:
  • Without load (i.e., with the gear idling);
  • Under the nominal working velocity of the bucket chain.

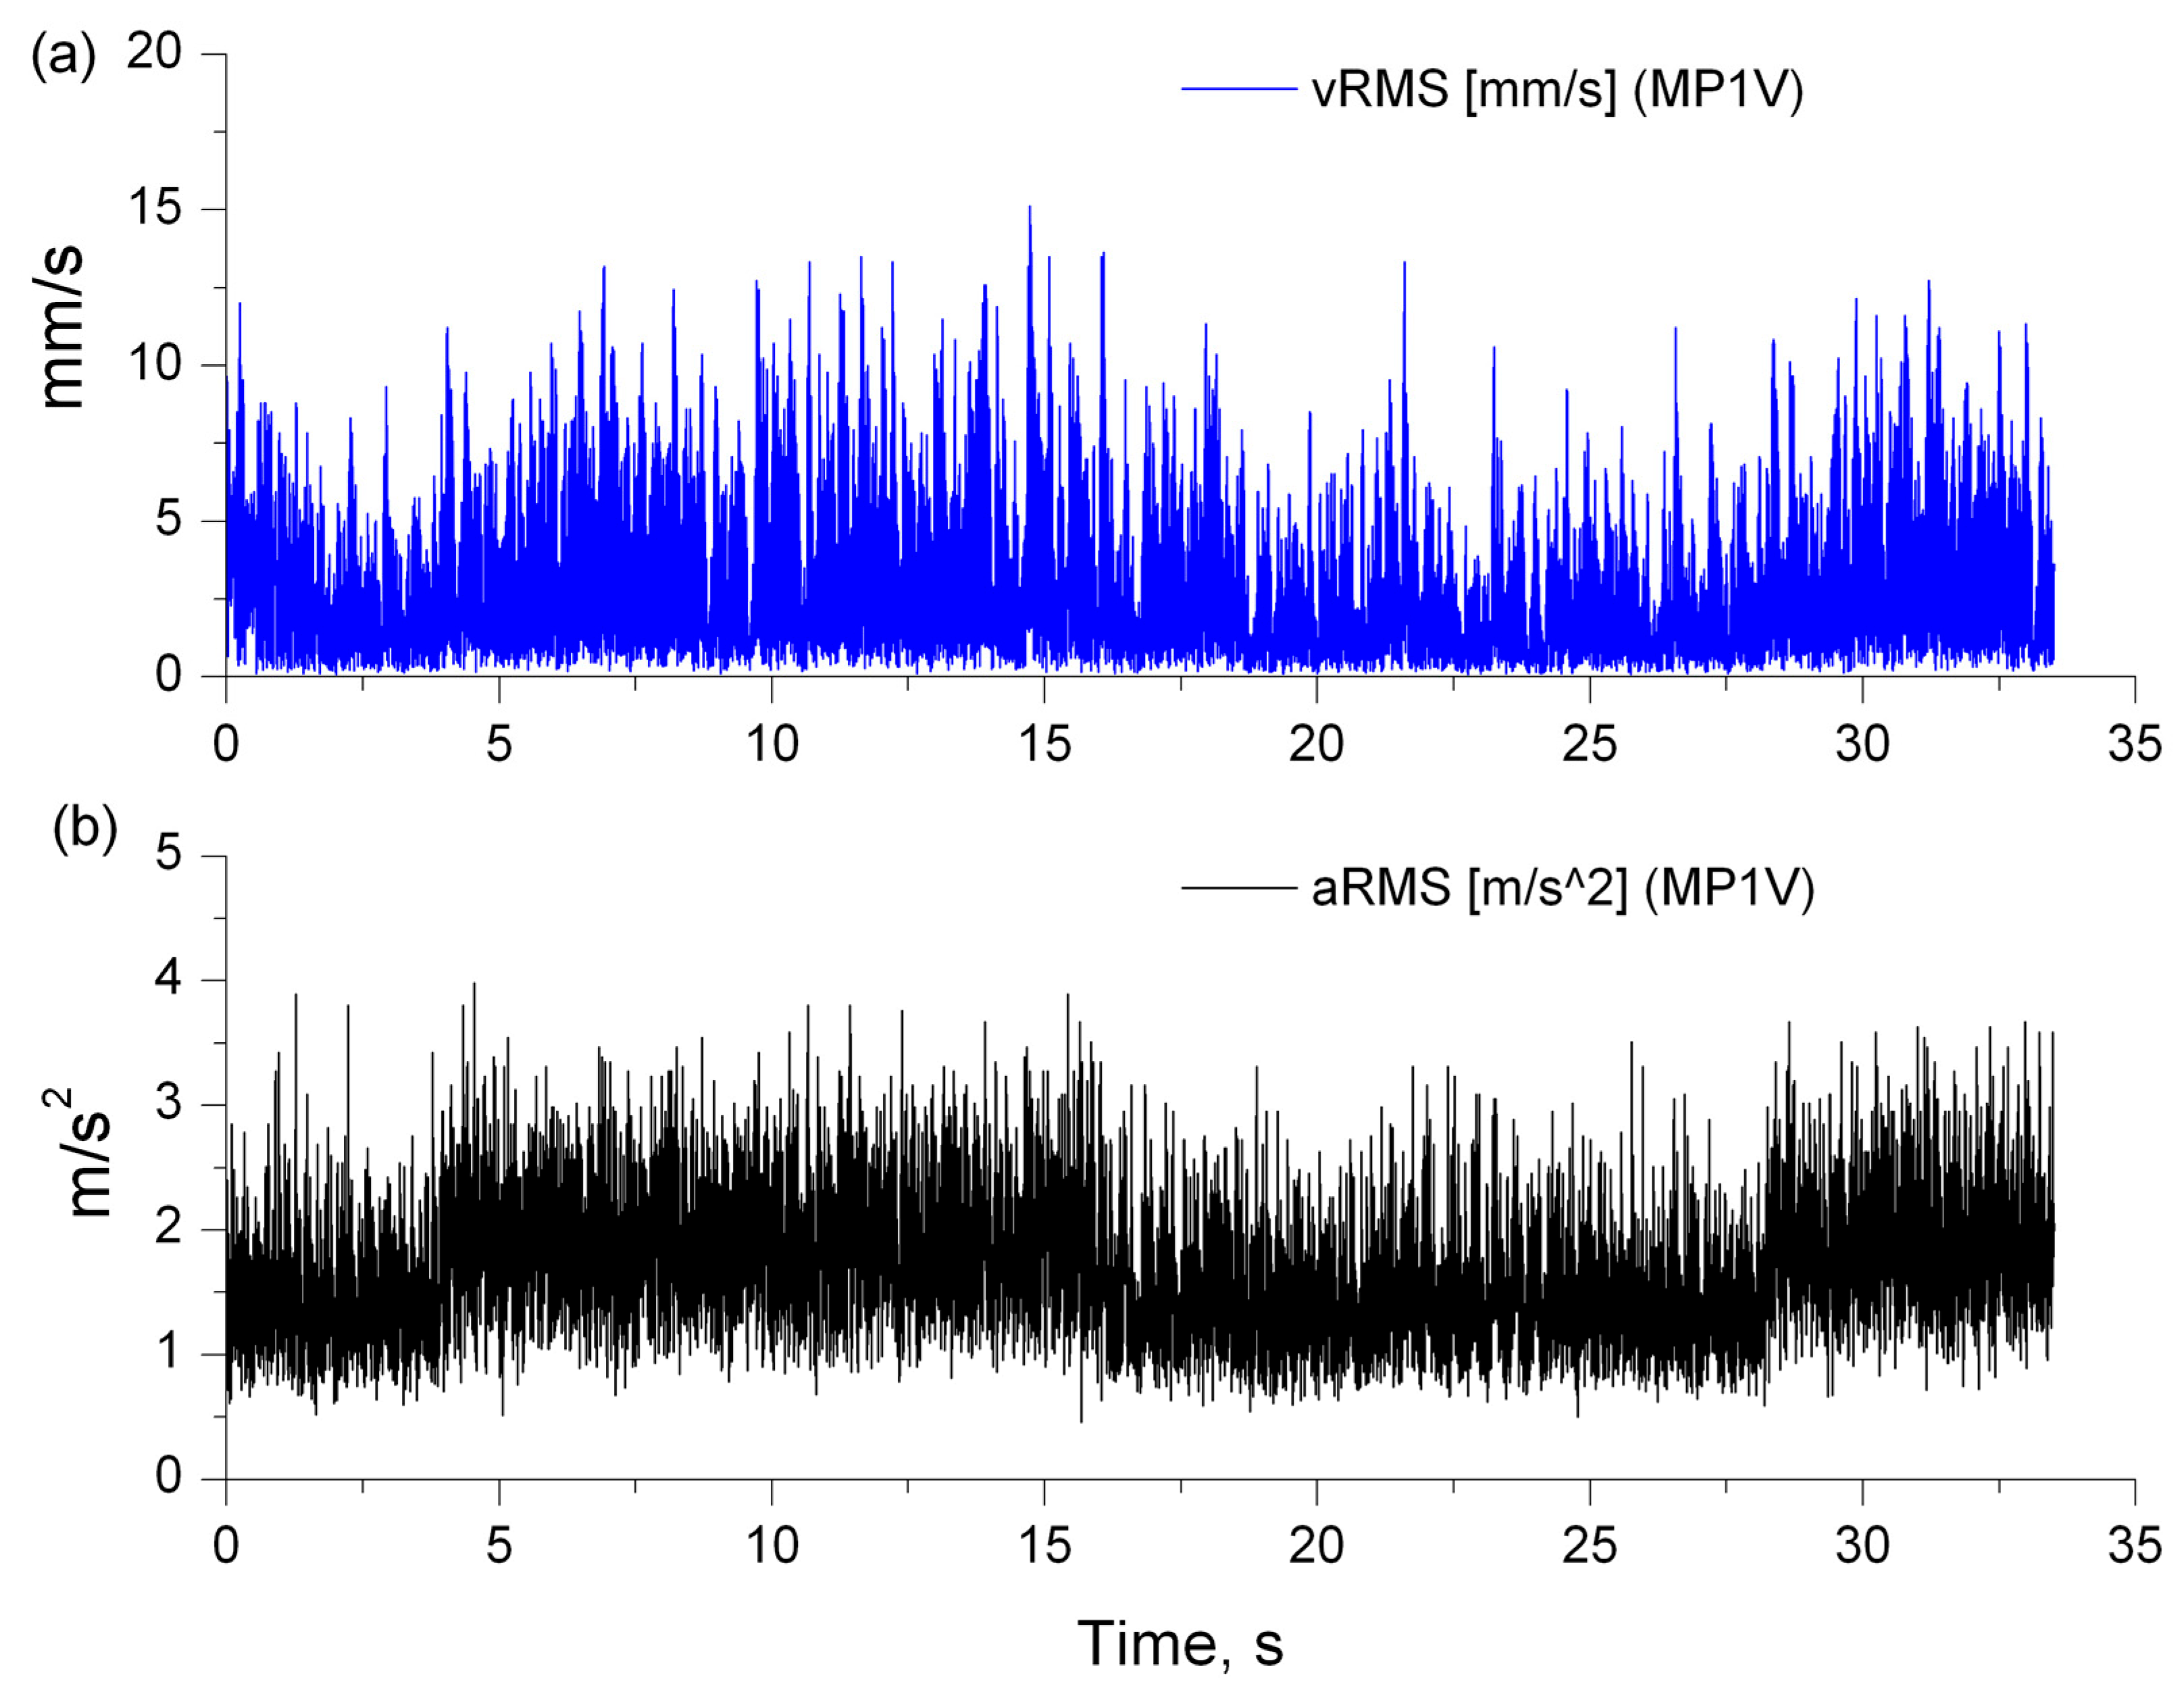
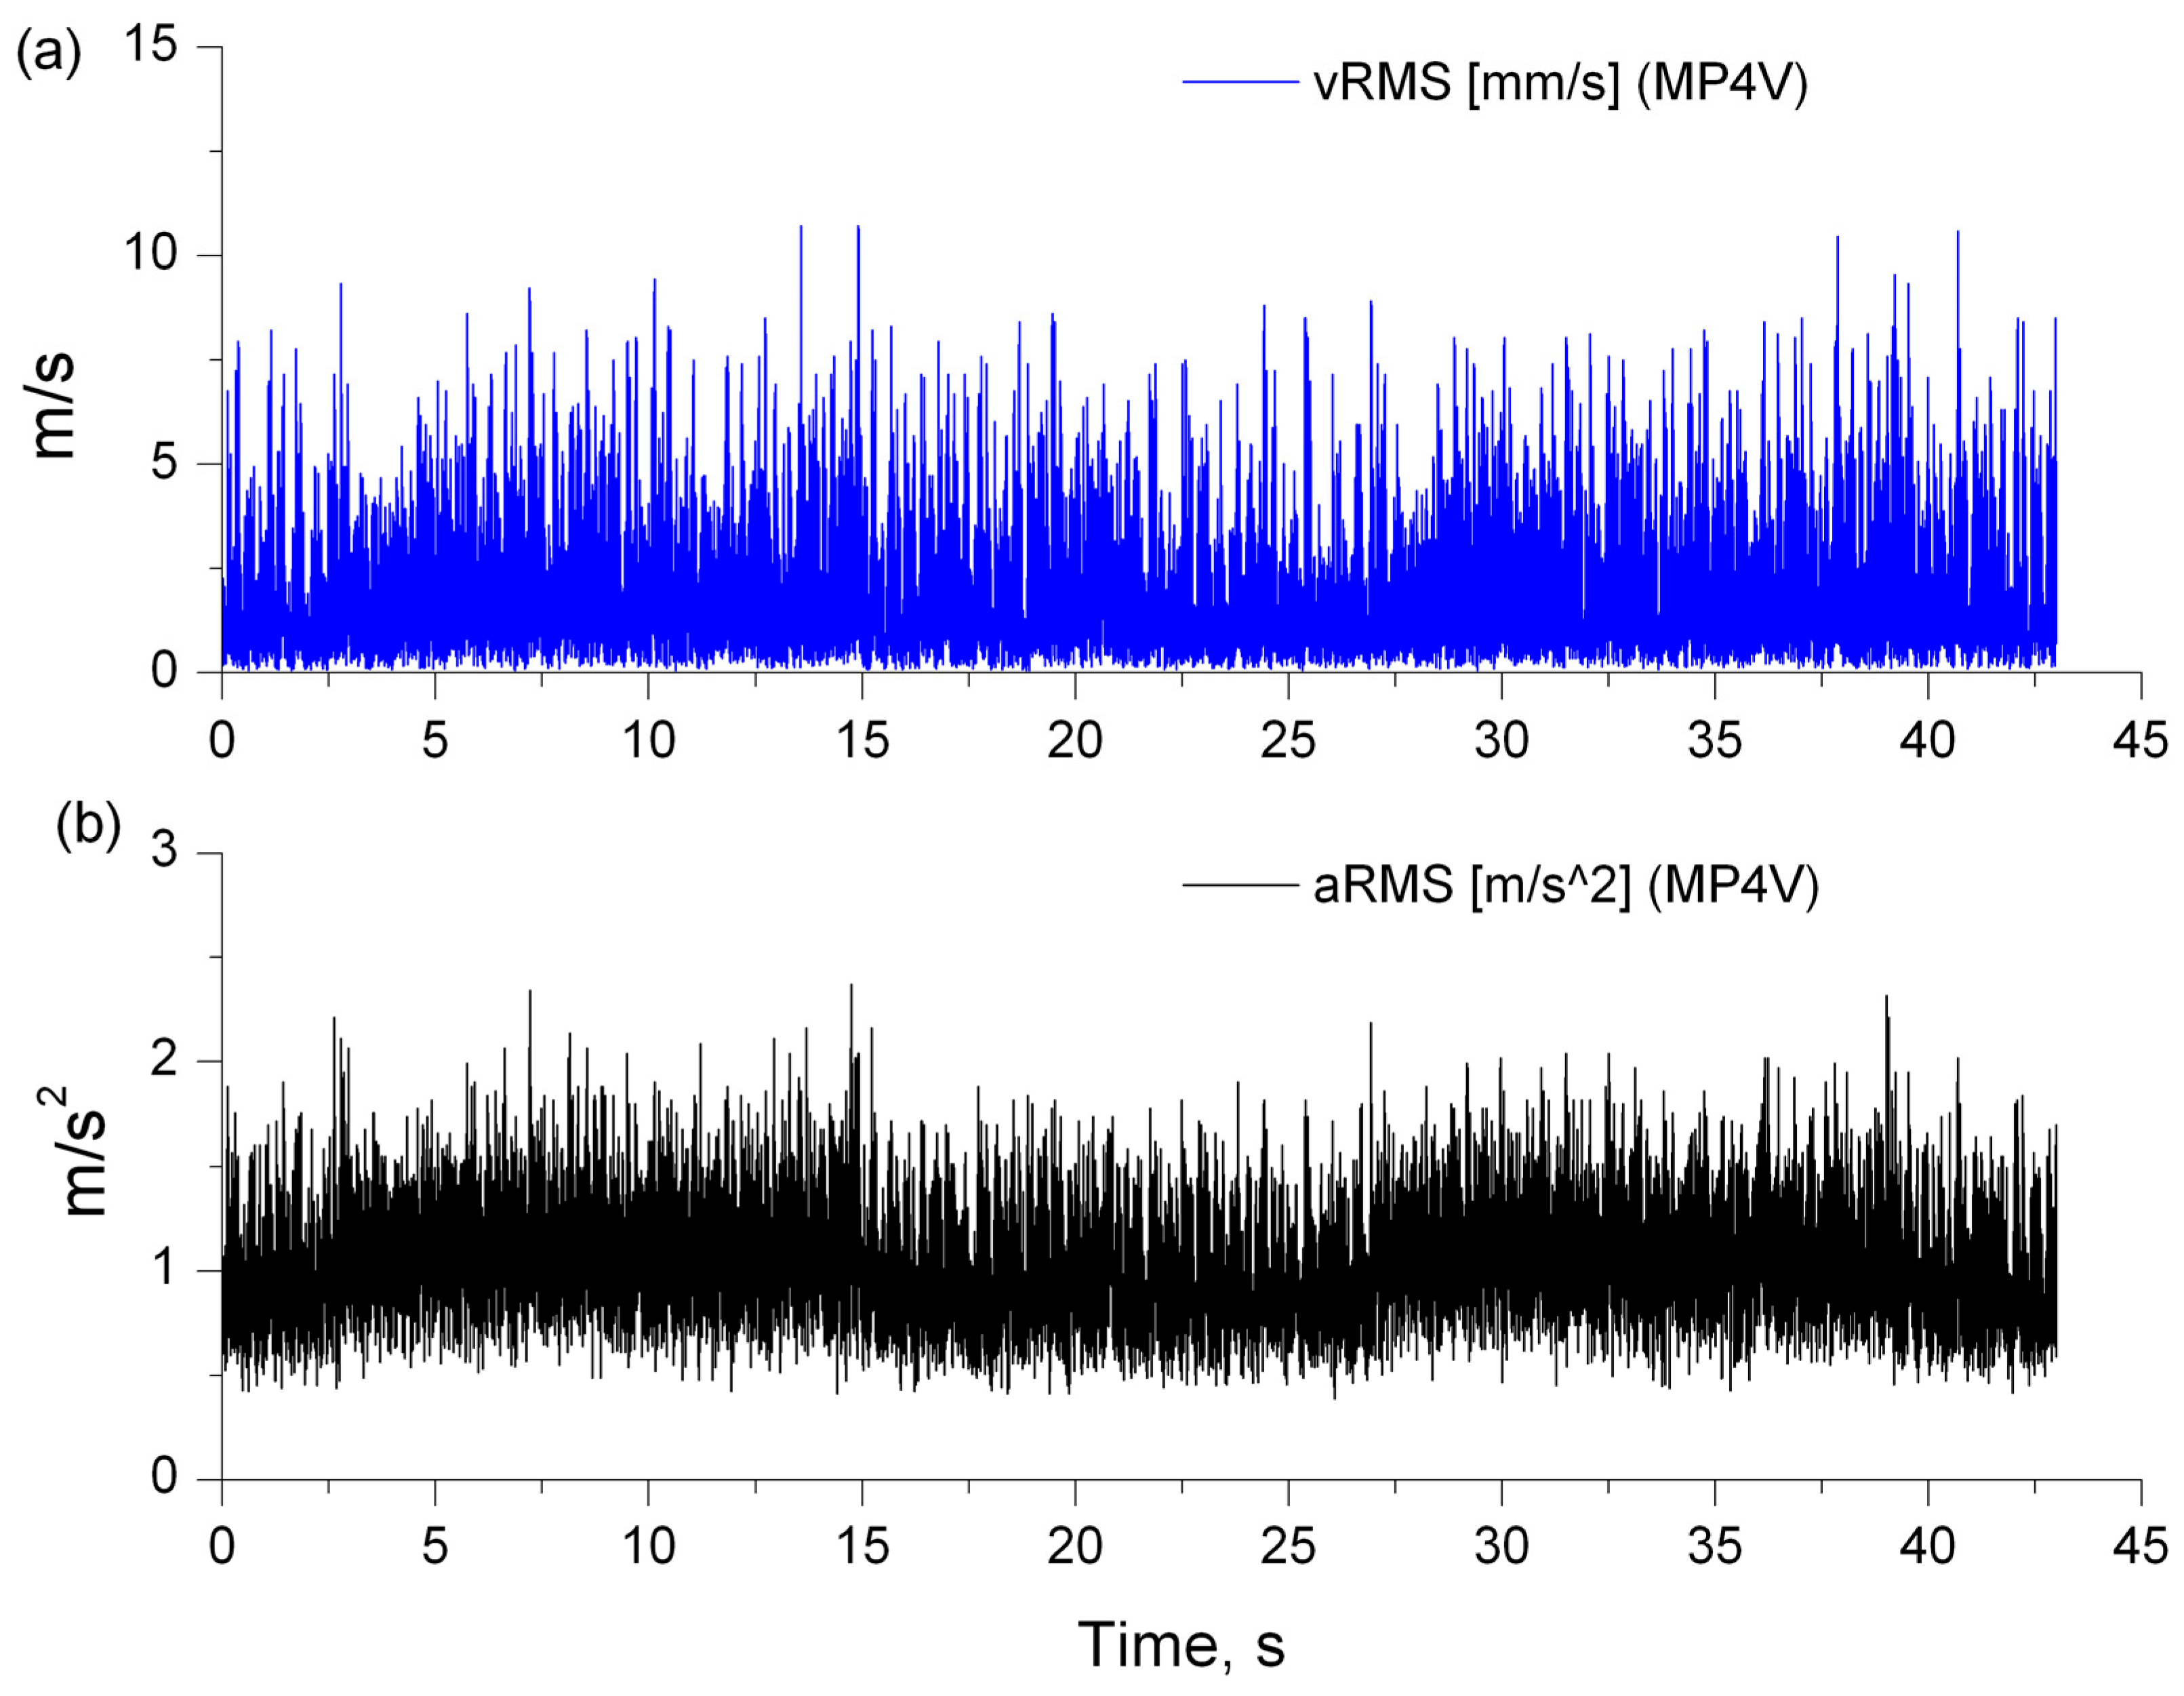
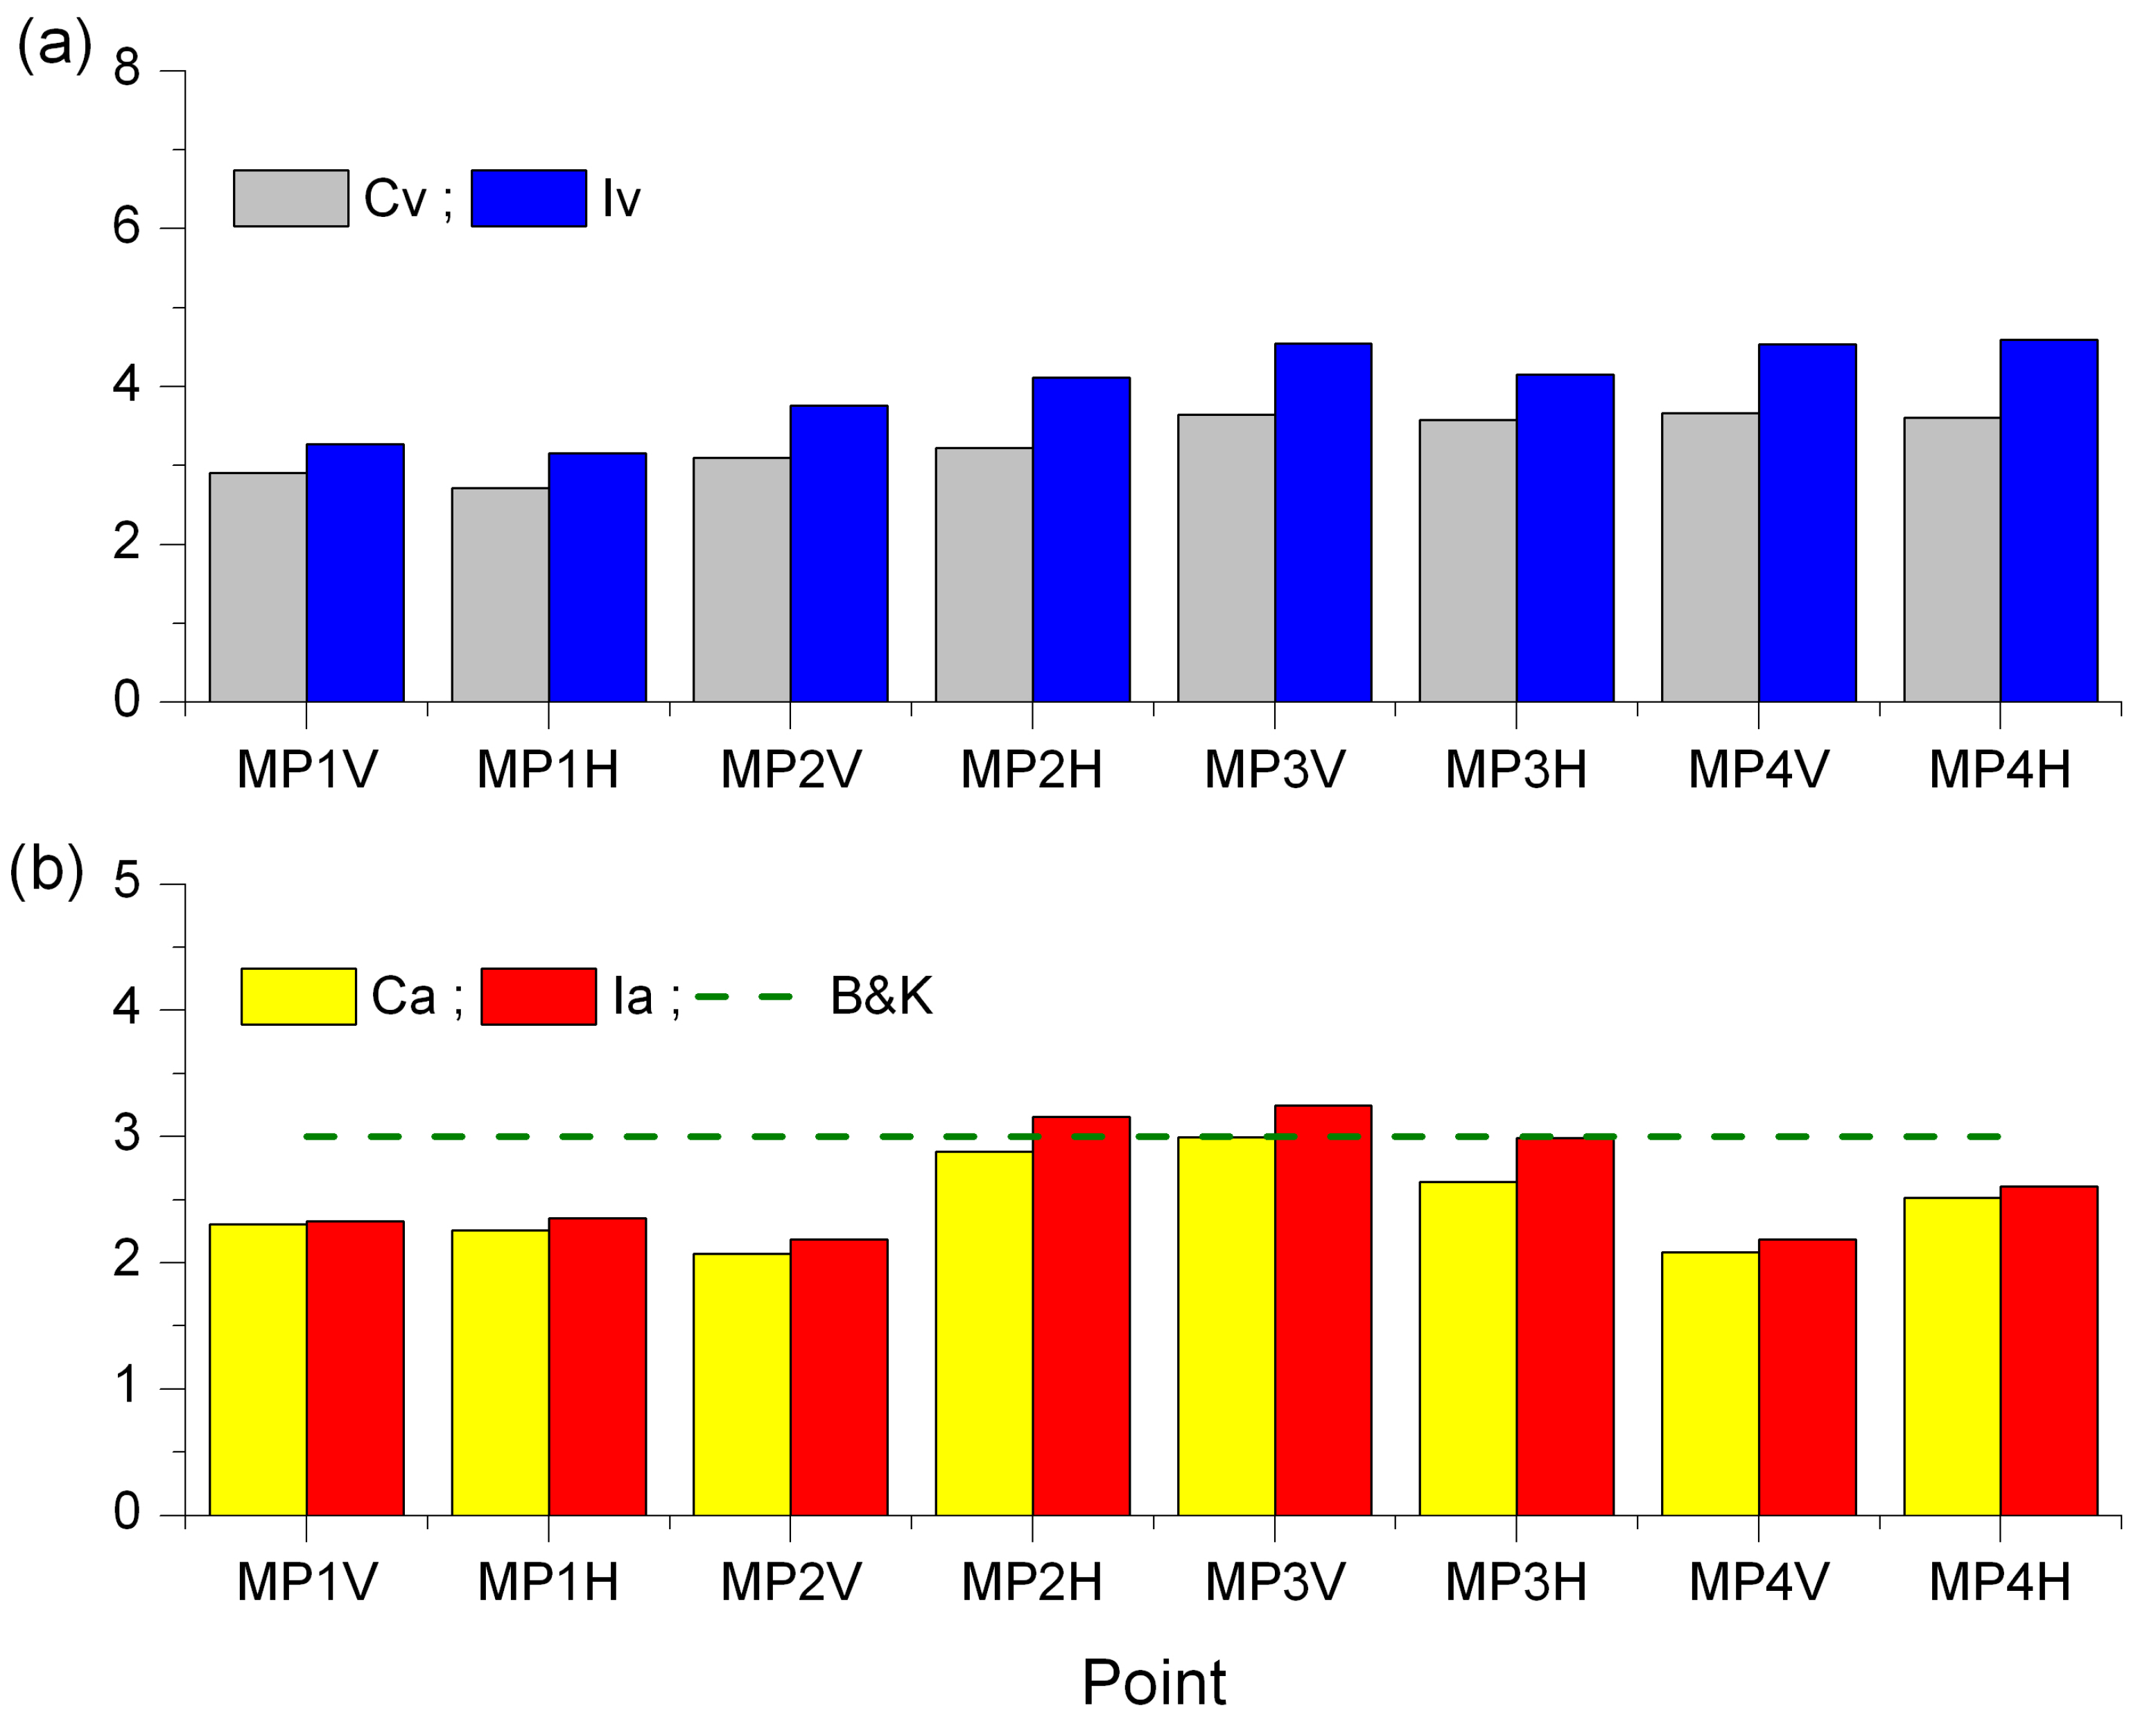
4.1. Results of Vibration Severity Analysis Based on the Peak Values of the Signal

The first stage of diagnostic testing consisted of the evaluation of vibration intensity in the drive unit of the BE#3 elevator carried out in the time domain.
The following were used as diagnostic signals: velocity and vibration acceleration measured at four characteristic points of the drive unit (Figure 1). Examples of time waveforms of these diagnostic signals, that is, vibration velocity and acceleration, at two measurement points are shown in Figure 2 and Figure 3.
A preliminary comparative analysis of the time waveforms of diagnostic signals revealed no significant differences in terms of the overall velocity and vibration acceleration level in the bearing nodes of the drive unit under study.
In a further stage of vibration intensity evaluation, the numerical values of the following velocity and acceleration characteristics were determined:
  • Classical measures of vibration: RMS, peak values of velocity and acceleration;
  • Dimensionless indices: crest factor and impulse factor. The impulse factor is particularly useful in diagnostics based on vibration analysis.
Some relevant results are presented in Figure 4, where the limits of vibration severity recommended by Blake are also marked.
Concerning the intensity of vibration in the drive unit of bucket elevator BE#3, the analysis of the measurement results revealed that:
  • Peak values of velocity at some points exceed the lower limit of zone “C” (minor fault) but do not exceed its upper limit. At the remaining points, the peak values of velocity are in zone “D” (no fault).
  • Peak values of acceleration only at point MP1H slightly exceed the lower limit of zone “C” (minor fault). At the remaining points, the peak values of vibration acceleration are in zone “D” (no fault).
In addition, the peak coefficient values for velocity and vibration acceleration were analyzed. The results are shown in Figure 5. The analyses show that in all measurement points, the values of the crest factor and impulse factor for vibration acceleration do not exceed the acceptable levels for long-term operation. Figure 5b (bottom diagram) additionally marks the Ca = 3.0 limit recommended by B&K for rolling bearings without damage (dashed line marks B&K).
Conclusion
The above findings imply that the vibration intensity of the BE#3 bucket elevator drive unit, evaluated using peak velocity and acceleration values according to Blake’s recommendations, makes it suitable long-term operation.

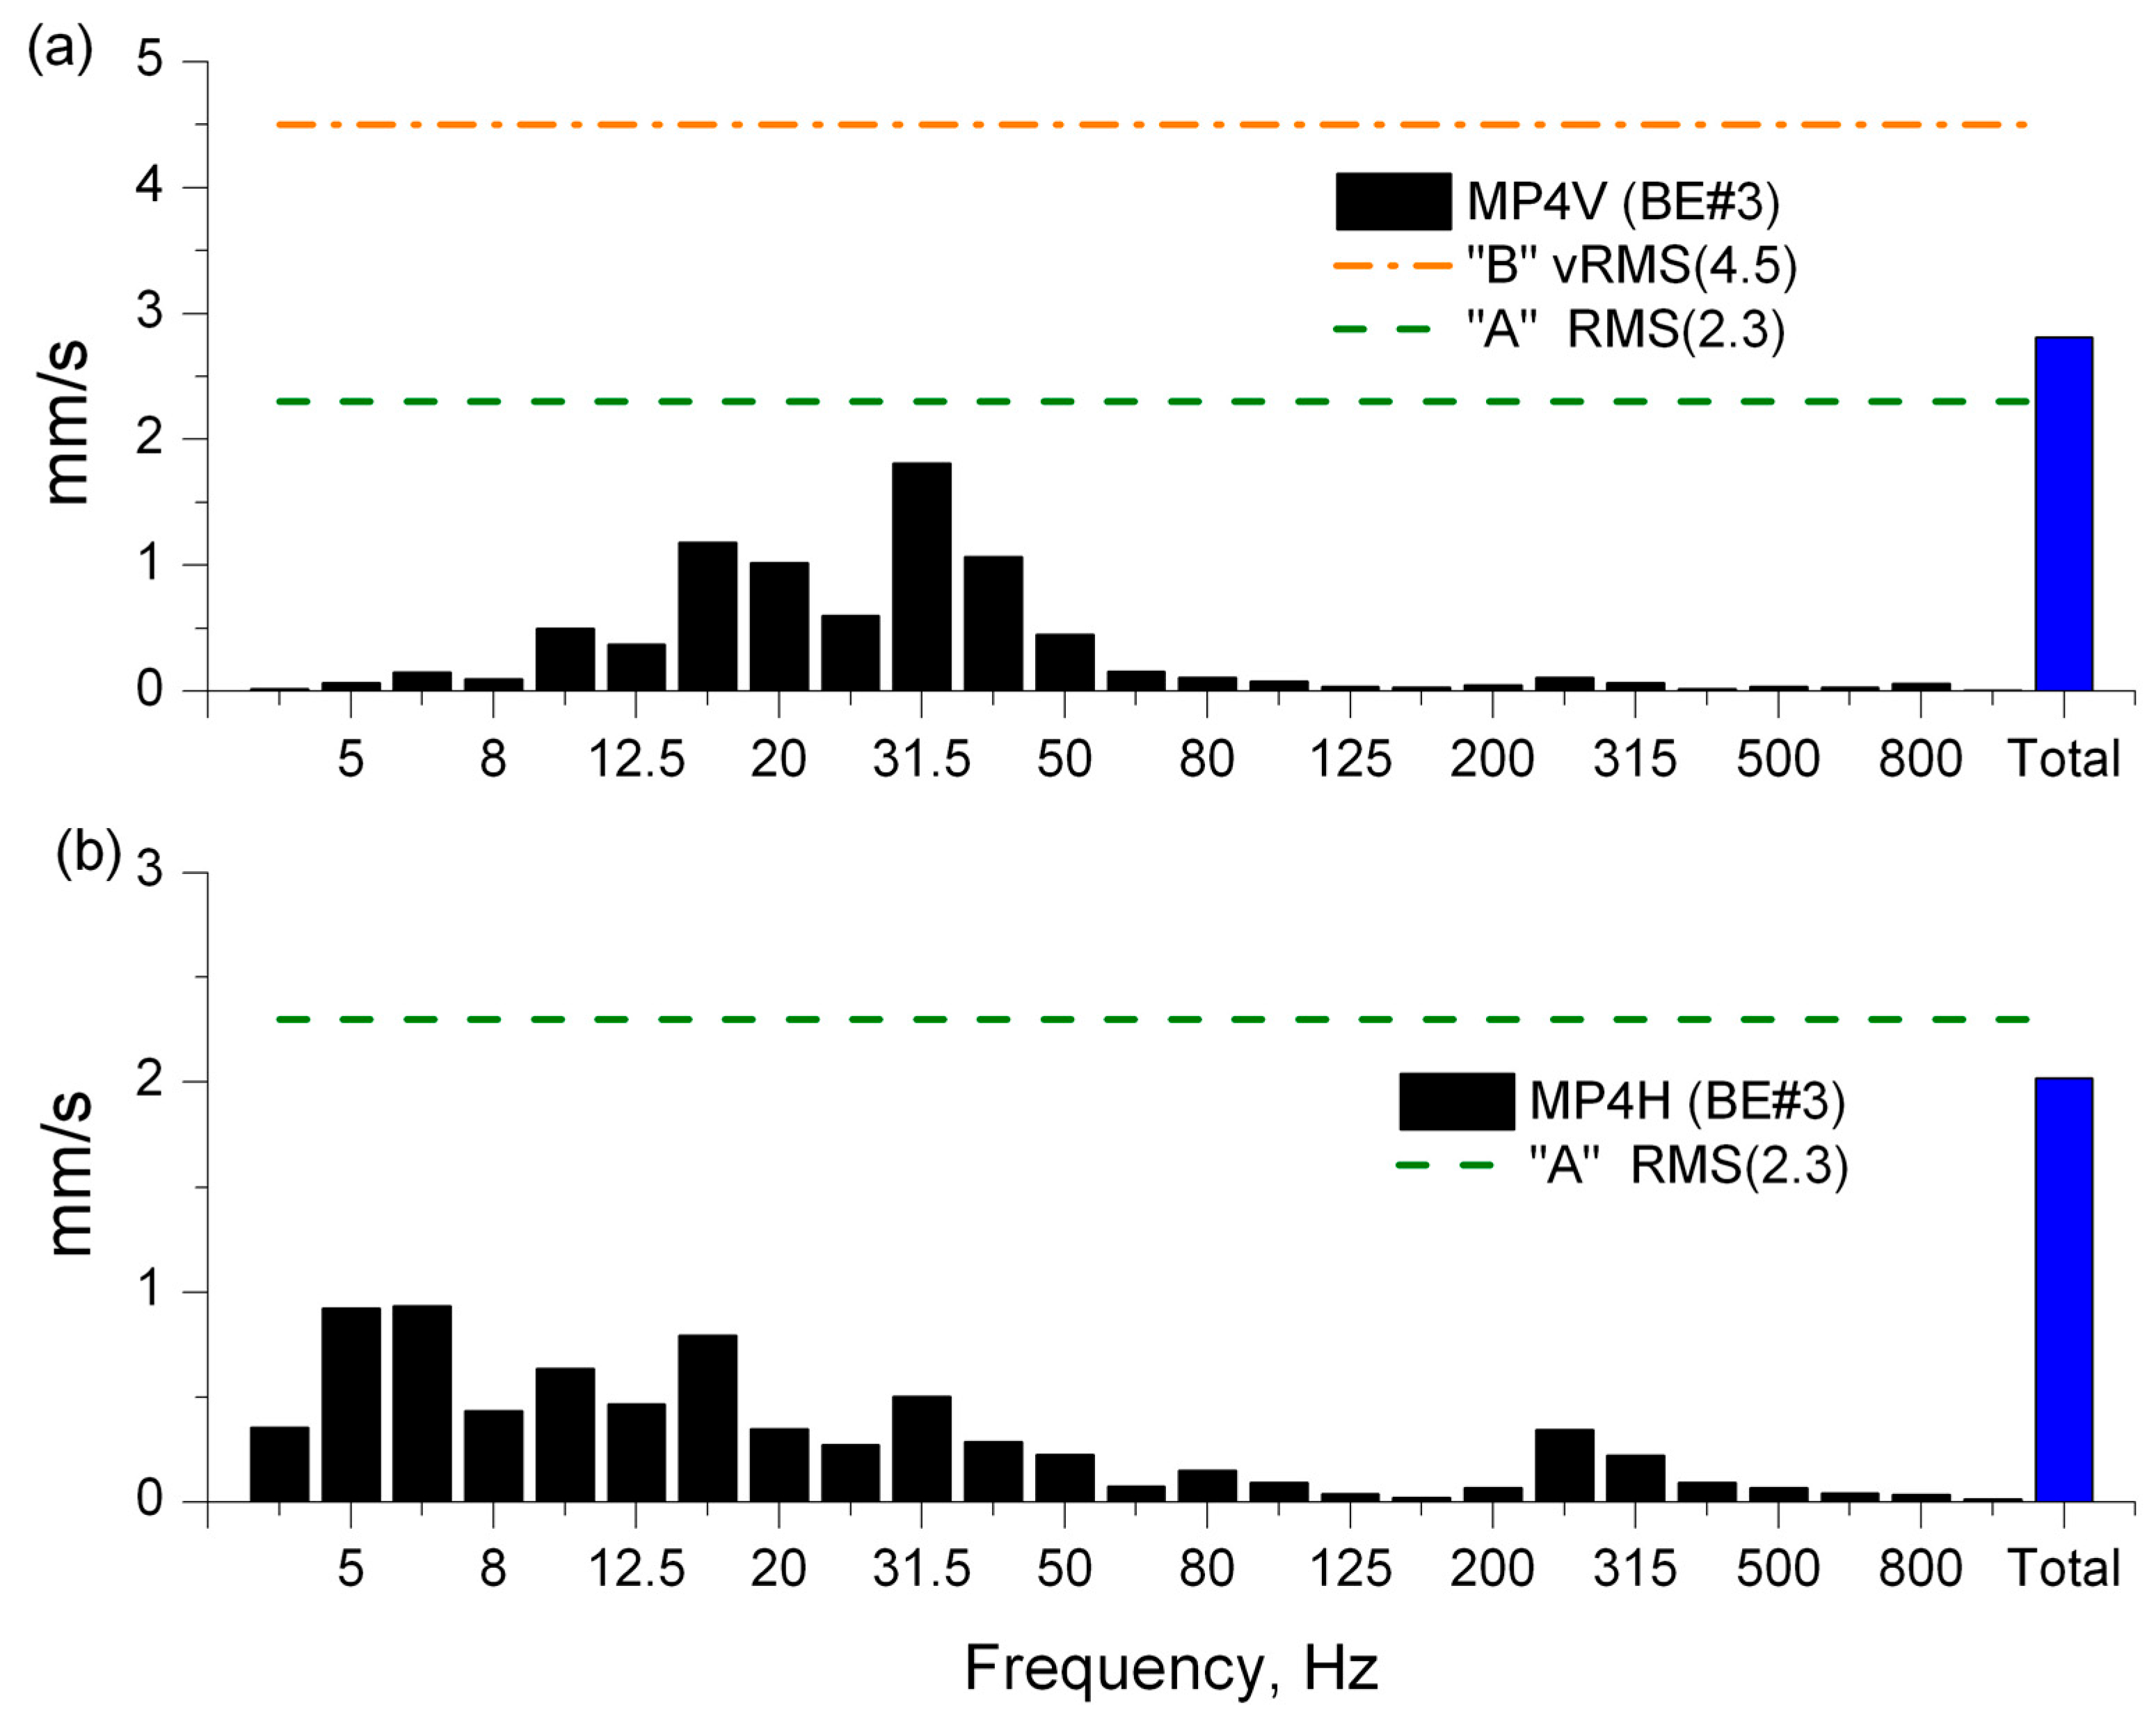
4.2. Results of Vibration Severity Analysis in the Frequency Domain

The time-based analysis of the vibration velocity waveforms was the first step in assessing the technical condition of the tested power unit. The next step was the analysis of the diagnostic signal in the frequency domain. This was carried out on the basis of broadband vibration velocity spectra (the 1/3 octave spectra). The broadband frequency analysis of vibration velocity signals was carried out according to the primary recommendation of the ISO-10816-3 standard.
The 1/3 octave analysis was performed in the range from 1 Hz to 10 kHz for all the points from MP1 to MP4 in the tested power unit. Examples of results are presented in Figure 6 and Figure 7, where the upper limits for zones “A” to “D” of vibration severity are also marked by relevant lines (dash, dash-dot or solid).
The broadband analysis of vibration velocity at measurement points MP1 to MP4 shows, among other things, that the highest vibration intensity during operation of the BE#3 bucket elevator under study occurred at the first bearing node of the input shaft (point MP1) and the first (outer) bearing node of the output slow-speed shaft at point MP3 (Figure 8).
This conclusion is consistent with the diagnostic evaluation based on peak value analysis of the signals.
In the context of the requirements formulated in ISO-10816-3, it was found that the vibration intensity at points MP1 and MP3 slightly exceeds the lower limit of the “B” condition but does not exceed the upper limit of the “C” zone. This means that the intensity of vibrations generated at points MP1 and MP3 on the drive unit is considered acceptable for long-term operation but with some restrictions, and that is why proper remedial action should be taken. At other points, MP2 and MP4, the level of vibration severity is acceptable for unrestricted long-term operation.
Conclusion
In the author’s opinion, the slightly higher level of vibration severity at points MP1 and MP3 resulted not from the operation of the tested drive unit but was caused by additional vibration transferred to the support frame from the housing of the bucket elevator.
However, if one adopts less restrictive requirements for the vibration intensity level—e.g., the acceptable vibration velocity vRMS(8.0) = 8.0 mm/s (as extensively presented in the paper [18])—then the vibration intensity at points MP1 and MP3 does meet the criteria for unrestricted long-term operation of the drive unit.

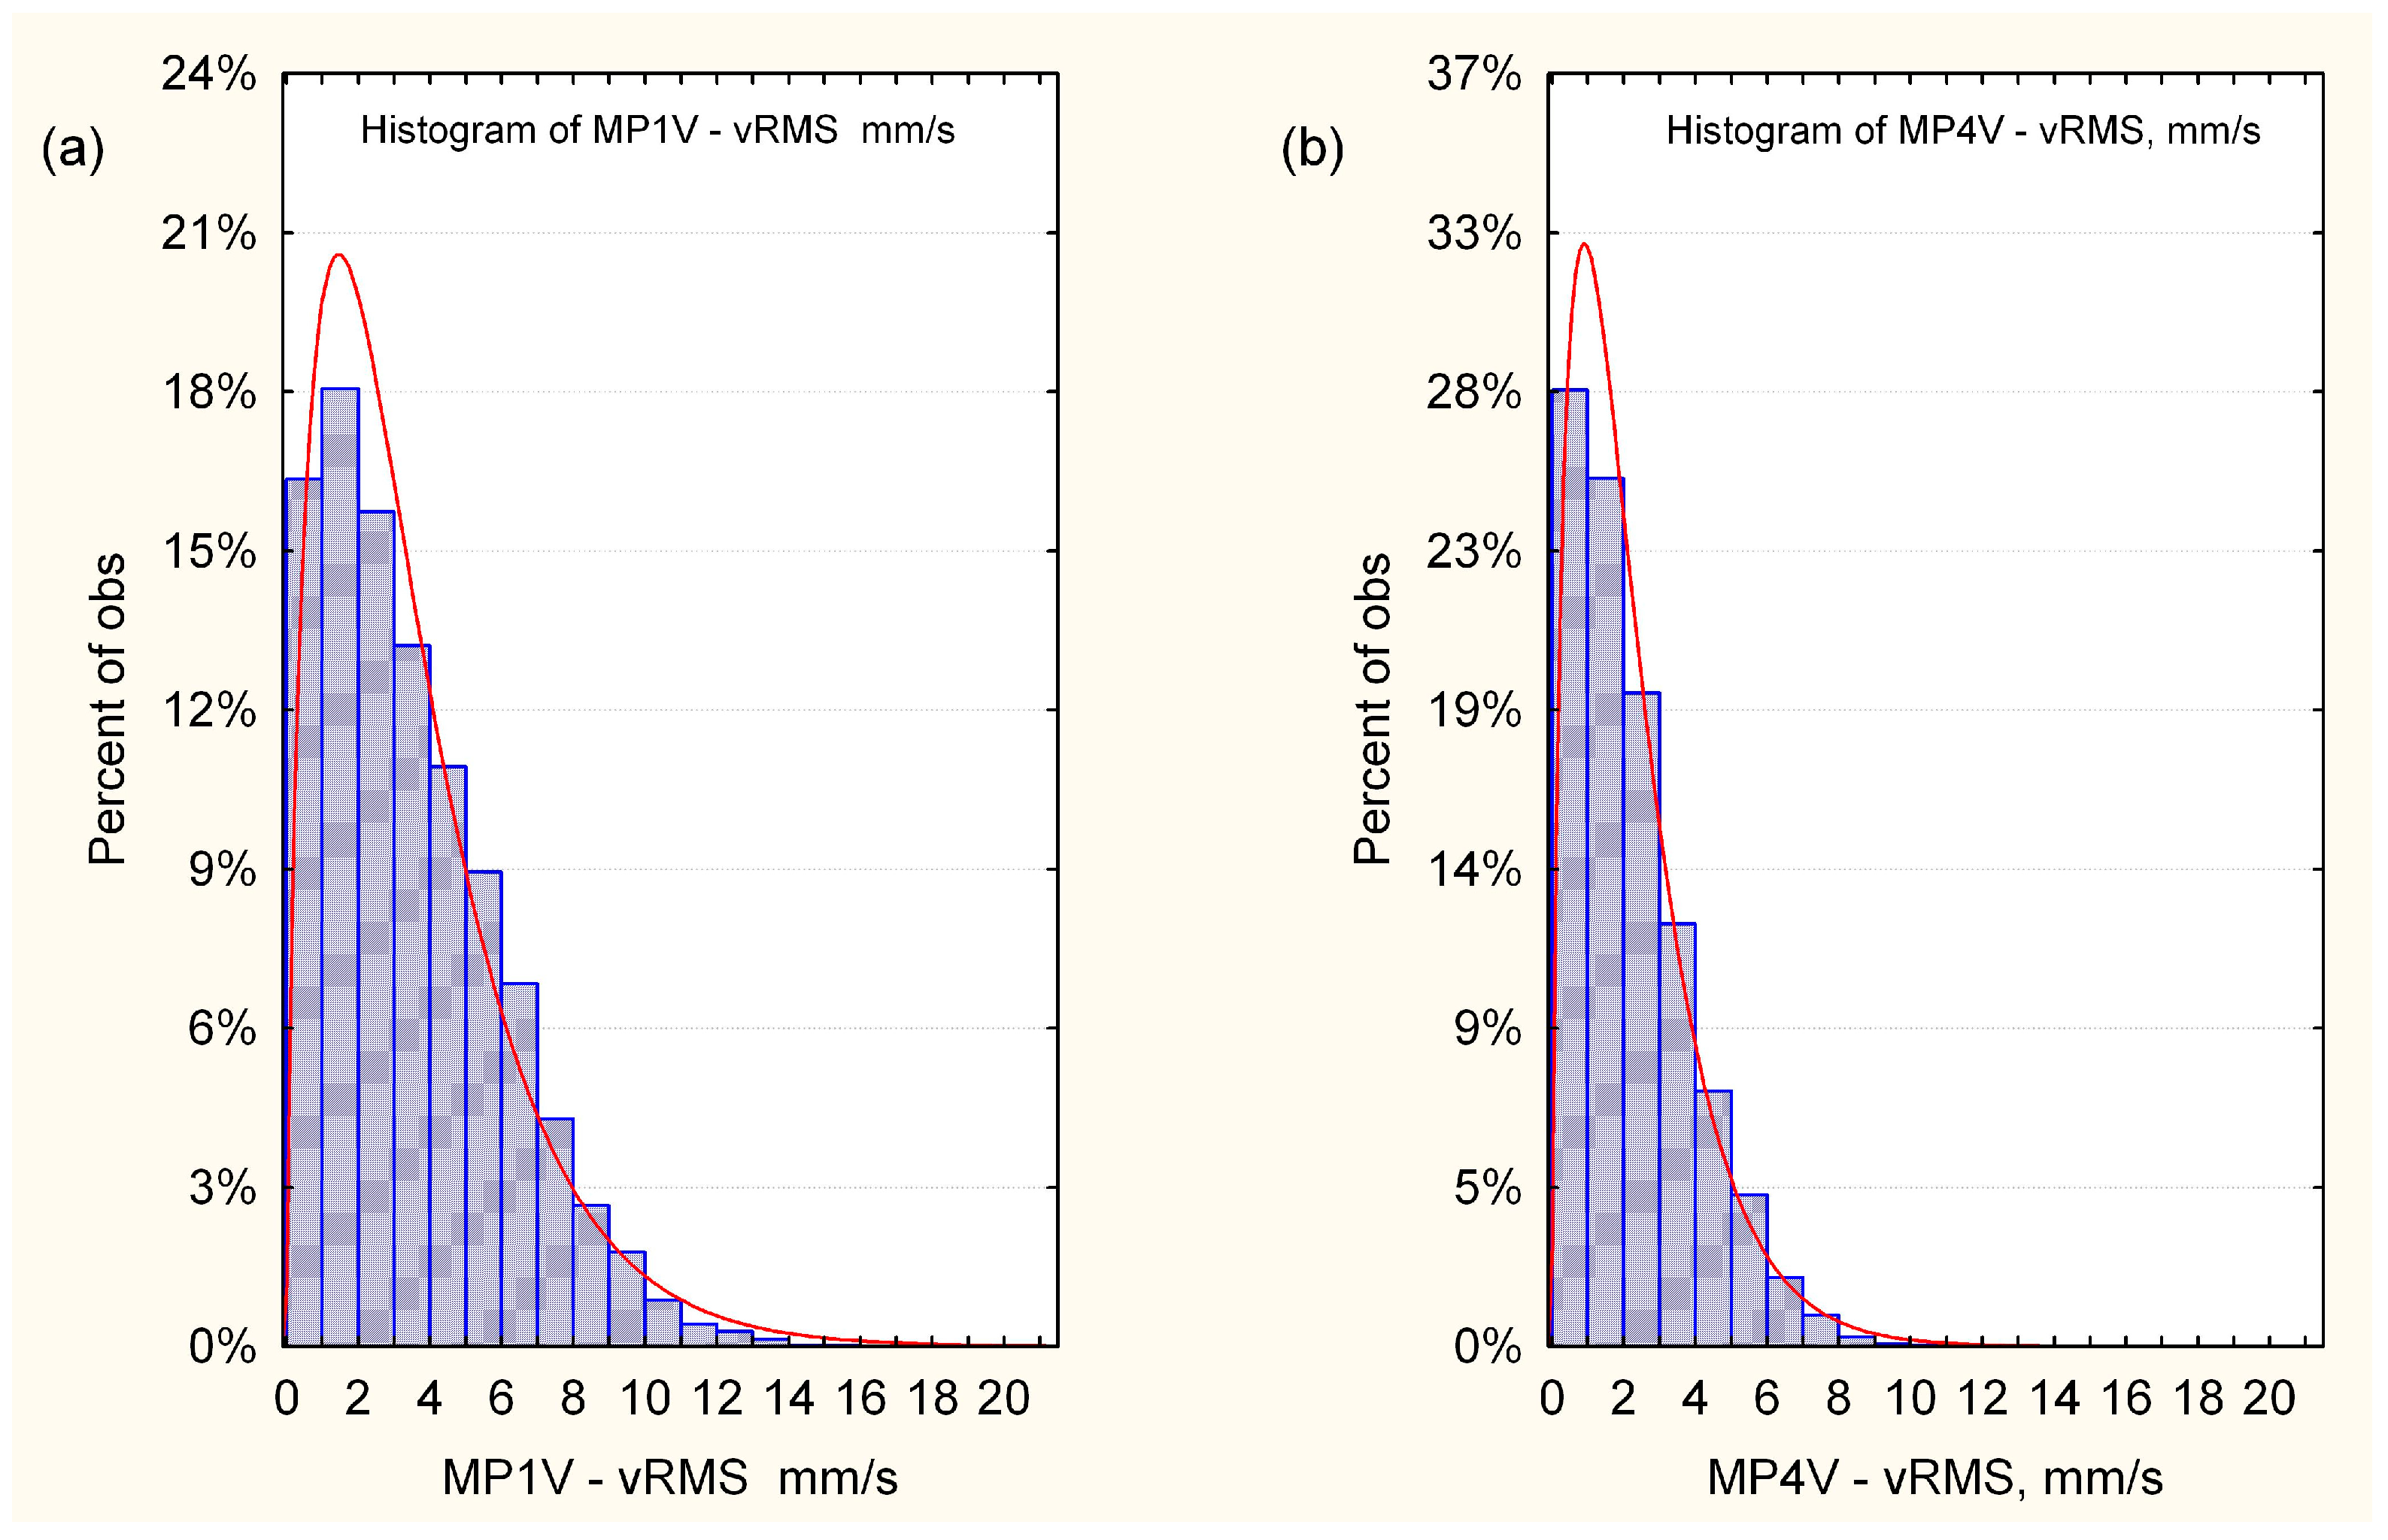
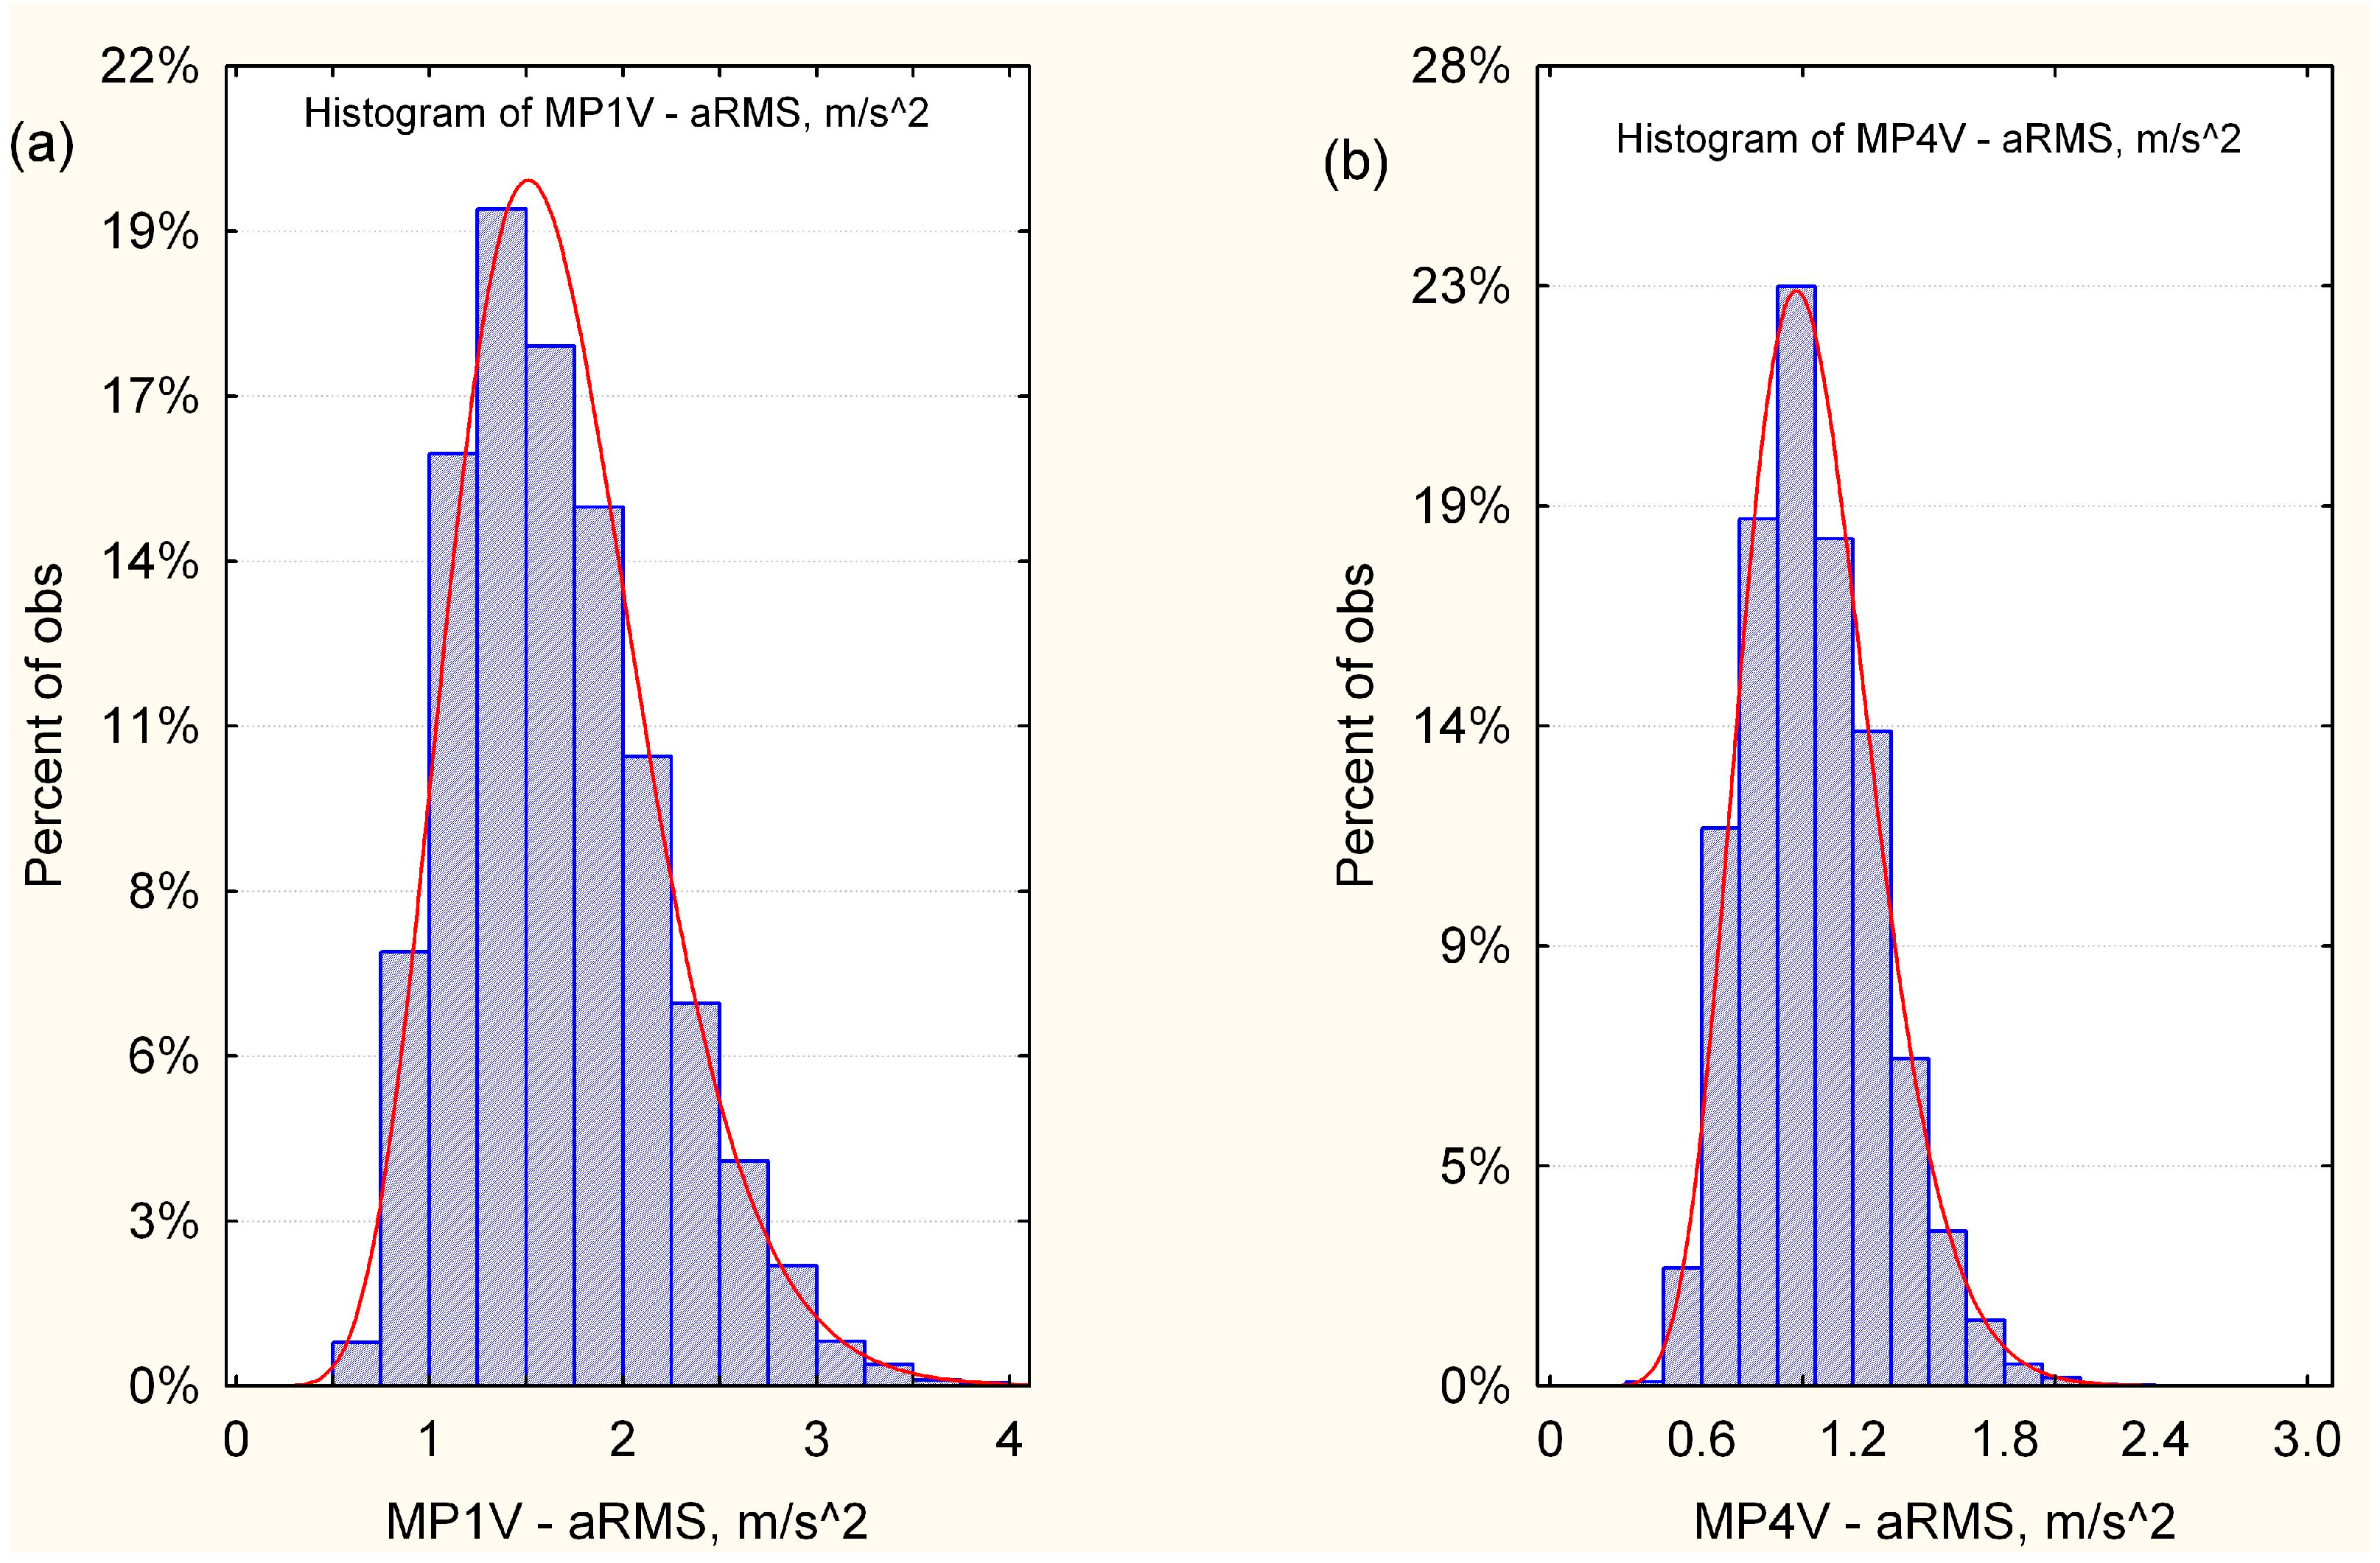
4.3. Results of Vibration Severity Analysis in the Probabilistic Approach

A probabilistic approach to assessing vibration severity was used to estimate the statistical distribution of velocity vRMS and acceleration aRMS in the measuring points MP1 to MP4 of the tested drive unit (using the maximum likelihood method). The best fit with experimental data was obtained using the two-parameter gamma distribution. Examples of histograms of vibration velocity and acceleration are presented in Figure 9 and Figure 10.
In the next step, the relevant quantiles Q0.90 and median of the vibration velocity and acceleration at the measuring points MP1 to MP4 of the tested drive unit were determined and are presented in Figure 11. The upper limits of vibration velocity vRMS = 4.5 mm/s for zone “B” (according to the ISO-10816-3 standard) as well as the limit vRMS = 8.0 mm/s (according to the less restrictive recommendation) are also marked.
Larger values of the Q0.90 quantiles of the measurement signals characterize a higher level of vibration intensity in probabilistic terms and, in these terms, can be regarded as symptoms of worse technical conditions.
Conclusion
Evaluation of vibration intensity using the probabilistic approach is not yet widespread in the literature. However, the probabilistic approach to vibration intensity analysis is more realistic, considering the nature of randomly varying signals. The machinery under study generally generates non-Gaussian diagnostic signals, hence the need to determine the actual statistical distributions of velocity and acceleration. This claim is based on [37] and the author’s previous research.

5. Conclusions

The main goal of this paper was to assess the vibration severity level in the drive unit of the tested bucket elevator and to determine if that drive unit is still suitable for long-term operation.
The vibration velocity and acceleration were assumed as diagnostic signals, and their characteristic features were used to determine the vibration severity. The vibration velocity and acceleration were measured at the bearing housings of the drive unit.
The assessment of vibration severity was based on the following three approaches:
  • In the time domain, based on the peak values of vibration signals;
  • In the frequency domain, based on the spectral analysis of vibration signals;
  • Using the probabilistic approach to the analysis of vibration signals.
In the vibration analysis based on the peak values of signals, Blake’s recommendations regarding the permissible limits of velocity and acceleration were taken into account.
The assessment of vibration severity performed in the frequency domain was based on the broadband (1/3 octave) spectra of vibration velocity and the severity zones according to the recommendations of ISO-10816-3.
The probabilistic approach to calculating vibration severity was carried out according to the author’s concept and based on the probability density function of vibration velocity and acceleration and the relevant quantiles. The probability density functions were estimated using the maximum likelihood method from the measured data. Quantile Q0.90 was proposed to measure the vibration severity in real technical systems.
The evaluation of vibration intensity in probabilistic terms, proposed by the author, offers new possibilities because it considers the actual random nature of diagnostic signals. The assumption that the machines under study generate Gaussian signals is not always justified.
There are many different diagnostic methods and each of them has its advantages and limitations. The vibroacoustic diagnostics method used by the author of the article is a non-invasive method that can be applied during regular operation of the machine or equipment under test.
A combination of various diagnostic methods, such as vibroacoustic diagnostics in conjunction with thermal imaging, helps to acquire additional information (so-called redundancy). Therefore, in the case of electric motors, in addition to the vibroacoustic method presented in this article, such a comprehensive procedure can include multiple methods, such as thermal imaging and measurements of the phase current, voltage and axial flux [38,39].
It should be noted that intelligent systems based on neural networks, including convolutional networks, are also used for condition monitoring and fault detection [40,41,42,43,44,45].

Funding

This research received no external funding.

Data Availability Statement

Data are contained within the article.

Conflicts of Interest

The author declares no conflict of interest.

References

  1. Feldman, M. Hilbert transform in vibration analysis. Mech. Syst. Signal Process. 2011, 25, 735–802. [Google Scholar] [CrossRef]
  2. Rai, A.; Upadhyay, S.H. A review on signal processing techniques utilized in the fault diagnosis of rolling element bearings. Tribol. Int. 2016, 96, 289–306. [Google Scholar] [CrossRef]
  3. Malla, C.; Panigrahi, I. Review of Condition Monitoring of Rolling Element Bearing Using Vibration Analysis and Other Techniques. J. Vib. Eng. Technol. 2019, 7, 407–414. [Google Scholar] [CrossRef]
  4. Jabłoński, A.; Dworakowski, Z.; Dziedziech, K.; Chaari, F. Vibration-based diagnostics of epicyclic gearboxes—From classical to soft-computing methods. Measurement 2019, 147, 106811. [Google Scholar] [CrossRef]
  5. Skal’s’kyi, V.R.; Stankevych, O.M.; Kuz’, I.S. Application of Wavelet Transforms for the Analysis of Acoustic-Emission Signals Accompanying Fracture Processes in Materials (A Survey). Mater. Sci. 2018, 54, 139–153. [Google Scholar] [CrossRef]
  6. Bortnowski, P.; Gładysiewicz, L.; Król, R.; Ozdoba, M. Models of transverse vibration in conveyor belt—Investigation and analysis. Energies 2021, 14, 4153. [Google Scholar] [CrossRef]
  7. Baccar, D.; Söffker, D. Identification and classification of failure modes in laminated composites by using a multivariate statistical analysis of wavelet coefficients. Mech. Syst. Signal Process. 2017, 96, 77–87. [Google Scholar] [CrossRef]
  8. Chen, Y.; Zhang, T.; Luo, Z.; Sun, K. A novel rolling bearing fault diagnosis and severity analysis method. Appl. Sci. 2019, 9, 2356. [Google Scholar] [CrossRef]
  9. Badihi, H.; Zhang, Y.; Jiang, B.; Pillay, P.; Rakheja, S. A Comprehensive Review on Signal-Based and Model-Based Condition Monitoring of Wind Turbines: Fault Diagnosis and Lifetime Prognosis. Proc. IEEE 2022, 110, 754–806. [Google Scholar] [CrossRef]
  10. Huang, L.T.; Chang, J.Y. Vibration Characterization and Fault Diagnosis of a Planetary Gearbox with a Wireless Embedded Sensor. Appl. Sci. 2023, 13, 729. [Google Scholar] [CrossRef]
  11. Abouel-seoud, S.A. Fault detection enhancement in wind turbine planetary gearbox via stationary vibration waveform data. J. Low Freq. Noise Vib. Act. Control 2018, 37, 477–494. [Google Scholar] [CrossRef]
  12. Yadavar Nikravesh, S.M.; Rezaie, H.; Kilpatrik, M.; Taheri, H. Intelligent fault diagnosis of bearings based on energy levels in frequency bands using wavelet and support vector machines (SVM). J. Manuf. Mater. Process. 2019, 3, 11. [Google Scholar] [CrossRef]
  13. Abboud, D.; Elbadaoui, M.; Smith, W.A.; Randall, R.B. Advanced bearing diagnostics: A comparative study of two powerful approaches. Mech. Syst. Signal Process. 2019, 114, 604–627. [Google Scholar] [CrossRef]
  14. Sokolski, P.; Smolnicki, T. A Method for Monitoring the Technical Condition of Large-Scale Bearing Nodes in the Bodies of Machines Operating for Extended Periods of Time. Energies 2021, 14, 6637. [Google Scholar] [CrossRef]
  15. Asmussen, M.F.; Liniger, J.; Pedersen, H.C. Fault detection and diagnosis methods for fluid power pitch system components—A review. Energies 2021, 13, 1305. [Google Scholar] [CrossRef]
  16. Jonas, S.; Anagnostos, D.; Brodbeck, B.; Meyer, A. Vibration Fault Detection in Wind Turbines Based on Normal Behaviour Models without Feature Engineering. Energies 2023, 16, 1760. [Google Scholar] [CrossRef]
  17. Yan, R.; Gao, R.X.; Chen, X. Wavelets for fault diagnosis of rotary machines: A review with applications. Signal Process. 2014, 96, 1–15. [Google Scholar] [CrossRef]
  18. Sokolski, P.; Sokolska, J. A method of comparative evaluation of the drive units of two bucket elevators—A case study. Energies 2021, 14, 7439. [Google Scholar] [CrossRef]
  19. Wang, Y.; Zheng, L.; Gao, Y.; Li, S. Vibration Signal Extraction Based on FFT and Least Square Method. IEEE Access 2020, 8, 224092–224107. [Google Scholar] [CrossRef]
  20. Jaros, R.; Byrtus, R.; Dohnal, J.; Danys, L.; Baros, J.; Koziorek, J.; Zmij, P.; Martinek, R. Advanced Signal Processing Methods for Condition Monitoring. Arch. Comput. Methods Eng. 2023, 30, 1553–1577. [Google Scholar] [CrossRef]
  21. Strömbergsson, D.; Marklund, P.; Berglund, K.; Larsson, P.E. Bearing monitoring in the wind turbine drivetrain: A comparative study of the FFT and wavelet transforms. Wind Energy 2020, 23, 1381–1393. [Google Scholar] [CrossRef]
  22. Li, S.Y.; Tam, L.M.; Wu, S.P.; Tsai, W.L.; Hu, C.W.; Cheng, L.Y.; Xu, Y.X.; Cheng, S.C. The Performance Investigation of Smart Diagnosis for Bearings Using Mixed Chaotic Features with Fractional Order. Sensors 2023, 23, 3801. [Google Scholar] [CrossRef]
  23. Yazdanpanah Goharrizi, A.; Sepehri, N. A wavelet-based approach to internal seal damage diagnosis in hydraulic actuators. IEEE Trans. Ind. Electron. 2010, 57, 1755–1763. [Google Scholar] [CrossRef]
  24. Goharrizi, A.Y.; Sepehri, N.; Wu, Y. A wavelet-based approach for online external leakage diagnosis and isolation from internal leakage in hydraulic actuators. Int. J. Fluid Power 2011, 12, 37–47. [Google Scholar] [CrossRef]
  25. Shi, Z.; Yang, X.; Li, Y.; Yu, G. Wavelet-based Synchroextracting Transform: An effective TFA tool for machinery fault diagnosis. Control Eng. Pract. 2021, 114, 104884. [Google Scholar] [CrossRef]
  26. Liu, Z.; Zhang, L.; Carrasco, J. Vibration analysis for large-scale wind turbine blade bearing fault detection with an empirical wavelet thresholding method. Renew. Energy 2020, 146, 99–110. [Google Scholar] [CrossRef]
  27. Maliuk, A.S.; Ahmad, Z.; Kim, J.M. Hybrid Feature Selection Framework for Bearing Fault Diagnosis Based on Wrapper-WPT. Machines 2022, 10, 1204. [Google Scholar] [CrossRef]
  28. ISO-10816-3; Mechanical Vibration. Evaluation of Machine Vibration by Measurements on Non-Rotating Parts. Part 3: Industrial Machines with Nominal Power above 15 kW and Nominal Speeds between 120 r/min and 15,000 r/min When Measured In Situ. ISO: Geneva, Switzerland, 2009.
  29. Elsamanty, M.; Ibrahim, A.; Saady Salman, W. Principal component analysis approach for detecting faults in rotary machines based on vibrational and electrical fused data. Mech. Syst. Signal Process. 2023, 200, 110559. [Google Scholar] [CrossRef]
  30. He, L.; Unnikrishnan, J.; Hao, L.; Matthews, B.; Qiao, W. Enhanced Wind Turbine Main Drivetrain Gearbox and Bearing Monitoring and Diagnostics via Information Fusion of Acoustic Electrical and Vibration Signatures. In Proceedings of the Electric Machines—Drives Conference (IEMDC) 2019 IEEE, San Diego, CA, USA, 12–15 May 2019. [Google Scholar] [CrossRef]
  31. Jabłoński, M.; Borkowski, P. Industrial implementations of control algorithms for voltage inverters supplying induction motors. Arch. Electr. Eng. 2021, 70, 475–491. [Google Scholar] [CrossRef]
  32. Jabłoński, M.; Borkowski, P. Correction Mechanism for Balancing Driving Torques in an Opencast Mining Stacker with an Induction Motor and Converter Drive System. Energies 2022, 15, 1282. [Google Scholar] [CrossRef]
  33. PN-ISO 8579-2:1996; Przepisy Odbioru Przekładni Zębatych—Określanie Drgań Mechanicznych Przekładni Zębatych Podczas Badań Odbiorczych (Gearbox Acceptance Regulations—Determination of Mechanical Vibration of Gearboxes during Acceptance Tests). ISO: Geneva, Switzerland, 1996. (In Polish)
  34. Blake, M.P.; Mitchell, W.S. Vibration and Acoustic Measurement Handbook; Spartan Books: New York, NY, USA, 1972. [Google Scholar]
  35. Cempel, C. Diagnostyka techniczna—Spojrzenie syntetyczne (Machine Condition Monitoring-Historic Overview). Diagnostyka Diagn. Struct. Health Monit. 2011, 1, 55–67. (In Polish) [Google Scholar]
  36. Brüel & Kjær an HBK Company. Available online: https://www.bksv.com/media/doc/bo0253.pdf (accessed on 1 June 2021).
  37. Cempel, C. Fundamentals of vibroacoustical condition monitoring. In Handbook of Condition Monitoring; Davies, A., Ed.; Springer: Dordrecht, The Netherlands, 1998; pp. 324–353. [Google Scholar] [CrossRef]
  38. Pietrzak, P.; Wolkiewicz, M. Machine Learning-Based Stator Current Data-Driven PMSM Stator Winding Fault Diagnosis. Sensors 2022, 22, 9668. [Google Scholar] [CrossRef]
  39. Skowron, M.; Krzysztofiak, M.; Orlowska-Kowalska, T. Effectiveness of neural fault detectors of permanent magnet synchronous motor trained with symptoms from field-circuit modeling. IEEE Access 2022, 10, 104598–104611. [Google Scholar] [CrossRef]
  40. Choi, S.; Haque, M.S.; Tarek, M.T.B.; Mulpuri, V.; Duan, Y.; Das, S.; Garg, V.; Ionel, D.M.; Masrur, M.A.; Mirafzal, B.; et al. Fault diagnosis techniques for permanent magnet ac machine and drives—A review of current state of the art. IEEE Trans. Transp. Electrif. 2018, 4, 444–463. [Google Scholar] [CrossRef]
  41. Khaneghah, M.Z.; Alzayed, M.; Chaoui, H. Fault Detection and Diagnosis of the Electric Motor Drive and Battery System of Electric Vehicles. Machines 2023, 11, 713. [Google Scholar] [CrossRef]
  42. Hsueh, Y.-M.; Ittangihal, V.R.; Wu, W.-B.; Chang, H.-C.; Kuo, C.-C. Fault diagnosis system for induction motors by CNN using empirical wavelet transform. Symmetry 2019, 11, 1212. [Google Scholar] [CrossRef]
  43. Ribeiro Junior, R.F.; dos Santos Areias, I.A.; Campos, M.M.; Teixeira, C.E.; da Silva, L.E.B.; Gomes, G.F. Fault detection and diagnosis in electric motors using convolution neural network and short-time fourier transform. J. Vib. Eng. Technol. 2022, 10, 2531–2542. [Google Scholar] [CrossRef]
  44. Xu, G.; Liu, M.; Jiang, Z.; Shen, W.; Huang, C. Online fault diagnosis method based on transfer convolutional neural networks. IEEE Trans. Instrum. Meas. 2019, 69, 509–520. [Google Scholar] [CrossRef]
  45. Wang, L.; Zhang, C.; Zhu, J.; Xu, F. Fault Diagnosis of Motor Vibration Signals by Fusion of Spatiotemporal Features. Machines 2022, 10, 246. [Google Scholar] [CrossRef]
Figure 1. The drive unit of the tested bucket elevator BE#3 (the locations of MP points of vibration measurement are marked).
Energies 16 07852 g001
Figure 2. Time waveform of: (a) vibration velocity (top diagram) and (b) acceleration (bottom diagram) at the point MP1 (in the vertical direction) in the power unit of the tested bucket elevator BE#3.
Energies 16 07852 g002
Figure 3. Time waveform of: (a) vibration velocity (top diagram) and (b) acceleration (bottom diagram) at the point MP4 (in the vertical direction) in the power unit of the tested bucket elevator BE#3.
Energies 16 07852 g003
Figure 4. RMS and peak of: (a) vibration velocity, (b) vibration acceleration in the measuring points MP1–MP4. According to Table 1, level B(v) = 25 mm/s, level C(v) = 10.5 mm/s, level C(a) = 5.5 m2/s.
Energies 16 07852 g004
Figure 5. Crest factor and impulse factor of: (a) vibration velocity, (b) vibration acceleration in the measuring points MP1–MP4. Green line marks Ca = 3.0 recommended by B&K.
Energies 16 07852 g005
Figure 6. Example of the spectrum of the RMS vibration velocity at point MP1 in the bucket elevator BE #3: (a) in the vertical direction (top) and (b) in the horizontal direction (bottom); the total value is marked as a blue column.
Energies 16 07852 g006
Figure 7. Example of the spectrum of the RMS vibration velocity at point MP4 in the bucket elevator BE#3: (a) in the vertical direction (top) and (b) in the horizontal direction (bottom); the total value is marked as a blue column.
Energies 16 07852 g007
Figure 8. Total values of the RMS velocity in points MP1 to MP4 of the tested drive units.
Energies 16 07852 g008
Figure 9. Examples of histograms of vibration velocity vRMS (in the vertical direction) at the points: (a) MP1, (b) MP4. The estimated gamma probability distribution functions are shown.
Energies 16 07852 g009
Figure 10. Examples of histograms of vibration acceleration aRMS (in the vertical direction) at the points: (a) MP1, (b) MP4. The estimated gamma probability distribution functions are shown.
Energies 16 07852 g010
Figure 11. Statistical parameters of (a) vibration velocity, (b) vibration acceleration in the vertical direction in the tested drive unit of the bucket elevator BE#3.
Energies 16 07852 g011
Table 1. Condition classification recommended by Blake based on vibration severity (based on [34]).
Upper LimitsClasses of Condition
Effective Velocity Peak, mm/sEffective Acceleration Peak, m/s2
140.5981.0AA—Danger
59.25174.6A—Acute Fault
25.031.0B—Some Fault
10.55.5C—Minor Fault
4.51.0D—No Fault
Note: The table includes values converted from US customary units to SI units. The calculations assume standard gravity g = 9.81 m/s2.
Table 2. Numerical values used for a qualitative assessment of the technical condition of the tested drive unit (according to ISO-10816-3).
Support
Conditions
Upper Limits of
Velocity RMS, mm/s
Evaluation Zones/Vibration Severity
Flexible2.3Zone “A”—vibration severity for newly commissioned drive units
4.5Zone “B”—vibration severity is considered acceptable for unrestricted long-term operation
7.1Zone “C”—vibration severity is considered unsatisfactory for unrestricted long-term continuous operation, and remedial action should be taken
>7.1Zone “D”—vibration severity is sufficiently high to cause damage
Disclaimer/Publisher’s Note: The statements, opinions and data contained in all publications are solely those of the individual author(s) and contributor(s) and not of MDPI and/or the editor(s). MDPI and/or the editor(s) disclaim responsibility for any injury to people or property resulting from any ideas, methods, instructions or products referred to in the content.

