1. Introduction
Three-phase induction motors (TIMs) are simple and robust electromechanical devices. The industrial sector widely employs TIMs in processes that include pumping, ventilation, compressors, conveyor belts, and machine tools. Electric motors consume more than half of the total electrical energy generated worldwide, with TIMs accounting for around 60% of industrial energy consumption [
1]. Despite their robust construction, TIMs are susceptible to failures, of which 35–45% are electrical. Among these, approximately 36% are related to the stator [
2]. The reliable detection of incipient stator failures is critical in manufacturing as it avoids unexpected process stops and financial losses.
Several techniques have been proposed in the literature to detect faults in electric motors [
3]. Stray flux signature analysis (SFSA) is a promising method for collecting signals using external search coil sensors (SCs) [
4,
5], which is noninvasive, and its installation does not require interrupting the manufacturing process. Furthermore, machine learning (ML) algorithms have gained importance in identifying the type and intensity of TIM failures [
6]. In Georgoulas et al. [
7], the acquisition of the axial and radial leakage fluxes, current of one phase, and speed were used to identify inter-turn short circuit (ITSC) in the TIM fed inverter. The strategy applied a filter approach using the area under the receiver operating characteristic (ROC) curve for feature selection, a linear classifier with minimum Mahalanobis distance, and a random forest (RF) classifier. RF performance was slightly superior, and frequency components below 2 kHz can be used for detection. In Irhoumah et al. [
8], the authors proposed the detection of ITSC through SFSA using two SCs arranged 180°. The signal harmonics were analyzed using Pearson’s correlation coefficient. While this method does not require knowledge of the machine’s healthy state, it demands precise sensor alignment, and its modeling is based on a specific machine geometry. Based on Irhoumah et al. [
8], the work of Irhoumah et al. [
9] increased the number of SCs to investigate the effects of different load operating conditions. The authors applied fusion information with belief function to the correlation coefficients to detect failures.
In Zamudio-Ramírez et al. [
10], the authors proposed a smart sensor based on primary hall effect sensors, which can capture the stray flux in different directions in its axial, radial, and combination of both components. The approach consists of applying the short-term Fourier transform (STFT), linear discriminant analysis (LDA), and a multilayer perceptron (MLP) to classify misalignment, broken rotor bars, and stator failure. The study reported a high-accuracy diagnosis, demonstrating that SFSA is a promising signal for fault detection. The detection of ITSC through SCs using the discrete wavelet transform (DWT) is proposed in the works of Cherif et al. [
11] and Frosini et al. [
12]. The energy calculated in each decomposition coefficient allowed the estimation of the failure severity. It is concluded that ITSC failure causes substantial changes in the energy ratio of the component.
The work of Tian et al. [
13] proposed different types of SCs with and without iron cores, considering the shapes “E” and “U” to increase the intensity of the induced voltage. The authors concluded that the nonlinearity of the ferromagnetic material does not affect classification, and the induced voltages have higher amplitudes than those of the air core, which is advantageous in noisy environments. The study of Lamim Filho et al. [
14] used the filtered orbit, obtained from the full SFSA spectrum, to identify several ITSC severities in TIM, considering unbalanced voltages and load variation. The experimental results showed that the failure modifies the orbital area and the direction of rotation. In Cunha et al. [
15], the authors described an algorithm that combines DWT and statistical features applied to axial flux signals. Analysis of variance (ANOVA) and F1-score were used to reduce the number of attributes. The comparison between MLP, k-nearest neighbors (
k-NNs), optimum path forest (OPF), and the support vector machine (SVM) showed that SVM achieved superior performance.
A substantial portion of the studies mentioned involve complex computational methods to extract failure indicators, making these strategies unfeasible for practical implementation and requiring reduced computation time. The method proposed in this work employs only time-domain statistical measures obtained from stray flux signals, so the computational burden tends to be minimal. In addition, few methodologies in the literature are concerned with developing a strategy to estimate the relevance of the extracted attributes and their potential to characterize ITSC. Considering the importance of a reduced feature set, this work presents a detailed attribute engineering method to identify the most relevant fault indicators, using SC to collect information, promoting data analysis, and exploring several ML techniques to classify ITSC. The sensor developed for this work is noninvasive and may be fixed externally to the motor housing. In addition to that, it can measure the stray flux independently of the motor power and dimension. This method does not require prior machine modeling and is completely based on experimental signals collected from the motor. The TIM stator coils were fully rewinded and damaged at specific points connected to external taps to emulate various ITSC intensities. Therefore, resistors were not required to regulate the short-circuit current, reflecting real operating conditions.
Thus, the main contributions of this work are as follows:
Using stray flux, this work presents an innovative technique for identifying short circuits between stator turns in asynchronous motors. The technique comprises the construction of an external SC sensor, the acquisition of signals, and their subsequent analysis via a digital processor.
Unlike existing studies that involve complex computational methods for extracting failure indicators, the proposed method uses only statistical measures in the time domain obtained from stray flux signal. This approach ensures minimal computational burden, making it suitable for applications that require reduced computation time.
In this work, a comprehensive attribute engineering approach is introduced that acknowledges the importance of reducing the set of features. This study aims to determine the most relevant defect indicators employing the SC sensor developed in the feature extraction, selection, and evaluation processes. This strategy helps characterize incipient-turn short circuits.
The developed sensor is non-invasive, allowing it to be fixed externally to the motor housing. The method is experimentally validated with tests on motors exhibiting supply voltage imbalance and a wide range of torque variation. Furthermore, multiple relative positions between the sensor and the faulty coil were considered to improve the robustness and reliability of the proposed method. It proves to be effective in detecting incipient stator failures, even when only 1% of the stator turns were short-circuited. It does not require prior machine modeling, relying solely on experimental signals collected from the motor under real operating conditions.
The remainder of this paper is organized as follows.
Section 2 presents the theoretical background, discussing feature engineering techniques, feature selection methods, classification algorithms, and data balancing strategies relevant to fault detection.
Section 3 describes the materials and methods, detailing the experimental setup, signal acquisition, feature extraction, and classification procedures.
Section 4 presents the results, evaluating the performance of binary and multiclass classification approaches and analyzing the impact of dimensionality reduction through principal component analysis (PCA), and after the discussion of the findings, including the influence of SMOTETomek on classification performance, the trade-offs between feature reduction and computational efficiency, and comparisons with existing methodologies. Finally,
Section 5 concludes the study by summarizing the main contributions and discussing the feasibility of implementing the proposed approach in industrial applications with computational constraints.
3. Materials and Methods
Feature extraction, selection, and evaluation were performed to identify the most relevant indicators of ITSC faults. The random forest (RF) method was implemented for feature selection, focusing on time-domain attributes to minimize computational complexity and execution time. Despite the potential benefits of frequency-domain analysis, time-domain features were selected due to their lower computational cost, ensuring suitability for real-time applications.
To mitigate the impact of electromagnetic noise from surrounding equipment, the experimental setup was designed to isolate the motor and sensor from external sources of interference. The search coil sensor was shielded to reduce the pickup of external electromagnetic fields, and data acquisition was performed under controlled conditions.
Various SC sensors have been developed in the literature, employing different materials in the construction of their cores, such as metal alloys (commercial), air [
11,
15], and ferromagnetic [
13]. The air core is simple to produce and is free of saturation difficulties associated with ferromagnetic materials. However, the induced voltage is typically low, which requires thousands of turns in some situations to maintain the higher resonance frequency without damaging the signal-to-noise ratio [
8]. Sensors with a high-permeability ferromagnetic core have advantages, including reducing the number of coil turns, reducing thermal noise, increasing resonance frequency, and improving the noise-signal ratio. It also allows the implementation of sensors with smaller sizes than commercial ones, such as Emerson flow sensors [
12]. For this study, a U-shaped SC-type sensor was constructed with a ferromagnetic core composed of a M4 cold-rolled grain-oriented (CRGO) laminated material with a thickness of 0.27 mm, containing 3 stacked pieces and 1200 turns of enameled copper wire with a circular cross-section of 0.00636 mm
2.
Figure 1 shows the search coil sensor developed in this work.
The search coil sensor was mounted externally on the motor housing, positioned near the stator core to measure the variations in the stray flux without directly interfering with motor operation. Due to the three-phase nature of induction motors, the stray flux signal inherently contains contributions from all three phases, making it possible to capture relevant fault signatures without the need for multiple sensor placements [
4,
5].
Unlike methods that rely on a single relative position between the search coil and the faulty winding, which may require careful sensor positioning to capture localized effects, our approach considers three relative positions, minimizing the positioning problem and improving the robustness of the method. The three relative positions used in this work can be seen in
Figure 2, in which the faulty windings are represented in red.
Moreover, the noninvasive characteristic of the search coil sensor provides additional advantages for practical applications. Since the sensor does not need direct contact with the motor windings and is not highly sensitive to placement variations, it can be easily implemented in industrial settings without requiring modifications to the motor housing or internal components [
8], which makes it suitable for real-world fault detection applications, minimizing installation complexity while maintaining high detection accuracy.
The TIM load element is a 2 kW DC generator connected to a resistor bank. Two motors were used to create this work database. TIM 1 is a 1 HP, with four poles, 220 V, 1730 rpm, and 60 Hz, and TIM 2 is a 2 HP, with four poles, 220 V, 1750 rpm, and 60 Hz. These machines had their windings modified to emulate stator short circuits, considering intensities of 1%, 3%, 5%, and 10%.
Figure 3 illustrates the experimental bench for data acquisition, highlighting the search coil attached to the motor.
Figure 4 presents the proposed method, from data collection to machine learning evaluation.
First, in step (a), data were acquired using the SC and a signal conditioning board (NI-DAQ6210) with 16-bit resolution 16 kHz of sampling rate, over an acquisition time of 3 s. For TIM 1, the load torque ranged from 0.5 N·m to 5.0 N·m in increments of 0.5 N·m; for TIM 2, the load torque ranged from 0.5 N·m to 9.0 N·m, with an initial step of 0.5 N·m and subsequent steps of 1.0 N·m, totaling 10 load levels per motor. The stator short-circuit levels were applied to the 3 phases, one at a time, with 0% (healthy), 1%, 3%, 5%, and 10%, totaling 5 conditions for each phase. In addition, acquisitions were made considering 11 different levels of voltage supply: balanced voltages, reducing the voltage of phase A while keeping the voltages of phases B and C constant, and keeping phase A constant while simultaneously increasing the voltage of phase B and decreasing the voltage of phase C.
Table 1 shows the motor power supply and the load variation for each short circuit level. Therefore, a dataset containing 110 acquisitions was built for each ITSC level.
Subsequently, in step (b), each experimental acquisition was segmented into windows of 30 cycles, generating six new instances per original acquisition. As a result, the dataset comprised 660 instances for each short-circuit level per phase, totaling 17,160 instances.
Table 2 provides an overview of the distribution of these instances. The extracted features from the stray flux signal, sampled at 16 kHz, are detailed in
Table 3. The dataset was divided into 30-cycle windows (8000 samples), and statistical measures were computed to characterize the signal. The statistical features describe the signal’s central tendency, dispersion, and shape. The histogram bins divide the signal’s amplitude range into 45 intervals, counting occurrences within each bin to represent the signal distribution. These features collectively form a 57-dimensional feature space, optimizing the classification process while balancing computational efficiency. The inclusion of histogram bins, along with time-domain statistical features, allows the machine learning models to extract relevant fault-related patterns while maintaining a manageable computational complexity suitable for real-time applications.
In step (c), a new dataset is generated, comprising a set of sensor signals acquired under different loads, voltage levels, and fault conditions. The database comprises 57 statistical attributes and 17,160 instances, and the data are normalized using the Min-Max method. However, as shown in
Table 2, there is an imbalance between classes. The imbalance of classes presents difficulties for ML models, which can exhibit bias towards the dominant class, resulting in inadequate results on minority classes. Such an imbalanced condition affects the model’s ability to generalize and prioritize accuracy and undermines its effectiveness in recognizing minority-class patterns.
Afterward, in step (d), the SMOTETomek algorithm, presented in
Section 2.4, is applied to perform data balancing, ensuring the same number of instances in all classes. Such a method mitigates class imbalances by synthesizing minority-class instances using SMOTE and removing potentially noisy or redundant examples through Tomek links. The SMOTETomek can alleviate biases in the training stage and improve the robustness of machine learning models by achieving a more balanced class distribution.
In step (e), techniques are performed to evaluate these statistical measures as potential ITSC indicators using the attribute engineering process to establish the most relevant factors for diagnosis. Attribute importance was estimated using ensemble and filter feature selection techniques, with RF as the feature importance estimator and collinearity as a measure. Then, the less relevant attributes are gradually eliminated, and the performance of those classified is verified for each case. Several tests are carried out to understand the impact of attribute reduction on classification evaluation.
Finally, in step (f), the k-NN, RF, XGBoost, SVM, and MLP classifier algorithms are trained and tested using k-fold cross-validation with ten folds. Then, the metrics of accuracy, precision, recall, macro and weighted F1-score evaluate the performance of the intelligent models. The F1-score metric balances precision and recall, and accuracy indicates the overall performance of the model. The tests were carried out on a computer with the Ubuntu Linux operating system, an i7-8750H processor, and 32 GB of RAM. The experiments were implemented using Python 3 with the scikit-learn library.
For the classification tasks, two distinct machine learning approaches were applied. The first approach is binary classification, which differentiates between healthy and faulty motors, making it essential for early-stage fault detection and real-time monitoring applications. The second approach is multiclass classification, which categorizes stator fault severity into four levels: 1%, 3%, 5%, and 10% inter-turn short circuits. While binary classification is advantageous for quickly determining motor health, multiclass classification provides more detailed insights into fault progression, which is crucial for predictive maintenance strategies.
The selection of classification tasks was driven by practical considerations in industrial settings. The binary classification approach allows for immediate detection of faults, facilitating real-time decision-making and minimizing operational disruptions. In contrast, the multiclass classification framework provides a finer granularity of fault diagnosis, enabling maintenance teams to assess the severity of stator faults and schedule interventions proactively. This dual approach ensures a comprehensive fault detection and assessment framework that supports both real-time and predictive maintenance applications.
4. Results
To mitigate the impact of electromagnetic noise from surrounding equipment, several measures were implemented to ensure the robustness of the proposed method. The experimental setup was designed to isolate the motor and sensor from external sources of interference. The search coil sensor was shielded to reduce the pickup of unwanted electromagnetic fields, and data acquisition was performed under controlled conditions. Additionally, signal processing techniques, such as statistical averaging, were applied to improve the reliability of extracted features and classification accuracy.
To further assess the robustness of the method in real-world conditions, tests were conducted under varying operational scenarios, including supply voltage imbalances and different torque levels. Despite the presence of external disturbances, the classification accuracy remained high, indicating that the proposed approach is feasible for industrial applications with appropriate noise mitigation strategies.
To evaluate the effectiveness of machine learning in detecting stator faults, two separate classification tasks were performed. First, a binary classification task was performed, in which the model distinguished between healthy and faulty motors. This method is particularly useful for early fault detection in industrial environments where a quick decision is needed to trigger maintenance actions. Second, a multiclass classification task was implemented to categorize different levels of faults (1%, 3%, 5%, and 10% inter-turn short circuits). The ability to classify fault severity allows engineers to plan interventions before failures escalate. The comparison of both classification tasks highlighted the trade-offs between detection accuracy and fault severity analysis.
The proposed method is compared with PCA in multiclass situations with different fault conditions, including incipient ones. The grid search technique identified the optimal hyperparameters for the classification models.
Table 4 shows the best hyperparameter values found by the grid search for
k-NN, RF, XGBoost, SVM, and MLP.
The ensemble feature selection technique was applied to analyze binary and multiclass classification, using RF as the feature relevance estimator. After that, a filter feature selection method was employed to analyze feature pairs with high correlation and eliminate the least relevant ones. The ensemble feature selection method was applied for the classification with PCA, allowing an alternative to reduce the number of features.
4.1. Binary Classification
The binary classification task involved multiple stages of feature selection to identify and retain relevant features while assessing the performance of five classifiers: MLP, RF, k-NN, XGBoost, and SVM.
Initially, the complete dataset with 57 attributes was evaluated, and MLP achieved the highest performance with an accuracy of 100%. Following this, an ensemble feature selection approach was applied, using RF to rank features based on their relevance.
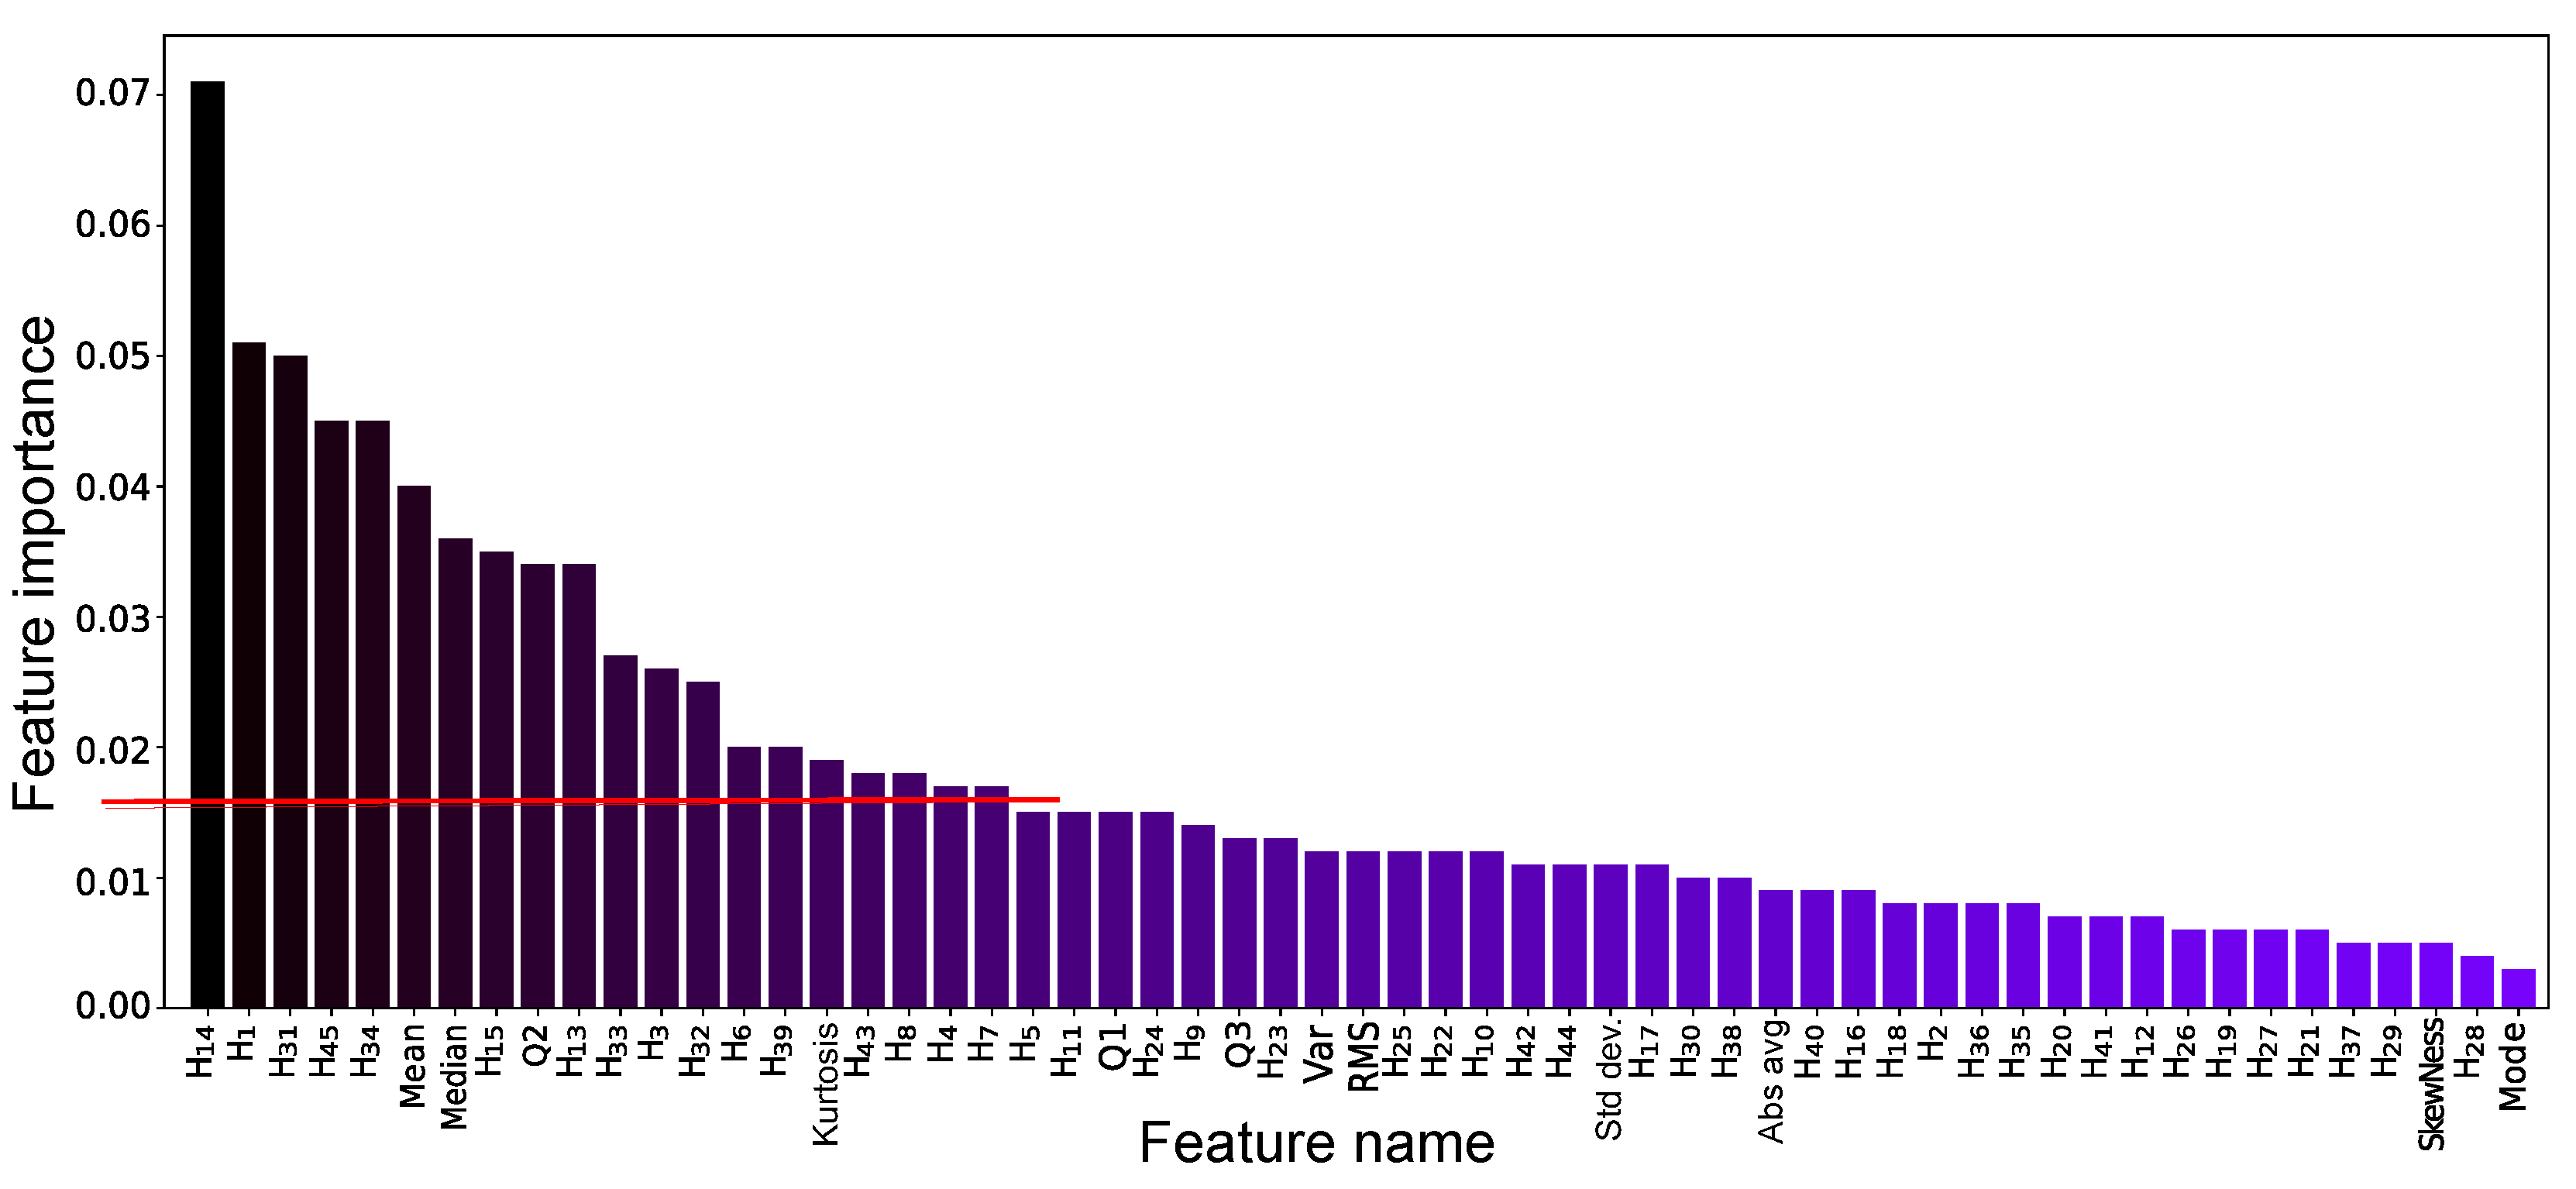
Figure 5 shows the features ranked by importance as determined by RF. With a relevance threshold of 1.6% (indicated by the red line), 20 features were retained. Among the classifiers, XGBoost achieved the best performance with these 20 features, but accuracy dropped to 94.7%.
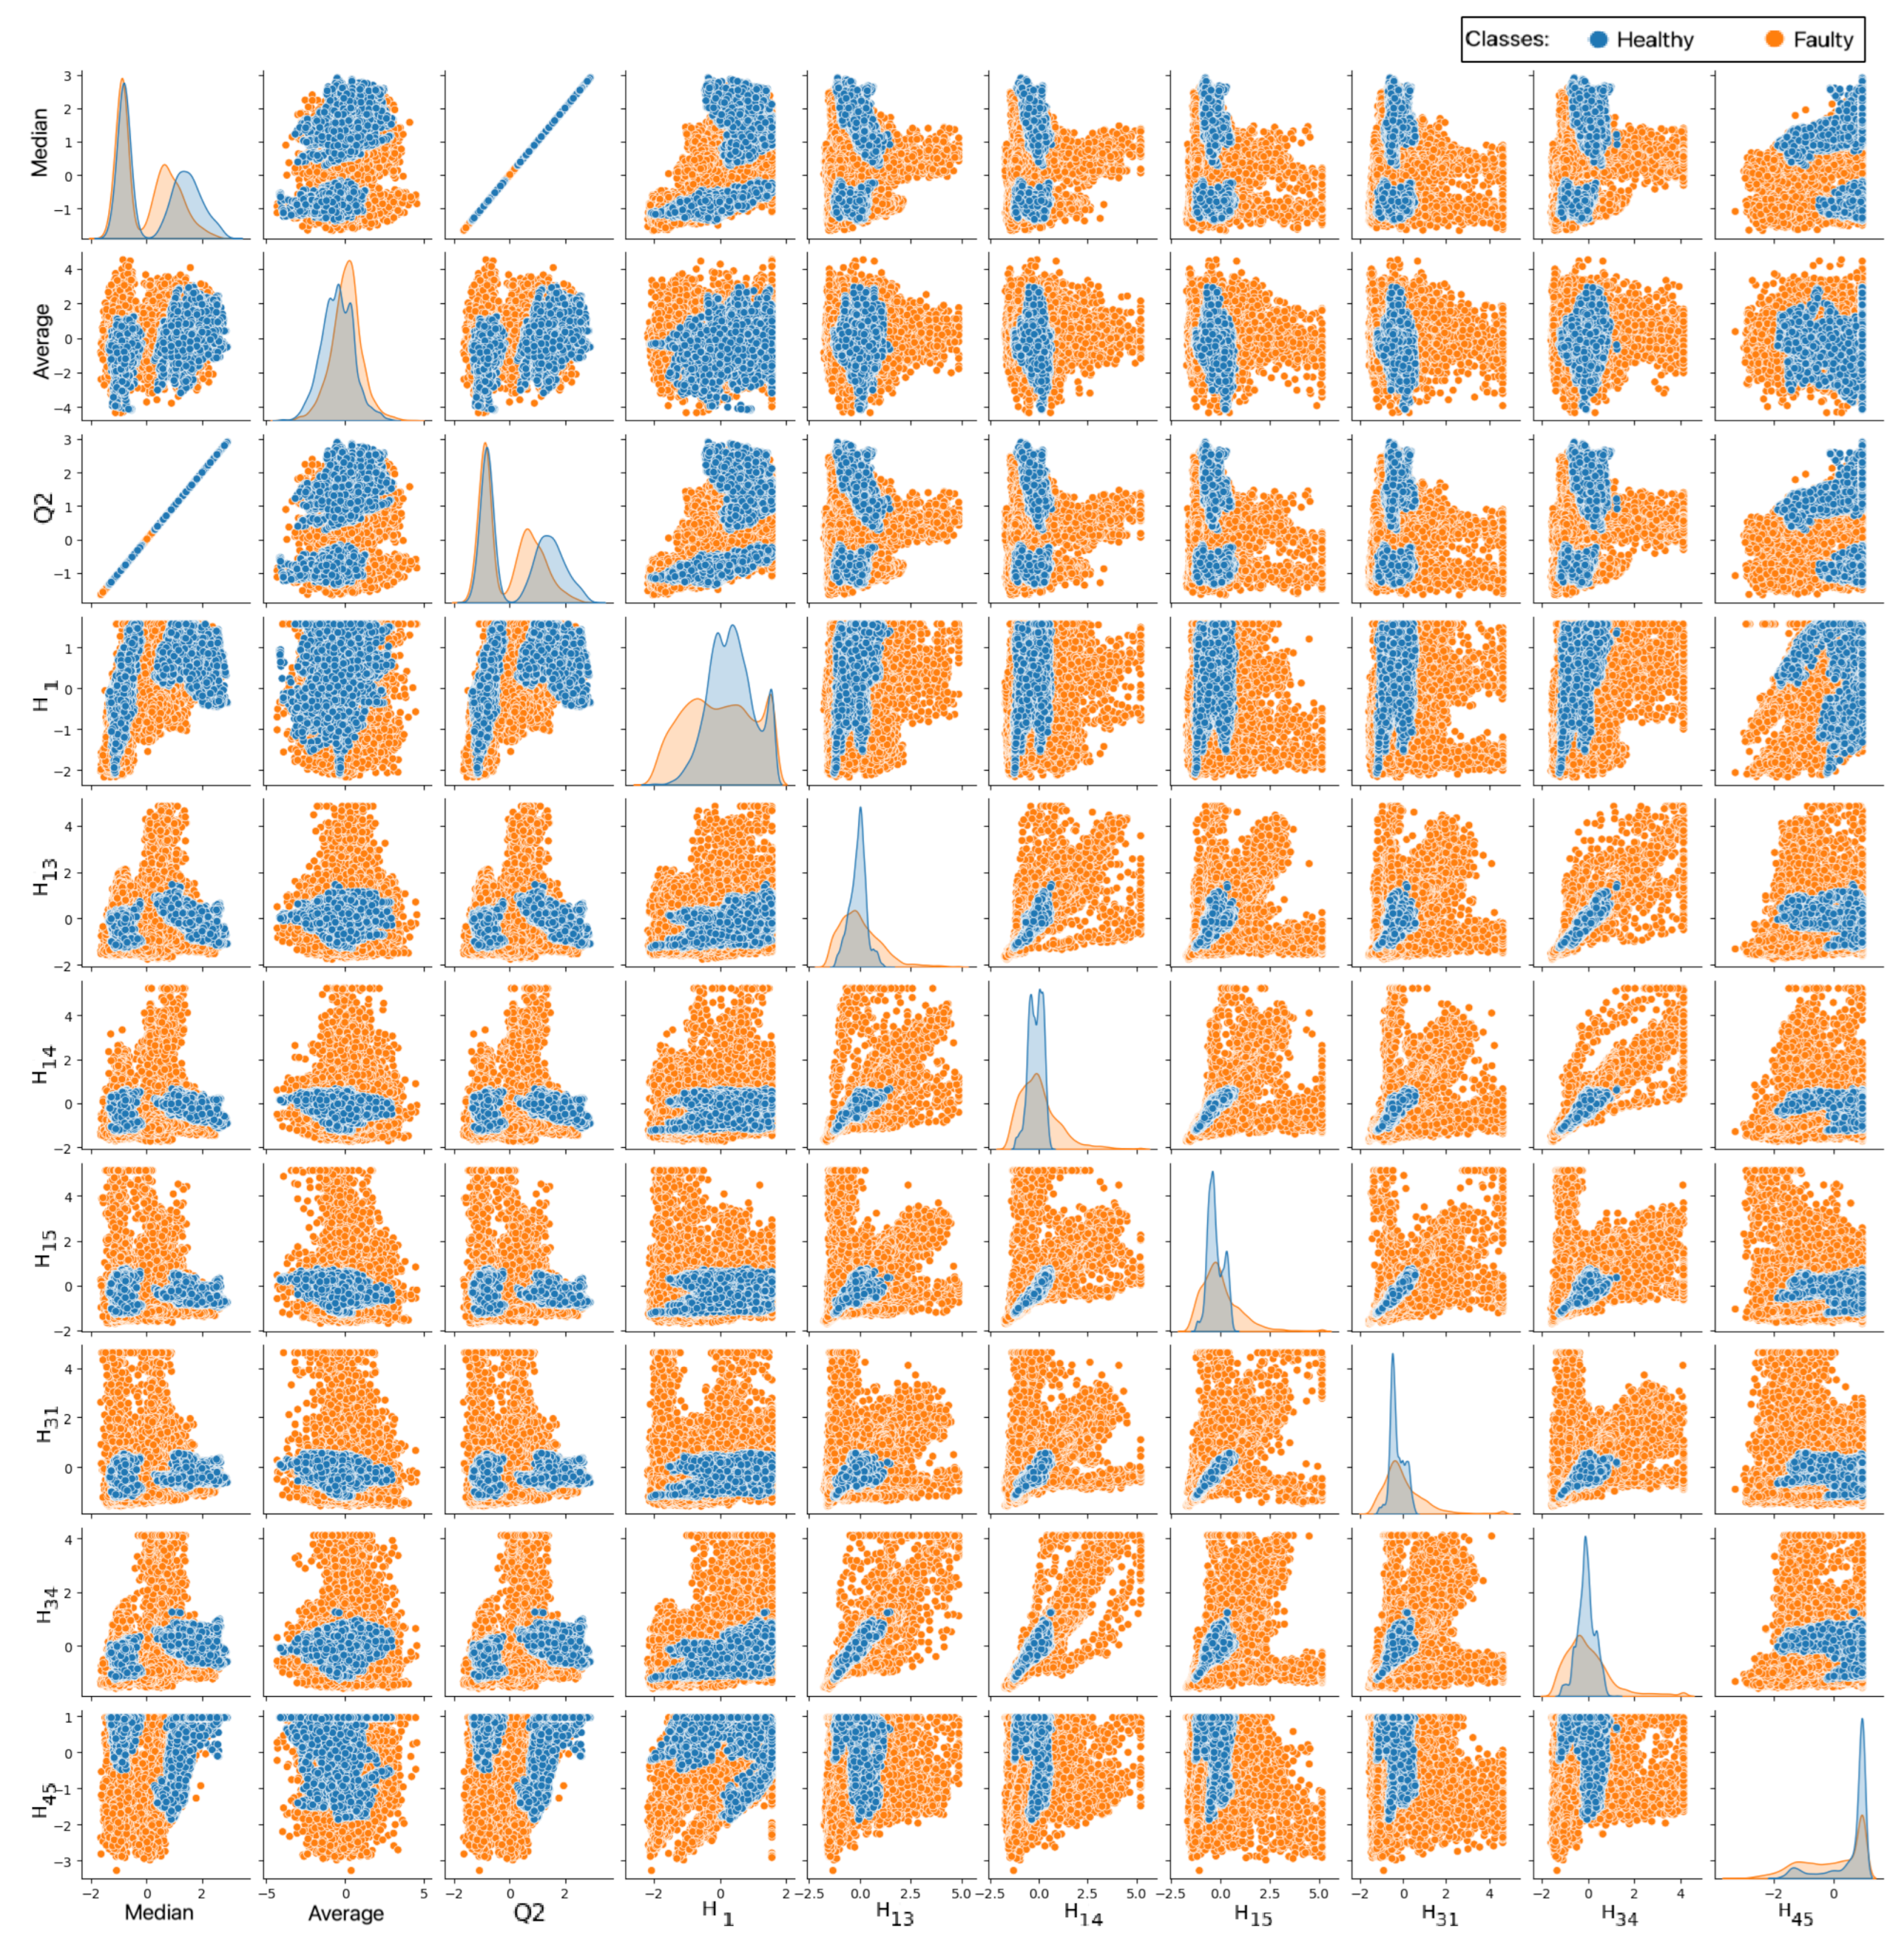
Furthermore, the ensemble feature selection method was applied with a relevance threshold of 3%, resulting in 10 features, with the dispersion of the data presented in the pair plot of
Figure 6. The XGBoost classifier excelled using these 10 features, achieving an accuracy of 94.1%.
A substantial correlation between Q2 and the median and between H14 and H34 should be noted. Consequently, considering the collinearity threshold of 0.8, the features Q2 and H34 were excluded, reducing the dataset to eight attributes: median, mean, and histograms numbered 1, 13, 14, 15, 31, and 45.
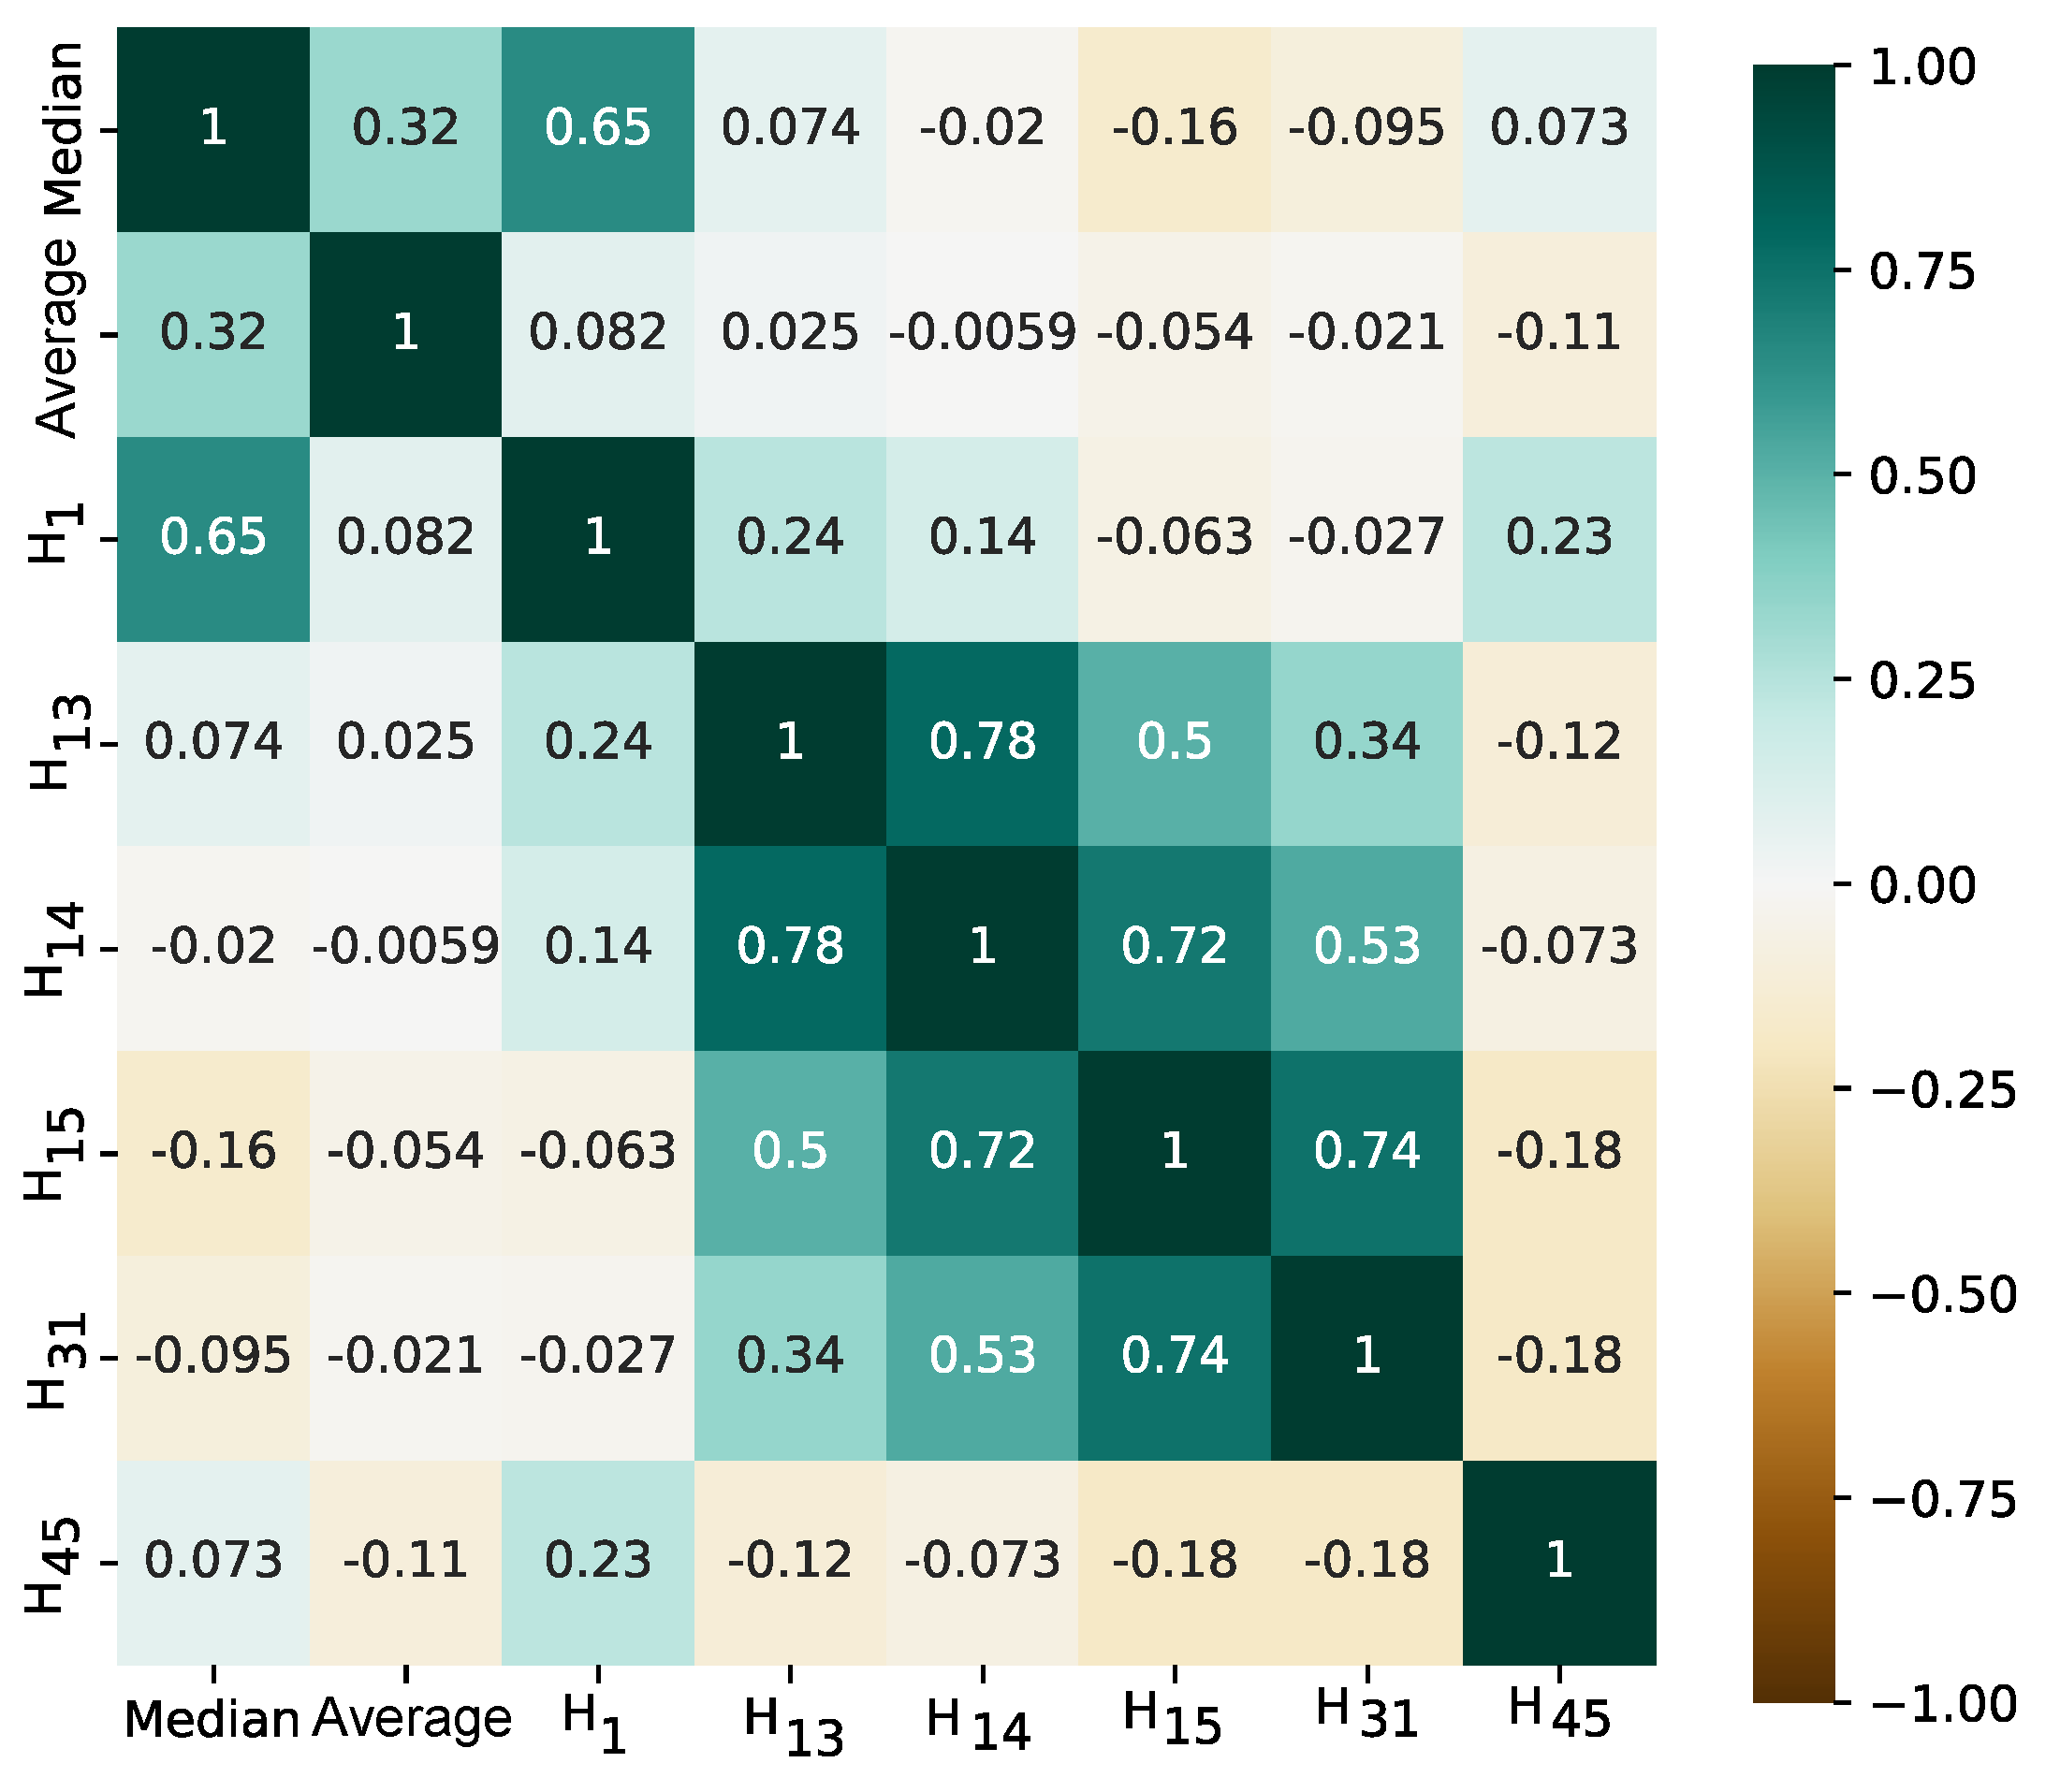
Figure 7 depicts the correlation among the eight selected features. The XGBoost classifier demonstrated superior performance, attaining an accuracy of 94.4%.
Table 5 provides a comparative overview of the performance results for binary classification across different feature sets. The experiments showed a noticeable decline in performance metrics when the feature set was reduced to eight attributes. Among the classifiers,
k-NN achieved an accuracy of 98–99% with 57 attributes and 92–93% with 8 attributes. The RF classifier reached an accuracy of 97% with 57 attributes and 92–93% with 8 attributes, while the MLP classifier achieved 97% with 57 attributes and 90–91% with 8 attributes.
XGBoost reported an accuracy of 98.4% with the full set of 57 attributes, which decreased to 94.4% with 8 attributes. The SVM classifier showed similar trends, with an accuracy of 95.8% with 57 attributes, declining to 90.4% with 8 attributes. When considering fewer than 20 attributes, performance decreased for MLP, XGBoost, and SVM, while k-NN and RF remained more consistent. In these cases, feature selection was not sufficient to maintain high accuracy for classifiers with fewer features.
The binary classification task achieved 100% accuracy with MLP, confirming the discriminative power of stray flux data in distinguishing between healthy and faulty conditions. Even when reducing the feature set to only eight attributes, accuracy remained at 94.4% (XGBoost), indicating the robustness of the proposed method for fault detection.
4.2. Multiclass Classification
Initially, the entire dataset with 57 features is considered, and the MLP presented the best performance result, with an accuracy of 99.1%. In this experiment and subsequent ones, the macro- and weighted averages of the precision, recall, and F1-score presented values numerically equal to accuracy.
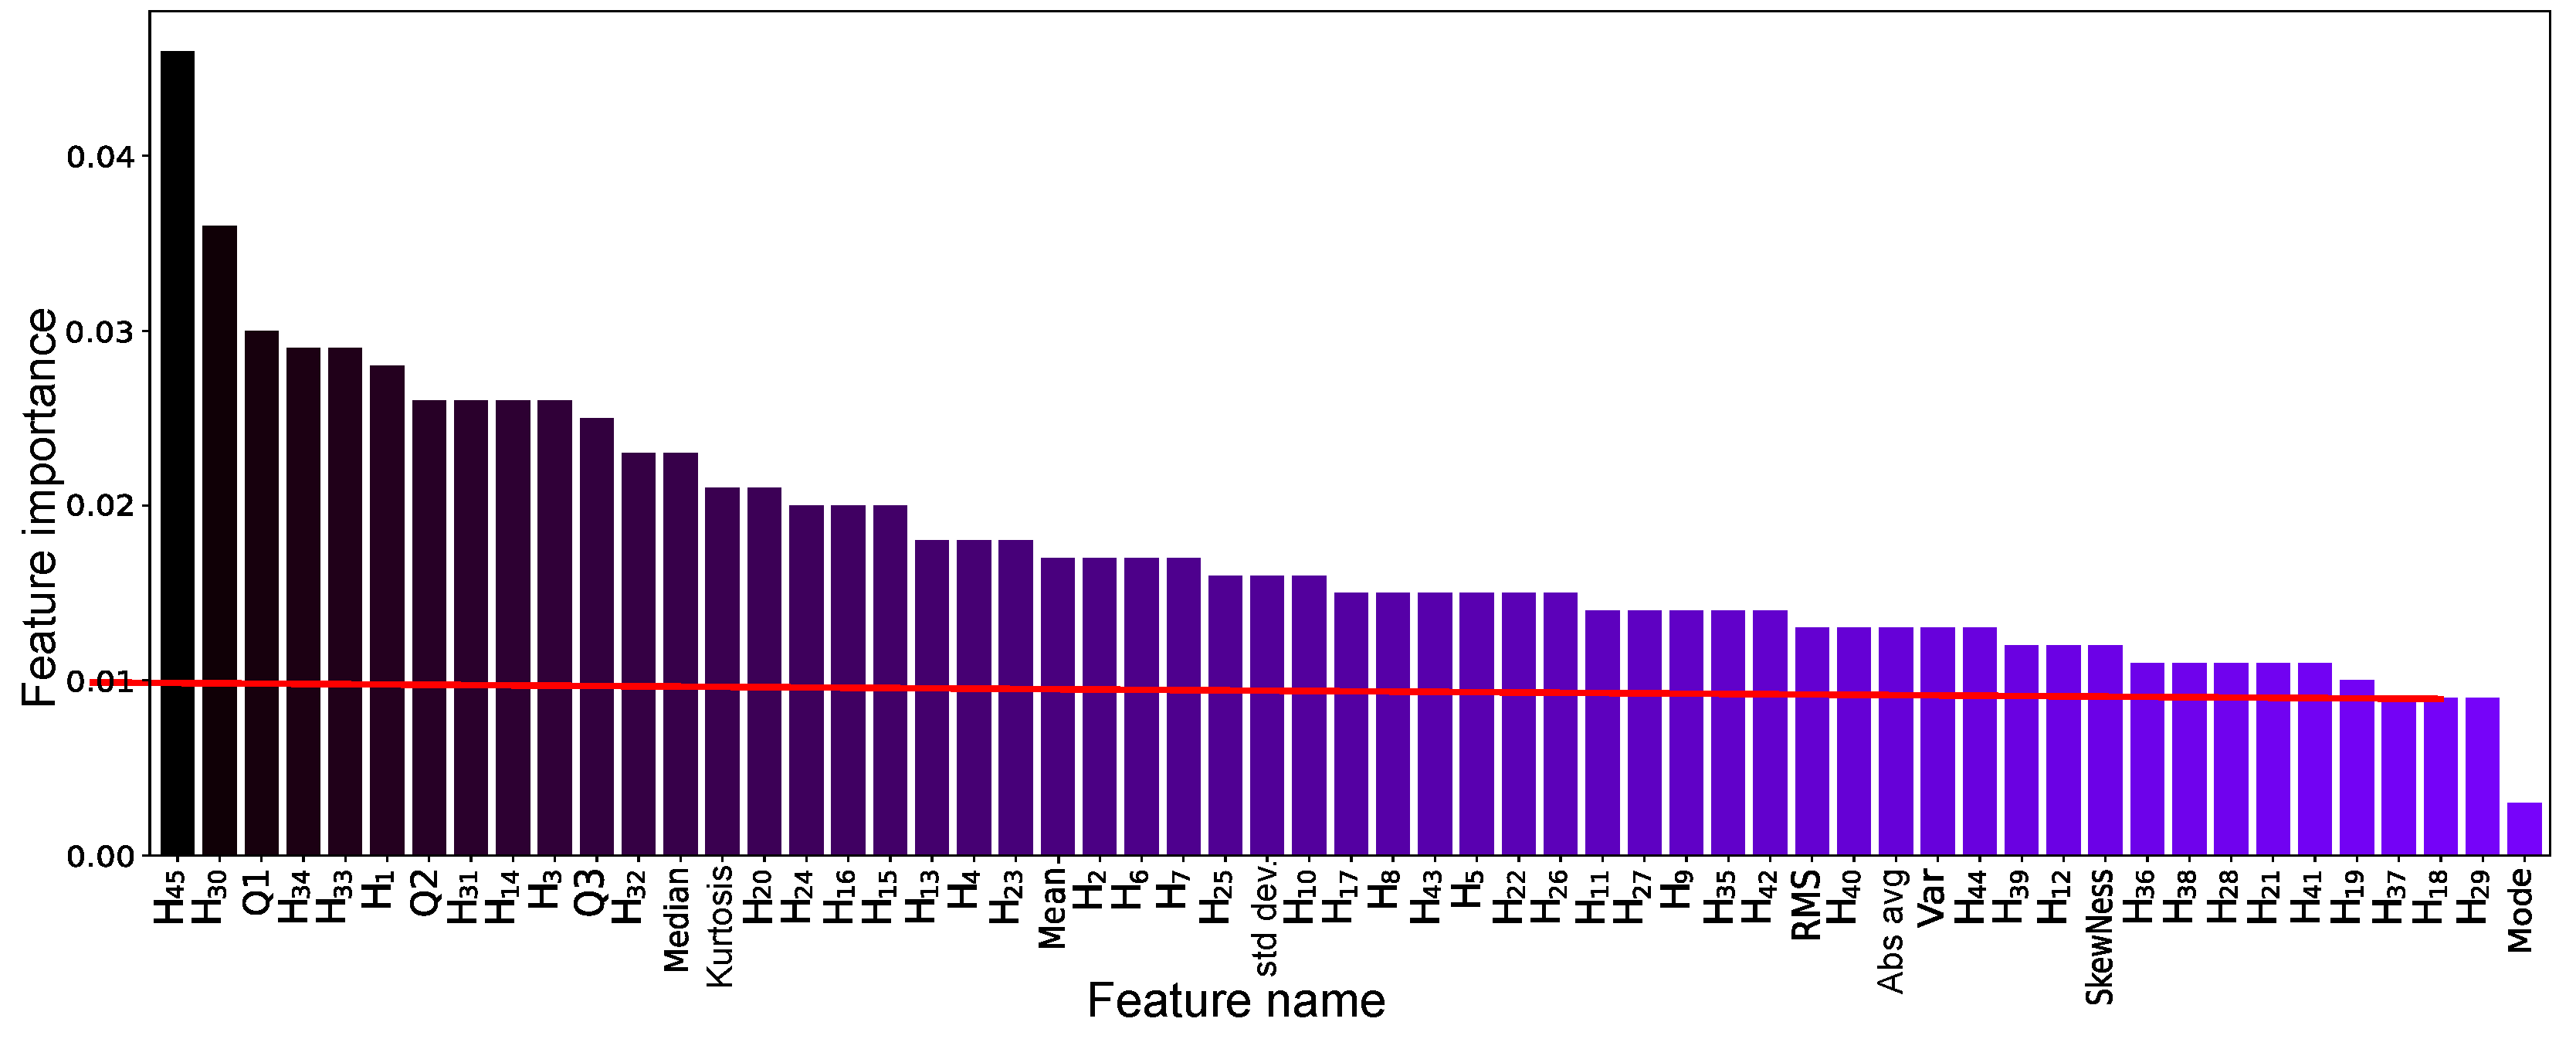
Figure 8 shows the relevance of the attribute estimated by RF. Remarkably, for this feature selection stage, the number of attributes considered essential for prediction is much higher than in binary classification. Therefore, careful reductions are made. Then, 54 attributes with an importance greater than 1% were selected, and the MLP obtained the best results with an accuracy of 99.3%.
Subsequently, the features with an importance greater than 1.5% are selected, remaining 29 features, and the k-NN presented the best performance, with an accuracy of 97.4%. Taking into account the importance greater than 2%, 16 features are selected. The performance results present a decrease in the accuracy, reaching 93.4% by the k-NN, for the incipient condition of 1% of ITSC, the precision is 93.2%.
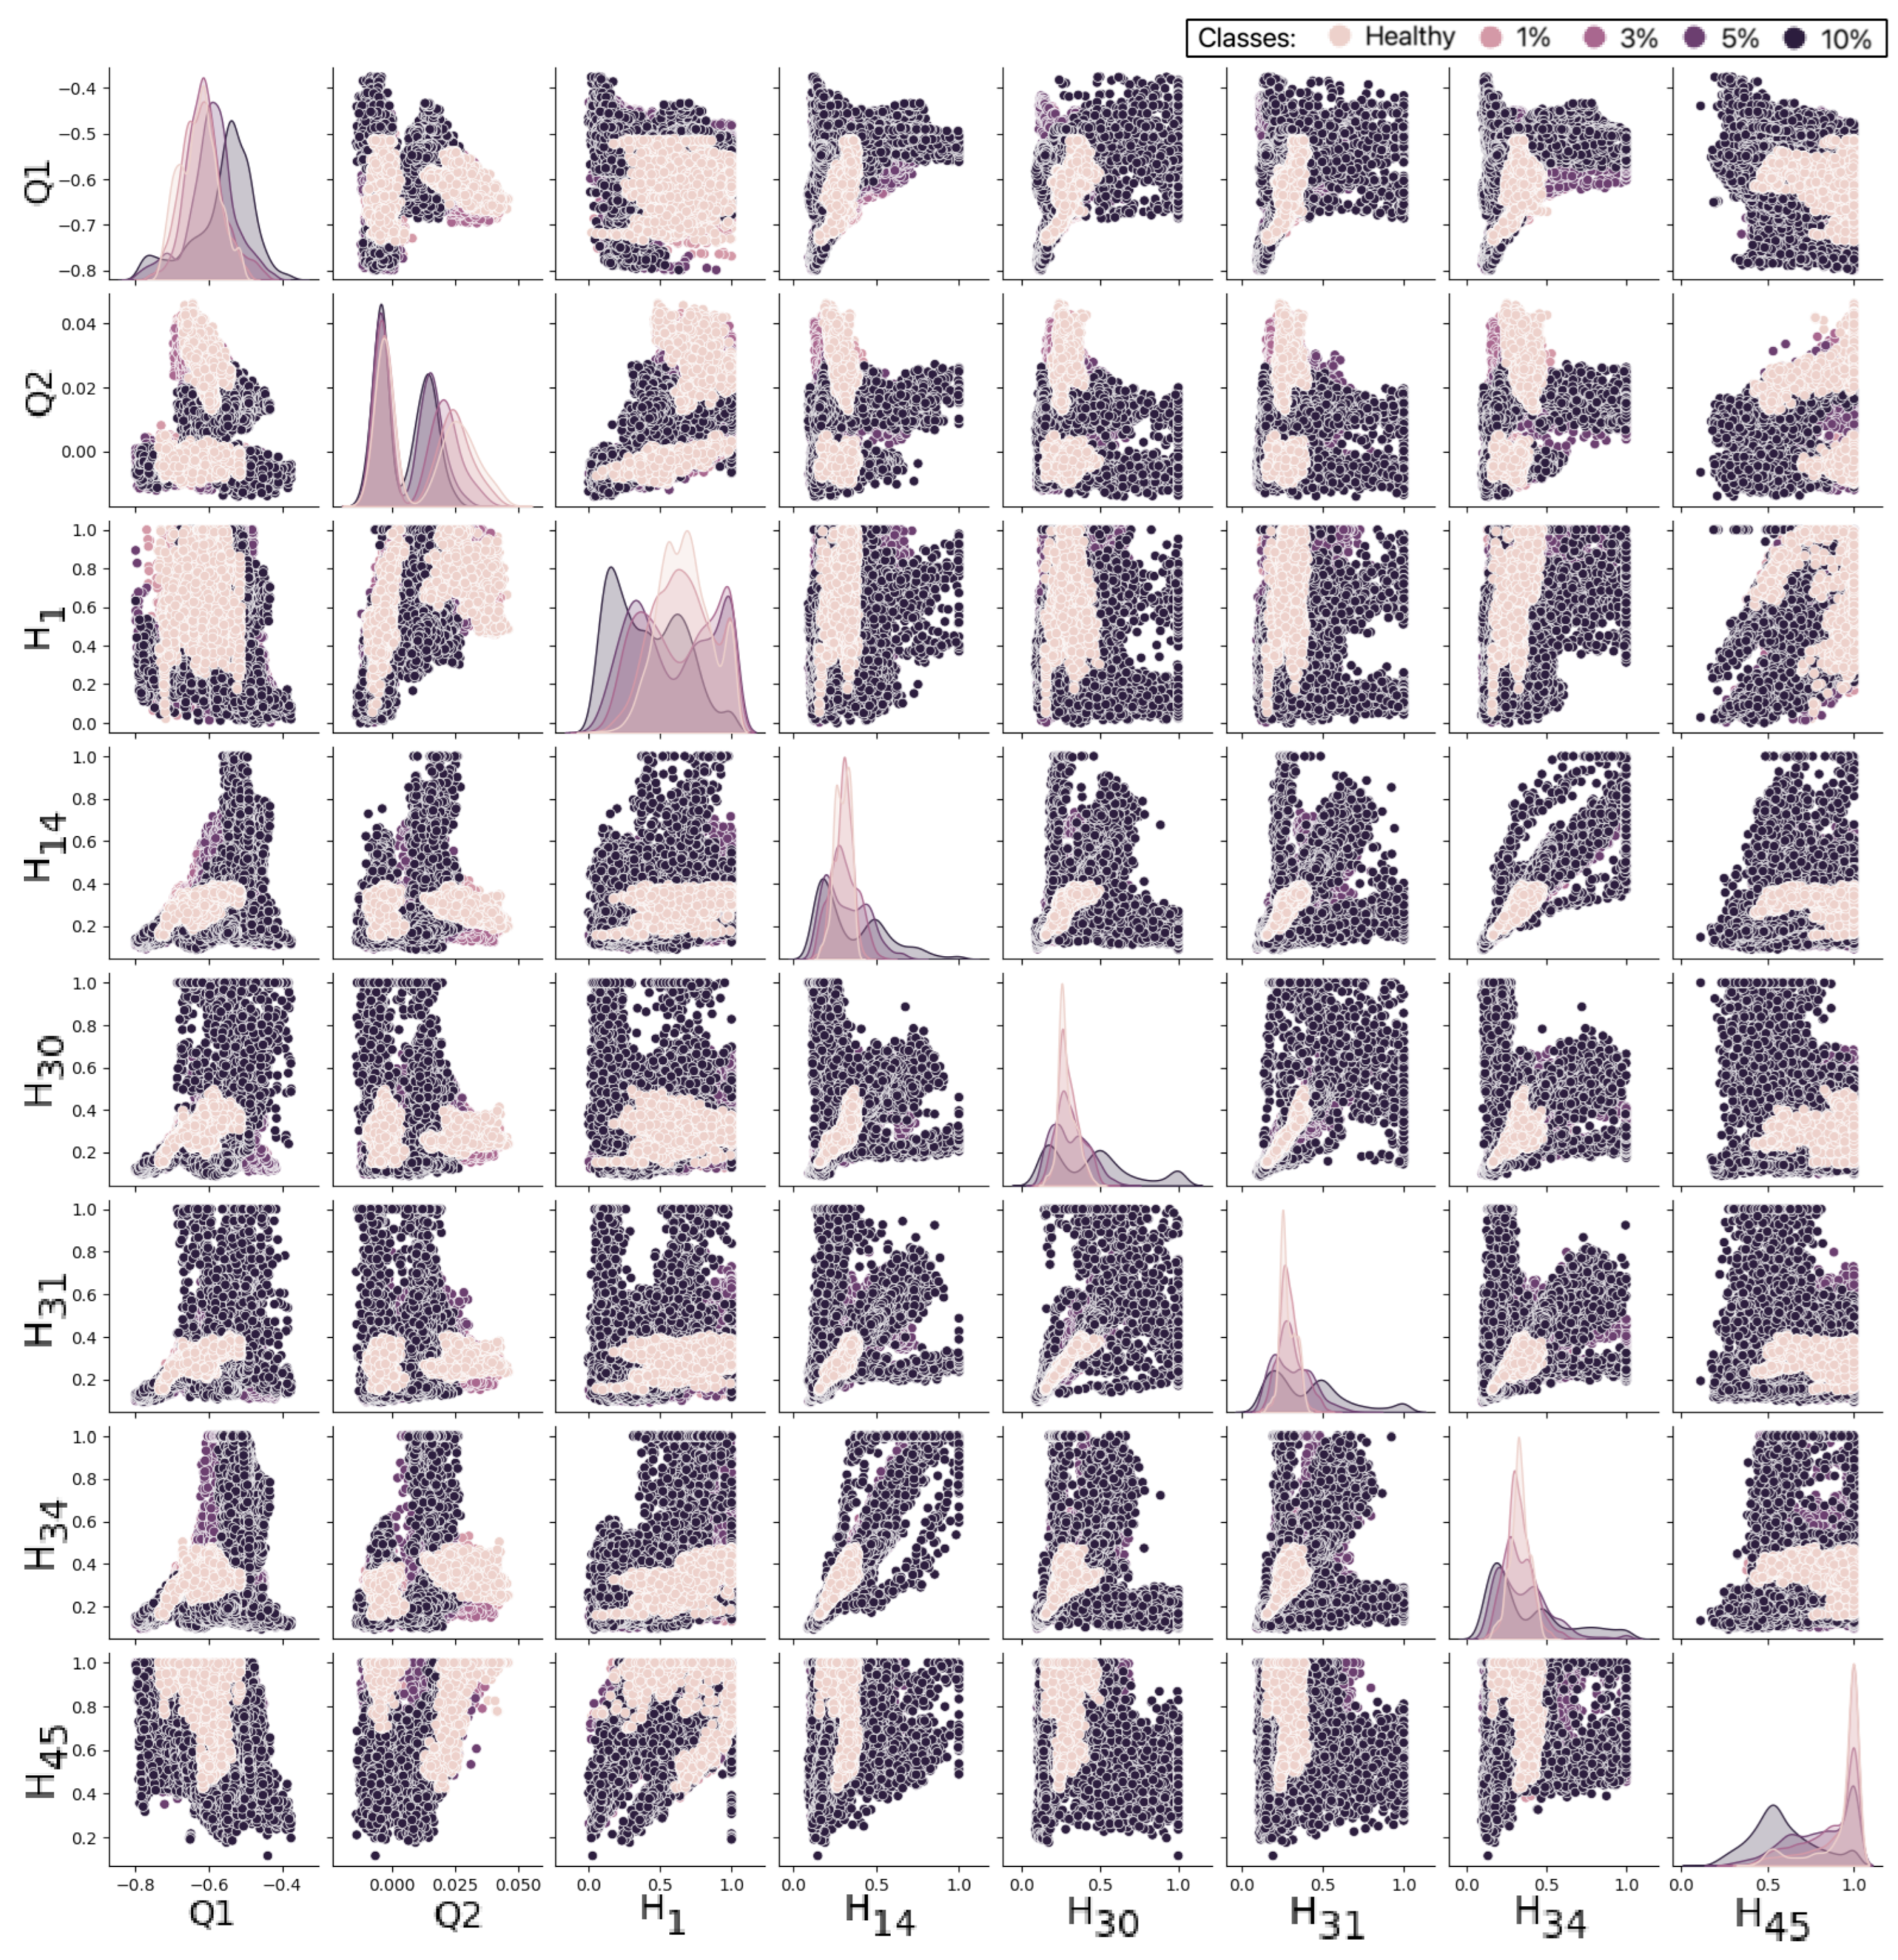
Next, for the relevance of the attribute above 2.5%, the eight attributes were Q1, Q2, histograms 1, 14, 30, 31, 34, and 45. The
k-NN presented the highest performance of the classifiers, with 81.3% of precision for 1% of ITSC and a general accuracy of 85.4%.
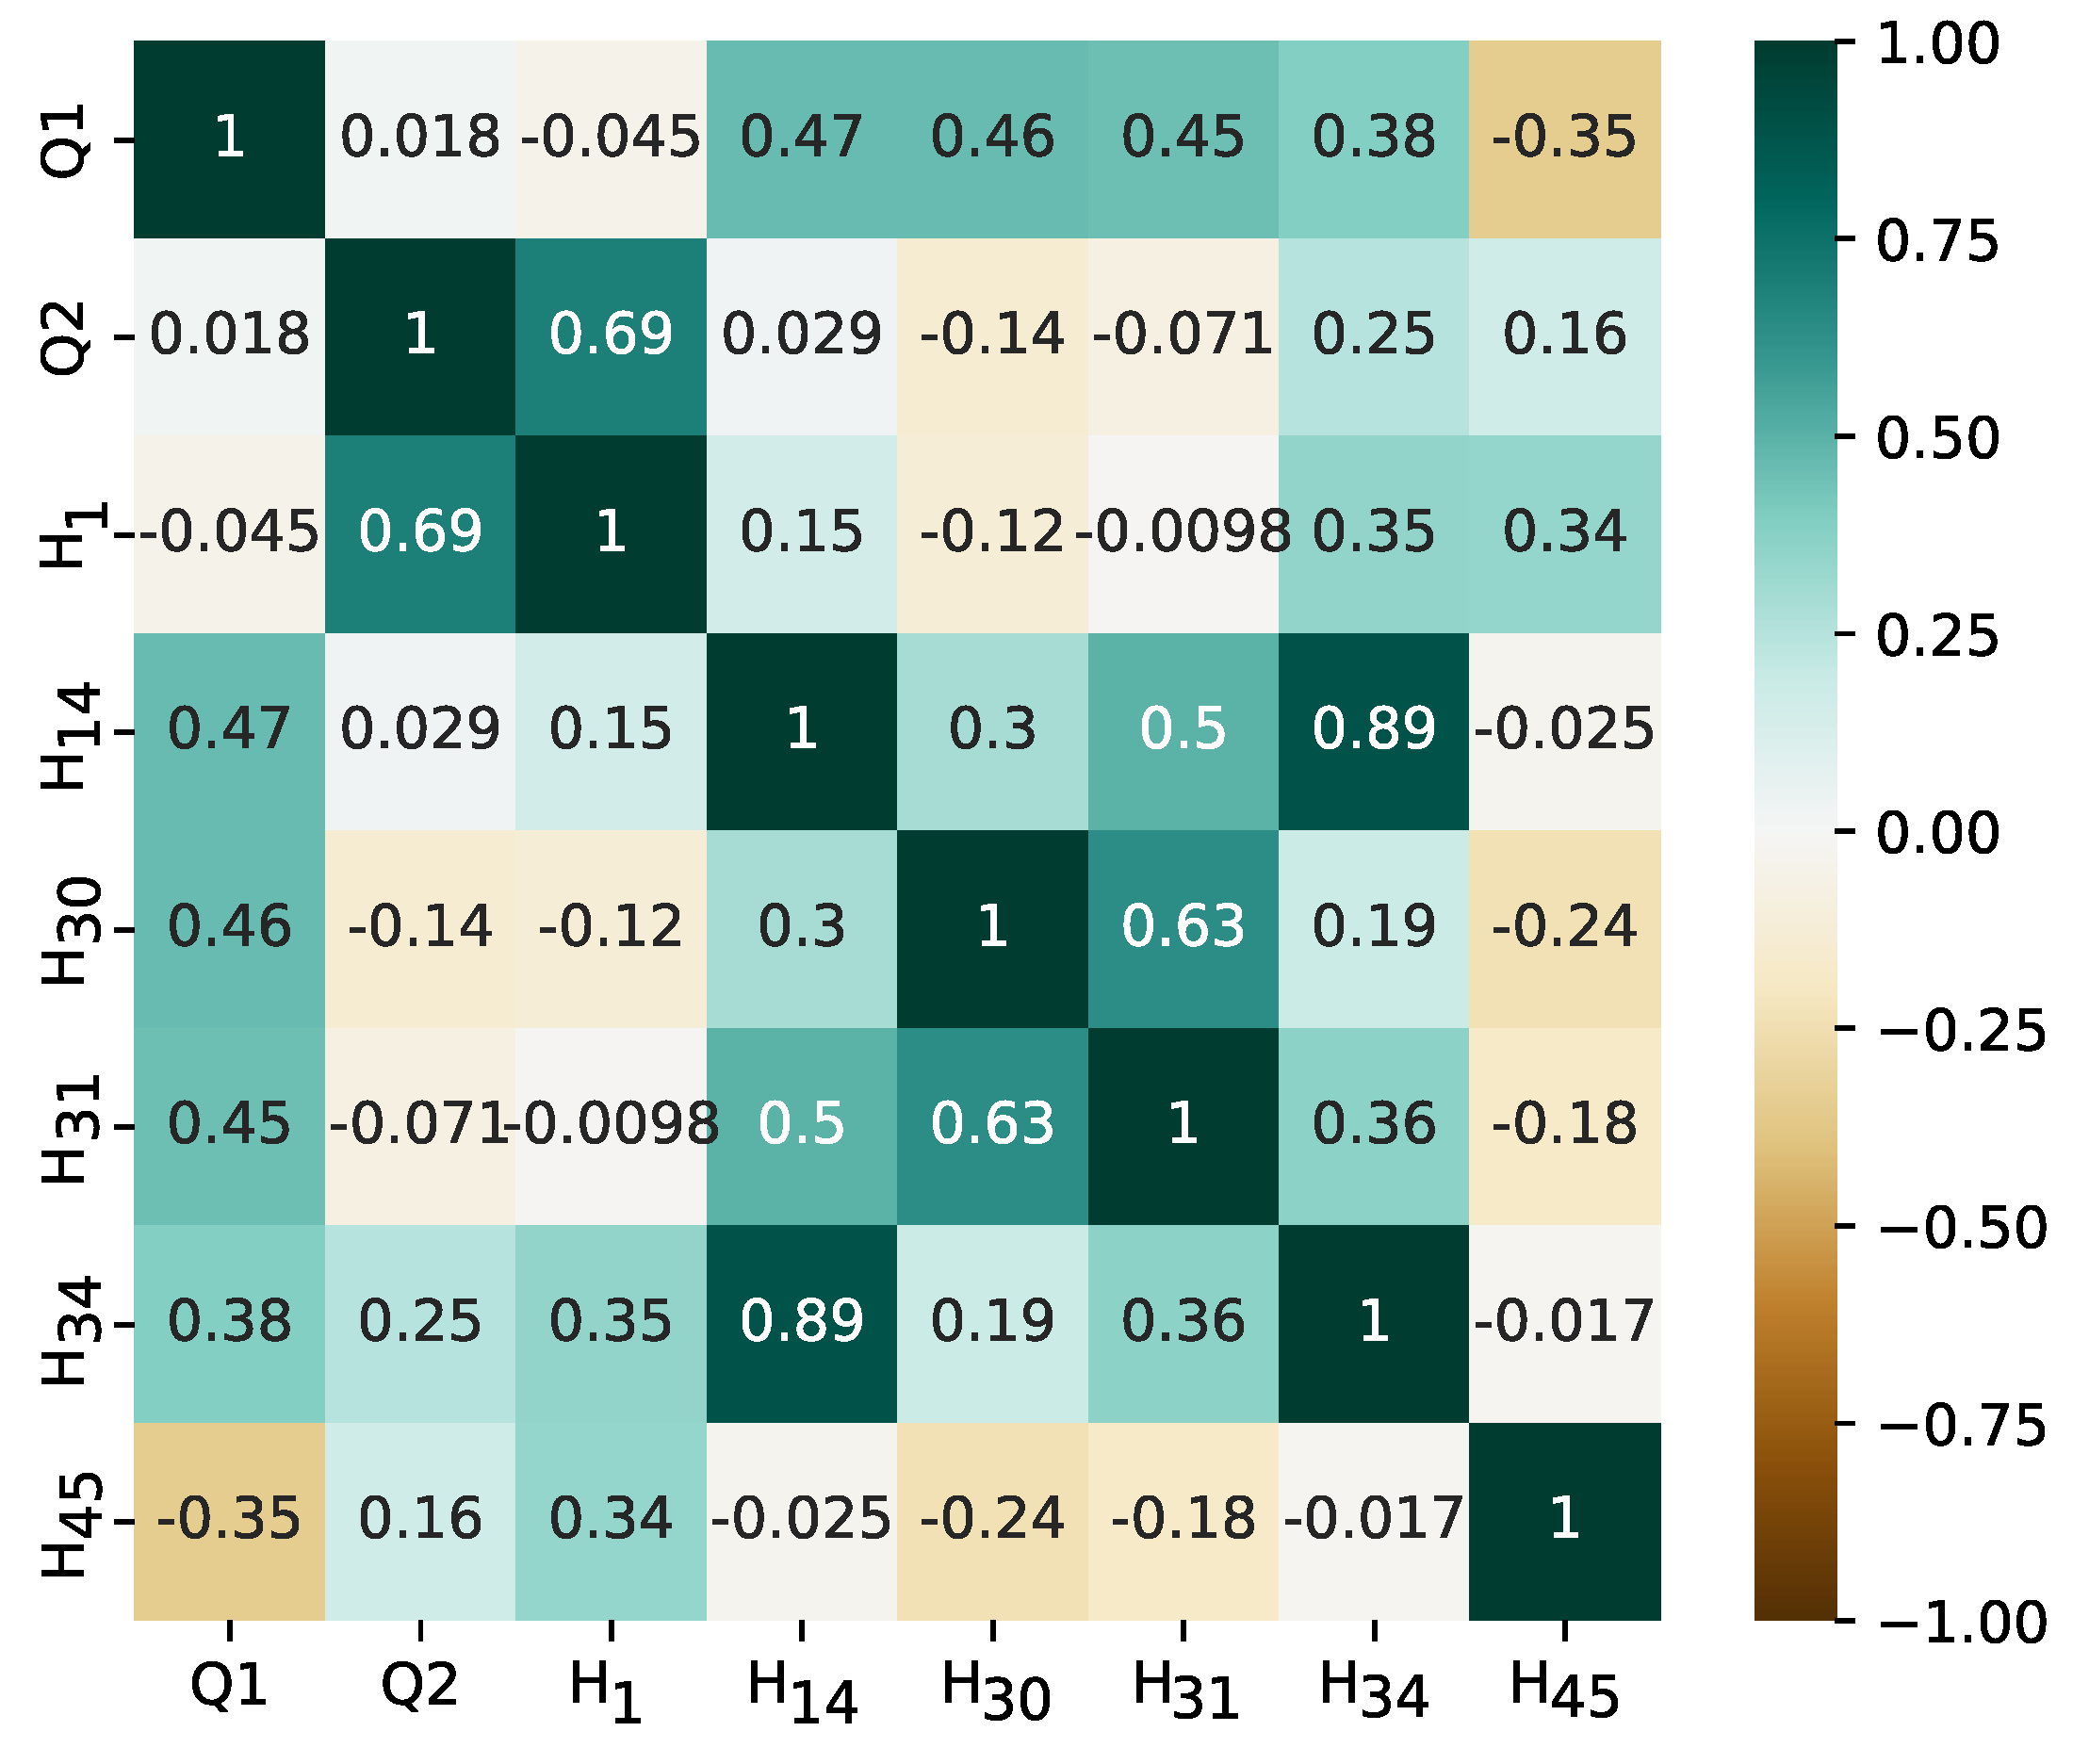
Figure 9 presents the dispersion of the data considering the pair plots, and as can be seen in
Figure 10, it does not show a high correlation between these eight attributes, and it is not necessary to apply the collinearity method. For further reductions, testing demonstrated a drastic decrease in performance metrics. Precision, recall, and F1-score metrics are summarized using macro and weighted measures to evaluate subclasses globally.
Table 6 shows the performance results in each feature selection stage for this multiclass classification. Considering the three classifiers, the accuracy, macro and weighted precision, macro and weighted recall, and macro and weighted F1-score were equal in numerical value in all reduction stages, indicating that the training set is balanced.
The maximum performance of
k-NN occurs with 54 attributes (approximately 99.0% of the success rate). Focusing on incipient failures (1% and 3% of ITSC), it is possible to observe in
Table 6 a performance of over 98%. Taking into account less than 29 attributes, a more pronounced drop in performance metrics is observed due to the minimal differences in decision boundaries between the classes. For 1% of ITSC, maximum performance occurs with 54 attributes, with 93.2% of precision, 86.1% recall, and 89.2% F1-score. For
k-NN, the reduction from 57 to 54 attributes improves performance, while the reduction from 54 to 16 only degrades performance by approximately 4%.
For the RF classifier, the best performance, 95%, is obtained with 57 attributes, and it remains approximately constant until 29 attributes. XGBoost follows a similar trend but with slightly lower performance, achieving a maximum of 94% with 57 attributes and showing a gradual decline after 29 attributes.
For SVM, the highest performance is 93% with 57 attributes, slightly below that of XGBoost. SVM also maintains relatively stable performance until around 20 attributes, after which accuracy declines more significantly. Both XGBoost and SVM demonstrate reduced robustness in performance as the feature set is minimized compared to RF. For k-NN, the reduction from 57 to 54 attributes improves performance, while the reduction from 54 to 16 attributes only degrades performance by approximately 4%.
For the RF classifier, the best performance of 95% is achieved with 57 attributes, and this level remains approximately constant until the attribute set is reduced to 29. Beyond 29 attributes, two notable performance degradations are observed. XGBoost follows a similar trend but with slightly lower performance, achieving a maximum of 94% with 57 attributes and showing a gradual decline after 29 attributes.
For SVM, the highest performance is 93% with 57 attributes, slightly below that of XGBoost. SVM also maintains relatively stable performance until around 20 attributes, after which accuracy declines more significantly. Both XGBoost and SVM demonstrate reduced robustness in performance as the feature set is minimized compared to RF.
Regarding MLP, the maximum performance is 54 attributes, with a value of 99.3% of the success rate. However, MLP loses performance more significantly with a reduction in attributes. For incipient failures, the best performance is obtained with 54 attributes. For 54 attributes, the MLP reached the accuracy, macro and weighted F1-score of 99.3%. For 16 attributes, k-NN reaches 93.3% of the hit rate. For incipient failures, with 54 attributes, MLP achieved 99.3% of the F1-score. However, considering smaller feature sets, k-NN can be considered a rational choice, since MLP is substantially sensitive to attribute reduction.
The multiclass classification task, designed to differentiate stator fault severity levels, achieved 99.3% accuracy with MLP using 54 features. However, reducing the feature set to eight decreased accuracy to 85.4% with k-NN, illustrating the trade-off between model complexity and classification performance. These findings suggest that the integration of stray flux measurement with machine learning provides a reliable and scalable approach for diagnosing and managing induction motor faults in industrial applications.
4.3. Multiclass Classification with PCA
The PCA technique applies dimensionality reduction, potentially enhancing classifier performance. This experiment applies PCA assuming the representativeness of 98%, resulting in 18 principal components. The
k-NN algorithm achieves an accuracy of 93.1%, higher than those of MLP, XGBoost, SVM, and RF, and the results of the performance of
k-NN can be shown in
Table 7. Taking into account the reduction to seven components using the RF as a feature importance selector and threshold of 2%, the performance of
k-NN exceeds that of the other classifiers with an accuracy of 87.2%. For the 18 and 7 components, the three intelligent models exhibited a contraction in their performance.
k-NN stands out for incipient failure, scoring a precision of 88.2% for 18 components and 83.3% for seven components.
Therefore, the experiments confirmed the importance of attribute engineering in this work. The results indicated that the k-NN algorithm is less affected by dimensional reduction, using the RF or PCA strategies. The PCA promoted an optimal linear transformation, converting the 57 original attributes into 18 “compressed”, which behave like “super attributes”, even with a representativeness of 98%.
4.4. Results and Discussion
The experimental analysis evaluates the influence of data balancing, feature selection, and computational complexity on the classification of stator faults in induction motors. The results are structured to first examine the impact of the SMOTETomek algorithm on model performance, followed by an analysis of binary and multiclass classification outcomes under different feature selection scenarios. In addition, the trade-offs between classification accuracy and computational efficiency are discussed, particularly in the context of deploying machine learning models in embedded systems with limited resources. If the target architecture is a simple RISC-based system, optimization of feature dimensionality and classifier selection can ensure feasible real-time processing while maintaining reliable fault detection. In contrast, more advanced RISC architectures with enhanced computational capabilities may accommodate a larger number of features and more complex classifiers while still meeting real-time constraints.
4.4.1. Impact of SMOTETomek on Classification Performance
Table 8 presents the classification performance before and after applying the SMOTETomek algorithm for binary and multiclass fault detection. The dataset used for the testing remained balanced in all experiments, ensuring a consistent evaluation. Initially, the training dataset exhibited class imbalance, reflecting real-world conditions in which faults are rare compared to normal operation. The application of SMOTETomek aimed to mitigate this imbalance, improving the models’ ability to generalize.
The results indicate that class imbalance negatively affected classification accuracy, particularly in binary classification, where models performed close to random chance ( 50% accuracy). SVM and MLP were particularly affected, highlighting their sensitivity to imbalanced datasets, as their decision boundaries and weight adjustments are influenced by class distributions. Ensemble methods, such as RF and XGBoost, also exhibited suboptimal performance without balancing. In contrast, k-NN retained some ability to classify the minority class, achieving 63.2% accuracy in binary classification.
After applying SMOTETomek, all models showed substantial improvements. The highest accuracy in binary classification was achieved by MLP (100%), followed by XGBoost (98.4%) and k-NN (98.6%). In multiclass classification, MLP maintained the highest accuracy (99.1%), followed by k-NN (95.5%) and RF (95.1%). The improvements in both accuracy and F1-score confirm that balancing the dataset enhances classification reliability by improving recall and reducing bias toward the majority class.
It is important to highlight that the SMOTETomek algorithm was applied exclusively to the training dataset, ensuring that the test dataset remained unchanged and representative of real-world conditions.
4.4.2. Feature Reduction and Its Impact on Accuracy and Computational Cost
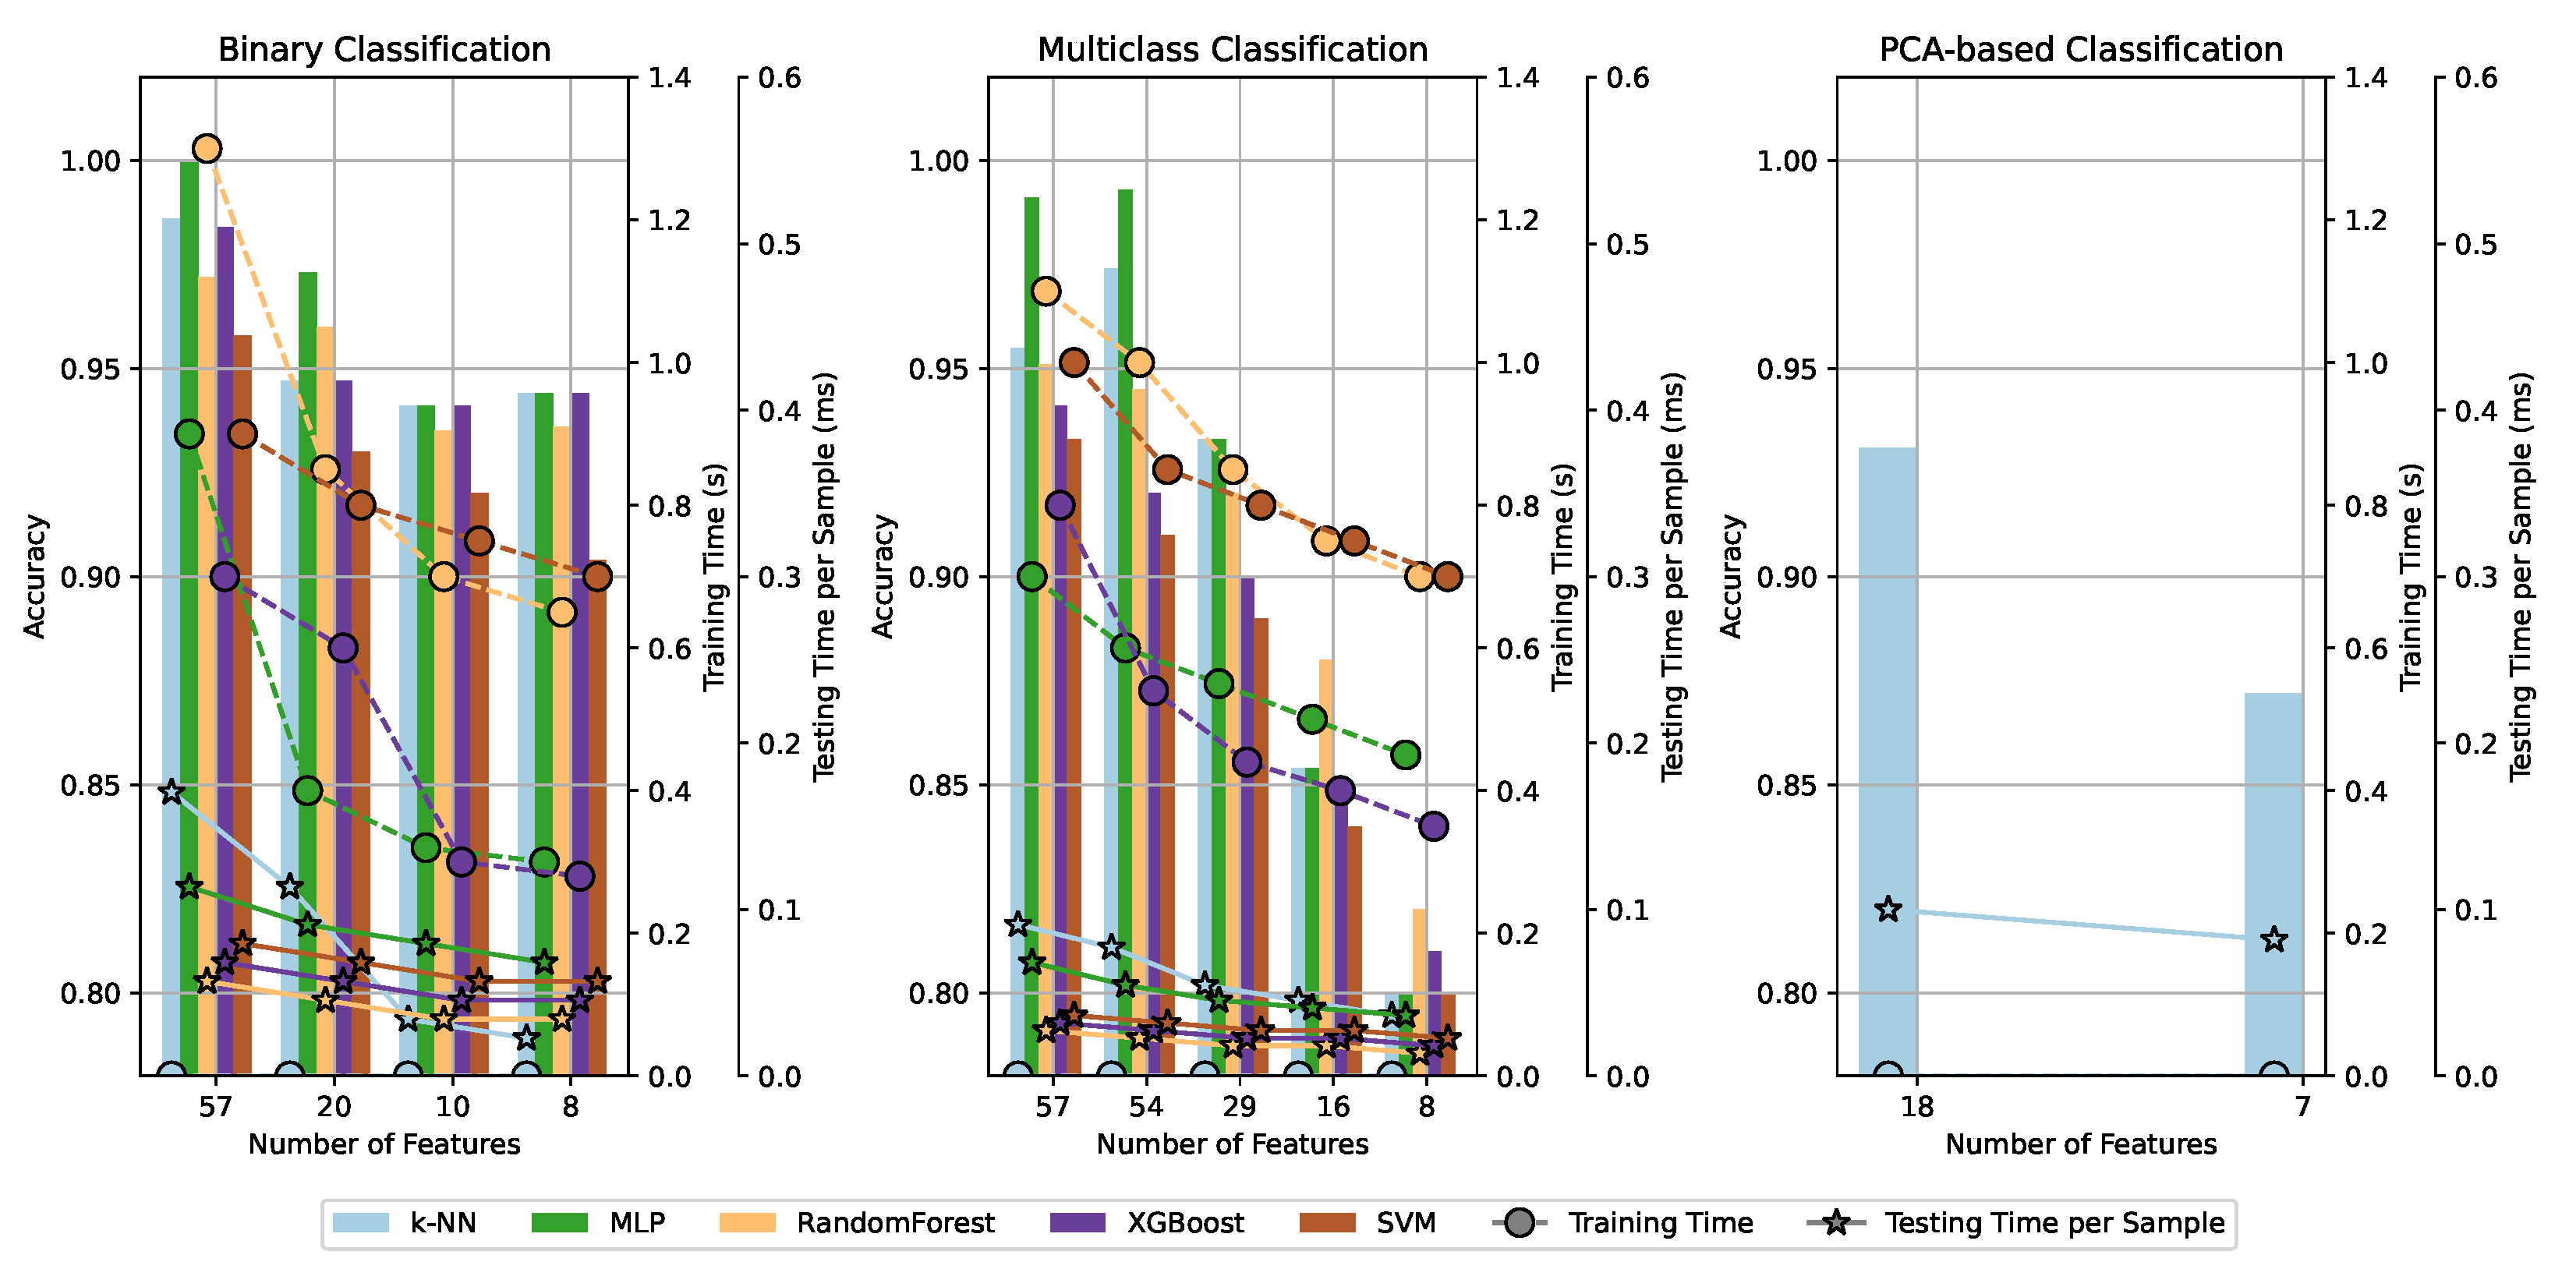
Feature selection plays a key role in optimizing machine learning models for real-time applications, particularly in embedded systems.
Figure 11 illustrates the trade-off between classification accuracy and computational efficiency in different feature selection scenarios.
Using the full feature set (57 attributes), MLP achieved 100% accuracy in binary classification and 99.1% in multiclass classification. However, feature selection led to varied impacts among classifiers. MLP maintained high accuracy despite reductions, while tree-based models such as RF and XGBoost showed more pronounced performance degradation. Distance-based methods, particularly k-NN, were significantly affected due to the increased sensitivity to dimensionality reduction.
For binary classification, the accuracy remained above 98% when using at least 10 attributes but decreased when reduced to 8 attributes, suggesting that some statistical characteristics are essential for reliable classification. In multiclass classification, the highest accuracy was obtained with 54 attributes, decreasing as features were reduced to 8. This decline was more evident in low-severity faults (e.g., 1% ITSC), where class separability is reduced.
In binary classification, retained statistical features (mean, variance, and RMS) reflect different aspects of the signal amplitude and energy distribution. The mean represents the average value of the stray flux signal, which can shift due to asymmetries introduced by ITSC faults. The variance quantifies signal dispersion, capturing increased fluctuations in stray flux due to fault-induced disturbances. The RMS reflects the overall signal energy, which may be higher in faulty conditions due to increased flux leakage. The selected histogram bins , , , , indicate that faults alter both the lower and upper amplitude ranges of the signal distribution. corresponds to the most negative peak values, while captures the highest positive peaks. The presence of intermediate bins (, , and ) suggests that certain fault conditions affect the probability of midrange amplitude occurrences, possibly due to modulations introduced by short circuits.
For multiclass classification, the retained statistical features and (median) provide a characterization of signal distribution, independent of extreme values. (first quartile) captures lower signal variations, while (median) represents the central tendency, which can shift depending on fault severity. The selected histogram bins , , , , , further confirm that ITSC faults introduce structured modifications in specific amplitude regions. and suggest that faults alter both minimum and maximum stray flux peaks, whereas , , , and imply that moderate-to-severe faults introduce changes in mid-range amplitude distributions.
The differences in feature selection between binary and multiclass classification reflect their respective objectives. While binary classification prioritizes features that distinguish faulty from healthy conditions, multiclass classification retains attributes that further differentiate fault severity levels. The inclusion of quartile-based features in multiclass classification suggests that the severity of the fault influences the broader signal distribution beyond mean and variance alone. Additionally, the retained histogram bins indicate that as the severity of ITSC faults increases, the probability distribution of flux values changes progressively, affecting both peak and mid-range amplitude occurrences.
Computational Complexity Considerations
The computational cost of machine learning models varies significantly between training and inference. MLP exhibits a training complexity of , where N is the number of training samples and L is the number of neurons. The backpropagation algorithm introduces high computational overhead during training, but the inference complexity is , making it efficient once it is deployed.
Tree-based models such as RF and XGBoost have training complexities of and , respectively, where T is the number of trees and d is the depth. Their inference complexity remains low (), making them viable for embedded applications. k-NN, in contrast, has no training cost but incurs a high inference complexity of , as it computes distances to all training samples. SVM requires to during training, making it computationally expensive, with the inference complexity dependent on the number of support vectors ().
Deployment in Embedded Systems: Trade-Off Between Accuracy and Efficiency
For deployment in RISC-based embedded architectures, computational efficiency is critical. Feature selection optimizes resource utilization by reducing memory footprint and inference latency. The results indicate that, for binary classification, 8–10 features preserve high accuracy while improving efficiency. For multiclass classification, 16 features offer a balance between performance and computational cost. PCA-based reduction, while compressing information, led to overall performance degradation across all classifiers.
Training should be performed on a high-performance server, and the trained model should be transferred to the embedded system for inference. RF and XGBoost provide favorable trade-offs because of their low inference complexity and memory efficiency. k-NN is less suitable due to its reliance on distance calculations throughout the data set, while MLP and SVM require higher computational resources, making them impractical for embedded deployment.
Trade-Offs in Classification Strategy
Binary classification enables rapid fault detection with minimal computational overhead, while multiclass classification provides additional diagnostic granularity at the expense of increased complexity. MLP demonstrates effective performance on high-dimensional data but has a higher training cost. Tree-based models such as XGBoost maintain stability to feature reduction while balancing accuracy and computational efficiency. The results suggest that the classification strategy should be selected based on application constraints, prioritizing either real-time efficiency or diagnostic depth.
4.4.3. Comparison with the Literature
Table 9 presents a comparison of this work with the summarized information on other related works. One of the major challenges in early detection of ITSCs is voltage imbalances. In this work, unbalances of up to ±10% between phases are covered, as presented in
Table 1, increasing the complexity of classification.
The study conducted comprehensive evaluations that included binary and multiclass classifications and performed a comparison with feature reduction through PCA to address the early detection of ITSCs in electrical motors. For both binary and multiclass classification, the ensemble feature selection method, based on RF and collinearity filtering, was essential to identify relevant features. The multiclass with an initial dataset comprising 57 attributes presented an accuracy of 99.1% when applying the MLP model. The ensemble feature selection approach, using RF, identified the most relevant attributes, leading to a reduction of the dataset to 54 features, but the accuracy increased to 99.3%. Subsequent evaluations showcased the resilience of classifiers to attribute reduction, with k-NN achieving an accuracy of 97.4% with 29 features and 93.3% with only 16 features.
In contrast, the PCA-based feature reduction technique demonstrated a noticeable reduction in performance across all classifiers. For multiclass classification, the analysis of the principal components led to a decrease in the accuracy of the three classifiers compared to the multiclass results using statistical features, with an accuracy of 93.1%. The binary and multiclass classification results, driven by an ensemble feature selection approach, generally surpassed the performance achieved through PCA-based dimensionality reduction.
The experimental results highlight the significance of both classification tasks. The binary classification model exhibited robust performance, achieving perfect accuracy in distinguishing between faulty and healthy motors, which underscores its suitability for real-time fault detection. On the other hand, the multiclass classification task demonstrated an accuracy of 99.3%, effectively distinguishing fault severity levels and providing valuable insights for predictive maintenance strategies. The high classification performance in both tasks reaffirms the reliability of the proposed method for industrial applications, offering a scalable and effective solution for stator fault detection.
The study evaluated multiple classifiers, including MLP, k-NN, RF, XGBoost, and SVM. For binary classification, MLP achieved the highest accuracy (100%), which confirms its suitability to detect motor failure. In multiclass classification, both MLP and k-NN provided exceptional performance, reaching a maximum accuracy of 99.3%. These results indicate that neural networks and distance-based classifiers are well-suited for fault detection tasks.
5. Conclusions
This study developed a sensor to collect TIM stray flux to detect ITSC. The proposed approach applied two machine learning classification tasks: binary classification, which demonstrated high accuracy (100% using MLP) for general fault detection, and multiclass classification, which provided additional insights into fault severity (achieving 99.3% accuracy with MLP). While binary classification is ideal for real-time fault detection, multiclass classification allows for a more detailed analysis, supporting predictive maintenance strategies. These findings suggest that the combination of stray flux measurement and machine learning can be a powerful tool for diagnosing and managing induction motor faults. The SMOTETomek algorithm was applied for data balancing, while RF and PCA were used for feature selection. The MLP, RF, XGBoost, SVM, and k-NN classifiers were then evaluated at each feature selection stage.
With the initial set of 57 attributes, MLP achieved an accuracy of 100% accuracy, F1-score, precision, and recall in binary classification and 98–99% in multiclass classification. Using RF to estimate the importance of the characteristic, a reduction to eight elements allows 92% of accuracy to be reached in the binary experiment using RF and 85% in multiclass classification using k-NN. In the PCA experiments, the set of 18 principal components used as input to k-NN achieved an overall accuracy of 93%. Considering seven principal components, k-NN achieved 87% of accuracy. The results demonstrated that MLP was substantially sensitive to attribute reduction, while k-NN is recommended with reduced feature sets.
Removing irrelevant features reduces execution time and enhances classification accuracy by eliminating noisy data. In this study, the maximum level of accuracy was achieved by eliminating three features for the multiclass scenario. An additional feature decrease led to a reduction in assertiveness scores, although a decrease in computational effort. In applications like embedded systems, balancing accuracy with computational cost is essential, but it can directly influence the overall performance of the classification model.
Remarkably, this work database comprises ITSC in the three phases, so the short-circuit position varied in relation to the position of the SC, causing the waveforms of the phases to be slightly different. Moreover, voltage imbalance distorts the motor’s rotating magnetic field, affecting the waveform induced in the SC. These factors increase diagnostic complexity and highlight the reliability of the proposed approach.
Future research should explore deep learning techniques, such as convolutional and recurrent neural networks, to automate feature extraction and reduce reliance on manual attribute selection. Additionally, combining time-domain and frequency-domain features through methods like short-time Fourier transform (STFT) or wavelet analysis could enhance classification robustness, particularly in identifying fault severity levels. Optimizing computational efficiency for embedded system deployment remains a relevant challenge, where techniques such as quantization, model pruning, and hardware-aware neural networks could enable real-time fault detection in industrial applications.
Extending the proposed methodology to different motor types and operational conditions would improve generalizability, while adaptive machine learning models capable of incremental learning could enhance real-time fault detection in evolving environments. Multi-sensor fusion, integrating stray flux data with vibration or thermal imaging, could refine diagnostic accuracy and reduce false positives. The application of explainable AI (XAI) techniques, such as SHAP or LIME, would provide greater interpretability of classification decisions, making the approach more accessible for maintenance strategies. Finally, large-scale validation in industrial environments remains an essential step to assess the method’s reliability under real-world conditions, ensuring its applicability in diverse operational contexts.


 ,
, 
