1. Introduction
Photovoltaics has been the most dynamically growing branch of Polish renewable energy in recent years. The total installed capacity of PV systems in Poland is already almost 15.7 GW, of which more than 10.2 GW are prosumer micro-installations, with a total of approximately 1.35 million [
1]. Generation of energy in these PV installations is forced by the availability of solar radiation energy resulting from variable weather conditions and limited by phenomena such as shading of the active surface of PV modules, their temperature increase, and pollution deposited on PV modules.
The development of photovoltaics over the past several decades is inextricably linked to its use of silicon-based cells. Despite ongoing development work on alternative technologies such as tandem perovskite cells [
2] or polymer cells [
3], however, according to a recent Fraunhofer ISE report [
4], 94.7% of photovoltaic modules produced today are made of crystalline silicon technology. Modules made of monocrystalline silicon account for 84.2% of production. The most common material in this type of module is tempered solar glass, which provides insulation of the silicon structure from the weather while allowing sunlight to reach the surface of the photovoltaic cells. However, in the literature, one can find information on the use of other materials in this role, e.g., Poly(methyl methacrylate) (PMMA) [
5]. Special coatings can also be applied to solar glass to make it more difficult to deposit pollutants [
6].
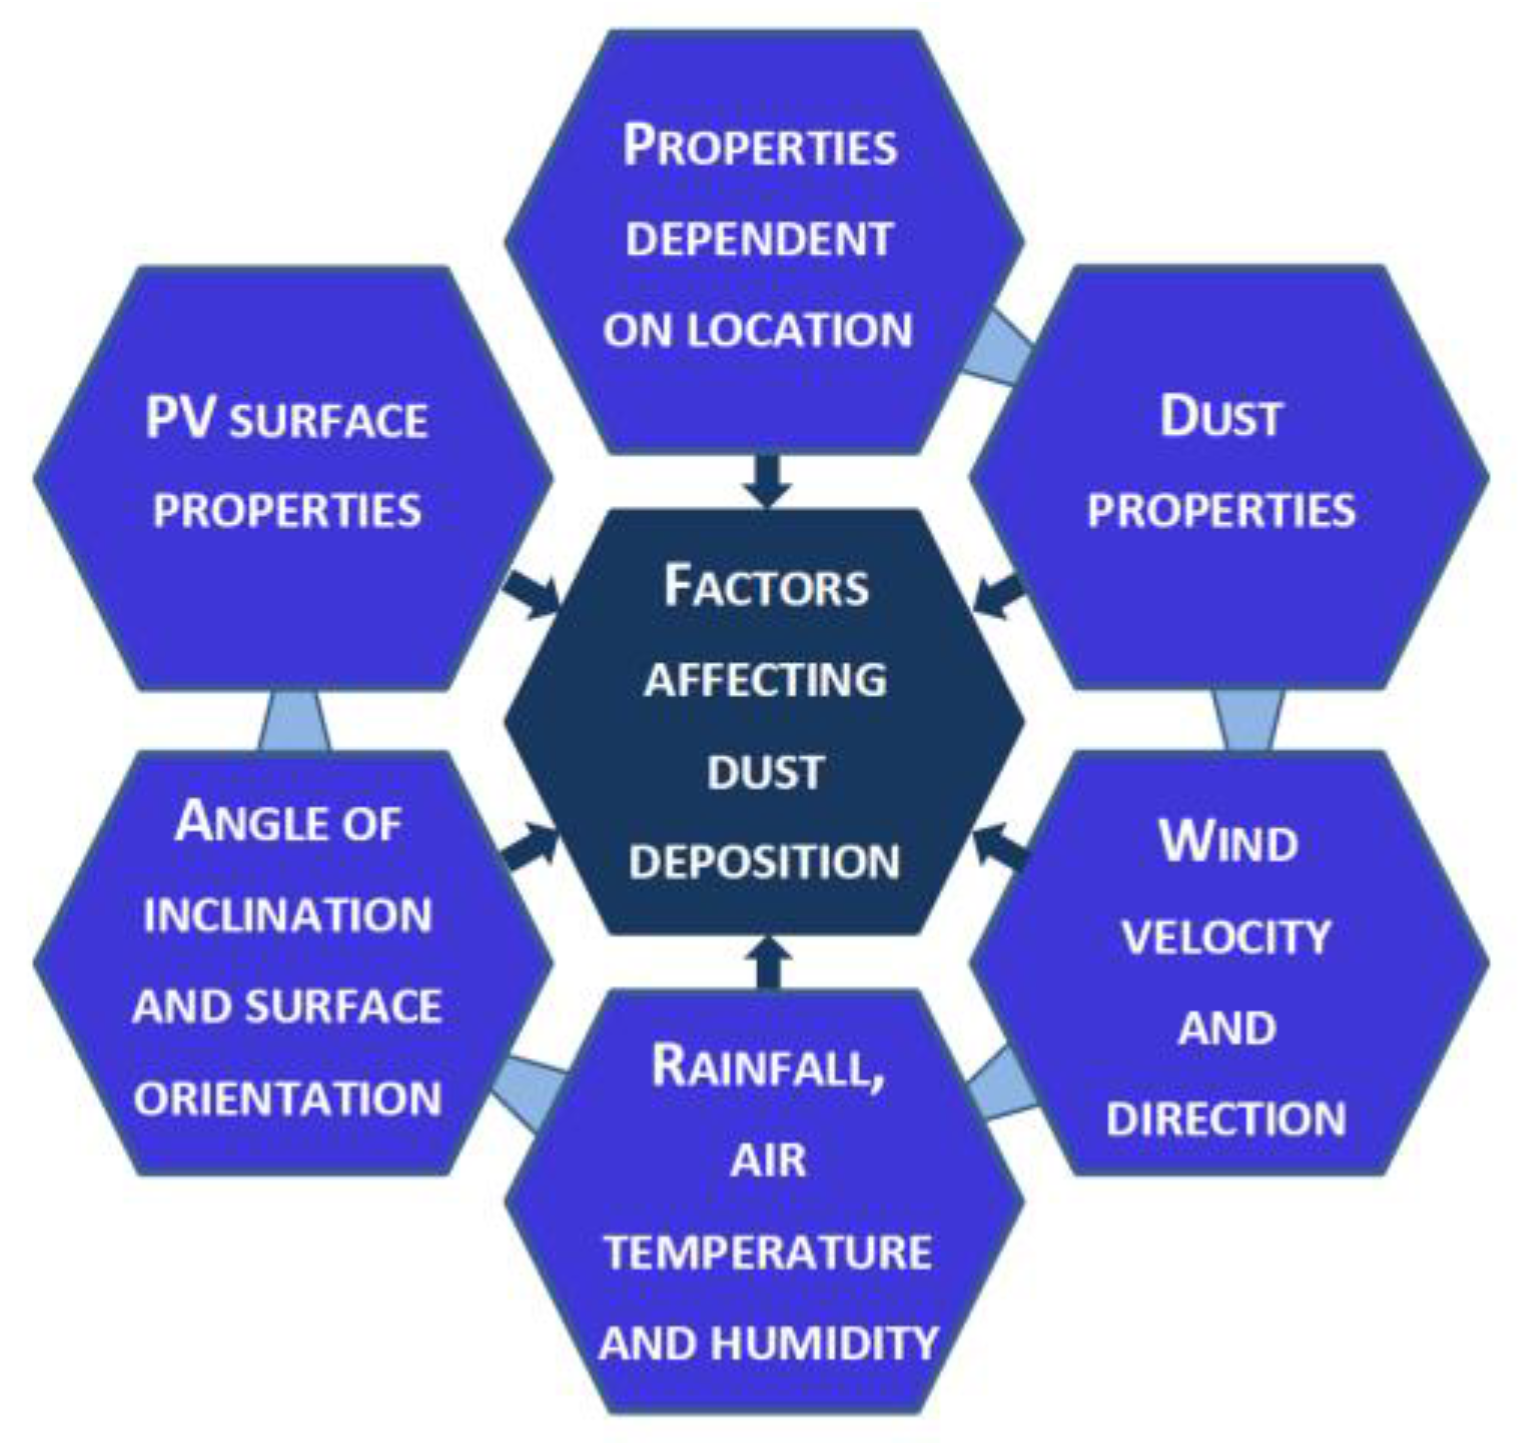
Dust floating in the atmosphere can be of natural origin (e.g., desert storms, volcanic eruptions, rock erosion, and pollen) or can be the result of human activity (transport, industry, and low emissions from heating appliances). The intensity of pollutant deposition on a given surface will be influenced by a number of factors, as shown in more detail in
Figure 1.
It is considered that environmental conditions, relative humidity, wind speed, temperature, dust particle size, and concentration all have important effects on dust accumulation. Of all the factors that affect the efficiency of photovoltaic module production, there are outdoor factors such as altitude, dust, humidity, temperature, wind speed, hail, and self-factors such as the tilt angle, material, quality, and maintenance of PV modules [
8]. Dust, in cooperation with other particles in the atmosphere, causes the scattering of solar radiation by the process of reflection, absorption, and dispersion, which negatively impacts the performance of the solar PV module [
9]. However, in the literature, one encounters descriptions of studies that prove that a very thin layer of dirt (26 mg/m
2) on the front surface of the module increases its efficiency [
10]. This is because, in this case, the dirt acts as a texturization of the glass, reducing light reflection. The dust covering the surface of the PV panel not only blocks the irradiation but also blocks the heat dissipation that affects the power generation efficiency [
11]. As the dust particles cling to the panel surfaces, they can lead to scratches and corrosion [
12], decreasing the panels’ lifespan. Influencing factors such as characteristics of collected dust and ambient conditions must be considered in the design of solar plants.
Pollution accumulates on the PV module unevenly, as research results [
13] show that a higher dust accumulation occurs in the central part of the module. A study conducted in Chile [
14] found that the soiling-losses effect of bifacial PV modules is 21.6% lower than in the case of monofacial modules.
Measuring the amount of contamination on the surface of PV modules is a major technical challenge. Leaving aside direct analytical-weighing methods (such as the one described in this article), which cannot be applied on an industrial scale, two different solutions to this problem can be found in the literature. In the first, a calibrated light source is used to illuminate a photosensitive element (such as a reference photovoltaic cell) at night, and the electrical signals generated by this device are recorded [
15]. The recorded electrical signals also change as pollution is deposited on this photosensitive element. Comparing the current signals to those when the sensor was completely clean indicates the degree of contamination. The second method is a statistical analysis of the power generated by a PV installation, taking into account environmental parameters [
16]. In this case, the current measurements are also compared to those taken immediately after washing the installation, and the fouling soiling is assessed on this basis.
Removal of dirt from the surface of PV modules can occur from natural causes (rain and wind) or through human activity (manual or mechanical cleaning). An interesting overview of PV module cleaning methods can be found in [
17,
18]. An interesting system for cleaning the surface of photovoltaic modules using electrostatic methods is described in [
19].
Effective scheduling of PV system cleaning activities is one of the measures that can positively impact their operational and economic performance. Planning module cleaning too early or too late may result in significant losses, especially in large installations [
20]. An optimized cleaning schedule can enhance the benefits of installing high-efficiency modules, as it increases the amount of energy recovered through each cleaning and, therefore, the profits [
21]. The cost-effectiveness of cleaning photovoltaic installations must be calculated individually each time, taking into account electricity prices, labor costs, the cost of the necessary equipment, and the probability of rainfall in the near future. Analysis of a photovoltaic farm located in the south of Spain showed that cleaning the modules once a year (during the summer) increases the farm’s revenue by 3.6% [
19]. Extensive analysis in Saudi Arabia has shown that in the region, manual or mechanical washing pays off when the PV plant’s efficiency due to soiling drops by 8%. In the case of washing with sprinklers, profitability begins when the efficiency drops by 3% [
22].
2. Materials and Methods
2.1. Object of Study
The experiment was conducted on a rooftop photovoltaic installation. It is a 10.2 kWp research installation located on building C3 (AGH campus, Krakow, Poland, GPS: 50°03′58.05″ N, 19°55′17.96″ E). Six types of silicon PV modules from three different manufacturers were selected for the experiment and installed with the same azimuth (20°W) and at three different tilt angles:
Type 1: polycrystalline silicon, white backsheet, manufacturer no. 1, 15° and 45° inclination;
Type 2: polycrystalline silicon, white backsheet, manufacturer no. 2, inclination 35°;
Type 3: polycrystalline silicon, black backsheet, manufacturer no. 2, inclination 35°;
Type 4: monocrystalline silicon, white backsheet, manufacturer no. 2, inclination 35°;
Type 5: monocrystalline silicon, black backsheet, manufacturer no. 2, inclination 35°;
Type 6: monocrystalline silicon, white backsheet, manufacturer no. 3, inclination 45°.
The three different angles of tilt of the modules indicated above are common in Poland. An inclination of 15 degrees is used when installing photovoltaics on flat roofs. A 35-degree slope is the optimal year-round angle (guaranteeing maximum energy yield), while a 45-degree slope is used for off-grid systems to facilitate self-cleaning and winter snow sliding off the surface of PV modules.
Each module had its own power optimizer, allowing continuous measurement of the module’s most relevant electrical parameters. The MPPT algorithm implemented in the optimizer guarantees that the module always operates at the maximum power point (MPP). Observing the behavior of the modules between cleanups, we relied on the energy generated by the modules in a given hour rather than their instantaneous power because the power fluctuated constantly.
2.2. Weather Background
Both the weather station located on the roof of the C3 building (mainly sunlight measurements) and the weather station located on the roof of the AGH Faculty of Physics and Applied Computer Science building were used to monitor the weather background during the experiments. The latter station has sensors for rainfall intensity and PM10 particulate matter. The experiment started at the end of the heating season when the average levels of PM10 particulate matter in the air were around 60 μg/m3. The end of the experiment coincided with the spring season, which is associated with heavy pollen counts. PM10 content in the ambient air did not usually exceed 20 μg/m3 at that time.
No precipitation was recorded for almost three weeks before the start of the experiment, while precipitation during the experiment is shown in
Table 1.
2.3. Methodology of Measurement
Prior to the experiment, the modules had not been intentionally cleaned for at least a year. During this period, they were only subject to natural self-cleaning under the influence of precipitation. It was assumed that the selected modules would be cleaned weekly. This rule was maintained with the exception of one week in May when no samples were collected due to the absence of the experimenters [
7]. Some modules were cleaned less frequently to check whether deposition increased linearly over time.
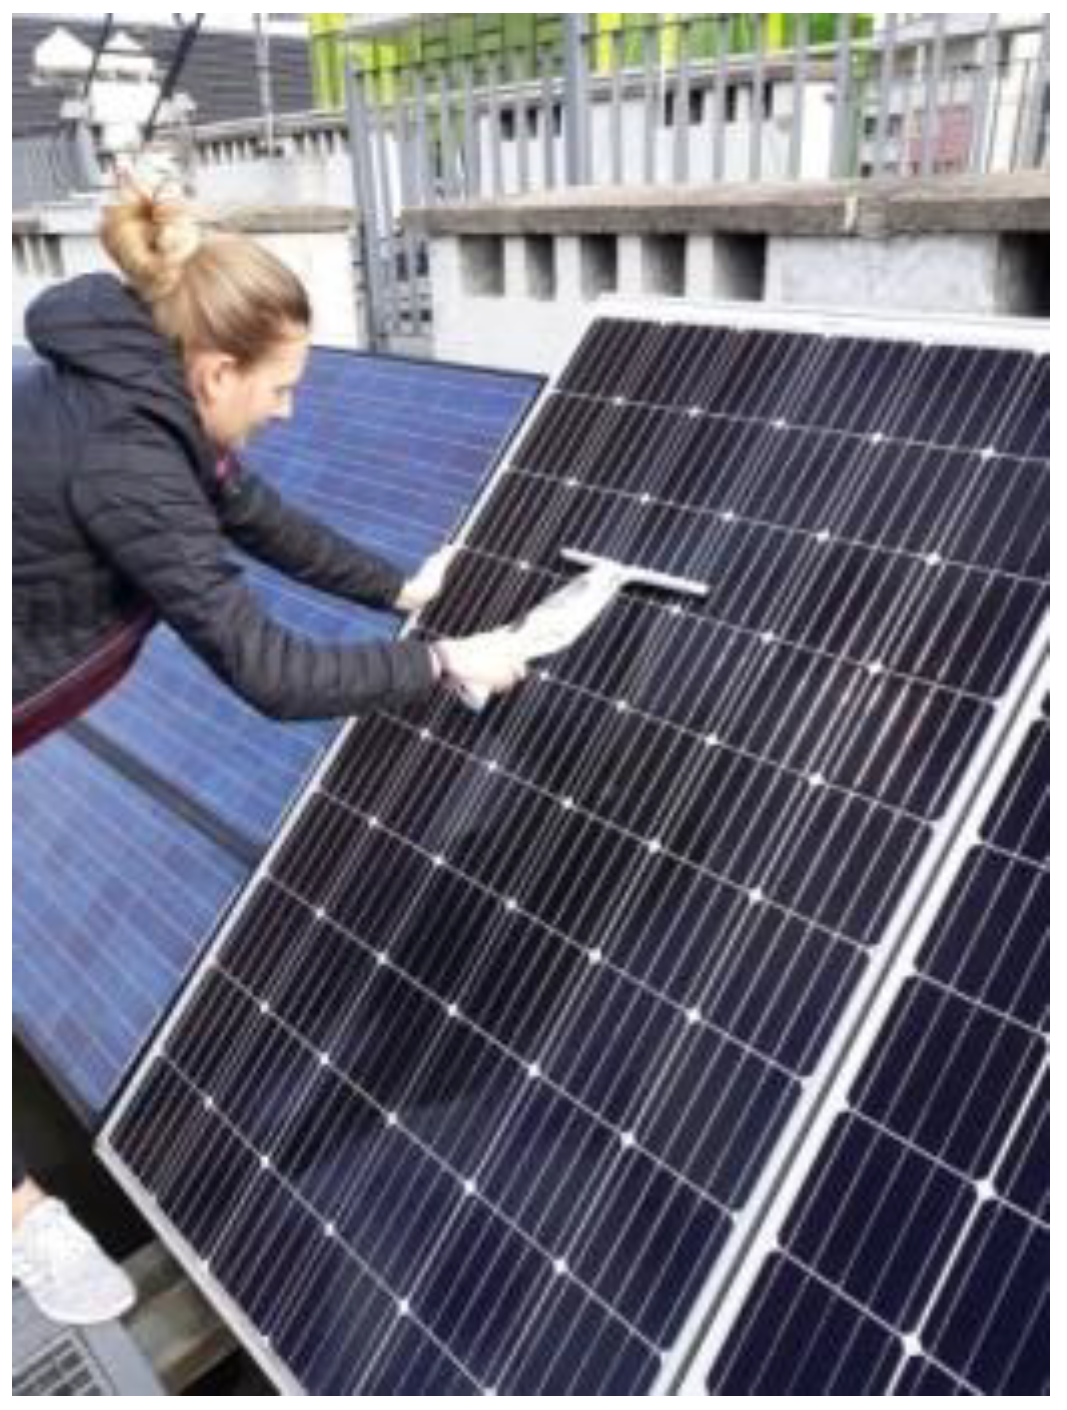
The sampling (and module cleaning) procedure started by spraying a small amount of demineralized water on the module surface. The wetted module surface was then cleaned using an electric vacuum window washer. This is shown in
Figure 2. The washer collected the water along with the dirt in its internal tank. The wetting and dirt collection operations were repeated for each module 2–3 times until the surface was completely clean. The contents of the spray tank were then poured into a perfectly clean and sterile container (plastic containers used in medical analytics were used). In addition, the washer was rinsed with a small amount of demineralized water, and these rinses were added to the same container.
The containers were previously numbered and weighed on a laboratory balance with a resolution of 0.1 mg. The numbers of the sample containers were entered into special record cards to unambiguously link the sample to a specific date and module.
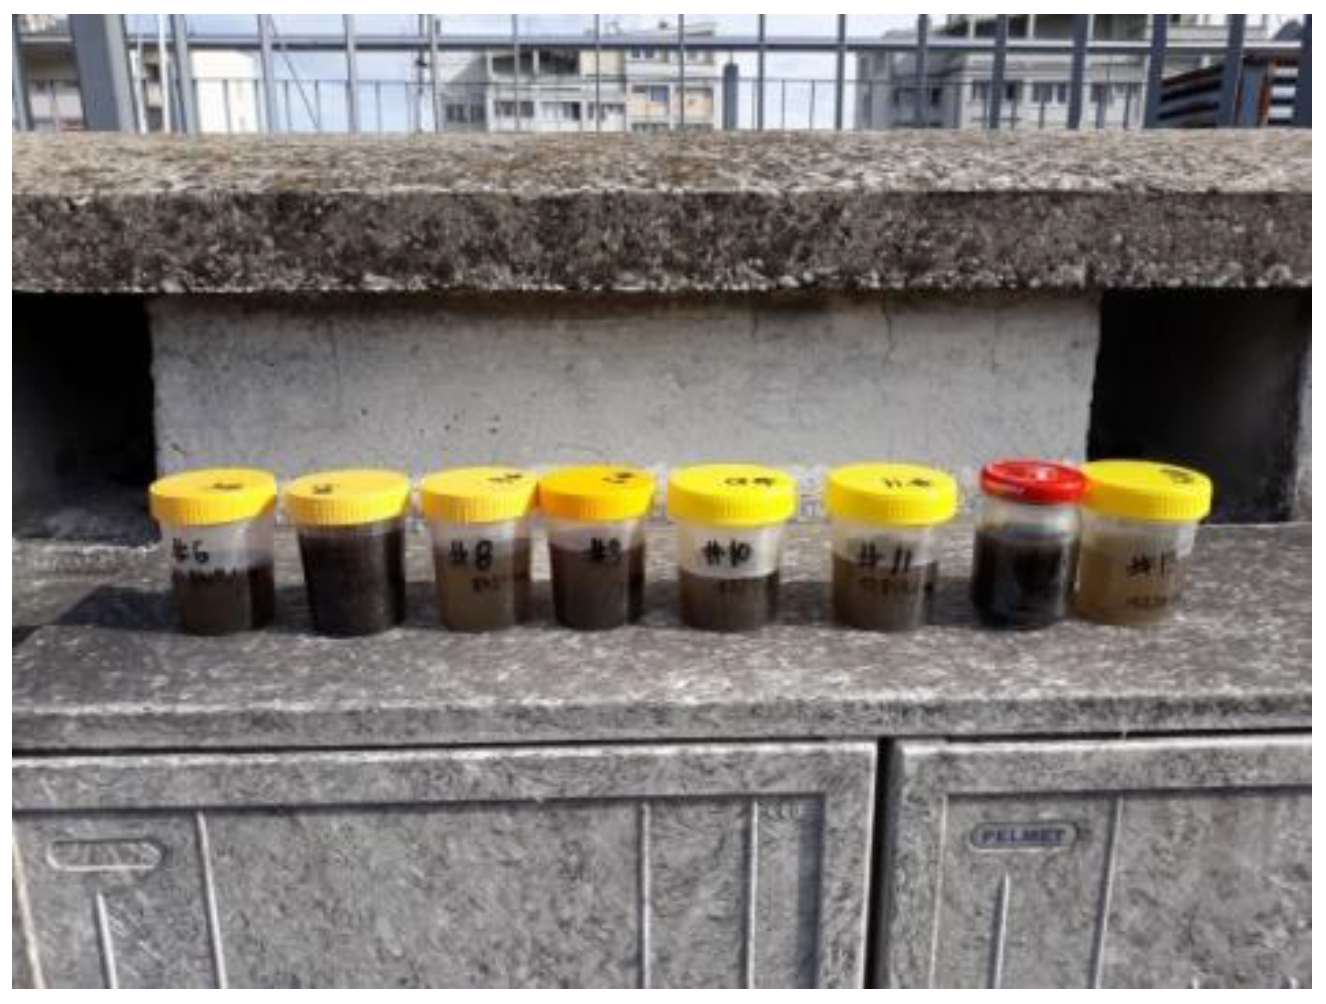
Already with the naked eye (
Figure 3), it was possible to notice the different content of impurities in the individual samples manifested by the different intensities of the color of the solution.
For an accurate assessment of the mass of contaminants, water was removed from all samples (via evaporation or freeze drying), and the container of dry contaminants was weighed again. By subtracting the original weight of the container from the result obtained, the weight of the collected contaminants was obtained. This mass was then normalized by dividing by the area of the solar glass in the module in question.
2.4. Checking the Effect of the Dirt Layer on the Electrical Performance of the PV Module
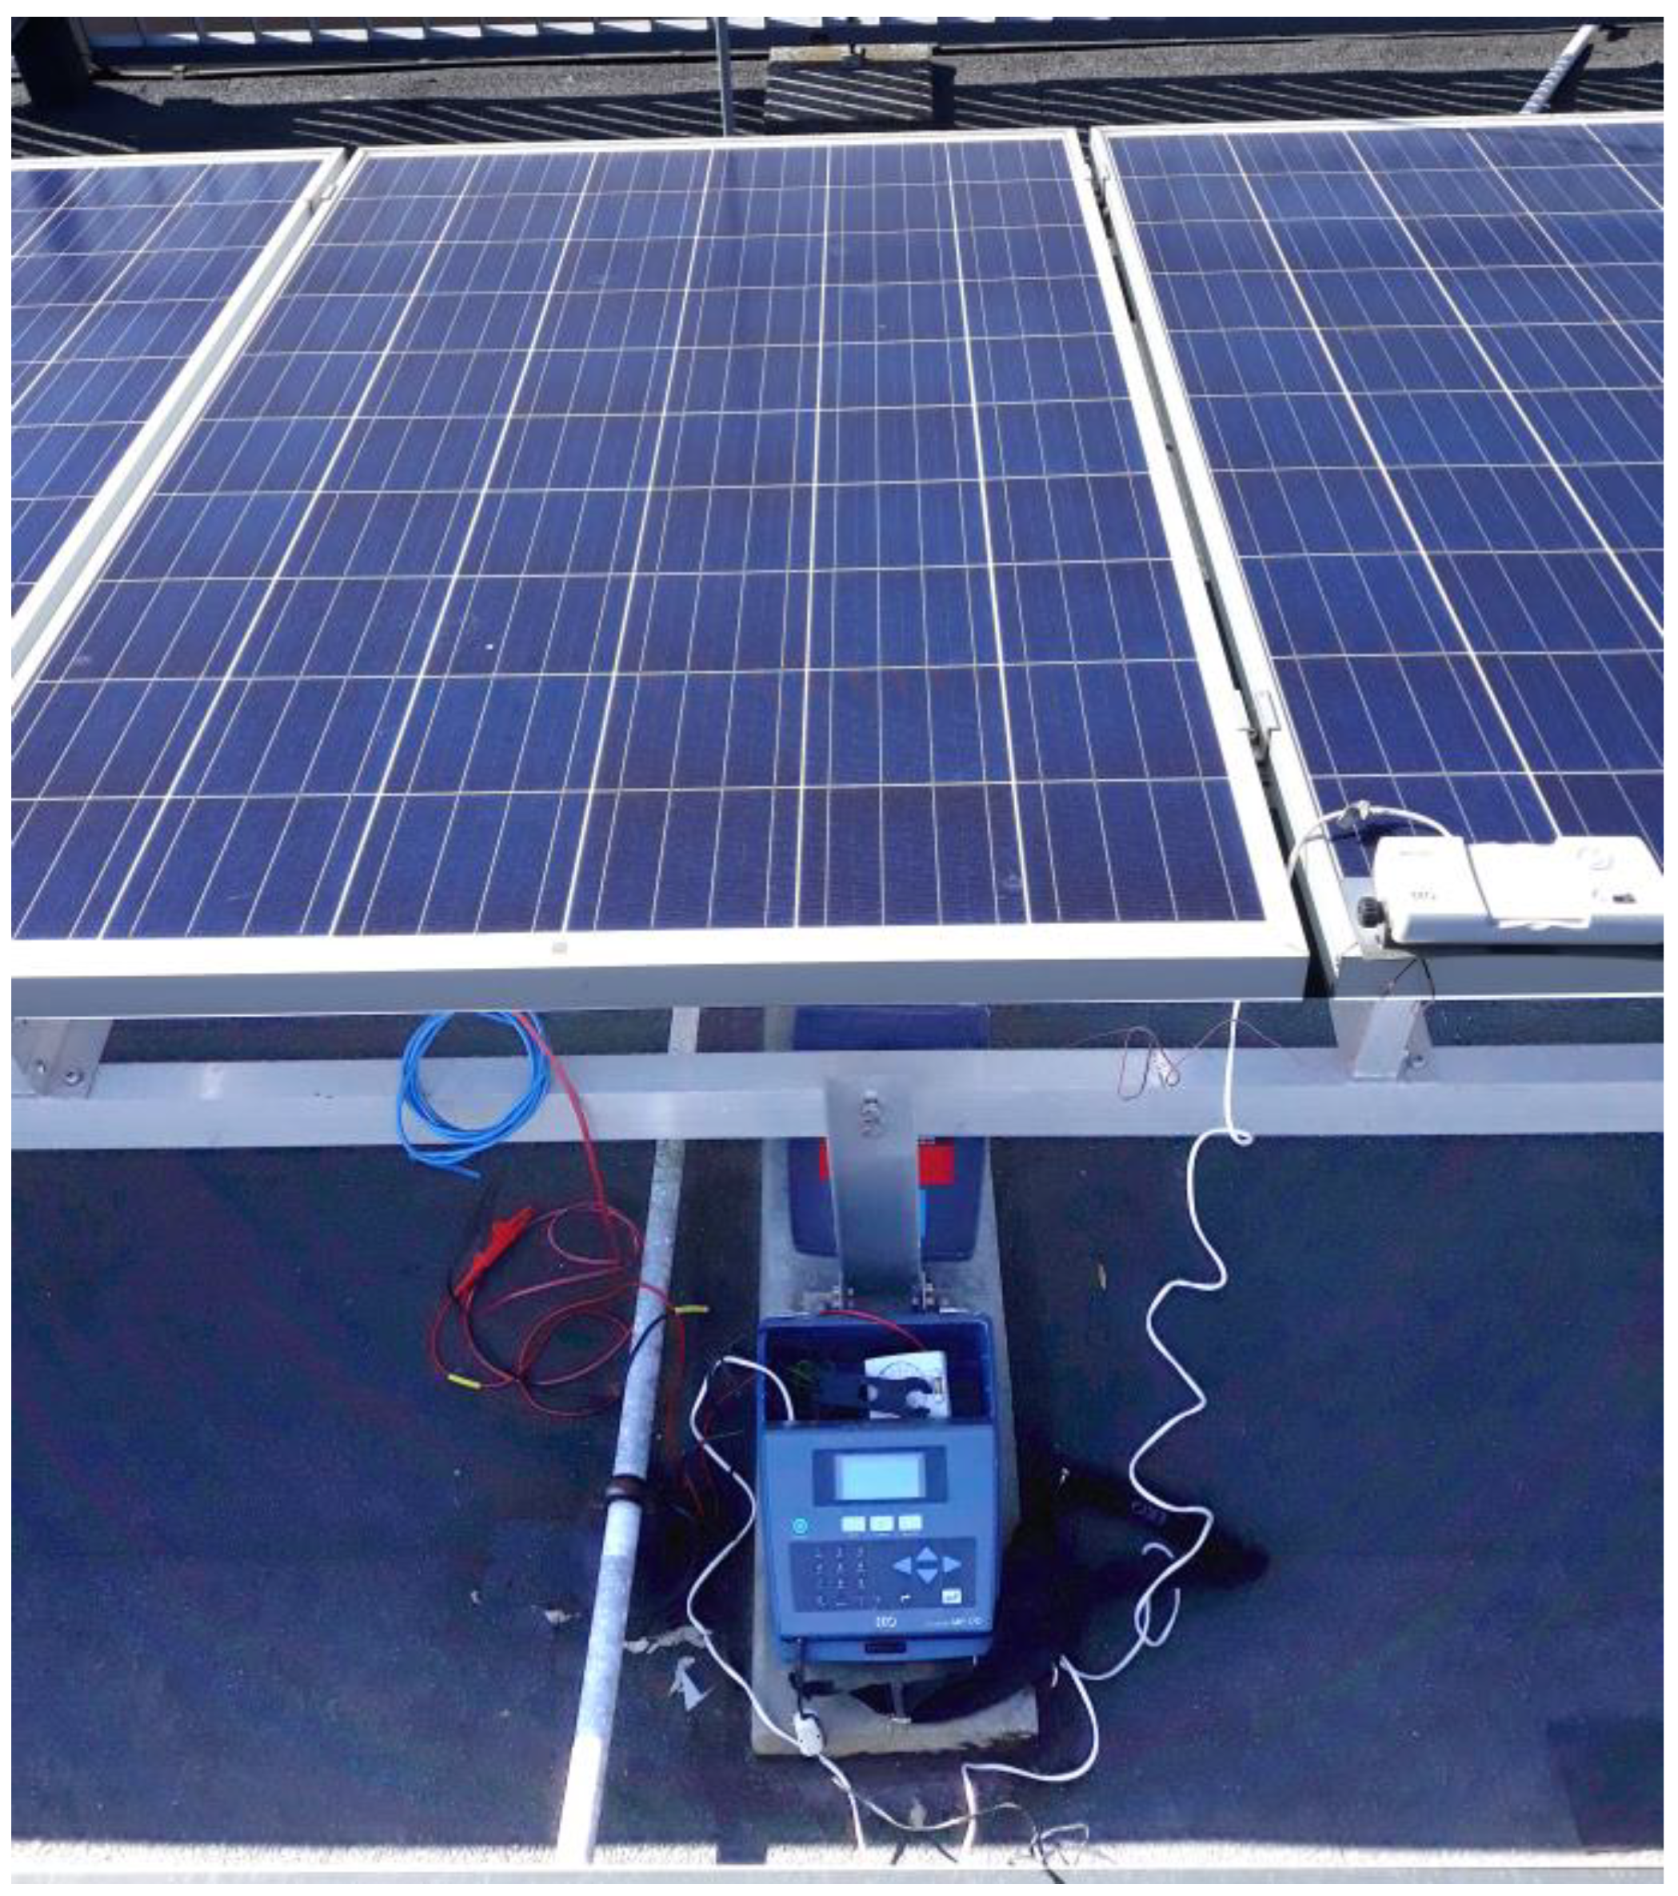
A comparative test was carried out to see how the electrical performance of a module is affected by impurities deposited on its surface. This took place under natural outdoor conditions (with a cloudless sky) on a polycrystalline silicon module inclined at 15°. The module had not been cleaned for a fortnight, but three days prior to the measurements, it had rained on with medium intensity. A spring day with good, stable lighting conditions was chosen for the measurements. To start with, the I–V characteristics of the module covered with a layer of natural dirt were measured using an MP-170 current–voltage characteristic meter (EKO Instruments Co., Ltd., Tokyo, Japan). The measuring device was connected directly to the terminals of the module after it had been disconnected from the optimizer. The measurement of a single I–V characteristic containing 400 measurement points took 4 ms. The standard procedure of cleaning and collecting the collected contaminants was then applied. After cleaning, the I–V characteristics were measured again. The time interval between the acquisition of both I–V characteristics (before and after washing the module) was exactly 12 min. Subsequent analysis of the dirt sample showed a mass of 181.2 mg/m
2. The appearance of the measuring station is shown in
Figure 4. The measuring device is located below the module under test. On the adjacent module (on the right) is an illumination sensor that records the irradiance in the plane of the modules. The temperature sensor was attached to the backsheet of the module.
4. Discussion
Initial cleaning of the modules (after a gap of more than a year and almost three weeks of rain-free weather) revealed a layer of contamination with an average mass of 710 mg/m
2 and 401 mg/m
2 for modules inclined at 15° and 45° angles, respectively. This was followed by comparing the amount of dust accumulated on the surface of modules inclined at angles of 15°, 35°, and 45°. Modules cleaned at the same intervals (every one or two weeks) were selected for comparison.
Table 6 shows the percentage relationships between the average amounts of dirt accumulated on modules tilted at different angles. The mass of dust from modules inclined at an angle of 15° was taken as the reference value.
As can be seen in
Table 2,
Table 3,
Table 4,
Table 5 and
Table 6 earlier, the amount of contamination deposited during the same week on the surface of PV modules installed at the same tilt angle can vary significantly from one module to another. This may be due to the localized nature of the wind effect or due to random events such as the local appearance of larger contaminant particles. It is also significant that in the case of modules inclined at 45°, they come from two different manufacturers (different surfaces of solar glass). For modules with the most horizontal position, the weekly deposition of pollutants (in rain-free weather) ranges from 100 to about 200 mg/m
2. For modules positioned more vertically, the contaminant deposition is 22 to 59% lower. Modules installed more vertically are also subject to more effective self-cleaning under the influence of rain. For self-cleaning to be effective, the rain must be of sufficient intensity. This is confirmed by the example of the rain on 3 May. With a total rainfall of 0.54 mm/m
2 and an intensity of 0.5 mm/h, it had virtually no effect on the samples collected the following day, which is why the summary states that there were seven rain-free days. Even very heavy rain cannot completely wash the PV modules—it leaves a layer of dirt on them of 20 to 40 mg/m
2. The effect of washing the modules or self-cleaning them is short-lived. After just three to four days, a layer of contamination similar to the whole-week values appears on them.
In the next step, it was decided to test whether the silicon cell technology and the color of the backsheet had an impact on deposition. Four modules from the same manufacturer were used for testing: two each in polycrystalline and monocrystalline silicon technology. In each pair, one module had a white backsheet and silver frame, and the other had a black backsheet and black frame. The modules were installed at a 35° angle in close proximity to each other. A summary and comparison of the amount of dirt collected is shown in
Table 7.
When analyzing the impact of the color of the backsheet shown in
Table 7, the amount of dirt accumulated on the module with a white backsheet was used as a reference quantity. When analyzing the influence of cell technology, the mass of impurities accumulated on both modules (with black and white backsheet) was first summed separately for Si-mono and Si-poly technologies. Then, their mutual ratio was determined by taking Si-poly technology modules as a reference. While it is difficult to find a correlation between the deposition of impurities on mono- and polycrystalline modules, it is easy to see that the calculated average value of the ratio of impurities for modules with a black backsheet to modules with a white backsheet is similar for mono- and polycrystalline modules. It is 111.2% for monocrystalline modules and 110.2% for polycrystalline modules. Mono/poly deposition coefficients range from 72.2 to 116.9% with an average of 96.2%, which does not allow us to draw any conclusions about any relationship.
The final comparison in the experiment described here was to see whether vertical or horizontal mounting of a module affects the amount of dirt deposited on it. Samples were collected from four modules inclined at 45°. Two of these were monocrystalline modules from manufacturer No. 3, and the other two were polycrystalline modules from manufacturer No. 1. In each pair, one module was installed vertically and the other horizontally. The results of the measurements are summarised in
Table 8.
The vertical module was taken as the reference when analyzing the impact of module orientation (vertical or horizontal), as shown in
Table 8. When analyzing the influence of cell technology, the procedure was the same as for the measurements in
Table 7 by summing the samples collected for the vertical and horizontal modules in the first step. In the absence of samples for the horizontal module, only samples collected for the vertical modules were compared. In this case, a slightly more pronounced trend than before is the tendency towards stronger dirt deposition on polycrystalline modules—up to 132.6% with an average of 110.7% (the quoted values are the inverse of those shown in the last column of
Table 8). However, the effect of the installation method is more interesting. For monocrystalline modules, far more contamination settles on a module installed horizontally (with an average of 144.4%). In the case of polycrystalline modules, the horizontal module is more contaminated at higher sample weights, while the horizontal module is cleaner at lower sample weights. This means that the self-cleaning efficiency of the horizontally installed module is higher. This phenomenon may be influenced by the texture of the solar glass surface and the shape of the module frame, which prevents rainwater with dissolved contaminants from collecting on its inner edge. This phenomenon has not been observed on monocrystalline modules, but it should be remembered that they come from a different manufacturer and have a different solar glass and frame.
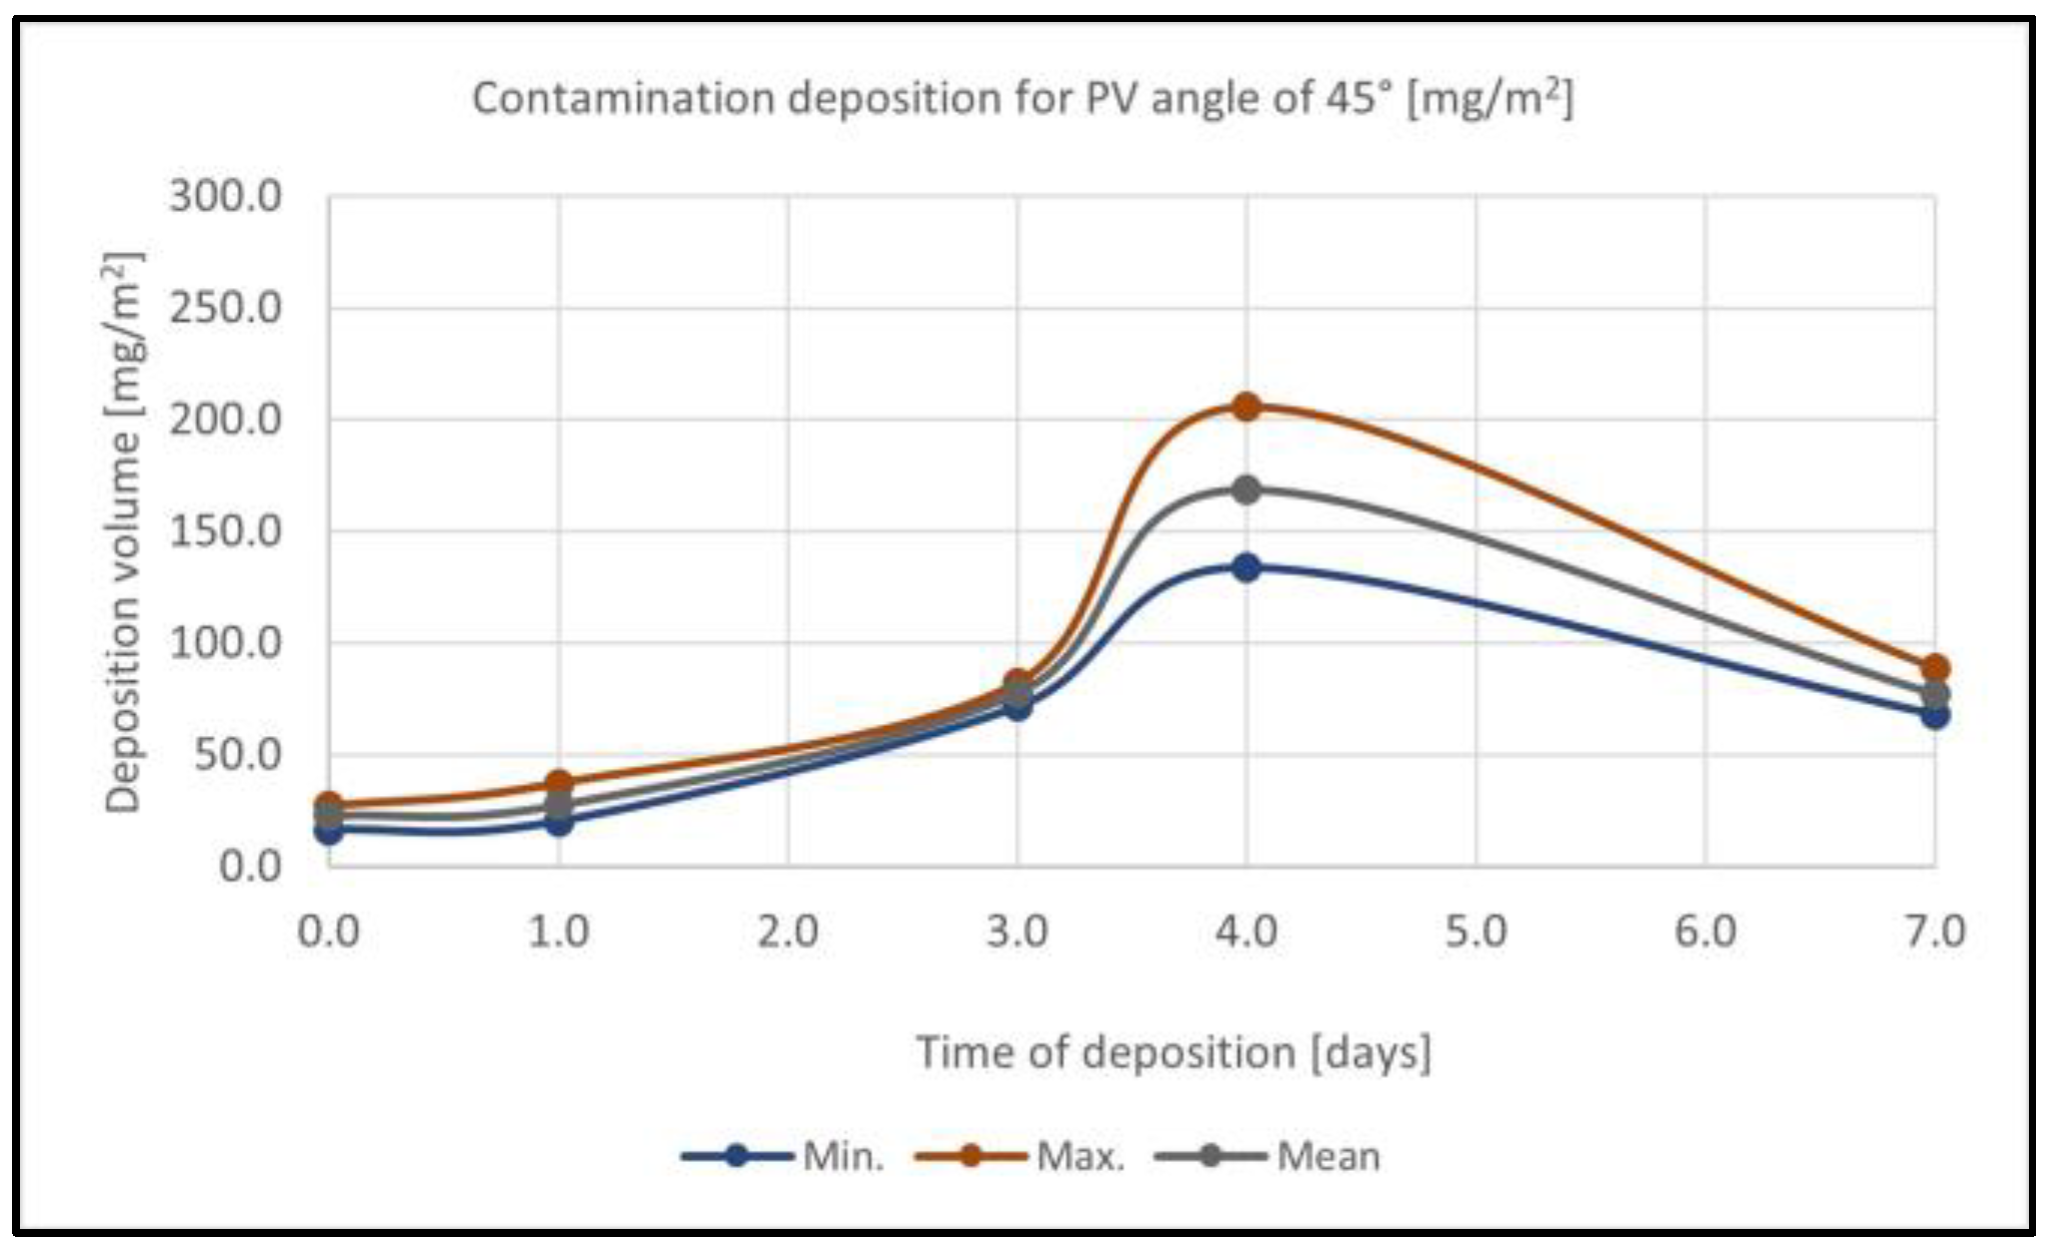
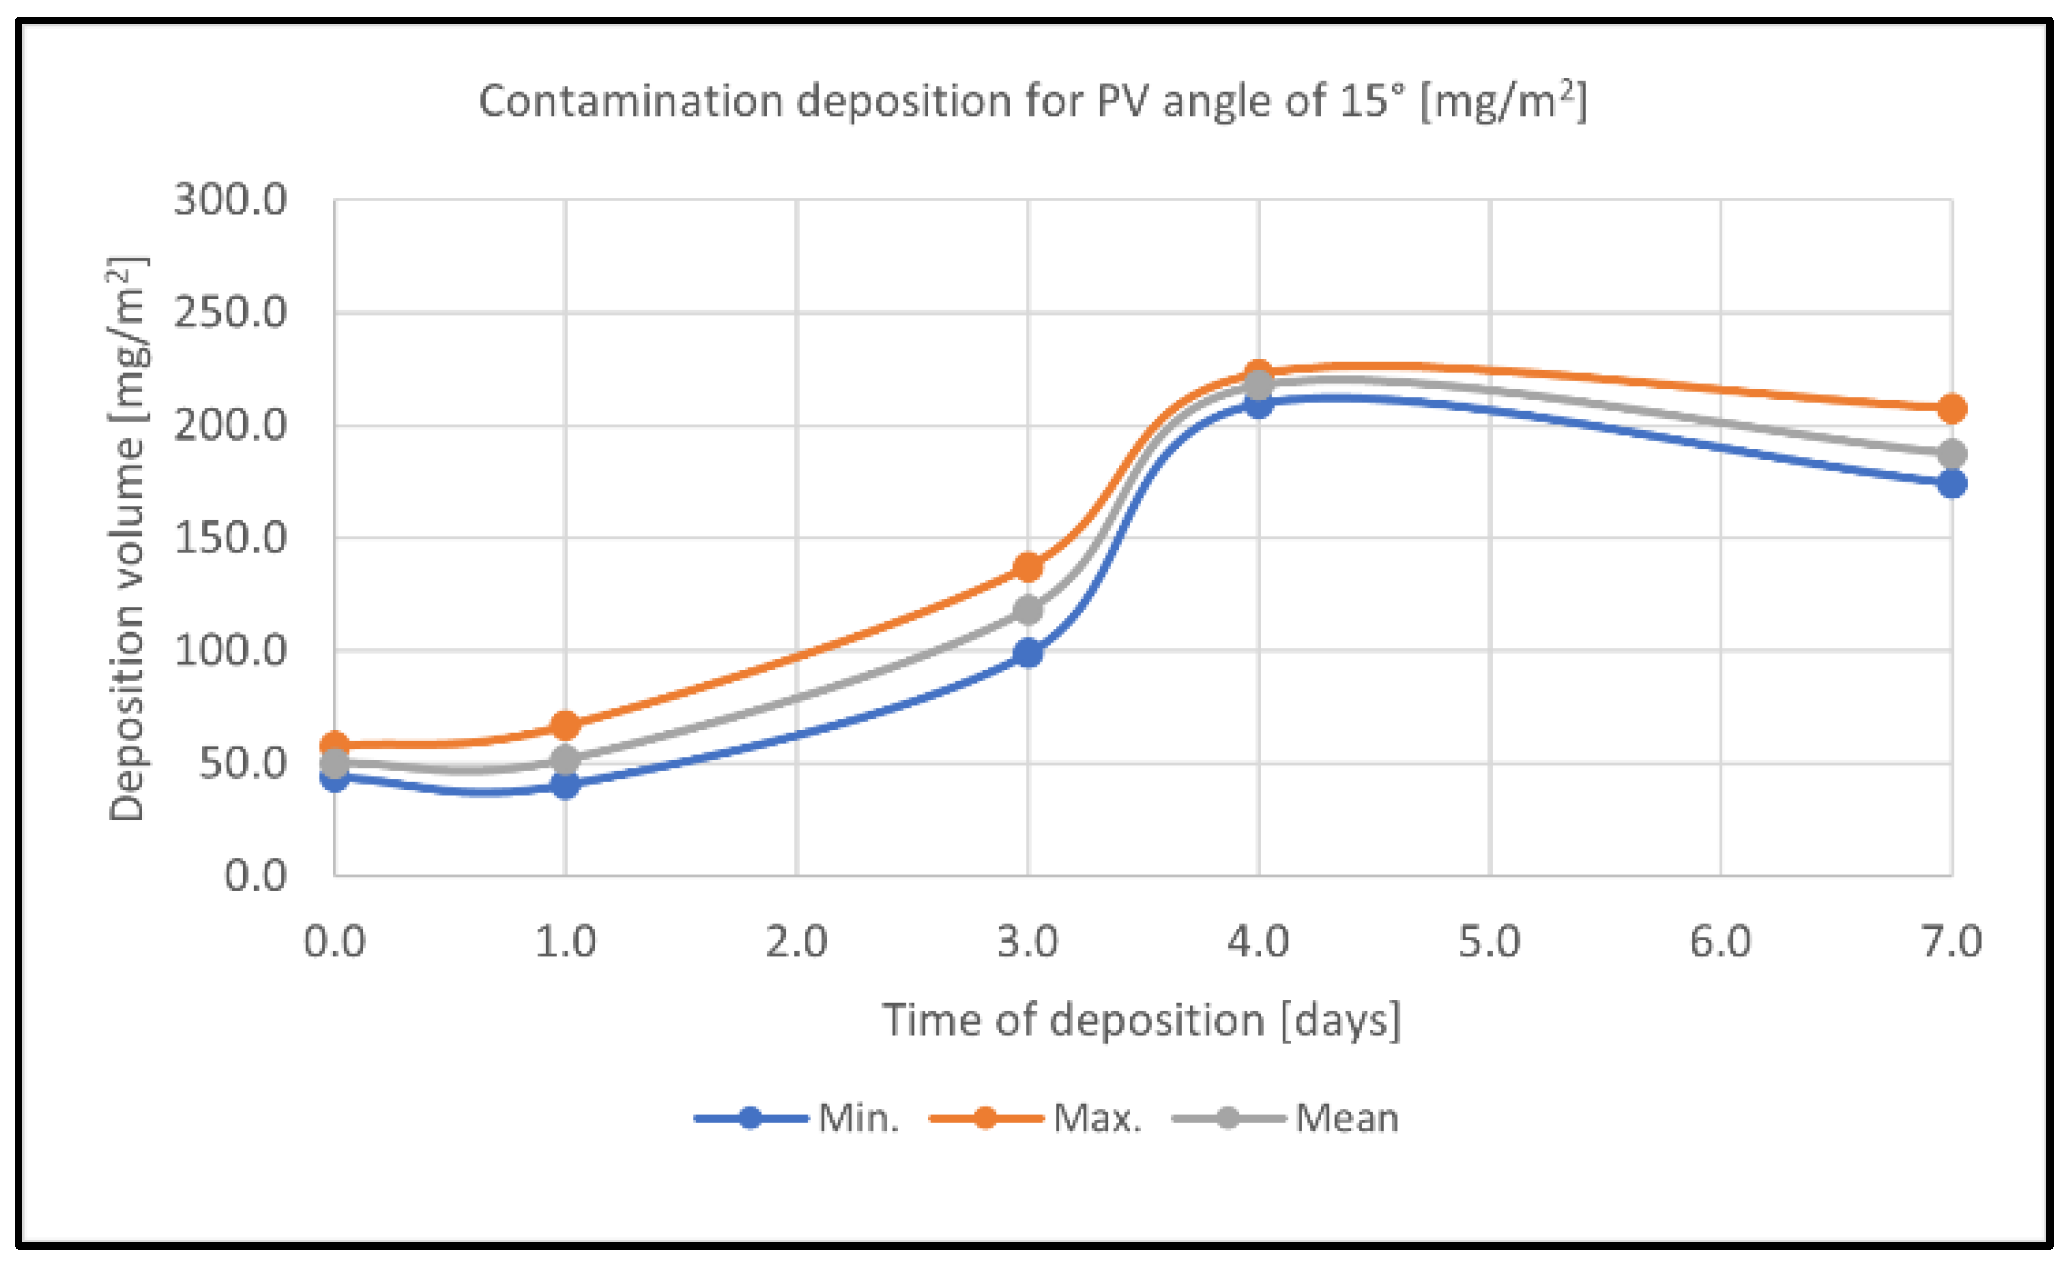
During the data analysis, a non-linear distribution of pollutant deposition on PV panels was observed, so it was decided to analyze how the amount of pollutants collected changed after each time interval (0, 1, 3, 4, and 7 days). Where more data were available for a given time interval, they were averaged using the arithmetic mean. The results obtained for different PV panel inclination angles (15°, 35°, and 45°) are presented in the graphs (
Figure 6,
Figure 7 and
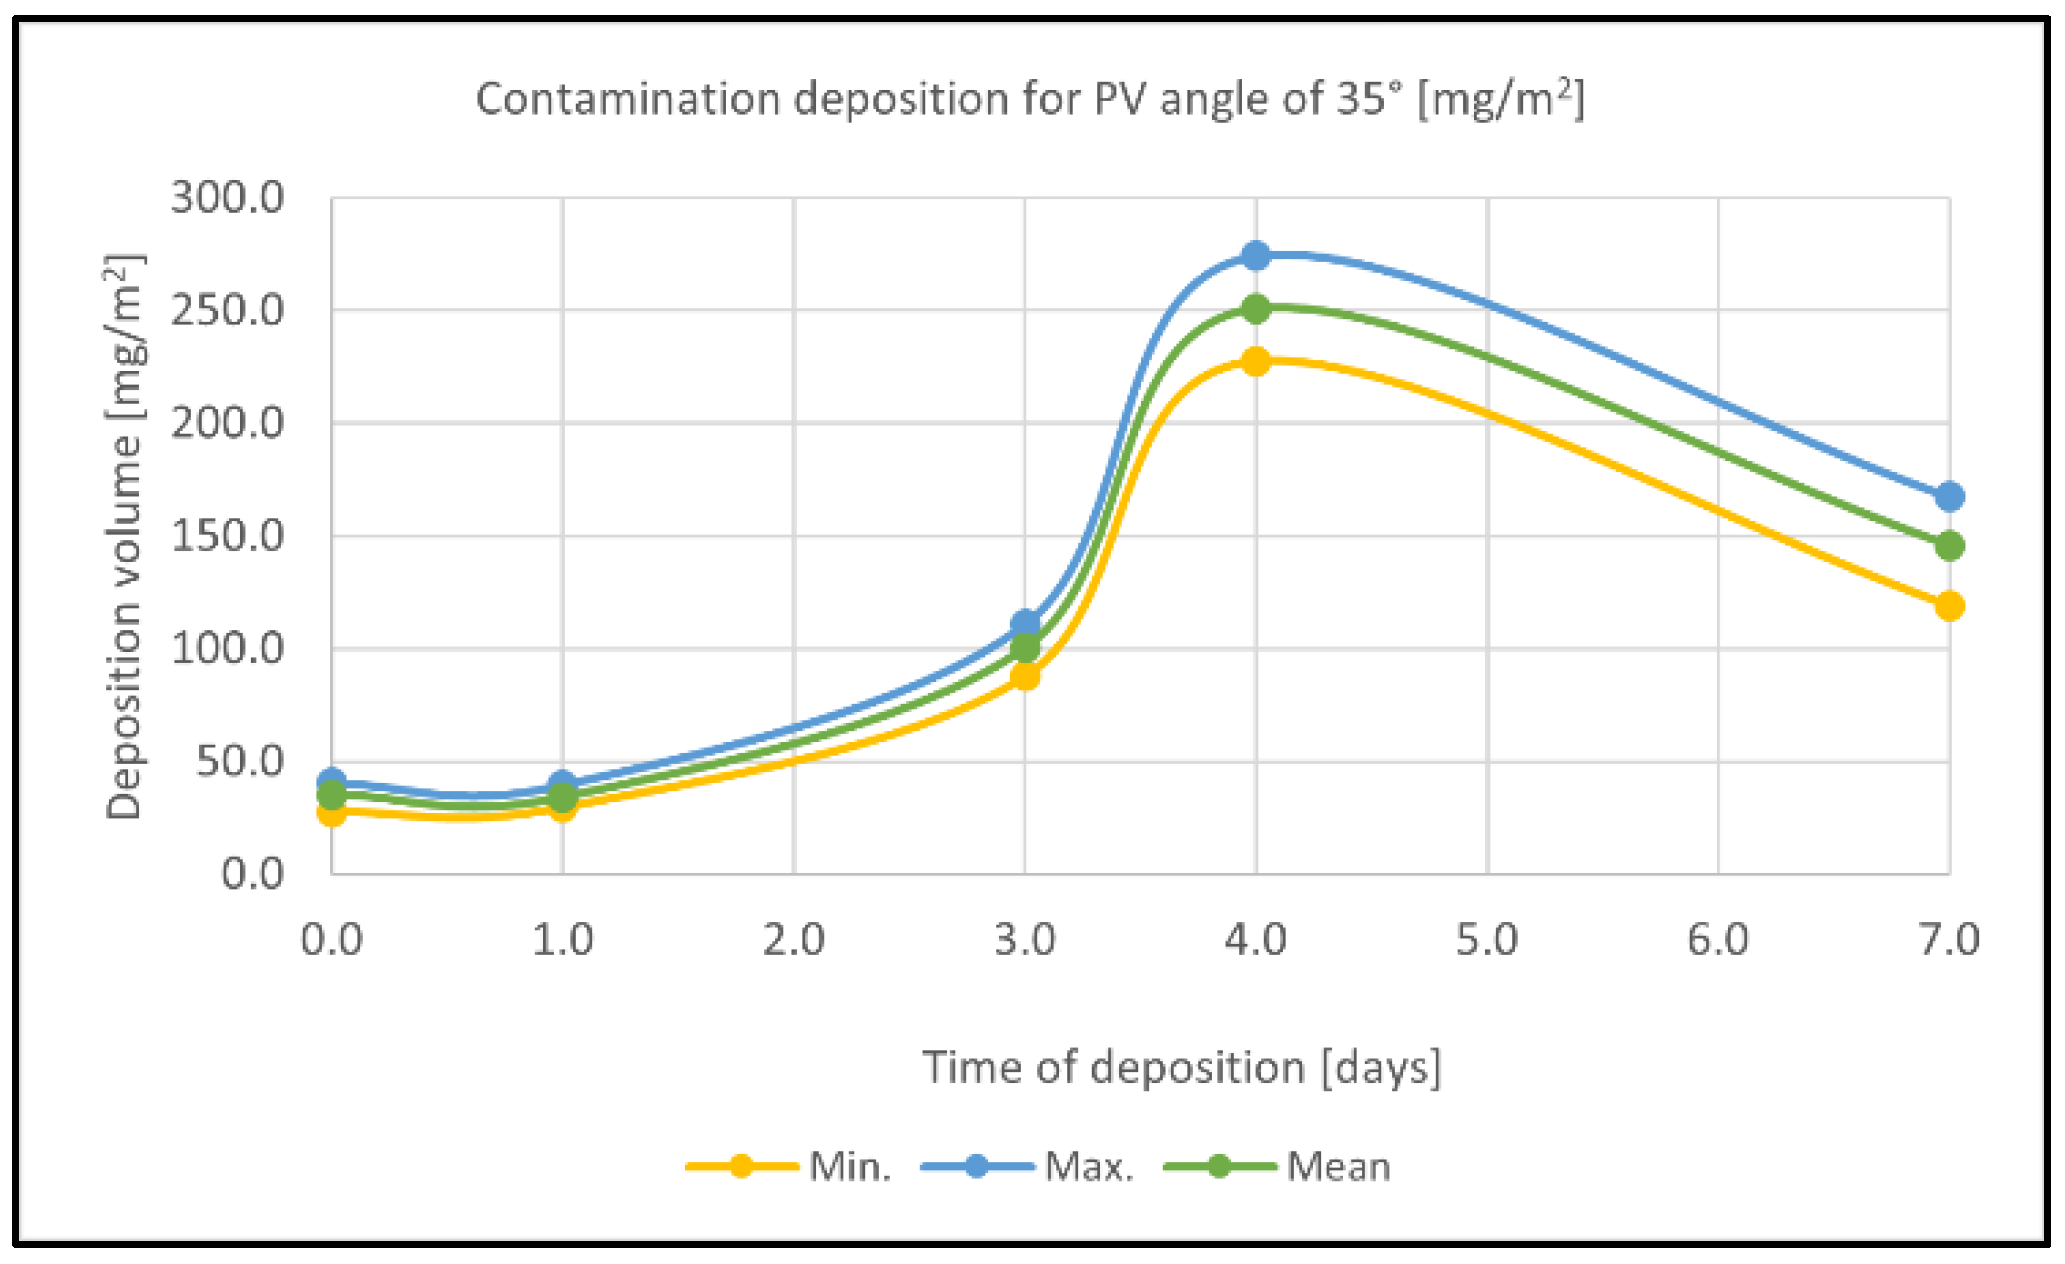
Figure 8). It can be observed from them that the amount of impurities deposited on the panels increases relatively slowly for all cases in the first period, and then, the amount of impurities increases faster to reach the maximum after 3–4 days. After reaching the maximum, the amount of contamination deposited on the panels gradually decreases to a certain value.
For an angle of 15°, the value of maximum contamination is about 220 mg/m
2 on the fourth day after rainfall before falling to a mean value of 187.6 mg/m
2 (
Figure 6).
For the angle of 35°, the maximum contamination value averages 251.0 mg/m
2 on the fourth day after rainfall before dropping to a mean value of 146.0 mg/m
2 (
Figure 7).
For the angle of 45°, the average value of the maximum contamination on the fourth day after rainfall is 168.5 mg/m
2 and then decreases to an average value of 77.2 mg/m
2 (
Figure 8).
The above data allow us to observe that the average deposition of pollutants on the surface of panels inclined at an angle of 15° and 35° is quite similar and is in the range of 222.9 mg/m2. Panels inclined at 45° do not reach such high values—the average deposition is 168.5 mg/m2. This allows the assumption of a gravitational self-cleaning factor. Also, the increase in self-cleaning of PV panels with an increasing angle of inclination allows the conclusion of a rather strong gravitational factor influencing dry self-cleaning of the panels. It is likely that the aggregation of contaminant particles into larger clusters results in their detachment by the predominance of forces due to gravity over those that keep the contaminant on the panel surface.
Unfortunately, the research did not foresee such an analysis, and the data collected do not allow a definitive solution to the problem regarding quality and quantity. It is advisable to continue conducting more detailed research in this area, which the authors encourage other researchers to do. Only a sufficiently large pool of diverse measurements will allow the verification of the phenomenon and its in-depth analysis.
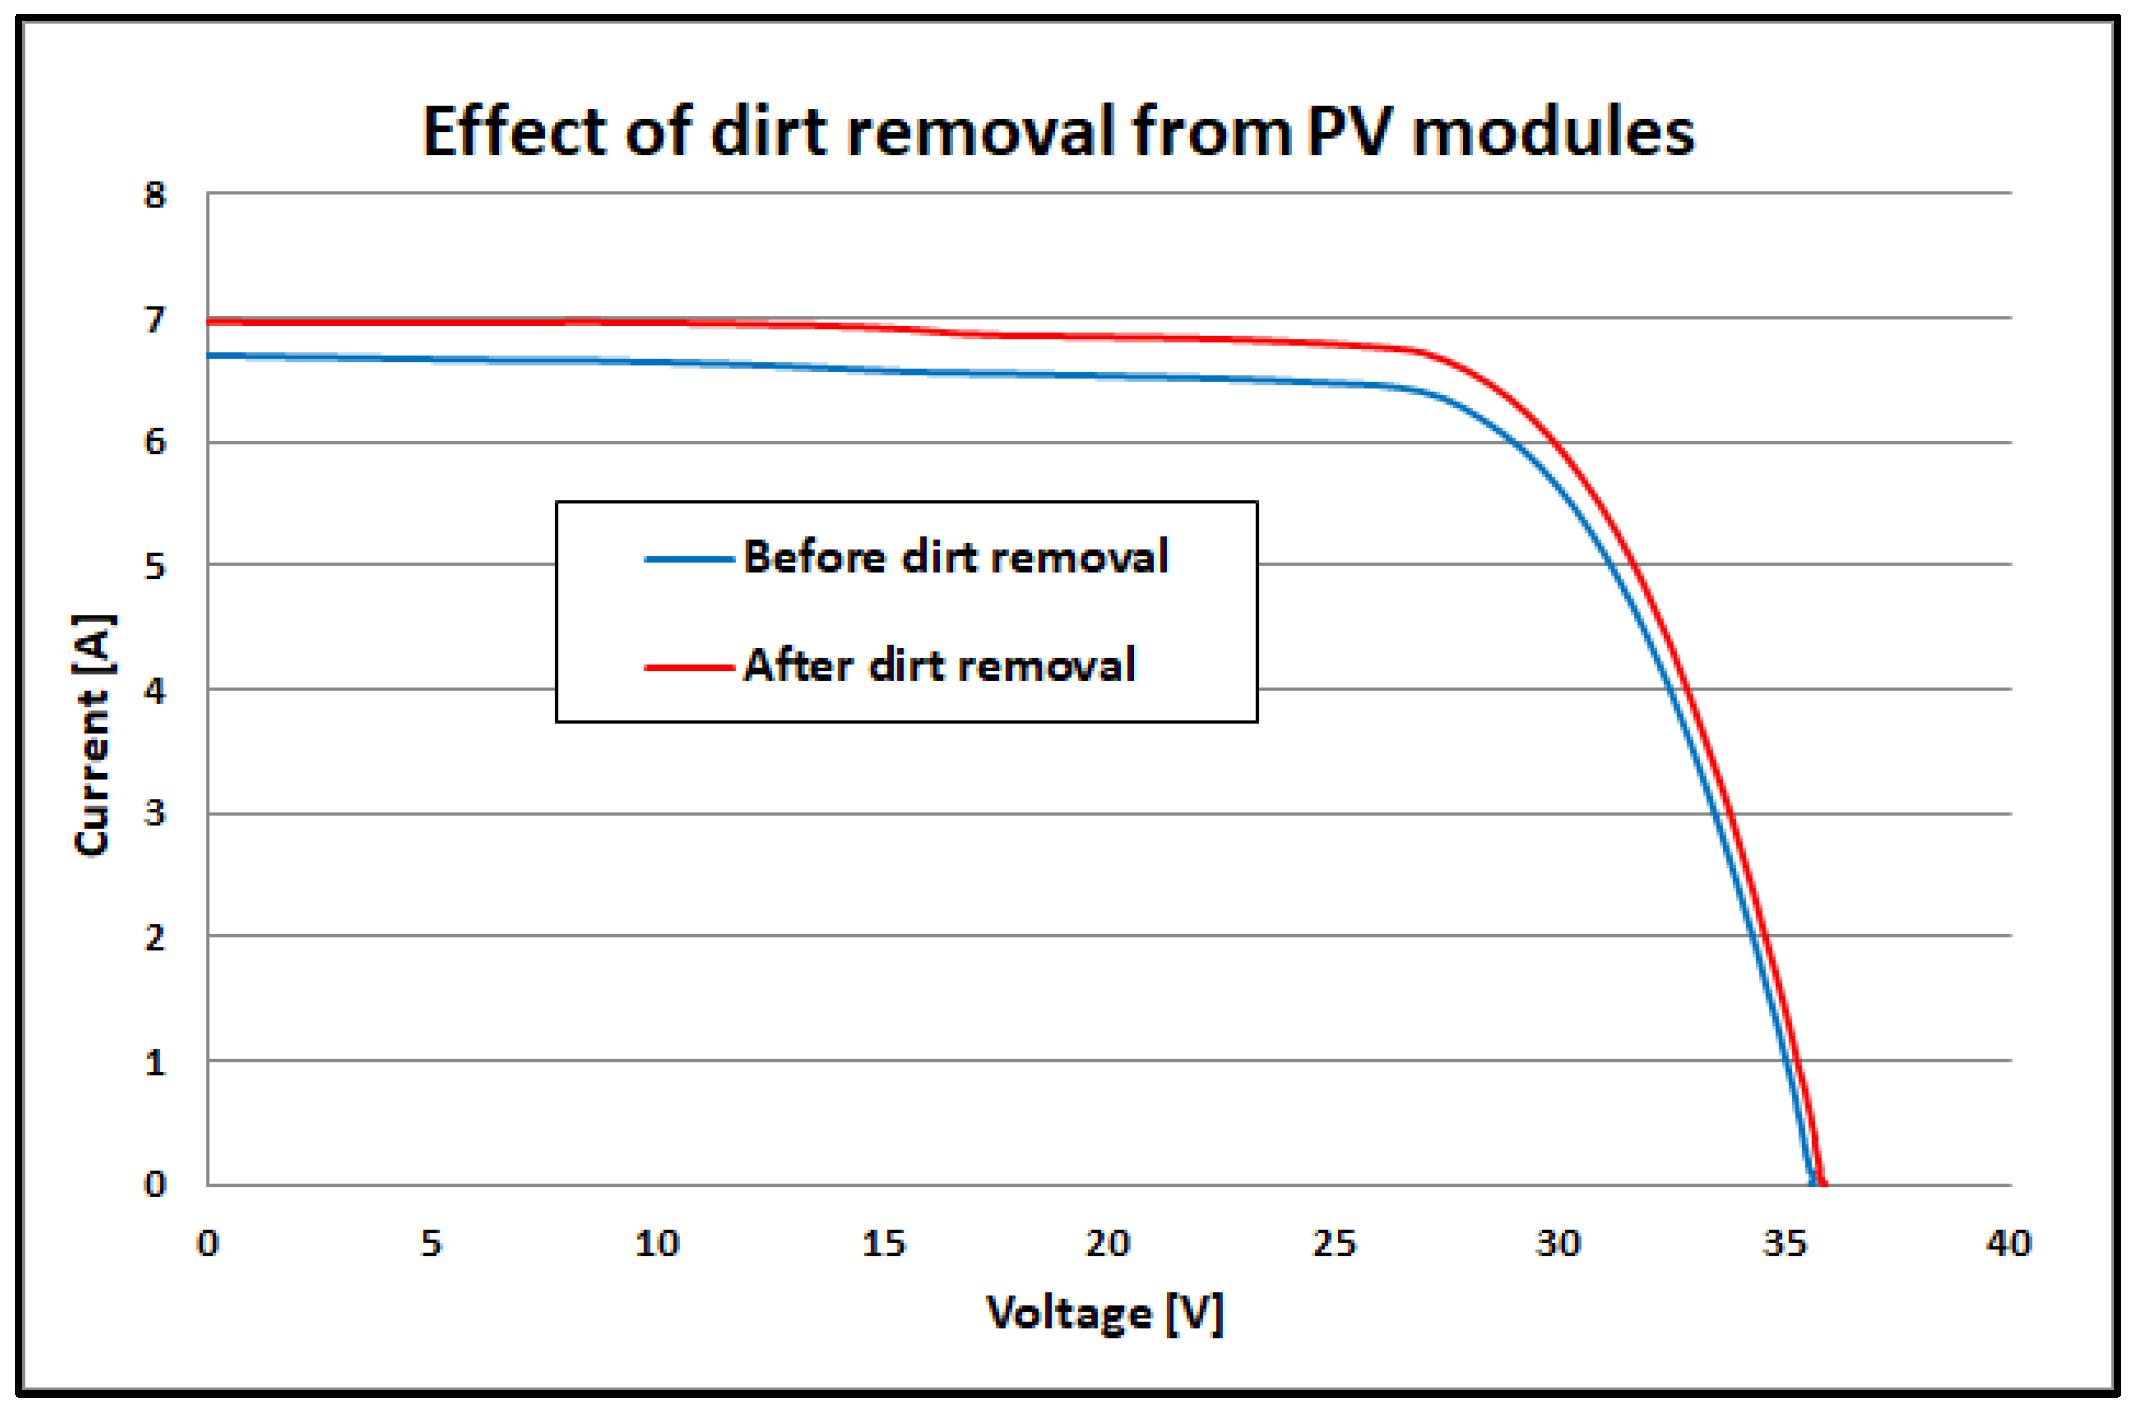
The results of a test to check the effect of a layer of dirt on the surface of a PV module on its electrical performance require separate discussions. As can be seen from the parameters shown in
Table 5, both measurements took place under identical irradiation conditions. The only difference was the temperature of the module. As a result of washing, it dropped by about 3 °C. After washing, the current and voltage values generated by the module increase. The increase in voltage is due to the decrease in module temperature and is transient [
23]. The current, on the other hand, should decrease when the temperature drops (silicon modules have a positive temperature coefficient of current). The fact that the current has increased means that more sunlight is now reaching the photocells, i.e., washing the active surface of the module has had a positive effect. After washing, the power generated by the module increased by 5.1%, but after taking into account the temperature difference, the real increase in generated power was 3.8%. Similar values were recorded the day after washing the modules involved in the experiment by analyzing the readings from their power optimizers. Unfortunately, this phenomenon faded with time, analogous to the aggregation of contamination on the modules. Already 3–4 days after cleaning, there were no noticeable differences in the amount of energy produced by washed and unwashed modules.


