Article

Modified Genetic Algorithm for the Profit-Based Unit Commitment Problem in Competitive Electricity Market

by
Lucas Santiago Nepomuceno
*,
Layon Mescolin de Oliveira
,
Ivo Chaves da Silva Junior
,
Edimar José de Oliveira
and
Arthur Neves de Paula
Department of Electrical Energy, Federal University of Juiz de Fora, Juiz de Fora 36036-900, Brazil
*
Author to whom correspondence should be addressed.
Energies 2023, 16(23), 7751; https://doi.org/10.3390/en16237751
Submission received: 10 October 2023 / Revised: 13 November 2023 / Accepted: 18 November 2023 / Published: 24 November 2023
(This article belongs to the Section C: Energy Economics and Policy)

Abstract

:
This article proposes a solution to the Profit-Based Unit Commitment (PBUC) problem to maximize the profit of a power generation company that owns thermal units and compressed air energy storage (CAES) systems, considering the Day-Ahead market. The proposed methodology is more realistic as it considers a mixed-integer nonlinear formulation of the PBUC. The problem is solved through two stages, with Stage 1 dedicated to obtaining the operational state of the generating units (On or Off) and the operation mode of the storage system (energy exchange: charging, discharging, idle). Stage 2 determines the dispatch of power from the thermoelectric units and the energy exchange in the storage system. The analysis of the system consisting of 20 thermoelectric units and three storage systems shows the efficiency of the proposed method in making decisions for the power generation company and is therefore promising for real-world applications.

1. Introduction

In recent years, the electric power industry has undergone significant changes worldwide. This is largely due to the restructuring and deregulation of the sector, aimed at creating a competitive environment for the trading of electric power and related services. These transformations have resulted in significant alterations in the operation and planning of electric power systems, due to the need to consider new paradigms arising from competition [1].
In electricity spot markets, such as the Day-Ahead, Ancillary Services, and Intraday, decisions on submitted bids and offers in terms of price and quantity are made by electricity generation companies (GENCOs) to maximize their expected profit [2,3]. The formulation of an effective bidding strategy for GENCOs is deemed fundamental to the success of companies operating in this competitive environment. However, uncertainties primarily arising from market prices and demand in electricity spot markets are grappled with by these companies. The complexities are further compounded by the proliferation of renewable energy sources in the market and the influence of climate change, potentially amplifying volatility in energy prices [4].
Profit-based Unit Commitment (PBUC) is one of the fundamental tools employed by GENCOs to address these challenges. In a competitive energy market, PBUC plays a crucial role by identifying the optimal operational state (On or Off) and generation levels for each unit in the GENCO fleet over a defined time horizon. Its primary objective is to maximize GENCO’s profitability in electricity spot markets. The PBUC problem holds utmost importance, enabling GENCOs to adapt to the complexities of restructured electricity spot markets and capitalize on profit opportunities in a dynamic and competitive environment [5,6]. PBUC is commonly formulated as a mixed-integer nonlinear optimization problem that considers the operational constraints of the power plants and market conditions [6]. The quality of the PBUC solution is of utmost importance for GENCO’s participation strategy in the market competition. To solve PBUC, it is crucial for these companies to have efficient and fast computational methods, mainly due to fluctuations in the quantity of requested energy and its price in the wholesale spot markets [6].
The methods employed to address the Profit-based Unit Commitment (PBUC) problem can be broadly classified into three categories: Numerical Methods, Metaheuristics, and Hybrid Methods [6]. Numerical methods encompass mathematical optimization techniques such as mixed-integer linear programming (MILP) [7], Lagrangian Relaxation (LR) [8], Muller method [9], Dynamic Programming (DP) [10], Stochastic Optimization through Monte Carlo Simulation [11], etc. These methods, despite their theoretical soundness, are not recommended for PBUC due to their computational inefficiency, susceptibility to local optima, and challenges posed by non-convexity, multimodality, and system dimensionality [6].
On the other hand, metaheuristic techniques prove to be suitable for solving the PBUC problem. These methods offer advantages such as reduced computational time, flexibility for algorithmic adaptations, and the ability to avoid stagnation in local minima. Despite not guaranteeing a global solution, metaheuristics enable the consideration of more complex formulations without excessive simplification [6]. The Genetic Algorithm (GA) has been an early and influential metaheuristic applied to PBUC. For instance, Richter et al. [12] adapted a Genetic-Based Unit Commitment Algorithm to maximize the profit of a generating company (GENCO) in the energy market. Subsequent studies [13,14] utilized GA to solve PBUC. Other metaheuristic approaches based on swarm intelligence have been adapted to handle binary commitment variables, such as Particle Swarm Optimization (PSO) [15,16], Shuffled Frog Leaping Algorithm (SFLA) [17], Imperialistic Competitive Algorithm (ICA) [18], Fish Swarm Algorithm (FSA) [19], Grey Wolf Optimizer (GWO) [20], Whale Optimization Algorithm (WOA) [21], Monarch Butterfly Optimization (MBO) [22], etc. These methods have been extensively researched as solution approaches for the PBUC due to their unique characteristics of exploration and exploitation.
Furthermore, researchers have exhibited significant interest in hybrid algorithms that integrate Numerical Methods, Metaheuristics, or a combination of both to enhance both solution quality and computational efficiency. Recent investigations have delved into the hybridization of Lagrangian Relaxation with metaheuristic techniques, as exemplified by the integration of Genetic Algorithm (GA) [23], Evolutionary Programming (EP) [24], Ant Colony Search Algorithm (ACO) [25], Firefly Algorithm (FA) [26], Artificial Bee Colony (ABC) [27], and Weed Optimization Algorithm (WO) [28]. Furthermore, other hybrid approaches have emerged, such as the combination of Particle Swarm Optimization (PSO) and Dynamic Programming [29], Improved Pre-prepared Power Demand (IPPD) Table with Muller’s method [30], and Modified Pre-Prepared Power Demand (MPPD) Table with ABC algorithm [31]. The recurring theme of hybridization, combining various metaheuristics, in addressing the PBUC is further underscored in specialized literature. Examples include the Hybrid Binary Successive Approach (BSA) and Civilized Swarm Optimization (CSO) [32], the integration of the Artificial Immune System (AIS) and GA [33], and the integration of Tabu Search and ABC [34]. Despite the potential of these hybrid methods, they still grapple with the challenge of vulnerability to parameter selection, constituting a significant limitation in their practical application.
Alternative energy sources are being increasingly pursued globally in response to the detrimental environmental impact and diminishing availability of fossil fuels [35]. The need for diversified and sustainable energy generation methods is underscored by the urgency accentuated by the instability in fossil fuel prices. Large-scale energy storage is considered a great solution for peak shaving and load shifting in contemporary power systems. Additionally, a compelling business opportunity is presented for owners of energy storage facilities due to fluctuating electricity prices [35,36].
Compressed Air Energy Storage (CAES) is recognized as one of the largest energy storage technologies, capable of storing substantial energy volumes and designed to meet peak load requirements [36]. CAES technology is a modification of the basic gas turbine (GT) technology, where electrical energy is consumed to store compressed air in an underground cavern. This compressed air is then heated and expanded in a gas turbine to produce electricity when needed, such as during peak demand periods or to provide ancillary services [37,38].
In deregulated power markets, where the hourly market clearing price hinges on the balance between supply and demand, the compression of air into storage during periods of low demand becomes pivotal. Its subsequent utilization for electricity generation during high-demand periods improves the reliability of electricity supply and bolsters the productivity of existing power plants and transmission facilities. Additionally, stored power contributes to the reduction of upkeep costs associated with these facilities [39]. The profitability of Compressed Air Energy Storage (CAES) systems for Generation Companies (GENCOs) has been recognized [40]. This feasibility arises from the capacity of these companies to acquire energy from the market during periods of low demand when prices are favorable and store it in their compressed air storage systems. Subsequently, they can strategically sell this stored energy during periods of high demand or as needed to fulfill contracts established after the market closes. This strategic approach not only increases the flexibility of the company’s generation portfolio but also enhances its efficiency and profitability [41,42].
In [43], a robust optimization model is presented to determine the operation of thermal power units and compressed air energy storage systems owned by a GENCO, considering uncertainties in energy price values in the Day-Ahead market. In [44], a mixed-integer nonlinear optimization problem is formulated for two situations. The first aims to maximize the profit obtained by a generation company through its participation in the market, while the second aims to minimize the total cost of load serving. The formulation considers a wind generation farm and a compressed air energy storage system. The problem was solved using commercial solvers. In the article [45], a strategy based on the Information-Gap Decision Theory (IGDT) is presented to determine bids and hourly offers for a CAES holder in order to mitigate the risk associated with price uncertainty in a short-term market. In the article [46], a stochastic optimization approach is presented to enhance the bidding process of a generation company with compressed air energy storage, wind generation units, and thermal generation units in the Day-Ahead market, balancing market, and spinning reserve market. Additionally, the authors incorporate Conditional Value-at-Risk in the formulation for risk management in CAES scheduling, and the problem is formulated as a Mixed-Integer Linear Programming (MILP) problem. In [40], a methodology is presented to solve the PBUC problem for a generation company participating in the Day-Ahead market, owning thermal units, concentrated solar power (CSP) units, and CAES. The adopted formulation is a Mixed-Integer Linear Programming (MILP) problem, solved using commercial solvers.
Under this backgraund, the present work contributes to a new solution strategy for the Profit-Based Unit Commitment (PBUC) problem considering a generation company that owns thermal generation units and compressed air energy storage (CAES) systems. The proposed strategy stands out for its resolution speed and flexibility in handling different CAES systems without compromising computational effort.
The solution strategy consists of a hybrid optimization model that combines Genetic Algorithms with heuristic techniques. The Genetic Algorithm is responsible for determining the operational states of the thermal generation units and the operational states of the storage systems. Meanwhile, the power consumption and generation by the CAES systems, as well as the dispatch of thermal generation units, are defined using heuristic processes.

2. Proposed PBUC Formulation

Equations (1)–(25) formulate the proposed Profit-Based Unit Commitment (PBUC) problem. The objective function of the problem, formulated in (1), aims to maximize the total profit ( T P ) of the company. This profit is calculated as the difference between total revenue ( T R ) and total cost ( T C ), both calculated in (2) and (3), respectively. T R is obtained through the sale of electric energy generated by thermal generation units ( R T G ) and the compressed air energy storage system ( R C A ). T C consists of expenses related to the operation of thermal units ( C T G ) and the acquisition of energy for storage in the compressed air energy storage systems ( C C A ).
T P = max T R T C
T R = R T G + R C A
T C = C T G + C C A

2.1. Thermal Unit Model

The cost associated with the operation of thermal generation units ( C T G ) is composed of the quadratic fuel cost, the start-up cost, represented in (4), and the revenue associated with the sale of electric energy generated by these units ( R T G ), represented in (5). The start-up cost for the thermal generation unit t at hour h ( S U C h , t ) is calculated in (6). This start-up cost can be further divided into hot start cost ( H S C t ) and cold start cost ( C S C t ). Constraints (7) and (8) model, respectively, the minimum uptime and minimum downtime of thermal generation units. Constraints (9) and (10) model, respectively, the number of hours t that the thermal generation unit has remained continuously on ( T h , t o n ) and off ( T h , t o f f ) until hour h. Constraint (11) defines the generation limits of thermal generation units. Constraints (12) and (13) model, respectively, the ramp-up and ramp-down rates of thermal generation units. Constraint (14) models the operational states in the hour before the start of the analysis. The value of U I S is essential for calculating T h , t o n and T h , t o f f , influencing the constraints of minimum uptime and downtime as well as the start-up cost calculation.
C T G = h N H { t N T G [ a t + b t · P h , t T G + c t · P h , t T G 2 + ( 1 X h 1 , t ) · S U C h , t ] · X h , t
R T G = h N H t N T G P h , t T G · E P h
S U C h , t = H S C t ; M D T t T h , t o f f M D T t + T C O t C S C t ; T h , t o f f > M D T t + T C O t
T h , t o n M U T t · X h , t 1 X h , c 0
T h , t o f f M D T t · X h , t X h , t 1 0
T h , t o n = T h , t 1 o n + 1 · X h , t
T h , t o f f = T h 1 , t o f f + 1 · 1 X h , t
P t m i n · X h , t P h , t P t m a x · X h , t
P h , t P h 1 , t R U t
P h 1 , t P h , t R D t
X h = 0 , t = 0 ; U I S t < 0 1 ; U I S t > 0
where: h and t represent the indices associated with time intervals and thermal generation units, respectively. The corresponding sets for these quantities are represented by N H and N T G ; P h , t T G represents the active power generated by thermal generation unit t during time interval h; P h , c C A , r e l is the power generated by CAES system c in hour h; E P h represents the electricity price in the Day-Ahead market in hour h; a t , b t , and c t are the constant, linear, and quadratic coefficients of the fuel cost function of thermal generation unit t; X h , t is the binary variable indicating the operational state of thermal generation unit t at the time h, where X h , t = 1 indicates an active thermal unit, while X h , t = 0 indicates otherwise; M D T t and T C O t define the minimum number of hours that thermal generation unit t must remain inactive after being shut down and the number of hours required for cold start, respectively; T h , t o f f represents the number of hours that thermal generation unit t has remained continuously inactive until hour h; M U T t refers to the minimum number of hours that thermal generation unit t must remain in the active operational state after being turned on; P t m a x and P t m i n represent, respectively, the maximum and minimum generation capacity of thermal generation unit t; R U t and R D t are the ramp-up and ramp-down rates, respectively, for thermal generation unit t; U I S t indicates the number of hours in which thermal units remained continuously active or inactive before the analysis.

2.2. Compressed Air Energy Storage Model

The cost associated with the operation of compressed air energy storage systems is related to the acquisition of energy for storage in these systems. The cost associated with the operation of compressed air energy storage systems is represented in (15). The revenue associated with the sale of electric energy generated by the compressed air energy storage system ( R C A ) is represented in (16). The constraints presented in (17)–(24) model the operation of compressed air energy storage (CAES) systems. These systems have three distinct operating modes: Injection, Release, and Idle. In the Injection mode, network power is consumed to compress air, feeding the CAES. In the Release mode, stored compressed air is released and expanded to generate electricity. In idle mode, the storage system does not consume or generate electric energy. Constraints (17) and (18) represent, respectively, the injection and release of CAES at hour t. Constraints (19) and (20) limit the capacity to inject and absorb power from CAES. Constraint (21) ensures that the CAES system will operate in only one specific mode in a time interval h. The storage level for each period is updated according to (22), where the amount of stored air is calculated based on the current storage and the amount of air injected or released in the current hour. The constraint related to the storage capacity of the reservoir is modeled in (23). Equation (24) includes the initial level of air stored in the reservoir.
C C A = h N H c N C A P h , c C A , i n j · E P h
R C A = h N H c N C A P h , c C A , r e l · E P h
V h , c i n j = P h , c i n j · ρ c i n j
P h , c r e l = V h , c r e l · ρ c r e l
V c i n j , m i n · K h , c i n j V h , c i n j V c i n j , m a x · K h , c i n j
V c r e l , m i n · K h , c r e l V h , c r e l V c r e l , m a x · K h , c r e l
K h , c r e l + K h , c i n j 1
A h + 1 , c = A h , c + V h , c i n j V h , c r e l
A c m i n A h , c A c m a x
A h = 0 , c = A c i n i t i a l
where: c represent the indices associated with compressed air energy storage (CAES) systems. The corresponding sets for these quantities are represented by N C A ; V h , c i n j and V h , c r e l represent, respectively, the amount of injected and released air energy in CAES system c at hour h; P h , c C A , i n j and P h , c C A , r e l indicate, respectively, the amount of active power consumed and generated by CAES c at hour h; ρ c r e l and ρ c i n j represent the efficiency of energy absorption and injection related to CAES c; binary variables K h , c r e l and K h , c i n j define the operating mode of CAES system c. If K h , c i n j = 1 , CAES c will be operating in the Injection mode at hour h, and if K h , c r e l = 1 , CAES c will be operating in the Release mode at hour h. If K h , c i n j = 0 and K h , c r e l = 0 , the system will be in Idle mode at hour h. The minimum and maximum levels of air injected into the storage for CAES c (MWh) are represented, respectively, by V c i n j , m i n and V c i n j , m a x , while the minimum and maximum levels of released air from storage for CAES c (MWh) are represented, respectively, by V c r e l , m i n and V c r e l , m a x . The initial level of compressed air storage related to CAES c (MWh) is represented by A h = 0 , c . The minimum and maximum levels of storage reservoir related to CAES c (MWh) are represented, respectively, by A c m i n and A c m a x . The volume of compressed air stored in the storage system for CAES c at the time h is represented by A h , c .

2.3. Market Model

Constraint (25) establishes the relationship between generation and the forecasted demand in the Day-Ahead market (DAM).
t N T G P h , t T G · X h , t + c N C A P h , c C A , r e l · K h , c r e l P h , c C A , i n j · K h , c i n j P D h
where: P D h represents the forecasted demand requested in the Day-Ahead market at hour h.

3. Modified GA for Solving PBUC

In this work, a solution method for the Profit-Based Unit Commitment problem with a mixed-integer nonlinear formulation is presented. This problem is applied to companies that have thermal generation units and compressed air energy storage systems, as explained in the previous section. The proposed optimization approach uses a Genetic Algorithm in conjunction with heuristic strategies.
The proposed method distinguishes itself, especially in terms of execution speed, when juxtaposed with strategies relying on classical optimization. This advantage is particularly noteworthy in handling the inherent non-linearity, non-convexity, and combinatorial complexity of the formulated problem. The flowchart of the proposed process is illustrated in Figure 1. Subsequently, each step of the method will be meticulously explained.

3.1. Population Initialization

In this work, the initial population of the Genetic Algorithm is randomly generated and consists of N S chromosomes. The representation of a chromosome, which can also be referred to as an individual or solution, is expressed as a vector with dimensions of N H × ( N T G + 2 × N C ) . This vector is composed of binary values, 0 or 1, indicating the active or inactive state (committed/de-committed) of thermal generation units, as well as the Inject, Release and Idle operation states of CAES systems.
The representation of chromosomes is essential for our method, and it is one of the contributions of this work. The chromosome is defined as S ¯ and comprises three distinct parts, as shown in Equation (26):
S ¯ = X S ¯ K S , i n j ¯ K S , r e l ¯
where X S ¯ represents the vector of operation states of thermal generation units, while the vectors K S , i n j ¯ and K S , r e l ¯ denote the operation states of storage systems in the Inject and Release modes, respectively. These vectors are detailed in Equations (27)–(29):
X S ¯ = X 1 , 1 S X 2 , 1 S X N H , 1 S X 1 , 2 S X 2 , 2 S X N H , 2 S X 1 , N G T S X 2 , N G T S X N H , N G T S
K S , i n j ¯ = K 1 , 1 S , i n j K 2 , 1 S , i n j K N H , 1 S , i n j K 1 , 2 S , i n j K 2 , 2 S , i n j K N H , 2 S , i n j K 1 , N C S , i n j K 2 , N C S , i n j K N H , N C S , i n j
K S , r e l ¯ = K 1 , 1 S , r e l K 2 , 1 S , r e l K N H , 1 S , r e l K 1 , 2 S , r e l K 2 , 2 S , r e l K N H , 2 S , r e l K 1 , N C S , r e l K 2 , N C S , r e l K N H , N C S , r e l
where X 1 , 1 S represents the operation state of thermal generation unit 1 at hour 1; K S , i n j 1 , 1 denotes the INJECT operation mode of CAES 1 at hour 1; and K S , r e l 1 , 1 indicates the RELEASE operation mode of CAES 1 at hour 1. The superscript S is used to indicate that these operation states are related to chromosome S.
It is worth mentioning that the Idle operation mode of the compressed air energy storage systems is implicitly represented in the K i n j ¯ and K r e l ¯ vectors. The operation mode of CAES c at hour h is considered Idle when the values of K h , c i n j and K h , c r e l are both equal to zero. Therefore, this chromosome representation can identify advantageous solutions for the GENCO, allowing for idle periods in the market. This broadens the range of available operational strategies.
Finally, the initial population, consisting of N S chromosomes, is randomly generated according to Equation (30):
S ¯ = 1 , se r a n d ( ) 0.5 0 , otherwise

3.1.1. Heuristic Constraints Handling Technique

The process of randomly generating the initial population and the operators used in the Genetic Algorithm have the potential to create chromosomes that do not comply with the specific problem constraints. Within the scope of this study, such constraints include the minimum activity and inactivity times of thermal generation units (as in (8) and (7)), power balance in the market (25), as well as limitations inherent to the exclusive operation of the storage system and the reservoir storage capacity (21) and (23).
To avoid the use of techniques that penalize infeasible solutions, which can hamper the effectiveness of the Genetic Algorithm in finding the best solutions, especially in large-scale test systems [47], this study employs four heuristic techniques to correct chromosomes. The first of these techniques is widely used in various studies and involves correcting violations of minimum activity and inactivity times. The remaining three techniques proposed in this article aim to address violations of constraints related to the storage system, including exclusive operations, reservoir storage capacity, and power balance in the market.

3.1.2. Minimum up/down Time Constraint Handling

The pseudocode for the heuristic to correct violations of minimum activity and inactivity time constraints is presented in Algorithm 1. This repair strategy is commonly used in the literature, as seen in the works [19,20,21].
Algorithm 1 Minimum up/down time constraint handling (Thermo units)
Require:  N H , N T G , M U T t , M D T t , T h , t o n , T h , t o f f
       h 1 , 2 , , N H
       t 1 , 2 , , N T G
Ensure:  X h , t
       h 1 , 2 , , N H
       t 1 , 2 , , N T G
 1:
for  h = 1 to N H  do
 2:
      for  t = 1 to N T G  do
 3:
            if  X h 1 , t = 1 e X h , t = 0  then
 4:
                  if  T h 1 , t o n M U T g  then
 5:
                         X h , t 1
 6:
                  else
 7:
                         X h , t 0
 8:
                  end if
 9:
            else if  X h 1 , t = 0 e X h , t = 1  then
10:
                 if  T h 1 , t o f f M D T g  then
11:
                         X h , t 1
12:
                 else
13:
                         X h , t 0
14:
                 end if
15:
           end if
16:
      end for
17:
end for

3.1.3. Exclusive Operation Constraint Handling

The violation of the exclusive operation Constraint (21) occurs when both K h , c i n j and K h , c r e l are equal to 1. In these cases, new values for K h , c i n j and K h , c r e l will be randomly selected until the constraint is satisfied.

3.1.4. Storage Capacity Constraint Handling

Violation of the storage capacity occurs when the chromosome indicates an operation state that is not feasible based on the storage system parameters. To illustrate this violation, let’s consider a 6-hour period, discretized into hourly intervals, along with a storage system characterized by the following parameters: A m a x = 100; A m i n = 10; V m i n = 2.5; and A i n i t i a l = 15. Now, suppose a chromosome defines the following vectors K i n j ¯ and K r e l ¯ , as in (31) and (32):
K i n j ¯ = 0 0 0 0 1 1
K r e l ¯ = 1 0 1 1 0 0
We can observe that this solution is not feasible as it exceeds the minimum storage limit in the fourth hour, regardless of the amount of energy injected into storage later, as shown in Table 1.
To check if a chromosome violates the constraints, considering the storage capacity A c m i n , we examine the minimum active power consumption by the storage system and the maximum active power generation according to K i n j ¯ and K r e l ¯ , respectively (as per Equations (33) and (34)). Next, we calculate the storage volume based on Equation (22). If, at any time h, the storage value A h , c is less than A c m i n , we conclude that the chromosome represents an infeasible operation and therefore requires correction.
Similarly, to check for violations of the upper limit of the storage capacity A c m a x by a chromosome, we consider the maximum active power consumption by the storage system and the minimum active power generation according to K i n j ¯ and K r e l ¯ , respectively, as per Equations (35) and (36). Then, we calculate the amount of energy stored for each hour of operation, following Equation (22). If, at any time h, the storage value A h , c is greater than A c m a x , this indicates that the chromosome represents an infeasible operation and therefore requires correction.
In case of violations of the storage capacity Constraints (23), it is necessary to select new operation modes for the storage systems with violations until these storage capacity constraints and the exclusive operation Constraint (21) are no longer violated.
P h , c i n j = V c i n j , m i n ρ c i n j · K h , c i n j
P h , c r e l = V c r e l , m a x · ρ c r e l · K h , c r e l
P h , c i n j = V c i n j , m a x ρ c i n j · K h , c i n j
P h , c r e l = V c r e l , m i n · ρ c r e l · K h , c r e l

3.1.5. Market Constraint Handling

This violation occurs when chromosome S indicates a vector K r e l ¯ that violates the market Constraint (25) in any of the analysis hours. To check if this violation occurs, let’s assume that at hour h, the storage systems are in Release operation mode, meaning K h r e l = 1 , generating the minimum possible active power, P c m i n , r e l . If the sum of the generations from the storage systems exceeds the demanded power in the system P D h , it means that a violation of this constraint has occurred. To correct it, it is necessary to change the operation mode from Release to Idle for the storage system with the lowest compressed air volume, A h , until the sum of the generation from the systems at hour h is less than the demanded power in the system P D h .

3.2. Dynimic Economic Dispatch Method

This article presents a significant contribution in the form of a heuristic technique to solve the subproblem of dynamic economic dispatch of thermal units and compressed air energy storage systems, with the aim of maximizing profit in the Day-Ahead market by a generation company. The strategy is based on heuristic rules, resulting in a considerably short computational execution time, especially in large-scale systems.
The heuristic is divided into two steps:
  • Step 1: In this phase, we determine the amount of power to be consumed from the electrical grid for air injection into the reservoir, as well as the amount of power to be generated by the reservoir for sale.
  • Step 2: In the second part of the algorithm, we conduct the dispatch of thermal units, taking into account the generation and consumption of storage systems. This heuristic addresses all the operational constraints previously presented for both storage systems and thermal units.

3.2.1. Stage 1: CAES Dispatch

The strategy developed to determine the amount of power consumed and generated by compressed air energy storage systems in a specific hour is based on the premise that “selling is more profitable than buying”. Therefore, the proposed method aims to maximize the sale of energy so that the revenue from sales exceeds the cost of purchasing energy for storage. In simple terms, this part of the heuristic seeks to optimize the maximum profit in the operation of compressed air energy storage units, regardless of the dispatch of thermal units.
Considering that there is a price forecast for energy in the Day-Ahead market for each analyzed hour, profit maximization is achieved by generating the highest amount of energy for sale during high-price hours and buying energy for storage during low-price hours.
To determine which units of the compressed air energy storage system will undergo the process of defining the active power consumed and generated in each hour, a priority list is used. The storage unit with the highest initial amount of compressed air, represented as A h = 0 , c , is the first to undergo the heuristic strategy, followed by other units in subsequent order.
The proposed heuristic strategy to determine the amount of active power consumed from the electrical grid for compressed air storage and the amount of active power generated for trading in the Day-Ahead market is divided into three heuristics, as described below:

3.2.2. Heuristic 1: Priority Lists Creation Based on Energy Price Forecasts Sorting

To begin, based on the K i n j ¯ and K r e l ¯ vectors provided by a chromosome, the heuristic creates the lists Φ c i n j and Φ c r e l . The Φ c i n j list is formed by sorting the hours h where K h , c i n j = 1 based on the energy price forecasts E P h . The hours are organized in ascending order, meaning that the first time slot in the list has the lowest energy price and has a priority in buying energy. The Φ c r e l list is created similarly, but the hours where K h , c r e l = 1 are sorted in descending order based on the energy price forecasts E P h . Therefore, the first time slot in the Φ c r e l list has the highest energy price and a priority in selling energy. Additionally, the minimum and maximum hourly amounts of active power that can be consumed and generated by the storage system are stored as per Equations (37)–(40).
P h , c i n j , m i n = V c i n j , m i n ρ c i n j · K h , c i n j
P h , c i n j , m a x = V c i n j , m a x ρ c i n j · K h , c i n j
P h , c r e l , m i n = V c r e l , m i n · ρ c i n j · K h , c r e l
P h , c r e l , m a x = V c r e l , m a x · ρ c i n j · K h , c r e l

3.2.3. Heuristic 2: Buy and Sell as Minimal as Possible

In this heuristic, initially, the minimum amount of air, V c i n j , m i n , is injected, and the minimum amount of air, V c r e l , m i n , is released in the hours where K h , c i n j = 1 and K h , c r e l = 1 , respectively, for system c. Then, the volume of stored air is calculated for each analyzed hour using Equation (22). From there, it is checked if the reservoir storage falls below A c m i n in any hour. If this condition is true, it is necessary to calculate the amount of air volume that must be acquired to avoid violating Constraint (23). This calculation is performed using Equation (41). Then, the amount of active power that must be acquired and consumed to inject this amount of air is calculated as per Equation (42). Finally, the amount of MW Δ P i n j must be acquired in the hours when the energy price is lower, following the Φ c i n j list and respecting P h , c i n j , m i n and P h , c i n j , m a x . It is important to note that if the active power consumption is modified in any hour, the minimum active power limit that can be consumed in that hour must be updated, as shown in Equation (43).
Δ A = A c m i n | max ( A h , c ) |
Δ P i n j = Δ A ρ i n j
P h , c i n j , m i n = P h , c i n j

3.2.4. Heuristic 3: Maximize Profit

In this heuristic, the objective is to sell the maximum amount of energy while ensuring that the revenue from sales exceeds the cost of purchasing energy for injection into storage, according to the operational state provided by the chromosome. Therefore, a loop is executed based on the number of values in the Φ c r e l list. In each iteration of this loop, the hour h with the highest priority for energy sales is selected, and the maximum possible power for that hour is generated, i.e., P h , c r e l = P h , c r e l , m a x . After defining the generation for that hour, it is checked if the amount of air stored in the reservoir violates the minimum limit A c m i n at any hour. If this condition is false, the process advances to the next iteration of the loop. Otherwise, it is necessary to calculate the amount of compressed air that must be acquired to avoid violating Constraint (23), and consequently, determine the amount of active power that the storage system needs to consume, represented by Δ P i n j . Then, three processes can occur:
  • Process 1: Purchase the required amount Δ P i n j only if it can be acquired during the selling hours listed in Φ c i n j , thus maximizing profit, i.e., if the revenue from sales is greater than the cost of purchase.
  • Process 2: Consume the maximum possible amount of power during the selling hours listed in Φ c i n j , reducing the amount of power generated in hour h to eliminate violations of Constraint (23) while maximizing profit.
  • Process 3: Reduce the amount of power generated in hour h to eliminate violations of Constraint (23).
After the completion of one of these processes, a new iteration of the loop begins.

3.2.5. Stage 2: Thermo Units Dispatch

In this section, the determination of power generation from thermal units is carried out for each hour h with the goal of maximizing the profit from selling this generation in the Day-Ahead market. Here, we address the resolution of the Dynamic Economic Dispatch (DED) problem, which aims to minimize the fuel cost of the units in operation and, consequently, maximize the profit obtained by the generation company. The problem is termed “dynamic” due to the consideration of ramp constraints when planning generation variations throughout the analyzed hours.
For each scenario analyzed, the determination of the power dispatch of thermal units begins with updating the forecasted demand in the market for the next day. This takes into account both the amount of energy consumed and the amount of energy generated by the storage systems, as calculated in Equation (44).
P D h n e w = P D h c N C A P h , c r e l P h , c i n j
where P D h n e w represents the amount of active power requested in the market after determining the amount of generation and consumption from the storage systems, as well as the amount of generation from thermal units.
The dispatch of thermal units in hour h occurs according to a priority list Ψ h t h e r m o . This priority list is constructed based on the average production cost at maximum generation capacity for each active thermal unit in hour h, calculated as shown in (45). The list Ψ h t h e r m o is formed by sorting the thermal units in ascending order according to their respective value of f c t , where the first position in the list corresponds to the active thermal unit in hour h with the highest priority for dispatch.
f c t = a t P t m a x + b t + c t · P t m a x
Due to the consideration of ramp-up and ramp-down constraints, for each thermal unit with an active operating state in hour h, it is necessary to calculate the maximum and minimum active power generation limits Υ h , t m a x and Υ h , t m i n as specified in (46) and (47).
Υ h , t m a x = min P h , t m a x , P h 1 , t + U R t , if X h 1 , t = 1 and X h , t = 1 P h , t m a x , if X h 1 , t = 0 and X h , t = 1 0 , if X h , t = 0
Υ h , t m i n = max P h , t m i n , P h 1 , t D R t , if X h 1 , t = 1 and X h , t = 1 P h , t m i n , if X h 1 , t = 0 and X h , t = 1 0 , if X h , t = 0
At each analysis hour, the process begins by activating the thermal units with the minimum power possible for each active unit at the current time. Subsequently, the new demand Δ P is calculated as expressed in Equation (48).
Δ P D h = P D h , n e w + t N T G P h , t T G
Next, the dispatch of the highest-priority thermal unit is determined according to the priority list Ψ h t h e r m o using Equation (49).
P h , t T G = Δ P D h Υ h , t m i n , if Δ P D h Υ h , t m i n > Υ h , t m a x Υ h , t m a x , otherwise
Due to the consideration of ramping constraints, the heuristic process can result in dispatches of thermal units that violate the market Constraint (25), meaning when the sum of the generation from the storage systems and thermal units at hour h exceeds the market demand in the same hour, P D h n e w . To address this issue, a heuristic is employed to adjust the dispatch of thermal units, comprising two actions:
  • If possible, the necessary amount of thermal unit generation is reduced. To achieve this, based on the priority list Υ t h e r m o , the active thermal unit at hour h with the lowest priority in the list will have its generation decreased, respecting Υ h , t m i n , to comply with the market Constraint (25). If it is not possible to satisfy this constraint, the next thermal unit with lower priority in the Υ t h e r m o list will have its power reduced, respecting its respective generation limit Υ h , t m i n .
  • If the market constraint is still violated after the previous step, the possibility of reducing the generation of thermal units that are active in the previous hour and the hour before that is examined (i.e., X h , t = 1 and X h 1 , t = 1 ). By reducing generation in the previous hour, the generation limits Υ h , t m i n and Υ h , t m a x are altered due to ramping constraints. Therefore, the reduction in generation can be applied at hour h following the same process as before.

3.3. Fitness Evaluation

The fitness value of each chromosome is calculated after determining the power consumed and generated by the compressed air energy storage systems ( P h , c i n j and P h , c r e l ) and the active power generation of the thermal units ( P h , t T G ), in accordance with the objective Function (1).

3.4. Selection, Elitist, Crossover and Mutationand Elitist Operators

The methodology employs various genetic operators, including Selection operators, Crossover operator, Mutation operator, and Elitism operator. The Selection operator is responsible for choosing the fittest chromosomes for reproduction, giving priority to those with higher fitness. In this work, the tournament method was chosen as the selection strategy.
The Crossover operator combines the selected chromosomes by randomly selecting a point for the exchange of information, generating a new chromosome. Finally, the Mutation operator introduces variations into the chromosomes by randomly altering one or more bits. In addition to these three operators, this work also incorporates the Elitism operator, which automatically preserves the fittest chromosomes from the current population, inserting them into the next generation without any modification. This approach helps maintain genetic diversity and accelerates convergence towards optimal solutions.

3.5. Stopping Criterion

The iterative process is concluded when the iteration counter i t e r reaches the predefined maximum value i t e r m a x , which represents the maximum number of iterations allowed in the evolutionary process. The chromosome with the highest fitness value becomes the final solution of the optimization process.

4. Discussion—Simulations and Results

This section discusses the case studies conducted to solve the PBUC problem, considering an electricity generation company with conventional thermal units and compressed air energy storage units. Three case studies will be analyzed for the standard test system with 10 thermal units. The case studies are described as follows:
  • Case I: An electricity generation company with thermal units only.
  • Case II: An electricity generation company with thermal units and one compressed air energy storage system.
  • Case III: An electricity generation company with thermal units and three compressed air energy storage systems.
All simulations were conducted using a 2.7 GHz Core i7 processor, and the codes were implemented using MATLAB® 2015.a software.
The operation and cost data for the thermal units in the 10-unit test system are presented in Table 2 [24]. In all case studies, ramp-up and ramp-down constraints are considered, with ramp rates set at 25% of the maximum generation capacity of the thermal unit P m a x .
Table 3 provides the parameters for the compressed air energy storage systems. The parameters for the first system were obtained from references [40], while the parameters for the other systems were defined arbitrarily. It is worth noting that the second system has a higher generation capacity, but its initial storage is close to the minimum storage limit. On the other hand, the third system has a lower generation capacity, but its initial storage is close to the maximum storage limit. This setup allows for the presentation of the flexibility of the methodology proposed in this article.
Table 4 contains data related to the Day-Ahead market, collected from the reference [24].
Finally, Table 5 presents the parameter values for the Genetic Algorithm adopted in this study, which were defined after empirical analyses. For all cases, the stopping criterion is the maximum number of iterations.

4.1. Case I

In this case study, we consider a generation company that exclusively owns thermal units. The most efficient solution found after 25 simulations resulted in a profit of $90,494.98, corresponding to the dispatch listed in Table 6. The hourly quadratic fuel costs, hourly startup costs, and revenue obtained in the Day-Ahead market from the sale of generation are also presented in this table.

4.2. Case II

In the present case study, the compressed air energy storage system used was system 1, as described in Table 3. After conducting 25 simulations, the best solution found resulted in a profit of $95,343.58. Table 7 presents the active power generation of thermal units in this solution, as well as the fuel cost, startup cost of units, and revenue obtained from selling the generated energy, all expressed in hourly values. It can be observed that the best solution found suggests that only thermal units 1 and 2 remain operational to maximize the generation company’s profit. Therefore, the startup cost of the thermal units was zero, as units 1 and 2 were already in operation at the time of the analysis, according to the initial operating state.
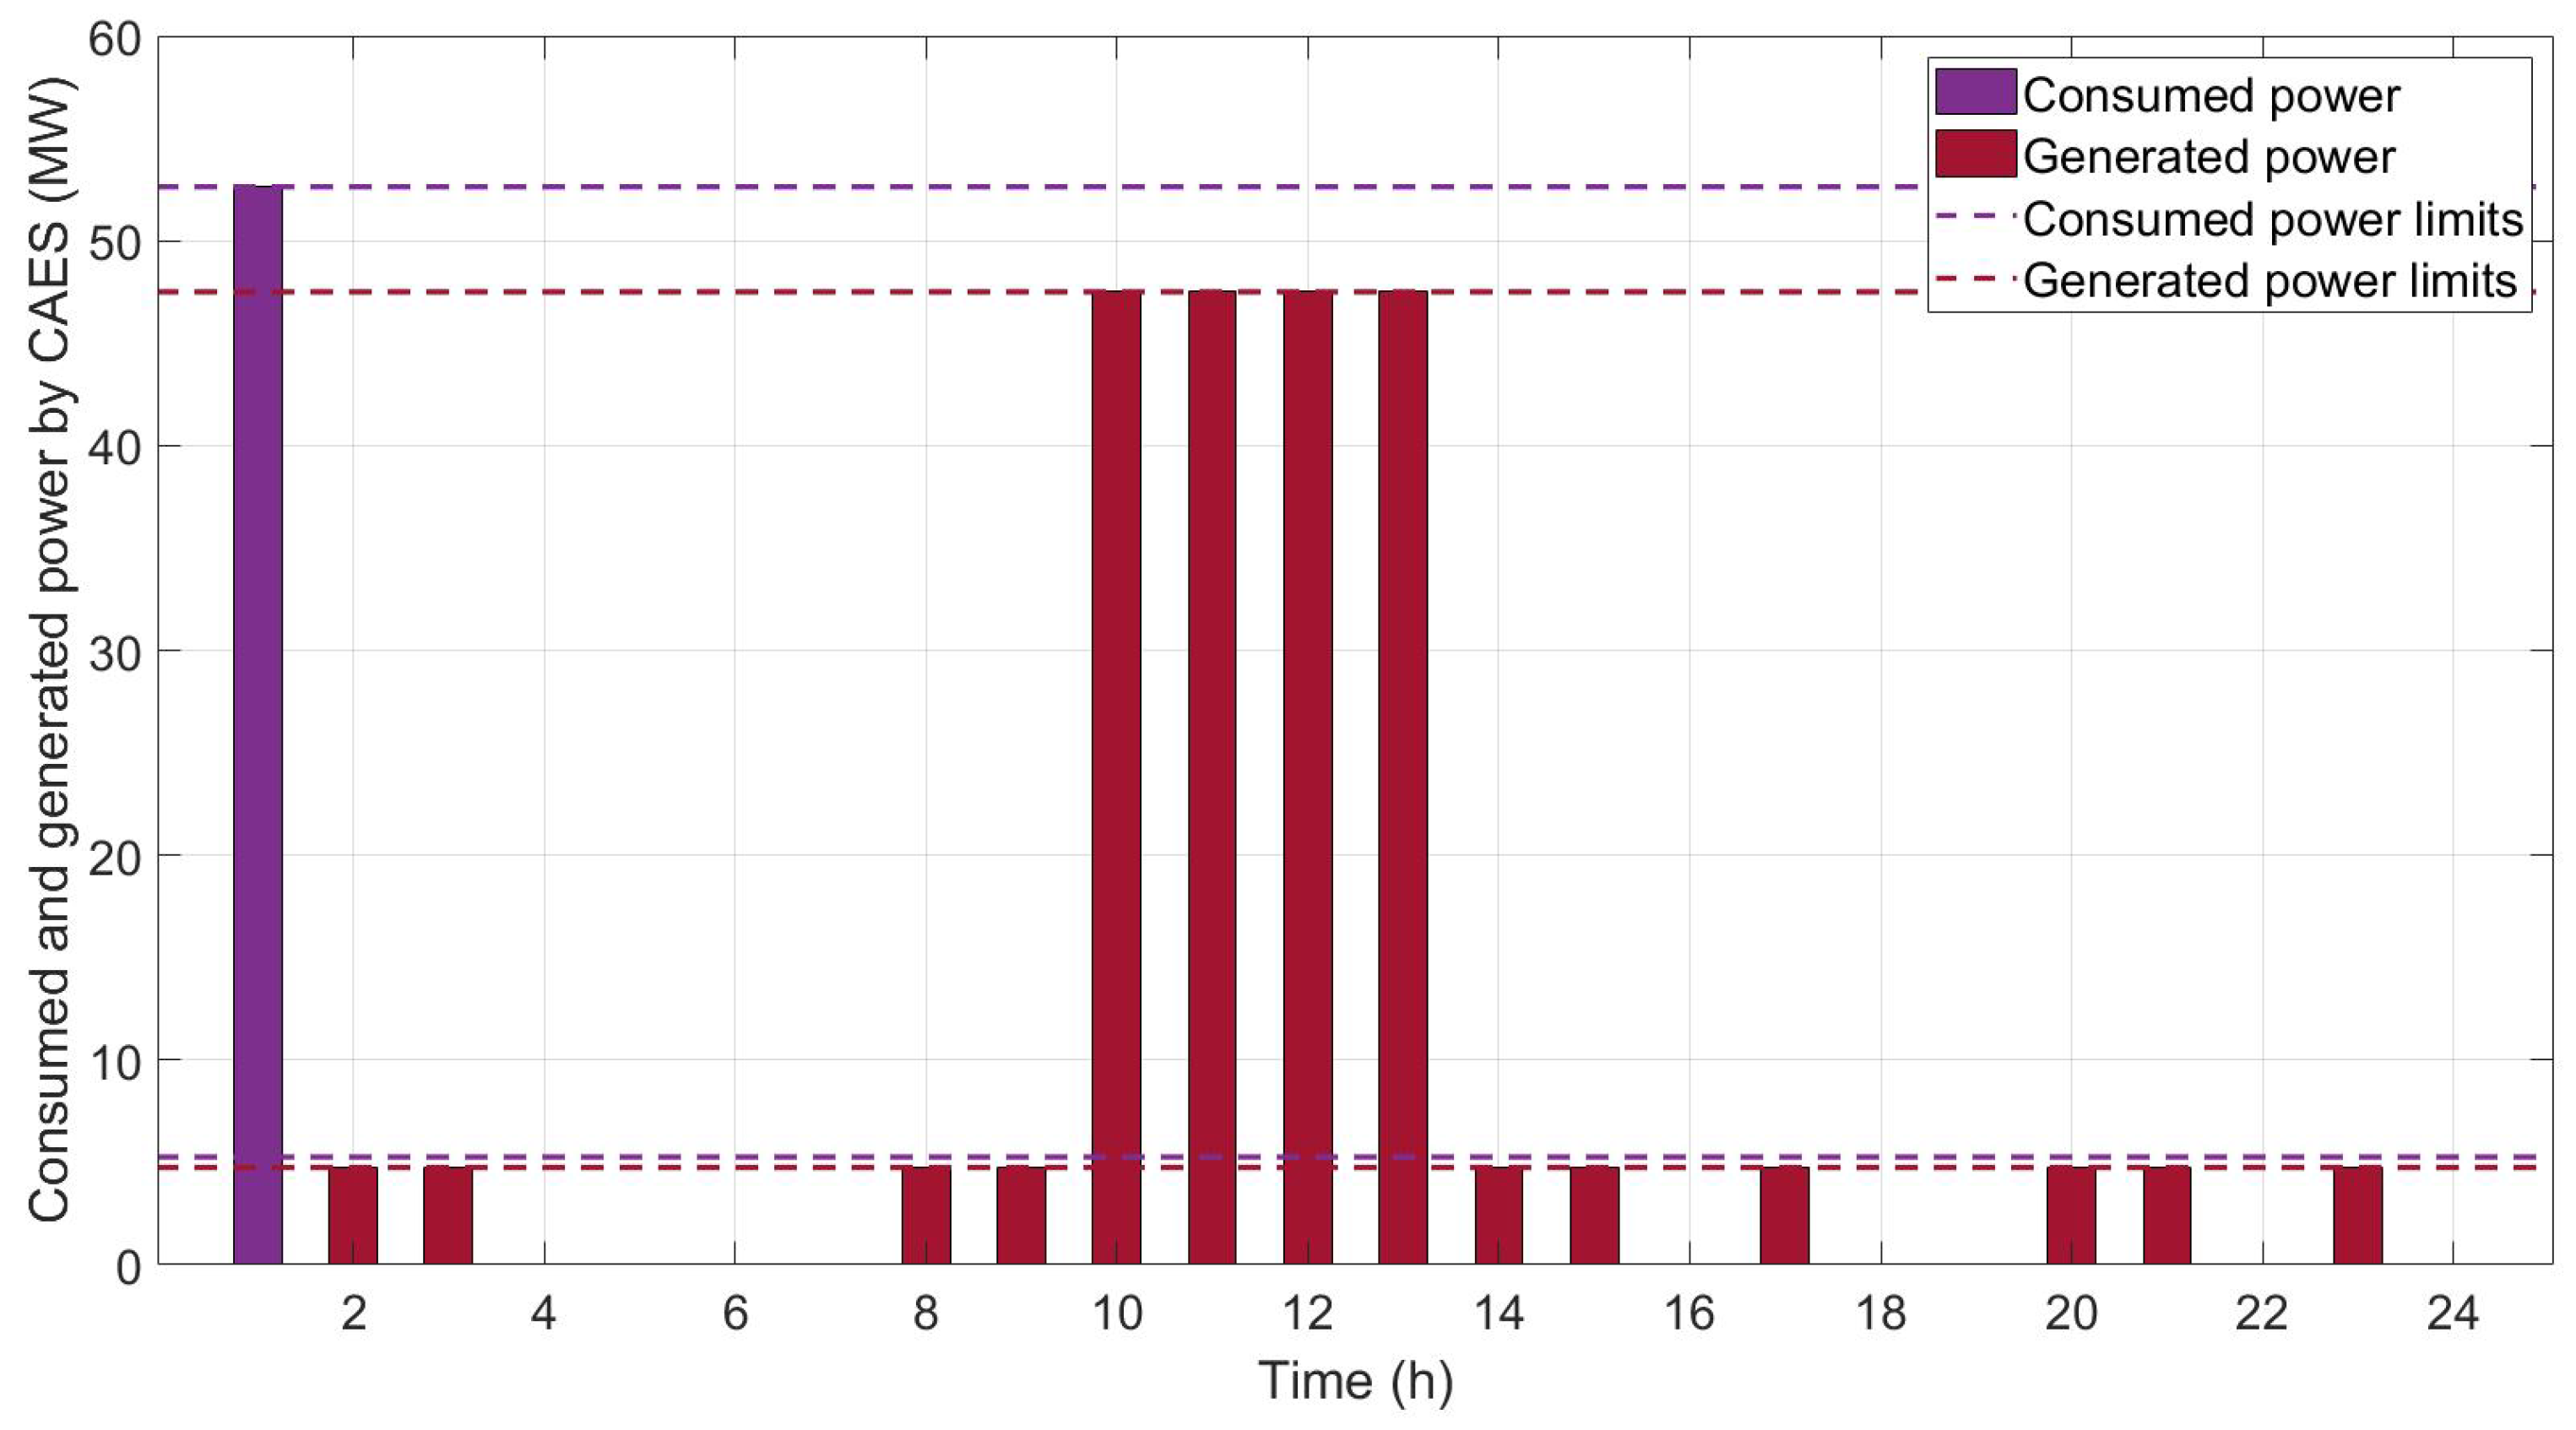
Figure 2 displays the amount of active power consumed and generated by the Compressed Air Energy Storage system in the best solution found, as well as the maximum and minimum limits for active power consumption and generation. It can be observed that this solution indicates that energy should be stored in the reservoir during hours 1 and 6, while during hours 2, 3, 4, 5, 7, 8, 9, 10, 11, 12, 13, 14, 15, 17, 19, and 20, energy should be discharged from the reservoir. It is important to note that during hour 1, the maximum amount of energy is consumed to enable more energy to be sold during the subsequent hours. This is because the price of energy in the market for the next day during hour 1 is cheaper than during the subsequent selling hours. In other words, it is more profitable to buy energy when it is cheaper and sell it when it is more expensive.
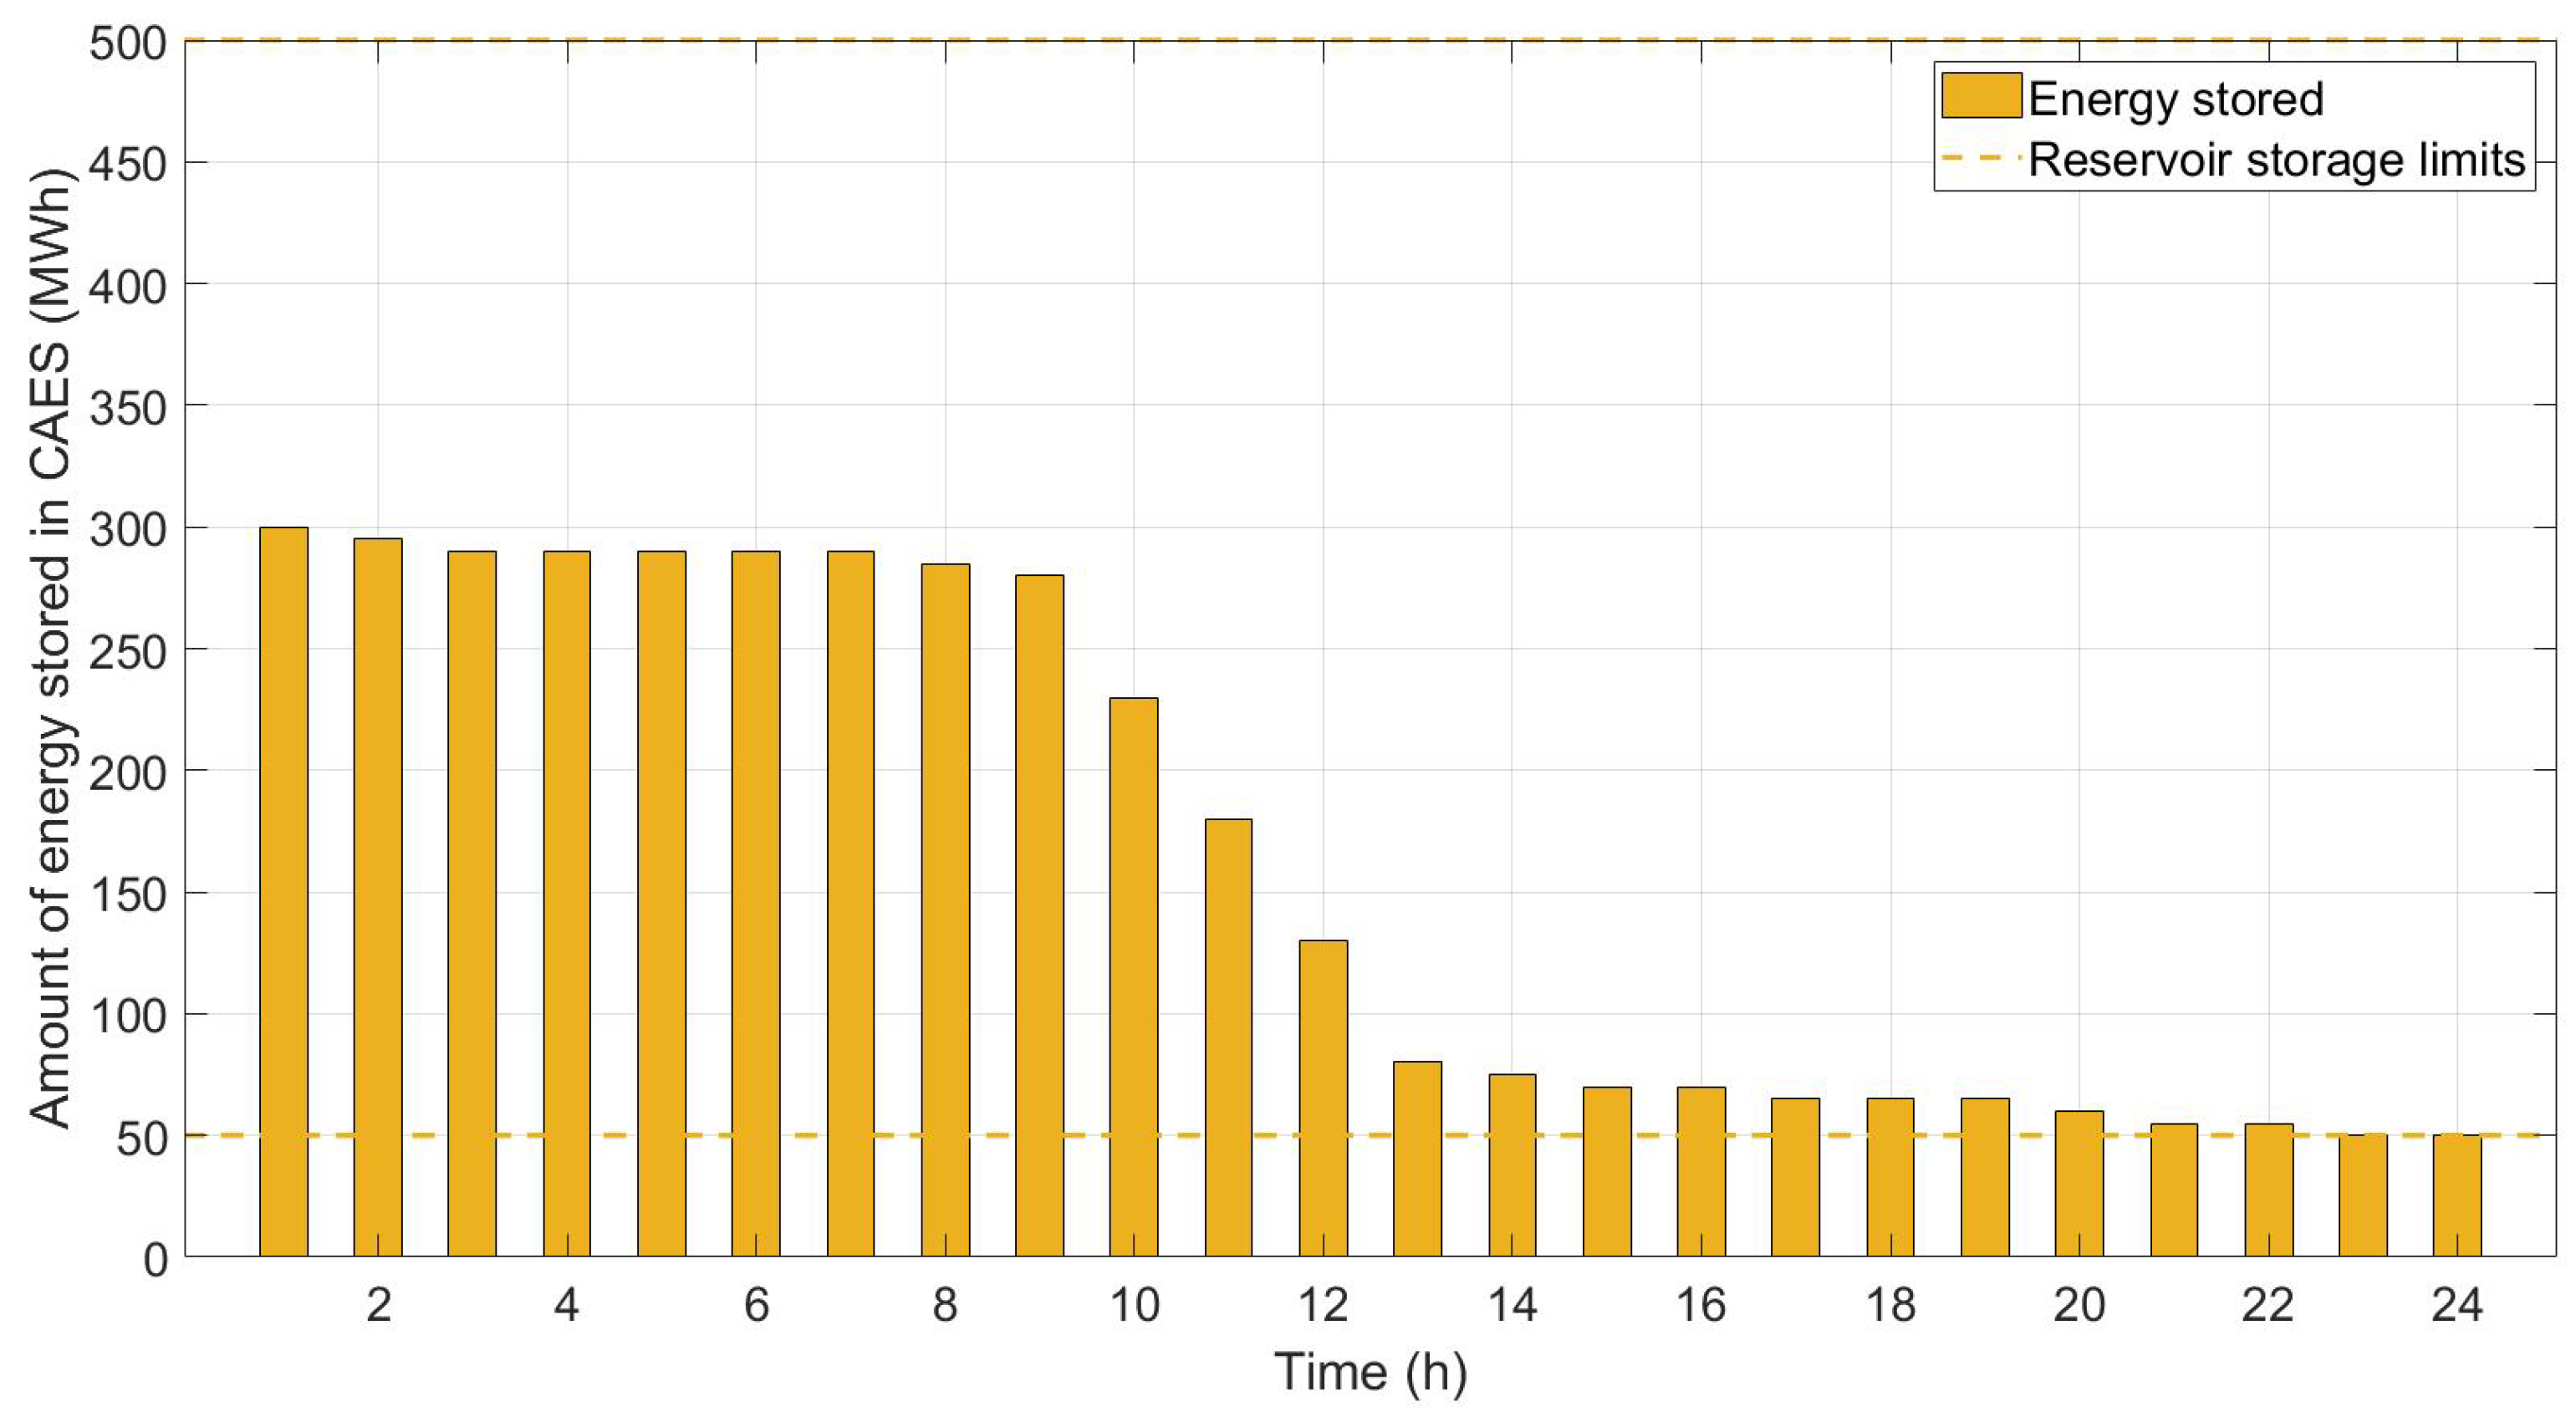
Figure 3 illustrates the amount of energy stored in the energy storage system for the 24 h. It can be observed that, to maximize the profit obtained by the generating company, energy was discharged from the energy storage system, meaning that energy was traded in the market until the amount of stored energy reached the minimum storage limit.

4.3. Case III

In Case III, all three compressed air energy storage systems with distinct parameters, as shown in Table 3, are considered. After conducting 25 simulations, the best solution found resulted in a profit of $102,813.86, which is higher than the best solutions found in Case I and Case II. Table 8 presents the active power generation of the thermal units in this solution, along with the fuel cost, start-up cost of the units, and revenue obtained from selling the energy generated by the units, all expressed on an hourly basis.
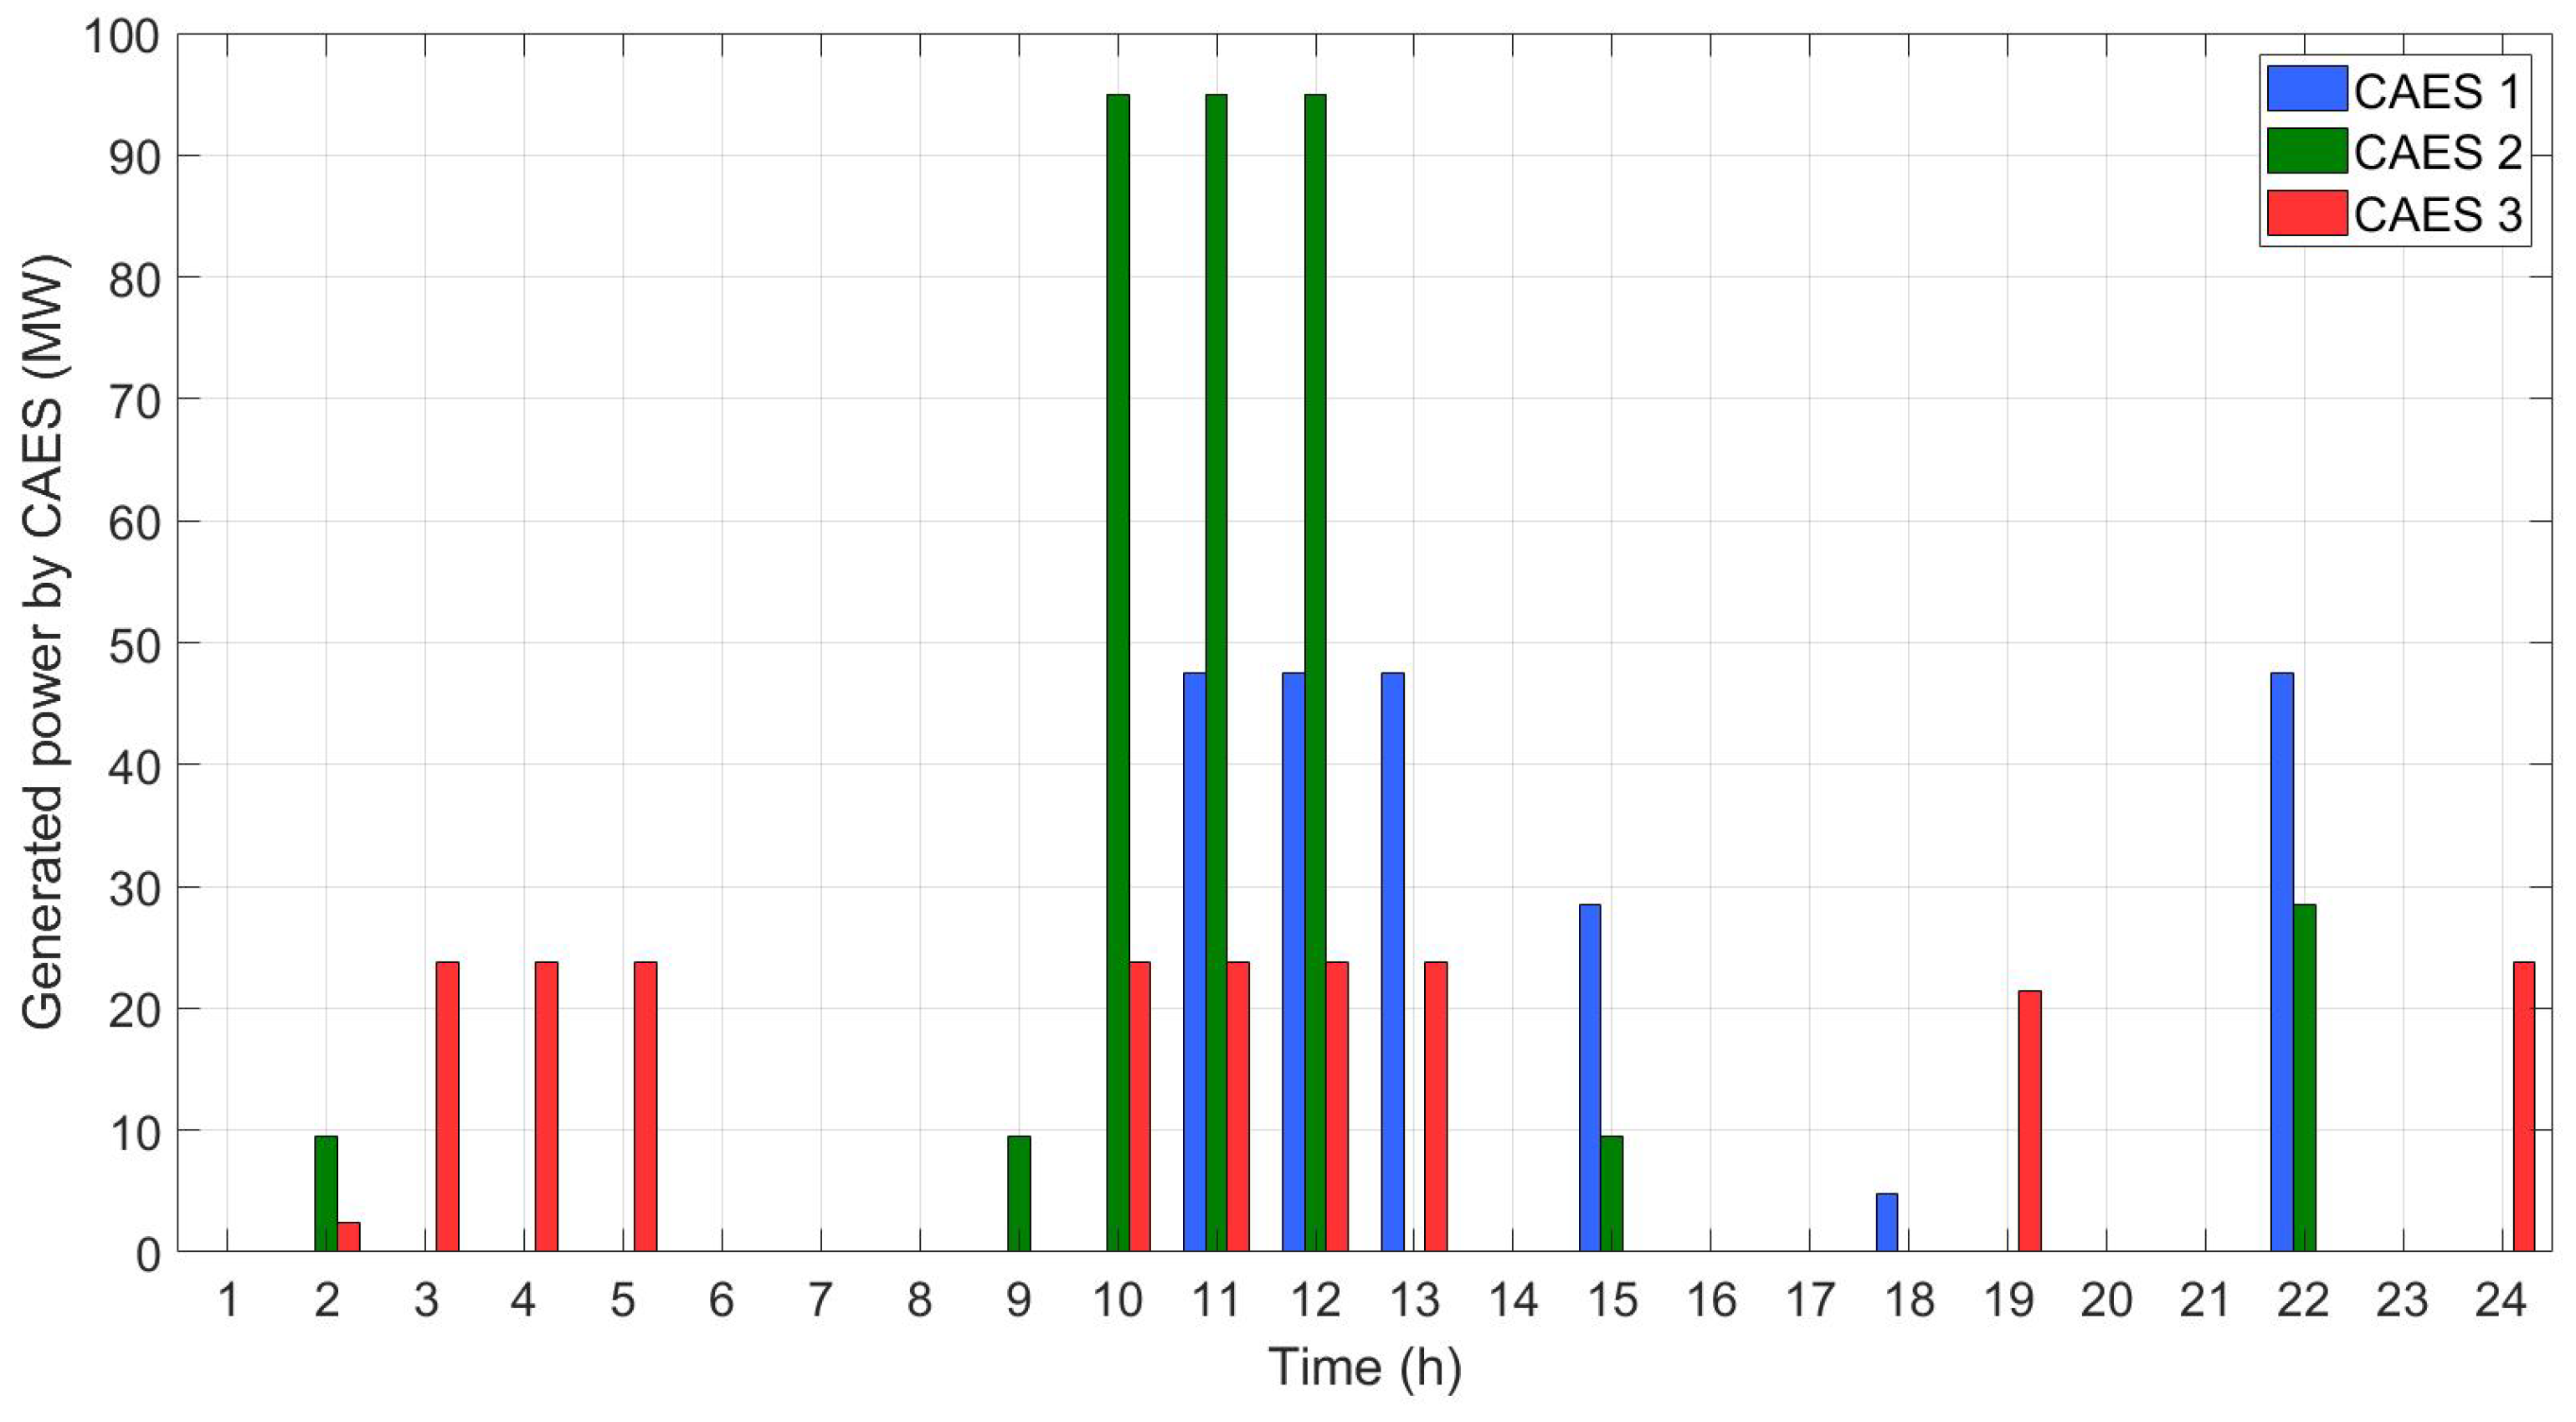
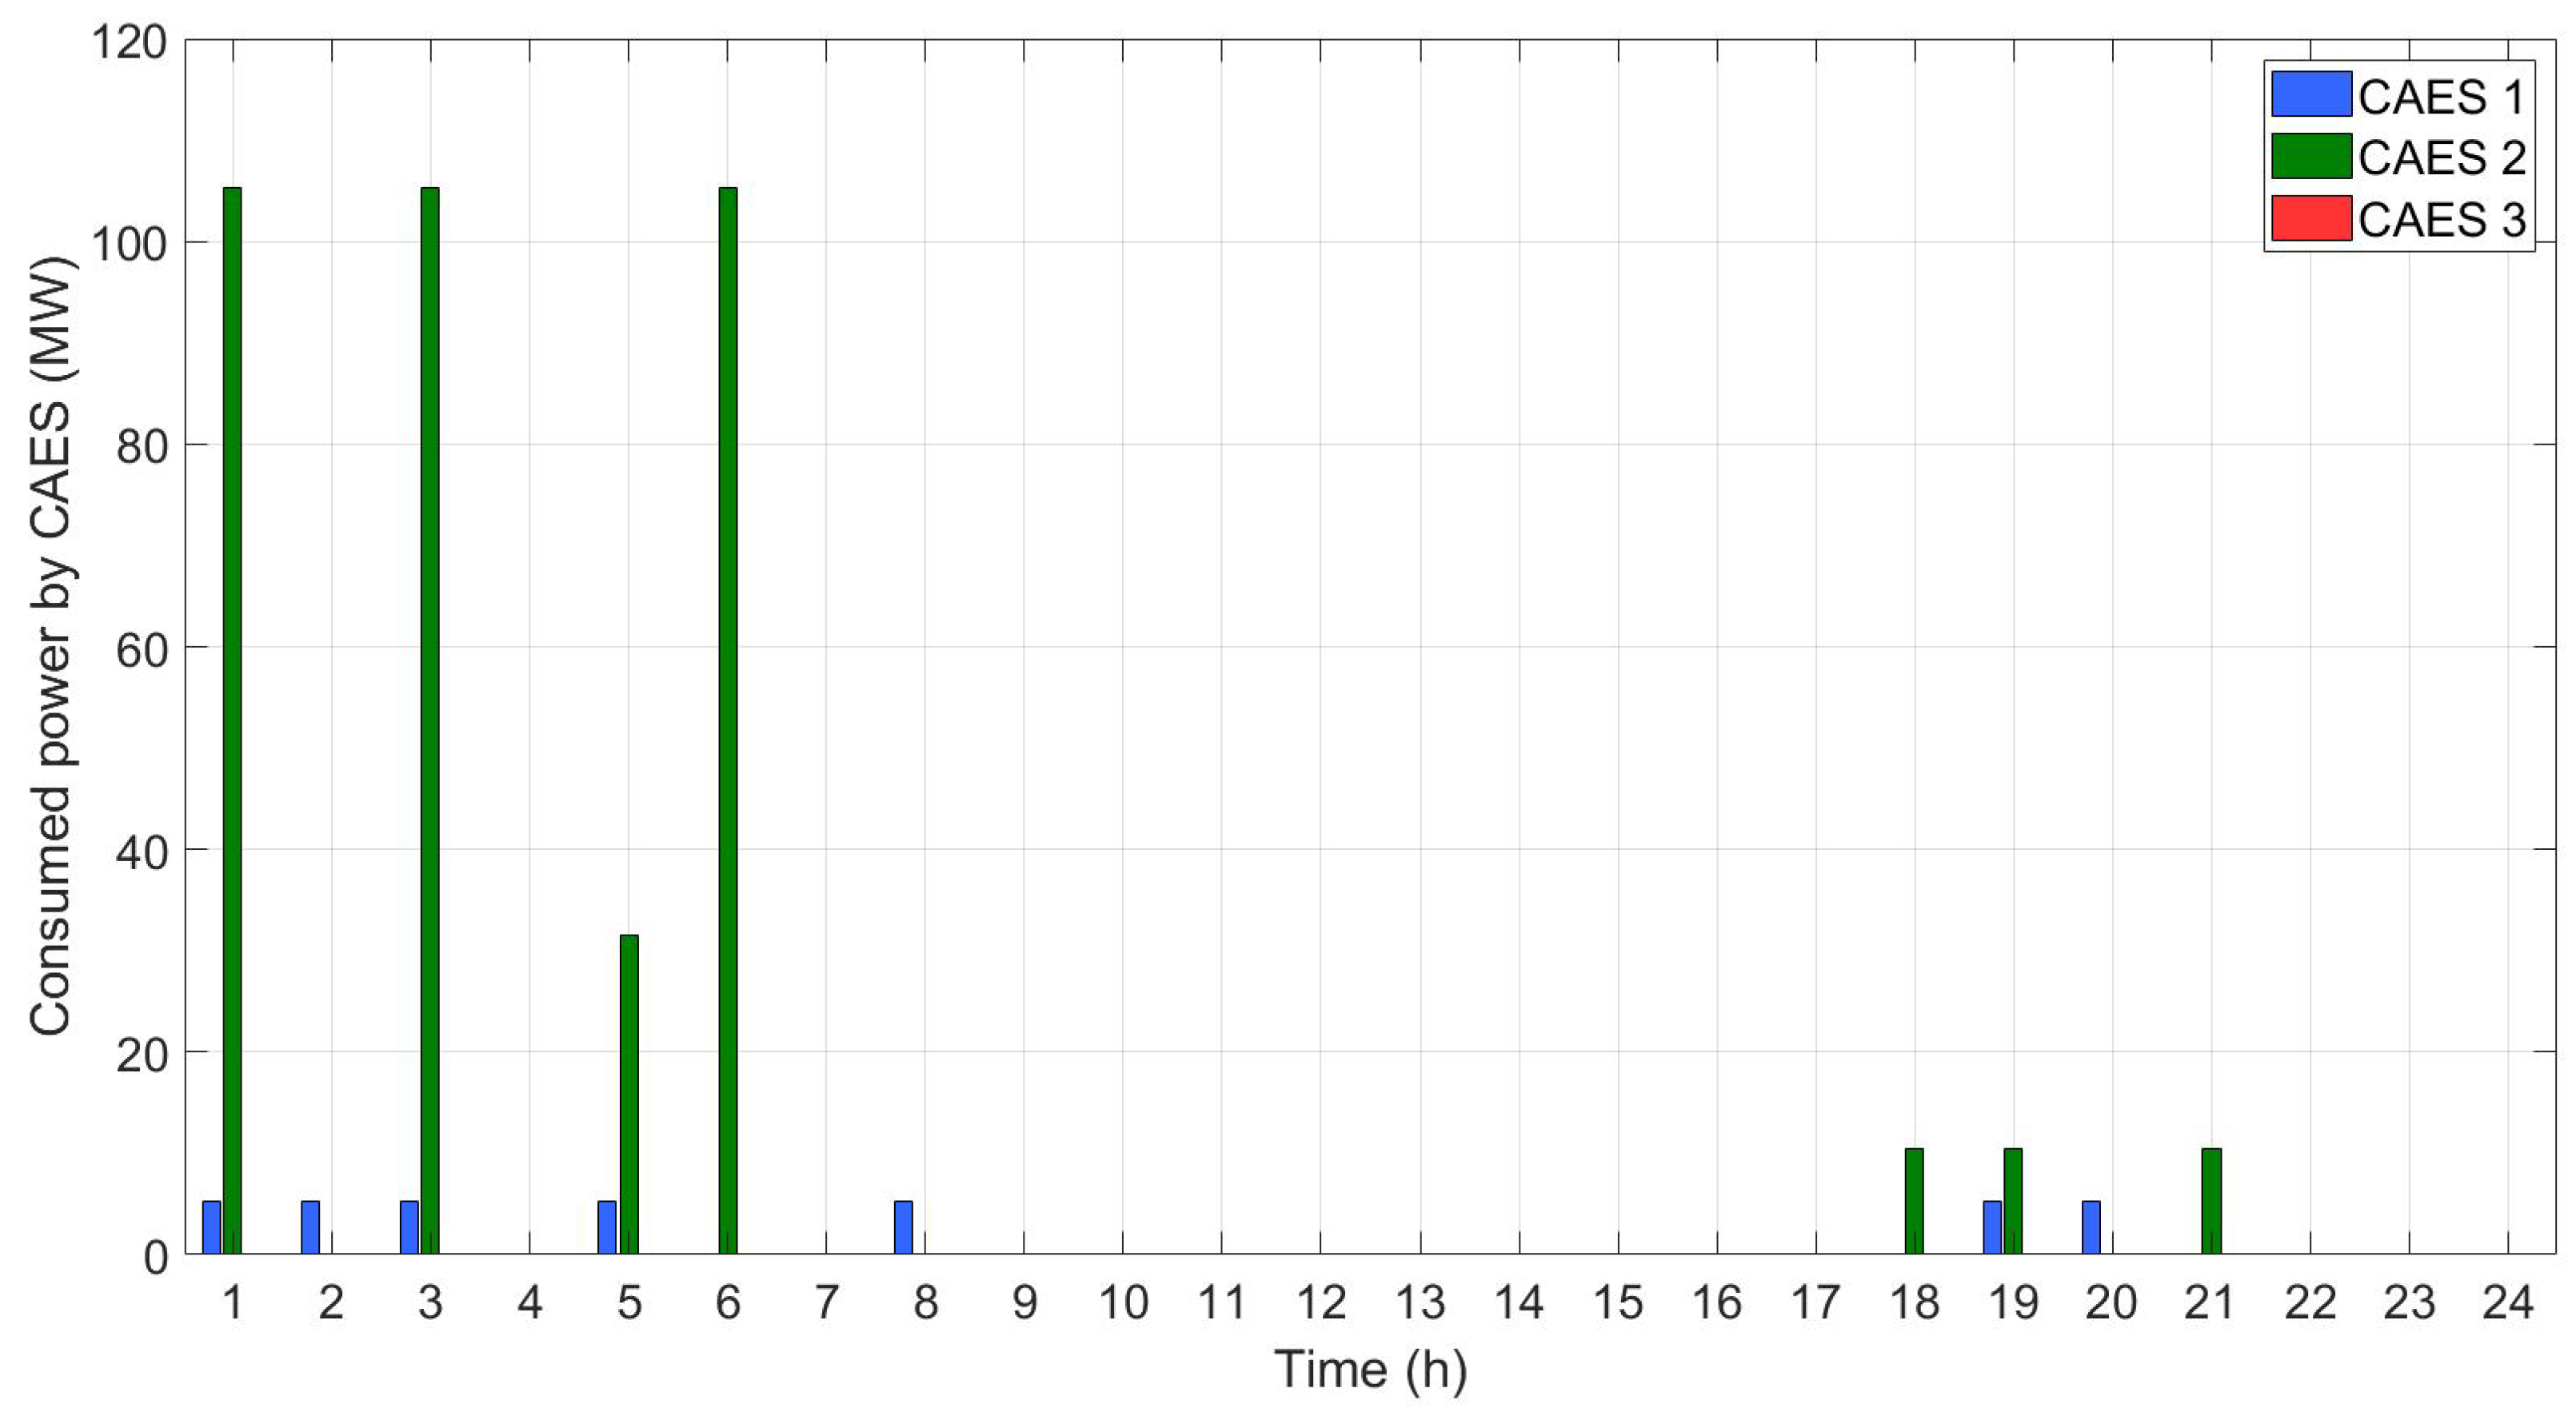
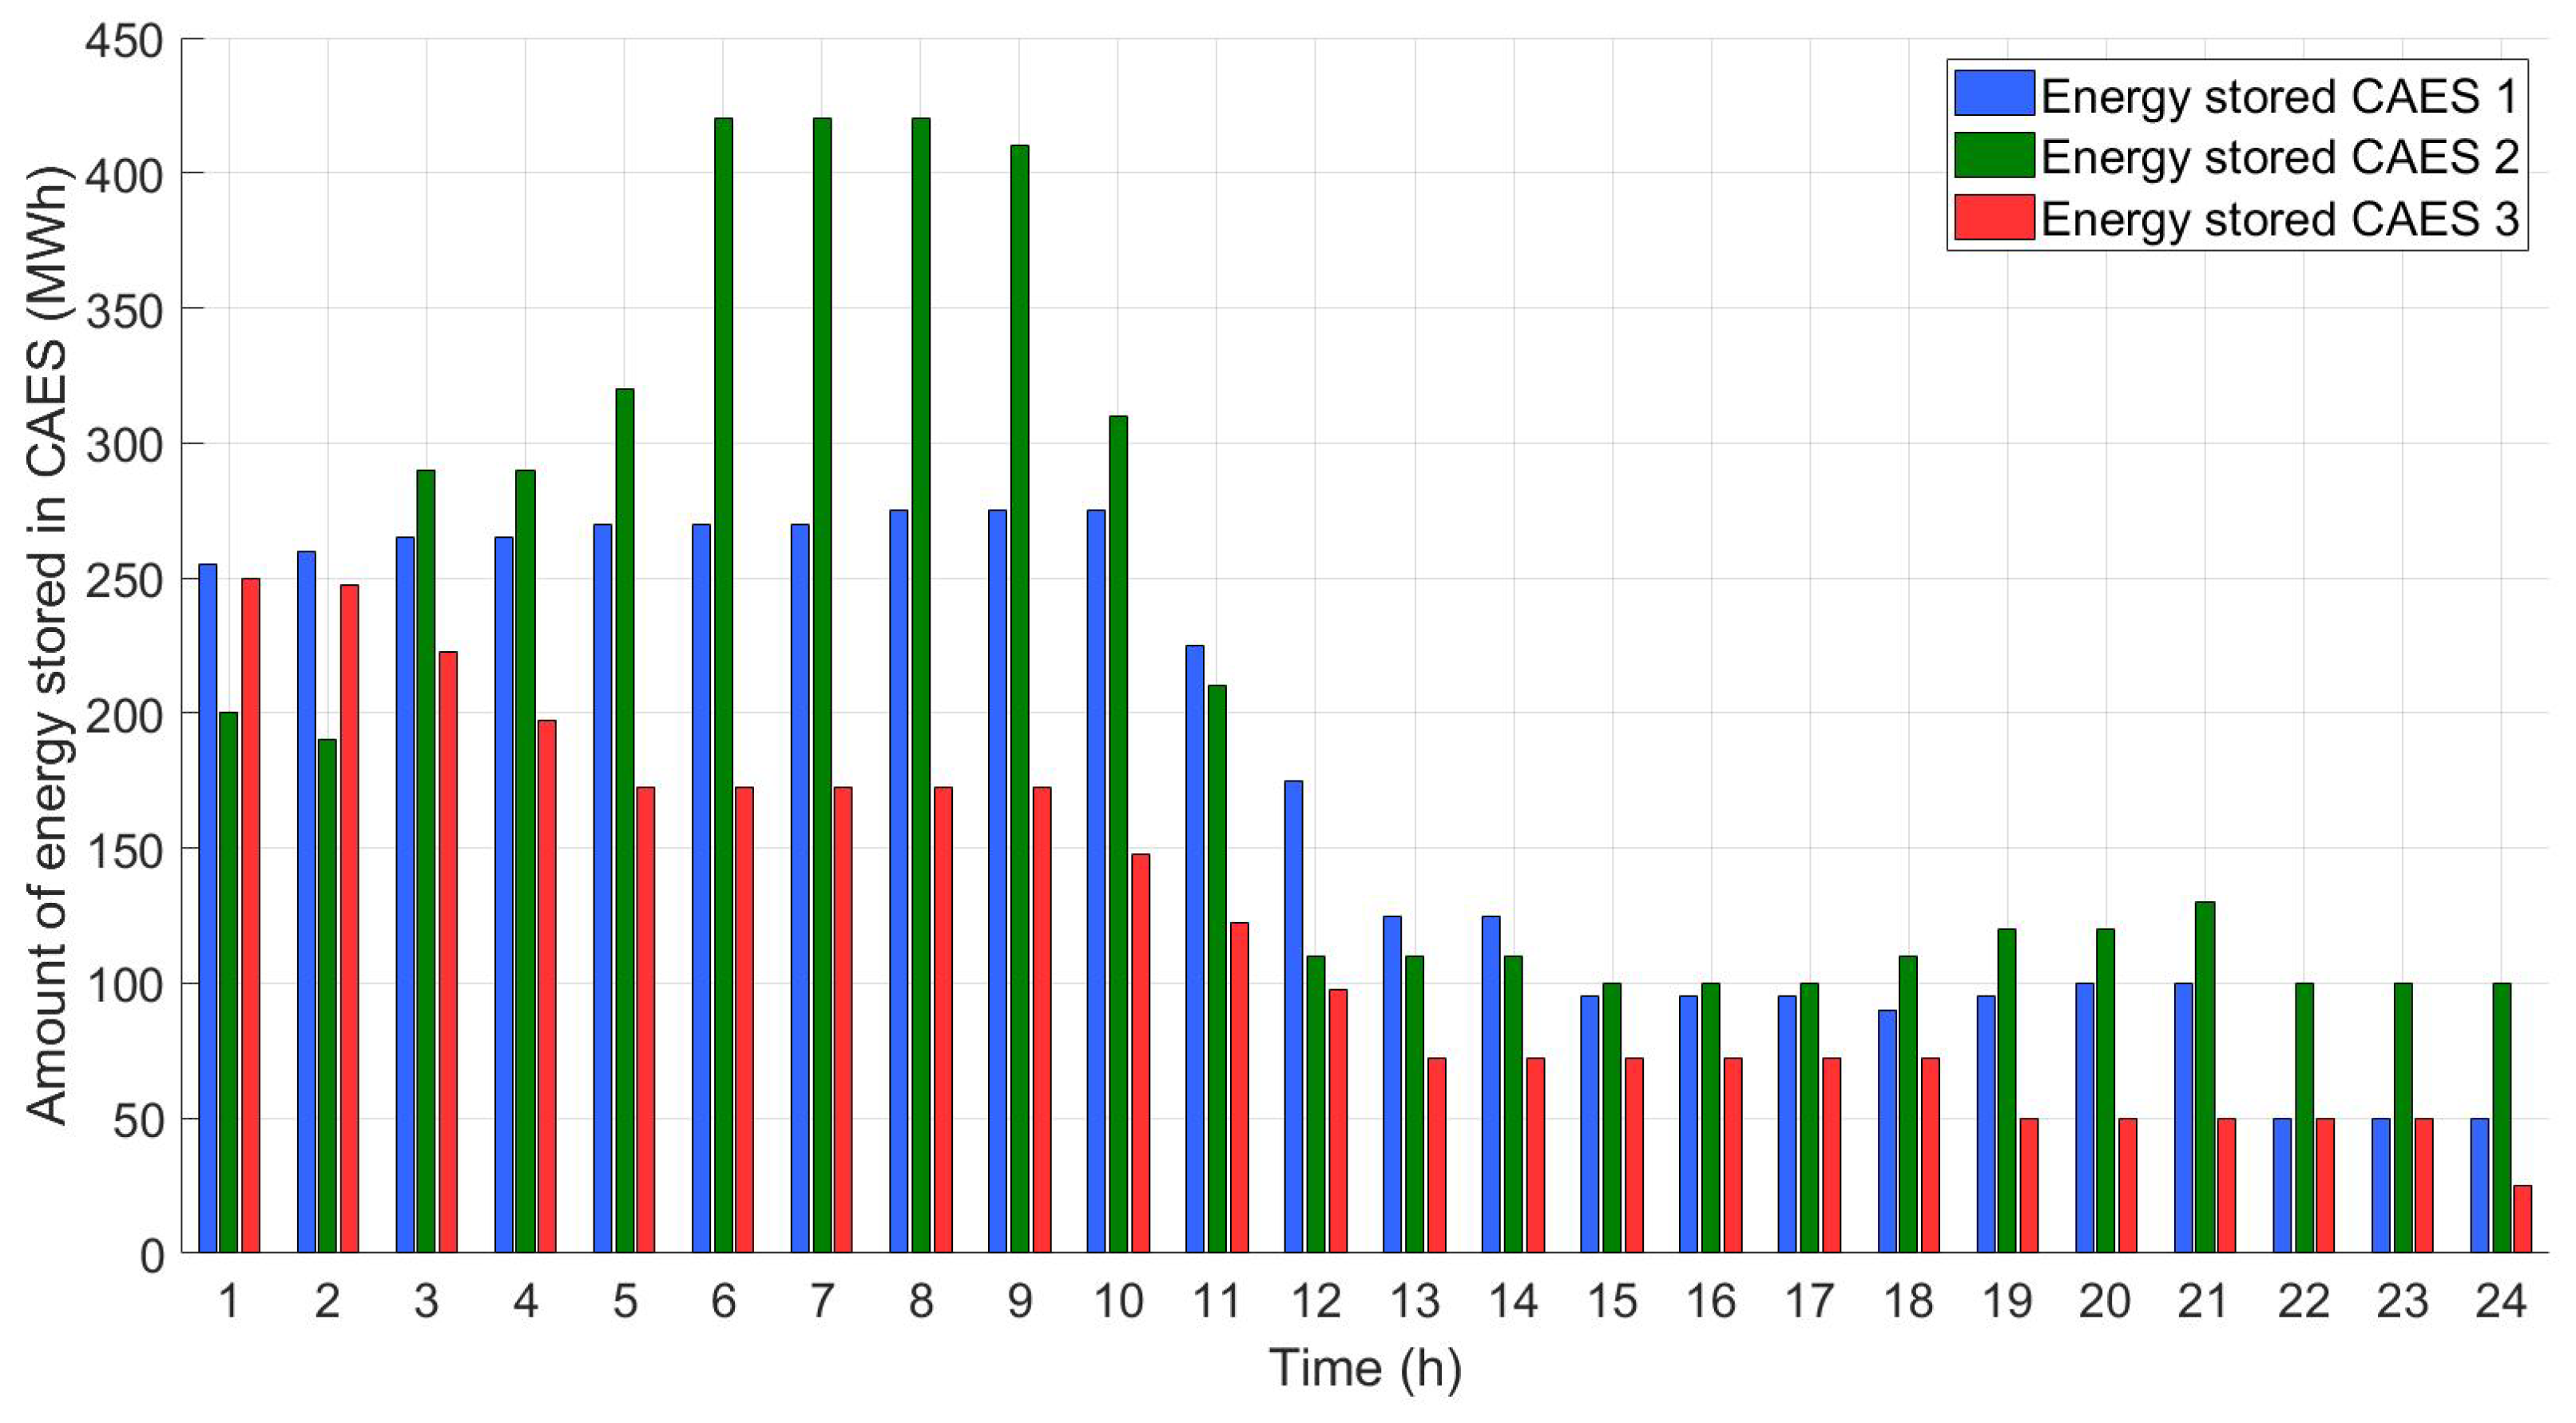
Figure 4 and Figure 5 display the amount of active power consumed by the grid for each Compressed Air Energy Storage (CAES) system and the amount of active power generated by each of these systems, respectively. It is important to note that CAES system 2 showed a higher demand for consumed power, which can be attributed to two main reasons: first, this system started the process with a lower volume of stored compressed air, and second, this system is capable of generating a greater amount of active power. Therefore, its operation is advantageous under these circumstances. As shown in Figure 6, you can observe the evolution of the amount of energy stored in the reservoirs.
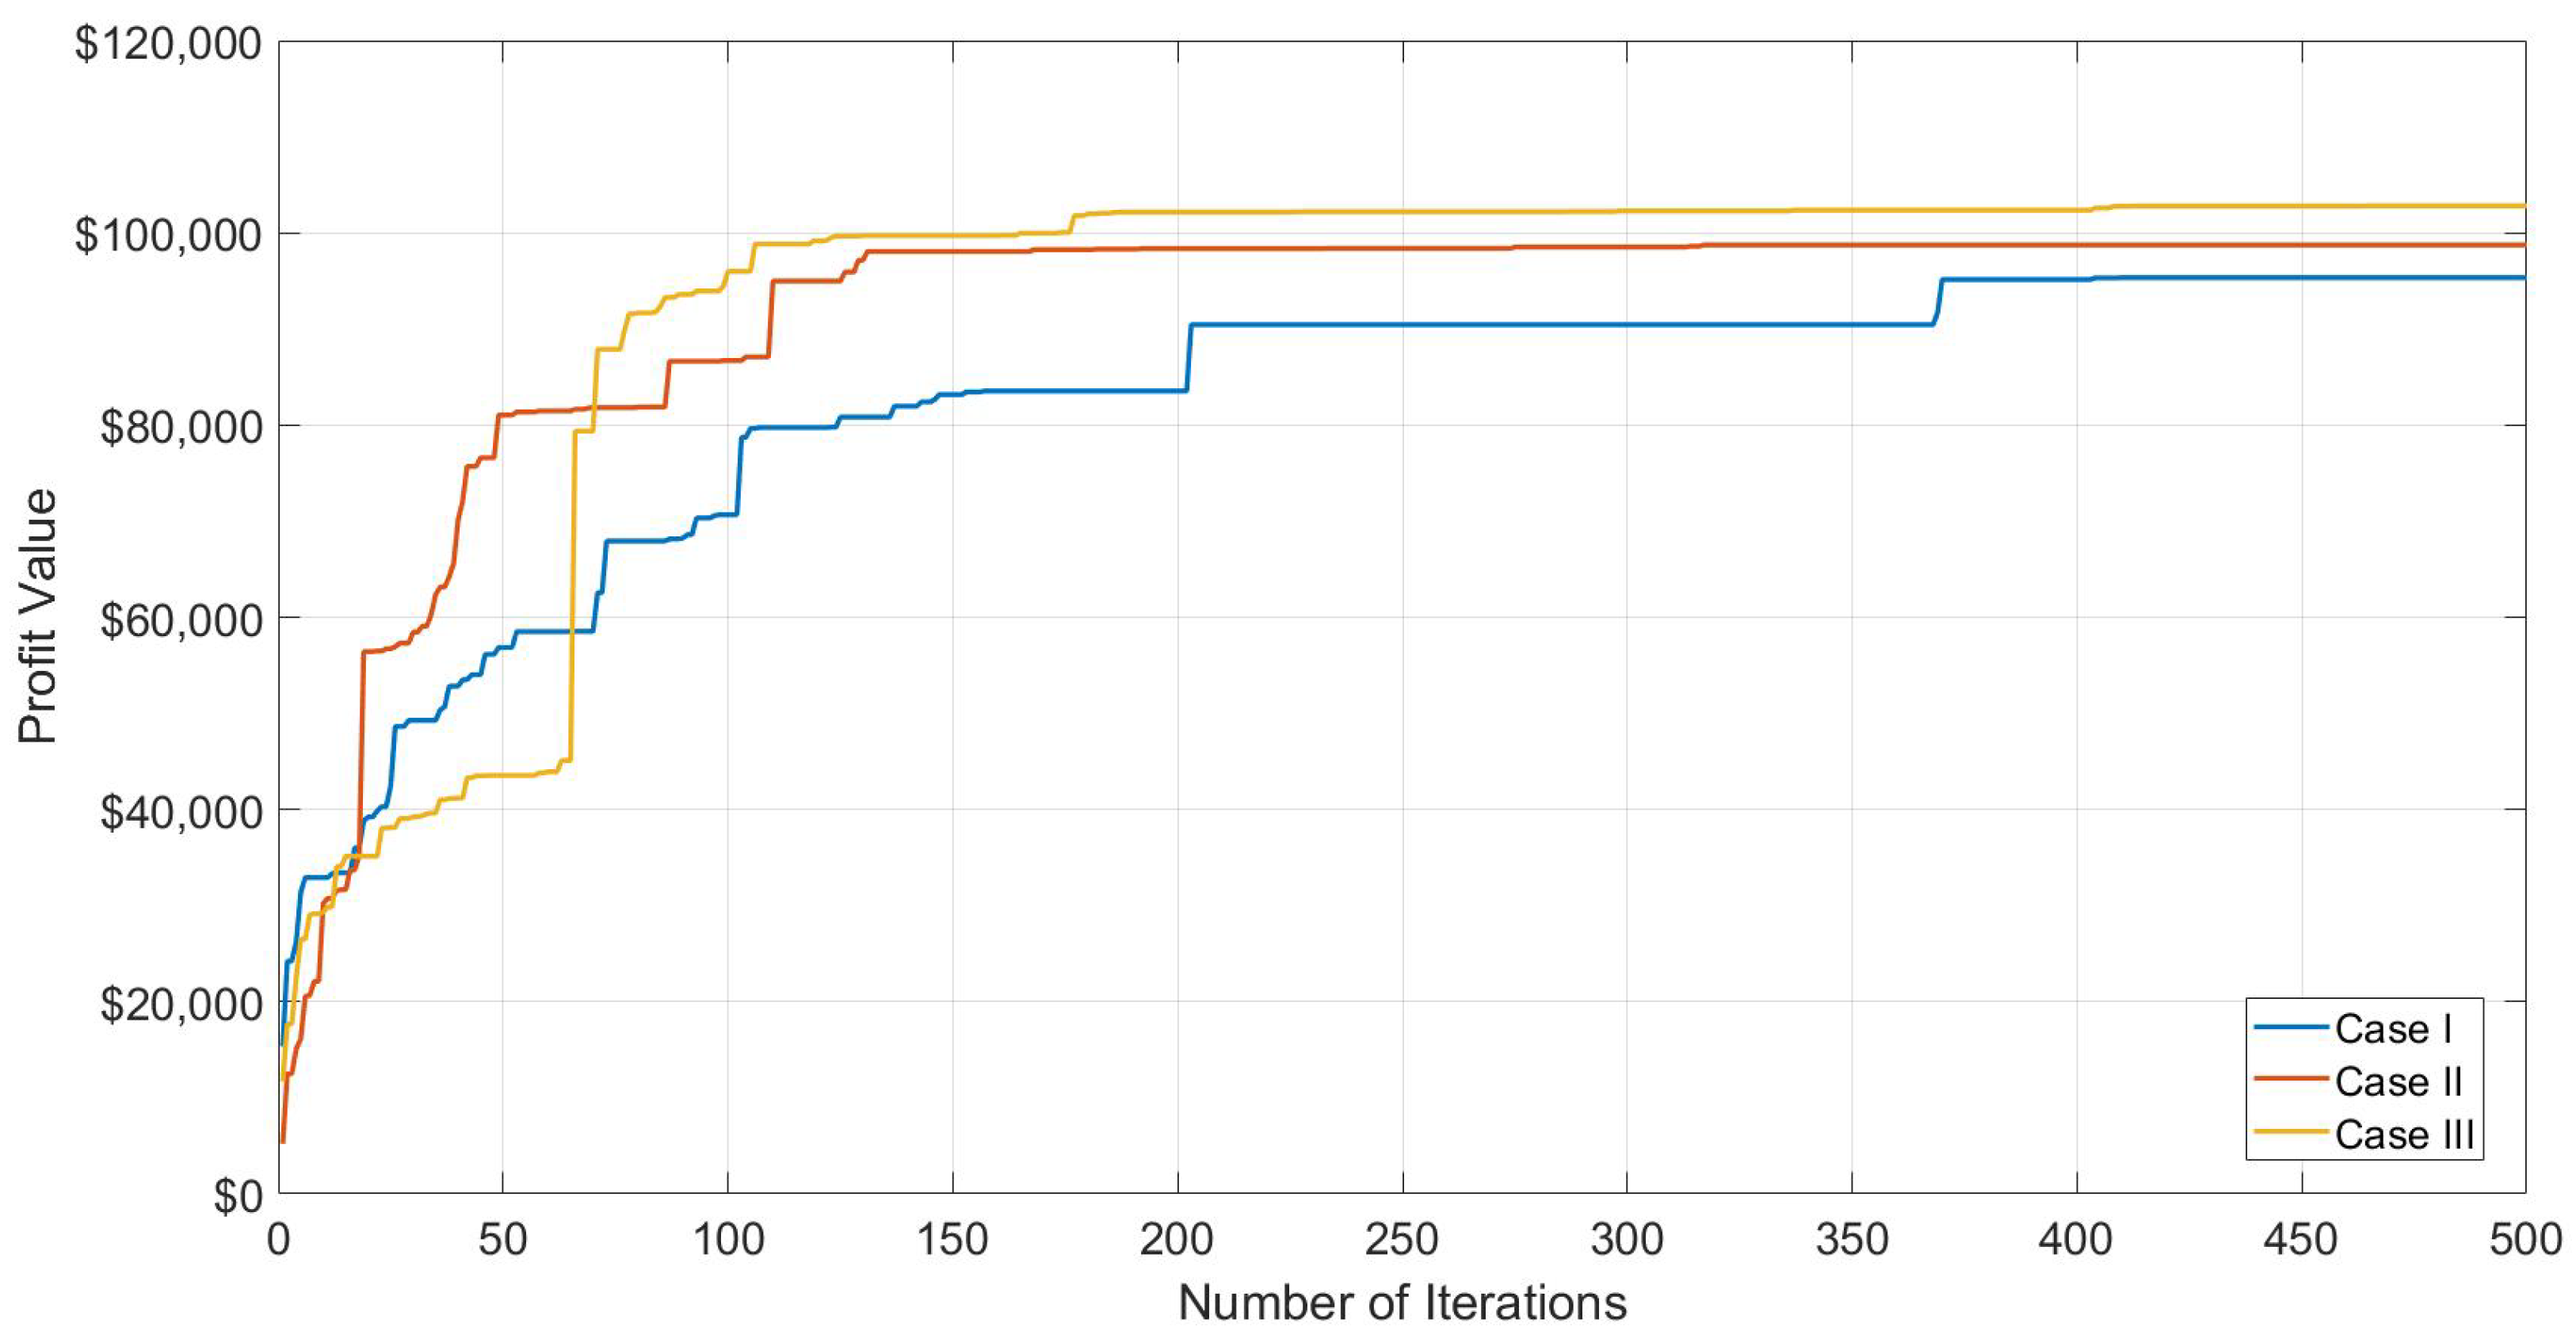
Table 9 provides a comparison of the best results in each case study conducted. It is evident that the use of CAES systems increases the profit obtained by the generation company. Furthermore, the methodology demonstrates a low level of computational execution. The convergence of the best solution found in each of the three cases is shown in Figure 7. The evolution of the best solution can be observed across iterations, with stagnation occurring at iteration 410 for Case I, and for Cases II and III, stagnation occurred at iterations 317 and 465, respectively.

5. Conclusions

This article presented an innovative approach to solve the Profit-Based Unit Commitment (PBUC) problem, involving a power generation company using thermal units and compressed air energy storage (CAES) systems to maximize their profits in the Day-Ahead market. The proposed strategy combines the use of Genetic Algorithm to determine the operational state of thermal units and the CAES system, along with a heuristic to optimize the amount of active power consumed from the grid to inject air into the storage system, as well as the amount of active power generated by CAES and thermal units for energy sale in the market. This strategy stands out for its low computational execution time and flexibility regarding storage system configurations.
The investigation encompassed three case studies: Case I, featuring a company with thermal units only; Case II, involving thermal units and one compressed air energy storage system; and Case III, incorporating thermal units and three compressed air energy storage systems. The results clearly indicate that the inclusion of CAESs leads to a more financially viable operation, marked by a reduction in committed thermal units (On) and, consequently, a decrease in operational costs. The results obtained demonstrate that the inclusion of CAESs can bring significant financial benefits to the power generation company. Therefore, this approach represents a valuable contribution to the field of PBUC, offering an efficient and effective solution to maximize profits in the energy market.
For future research, it is essential to investigate the consideration of generation companies with wind and solar units using this methodology. This allows for an examination of the significance of employing storage systems in the face of uncertainties in the generation of these highly variable renewable units. Additionally, another crucial aspect to address is the expansion of the methodology to incorporate the analysis of operating reserve and intra-day markets. Moreover, the model can be extended to a multi-objective formulation, where the benefits of the proposed methodology in minimizing greenhouse gas emissions and maximizing the profit of a GENCO through the use of compressed air systems should be explored. The heuristic strategy for defining the operation of the compressed air energy storage system in the Day-Ahead market can also be adapted for other types of energy storage systems.

Author Contributions

Conceptualization, L.S.N., I.C.d.S.J., E.J.d.O. and A.N.d.P.; Methodology, L.S.N., E.J.d.O. and A.N.d.P.; Software, L.S.N.; Validation, L.S.N.; Formal analysis, L.S.N., L.M.d.O., I.C.d.S.J. and E.J.d.O.; Investigation, L.S.N.; Resources, L.S.N. and L.M.d.O.; Data curation, L.S.N.; Writing—original draft, L.S.N., E.J.d.O. and A.N.d.P.; Writing—review & editing, L.S.N., L.M.d.O., I.C.d.S.J., E.J.d.O. and A.N.d.P.; Visualization, L.S.N., L.M.d.O., I.C.d.S.J., E.J.d.O. and A.N.d.P.; Supervision, L.M.d.O., I.C.d.S.J., E.J.d.O. and A.N.d.P.; Project administration, L.M.d.O., I.C.d.S.J., E.J.d.O. and A.N.d.P.; Funding acquisition, L.M.d.O. and I.C.d.S.J. All authors have read and agreed to the published version of the manuscript.

Funding

This research was funded by FAPEMIG, grant number PPM-00184-17.

Data Availability Statement

All data are contained within the article.

Acknowledgments

The authors thank FAPEMIG and the Electrical Engineering Post-graduation Program at the Federal University of Juiz de Fora for supporting this research.

Conflicts of Interest

The authors declare no conflict of interest.

References

  1. Willis, H.; Philipson, L. Understanding Electric Utilities and De-Regulation; CRC Press: Boca Raton, FL, USA, 2018. [Google Scholar]
  2. Corinaldesi, C.; Schwabeneder, D.; Lettner, G.; Auer, H. A rolling horizon approach for real-time trading and portfolio optimization of end-user flexibilities. Sustain. Energy Grids Netw. 2020, 24, 100392. [Google Scholar] [CrossRef]
  3. Lu, Z.; Liu, M.; Lu, W.; Lin, S. Shared-constraint approach for multi-leader multi-follower game of generation companies participating in electricity markets with carbon emission trading mechanism. J. Clean. Prod. 2022, 350, 131424. [Google Scholar] [CrossRef]
  4. Corinaldesi, C.; Fleischhacker, A.; Lang, L.; Radl, J.; Schwabeneder, D.; Lettner, G. European case studies for impact of market-driven flexibility management in distribution systems. In Proceedings of the 2019 IEEE International Conference on Communications, Control, and Computing Technologies for Smart Grids (SmartGridComm), Beijing, China, 21–23 October 2019; pp. 1–6. [Google Scholar]
  5. Nandi, A.; Kamboj, V.K. Comparative overview of profit-based unit commitment in competitive electricity market. In International Conference on Intelligent Computing and Smart Communication 2019: Proceedings of ICSC 2019; Springer: Berlin/Heidelberg, Germany, 2020; pp. 1171–1195. [Google Scholar]
  6. Abdi, H. Profit-based unit commitment problem: A review of models, methods, challenges, and future directions. Renew. Sustain. Energy Rev. 2021, 138, 110504. [Google Scholar] [CrossRef]
  7. Garcia-Gonzalez, J.; Barquin, J. Self-unit commitment of thermal units in a competitive electricity market. In Proceedings of the 2000 Power Engineering Society Summer Meeting (Cat. No. 00CH37134), Seattle, WA, USA, 16–20 July 2000; Volume 4, pp. 2278–2283. [Google Scholar]
  8. Shiina, T.; Watanabe, I. Lagrangian relaxation method for price-based unit commitment problem. Eng. Optim. 2004, 36, 705–719. [Google Scholar] [CrossRef]
  9. Chandram, K.; Subrahmanyam, N.; Sydulu, M. New approach with muller method for profit based unit commitment. In Proceedings of the 2008 IEEE Power and Energy Society General Meeting-Conversion and Delivery of Electrical Energy in the 21st Century, Pittsburgh, PA, USA, 20–24 July 2008; pp. 1–8. [Google Scholar]
  10. Krishna, P.; Sao, S. Price based unit commitment problem under deregulation. Int. J. Sci. Eng. Technol. 2012, 1, 177–184. [Google Scholar]
  11. Kumar, V.; Naresh, R.; Sharma, V. Stochastic profit-based unit commitment problem considering renewable energy sources with battery storage systems and plug-in hybrid electric vehicles. Int. J. Energy Res. 2022, 46, 16445–16460. [Google Scholar] [CrossRef]
  12. Richter, C.; Sheble, G. A profit-based unit commitment GA for the competitive environment. IEEE Trans. Power Syst. 2000, 15, 715–721. [Google Scholar] [CrossRef]
  13. Georgilakis, P. Genetic algorithm model for profit maximization of generating companies in deregulated electricity markets. Appl. Artif. Intell. 2009, 23, 538–552. [Google Scholar] [CrossRef]
  14. Singhal, P.; Naresh, R.; Sharma, V.; Nadakuditi, G. Generator scheduling under competitive environment using Genetic Algorithm. Int. J. Eng. Sci. Technol. 2015, 7, 24–32. [Google Scholar] [CrossRef]
  15. Yuan, X.; Yuan, Y.; Wang, C.; Zhang, X. An improved PSO approach for profit-based unit commitment in electricity market. In Proceedings of the 2005 IEEE/PES Transmission & Distribution Conference & Exposition: Asia and Pacific, Dalian, China, 18 August 2005; pp. 1–4. [Google Scholar]
  16. Raglend, I.; Raghuveer, C.; Avinash, G.; Padhy, N.; Kothari, D. Solution to profit based unit commitment problem using particle swarm optimization. Appl. Soft Comput. 2010, 10, 1247–1256. [Google Scholar] [CrossRef]
  17. Venkatesan, T.; Sanavullah, M. SFLA approach to solve PBUC problem with emission limitation. Int. J. Electr. Power Energy Syst. 2013, 46, 1–9. [Google Scholar] [CrossRef]
  18. Ghadi, M.; Baghramian, A. A new heuristic method for solving unit commitment problem in competitive environment. Int. J. Soft Comput. Eng. 2013, 2, 2231–2307. [Google Scholar]
  19. Singhal, P.; Naresh, R.; Sharma, V. Binary fish swarm algorithm for profit-based unit commitment problem in competitive electricity market with ramp rate constraints. IET Gener. Transm. Distrib. 2015, 9, 1697–1707. [Google Scholar] [CrossRef]
  20. Reddy, S.; Panwar, L.; Panigrahi, B.; Kumar, R.; Alsumaiti, A. Binary grey wolf optimizer models for profit based unit commitment of price-taking GENCO in electricity market. Swarm Evol. Comput. 2019, 44, 957–971. [Google Scholar] [CrossRef]
  21. Reddy K, S.; Panwar, L.; Panigrahi, B.; Kumar, R. Binary whale optimization algorithm: A new metaheuristic approach for profit-based unit commitment problems in competitive electricity markets. Eng. Optim. 2019, 51, 369–389. [Google Scholar] [CrossRef]
  22. Kumar, V.; Naresh, R.; Sharma, V. Profit based unit commitment problem solution using metaheuristic optimisation approach. Int. J. Syst. Sci. Oper. Logist. 2023, 10, 2037026. [Google Scholar] [CrossRef]
  23. Lakshmi, K.; Vasantharathna, S. A profit based unit commitment problem in deregulated power markets. In Proceedings of the 2009 International Conference on Power Systems, Kharagpur, India, 27–29 December 2009; pp. 1–6. [Google Scholar]
  24. Attaviriyanupap, P.; Kita, H.; Tanaka, E.; Hasegawa, J. A hybrid LR-EP for solving new profit-based UC problem under competitive environment. IEEE Trans. Power Syst. 2003, 18, 229–237. [Google Scholar] [CrossRef]
  25. Bavafa, M.; Navidi, N.; Monsef, H. A new approach for Profit-Based Unit Commitment using Lagrangian relaxation combined with ant colony search algorithm. In Proceedings of the 2008 43rd International Universities Power Engineering Conference, Padua, Italy, 1–4 September 2008; pp. 1–6. [Google Scholar]
  26. Rampriya, B.; Mahadevan, K.; Kannan, S. Unit commitment in deregulated power system using Lagrangian firefly algorithm. In Proceedings of the 2010 International Conference On Communication Control And Computing Technologies, Nagercoil, India, 7–9 October 2010; pp. 389–393. [Google Scholar]
  27. Kumar, R.; Asokan, K.; Kumar, S. Optimal scheduling of generators to maximize GENCOs profit using LR combined with ABC algorithm in deregulated power system. In Proceedings of the 2013 International Conference on Computation of Power, Energy, Information and Communication (ICCPEIC), Chennai, India, 17–18 April 2013; pp. 75–83. [Google Scholar]
  28. Sudhakar, A.; Karri, C.; Laxmi, A. A hybrid LR-secant method-invasive weed optimisation for profit-based unit commitment. Int. J. Power Energy Convers. 2018, 9, 1–24. [Google Scholar] [CrossRef]
  29. Shukla, A.; Lal, V.; Singh, S. Profit-based unit commitment problem using PSO with modified dynamic programming. In Proceedings of the 2015 18th International Conference On Intelligent System Application To Power Systems (ISAP), Porto, Portugal, 11–16 September 2015; pp. 1–6. [Google Scholar]
  30. Chandram, K.; Subrahmanyam, N.; Sydulu, M. Improved pre-prepared power demand table and Muller’s method to solve the profit based unit commitment problem. J. Electr. Eng. Technol. 2009, 4, 159–167. [Google Scholar] [CrossRef]
  31. Asokan, K.; Ashokkumar, R. Emission controlled Profit based Unit commitment for GENCOs using MPPD Table with ABC algorithm under Competitive Environment. Strategies 2014, 16, 20. [Google Scholar]
  32. Anand, H.; Narang, N.; Dhillon, J. Profit based unit commitment using hybrid optimization technique. Energy 2018, 148, 701–715. [Google Scholar] [CrossRef]
  33. Lakshmi, K.; Vasantharathna, S. Hybrid artificial immune system approach for profit based unit commitment problem. J. Electr. Eng. Technol. 2013, 8, 959–968. [Google Scholar] [CrossRef]
  34. Sundaram, C.; Sudhakaran, M.; Raj, P. Tabu search-enhanced artificial bee colony algorithm to solve profit-based unit commitment problem with emission limitations in deregulated electricity market. Int. J. Metaheurist. 2017, 6, 107–132. [Google Scholar] [CrossRef]
  35. BP, p.l.c. BP Statistical Review of World Energy 2017; BP p.l.c.: London, UK, 2019. [Google Scholar]
  36. Olabi, A.; Wilberforce, T.; Ramadan, M.; Abdelkareem, M.; Alami, A. Compressed air energy storage systems: Components and operating parameters—A review. J. Energy Storage 2021, 34, 102000. [Google Scholar] [CrossRef]
  37. Sharma, A.; Chiu, H.H.; Ahrens, F.O.W.; Ahluwalia, R.K.; Ragsdell, K.O.M. Design of optimum compressed air energy-storage systems. Energy 1979, 4, 201–216. [Google Scholar] [CrossRef]
  38. Budt, M.; Wolf, D.; Span, R.; Yan, J. A review on compressed air energy storage: Basic principles, past milestones and recent developments. Appl. Energy 2016, 170, 250–268. [Google Scholar] [CrossRef]
  39. Yucekaya, A. The operational economics of compressed air energy storage systems under uncertainty. Renew. Sustain. Energy Rev. 2013, 22, 298–305. [Google Scholar] [CrossRef]
  40. Nasouri Gilvaei, M.; Hosseini Imani, M.; Jabbari Ghadi, M.; Li, L.; Golrang, A. Profit-based unit commitment for a GENCO equipped with compressed air energy storage and concentrating solar power units. Energies 2021, 14, 576. [Google Scholar] [CrossRef]
  41. Lund, H.; Salgi, G.; Elmegaard, B.; Andersen, A. Optimal operation strategies of compressed air energy storage (CAES) on electricity spot markets with fluctuating prices. Appl. Therm. Eng. 2009, 29, 799–806. [Google Scholar] [CrossRef]
  42. Drury, E.; Denholm, P.; Sioshansi, R. The value of compressed air energy storage in energy and reserve markets. Energy 2011, 36, 4959–4973. [Google Scholar] [CrossRef]
  43. Soroudi, A. Smart self-scheduling of Gencos with thermal and energy storage units under price uncertainty. Int. Trans. Electr. Energy Syst. 2014, 24, 1401–1418. [Google Scholar] [CrossRef]
  44. Abbaspour, M.; Satkin, M.; Mohammadi-Ivatloo, B.; Hoseinzadeh Lotfi, F.; Noorollahi, Y. Optimal operation scheduling of wind power integrated with compressed air energy storage (CAES). Renew. Energy 2013, 51, 53–59. [Google Scholar] [CrossRef]
  45. Shafiee, S.; Zareipour, H.; Knight, A.M.; Amjady, N.; Mohammadi-Ivatloo, B. Risk-constrained bidding and offering strategy for a merchant compressed air energy storage plant. IEEE Trans. Power Syst. 2016, 32, 946–957. [Google Scholar] [CrossRef]
  46. Akbari, E.; Hooshmand, R.A.; Gholipour, M.; Parastegari, M. Stochastic programming-based optimal bidding of compressed air energy storage with wind and thermal generation units in energy and reserve markets. Energy 2019, 171, 535–546. [Google Scholar] [CrossRef]
  47. Kumar, V.; Naresh, R.; Singh, A. Investigation of solution techniques of unit commitment problems: A review. Wind Eng. 2021, 45, 1689–1713. [Google Scholar] [CrossRef]
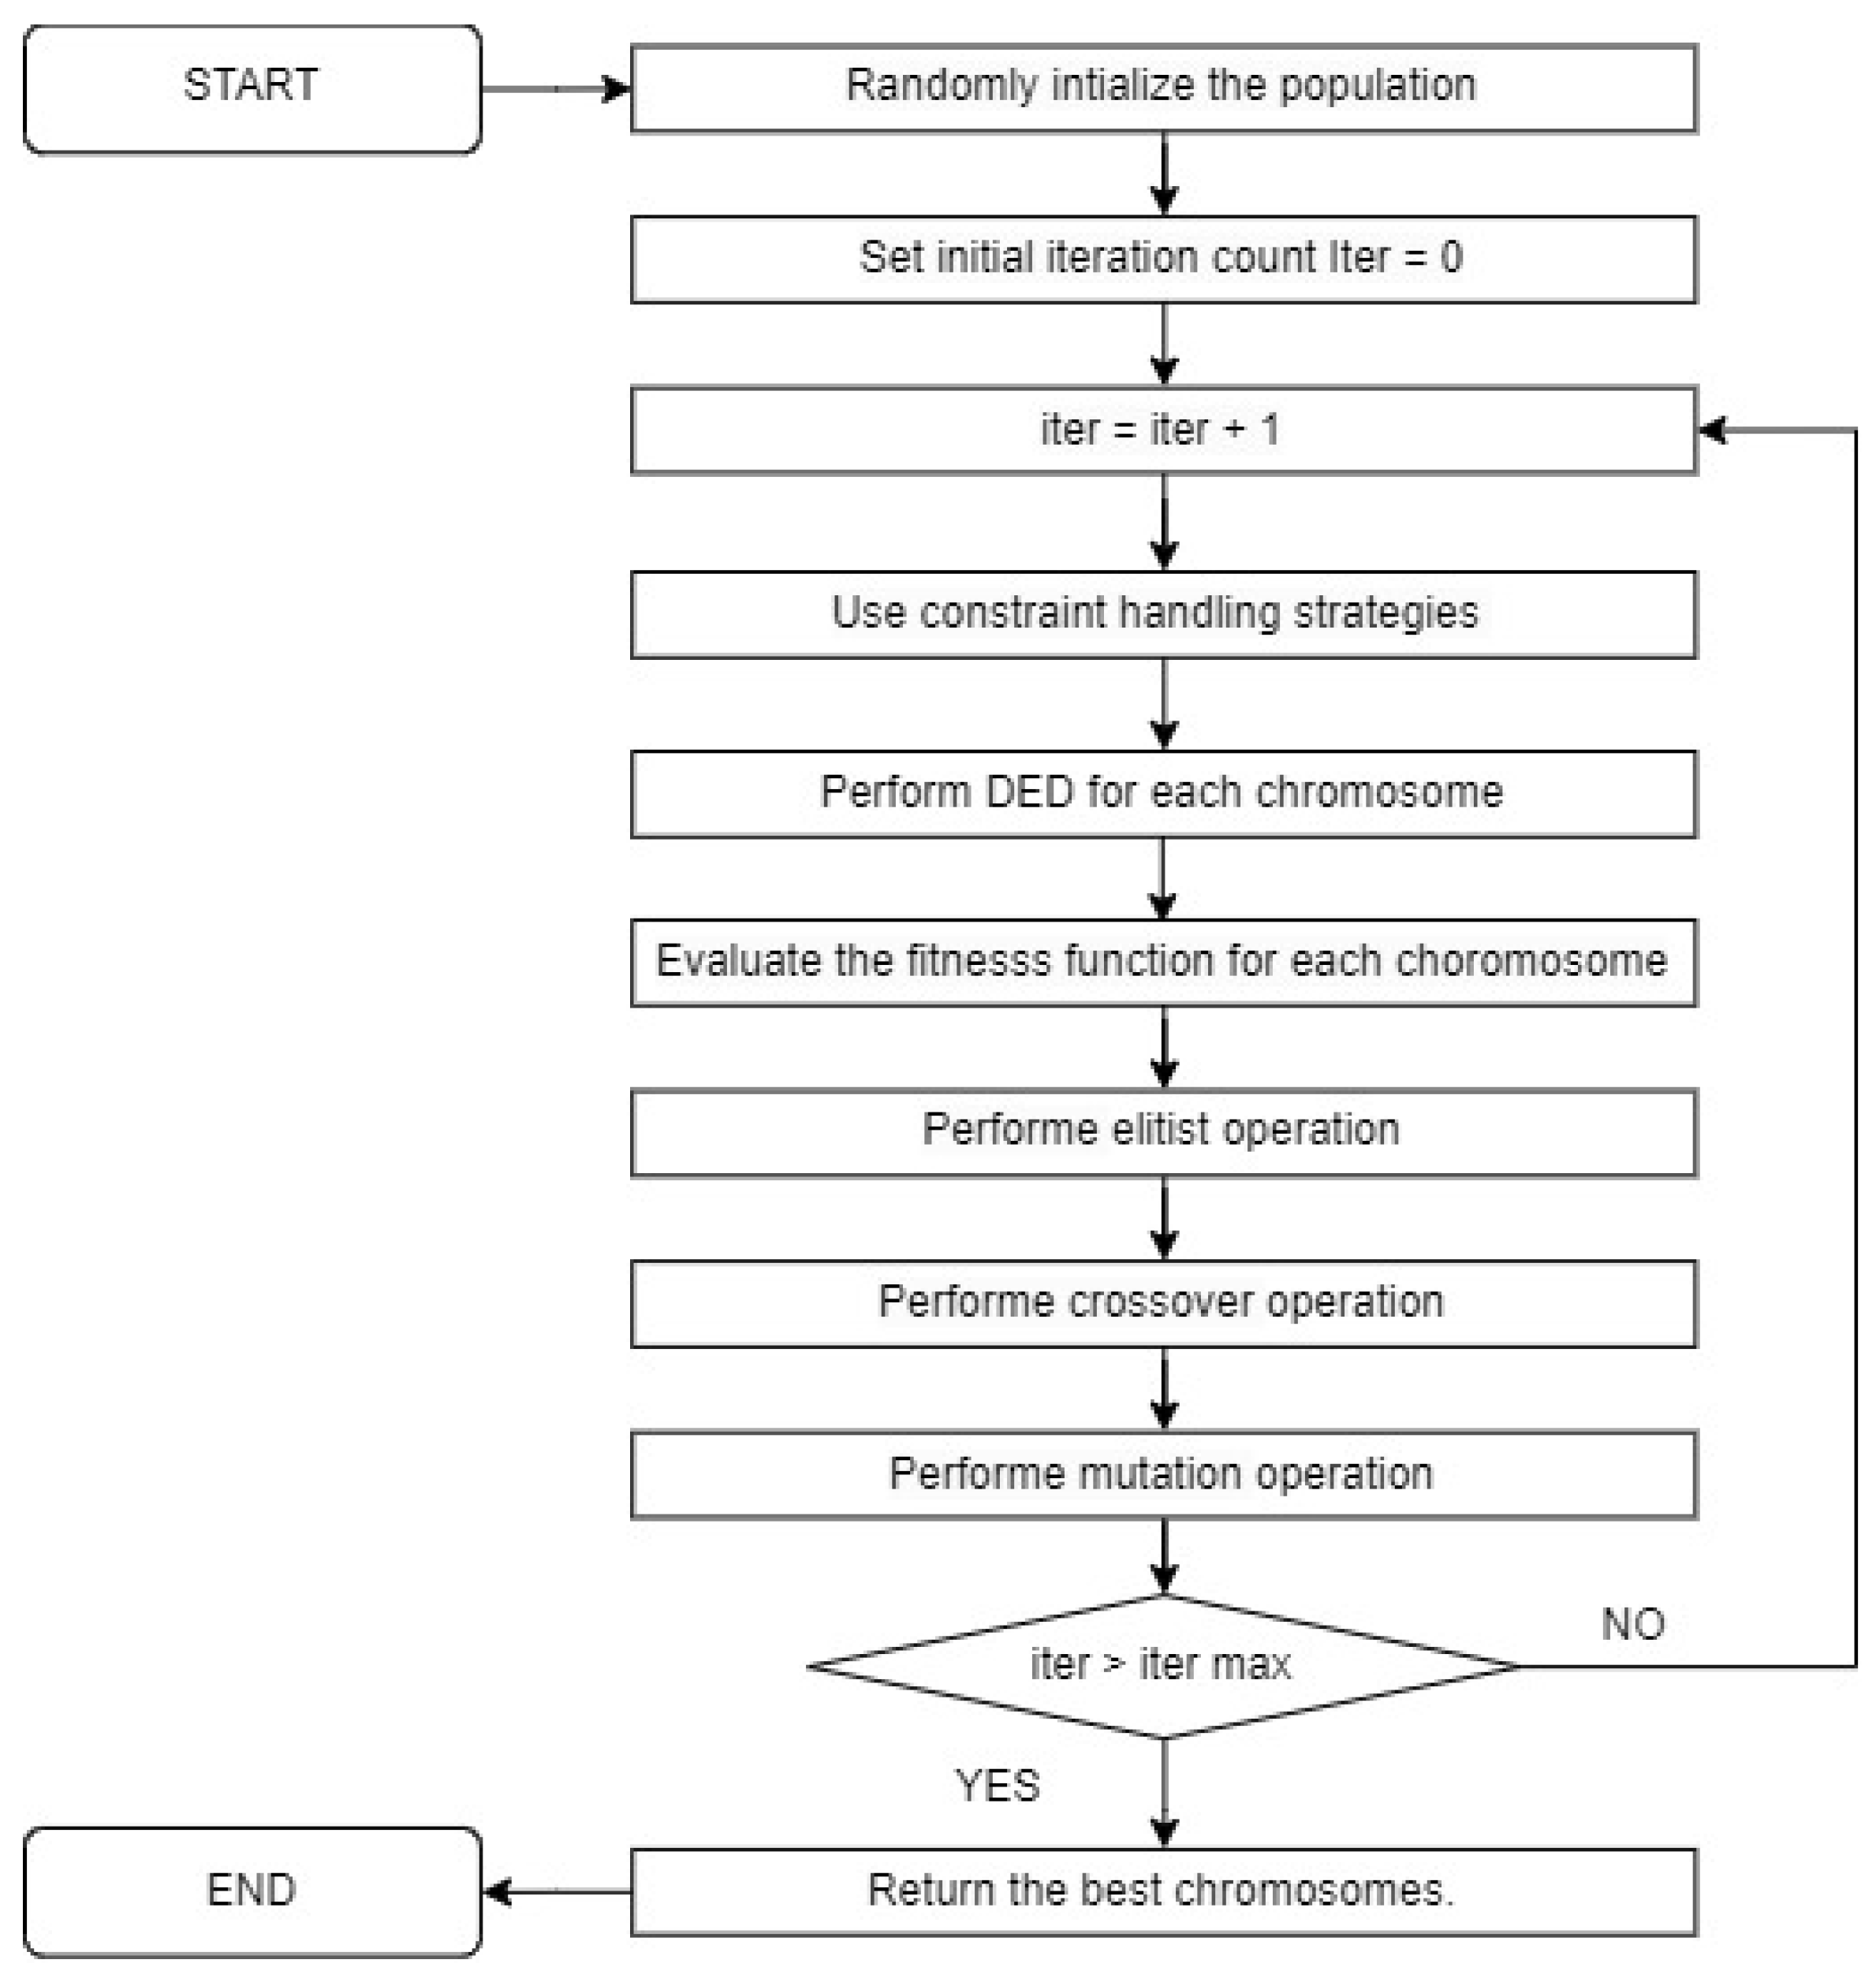
Figure 1. Flowchart methodology.
Energies 16 07751 g001
Figure 2. Amount of power produced or consumed by the CAES unit in Case II.
Energies 16 07751 g002
Figure 3. Quantity of energy stored in the CAES in Case II.
Energies 16 07751 g003
Figure 4. Amount of power produced by the CAES units in Case III.
Energies 16 07751 g004
Figure 5. Amount of power consumed by the CAES units in Case III.
Energies 16 07751 g005
Figure 6. Quantity of energy of energy stored in the CAES in Case III.
Energies 16 07751 g006
Figure 7. Convergence curve.
Energies 16 07751 g007
Table 1. Quantity of energy stored in the CAES in exemple.
Hour123456
A12.512.510.08.5- - -- - -
Table 2. Operating and cost parameters for thermoelectric generators.
Unit P t max
(MW)
P t min
(MW)
a t
($/MWh)
b t
($/MWh)
c t
($/MWh)
MUT t
(h)
MDT t
(h)
HSC t
($)
SCSC t
($)
TCO t
(h)
UIS t
1455150100016.190.00048884500900058
245515097017.260.0003188500010,00058
31302070016.600.002005555011004−5
41302068016.500.002115556011204−5
51622545019.700.003986690018004−6
6802037022.260.00712331703402−3
7852548027.740.00079332605200−3
8551066025.920.004131130600−1
9551066527.270.002221130600−1
10551067027.790.001731130600−1
Table 3. Parameters for CAESs units.
CAES A c max
(MWh)
A c min
(MWh)
V c inj , max
(MWh)
V c inj , min
(MWh)
V c rel , max
(MWh)
V c rel , min
(MWh)
ρ c inj ρ c rel A c i n i t i a l
(MWh)
150050055550.950.95250
210001000101010100.950.95100
32502502.52.52.52.50.950.95250
Table 4. Forecasted load and market price.
HourLoad
(MW)
Energy
Price
($/MWh)
HourLoad
(MW)
Energy
Price
($/MWh)
HourLoad
(MW)
Energy
Price
($/MWh)
HourLoad
(MW)
Energy
Price
($/MWh)
170022.157115022.5013(MW)24.6019120022.20
275022.008120022.1514130024.5020140022.65
385023.109130022.8015120022.5021130023.10
495022.6510140029.3516110022.3022110022.95
5100023.2511145030.1517105022.252390022.75
6110022.9512150031.6518100022.052480022.55
Table 5. Parameters adopted for the Genetic Algorithm.
Number of
Chromosomes
Number of
Iterations
Crossover
Rate
Mutate
Rate
Number of
Tournament Participants
Size of
the Elite
1005000.80.2510
Table 6. Operation scheduling for the conventional thermal units in Case I.
Hour P 1
(MW)
P 2
(MW)
P 3
(MW)
P 4
(MW)
P 5 P 10
(MW)
Fuel Cost
($)
Start Up
Cost ($)
Revenue from
Thermal Units ($)
1455.00245.0000013,683.13015,505.00
2408.75150.0000011,263.83012,292.50
3455.00250.0000013,770.20016,285.50
4455.00303.7500014,707.15017,185.69
5455.00313.7500014,881.66017,873.44
6455.00403.7500016,455.08019,708.31
7455.00363.7500015,755.16018,421.88
8455.00453.7500017,331.37020,128.81
9455.00455.0000017,353.30020,748.00
10455.00455.000107.50019,831.43112029,863.63
11455.00455.000102.50019,746.72030,526.88
12455.00455.000130.00020,213.96032,916.00
13455.00455.00097.50019,662.11024,784.50
14455.00397.50065.00018,107.07022,478.75
15455.00420.0000016,739.71019,687.50
16455.00306.2500014,750.77016,975.88
17455.00361.2500015,711.45018,161.56
18455.00256.2500013,879.05015,683.06
19455.00370.0000015,864.46018,315.00
20455.00455.0000017,353.30020,611.50
21455.00455.0000017,353.30021,021.00
22455.00341.2500015,361.90018,273.94
23455.00227.5000013,378.52015,526.88
24455.0000008,465.82010,260.25
Table 7. Operation scheduling for the conventional thermal units in Case II.
Hour P 1
(MW)
P 2
(MW)
P 3 P 10
(MW)
Fuel Cost
($)
Start Up
Cost ($)
Revenue from Thermal
Units ($)
1455.00297.63014,600.40016670.79
2370.12183.88011,212.25012,188.00
3455.00283.88014,360.60017,068.16
4455.00278.87014,273.20016,622.12
5455.00333.88015,233.18018,341.50
6455.00388.88016,194.80019,367.08
7455.00373.87015,932.12018,649.54
8455.00438.88017,070.63019,799.48
9455.00455.00017,353.30020,748.00
10455.00455.00017,353.30026,708.50
11455.00455.00017,353.30027,436.50
12455.00455.00017,353.30028,801.50
13455.00455.00017,353.30022,386.00
14455.00455.00017,353.30022,295.00
15455.00357.75015,650.26018,286.88
16455.00359.75015,685.23018,168.93
17455.00303.00014,694.06016,865.50
18455.00314.50014,894.75016,967.48
19455.00428.25016,884.27019,608.15
20455.00455.00017,353.30020,611.50
21455.00455.00017,353.30021,021.00
22455.00341.25015,361.90018,273.94
23455.00227.50013,378.52015,526.88
24455.00008465.82010,260.25
Table 8. Operation scheduling for the conventional thermal units in Case III.
Hour P 1
(MW)
P 2
(MW)
P 3 P 10
(MW)
Fuel Cost
($)
Start Up
Cost ($)
Revenue from
Thermal Units ($)
1455.00355.53015,611.39017,953.16
2341.25241.78011,741.91012,826.58
3455.00355.53015,611.39018,723.16
4455.00241.78013,627.00015,781.98
5455.00355.53015,611.39018,844.74
6455.00455.00017,353.30020,884.50
7455.00341.25015,361.90017,915.63
8455.00455.00017,353.30020,156.50
9455.00453.00017,318.22020,702.40
10455.00445.75017,191.06026,437.01
11455.00455.00017,353.30027,436.50
12455.00455.00017,353.30028,801.50
13455.00455.00017,353.30022,386.00
14455.00455.00017,353.30022,295.00
15455.00341.25015,361.90017,915.63
16455.00376.25015,973.78018,536.88
17455.00291.25014,489.09016,604.06
18455.00332.03015,200.77017,353.93
19455.00445.78017,191.52019,997.23
20455.00455.00017,353.30020,611.50
21455.00455.00017,353.30021,021.00
22455.00341.25015,361.90018,273.94
23455.00227.50013,378.52015,526.88
24455.00008465.82010,260.25
Table 9. Comparison of the Best Results Obtained in Each Case.
CaseBest Profit
($)
Total Generated
(MW)
Total Cost
($)
Comput. Time
(s)
I90,494.9819,725.00382,740.468.20
II95,343.5819,854.53384,358.1814.50
III102,813.8620,370.68397,666.9022.46
Disclaimer/Publisher’s Note: The statements, opinions and data contained in all publications are solely those of the individual author(s) and contributor(s) and not of MDPI and/or the editor(s). MDPI and/or the editor(s) disclaim responsibility for any injury to people or property resulting from any ideas, methods, instructions or products referred to in the content.