Article

Experimental Investigation of Thermal Properties of Frozen Tap, Demineralized, and Sea Water

by
Jelena Bošnjak
,
Mišo Jurčević
,
Natalia Bodrožić Ćoko
and
Sandro Nižetić
*
Faculty of Electrical Engineering, Mechanical Engineering, and Naval Architecture, University of Split, Ruđera Boškovića 32, 21000 Split, Croatia
*
Author to whom correspondence should be addressed.
Energies 2023, 16(23), 7745; https://doi.org/10.3390/en16237745
Submission received: 21 October 2023 / Revised: 21 November 2023 / Accepted: 22 November 2023 / Published: 24 November 2023
(This article belongs to the Section J: Thermal Management)

Abstract

:
This paper reports an experimental investigation of the thermal properties of frozen tap, demineralized, and sea water. The presented research assists in a better understanding of the thermal properties of ice and the processes within it and contributes regarding the generation of novel experimental data. The thermal conductivity was measured in a range from −14 °C to −33 °C using the Transient Plane Source (TPS) method. Ice blocks were placed in an expanded polystyrene box in the freezer, which is where the measurements took place. The thermal conductivity of the tap water ice was observed to vary in a range from 1.915 ± 0.005 Wm−1K−1 at −14 °C to 2.060 ± 0.004 Wm−1K−1 at −33 °C. The values obtained for the ice made of demineralized water differed by less than 10%. The thermal conductivity of the sea ice was shown to be more temperature dependent, with the values ranging from 1.262 ± 0.005 Wm−1K−1 at −14 °C to 1.970 Wm−1K−1 ± 0.004 at −33 °C. A noticeable fall in the thermal conductivity of the sea ice was observed in the temperature range from −26 °C to −19 °C. A possible reason for this could be the increased precipitation of salt in that temperature range. Measurements of thermal diffusivity displayed similar trends as those of thermal conductivity. Specific volumetric heat capacity was indirectly calculated.

1. Introduction

Water is the most common compound and source of life on Earth. It is of immeasurable importance in all aggregate states. Solid H2O has been used for food preservation and cooling purposes for centuries. Nowadays, there is a growing interest in exploring the usage of ice in a wide range of engineering applications. Cold energy storage systems have shown great potential in improving the efficiency of refrigeration systems. Several researchers have explored the potential of ice slurry for thermal energy storage (TES) [1,2,3] and have experimentally examined the usage of ice for cold food storage [4] as well as in an alternative Allam cycle for power generation [5]. Experimental integration of hybrid solar powered cooling systems with ice in office buildings has been found to reduce the annual energy consumption by 38%, with a 40% reduction in CO2 emissions [6]. The focus of recent research is also on the enhancements of ice TES systems that use a three-fluid heat exchange module [7], aligned carbon nanotubes under an external magnetic field [8], and different heat source positions and configurations to increase the system’s performance [9,10]. Withal, knowledge about the thermal properties of pure and sea ice is very important in the view of the current climate crisis.
However, while thermal constants of liquid water have been well established, there are a lack of measurements in the literature when it comes to ice. Data are not readily available but need to be deduced from different mathematical models. Thermal properties of pure ice have been investigated since the beginning of the 20th century. Based on the data provided in [11], by 1958, only seven examinations of the thermal conductivity of ice had been undertaken compared with thirty-four for water. The first examination of the thermal conductivity of ice was performed by Lees [12], who examined the frozen distilled water in the range from −186 °C to −16 °C by using wire heaters and resistance thermometers in glass tubes placed within the specimen. Jakob and Erk [13] obtained results that differed significantly from those of Lees, particularly in temperature ranges below −100 °C where the divergence was above 20%. At the time, the International Critical Tables contained two values given by Schofield and Hall [14] and Van Dusen [15] for the thermal conductivity of ice at 0 °C that differed by 5%. Similar to the work of Lees [12], the steady-state method was employed by Ratcliffe [16], who measured the temperature gradient with thermocouples placed in in drilled holes in the specimen. His results have shown the work of Lees [12] to be unsubstantiated, as Ratcliffe’s values were lower by a factor of two compared to Lees’. Yen [17] summarized the measurements of the polycrystalline ice and expressed the thermal conductivity of ice as a function of temperature for the range from 0 °C to −233 °C. Fukusako [18] presented a similar review, with additions to the thermal conductivity data measured by Klinger regarding extremely low temperatures. All data presented above were measured by employing different methods that always included an artefact without a standard to rely on. The obtained results were scattered, especially in lower temperature ranges. The discrepancies in the data were due to different measuring techniques and conditions but also different sample purity and preparation methods. Precise measurements of the thermal properties of pure ice have not been common recently. In the last few decades, the thermal properties of ice have been examined in a few papers, mostly for food engineering, such as [19], where the thermal conductivity of ice prepared under different conditions was measured using a steady-state method. Consequently, there is still disagreement among the values of the thermal properties of pure ice in the literature.
There are even less data about the thermal properties of sea ice, as it is more complicated to measure than pure ice due to the occurrence of the brine. According to [20], relatively few measurements of sea ice have been reported despite its importance in ice growth and climate models, which still rely on values that are theoretical predictions. Yen [17] gave no exact numbers on the conductivity of sea ice but rather an approximated conductivity expression for temperatures of only up to −8 °C. A comparison of several measurements presented by Fukusako [18] indicated that, unlike with pure ice, deviations of measured values occur mostly in the higher-temperature regions from 0 °C to −30 °C.
The scattering of measurement results significantly affects possible engineering applications, which are particularly important in the design phase and exploitation of the machines. Therefore, engineers in the development phase must have credible thermal properties so that the effects on performance due to water freezing can be predicted and nullified. This is particularly important in aviation [21], road traffic [22], and energy production and transport, such as wind turbines [23] and transmission lines [24]. The freezing problem also appears in newer-energy power devices, such as proton exchange membrane fuel cells (PEMFC) [25]. Furthermore, certain latent heat storage systems are based on ice storage, where liquefaction rate, temperature distribution, and heat transfer coefficient stand out as important, influential factors during the phase change [26]. Evidently, the thermal properties of ice are very important for understanding the experimental results and for the numerical modelling [27] of cold energy retrieval. Thermal energy storage systems based on ice have a relatively low efficiency, so nanomaterials can be added to improve the thermal conductivity and diffusivity [28], where the increase in diffusivity is particularly limited by the stability of the nanomaterials in PCM. By adding nanomaterials, it is possible to manipulate the thermal properties of ice and PCMs in general [27]. Hence, for the manipulation to be successful, it is necessary to comprehend the thermal properties of ice at low temperatures.
The main motivation and necessity for the experimental work conducted herein is to update and expand insufficient and inconsistent data about the thermal properties of various water samples and to compare ice composed of different kinds of water. The research conducted so far in the field has been shown to be unreliable, as the measurements contained artefacts and were performed in insufficiently controlled conditions. Moreover, previous measurements have not been statistically analyzed, and it is not possible to ascertain the statistical reliability of the presented values. In this paper, the thermal properties of ice were measured by employing state-of-the-art equipment in stable conditions, which provides a basis for obtaining reliable values. Experimental investigations of frozen tap water, demineralized water, and sea water were undertaken using a non-steady-state Transient Plane Source (TPS) technique based on the ISO standard [29]. Two pairs of identical samples were made for each water type, and four measurements were taken at each temperature, after which the final value was computed with statistical reliability. The dependence of thermal conductivity on temperature is shown for all examined types of water. Subsequently, trends were analyzed and compared. The study provides a valuable source of data and a useful base for predicting the behavior of the thermal conductivity of different types of ice.
The main objective of the work was to provide novel, reliable data about the thermal conductivity, diffusivity, and specific volumetric heat capacity of frozen tap, demineralized, and sea water. The experimental data generated herein could be used in a wide range of research investigations related to the application of ice in engineering. However, it is important to underline the research limitations when thinking about the general applications of the presented data because of the uniqueness of the examined samples. All the samples, especially the sea and tap water, have specific chemical compositions considering the place, time of the year, and other conditions present when the sampling was performed.

2. Experimental Approach

2.1. Measurement Technique

Thermal constants can be measured with steady-state and non-steady-state techniques. Steady-state methods include measurements in which the sample temperature does not change with time, which implies the signal is constant, while in non-steady-state methods, the signal is a function of time. Measurements in this work were performed using the non-steady-state TPS method that was developed by Gustafsson [30] and advanced by Bohač et al. [31]. The method is in accordance with and precisely described in the ISO 22007-2 standard [32]. To perform direct measurements, a sensor that contains a heater is required to supply a steady source of heat that is transferred into the sample. The growth of an average temperature sensor is dependent on the sensor diameter, the general properties of the specimen material, the number of concentric rings, and the input heat. Based on the temperature function, thermal constants, namely thermal conductivity and thermal diffusivity, can be precisely assessed [33]. It was suggested by Gustafsson [30] that the first couple of seconds of the measurement should be dismissed because of the existence of insulation on the sensor. Taking this into consideration, in this research, the measurements were undertaken through polyethylene (PE) bags containing the examined materials. PE bags were used to simplify sample preparation and protect both the sample and the sensor. The measurements were performed using a Kapton 5501 sensor with a 6.4 mm radius and a double-spiral shape, Figure 1 The sensor is insulated with Kapton insulation so that it can withstand temperatures from −269 °C to 400 °C [34]. Thermal constants were measured by using the Hot Disk TPS 500 S device from Hot Disk AB, Göteborg, Sweden. This device can measure thermal conductivity on a scale from 0.005 Wm−1K−1 to 1800 Wm−1K−1 [29]. The data obtained were subsequently processed with the Hot Disk Thermal Constants Analyzer 7.4 Beta 24 software.

2.2. Measurement Uncertainty

When measuring thermal conductivity, Hot Disk TPS 500 S devices nominally provide an accuracy of ±5% and a reproducibility of ±2% for materials of diverse thermal conductivities [29]. For each type of water, two pairs of specimens were made. Each pair was examined several times, after which four measurements were selected and the average was calculated. The standard deviation for population (STDEVP) was calculated in Excel for each measurement process and then combined for each type of water as:
S T D E V P = S T D E V P 1   2 + S T D E V P 2   2
The standard deviations for the measurements of thermal conductivity and thermal diffusivity were calculated to be between 0.008 Wm−1K−1 and 0.026 Wm−1K−1 and between 0.007 mm2s−1 and 0.050 mm2s−1, respectively, while the calculated volumetric specific heat capacity deviation values were higher, varying from 0.007 MJm−3K−1 to 0.168 MJm−3K−1.
To find the confidence interval, the margin of error (ME) was calculated for each type of water for the two populations that represented two pairs of samples. The z-score for a 95% confidence interval is Z = 1.96. Thus, the values of ME were obtained with the equation:
M E = Z n 1 1 S T D E V P 1 2 + n 2 1 S T D E V P 2 2 n 1 + n 2 2 1 n 1 + 1 n 2   ,  
where n 1 and n 2 represent the total number of samplings in the first and second measurement processes, respectively.
To measure the specimens’ temperatures, a K-type thermocouple with Class 1 accuracy [35] and the Pico TC-08 data logger from 2023 Pico Technology Ltd., Cambridgeshire, United Kingdom, [36] were used. The calculation of the uncertainty of the temperature measurements was as follows [33]:
Δ U = ± Δ U t 2 + Δ U t c 2 ,
The measurement uncertainty of the K-type thermocouples is ±1.5 °C ( Δ U c ), and for the mentioned data logger, the uncertainty is ±0.5 °C ( Δ U t c ). The total measurement uncertainty equals ±1.58 °C.

2.3. Sample Preparation and Examination Procedure

In this research, specimens were selected and made of frozen tap water, demineralized water, and sea water. Tap water was taken from the public water supply from Jadro spring in the city of Split, Croatia. Although the exact chemical composition of the tap water sample is unknown, it is stated that tap water from the public supply is of the calcium-bicarbonate type, contains relatively little volatile residue, has low mineralization, and has a low total (119–123 mgCaOL−1) hardness [37]. To examine properties of frozen demineralized water, the commercially available water Blix, manufactured by Adriatik ulja d.o.o. from Zagreb, Croatia, was used. Sea water was collected from the Adriatic sea at Žnjan beach in Split, and the municipality of Preko on the island of Ugljan was used for the repeated measurements. It is known that in recent years, the salinity of the Adriatic sea is growing, with the measured value of the surface salinity around 39‰ [38].
To perform the measurements, the samples had to be frozen first. During the freezing process, specimens in a liquid state tend to deform under the influence of gravity. This was necessary to ensure a uniform shape of the specimens, as well as a smooth surface and an appropriate thickness. To make adequate ice samples, an aluminum mold for the specimens’ formation was designed. Four holes were drilled on each corner of the mold with screws to regulate the thickness of the specimens and allow contraction, which ensures a flat surface, Figure 2.
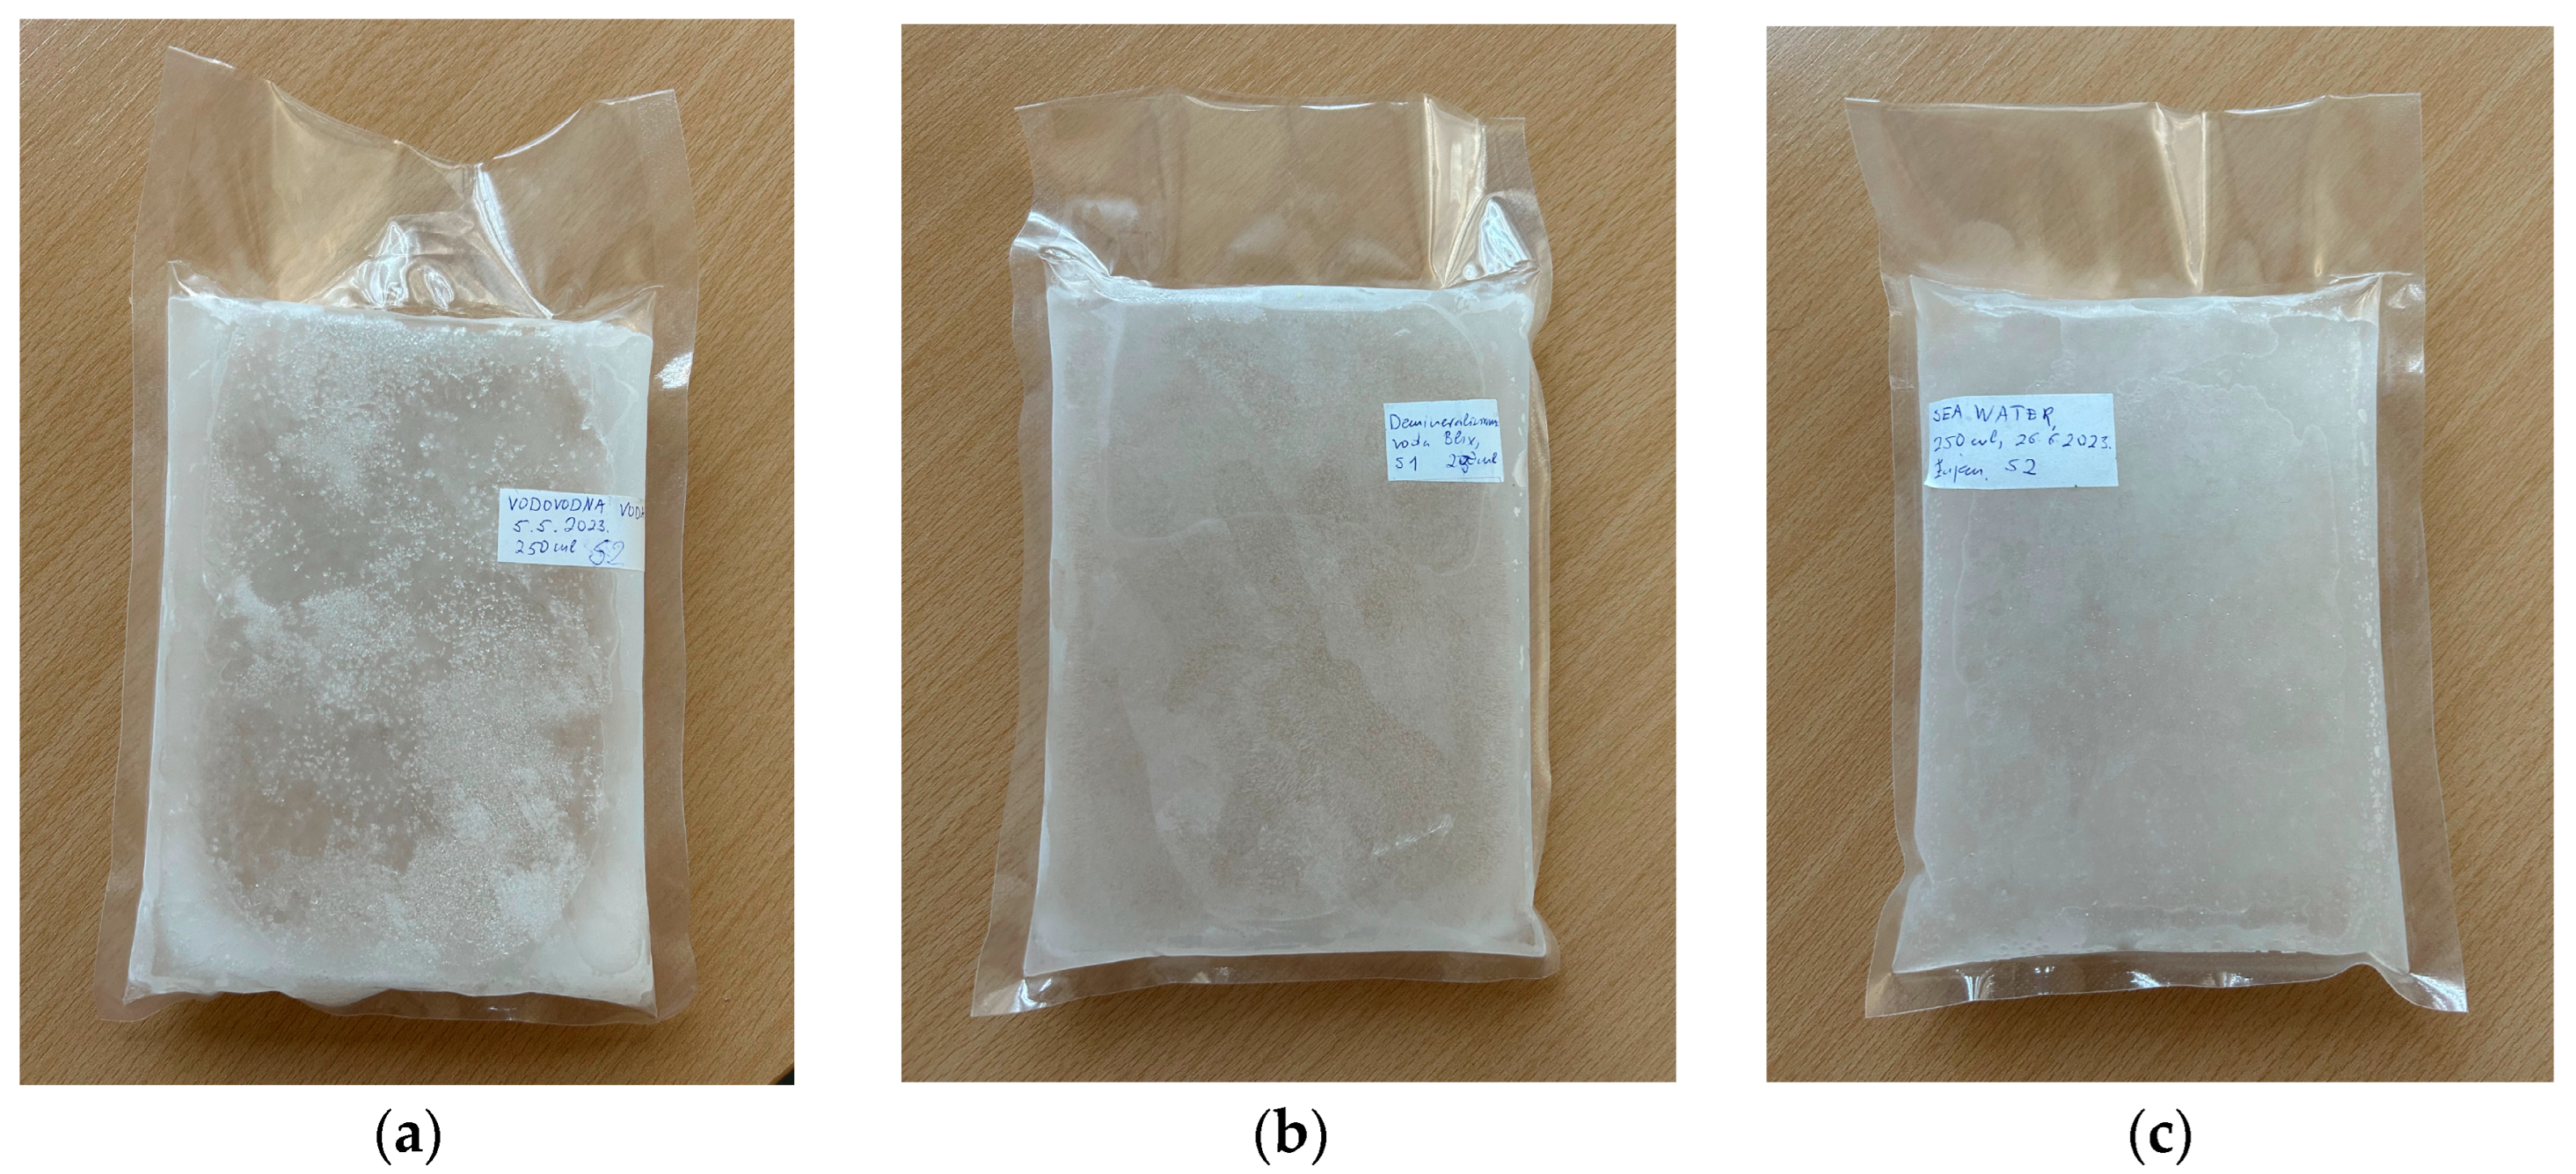
A total of 250 mL of each type of water were carefully poured into a PE bag and sealed with a heat seal machine. For each measurement, two equal specimens were made. Subsequently, the specimens were settled in a mold, which was then placed in the freezer for a minimum of 24 h. The mold was placed in a vertical position to allow the remaining air bubbles to drain at the top of the bags. After the freezing process, specimens were carefully taken out of the mold and swiftly positioned in the sample-positioning device. All specimens were 20 mm thick in the central part where the measurements were performed. Differences between the samples were noticed, as the sea water ice was completely cloudy, Figure 3c, while the frozen tap water was the most transparent, Figure 3a. Specimens made of frozen demineralized water turned out to be different, with one being as cloudy as the sea water ice and the others mostly clear, Figure 3b.
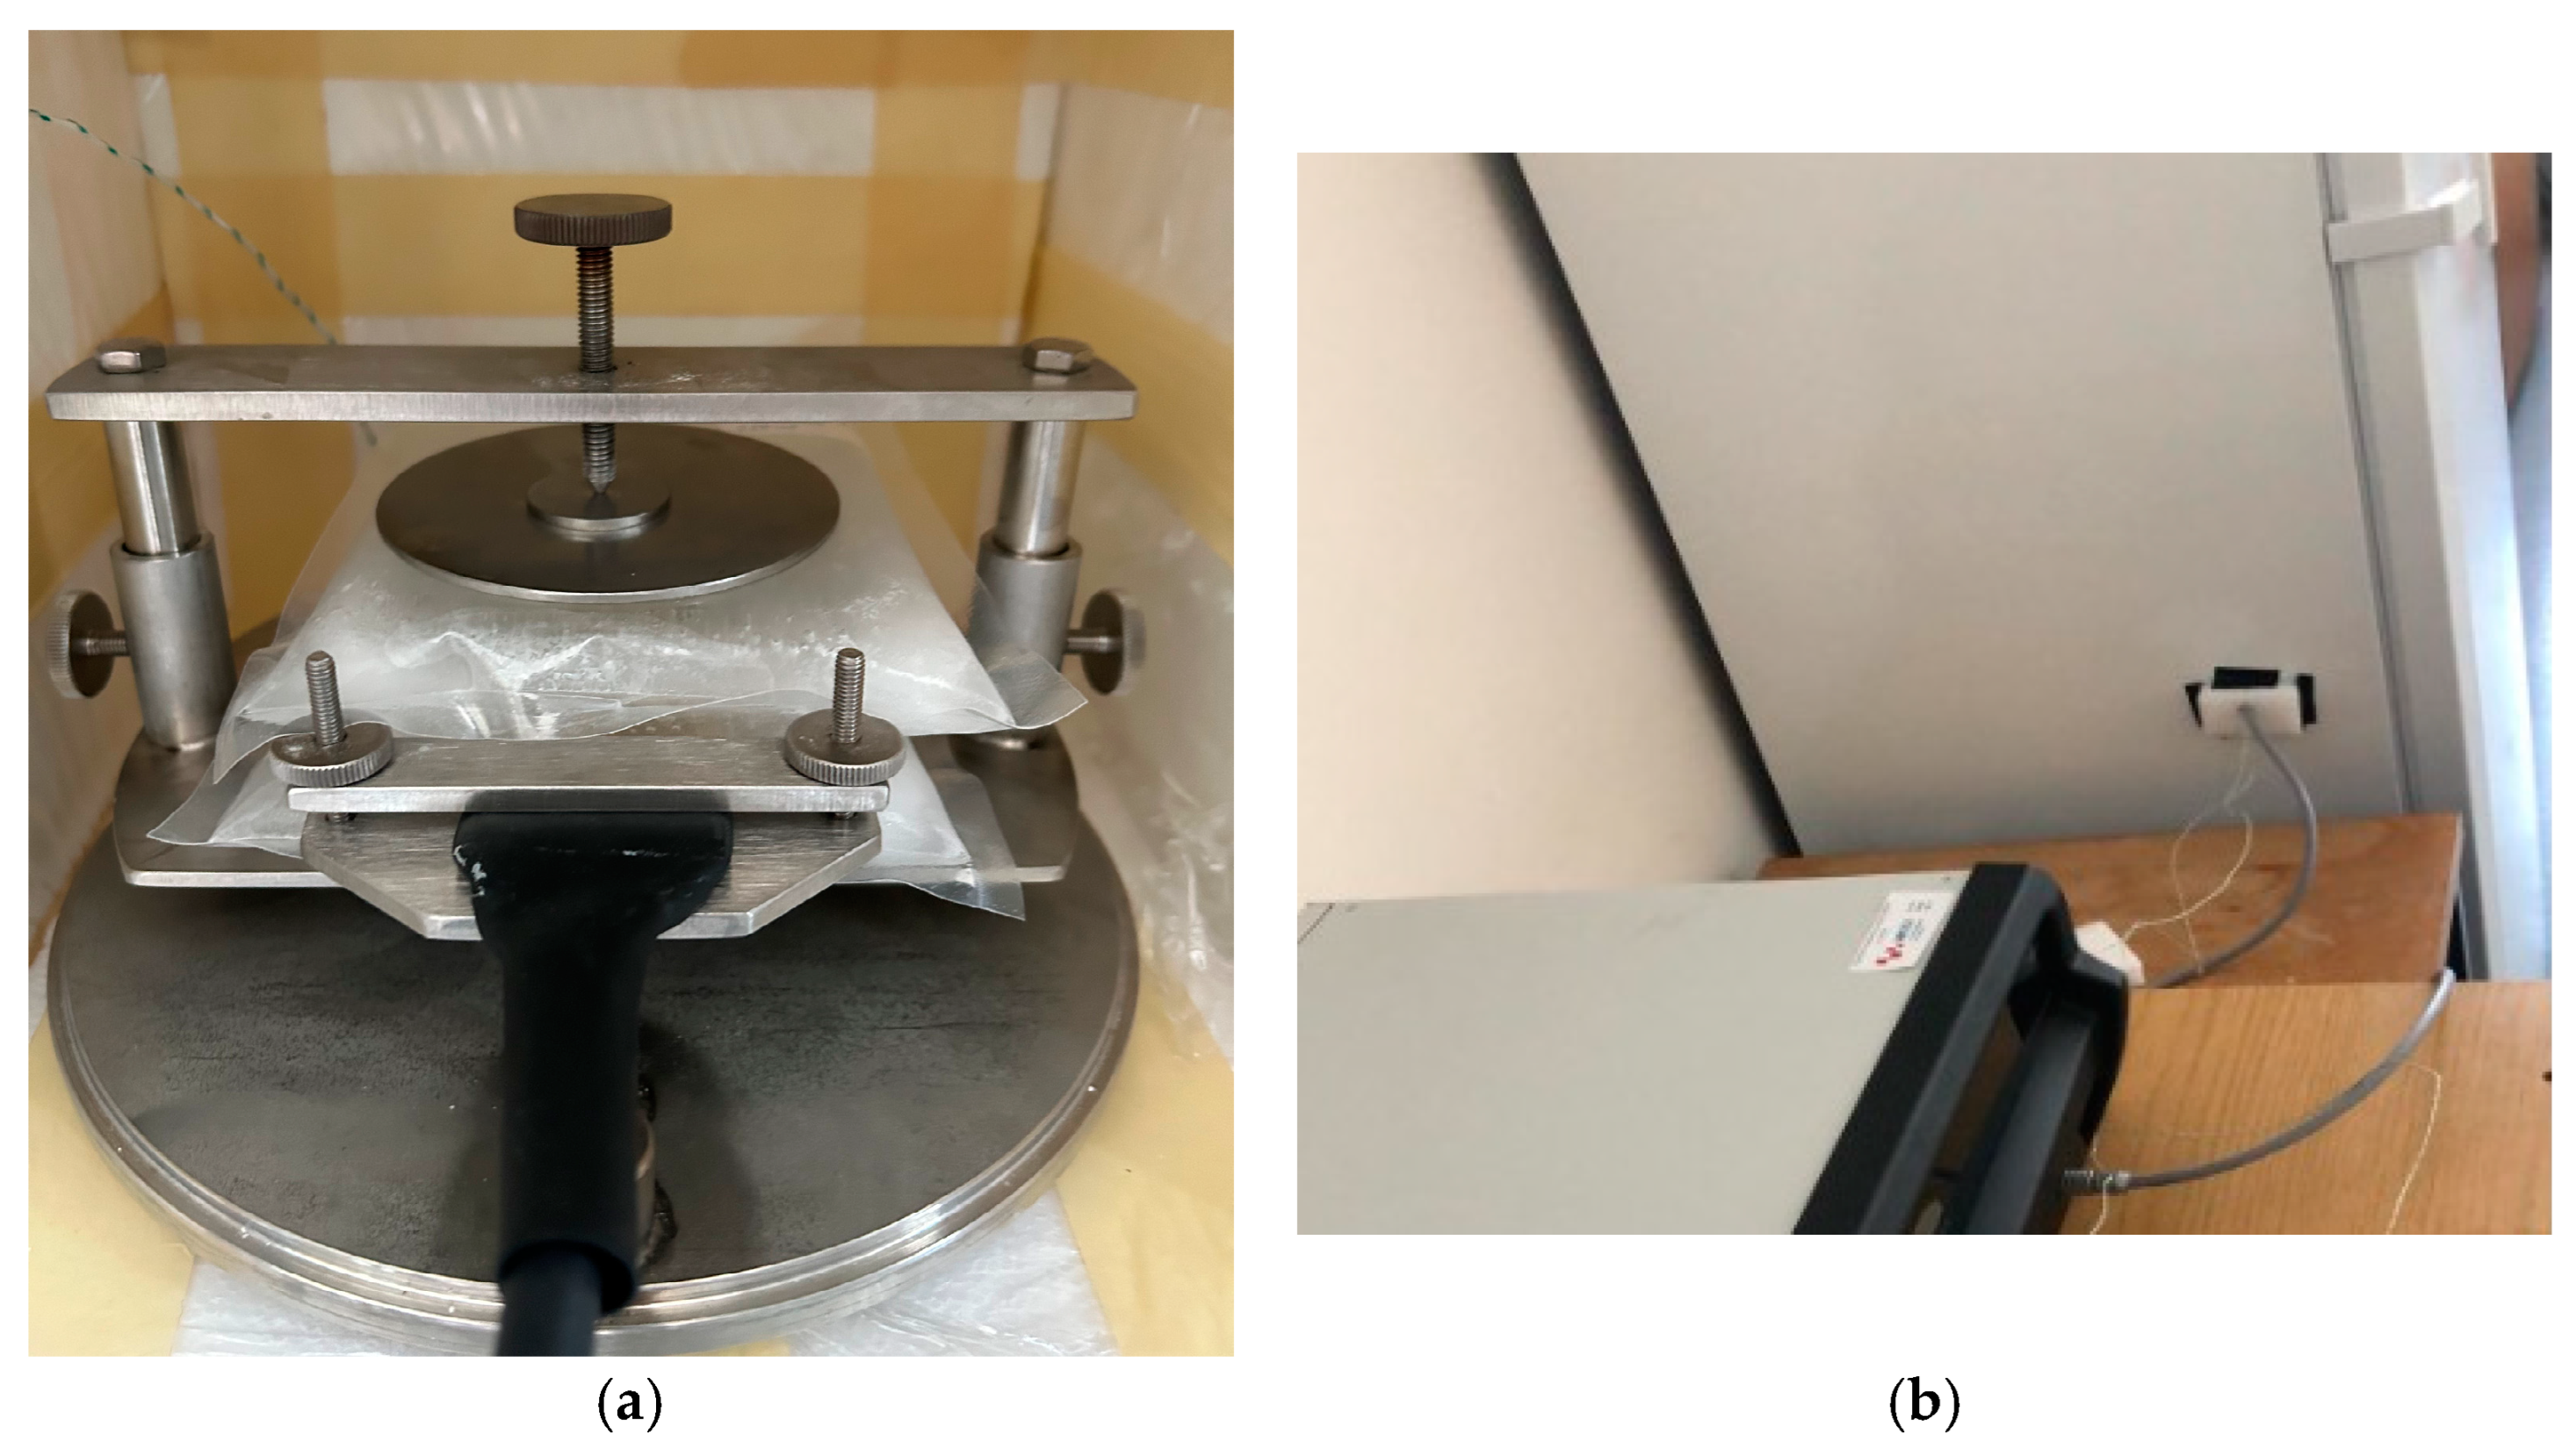
To perform the measurements, a Kapton 5501 sensor from Hot Disk AB, Göteborg, Sweden, was attentively placed between the central contact surfaces of the ice specimens, after which the whole device was put in a polystyrene (EPS) box in the freezer, Figure 4a. The box ensured a more stable temperature during the examinations. As measurements took place in the freezer, it was necessary to drill a hole through which a sensor cable was routed and connected to the device for measuring the thermal constants using the Hot Disk Thermal Constants Analyzer, from Hot Disk AB, Göteborg, Sweden, Figure 4b. The hole was then partially closed and isolated with the EPS and duct tape.
Testing was performed in a range from −14 °C to −33 °C. Four tests were conducted on two different pairs of samples for each type of water at five temperature levels: −14 °C, −19 °C, −26 °C, −30 °C, and −33 °C. The measurements were performed under atmospheric pressure. During the examination, two thermal K-type sensors were connected to the Pico TC-08 data logger to measure the temperature of the specimens.
When initiating the examination process, it was necessary to determine the measurement parameters. The parameters depend on material type and specimen thickness. The key parameters shown in Table 1 were tuned iteratively using the Hot Disk Thermal Constants Analyzer 7.4 (Beta 24 software) while ensuring that the heating power was small enough to avoid the overheating of the sophisticated sensor. The parameters remained the same for all the temperatures of the tested samples. The Hot Disk Thermal Constants Analyzer TPS 500 S directly measures thermal conductivity and thermal diffusivity, while specific volumetric heat capacity is indirectly calculated.
After the measurement process was finished, it was important to evaluate the data with respect to the Hot Disk features, i.e., the temperature drift and the residual. The temperature drift showed fluctuations in the sample temperature during the examination. The measurements that demonstrated significant temperature oscillations were disregarded. The residual graph represents the difference between the measured and fitted data. The measurements that did not have uniformly scattered residual values were neglected. In all measurements, the first 20% of the results, or 40 out of the 200 measured values, were discarded due to the existence of PE bags between the sensor and the examined material.

3. Results and Discussion

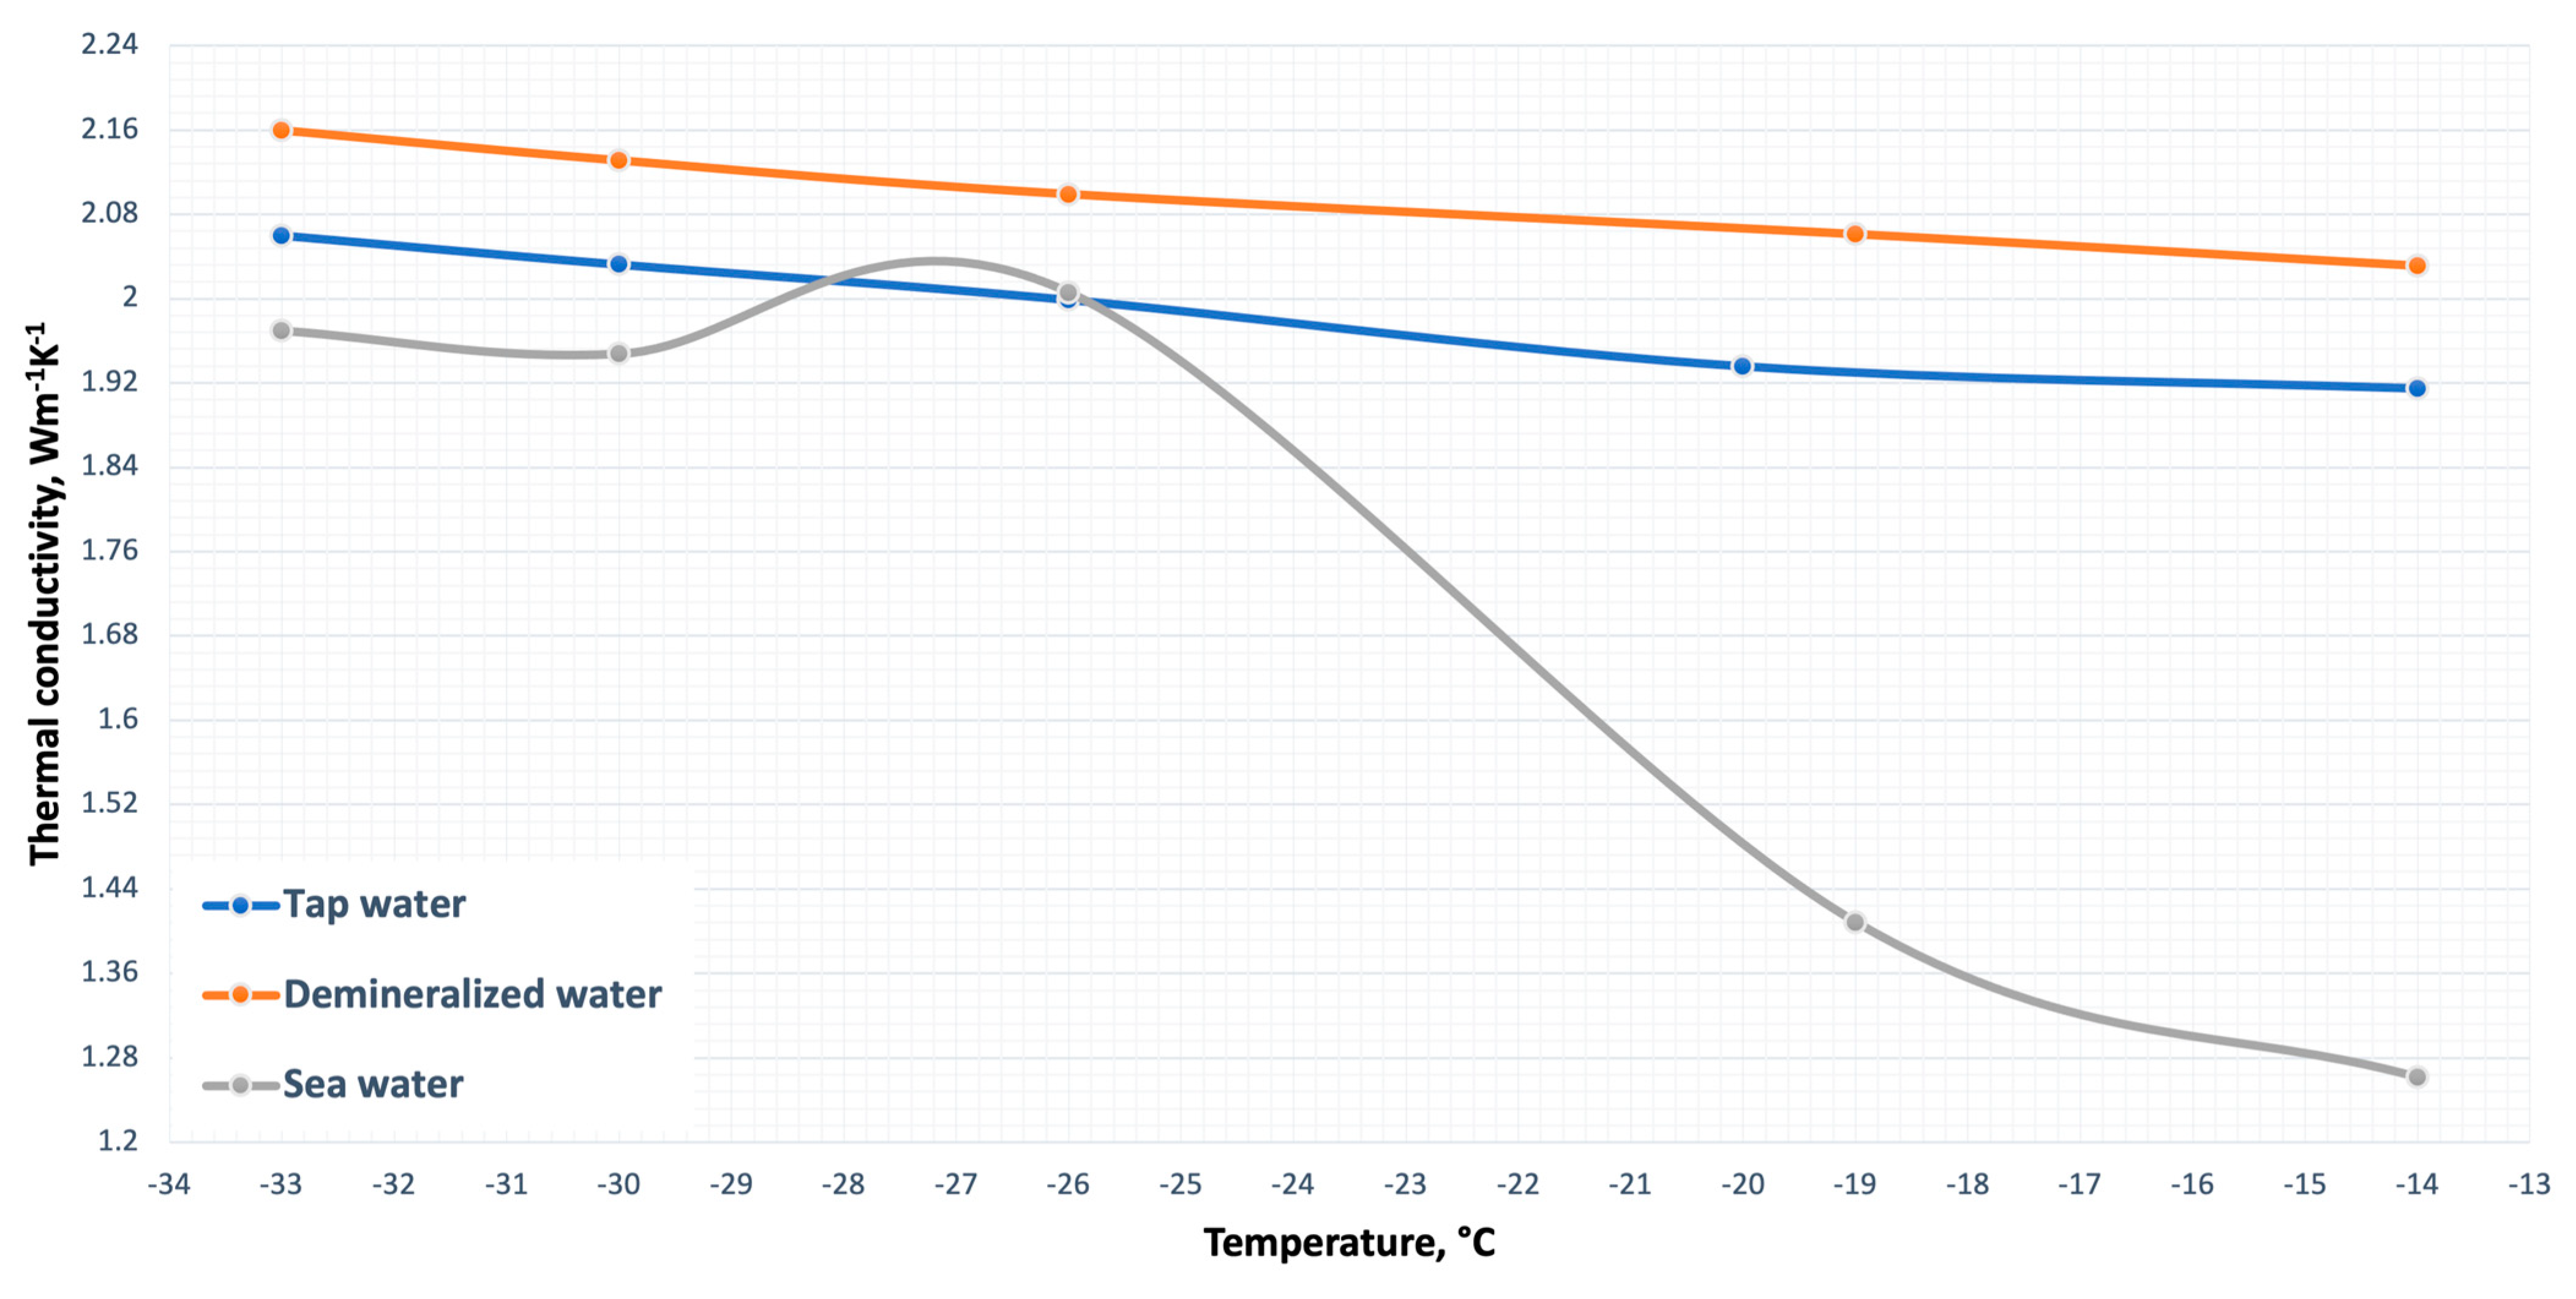
Experimental investigations of thermal conductivity, thermal diffusivity, and volumetric specific heat capacity were performed four times on each of the two pairs of samples, frozen tap water, demineralized water, and sea water, at each of five temperature levels. After validating the results, the arithmetic mean along with standard deviation and margin of error were obtained for each measurement, Figure 5.
As was expected due to its purer composition, the highest value for thermal conductivity was obtained for the frozen demineralized water at −33 °C, and it equaled 2.160 ± 0.007 Wm−1K−1. The thermal conductivity of all samples showed a negative correlation with temperature. In the case of the ice made of tap water, the measured values varied from 1.915 ± 0.005 Wm−1K−1 at −14 °C to 2.060 ± 0.004 Wm−1K−1 at −33 °C. The frozen sea water exhibited the lowest thermal conductivity and highest temperature dependence, with values ranging from 1.262 ± 0.005 Wm−1K−1 at −14 °C to 1.970 ± 0.010 Wm−1K−1 at −33 °C. When our measurements of thermal conductivity were compared to the previously conducted measurements of pure ice summarized by Fukusako [18], Figure 6, it was observed that Fukusako’s values were not consistent with the findings from the research conducted herein. The trend curve derived from past measurements is steeper than the resulting curves of this study in the examined temperature range.
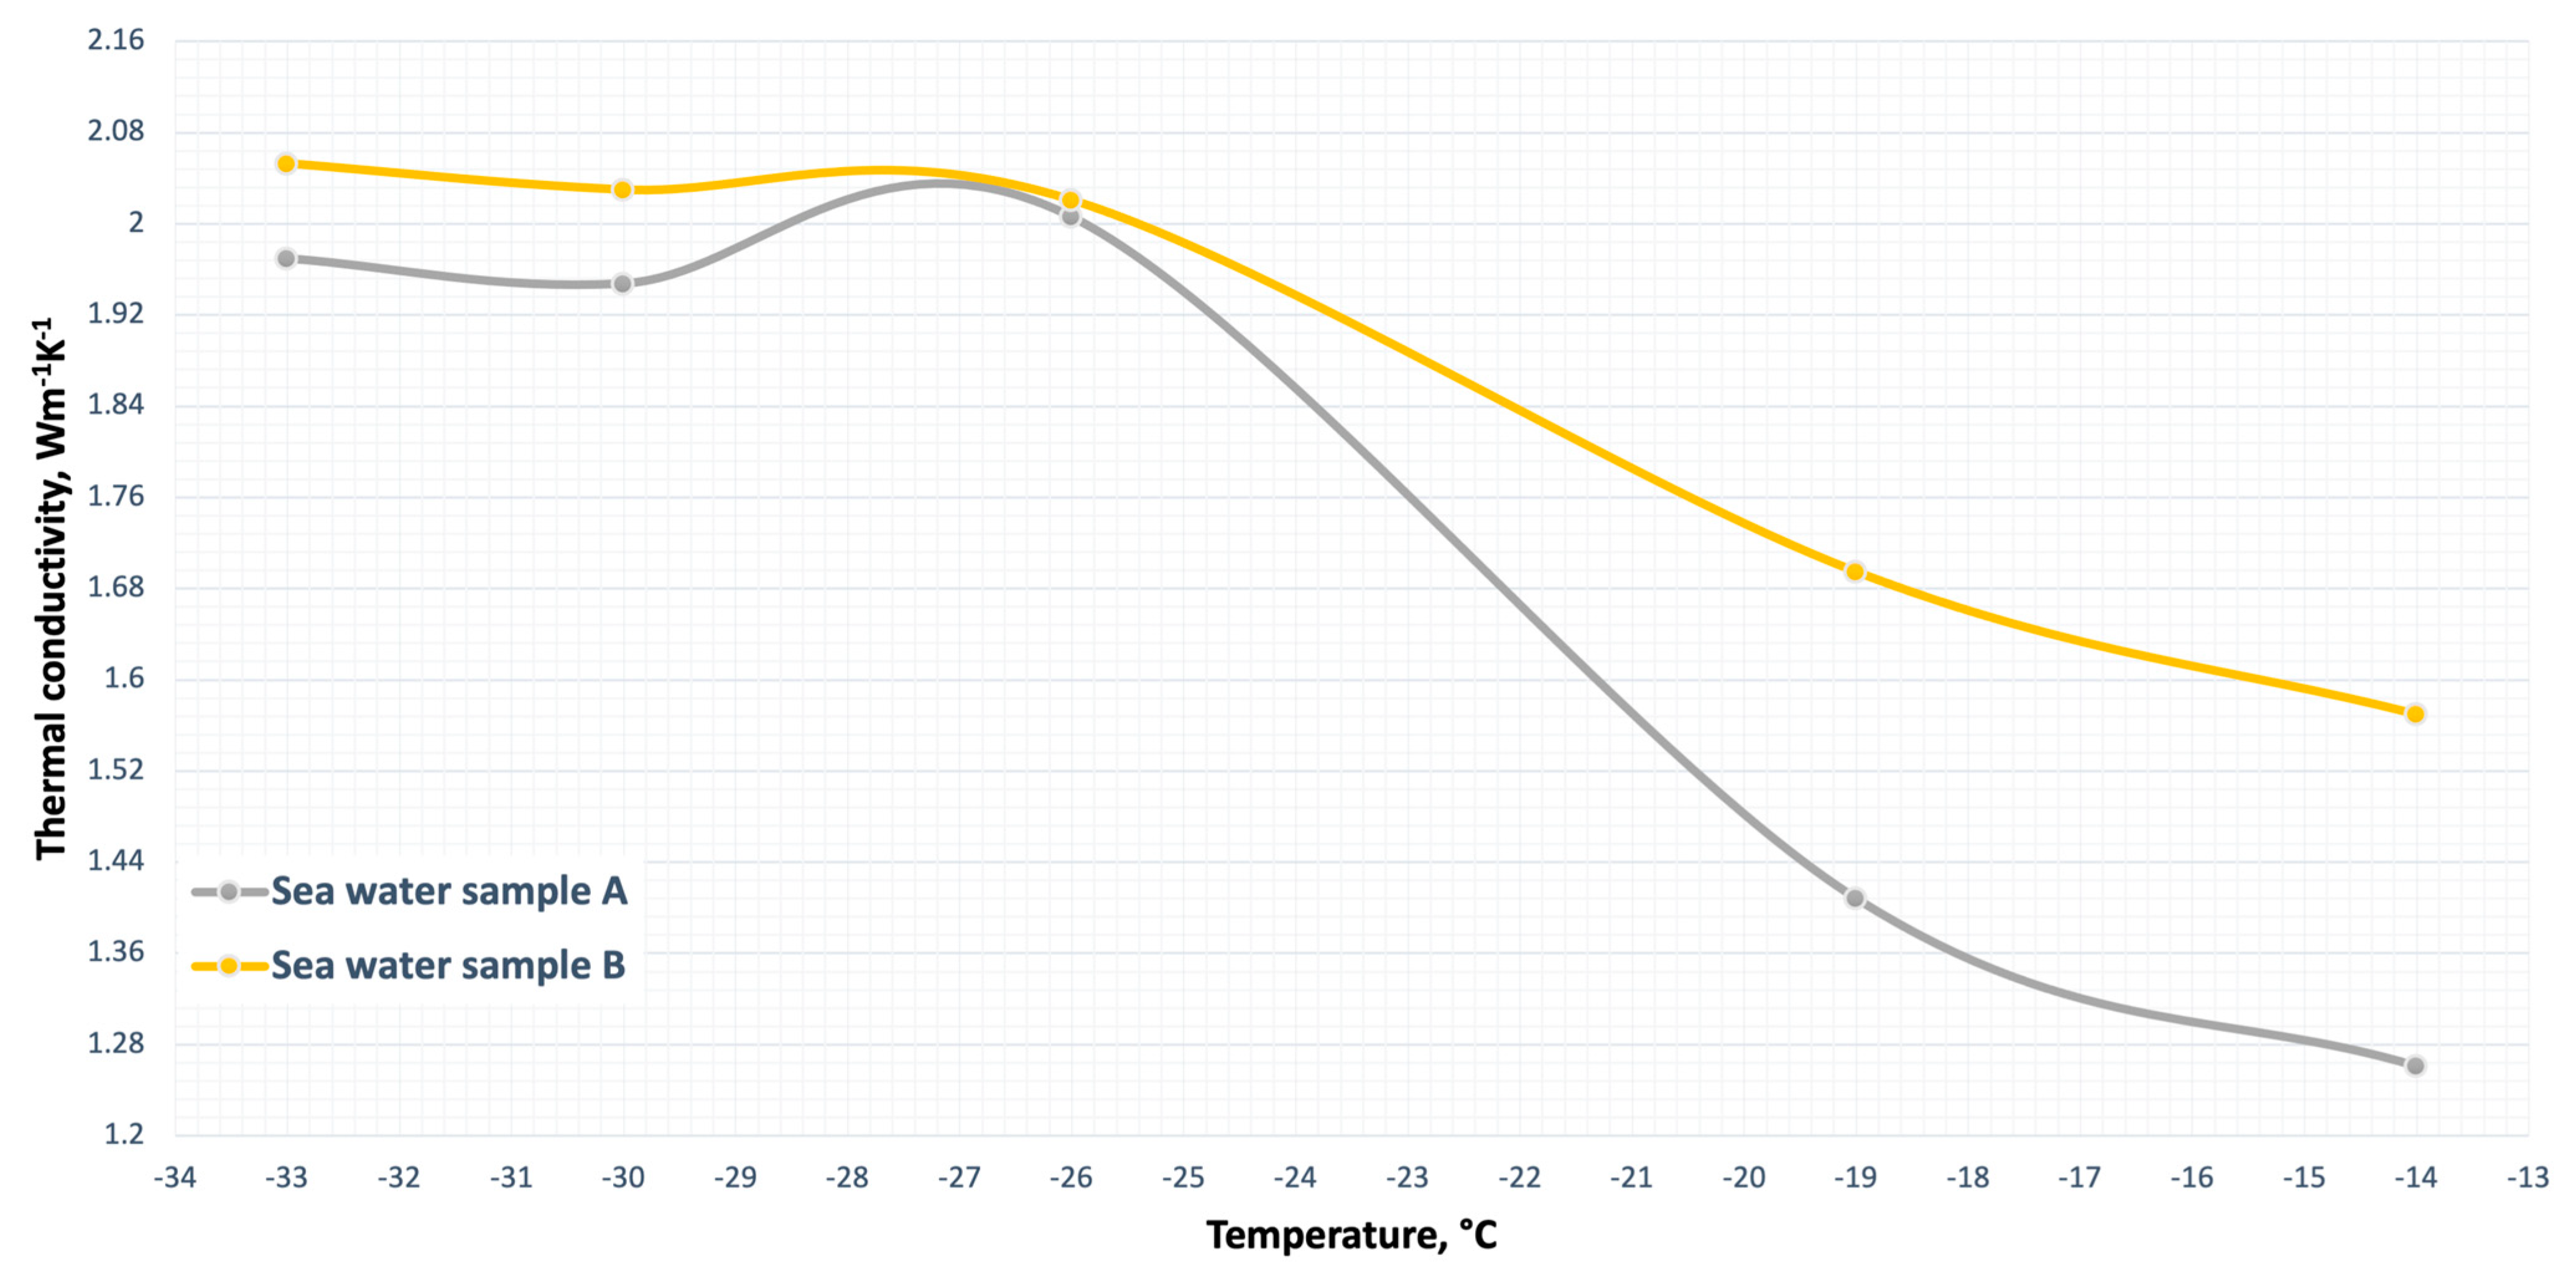
In the temperature range from −26 °C to −19 °C, a noticeable fall in the thermal conductivity of the frozen sea ice was observed. To be certain about the noticed trend, the examination was repeated with a different sample (sample B), and a similar trend was exhibited but on a smaller scale, Figure 7. The thermal conductivity of the sample A sea water ranged from 2.006 ± 0.010 Wm−1K−1 at −26 °C to 1.409 ± 0.003 Wm−1K−1 at −19 °C, which is a difference of 29.76%. In sample B, a smaller change occurred in which the conductivity fell from 2.021 ± 0.007 Wm−1K−1 at −26 °C to 1.694 ± 0.003 Wm−1K−1 at −19 °C, which is a decrease of 16.18%. The possible reason for this phenomenon could be found in the salt precipitation that occurred at that temperature range.
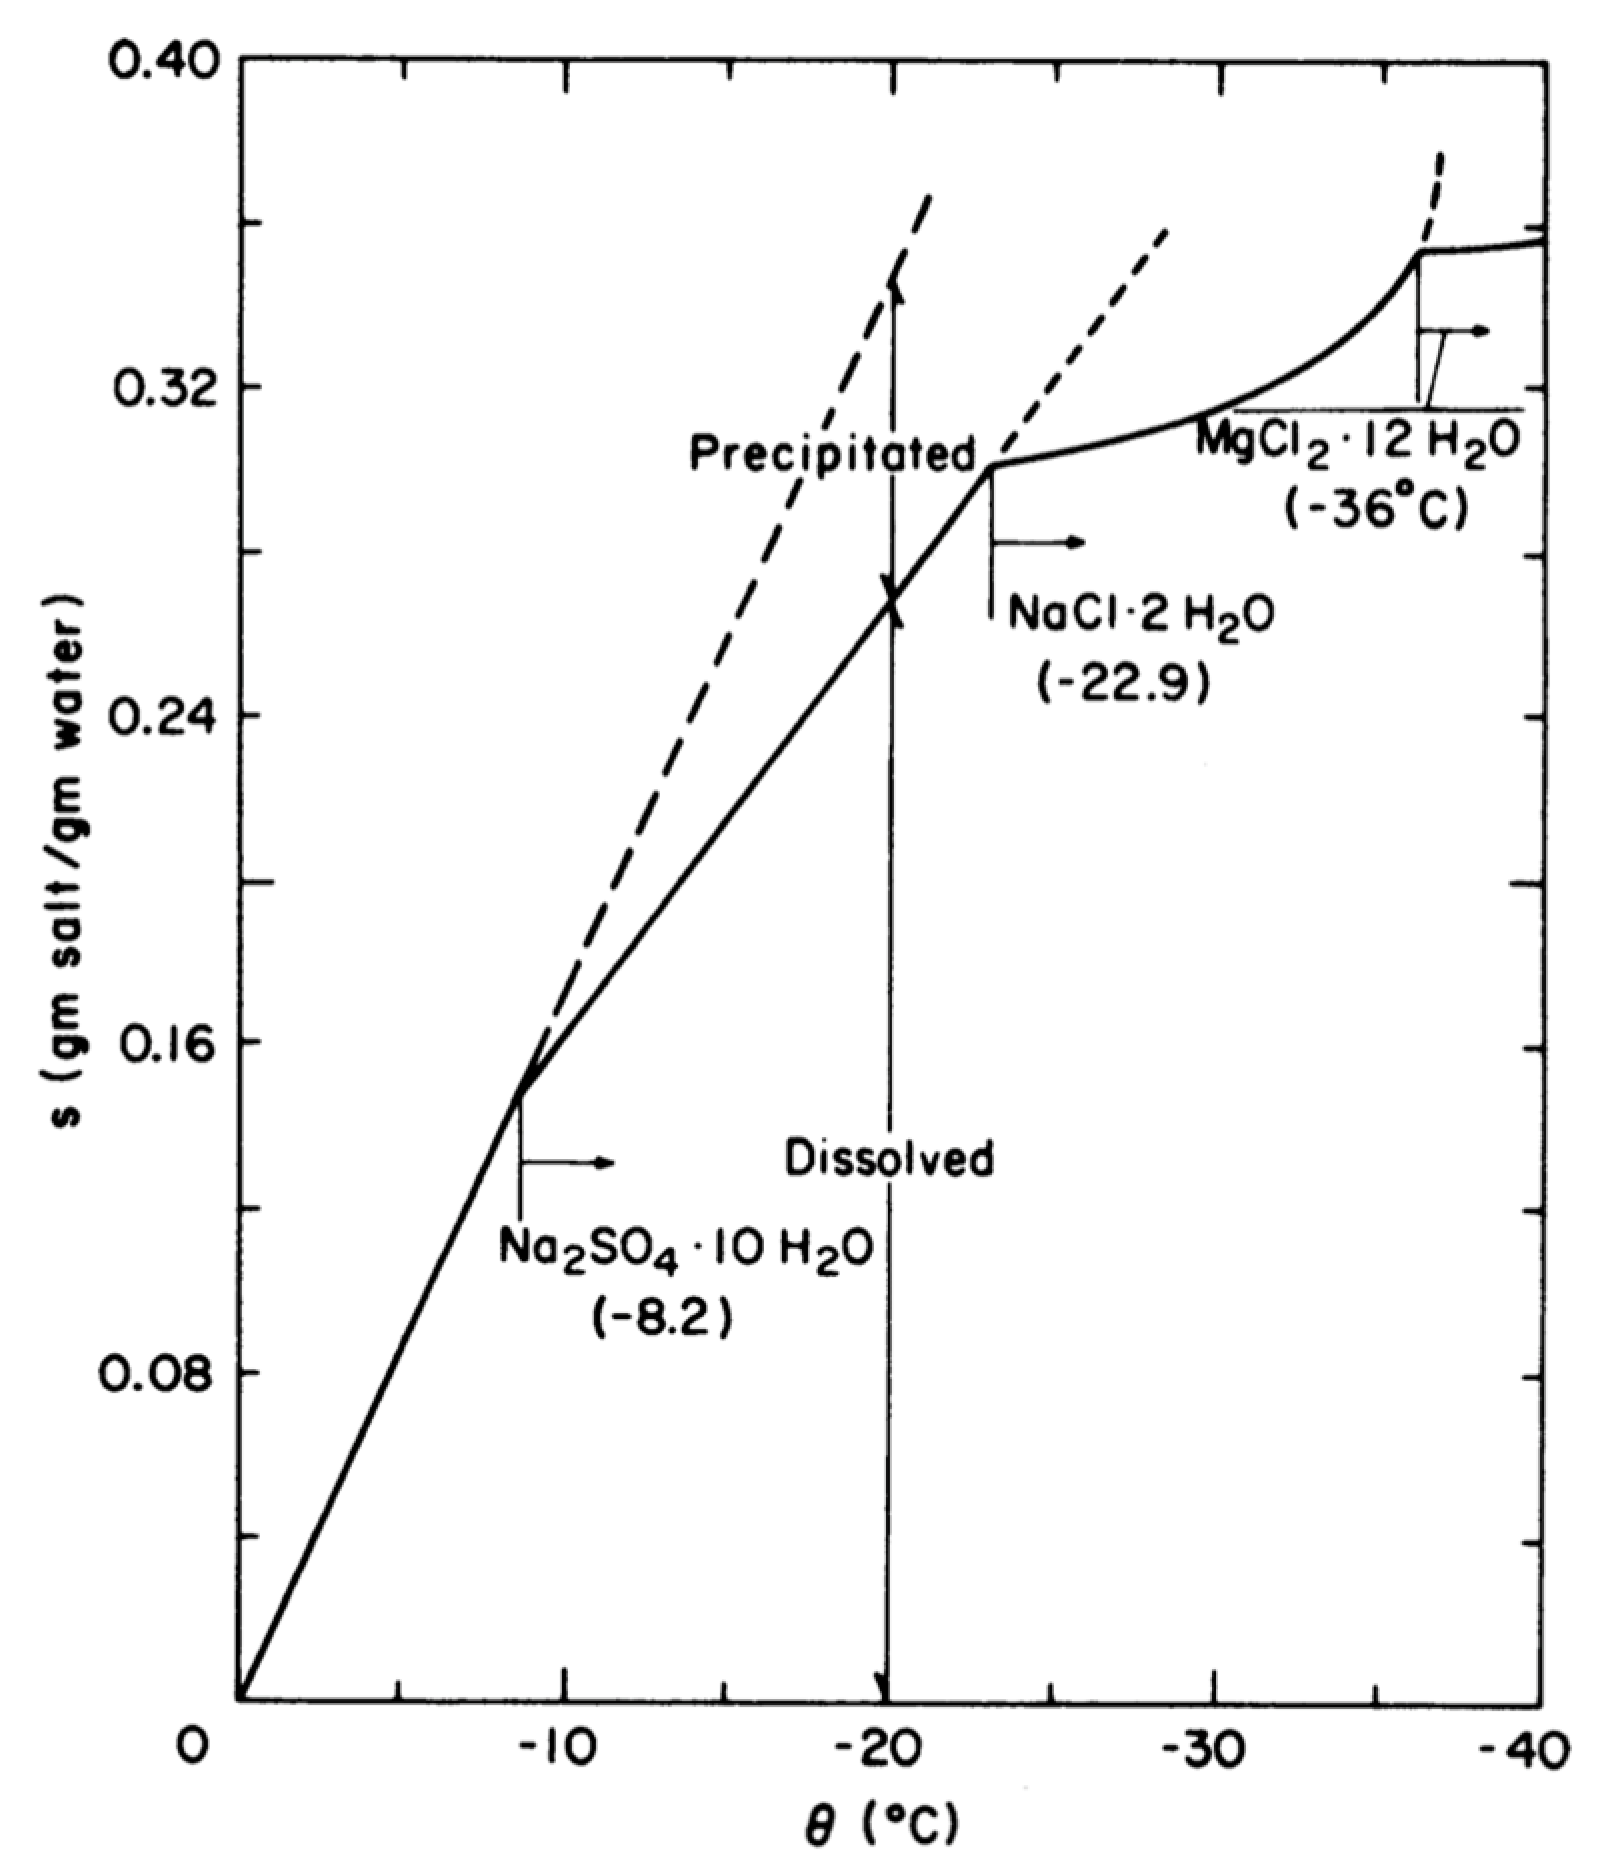
According to Yen [17], the thermal conductivity of sea ice is mainly dependent on salinity at high temperatures and on density at low temperatures. The precipitation of salt begins at −8.2 °C, and the continuous deposition carries on until the temperature reaches −23 °C, Figure 8.
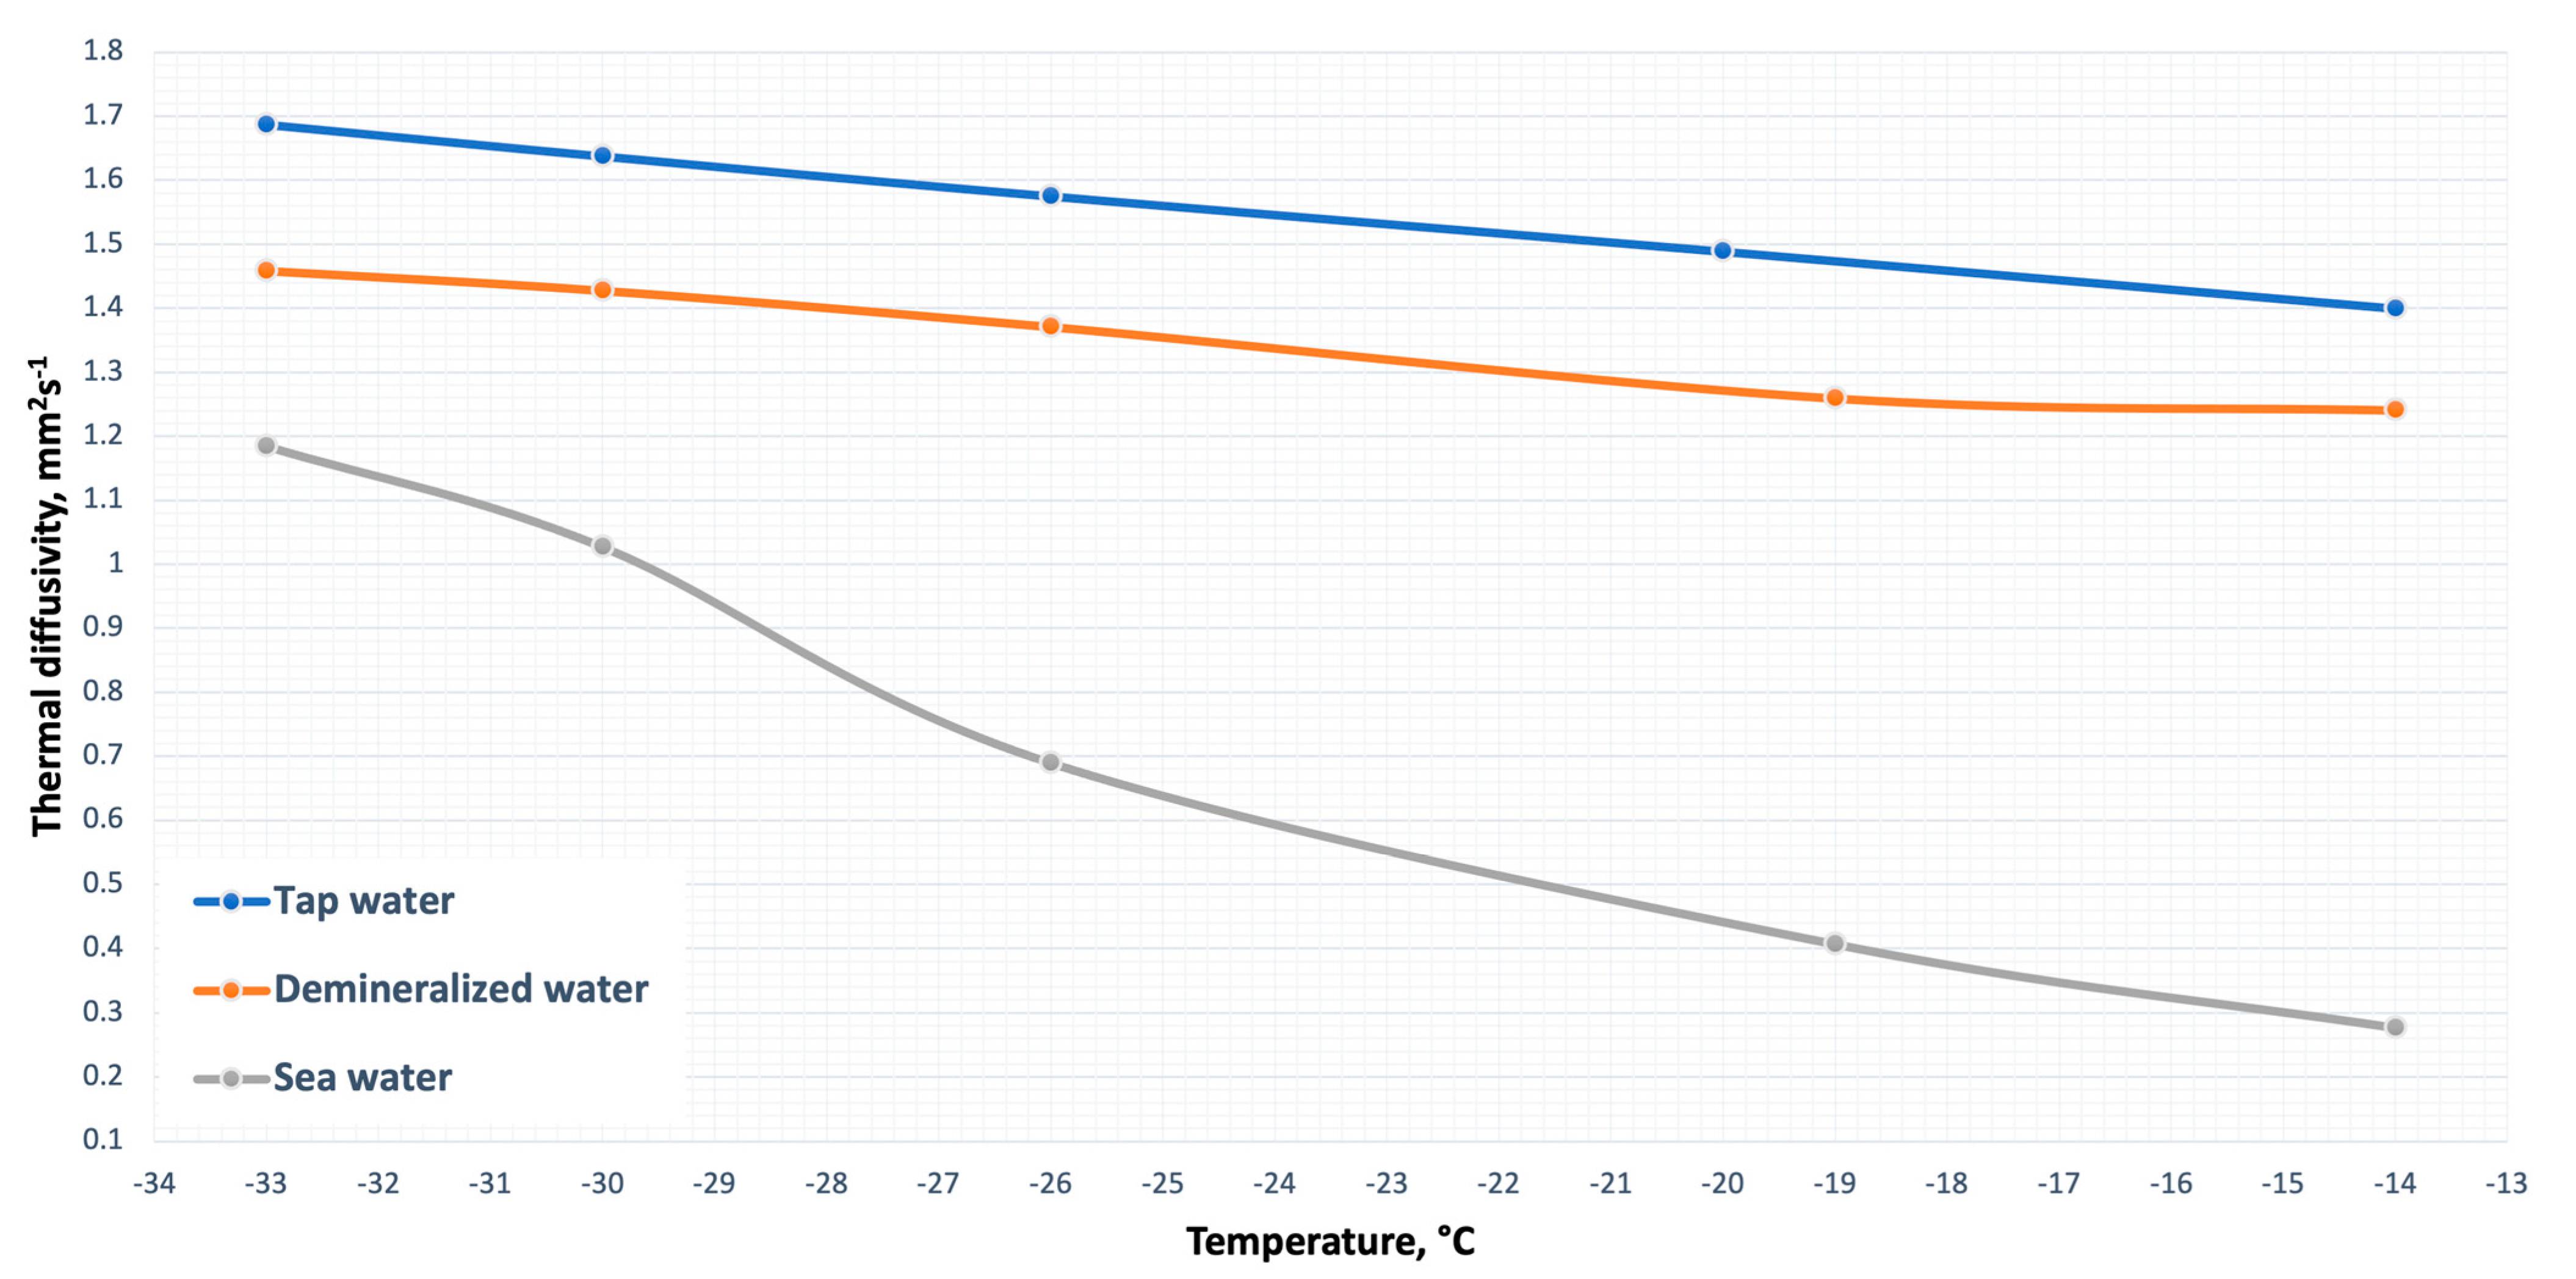
The correlation of the measured thermal diffusivity with temperature showed similar trends for tap and demineralized water, Figure 9. The highest values of thermal diffusivity were measured for frozen tap water, ranging from 1.400 ± 0.013 mm2s −1 at −14 °C to 1.687 ± 0.010 mm2s−1 at −33 °C. The measured diffusivity of the frozen demineralized water was lower, while the sea water ice exhibited the lowest values of thermal diffusivity, which ranged from 0.277 ± 0.004 mm2s−1 at −14 °C to 1.185 ± 0.007 mm2s−1 at −33 °C.
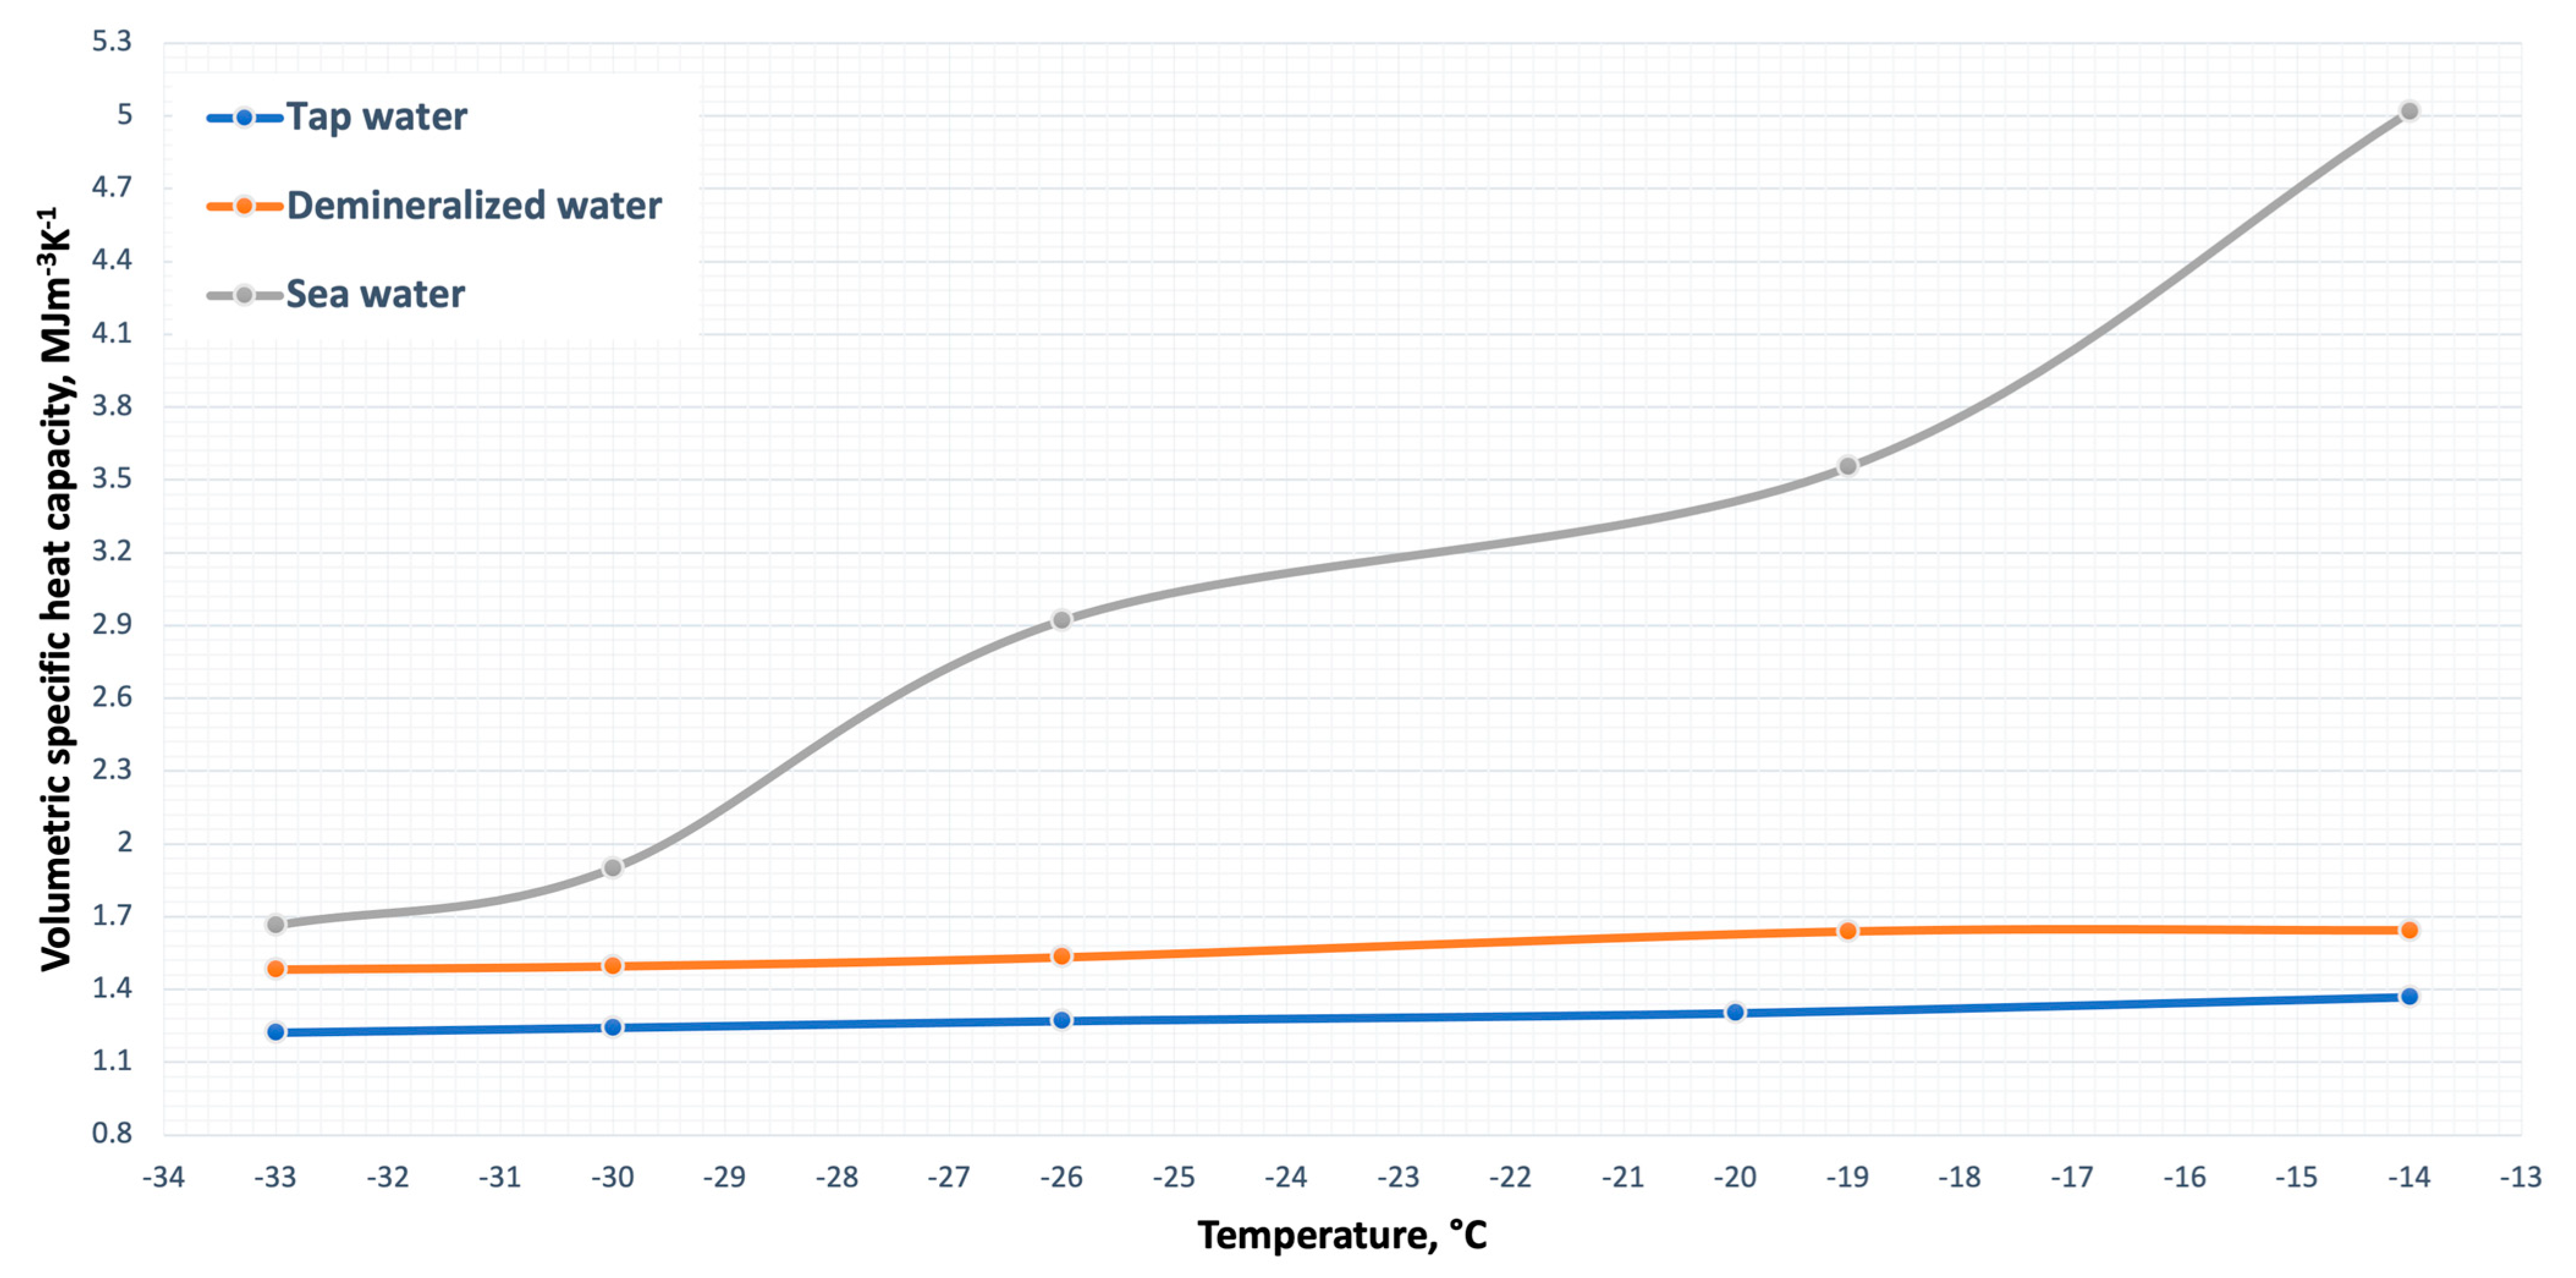
The volumetric specific heat capacity was positively correlated with temperature, Figure 10. As in previously discussed measurements, tap water and demineralized water exhibited similar behaviours, with values ranging from 1.643 ± 0.018 MJm−3K−1 to 1.484 ± 0.007 MJm−3K−1 for demineralized water. The volumetric specific heat capacity of the sea ice was calculated to be significantly higher at increased temperatures, e.g., slightly above 5 MJm−3K−1 at −14 °C, and almost three times lower at decreased temperatures.
Thermal conductivity and diffusivity displayed negative correlations with temperature for all samples, while volumetric specific heat capacity exhibited a positive correlation with temperature for all samples. The frozen tap and demineralized water exhibited similar trends in all experiments. The measured values of thermal conductivity for the pure ice were found to differ from the values that could be found in the literature. The thermal properties of the sea ice were shown to be different from those of the pure ice, especially in the higher-temperature range. Possible reasons for this could be the precipitation of salt in that range or the remaining liquid portion due to the lower freezing point of sea water.

4. Conclusions

The measured values of the thermal conductivity of the frozen tap water showed a negative correlation with temperature and varied from 1.915 ± 0.005 Wm−1K−1 at −14 °C to 2.060 ± 0.004 Wm−1K−1 at −33 °C. The measurements of the frozen demineralized water were slightly higher, which was expected due to purer composition. The measurements obtained for the thermal conductivity of the pure ice were inconsistent with the research findings published so far. The samples of sea ice have were shown to be more temperature-dependent than those made of pure water. An observable fall in the thermal conductivity of the sea ice was noticed in the temperature range from −19 °C to −26 °C. It is assumed that the reason for this phenomenon is the increased precipitation of salt in that temperature range. The measured thermal diffusivity of the tap water was between 1.400 ± 0.013 mm2s−1 at −14 °C and 1.687 ± 0.010 mm2s−1 at −33 °C, while the values for the demineralized water were less than 10% higher. The sea water ice exhibited the lowest values of thermal diffusivity. The calculated volumetric specific heat capacities for the frozen tap and demineralized water exhibited the same trend, slightly decreasing with the decrease in temperature. The measured values for frozen tap water oscillated around 1.2 MJm−3K−1 whilst those for demineralized water were, on average, 22% higher. The sea ice displayed a value of 5 MJm−3K−1 at −14 °C whilst showing values more similar to those of pure ice at lower temperatures.
Future work should focus on the study of the chemical composition of the samples, which could explain more precisely the presented trends and phenomena. Defining accurate values of the thermal properties of different kinds of ice and linking the chemical properties with thermal ones is crucial for predicting and managing the behavior of ice. It could allow for wider and more advanced applications of pure ice in various areas, such as energy storage, and could assist in the study of sea ice growth and climate models. Ultimately, it can be concluded that having a comprehensive and reliable knowledge of both pure ice and sea ice is of great importance, and more comprehensive investigations of various samples should be the next step.

Author Contributions

Conceptualization, J.B. and N.B.Ć.; methodology, M.J.; investigation, J.B. and N.B.Ć.; writing—original draft preparation, J.B. and N.B.Ć.; writing—review and editing, J.B., M.J. and S.N.; supervision, S.N. All authors have read and agreed to the published version of the manuscript.

Funding

This research was supported by the European Regional Development Fund, project Centre of Competence (CEKOM) under the grant KK.01.2.2.03.0022. This work was also supported by the Croatian Science Foundation, grant number IP-01-2018-2814.

Data Availability Statement

The data presented in this study are available on request from the corresponding author.

Conflicts of Interest

The authors declare no conflict of interest.

References

  1. Gao, Y.; Ning, Y.; Wu, C.; Xu, M.; Akhtar, S.; Mujumdar, A.S.; Sasmito, A.P. Experimental investigation of producing ice slurry with water using opposed-nozzle impinging jet method. Appl. Therm. Eng. 2023, 219, 119568. [Google Scholar] [CrossRef]
  2. Rezaei, M.; Pakravan, H.A. Thermo-fluidic characteristics of ice slurry flows in U-bend pipes for cold thermal energy storage. J. Energy Storage 2023, 57, 106224. [Google Scholar] [CrossRef]
  3. Hu, R.; Liu, X.; Zhang, X. Experimental study on supercooled water release supercooled state for generating ice crystals. J. Mol. Liq. 2023, 375, 121277. [Google Scholar] [CrossRef]
  4. Ahn, J.H.; Kim, H.; Kim, J.H.; Kim, J.Y. Evaporative cooling performance characteristics in ice thermal energy storage with direct contact discharging for food cold storage. Appl. Energy 2023, 330, 120334. [Google Scholar] [CrossRef]
  5. Xie, M.; Chen, L.; Wu, K.; Liu, Z.; Lin, J.; Jiang, C.; Xie, S.; Zhao, Y. A novel peak shaving approach to improving load flexibility of the Allam cycle by integrating cold energy storage. J. Clean. Prod. 2023, 386, 135769. [Google Scholar] [CrossRef]
  6. Ghaith, F.A.; Dag, R.O. Performance and feasibility of utilizing solar powered ice storage system for space cooling applications. Energy Convers. Manag. X 2022, 16, 100319. [Google Scholar] [CrossRef]
  7. Liu, Z.; Quan, Z.; Zhang, N.; Wang, Y.; Yang, M.; Zhao, Y. Energy and exergy analysis of a novel direct-expansion ice thermal storage system based on three-fluid heat exchanger module. Appl. Energy 2023, 330, 120371. [Google Scholar] [CrossRef]
  8. Xing, M.; Jing, D.; Chen, H.; Zhang, H.; Wang, R. Ice thermal energy storage enhancement using aligned carbon nanotubes under external magnetic field. J. Energy Storage 2022, 56, 105931. [Google Scholar] [CrossRef]
  9. Zhang, C.; Chai, D.; Fan, Y.; Zhang, W.; Yu, M.; Wang, Z.; Jiang, L. Numerical Analysis of Heat Transfer Behaviours of Melting Process for Ice Thermal Storage Based on Various Heat Source Configurations. Sustainability 2023, 15, 365. [Google Scholar] [CrossRef]
  10. Abhishek, A.; Kumar, B.; Kim, M.H.; Lee, Y.T.; Chung, J.D.; Kim, S.T.; Kim, T.; Lee, C.; Lee, K. Comparison of the performance of ice-on-coil LTES tanks with horizontal and vertical tubes. Energy Build. 2019, 183, 45–53. [Google Scholar] [CrossRef]
  11. Powel, R.W. Thermal conductivities and expansion coefficients of water and ice. Adv. Phys. 1958, 7, 276–297. [Google Scholar] [CrossRef]
  12. Lees, C.H. Effects of temperature and pressure on the thermal conductivities of solids. Part I. The effect of temperature on the thermal conductivities of some electrical insulators. Philos. Trans. R. Soc. Lond. Ser. A 1905, 204, 433–466. [Google Scholar]
  13. Jakob, M.; Erk, S. The thermal conductivity of ice between 0 °C and −125 °C. Z. Ges Kalte-Ind. 1929, 36, 229–234. [Google Scholar]
  14. Schofield, F.H.; Hall, J.A. Thermal insulating materials for moderate and low temperatures. In International Critical Tables; McGraw: New York, NY, USA, 1927; Volume 2, p. 312. [Google Scholar]
  15. Van Dusen, M.S.; Washburn, E.W. Thermal conductivity of non-metallic solids. In International Critical Tables of Numerical Data, Physics, Chemistry and Technology; McGraw: New York, NY, USA, 1929; Volume 5, pp. 216–217. [Google Scholar]
  16. Ratcliffe, E.H. The thermal conductivity of ice new data on the temperature coefficient. Philos. Mag. 1962, 7, 1197–1203. [Google Scholar] [CrossRef]
  17. Yen, Y. Review of Thermal Properties of Snow, Ice, and Sea Ice; CRREL Technical Report 81-10; United States Army Corps of Engineers, Cold Regions Research and Engineering Laboratory: Hanover, NH, USA, 1981. [Google Scholar]
  18. Fukusako, S. Thermophysical properties of ice, snow, and sea ice. Int. J. Thermophys. 1990, 11, 353–372. [Google Scholar] [CrossRef]
  19. Bonales, L.J.; Rodriguez, A.C.; Sanz, P.D. Thermal conductivity of ice prepared under different conditions. Int. J. Food Prop. 2017, 20, 610–619. [Google Scholar] [CrossRef]
  20. Trodahl, H.J.; Wilkinson, S.O.F.; McGuinness, M.J.; Haskell, T.G. Thermal conductivity of sea ice; dependence on temperature and depth. Geophys. Res. Lett. 2001, 28, 1279–1282. [Google Scholar] [CrossRef]
  21. Zeng, D.; Li, Y.; Liu, H.; Yang, Y.; Peng, L.; Zhu, C.; Zhao, N. Superhydrophobic coating induced anti-icing and deicing characteristics of an airfoil. Colloids Surf. A Physicochem. Eng. Asp. 2023, 660, 130824. [Google Scholar] [CrossRef]
  22. Chen, J.; Sun, C.; Sun, X.; Dan, H.; Huang, X. Finite difference model for predicting road surface ice formation based on heat transfer and phase transition theory. Cold Reg. Sci. Technol. 2023, 207, 103772. [Google Scholar] [CrossRef]
  23. Kreutz, M.; Ait Alla, A.; Lütjen, M.; Ohlendorf, J.-H.; Freitag, M.; Thoben, K.-D.; Zimnol, F.; Greulich, A. Ice prediction for wind turbine rotor blades with time series data and a deep learning approach. Cold Reg. Sci. Technol. 2023, 206, 103741. [Google Scholar] [CrossRef]
  24. Davalos, D.; Chowdhury, J.; Hangan, H. Joint wind and ice hazard for transmission lines in mountainous terrain. J. Wind Eng. Ind. 2023, 232, 105276. [Google Scholar] [CrossRef]
  25. Gao, Y.; Ding, Z. Investigation of water freezing in gas diffusion layer of PEMFC using lattice Boltzmann method. Ionics 2022, 29, 285–298. [Google Scholar] [CrossRef]
  26. Jurčević, M.; Penga, Ž.; Klarin, B.; Nižetić, S. Numerical analysis and experimental validation of heat transfer during solidification of phase change material in a large domain. J. Energy Storage 2020, 30, 101543. [Google Scholar] [CrossRef]
  27. Jurčević, M.; Nižetić, S.; Arıcı, M.; Ocłoń, P. Comprehensive analysis of preparation strategies for phase change nanocomposites and nanofluids with brief overview of safety equipment. J. Clean. Prod. 2020, 274, 122963. [Google Scholar] [CrossRef]
  28. Shojaeefard, M.H.; Jourabian, M.; Darzi, A.A.R. Rectangular heat sink filled with PCM/hybrid nanoparticles composites and cooled by intruded T-shaped cavity: Numerical investigation of thermal performance. Int. Commun. Heat Mass Transf. 2021, 127, 105527. [Google Scholar] [CrossRef]
  29. Hot Disk®. Available online: https://www.hotdiskinstruments.com/products-services/instruments/tps-500/ (accessed on 21 October 2022).
  30. Gustafsson, S.E. Transient plane source techniques for thermal conductivity and thermal diffusivity measurements of solid materials. Rev. Sci. Instrum. 1991, 62, 797–804. [Google Scholar] [CrossRef]
  31. Bohač, V.; Gustavsson, M.K.; Kubičar, L.; Gustafsson, S.E. Parameter estimations for measurements of thermal transport properties with the hot disk thermal constants analyser. Rev. Sci. Instrum. 2000, 71, 15–19. [Google Scholar] [CrossRef]
  32. ISO 22007-2:2022; Plastics—Determination of Thermal Conductivity and Thermal Diffusivity—Part 2: Transient Plane Heat Source (Hot Disc) Method. International Organization for Standardization: Geneva, Switzerland, 2022.
  33. Jurčević, M.; Nižetić, S.; Čoko, D.; Hoang, A.T.; Papadopoulos, A.M. Experimental investigation of novel hybrid phase change materials. Clean Technol. Environ. Policy 2022, 24, 201–212. [Google Scholar] [CrossRef]
  34. Kapton Polyimide Characteristics. Available online: https://www.dielectricmfg.com/knowledge-base/kapton/ (accessed on 22 November 2022).
  35. RS PRO. Available online: https://www.docs.rs-online.com/9b34/A700000007350702.pdf (accessed on 4 December 2022).
  36. Pico Technology. Available online: https://www.picotech.com/data-logger/tc-08/usb-tc-08-specifications (accessed on 4 December 2022).
  37. Water Supply and Sewerage Split. Available online: https://www.vik-split.hr/o-nama/djelatnost/vodoopskrba (accessed on 20 November 2023).
  38. Mihanović, H.; Vilibić, I.; Šepić, J.; Matić, F.; Ljubešić, Z.; Mauri, E.; Gerin, R.; Notarstefano, G.; Poulain, P.-M. Observation, preconditioning and recurrence of exceptionally high salinities in the Adriatic sea. Front. Mar. Sci. 2021, 8, 672210. [Google Scholar] [CrossRef]

Figure 1. Kapton 5501 sensor [29].
Energies 16 07745 g001
Figure 2. Aluminum mold for specimen formation.
Energies 16 07745 g002
Figure 3. (a) Frozen tap water specimens. (b) Frozen demineralized water specimens. (c) Frozen sea water specimens.
Energies 16 07745 g003
Figure 4. (a) Positioning device with pure ice samples in EPS box. (b) Hot Disk Thermal Constants Analyzer connected to specimens in the freezer using Kapton sensor.
Energies 16 07745 g004
Figure 5. Comparisons of thermal conductivity as a function of temperature for three types of water.
Energies 16 07745 g005
Figure 6. Thermal conductivity of pure ice in the range 100 K–300 K [18].
Energies 16 07745 g006
Figure 7. Comparison of thermal conductivity as a function of temperature for two different samples of sea water.
Energies 16 07745 g007
Figure 8. Freezing point of brine as a function of fractional salt content [17].
Energies 16 07745 g008
Figure 9. Comparisons of thermal diffusivity as a function of temperature for three types of water.
Energies 16 07745 g009
Figure 10. Comparisons of volumetric specific heat capacity as a function of temperature for three types of water.
Energies 16 07745 g010
Table 1. Input parameters for Hot Disk device.
Heating power450 mW
Measurement time40 s
Available probing depth15 mm
Sample temperaturefrom −14 °C to −33 °C
Disclaimer/Publisher’s Note: The statements, opinions and data contained in all publications are solely those of the individual author(s) and contributor(s) and not of MDPI and/or the editor(s). MDPI and/or the editor(s) disclaim responsibility for any injury to people or property resulting from any ideas, methods, instructions or products referred to in the content.