Article

SEiPV-Net: An Efficient Deep Learning Framework for Autonomous Multi-Defect Segmentation in Electroluminescence Images of Solar Photovoltaic Modules

1
Department of Electronics and Information Engineering, Jeonbuk National University, Jeonju 54896, Republic of Korea
2
Graduate School of Integrated Energy-AI, Jeonbuk National University, Jeonju 54896, Republic of Korea
3
Khalifa University Center for Autonomous Robotic Systems (KUCARS), Khalifa University, Abu Dhabi 127788, United Arab Emirates
4
Advances Electronics and Information Research Center, Jeonbuk National University, Jeonju 54896, Republic of Korea
*
Authors to whom correspondence should be addressed.
These authors equally contributed to this work.
Energies 2023, 16(23), 7726; https://doi.org/10.3390/en16237726
Submission received: 20 October 2023 / Revised: 15 November 2023 / Accepted: 18 November 2023 / Published: 23 November 2023
(This article belongs to the Section A2: Solar Energy and Photovoltaic Systems)

Abstract

:
A robust and efficient segmentation framework is essential for accurately detecting and classifying various defects in electroluminescence images of solar PV modules. With the increasing global focus on renewable energy resources, solar PV energy systems are gaining significant attention. The inspection of PV modules throughout their manufacturing phase and lifespan requires an automatic and reliable framework to identify multiple micro-defects that are imperceptible to the human eye. This manuscript presents an encoder–decoder-based network architecture with the capability of autonomously segmenting 24 defects and features in electroluminescence images of solar photovoltaic modules. Certain micro-defects occupy a trivial number of image pixels, consequently leading to imbalanced classes. To address this matter, two types of class-weight assignment strategies are adopted, i.e., custom and equal class-weight assignments. The employment of custom class weights results in an increase in performance gains in comparison to equal class weights. Additionally, the proposed framework is evaluated by utilizing three different loss functions, i.e., the weighted cross-entropy, weighted squared Dice loss, and weighted Tanimoto loss. Moreover, a comparative analysis based on the model parameters is carried out with existing models to demonstrate the lightweight nature of the proposed framework. An ablation study is adopted in order to demonstrate the effectiveness of each individual block of the framework by carrying out seven different experiments in the study. Furthermore, SEiPV-Net is compared to three state-of-the-art techniques, namely DeepLabv3+, PSP-Net, and U-Net, in terms of several evaluation metrics, i.e., the mean intersection over union (IoU), F1 score, precision, recall, IoU, and Dice coefficient. The comparative and visual assessment using SOTA techniques demonstrates the superior performance of the proposed framework.

1. Introduction

Photovoltaic modules play a crucial role in photovoltaic energy systems, which are part of ongoing efforts to transition toward renewable energy resources. This transition aims to minimize carbon dioxide emissions and mitigate their detrimental effects [1,2]. The International Renewable Energy Agency (IRENA) has taken a firm stance on renewable energy, leading to a global investment of USD 282 billion in the renewable energy sector as of 2019 [3]. This growing momentum toward renewable resources has significantly increased the demand for solar photovoltaic (PV) systems compared to other energy generation systems. However, solar cells may exhibit various defects and shortcomings that can affect the overall energy efficiency of the photovoltaic energy system. Consequently, there is a need to investigate solar cells, starting with their manufacturing phase and conducting inspections throughout their lifespan. Given the emerging trends in energy systems, it is essential to establish a viable and robust assessment mechanism for solar photovoltaic (PV) modules to ensure the anticipated energy harvesting through solar PV energy systems.
Solar PV modules are typically designed with protective measures to withstand different weather conditions and ensure resilience against environmental elements. The front side of the modules is shielded by tempered glass, providing resistance to the stresses and intensities of environmental factors. To safeguard against temperature variations, humidity, and corrosion resulting from water contamination, ethylene vinyl acetate is used as an encapsulation agent [4]. Additionally, a backsheet is incorporated as an additional component to provide mechanical stability, further protection against environmental elements, and insulation for the PV modules [5]. However, despite the presence of these supplementary protective components, multiple defects can occur in the modules over their lifespan. Weather conditions and mechanical damage can contribute to surface defects, while artifacts may also arise during the manufacturing phase [6]. The dynamic temperature and irradiance affect certain parameters of photovoltaic modules, acting as obstacles in estimating these parameters, as the overall throughput of a photovoltaic system hinges on their accurate assessment [7]. The authors propose the L-SHADE and L-SHADED techniques, with the latter method focusing on dimensionality reduction. Following this phase, they employ a linear population size reduction-based success history adaptation differential evolution (L-SHADE) method, consequently determining the unknown parameters. PV modules, such as multi-crystalline KC200GT and mono-crystalline SM55, are utilized under varying temperature and irradiance conditions to identify unknown parameters such as the photo-generated current, series resistance, and diode reverse saturation current. Consequently, inspecting and assessing the condition of PV modules become critical in solar energy systems.
Photovoltaic modules are designed to endure approximately 25 years of continuous exposure to challenging environmental conditions [8]. Manual visual inspection of solar PV modules is a laborious task, and even the scrutiny of a specialist may not be effective, as numerous defects are not visible to the naked eye. In the field of imaging, infrared (IR) cameras can be employed for PV module inspection using infrared imaging. Faulty solar cells that fail to convert solar energy into electrical output emit heat, which can be detected using infrared imaging techniques [9]. However, it is important to note that certain micro-defects may not be captured by infrared imaging, and the limited resolution of infrared cameras poses additional limitations when considering this approach for inspection [10].
Electroluminescence (EL) imaging is considered a preferable alternative to infrared (IR) imaging due to its ability to provide high-quality images capable of capturing micro-defects in solar cells. EL images are obtained by capturing emissions induced at a specific wavelength of 1150 nm using a silicon charge-coupled device (CCD) sensor [11]. In these grayscale EL images, micro-cracks are revealed as dark-gray areas where micro-defects occur [12]. However, visual inspection of EL images is a time-consuming and tedious task, even when performed by an expert. Given the growing trends in renewable energy systems, solar energy plays a major role in this domain. Manual visual assessment is impractical for solar PV energy systems, where it is necessary to inspect thousands of PV modules throughout their lifespan. Considering these factors, this manuscript proposes an autonomous assessment method utilizing EL images to detect various defects and features in solar PV modules.
In this manuscript, we introduce a novel deep learning-based framework for the automatic segmentation of 24 defects and features in EL images of solar photovoltaic (PV) modules. Our proposed framework aims to achieve efficient EL image segmentation by utilizing a minimal number of model parameters, resulting in a lightweight system. Figure 1 depicts different EL images of solar PV modules, showcasing the presence of multiple co-occurring defects and features. The contributions of this research work are as follows:
  • Development of a deep learning-based framework for the automatic segmentation of 24 defects and features in EL images of solar PV modules.
  • Emphasis on a lightweight segmentation system by optimizing the number of model parameters.
  • Due to the coexistence of multiple defects and features in an image, various micro-defects occupy a trivial number of pixels in an image, consequently causing imbalanced classes. Three different loss functions are utilized by employing custom class weights. This comparison study aids in determining the most efficient loss function for the appropriate segmentation of 24 unique classes present in EL imagery.
These contributions emphasize the novelty and importance of the proposed SEiPV-Net (Segmentation Network for Electroluminescence Images of Solar Photovoltaic Modules) framework in achieving accurate and efficient automatic segmentation of EL images of solar PV modules while taking into account the challenges posed by imbalanced classes and the presence of multiple defects and features in the images.

2. Related Works

Electroluminescence (EL) imaging, first experimented with in 2005, has been widely used to capture the degradation patterns of silicon solar cells [13]. In a study by Fuyuki et al. [14], EL imaging was deployed to determine the size of crystalline silicon solar cells and identify cracks and defects, which appeared as darker regions. The study successfully identified inadequate areas in the crystalline silicon solar cells using EL imaging. In another work by Deitsch et al. [15], various defects in mono-crystalline and poly-crystalline PV modules were detected by manually extracting features and employing a Support Vector Machine (SVM) classifier. To further improve defect classification, convolutional neural networks (CNNs) were employed using a dataset of 1968 solar cell images extracted from EL images of PV modules. The CNNs achieved higher classification accuracy compared to the SVM classifier, although the CNNs tended to be more resource-intensive in terms of hardware complexity. Shujaat et al. [16] exploited the practicality of CNNs to identify the promoters responsible for carrying out the transcription of genes.
Similarly, in a comparative study, Karimi et al. [17] evaluated the performance of CNNs against machine learning-based SVM and random forest classifiers. The objective of the study was to categorize solar cell images acquired from EL imaging of PV modules into three defined categories. The framework also incorporated data augmentation techniques to increase the overall dataset size, which consisted of 5400 solar cell images.
In a study by Tsai et al. [18], a Fourier image reconstruction approach was employed to identify defective solar cells using EL images obtained from poly-crystalline PV modules. The method presented in the study provided a reliable means to ascertain the presence of defects in solar cells. Furthermore, in a separate investigation, Anwar et al. [19] combined image segmentation techniques with anisotropic diffuse filtering to detect micro-cracks in solar cells. The study utilized a dataset of 600 EL images and demonstrated the effectiveness of the proposed approach in accurately discerning micro-cracks.
Deep learning has emerged as a potent method for autonomous decision making in several domains, allowing for accurate and fast object and region-of-interest identification [20,21]. In the field of biomedical image segmentation, the U-Net architecture, proposed in [22], has become a widely adopted model due to its effectiveness. It is made up of an encoder–decoder structure that forms a U-shaped network with a contracting and expanding route. Several U-Net design versions have been developed for specialized segmentation tasks in biomedical imaging [23,24]. These include Attention U-Net [25], Dilated Inception U-Net [26], Unet++ [27], SegR-Net [28], RAAGR2-Net [21], and R2U-Net [29]. These variants try to improve the U-Net model’s performance in certain scenarios. DeepLabv3+ is another well-known semantic segmentation framework, which expands the DeepLabv3 paradigm [30] by combining encoder–decoder blocks with Xception and ResNet-101 as the network backbones [31]. This architecture was created specifically for semantic segmentation tasks and has performed well. In biomedical imaging, dual-encoder- and dual-decoder-based DL frameworks are employed for aiding in the diagnosis of colorectal cancer through polyp segmentation from colonoscopy images [32]. In another work, Wooram et al. [33] adopted a neural network based on convolutional operations, along with atrous spatial pyramid pooling and separable convolutions integrated with a decoder module, to carry out the real-time segmentation of external cracks in structures.
The literature includes a variety of deep learning approaches aimed at classifying cells and modules into a wide range of flaws while accounting for the varied severity of these problems in solar PV modules [34,35]. In one work, Rahman et al. [36] adapted the U-Net architecture to identify flaws in poly-crystalline solar cells using EL pictures. The study proved the modified U-Net’s accuracy in segmenting and finding flaws in solar cells. Deqiang et al. [37] proposed a U-Net-based framework for single image super-resolution (SISR), with the sole purpose of image reconstruction from bristly textures to finer details. The approach is termed anti-illumination, as it effectively subdues the noise in images while captivating the illuminance details.
Another paper [38] by Chen et al. reported the segmentation of fractures in EL pictures of multi-crystalline solar cells. The study presented a unique approach for identifying and isolating fractures in photographs, which helped to characterize the faults. In order to extract global features, Ruixuan et al. [39] introduced a transformer-based architecture, LF-DET, for light-field spatial super-resolution. The model comprises two subsets. The first part introduces convolutional layers before self-attention modules, consequently obtaining global features. Further, in the second part, feature representations from macro areas are obtained at various levels using angular modeling across multiple scales. Furthermore, Pratt et al. [40] used EL pictures of PV modules to detect flaws in mono-crystalline and multi-crystalline silicon solar cells through a U-Net-based image semantic segmentation framework. The suggested framework yielded encouraging results in detecting and segmenting faults in solar cells. For crack segmentation, Young et al. [41] proposed a convolutional neural network-based DL model, comparing it to image processing edge detection approaches such as Canny and Sobel detection. Another work by Young et al. [42] reported the adaption of a faster region-based convolutional neural network (Faster R-CNN) for automatically detecting five different types of damage in the visual probing of structures.
We present a unique lightweight framework for the semantic segmentation of solar cells using EL imagery. While deep learning techniques have yielded promising results in a variety of segmentation problems, current models frequently face constraints such as excessive computational complexity and poor performance on unbalanced classes. To address these constraints, our proposed system employs a lightweight architecture built specifically for solar cell segmentation. We intend to achieve strong segmentation precision and accuracy for a total of 24 separate classes, covering a wide range of faults and characteristics. The dataset for training and assessment was acquired from [40,43] and provides a wide variety of samples for a thorough examination. The following sections will describe the approach, experimental setup, and outcomes of our established study.

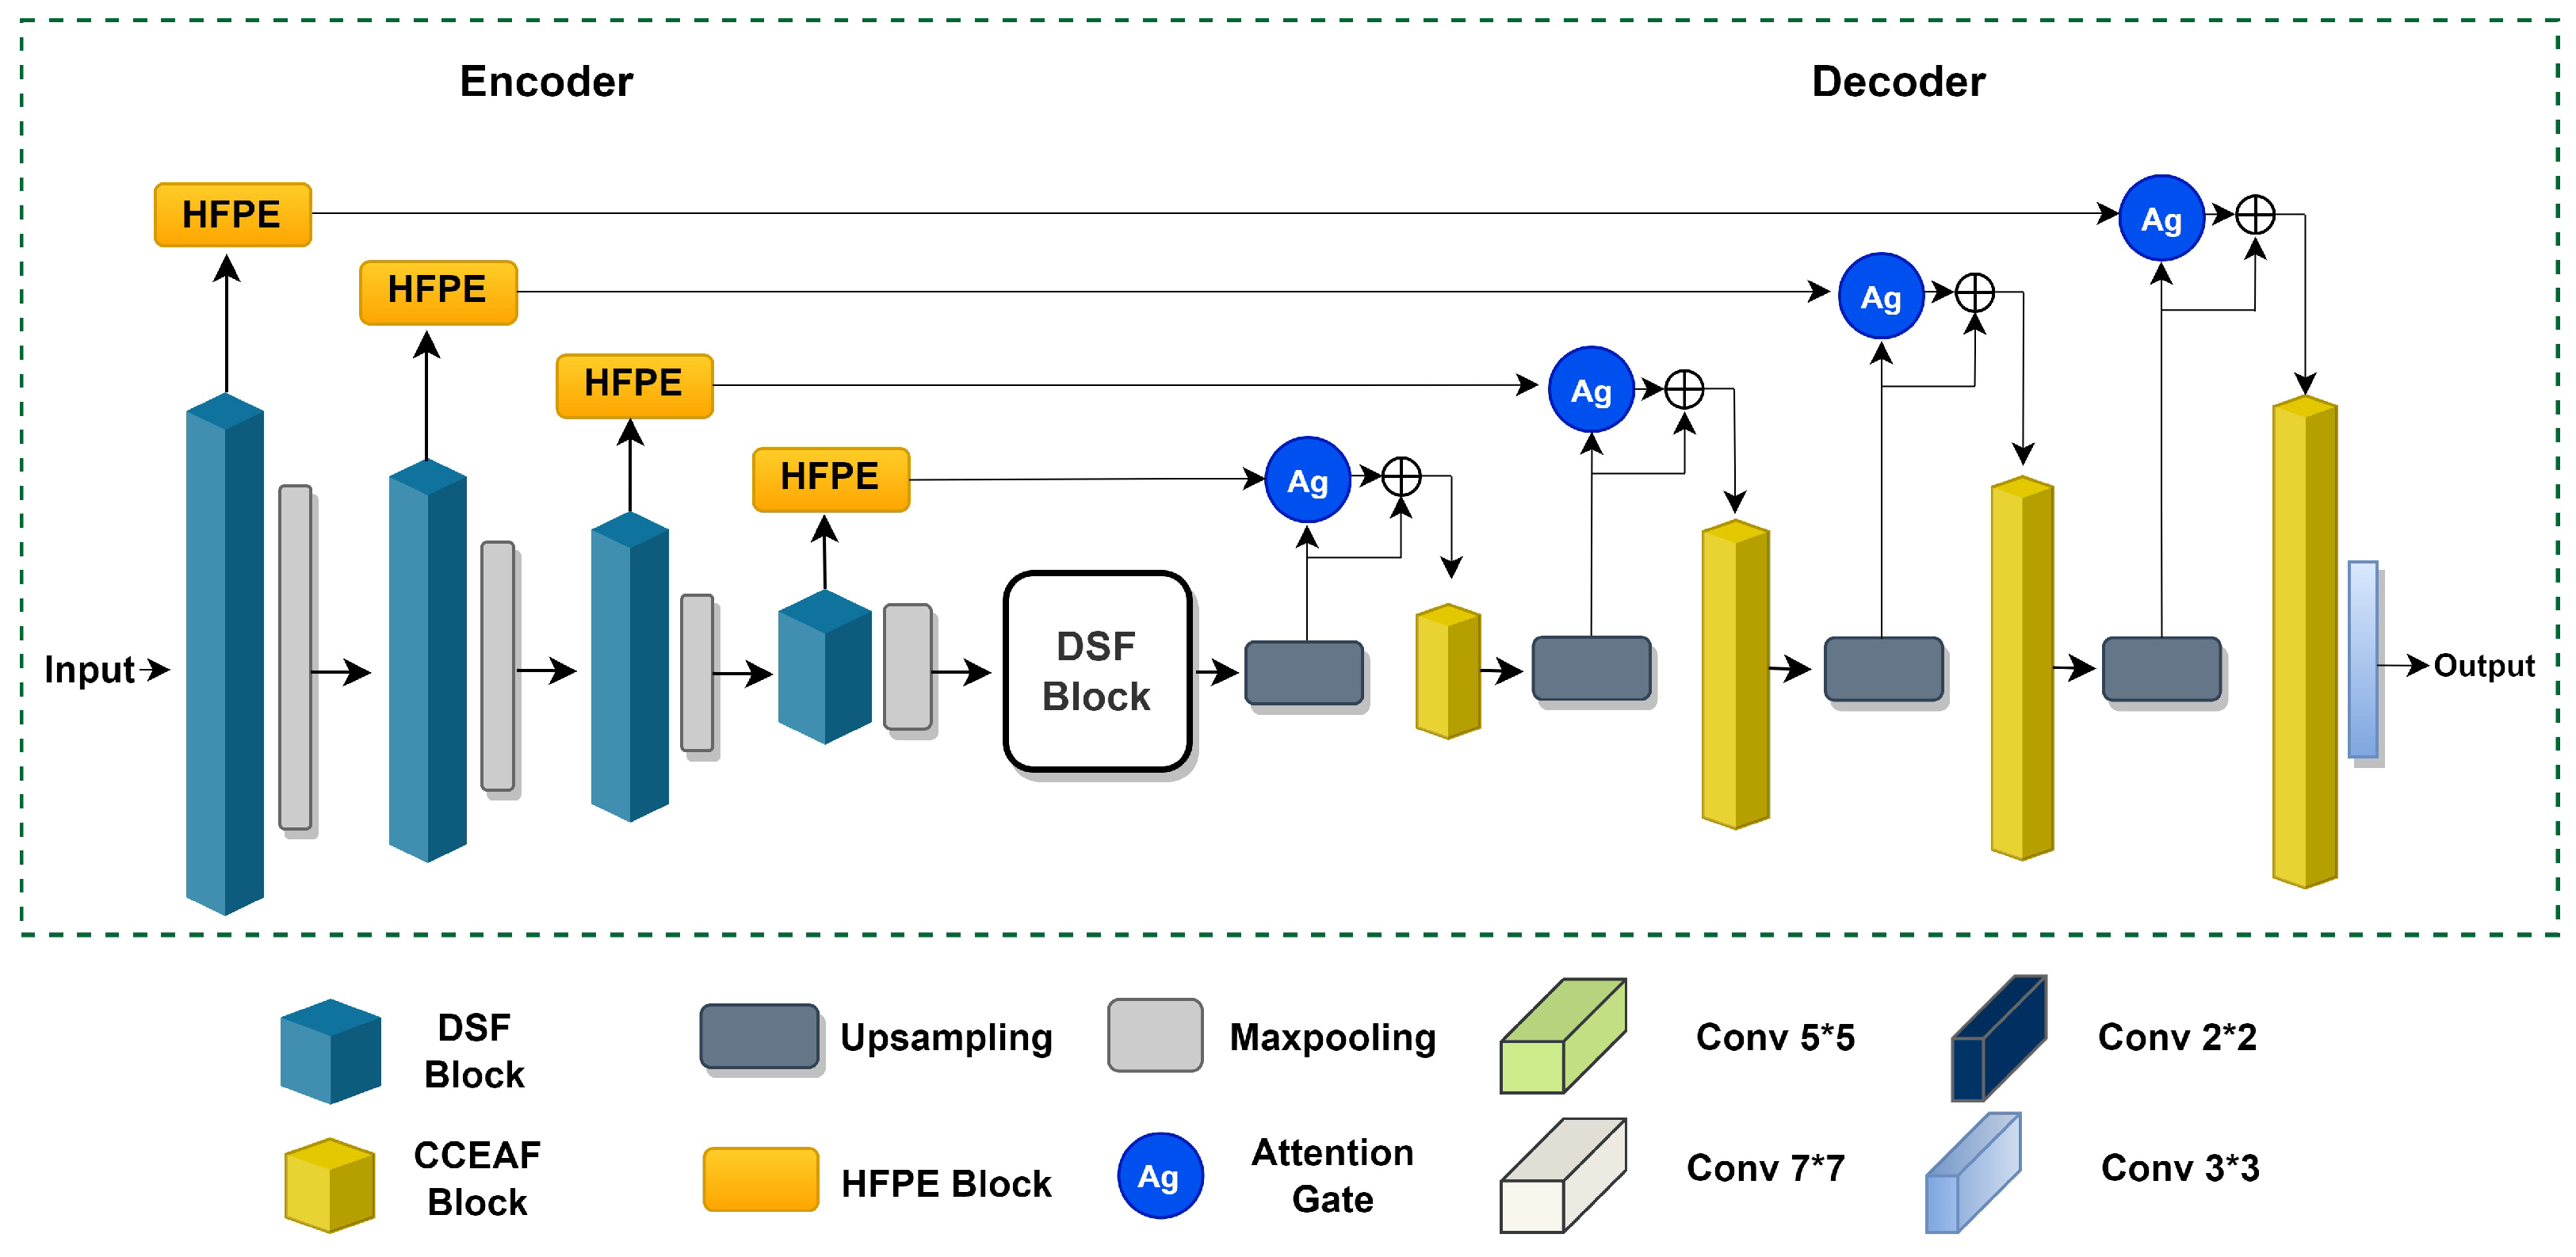
3. Proposed Network Architecture

The proposed network architecture is presented in Figure 2. The two inherent components—the model’s encoding and decoding modules—are depicted in the figure. The contracting part comprises a DSF (Dense and Successive Features) block as the primary component. The CCEAF block is an essential component of the expanding part of the network. In the skip connections, a pivotal block, known as HFPE, is employed along with an attention gate [44] as an inbuilt module. Details of the attributes of each block in the network are presented in the following subsections.
The encoder and decoder modules comprise a DSF block and a CCEAF block, respectively. The encoding part consists of consecutive DSF blocks, where each block has an adjacent max-pooling layer. The DSF block followed by the max-pooling layer extracts high-level features from the input EL image to the point where low-level features are obtained by employing successive pairs of a DSF block and a max-pooling layer. The skip connections in the network are positioned to provide a fusion of feature maps from the encoder to the decoder of the network. An HFPE block is used to process each skip connection from the encoder. The attention gate block is followed by an HFPE block, and the resulting feature representations are provided to the decoder module. The decoder module comprises a CCEAF block as the primary unit. It consists of four consecutive layers of up-sampling blocks and CCEAF blocks. Up-sampled features, along with the outputs of the HFPE block in each layer of the encoder, are processed by deploying an attention gate to intensify crucial features for segmentation precision and localization. The output of the attention gate block is combined with the up-sampled feature maps for all layers of the decoder. The resulting combined output is utilized as input features for the CCEAF blocks in the decoder module. In the last section, a final 3 × 3 convolutional layer is employed for precise and effective semantic segmentation of 24 various classes.

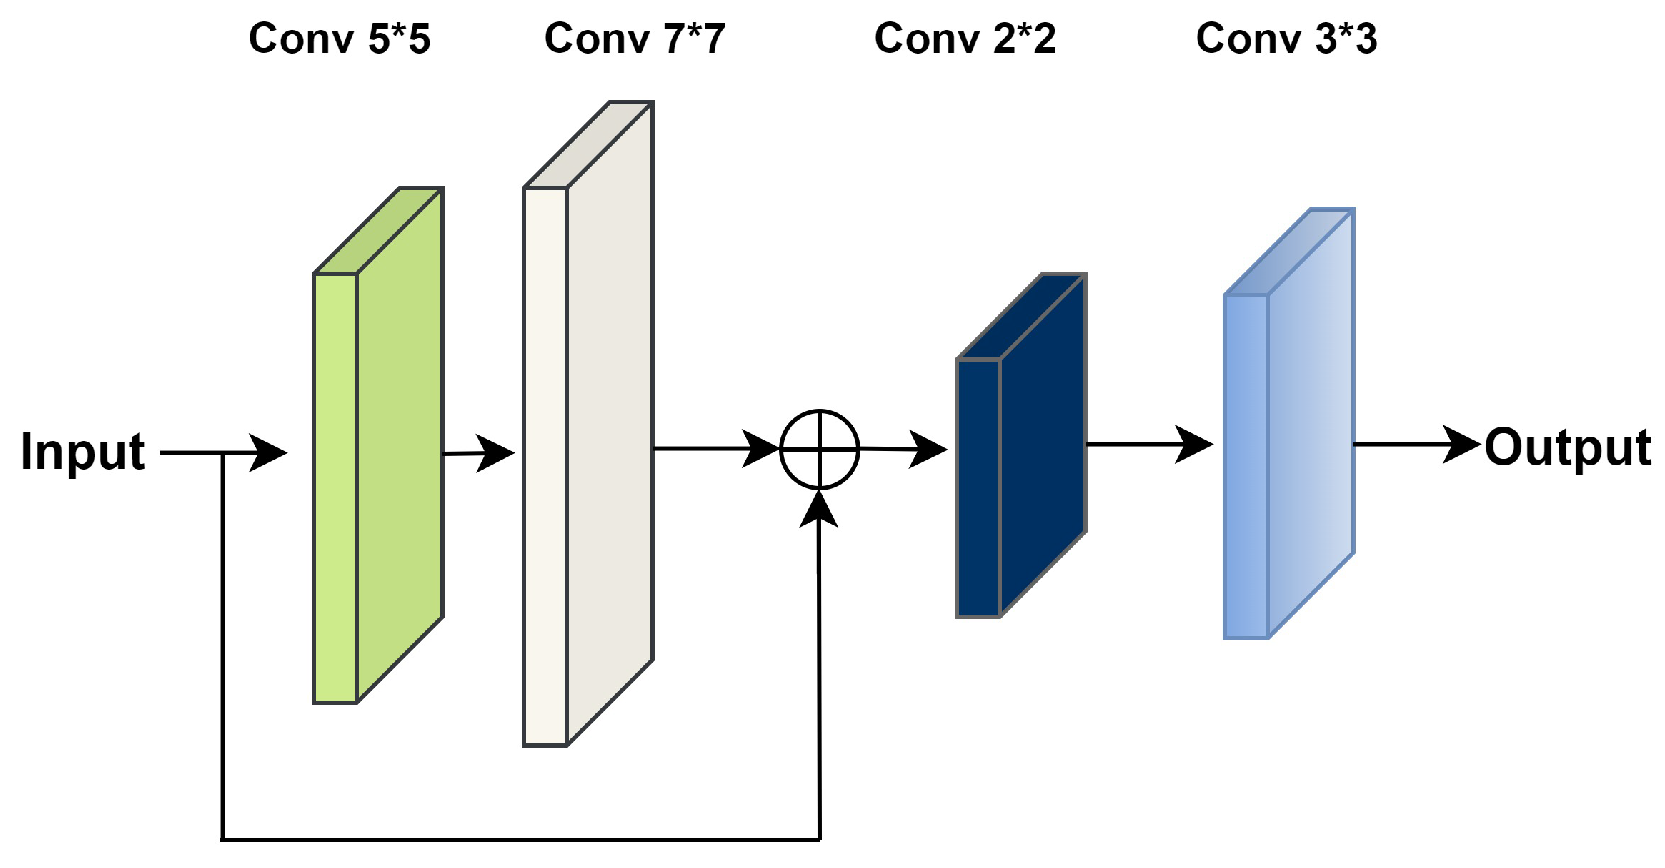
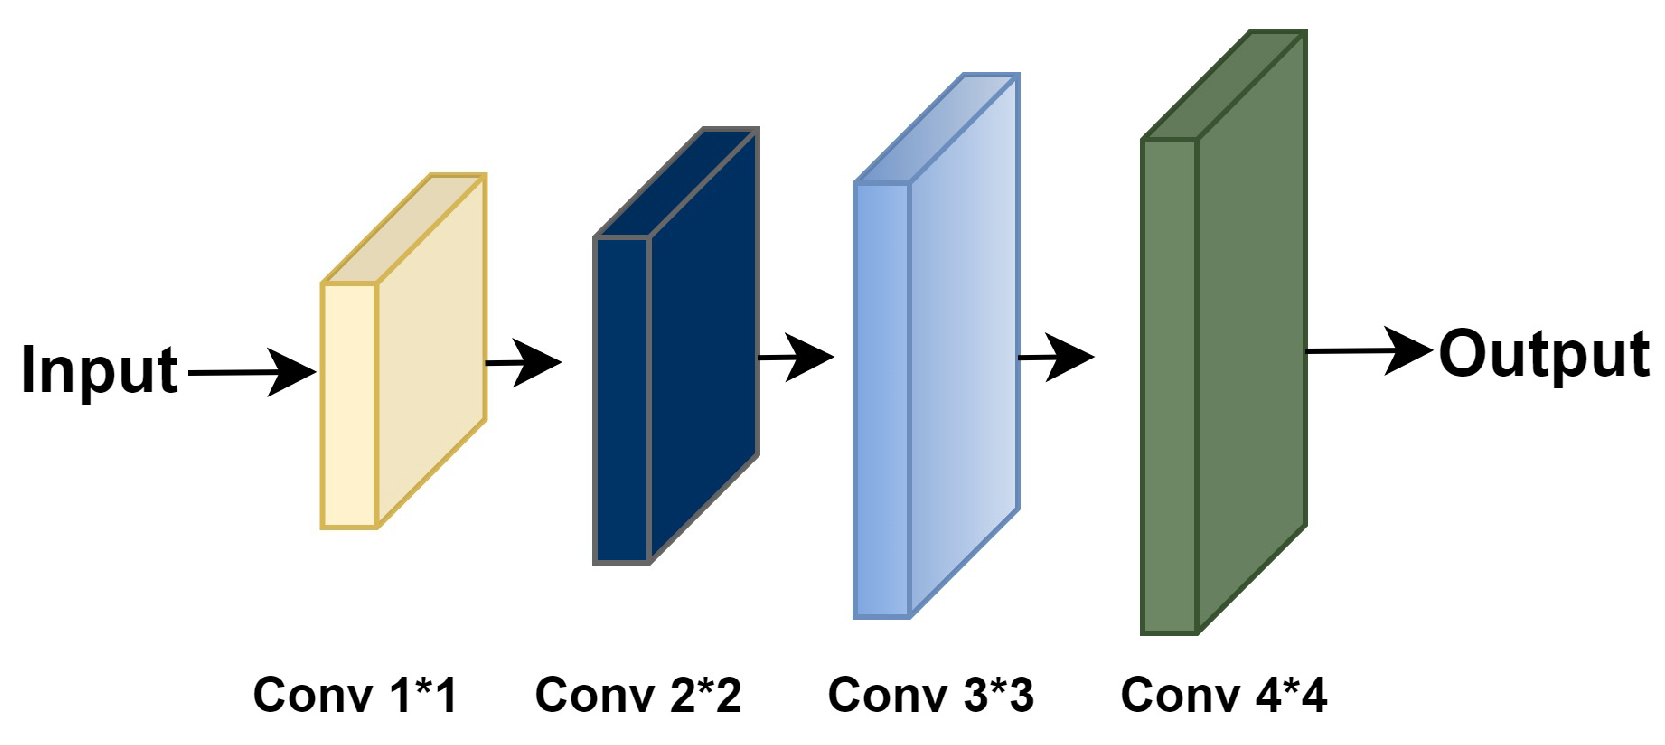
3.1. Dense and Successive Features (DSF) Block

The DSF block is depicted in Figure 3. The encoding part comprises a DSF block, a vital component for obtaining rich feature attributes from EL Images. It consists of four convolutional (conv) layers with dimensions of 7 × 7 , 5 × 5 , 2 × 2 , and 3 × 3 , which are connected in a dense and successive pattern. The input image is given to the 5 × 5 conv layer and further, the 7 × 7 conv layer is connected successively to the preceding layer. Followed by the concatenation of feature maps with the input image, consecutive 2 × 2 and 3 × 3 conv layers are employed to yield the final output of the DSF block. The DSF block is specifically utilized to acquire a set of divergent features rather than highly correlating features, which is usually the case in a conventional U-Net [22] model. Previous feature maps are availed and utilized in the successive convolutional layers through concatenation operations, which allows the encoding module in the network to limit the probability of vanishing gradients.

3.2. Hierarchical Feature Precision and Extraction (HFPE) Block

The HFPE block is illustrated in Figure 4. High- to low-level feature attributes are successively computed by the DSF block in the encoder module. The HFPE block comprises four convolutional layers with dimensions of 1 × 1 , 2 × 2 , 3 × 3 , and 4 × 4 . Each conv layer is connected to the previous layer in a serial pattern. Each layer is responsible for obtaining feature representations based on the kernel size of the respective convolutional layer. The first 1 × 1 convolutional layer takes in the input and learns the abstract feature attributes while the other 2 × 2 conv layer follows the previous layer. In this manner, the output is obtained through a consecutive combination of 3 × 3 and 4 × 4 conv layers. Consequently, feature maps are extracted hierarchically in such a way that shallow features are extracted in ascending order, leading to the attainment of more in-depth features. Further, the HFPE block is, in part, responsible for generating more precise feature representations.

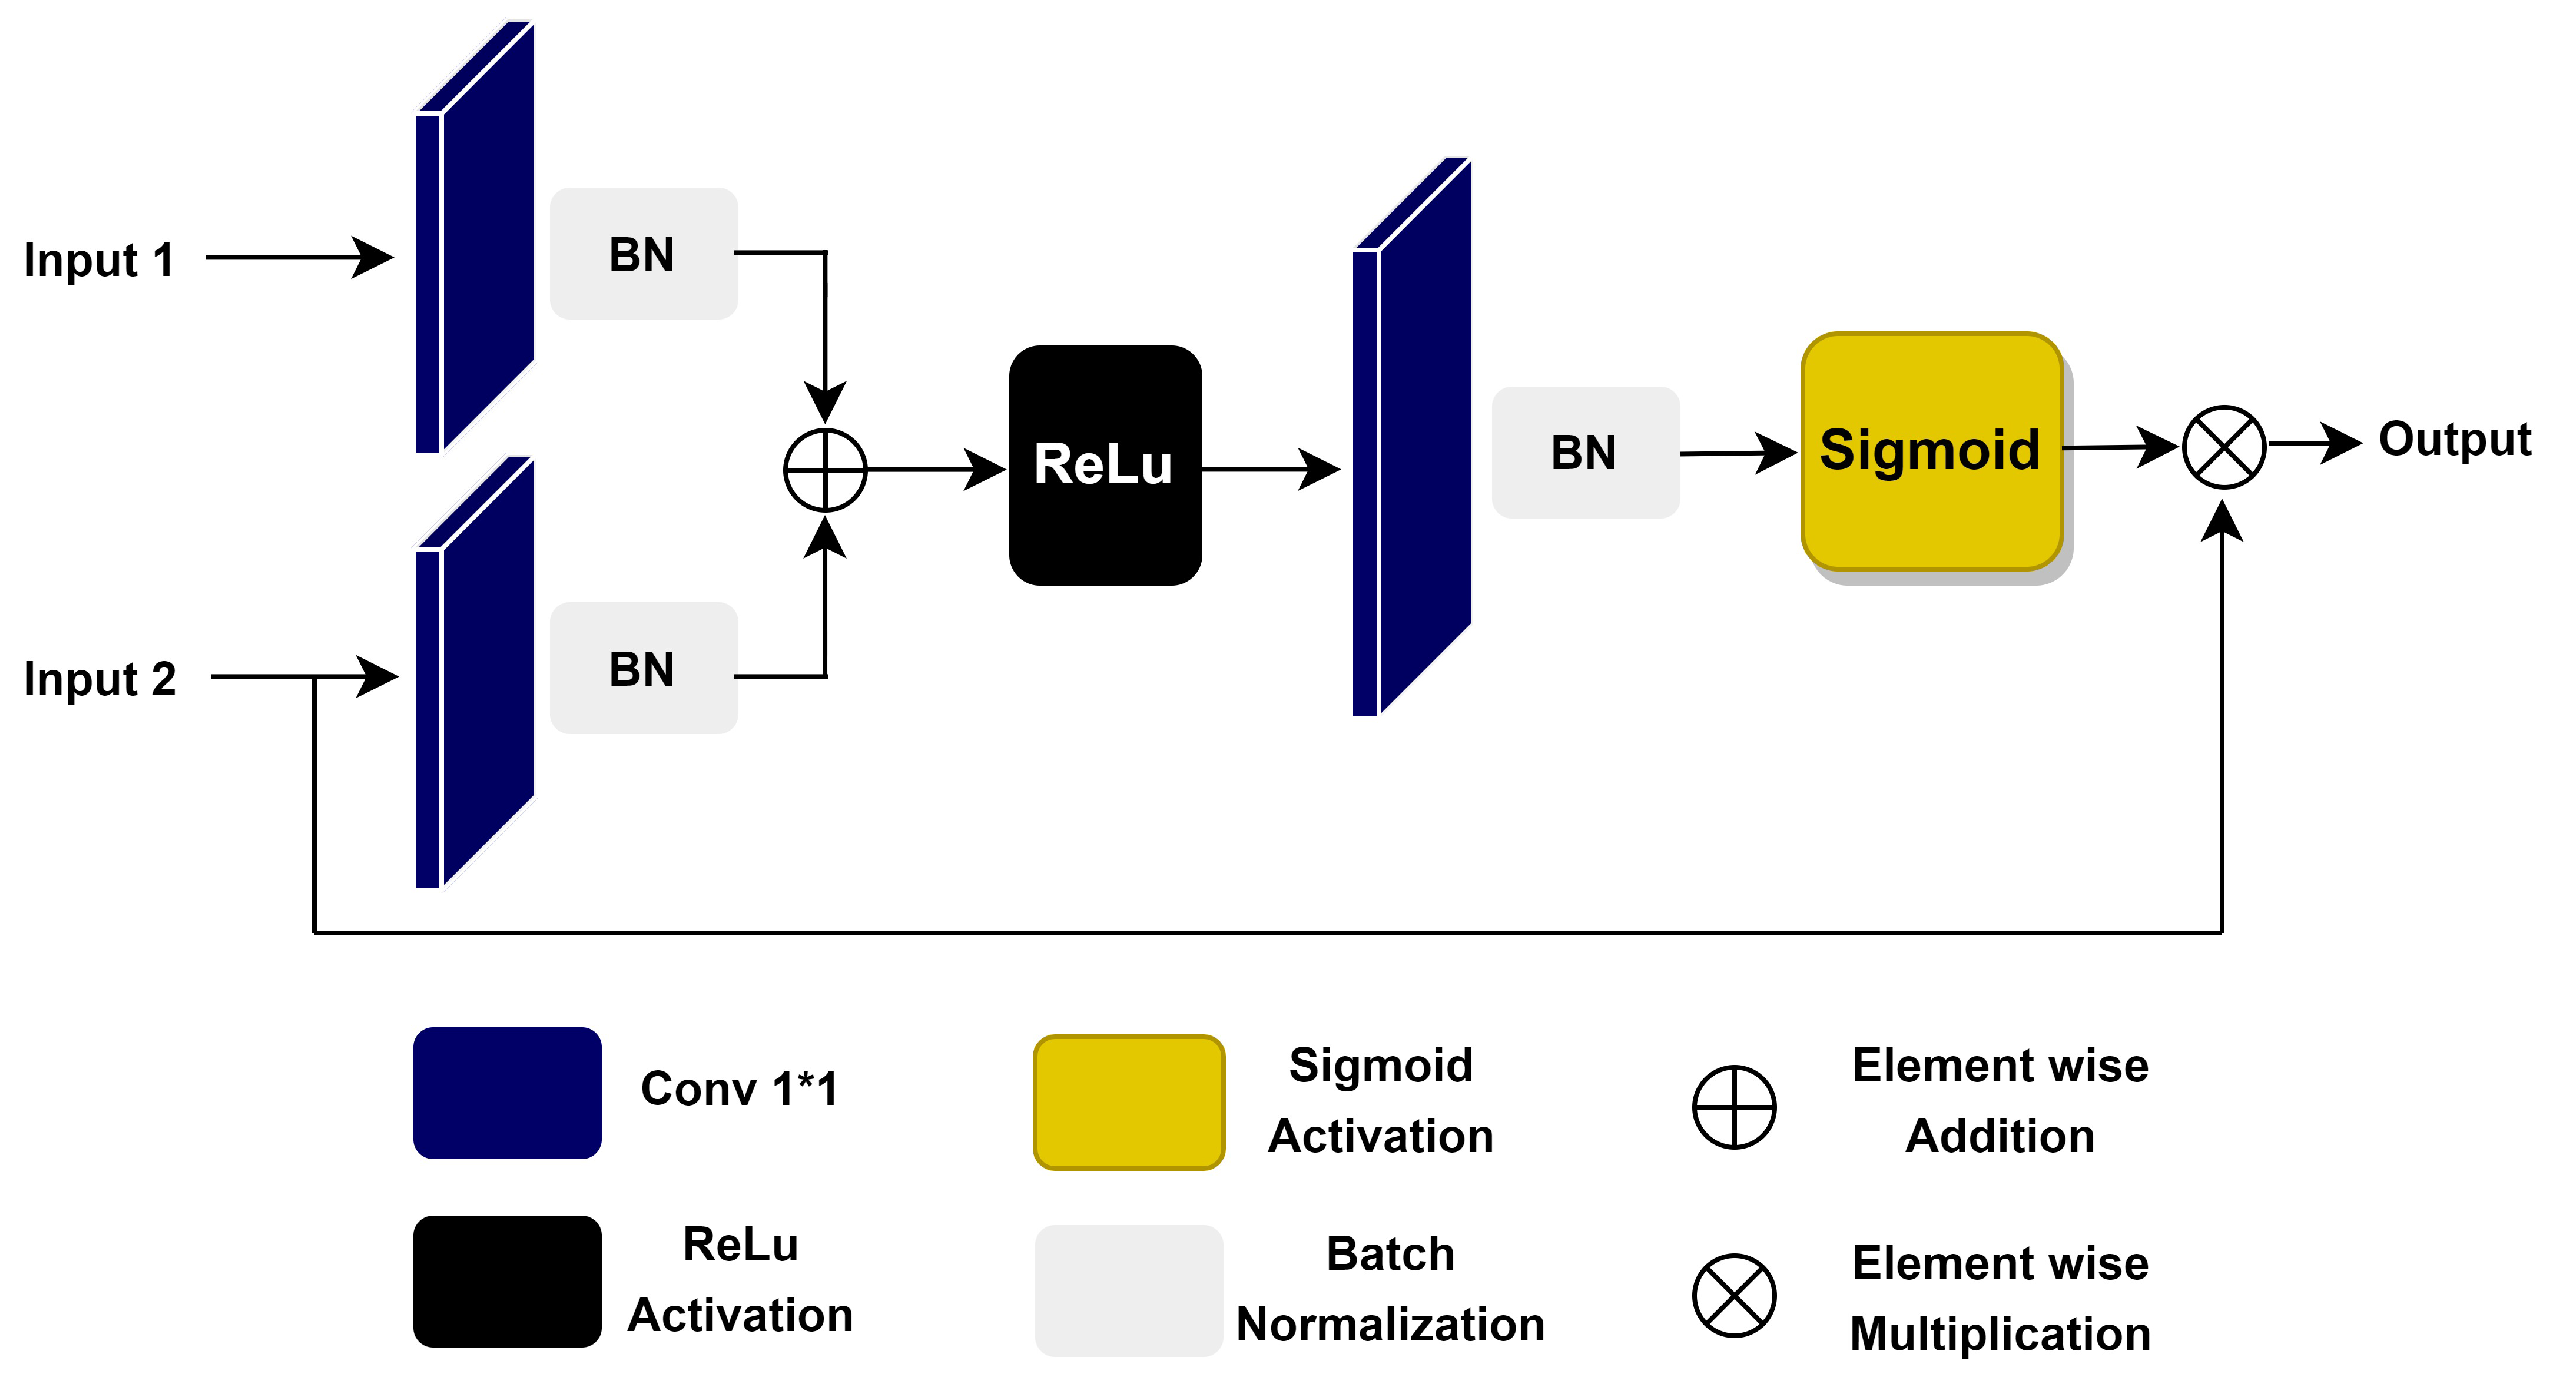
3.3. Attention Gate Block

Figure 5 illustrates the attention gate block. In image segmentation, particularly in this case, where the total number of classes is 24, the accurate segmentation of micro-defects in EL images is a complex task. Due to class imbalances, various micro-defects occupy narrow pixel regions in an image. To effectively localize micro-defects such as cracks, gridlines, and inactive areas, there is a need to focus only on particular regions in the feature maps. The attention gate (Ag) block is employed after the HFPE block to process the feature attributes and pinpoint only the relative regions of interest (ROI) before propagating the features to the decoder module. In this manner, the principal features are extracted by repressing the impertinent features, which leads to effective and precise segmentation localization. In [45,46,47], attention mechanisms were utilized to improve the segmentation performance of remote sensing and biomedical images. In a similar manner, Dong et al. [48] and Rahmat et al. [49] reported the utility of attention-based neural networks for crack segmentation by employing an encoder–decoder-based network and a generative adversarial network.

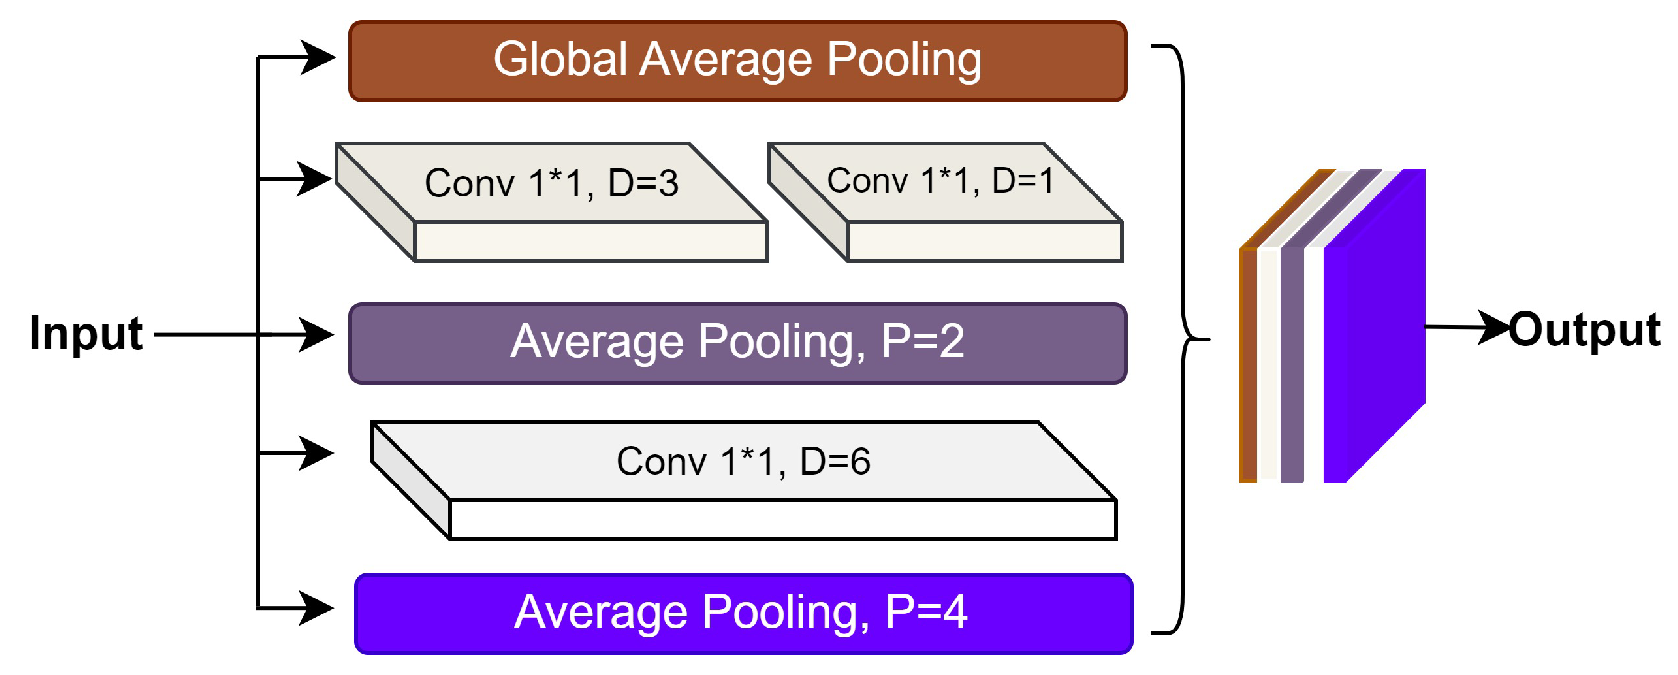
3.4. Contextual Characteristics Extraction and Attribute Fusion Block (CCEAF)

The CCEAF block is depicted in Figure 6. It is exploited to generate segmentation masks for EL images with various micro-defects such as cracks, inactive areas, and gridlines. It comprises dilated or atrous convolutional layers along with global pooling and average pooling layers. Three dilated conv layers are employed with dilation rates of 1, 3, and 6. Two average pooling layers are utilized with pool sizes set to 2 and 4 along with the global average pooling layer. Input features are provided in a parallel constellation to the four different layers of the CCEAF block. Two dilated conv layers are successively combined with dilation rates of 3 and 1, respectively. The outputs from all the layers are concatenated, where the respective layers include two average pooling layers with pool sizes of 2 and 4, a global pooling layer, a dilated conv layer with a dilation rate of 6, and two combined dilated conv layers. The CCEAF block is employed to understand the contextual representations of the feature maps. The total number of classes is 24, which includes micro-defects such as cracks and gridlines that spread across a very narrow range of image pixels. For this reason, understanding the characteristics of the global and local contexts is necessary. Dilated convolutions are crucial to capture comprehensive details in the feature maps by expanding the receptive region, thus enabling the network to gather context information over a wider region. This combined effect of average pooling, global pooling, and dilated convolutions consequently improves the overall segmentation performance.

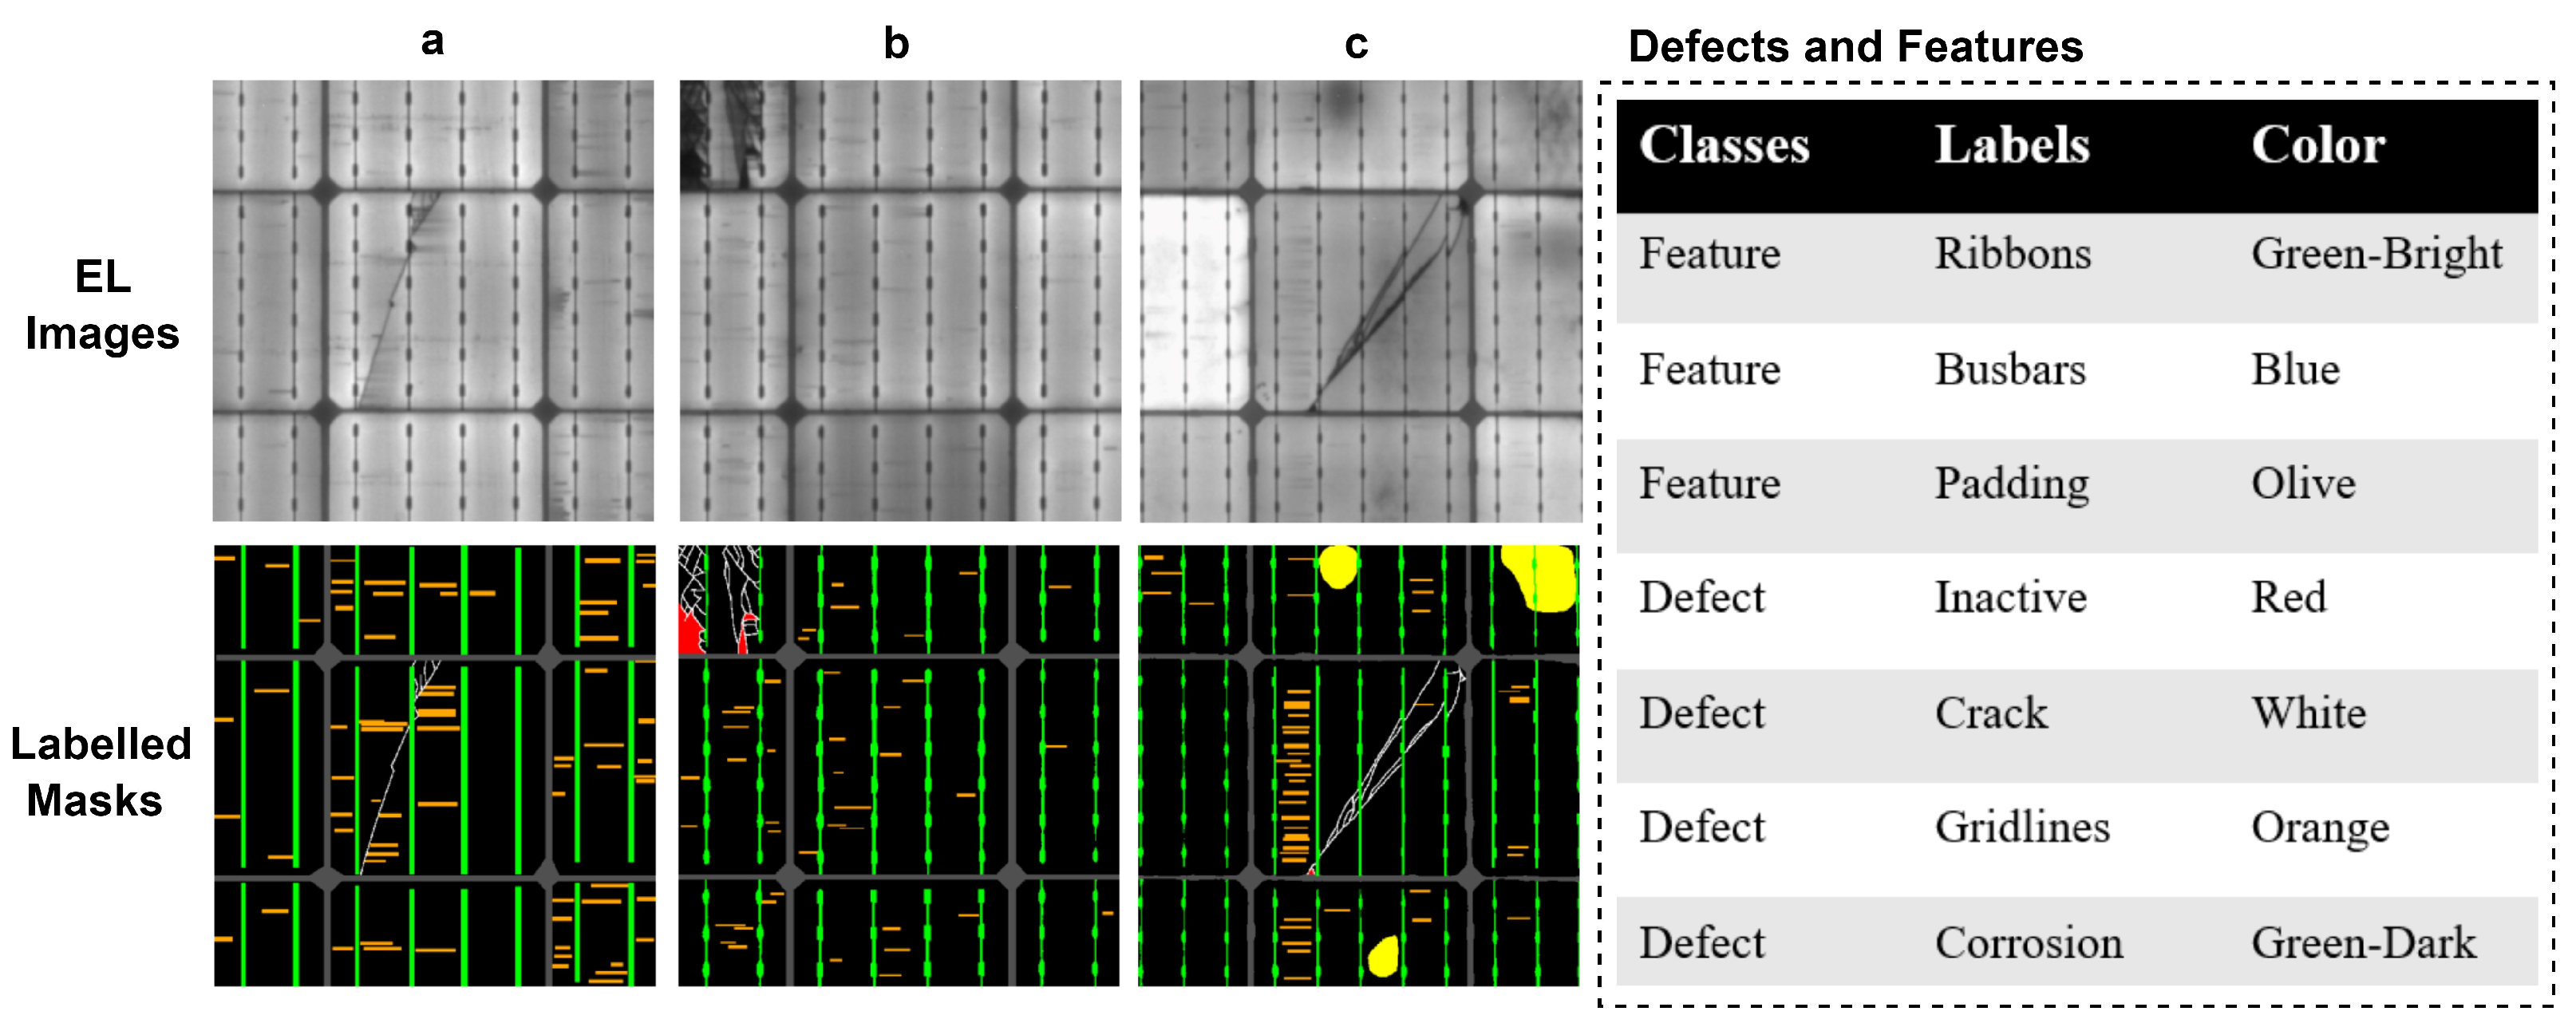
4. Dataset and Materials

The dataset for this research work was obtained from [43] and comprises 24 different classes. It is further subdivided into 12 generalized innate features of solar PV modules and 12 defects. The dataset comprises images displaying these 24 classes (defects and inbuilt features), which are specifically highlighted during the dataset preparation phase. These classes correspond to various defects that can occur during the lifespan of a solar PV module. The size of an EL image of a solar cell is 512 × 512 pixels. A total of 593 EL images were utilized, with an almost equal number of images for multi-crystalline and mono-crystalline solar wafers [43]. The dataset consists of 1912 images for training purposes and 54 images for model validation, comprising 896 mono-crystalline solar cell images and 1016 multi-crystalline solar cell images. For testing the model, a set of 50 images was utilized, which comprised an equal number of multi- and mono-crystalline solar wafers. The details of the dataset, including the total number of images, image size, total number of classes, and the training images split, are provided in Table 1. Defects such as cracks, inactive areas, and gridlines are frequent in testing images, consequently allowing for the evaluation of the model’s robustness against various micro-defects.

Class Weights

For effective model training, a crucial parameter involves choosing the weights for all classes in the dataset. Weight assignment refers to the critical emphasis given to a certain class, which is based on the numerical value that is given to the respective class during the training phase of the model. Two types of training strategies were utilized. The first one involved assigning equal class weights to all classes. A weight of 0.25 was experimentally assigned to all 24 classes in the first training phase. The other training strategy involved selecting custom class weights for classes such as cracks, inactive areas, gridlines, and ribbons. Certain defects were given higher priority over others. A value of 0.45 was assigned to cracks due to their very small pixel range in images, as these micro-defects occupy very narrow regions in EL images. The model was trained using the second training strategy by focusing on certain micro-defects based on their weight assignments. Table 2 illustrates the class-weight assignments for two categories, i.e., equal class weights and custom class weights.

5. Experimental Details

5.1. Performance Metrics

To analyze the performance of the aforementioned framework, evaluation metrics are imperative. For this reason, we selected a dynamic set of metrics to judge the segmentation efficiency and precision of the model on the 24 different classes. The metrics include the mean intersection over union (mIoU), precision, F1 score, recall, intersection over union (IoU), and Dice coefficient (DC). Mathematically, these metrics can be expressed as follows:
D i c e C o e f f i c i e n t = 2 × | J K | | J | + | K |
I o U ( J , K ) = | J K | | J K |
F 1 _ S c o r e = 2 T P 2 T P + F P + F N
P r e c i s i o n = T P T P + F P
R e c a l l = T P T P + F N
where T P represents true positive, T N represents true negative, F P represents false positive, and F N represents false negative.

5.2. Implementation Details

The proposed framework for segmenting EL images of solar PV modules comprises three parts. In the first step, the dataset containing the EL images was obtained from [40,43]. In the second step, model training and validation were performed using the TensorFlow framework. For higher computations, we utilized a graphic processing unit (GPU) for faster processing. The deployed GPU was an NVIDIA TITAN Xp P8 with 12 GB of allocated memory. During the training phase, the Adam optimizer [47] was utilized along with the weighted focal loss function with a learning rate of 0.001. The number of iterations for model training was set at 30 epochs with a batch size of 8. The implementation of the TensorFlow script can be accessed from the following GitHub link: SEiPV-Net github link.

6. Performance Evaluation and Discussion

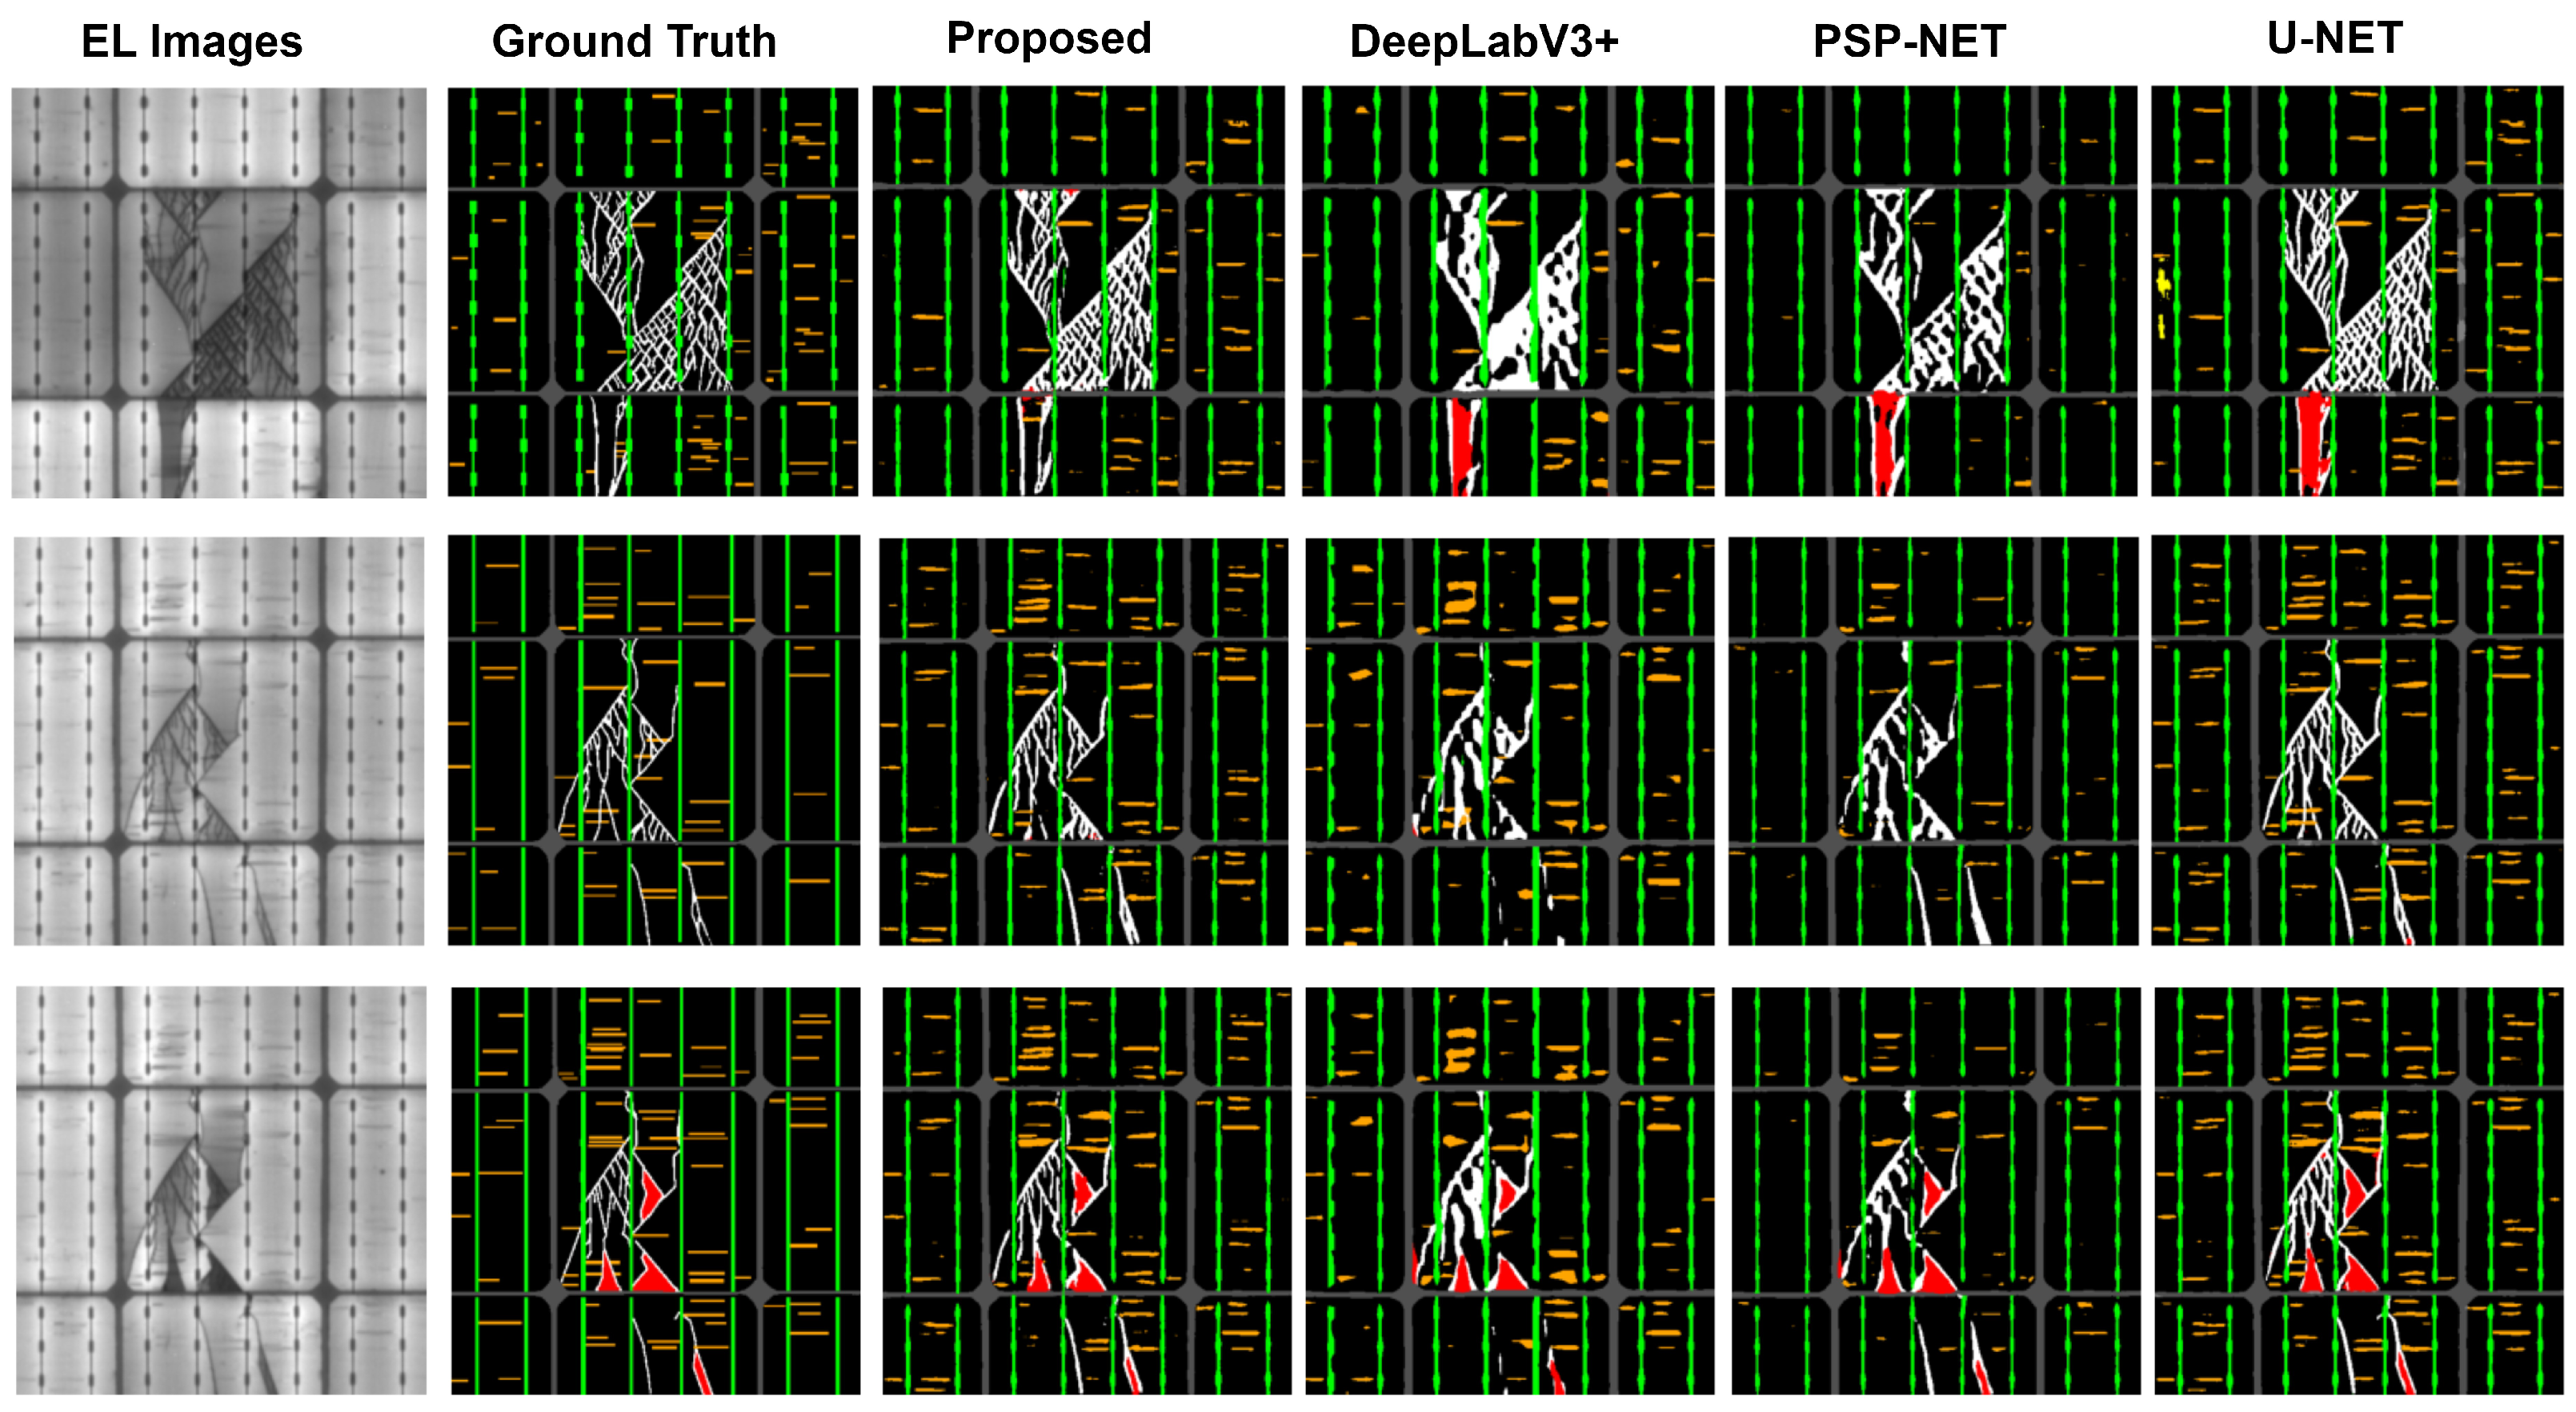
6.1. Comparison with Existing Techniques

Table 3 depicts a comparative analysis of the proposed model with three state-of-the-art models for semantic segmentation: DeepLabv3+, U-Net, and PSP-Net. For the performance comparison, we applied these three models to the same dataset of EL images and obtained their respective results. The experimental and visual results were recorded for analysis. The DeepLabv3+ model utilizes an Xception backbone trained on an ImageNet dataset [50]. The PSP-Net model comprises a pre-trained ResNet50 [51] backbone trained on an ImageNet dataset. In Table 3, the best results are highlighted in bold. It is evident from the experimental results that the proposed model performed optimally for both types of class weights. In the case of equal class weights, the mIoU was 0.8604, the F1 score was 0.9426, the recall was 0.9362, the IoU was 0.7447, the precision was 0.9491, and the Dice coefficient was 0.8531. When considering custom class weights, the mIoU was 0.8573, the F1 score was 0.9375, the recall was 0.9290, the precision was 0.9463, the IoU was 0.7124, and the Dice coefficient was 0.8312.
In addition to the analysis of the experimental results, we performed a visual assessment of both types of class weights. Firstly, the performance of the methods using equal class weights (ECW) was evaluated. Figure 7 presents a visual comparison between the proposed technique and the SOTA models, i.e., DeepLabv3+, U-Net, and PSP-Net, based on equal class weights. It is evident that the proposed model exhibits superior visual performance compared to the SOTA techniques. Considering custom class weights is also crucial due to class imbalance issues. Various defects, such as cracks, inactive areas, and gridlines, occupy quite a small pixel range in EL images. For this reason, we utilized a custom weight assignment strategy, in which more emphasis was given to classes occupying a narrow pixel range. The custom class weights are listed in Table 2. A visual comparison between the proposed model and other SOTA models—DeepLabv3+, U-Net, and PSP-Net—using custom class weights is illustrated in Figure 8.
When observing the visual performance illustrated in Figure 4 for equal class weights, it is apparent that the three SOTA models perform inadequately, as they lack the ability to precisely segment the defects. The segmentation aptitude of the proposed model is far more accurate compared to that of the comparative techniques, even when equal weight is assigned to micro-defects, as it is a challenging task to segment these micro-defects among dominant classes. The proposed model segments the classes precisely and effectively compared to the SOTA techniques when utilizing custom class weights. Figure 5 shows that by assigning custom class weights to specific classes, the visual performance of the three SOTA methods improved compared to the case of equal class weight assignments, but they still lacked precision in segmenting the micro-defects.

6.2. Ablation Study

In order to understand the capability of each individual block to enhance the performance of the proposed framework, we conducted an ablation study. A set of six different combinations of encoder and decoder blocks was selected to systematically understand the performance of each block. Table 4 lists the results of seven different experiments and compares the results with the proposed model.
The ablation study was performed using equal class weights. In the first experiment, a conventional encoder (ConvE) and conventional decoder (ConvD) were utilized with an attention gate (Ag). The ConvE and ConvD utilized a generic block with two 3 × 3 convolutional layers. Each layer employed ReLu activation and batch normalization. To understand the capability of the DSF block, we replaced the ConvE block with a DSF block to perform a second experiment in the ablation study. Further, an HFPE block was introduced to understand the utility of the HFPE block. Moreover, a CCEAF block was utilized in the decoder part while choosing a ConvE for the encoder with an attention gate. In this manner, the performance of the CCEAF block could be analyzed. In another experiment, an HFPE block was utilized along with a CCEAF block and an Ag block while using a ConvE for the encoder module. Finally, a DSF block was employed in the encoder and a CCEAF block in the decoder, without utilizing an HFPE block. The model parameters for all six experiments were also recorded for analysis. Lastly, the results of the proposed model incorporating all the respective blocks were compared to the results of all six experiments in the ablation study.

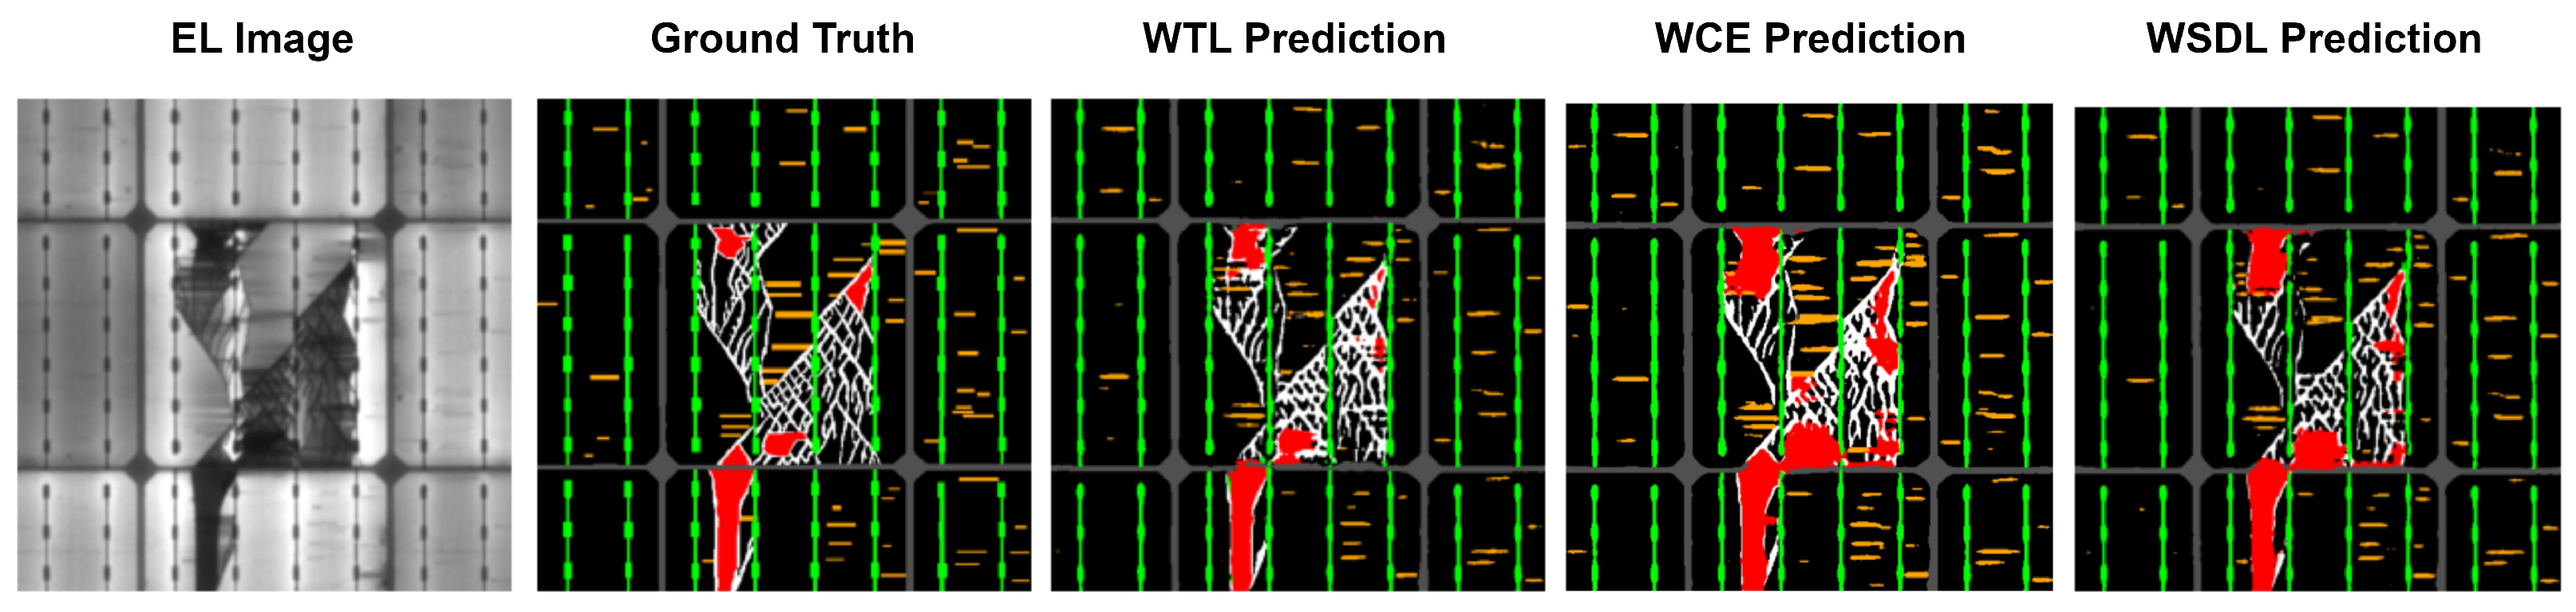
6.3. Comparative Analysis of Loss Functions

As some classes were spread over a wide pixel region in the EL images, we further explored the effect of utilizing three different loss functions to observe their effects on various class imbalances. The weighted cross-entropy loss (WCE) [52,53] was employed using custom class weights. Similarly, using custom class-weight assignments, we employed the weighted squared Dice loss (WSDL), as it has previously been utilized in medical image segmentation [54]. Lastly, we utilized the weighted Tanimoto loss (WTL) function, which has previously been used for the semantic segmentation of remote sensing images [55]. The Dice coefficient, precision, recall, IoU, F1 score, and mIoU values for all experiments employing the three loss functions are depicted in Table 5. The bold values highlight the optimal results. The weighted Tanimoto loss outperformed the WCE and WSDL, but the WCE achieved the highest mIoU value of 0.8600. Custom class-weight assignments were employed and the proposed model was trained three times utilizing the three different loss functions. A visual analysis of these three experiments is illustrated in Figure 9.

6.4. Comparative Analysis Based on Model Parameters

As mentioned in Section 2, one of the key features of the proposed model is its lightweight attribute. This can be illustrated by carrying out an experimental analysis by comparing the model parameters of the three state-of-the-art techniques to those of the proposed framework. The proposed model outperformed all three SOTA methods, as it comprised 853,152 model parameters, making it a lightweight framework. For this reason, in this section, we analyze DeepLabv3+, U-Net, and PSP-Net, along with the proposed model, based on the number of model parameters. Moreover, the model’s average inference time in seconds (sec) is compared to that of the three SOTA methods. Table 6 lists the parameters and average inference times for all three SOTA models and the proposed model. It is evident that the proposed model outperformed all three SOTA models. Moreover, the proposed model exhibited a reduced number of model parameters, making it a less computationally extensive and more lightweight model compared to DeepLabv3+, U-Net, and PSP-Net.

6.5. Implementation Challenges

Obtaining a labeled and extensive dataset for training, validation, and testing purposes was a challenge. Collecting EL images and carrying out the labeling process to generate an effective dataset requires resources and is deemed an assiduous process. For this reason, we acquired a dataset from [43]. Hyperparameter tuning is another step that requires significant time. In the experimental setup, we adopted two types of training strategies, i.e., equal and custom class weights. Choosing the appropriate class weights for each class required multiple trials, which was a time-consuming process. Another factor was the selection of the optimum loss function for the experimental setup. In this scenario, the weighted focal loss was employed for training, validation, and testing purposes. Further, we also compared the effects of three different loss functions: the weighted cross-entropy loss, weighted Tanimoto loss, and weighted squared Dice loss.

6.6. Limiting Factors and Future Prospects

The accurate segmentation of 24 classes in the EL images was a challenging task, as each class occupied a dynamic range of pixels within the images. Defects such as cracks, inactive regions, ribbons, and gridlines required custom weight assignments for carrying out segmentation. Adapting custom weight assignments allowed for the segmentation of the aforementioned defects, but the pixels became spread out, which affected precise segmentation. Since the dataset we used was originally from [43], inaccurate labeling consequently led to lower segmentation performance. The size of a dataset can directly impact the overall segmentation accuracy, and in this case, a total of 2016 images were utilized for training, validation, and testing purposes. The significant number of EL images was an obstacle to training the model so that it could learn the features of all 24 classes and perform precise segmentation. Another key aspect was the optimization of the hyperparameters of the network. In future studies, one important aspect would be to deploy a hyperparameter optimization technique rather than experimentally setting the hyperparameters. The overall size of the dataset would improve the network’s performance. Further increasing the number of classes or defects to incorporate various defects that can occur during the overall lifespan of PV modules would be beneficial for autonomous segmentation.

7. Conclusions

We present SEiPV-Net, a novel encoder–decoder-based network for segmenting EL Images of solar PV modules. Our method handles the segmentation of 24 separate classes, taking into account both intrinsic characteristics and picture flaws. Dense and Successive Features (DSF), Hierarchical Feature Precision and Extraction (HFPE), Contextual Characteristics Extraction and Attribute Fusion (CCEAF), and attention gate blocks are the four main components of SEiPV-Net. We use two distinct model training procedures to evaluate the performance of SEiPV-Net: equal class-weight and bespoke class-weight assignments. Qualitative and quantitative comparative analyses are carried out between SEiPV-Net, DeepLabv3+, U-Net, and PSP-Net. We investigate the use of three alternative loss functions during training and testing: the weighted cross-entropy (WCE) loss, weighted squared Dice loss (WSDL), and weighted Tanimoto loss (WTL). An ablation study is also carried out to better understand the role of each individual block in the encoder and decoder modules. The model parameters are also analyzed and compared to the aforementioned state-of-the-art methodologies, emphasizing SEiPV-Net’s lightweight nature. This thorough study sheds light on the efficacy of our proposed framework, emphasizing its potential for precise and efficient segmentation of EL imagery of solar PV modules.

Author Contributions

Conceptualization: H.E., S.J., M.U.R., Y.J. and K.T.C.; methodology: H.E., S.J. and M.U.R.; software: H.E., S.J., M.U.R. and Y.J.; validation: M.U.R. and K.T.C.; investigation: H.E., S.J., M.U.R., Y.J. and K.T.C.; writing—original draft preparation: H.E. and M.U.R.; writing—review and editing: H.E., S.J., M.U.R., Y.J. and K.T.C.; supervision: M.U.R. and K.T.C.; project administration, M.U.R. and K.T.C.; funding acquisition, K.T.C. All authors have read and agreed to the published version of the manuscript.

Funding

This work was supported by the “Human Resources Program in Energy Technology” of the Korea Institute of Energy Technology Evaluation and Planning (KETEP); the Ministry of Trade, Industry, and Energy, Republic of Korea (No. 20204010600470); and the National Research Foundation (NRF) of Korea grant funded by the Korean government (MSIT) (No. 2020R1A2C2005612).

Data Availability Statement

Data are contained within the article.

Conflicts of Interest

The authors declare no conflict of interest. The funders had no role in the design of the study; in the collection, analyses, or interpretation of data; in the writing of the manuscript, or in the decision to publish the results.

References

  1. Tu, Q.; Mo, J.; Betz, R.; Cui, L.; Fan, Y.; Liu, Y. Achieving grid parity of solar PV power in China-The role of Tradable Green Certificate. Energy Policy 2020, 144, 111681. [Google Scholar] [CrossRef]
  2. Adams, S.; Nsiah, C. Reducing carbon dioxide emissions; Does renewable energy matter? Sci. Total. Environ. 2019, 693, 133288. [Google Scholar] [CrossRef]
  3. Yang, Z.; Zhang, M.; Liu, L.; Zhou, D. Can renewable energy investment reduce carbon dioxide emissions? Evidence from scale and structure. Energy Econ. 2022, 112, 106181. [Google Scholar] [CrossRef]
  4. Peike, C.; Hädrich, I.; Weiß, K.A.; Dürr, I.; Ise, F. Overview of PV module encapsulation materials. Photovoltaics Int. 2013, 19, 85–92. [Google Scholar]
  5. Makrides, G.; Theristis, M.; Bratcher, J.; Pratt, J.; Georghiou, G.E. Five-year performance and reliability analysis of monocrystalline photovoltaic modules with different backsheet materials. Sol. Energy 2018, 171, 491–499. [Google Scholar] [CrossRef]
  6. Haque, A.; Bharath, K.V.S.; Khan, M.A.; Khan, I.; Jaffery, Z.A. Fault diagnosis of photovoltaic modules. Energy Sci. Eng. 2019, 7, 622–644. [Google Scholar] [CrossRef]
  7. Gu, Q.; Li, S.; Gong, W.; Ning, B.; Hu, C.; Liao, Z. L-SHADE with parameter decomposition for photovoltaic modules parameter identification under different temperature and irradiance. Appl. Soft Comput. 2023, 143, 110386. [Google Scholar] [CrossRef]
  8. Makrides, G.; Zinsser, B.; Schubert, M.; Georghiou, G.E. Performance loss rate of twelve photovoltaic technologies under field conditions using statistical techniques. Sol. Energy 2014, 103, 28–42. [Google Scholar] [CrossRef]
  9. Buerhop, C.; Bommes, L.; Schlipf, J.; Pickel, T.; Fladung, A.; Peters, M. Infrared imaging of photovoltaic modules A review of the state of the art and future challenges facing gigawatt photovoltaic power stations. Prog. Energy 2022, 4, 042010. [Google Scholar] [CrossRef]
  10. Rahaman, S.A.; Urmee, T.; Parlevliet, D.A. PV system defects identification using Remotely Piloted Aircraft (RPA) based infrared (IR) imaging: A review. Sol. Energy 2020, 206, 579–595. [Google Scholar] [CrossRef]
  11. Fuyuki, T.; Tani, A. Photographic diagnosis of crystalline silicon solar cells by electroluminescence. In Experimental and Applied Mechanics, Volume 6: Proceedings of the 2010 Annual Conference on Experimental and Applied Mechanics; Springer: Berlin/Heidelberg, Germany, 2011; pp. 159–162. [Google Scholar]
  12. Breitenstein, O.; Bauer, J.; Bothe, K.; Hinken, D.; Müller, J.; Kwapil, W.; Schubert, M.C.; Warta, W. Can luminescence imaging replace lock-in thermography on solar cells? IEEE J. Photovoltaics 2011, 1, 159–167. [Google Scholar] [CrossRef]
  13. Fuyuki, T.; Kondo, H.; Yamazaki, T.; Takahashi, Y.; Uraoka, Y. Photographic surveying of minority carrier diffusion length in polycrystalline silicon solar cells by electroluminescence. Appl. Phys. Lett. 2005, 86, 262108. [Google Scholar] [CrossRef]
  14. Fuyuki, T.; Kitiyanan, A. Photographic diagnosis of crystalline silicon solar cells utilizing electroluminescence. Appl. Phys. A 2009, 96, 189–196. [Google Scholar] [CrossRef]
  15. Deitsch, S.; Christlein, V.; Berger, S.; Buerhop-Lutz, C.; Maier, A.; Gallwitz, F.; Riess, C. Automatic classification of defective photovoltaic module cells in electroluminescence images. Sol. Energy 2019, 185, 455–468. [Google Scholar] [CrossRef]
  16. Shujaat, M.; Wahab, A.; Tayara, H.; Chong, K.T. pcPromoter-CNN: A CNN-based prediction and classification of promoters. Genes 2020, 11, 1529. [Google Scholar] [CrossRef]
  17. Karimi, A.M.; Fada, J.S.; Hossain, M.A.; Yang, S.; Peshek, T.J.; Braid, J.L.; French, R.H. Automated pipeline for photovoltaic module electroluminescence image processing and degradation feature classification. IEEE J. Photovoltaics 2019, 9, 1324–1335. [Google Scholar] [CrossRef]
  18. Tsai, D.M.; Wu, S.C.; Li, W.C. Defect detection of solar cells in electroluminescence images using Fourier image reconstruction. Sol. Energy Mater. Sol. Cells 2012, 99, 250–262. [Google Scholar] [CrossRef]
  19. Anwar, S.A.; Abdullah, M.Z. Micro-crack detection of multicrystalline solar cells featuring an improved anisotropic diffusion filter and image segmentation technique. Eurasip J. Image Video Process. 2014, 2014, 15. [Google Scholar] [CrossRef]
  20. Rehman, M.U.; Akhtar, S.; Zakwan, M.; Mahmood, M.H. Novel architecture with selected feature vector for effective classification of mitotic and non-mitotic cells in breast cancer histology images. Biomed. Signal Process. Control 2022, 71, 103212. [Google Scholar] [CrossRef]
  21. Rehman, M.U.; Ryu, J.; Nizami, I.F.; Chong, K.T. RAAGR2-Net: A brain tumor segmentation network using parallel processing of multiple spatial frames. Comput. Biol. Med. 2023, 152, 106426. [Google Scholar] [CrossRef]
  22. Ronneberger, O.; Fischer, P.; Brox, T. U-net: Convolutional networks for biomedical image segmentation. In Proceedings of the Medical Image Computing and Computer-Assisted Intervention–MICCAI 2015: 18th International Conference, Munich, Germany, 5–9 October 2015; Proceedings, Part III 18. Springer: Berlin/Heidelberg, Germany, 2015; pp. 234–241. [Google Scholar]
  23. Rehman, M.U.; Cho, S.; Kim, J.; Chong, K.T. Brainseg-net: Brain tumor mr image segmentation via enhanced encoder–decoder network. Diagnostics 2021, 11, 169. [Google Scholar] [CrossRef] [PubMed]
  24. Rehman, M.U.; Cho, S.; Kim, J.H.; Chong, K.T. Bu-net: Brain tumor segmentation using modified u-net architecture. Electronics 2020, 9, 2203. [Google Scholar] [CrossRef]
  25. Oktay, O.; Schlemper, J.; Folgoc, L.L.; Lee, M.; Heinrich, M.; Misawa, K.; Mori, K.; McDonagh, S.; Hammerla, N.Y.; Kainz, B.; et al. Attention u-net: Learning where to look for the pancreas. arXiv 2018, arXiv:1804.03999. [Google Scholar]
  26. Cahall, D.E.; Rasool, G.; Bouaynaya, N.C.; Fathallah-Shaykh, H.M. Dilated inception U-net (DIU-net) for brain tumor segmentation. arXiv 2021, arXiv:2108.06772. [Google Scholar]
  27. Zhou, Z.; Rahman Siddiquee, M.M.; Tajbakhsh, N.; Liang, J. Unet++: A nested u-net architecture for medical image segmentation. In Proceedings of the Deep Learning in Medical Image Analysis and Multimodal Learning for Clinical Decision Support: 4th International Workshop, DLMIA 2018, and 8th International Workshop, ML-CDS 2018, Held in Conjunction with MICCAI 2018, Granada, Spain, 20 September 2018; Proceedings 4. Springer: Berlin/Heidelberg, Germany, 2018; pp. 3–11. [Google Scholar]
  28. Ryu, J.; Rehman, M.U.; Nizami, I.F.; Chong, K.T. SegR-Net: A deep learning framework with multi-scale feature fusion for robust retinal vessel segmentation. Comput. Biol. Med. 2023, 163, 107132. [Google Scholar] [CrossRef]
  29. Alom, M.Z.; Hasan, M.; Yakopcic, C.; Taha, T.M.; Asari, V.K. Recurrent residual convolutional neural network based on u-net (r2u-net) for medical image segmentation. arXiv 2018, arXiv:1802.06955. [Google Scholar]
  30. Chen, L.C.; Papandreou, G.; Schroff, F.; Adam, H. Rethinking atrous convolution for semantic image segmentation. arXiv 2017, arXiv:1706.05587. [Google Scholar]
  31. Chen, L.C.; Zhu, Y.; Papandreou, G.; Schroff, F.; Adam, H. Encoder-decoder with atrous separable convolution for semantic image segmentation. In Proceedings of the European Conference on Computer Vision (ECCV), Munich, Germany, 8–14 September 2018; pp. 801–818. [Google Scholar]
  32. Lewis, J.; Cha, Y.J.; Kim, J. Dual encoder–decoder-based deep polyp segmentation network for colonoscopy images. Sci. Rep. 2023, 13, 1183. [Google Scholar] [CrossRef]
  33. Choi, W.; Cha, Y.J. SDDNet: Real-time crack segmentation. IEEE Trans. Ind. Electron. 2019, 67, 8016–8025. [Google Scholar] [CrossRef]
  34. Demirci, M.Y.; Beşli, N.; Gümüşçü, A. Efficient deep feature extraction and classification for identifying defective photovoltaic module cells in Electroluminescence images. Expert Syst. Appl. 2021, 175, 114810. [Google Scholar] [CrossRef]
  35. Tang, W.; Yang, Q.; Hu, X.; Yan, W. Convolution neural network based polycrystalline silicon photovoltaic cell linear defect diagnosis using electroluminescence images. Expert Syst. Appl. 2022, 202, 117087. [Google Scholar] [CrossRef]
  36. Rahman, M.R.U.; Chen, H. Defects inspection in polycrystalline solar cells electroluminescence images using deep learning. IEEE Access 2020, 8, 40547–40558. [Google Scholar] [CrossRef]
  37. Cheng, D.; Chen, L.; Lv, C.; Guo, L.; Kou, Q. Light-Guided and Cross-Fusion U-Net for Anti-Illumination Image Super-Resolution. IEEE Trans. Circuits Syst. Video Technol. 2022, 32, 8436–8449. [Google Scholar] [CrossRef]
  38. Chen, H.; Zhao, H.; Han, D.; Liu, K. Accurate and robust crack detection using steerable evidence filtering in electroluminescence images of solar cells. Opt. Lasers Eng. 2019, 118, 22–33. [Google Scholar] [CrossRef]
  39. Cong, R.; Sheng, H.; Yang, D.; Cui, Z.; Chen, R. Exploiting Spatial and Angular Correlations with Deep Efficient Transformers for Light Field Image Super-Resolution. IEEE Trans. Multimed. 2023, 1–14. [Google Scholar] [CrossRef]
  40. Pratt, L.; Govender, D.; Klein, R. Defect detection and quantification in electroluminescence images of solar PV modules using U-net semantic segmentation. Renew. Energy 2021, 178, 1211–1222. [Google Scholar] [CrossRef]
  41. Cha, Y.J.; Choi, W.; Büyüköztürk, O. Deep learning-based crack damage detection using convolutional neural networks. Comput.-Aided Civ. Infrastruct. Eng. 2017, 32, 361–378. [Google Scholar] [CrossRef]
  42. Cha, Y.J.; Choi, W.; Suh, G.; Mahmoudkhani, S.; Büyüköztürk, O. Autonomous structural visual inspection using region-based deep learning for detecting multiple damage types. Comput.-Aided Civ. Infrastruct. Eng. 2018, 33, 731–747. [Google Scholar] [CrossRef]
  43. Pratt, L.; Mattheus, J.; Klein, R. A benchmark dataset for defect detection and classification in electroluminescence images of PV modules using semantic segmentation. Syst. Soft Comput. 2023, 5, 200048. [Google Scholar] [CrossRef]
  44. Schlemper, J.; Oktay, O.; Schaap, M.; Heinrich, M.; Kainz, B.; Glocker, B.; Rueckert, D. Attention gated networks: Learning to leverage salient regions in medical images. Med. Image Anal. 2019, 53, 197–207. [Google Scholar] [CrossRef]
  45. Zhao, Q.; Liu, J.; Li, Y.; Zhang, H. Semantic segmentation with attention mechanism for remote sensing images. IEEE Trans. Geosci. Remote Sens. 2021, 60, 5403913. [Google Scholar] [CrossRef]
  46. Hou, G.; Qin, J.; Xiang, X.; Tan, Y.; Xiong, N.N. Af-net: A medical image segmentation network based on attention mechanism and feature fusion. Comput. Mater. Contin. 2021, 69, 1877–1891. [Google Scholar] [CrossRef]
  47. Kingma, D.P.; Ba, J. Adam: A method for stochastic optimization. arXiv 2014, arXiv:1412.6980. [Google Scholar]
  48. Kang, D.H.; Cha, Y.J. Efficient attention-based deep encoder and decoder for automatic crack segmentation. Struct. Health Monit. 2022, 21, 2190–2205. [Google Scholar] [CrossRef] [PubMed]
  49. Ali, R.; Cha, Y.J. Attention-based generative adversarial network with internal damage segmentation using thermography. Autom. Constr. 2022, 141, 104412. [Google Scholar] [CrossRef]
  50. Deng, J.; Dong, W.; Socher, R.; Li, L.J.; Li, K.; Fei-Fei, L. Imagenet: A large-scale hierarchical image database. In Proceedings of the 2009 IEEE Conference on Computer Vision and Pattern Recognition, Miami, FL, USA, 20–25 June 2009; IEEE: Piscataway, NJ, USA, 2009; pp. 248–255. [Google Scholar]
  51. He, K.; Zhang, X.; Ren, S.; Sun, J. Deep residual learning for image recognition. In Proceedings of the IEEE Conference on Computer Vision and Pattern Recognition, Las Vegas, NV, USA, 30 June 2016; pp. 770–778. [Google Scholar]
  52. Ho, Y.; Wookey, S. The real-world-weight cross-entropy loss function: Modeling the costs of mislabeling. IEEE Access 2019, 8, 4806–4813. [Google Scholar] [CrossRef]
  53. Özdemir, Ö.; Sönmez, E.B. Weighted cross-entropy for unbalanced data with application on covid x-ray images. In Proceedings of the 2020 Innovations in Intelligent Systems and Applications Conference (ASYU), Istanbul, Turkey, 15–17 October 2020; IEEE: Piscataway, NJ, USA, 2020; pp. 1–6. [Google Scholar]
  54. Milletari, F.; Navab, N.; Ahmadi, S.A. V-net: Fully convolutional neural networks for volumetric medical image segmentation. In Proceedings of the 2016 Fourth International Conference on 3D Vision (3DV), Stanford, CA, USA, 25–28 October 2016; IEEE: Piscataway, NJ, USA, 2016; pp. 565–571. [Google Scholar]
  55. Diakogiannis, F.I.; Waldner, F.; Caccetta, P.; Wu, C. ResUNet-a: A deep learning framework for semantic segmentation of remotely sensed data. ISPRS J. Photogramm. Remote Sens. 2020, 162, 94–114. [Google Scholar] [CrossRef]
Figure 1. Three EL images are shown along with their labeled ground-truth masks (ac). Defects such as cracks, gridlines, and inactive regions and features, such as busbars, ribbons, and padding, are listed in the figure along with their respective color labels.
Energies 16 07726 g001
Figure 2. The network architecture of the proposed model. It comprises two parts: encoder and decoder modules.
Energies 16 07726 g002
Figure 3. Architecture of the DSF block.
Energies 16 07726 g003
Figure 4. Configuration of the HFPE block.
Energies 16 07726 g004
Figure 5. The architecture of the attention gate block. It comprises 3 convolutional layers: ReLU and Sigmoid activations, batch normalization, and element-wise addition and multiplication.
Energies 16 07726 g005
Figure 6. The architecture of the CCEAF block.
Energies 16 07726 g006
Figure 7. Visual performance of the three SOTA techniques and the proposed model using equal class weights.
Energies 16 07726 g007
Figure 8. Visual performance of the 3 SOTA methods and the proposed model using custom class weights.
Energies 16 07726 g008
Figure 9. Visual performance of the proposed model employing 3 different loss functions.
Energies 16 07726 g009
Table 1. Dataset details for experimental setup.
Total ImagesTraining Images SplitTotal Classes
Training Validation Testing Image Size EL Images Multi-Crystalline Mono-Crystalline Features Defects
19125450512 × 51259310168961212
Table 2. Weights of classes based on equal and custom assignments.
WeightsClasses
Background Inactive Crack Ribbons Gridline Remaining Classes
Equal Class Weights0.250.250.250.250.250.25
Custom Class Weights0.150.400.450.300.350.25
Table 3. Comparison between proposed model and SOTA methods based on class weights. Values in bold indicate superior results.
Class WeightsMethodDice CoefficientPrecisionIoURecallF1 ScoremIoU
Equal Class WeightsU-NET0.79570.94640.66330.91290.92900.8145
PSP-NET0.82270.93140.70430.91690.92410.8516
DeepLabV3+0.83630.93460.71980.91710.92580.8316
SEiPV-Net0.8531 0.9491 0.7447 0.9362 0.9426 0.8604
Custom Class WeightsU-NET0.75030.94360.60380.90280.92070.8065
PSP-NET0.80090.93850.67140.90550.92100.8329
DeepLabV3+0.82180.93250.69980.89600.91290.8457
SEiPV-Net 0.8312 0.9463 0.7124 0.9290 0.9375 0.8573
Table 4. Performance evaluation using ablation study. Values in bold indicate superior results.
Ablation StudyDice CoefficientIoUPrecisionF1 ScoreRecallmIoUModel Parameters
ConvE & ConvD + Ag0.78330.64400.93730.92160.90650.7881235,140
DSF & ConvD + Ag0.79820.66470.94710.93370.92080.8329773,412
DSF + HFPE & ConvD + Ag0.82160.69760.94840.93920.93020.8445867,012
ConvE & CCEAF + Ag0.83160.71260.93760.93050.92350.8441221,280
ConvE + HFPE & CCEAF + Ag0.83850.72270.94820.93950.93110.8542314,880
DSF & CCEAF + Ag0.84440.73080.94830.94150.93490.8539759,552
SEiPV-Net0.85310.74470.94910.94260.93620.8604853,152
Table 5. Performance of proposed model employing 3 different loss functions. Values in bold indicate superior results.
Custom Class WeightsDice CoefficientPrecisionIoURecallF1 ScoremIoU
WCE0.91510.94470.84420.93610.94040.8600
WSDL0.92530.94560.86160.93950.94260.8598
WTL0.92750.94920.86510.94160.94530.8477
Table 6. Analysis of the number of model parameters and average inference time. Values in bold indicate lower number of parameters and lesser average inference time.
ModelNo. of ParametersAverage Inference Time
U-NET31,056,7920.1048 s
PSP-NET1,711,3840.0967 s
DeepLabV3+37,709,5680.0938 s
Proposed853,1520.0931 s
Disclaimer/Publisher’s Note: The statements, opinions and data contained in all publications are solely those of the individual author(s) and contributor(s) and not of MDPI and/or the editor(s). MDPI and/or the editor(s) disclaim responsibility for any injury to people or property resulting from any ideas, methods, instructions or products referred to in the content.

