Article

Optimization of the Air Distribution in a Biomass Grate-Fired Furnace

1
School of Energy and Power Engineering, Changchun Institute of Technology, Changchun 130012, China
2
State Key Laboratory of Power Systems, Department of Energy and Power Engineering, Tsinghua University, Beijing 100084, China
3
College of Electrical and Power Engineering, Taiyuan University of Technology, Taiyuan 030024, China
*
Authors to whom correspondence should be addressed.
Energies 2023, 16(22), 7634; https://doi.org/10.3390/en16227634
Submission received: 9 October 2023 / Revised: 12 November 2023 / Accepted: 14 November 2023 / Published: 17 November 2023
(This article belongs to the Section B: Energy and Environment)

Abstract

:
This study utilized a combination of FLIC(1D3.2C) and FLUENT(2021R2) software to optimize the primary air distribution along the grate and the performance of a straw briquette combustion furnace of a 7 MW unit in China used to produce hot air for drying grain. Three air distribution modes, namely front-enhanced, uniform, and rear-enhanced modes, were analyzed to determine their effect on the flue gas components above the grate, the temperature field in the furnace, and the nitrogen oxide concentration at the furnace outlet. The results of the calculations showed that the NOx emissions for the front-enhanced, uniform, and rear-enhanced modes were 133.5 mg/Nm3, 104.4 mg/Nm3, and 76.6 mg/Nm3, respectively. It was found that the rear-enhanced mode can expand the biomass drying, devolatilization, and combustion zone, thus improving the furnace combustion performance and decreasing NOx emissions. These findings can provide useful guidance for optimizing biomass chain-grate-firing furnaces.

1. Introduction

Biomass energy represents the energy form of solar energy stored in biomass as a carrier of chemical energy. Biomass has the initial characteristics of carbon neutrality and low pollution, and its effective utilization can realize zero emission of carbon dioxide [1,2]. In China, biomass energy reserves are extremely abundant, while the effective utilization rate of biomass energy is currently extremely low. With the increasingly prominent environmental problems and energy shortages, more attention is being paid to the utilization of biomass energy. Many countries are actively involved in the development and utilization of biomass energy [3]. Direct combustion utilization is one of the more important ways for large-scale utilization [4]. Large-scale utilization of discarded biomass is conducive to not only promoting energy saving and emission reduction but also to increasing farmers’ income. Therefore, the effective and reasonable use of biomass not only has environmental benefits but also has social benefits, and it is of great significance to social and economic growth and ecological environment improvement [5].
At present, the main ways of large-scale combustion of biomass include grate firing and fluidized bed combustion [6]. However, in small-scale combustion, grate systems and fluidized bed systems each have advantages and disadvantages. However, grate systems have some technical advantages and are particularly suitable for biomass fuels with large particle size variations and high moisture and ash contents [7]. In addition, they have a cost advantage as they do not require high-pressure fans. They are therefore more suitable for decentralized utilization of biomass resources. In the northeast region of China, grate-firing hot air furnaces are usually used to produce hot air for drying grain. However, the existing coal-fired drying furnaces have the features of a relatively small scale, a large number, and higher pollutant emissions. According to environmental protection requirements, boilers with a capacity smaller than 10 t/h must be eliminated. The grain drying industry has already obtained an extension period depending on its particularity, but it has to find new technology. Additionally, resource allocation and cost factors make it difficult to replace coal with electricity or gas in the future. Considering the abundant resource of biomass, developing a biomass grate-firing furnace is the feasible solution. However, after changing the fuel to biomass, there were problems such as insufficient output, low combustion efficiency, and excessive pollutant emissions, so it is still urgent to optimize its combustion, especially by optimizing the air distribution mode [8,9].
For grate-firing furnaces, a reasonable air distribution mode is important for ensuring the combustion of the upper-layer material on the grate and improving the reliability, high efficiency, and low-pollutant-emission performance of the boiler. Given the above considerations, the air distribution mode should be optimized to guide its actual operation.
Traditionally, the choice of the air distribution mode for chain-grate furnaces relied mainly on the experience of the operators. Due to the lack of thorough theoretical understanding, the primary research methods are field adjustments or the use of cold flow fields in the furnace and the homogeneous combustion simulation of the gas phase [10]. To address this issue, Chang studied the effect of different ratios of the air on the process of combustion [11], while Wang used cold air to simulate flue gas behavior to guide the design of furnace arches [12]. Wang also compared literature experimental results to furnace flow and temperature fields for various arch types, based on a uniform distribution of flue gas inlet velocity and temperature [13]. Xu optimized the furnace arch and air distribution method and conducted a comparative analysis of the furnace interior flow field, temperature, and grate surface heat flux density distribution before and after adjusting the furnace arch size and air distribution method [14]. Ji et al. used natural gas to simulate the volatiles released from coal and investigated the unsteady combustion mechanism of an industrial moving grate boiler under two typical air distribution modes [15]. Zhao et al. conducted a numerical simulation study using FLIC + Fluent [16] software to analyze the combustion characteristics of straw direct-firing boilers at a specific load, only changing the ratio of primary and secondary air [17]. However, due to the difference in combustion characteristics between coal and biomass, there is limited research on air distribution modes in grate-firing boilers for biomass combustion.
This study utilizes numerical simulation with the combination of FLIC and FLUENT software to investigate the impact of air distribution mode on biomass combustion in a grate-firing furnace designed for hot air supply. The findings offer valuable insights for optimizing the operation of these boilers in real-world settings.

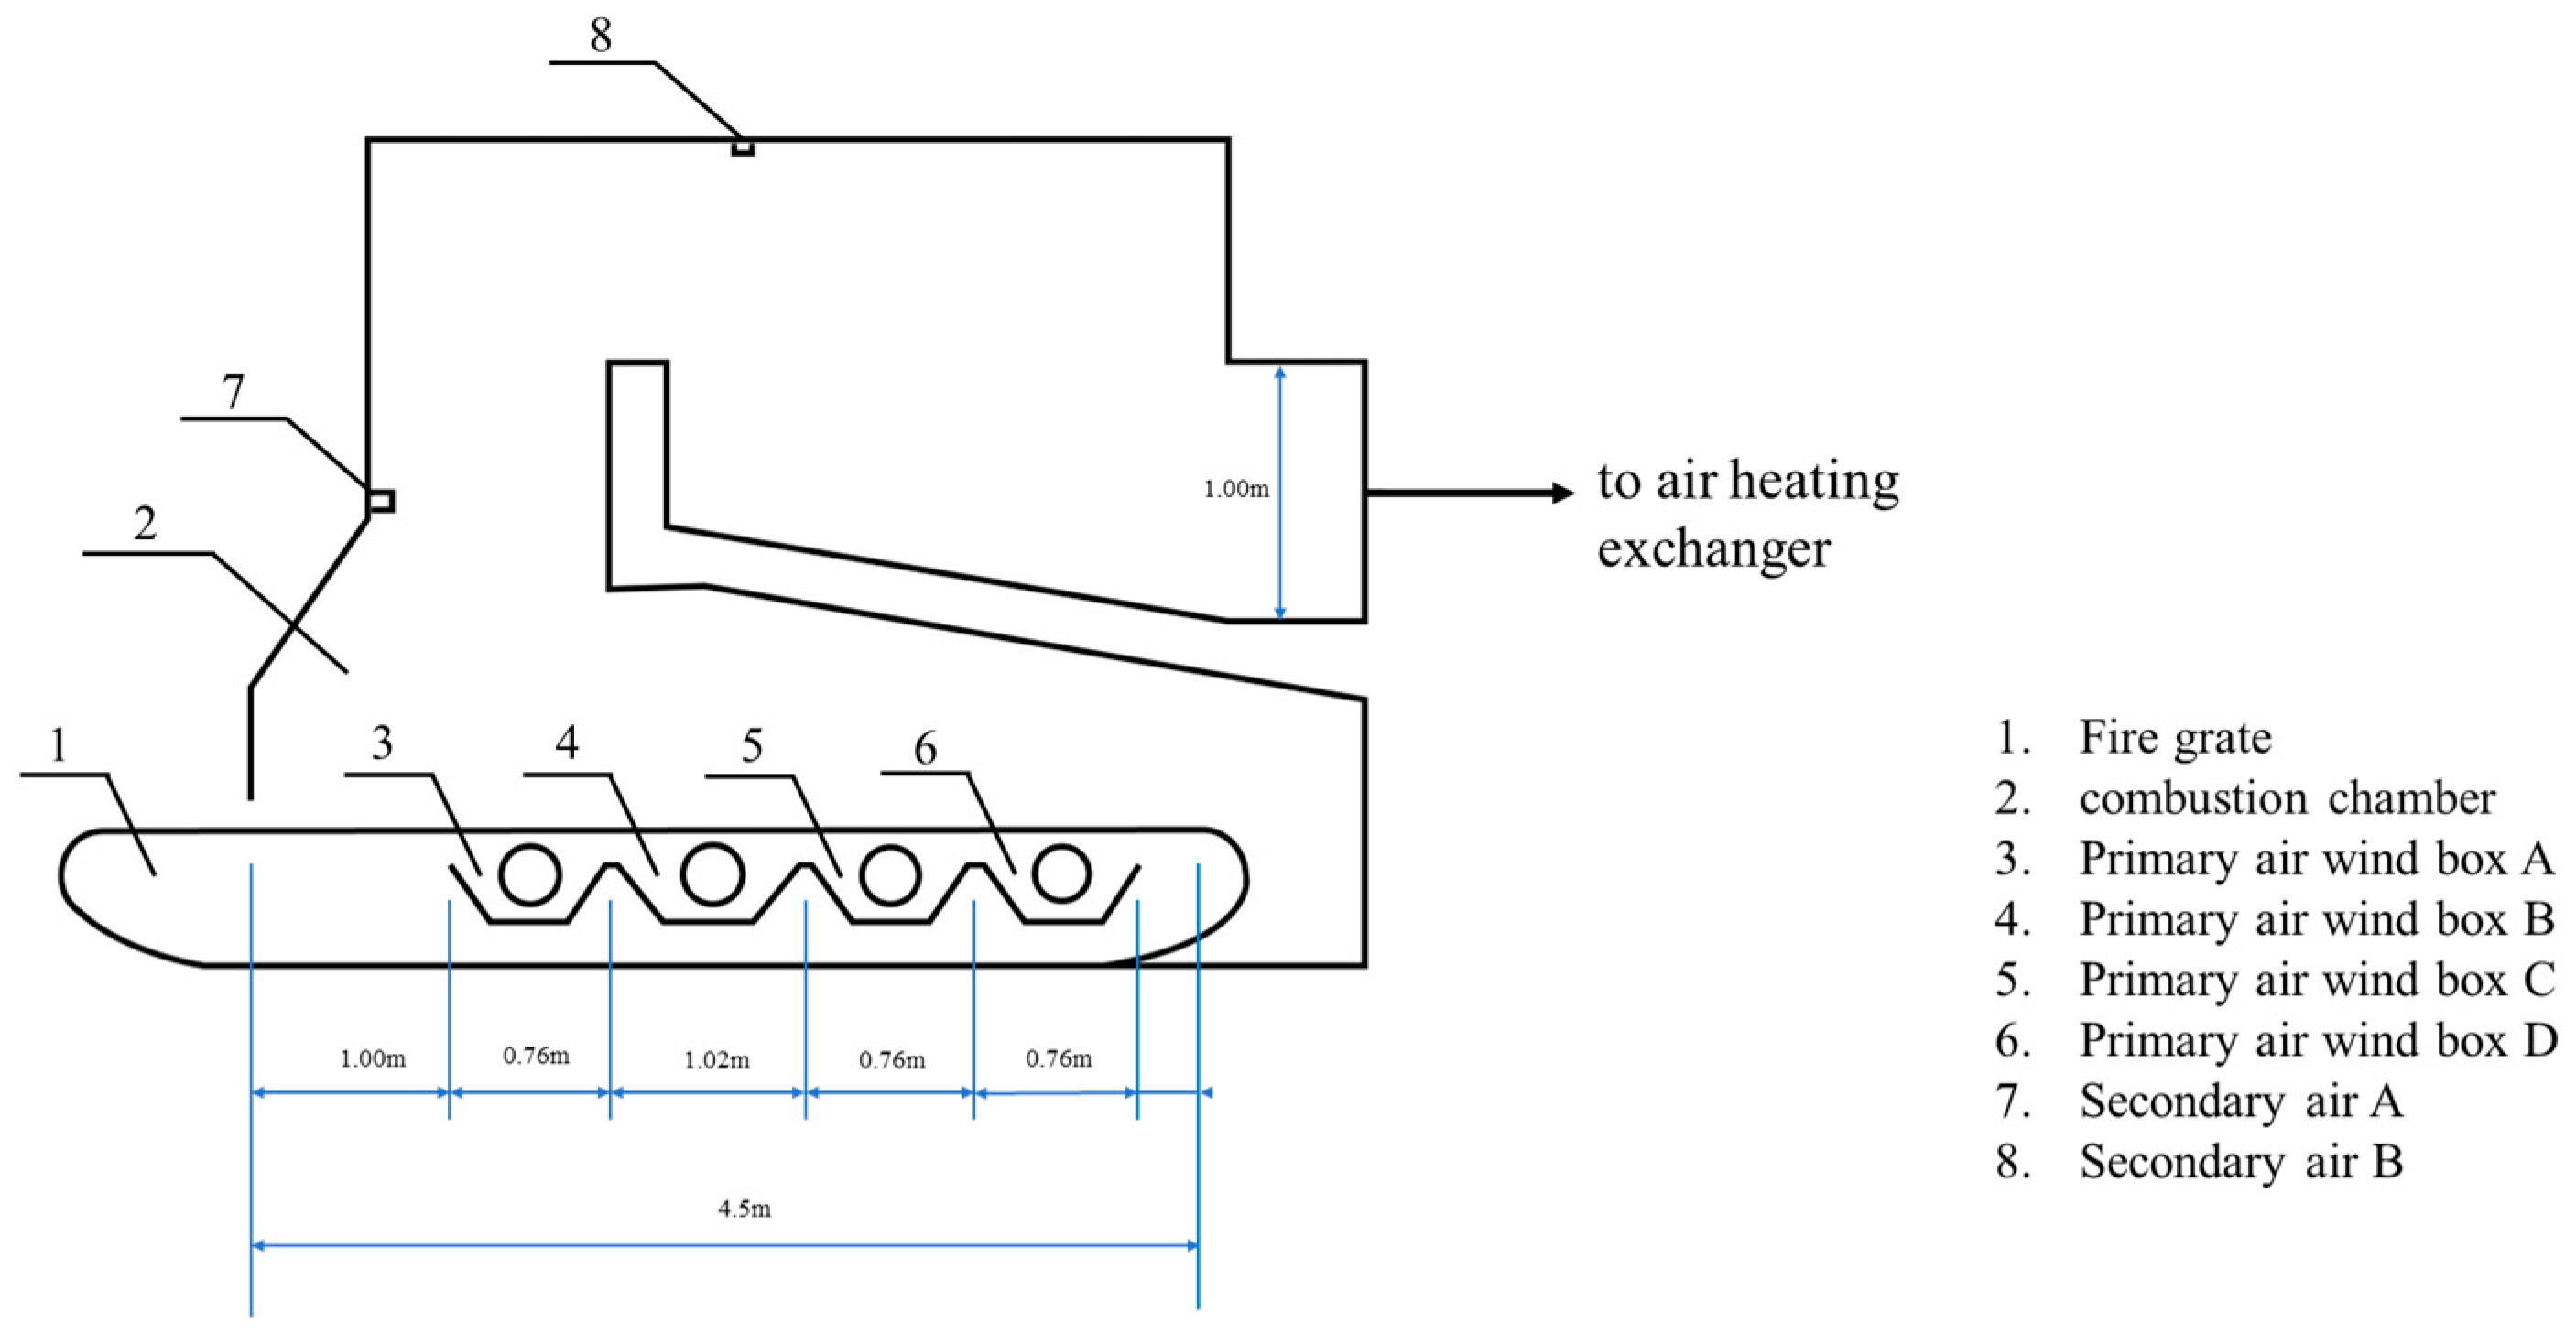
2. Biomass Grate-Firing Furnace for Hot Air Supply

The subject of study in this paper is a grate-firing furnace for hot air supply that burns straw briquettes in northeast China. This furnace has a rated heating power of 7 MW, illustrated in Figure 1. The specified values for the furnace can be found in Table 1.
The furnace is adiabatic, and the hot flue gas enters the gas–air heat exchanger after the combustion chamber. The flue gas temperature at the outlet of the furnace chamber is controlled by recirculating cold flue gas. The straw briquette fuel has sectional dimensions of 4 cm × 4 cm. The lower heating value of the fuel is 12,790 kJ/kg. The ultimate analysis and proximate analysis are listed in Table 2.
The chain grate has an effective length of 4.5 m and a width of 2.5 m. The front 1.0 m section of the grate has no primary air wind box; following it, there are four primary air wind boxes, namely A, B, C, and D, sequentially. These boxes have lengths of 0.76 m, 1.02 m, 0.76 m, and 0.76 m, respectively. The secondary air nozzles are situated on the front wall and the top of the furnace.

3. Modeling Method and Calculation Conditions

The combustion process of straw briquettes in the furnace comprises two processes: the grate firing and gas combustion in the combustion chamber, which have significant differences and affect each other. At present, the more mature method is to simulate the two separately, by transferring data flow, and the convergence is obtained by iteration. In this study, the grate firing was carried out through the FLIC bed simulation platform developed by the University of Sheffield [18,19,20]. The mathematical model of FLIC not only considers the basic conservation equations but also considers the sub-models of material drying, the precipitation and combustion of volatile gas, and solid-phase mixing and reactions. It can predict the concentration and temperature of gas components near the surface of the bed and can be used as the boundary conditions for gas combustion in the furnace chamber.
The calculation of gas-phase combustion in the combustion chamber was carried out using commercial software FLUENT. Considering the strong jet and swirl in the furnace, the realizable k-ε turbulence model was selected [21,22]. The finite rate/eddy dissipation model was chosen for the turbulent chemical reaction model, the P-1 model was chosen for the radiation model, and the wall boundary condition of the hot air furnace wall was set as adiabatic. The coupling between pressure and velocity was calculated using the Simple algorithm. Three-dimensional full-scale CFD modeling of the furnace was adopted. The mesh was divided by unstructured mesh, and local refinement was applied at the inlets of primary and secondary air and recycled flue gas. The total number of grid cells was 10.6 million, and the maximum size of the grid was 1.69 × 10⁻⁴ m3.
For a chain-grate furnace, there are generally four air distribution modes, namely front-enhanced, uniform, rear-enhanced, and strong air supply [23]. Front-enhanced air distribution refers to the introduction of a larger air volume in the early stages of combustion. Uniform air distribution means that the same air volume is introduced into each air chamber. Rear-enhanced air distribution involves introducing a small amount of air in the early stages of combustion, with the initial air volume primarily relying on air leakage from adjacent air chambers. However, as an extreme case, the strong air supply mode is only suitable for refractory coal; otherwise, it will cause serious slagging in the grate. Therefore, this study mainly focused on the combustion performance and pollutant emission under the first three air distribution modes. As listed in Table 3, the air fractions of the four wind boxes with the front-enhanced air distribution (FAD) mode were 30%, 40%, 15%, and 15%, respectively. Similarly, these values were 23%, 31%, 23%, and 23% with the uniform air distribution (UAD) mode and 15%, 20%, 35%, and 30% with the rear-enhanced air distribution (RAD) mode. The total excess air ratio was 2.0, and the total air supply and fuel supply were kept the same under the three air distribution modes.

4. Results and Discussion

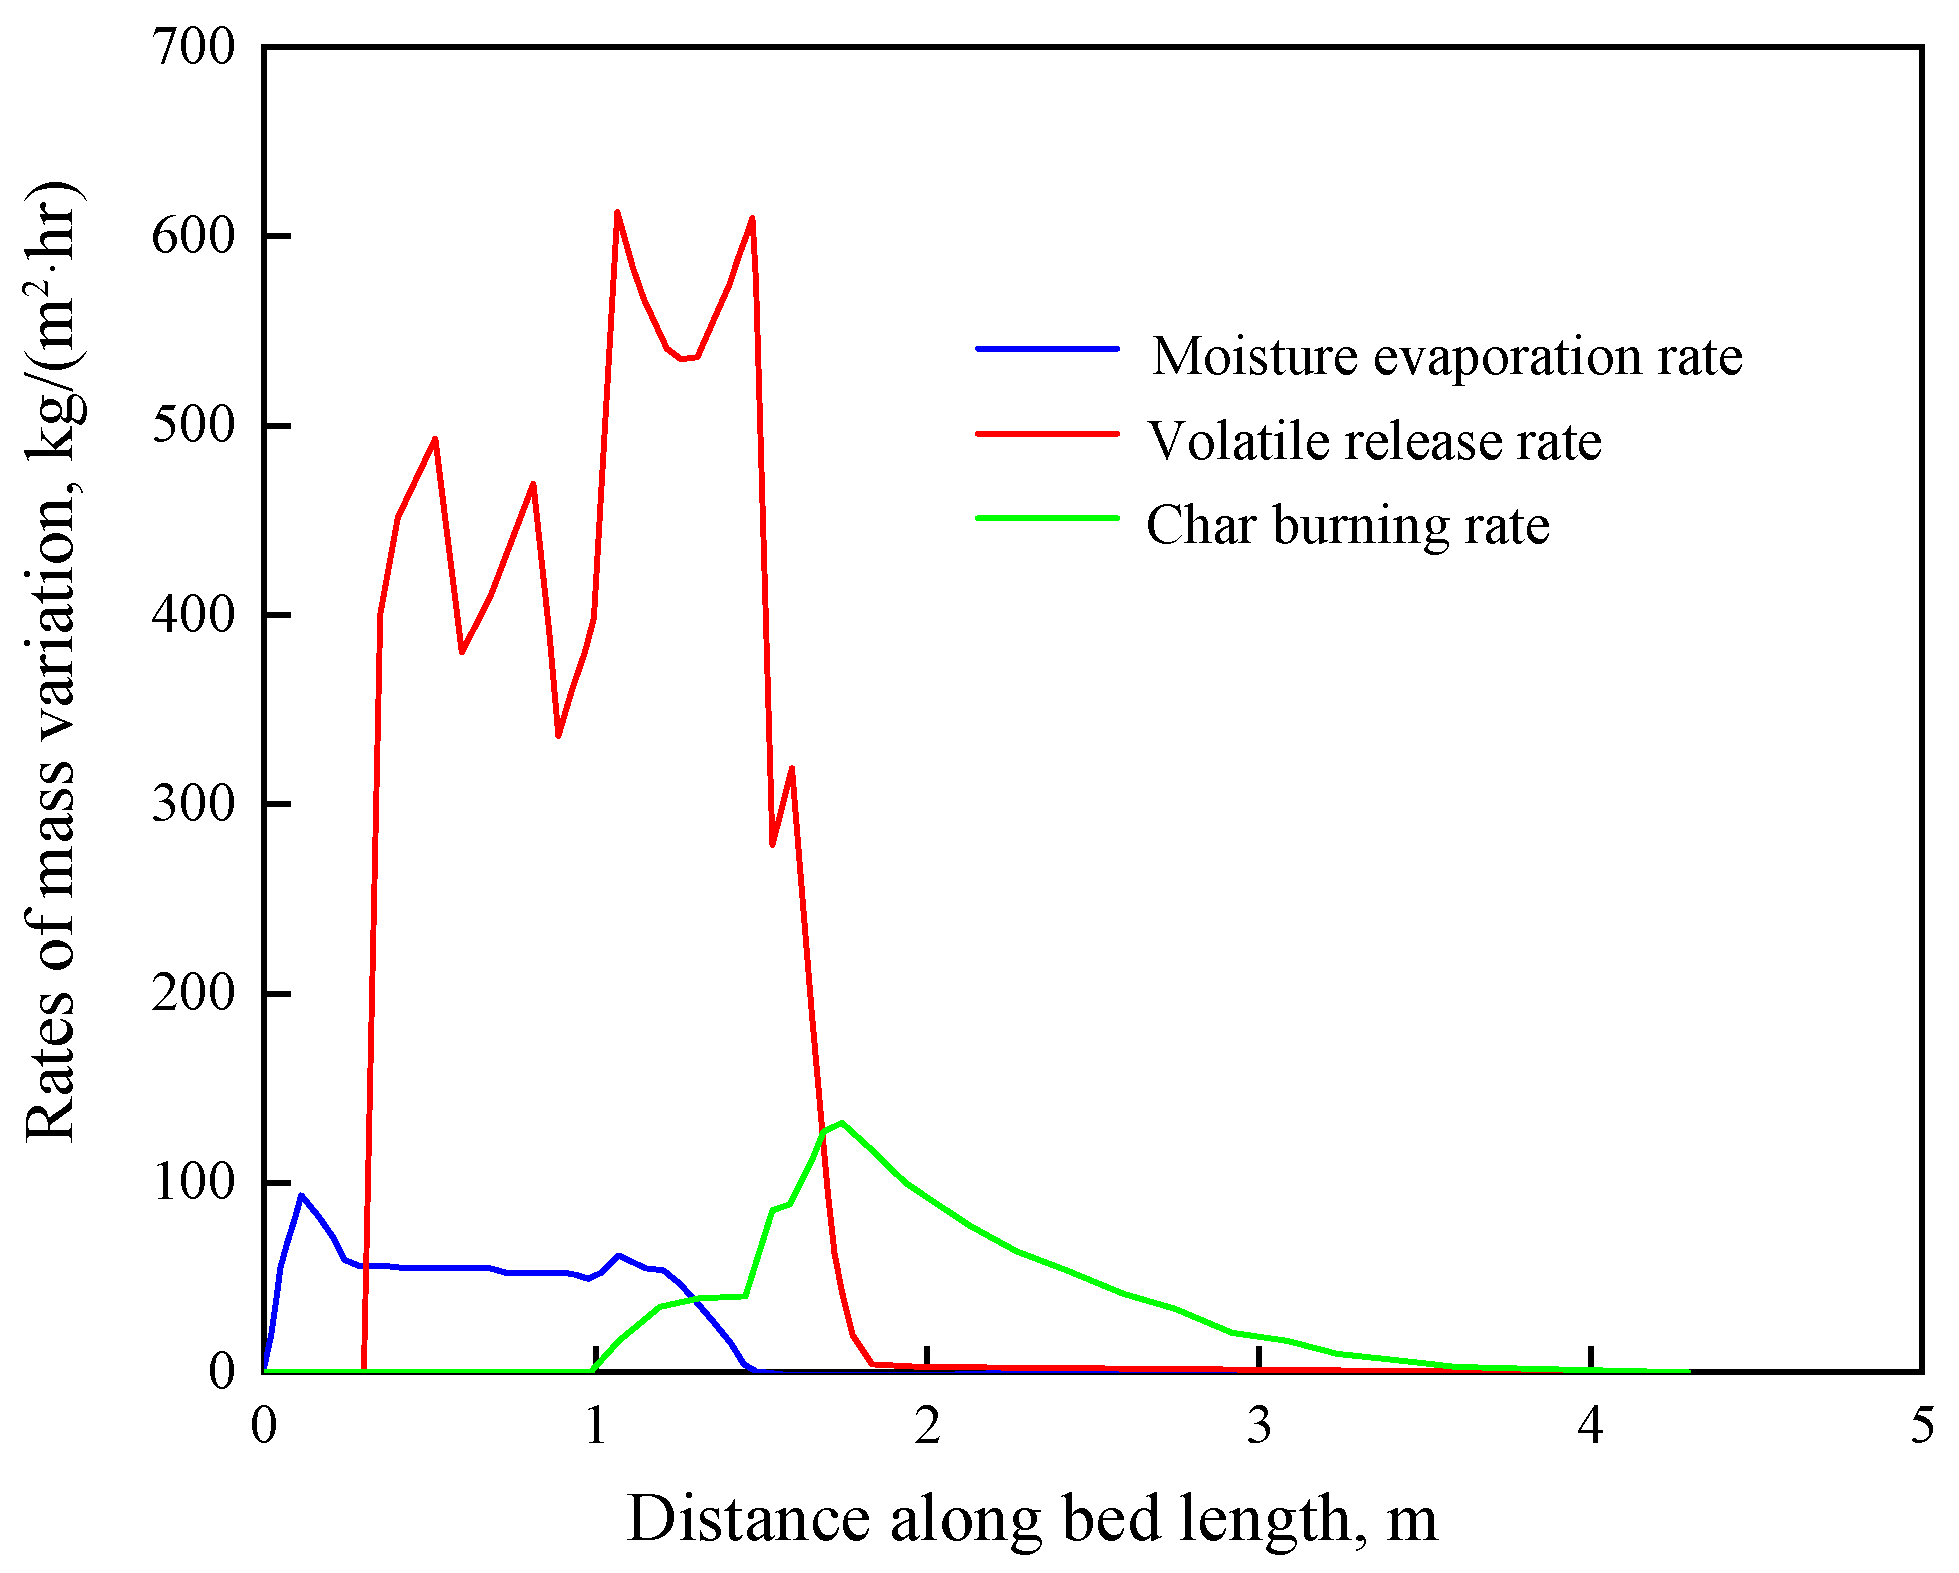
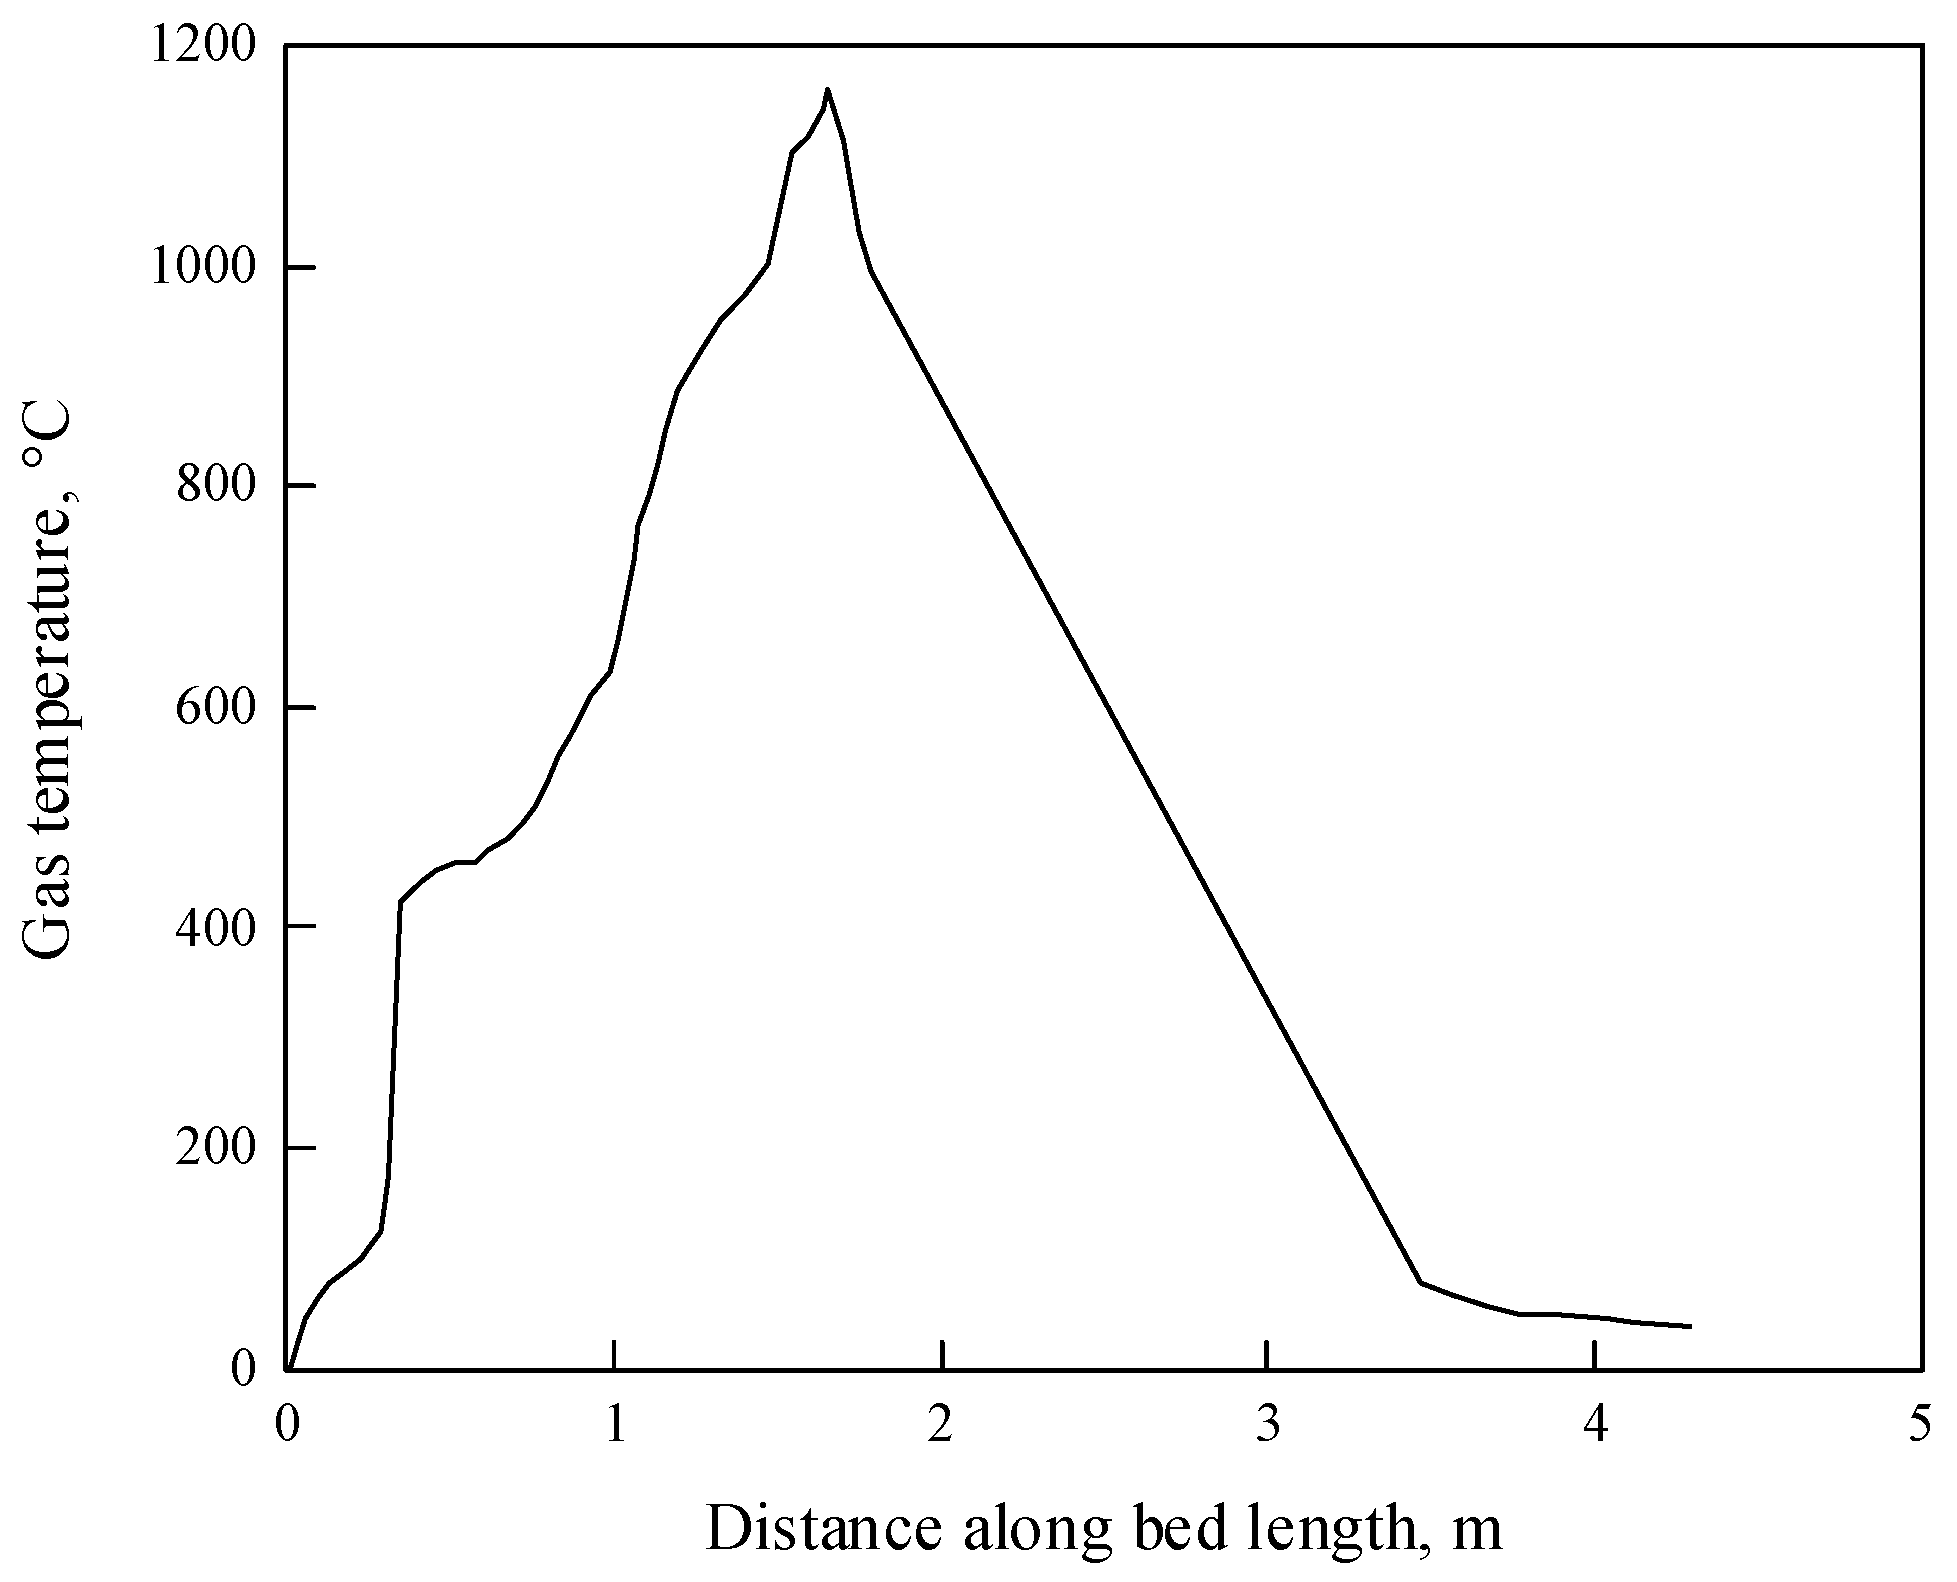
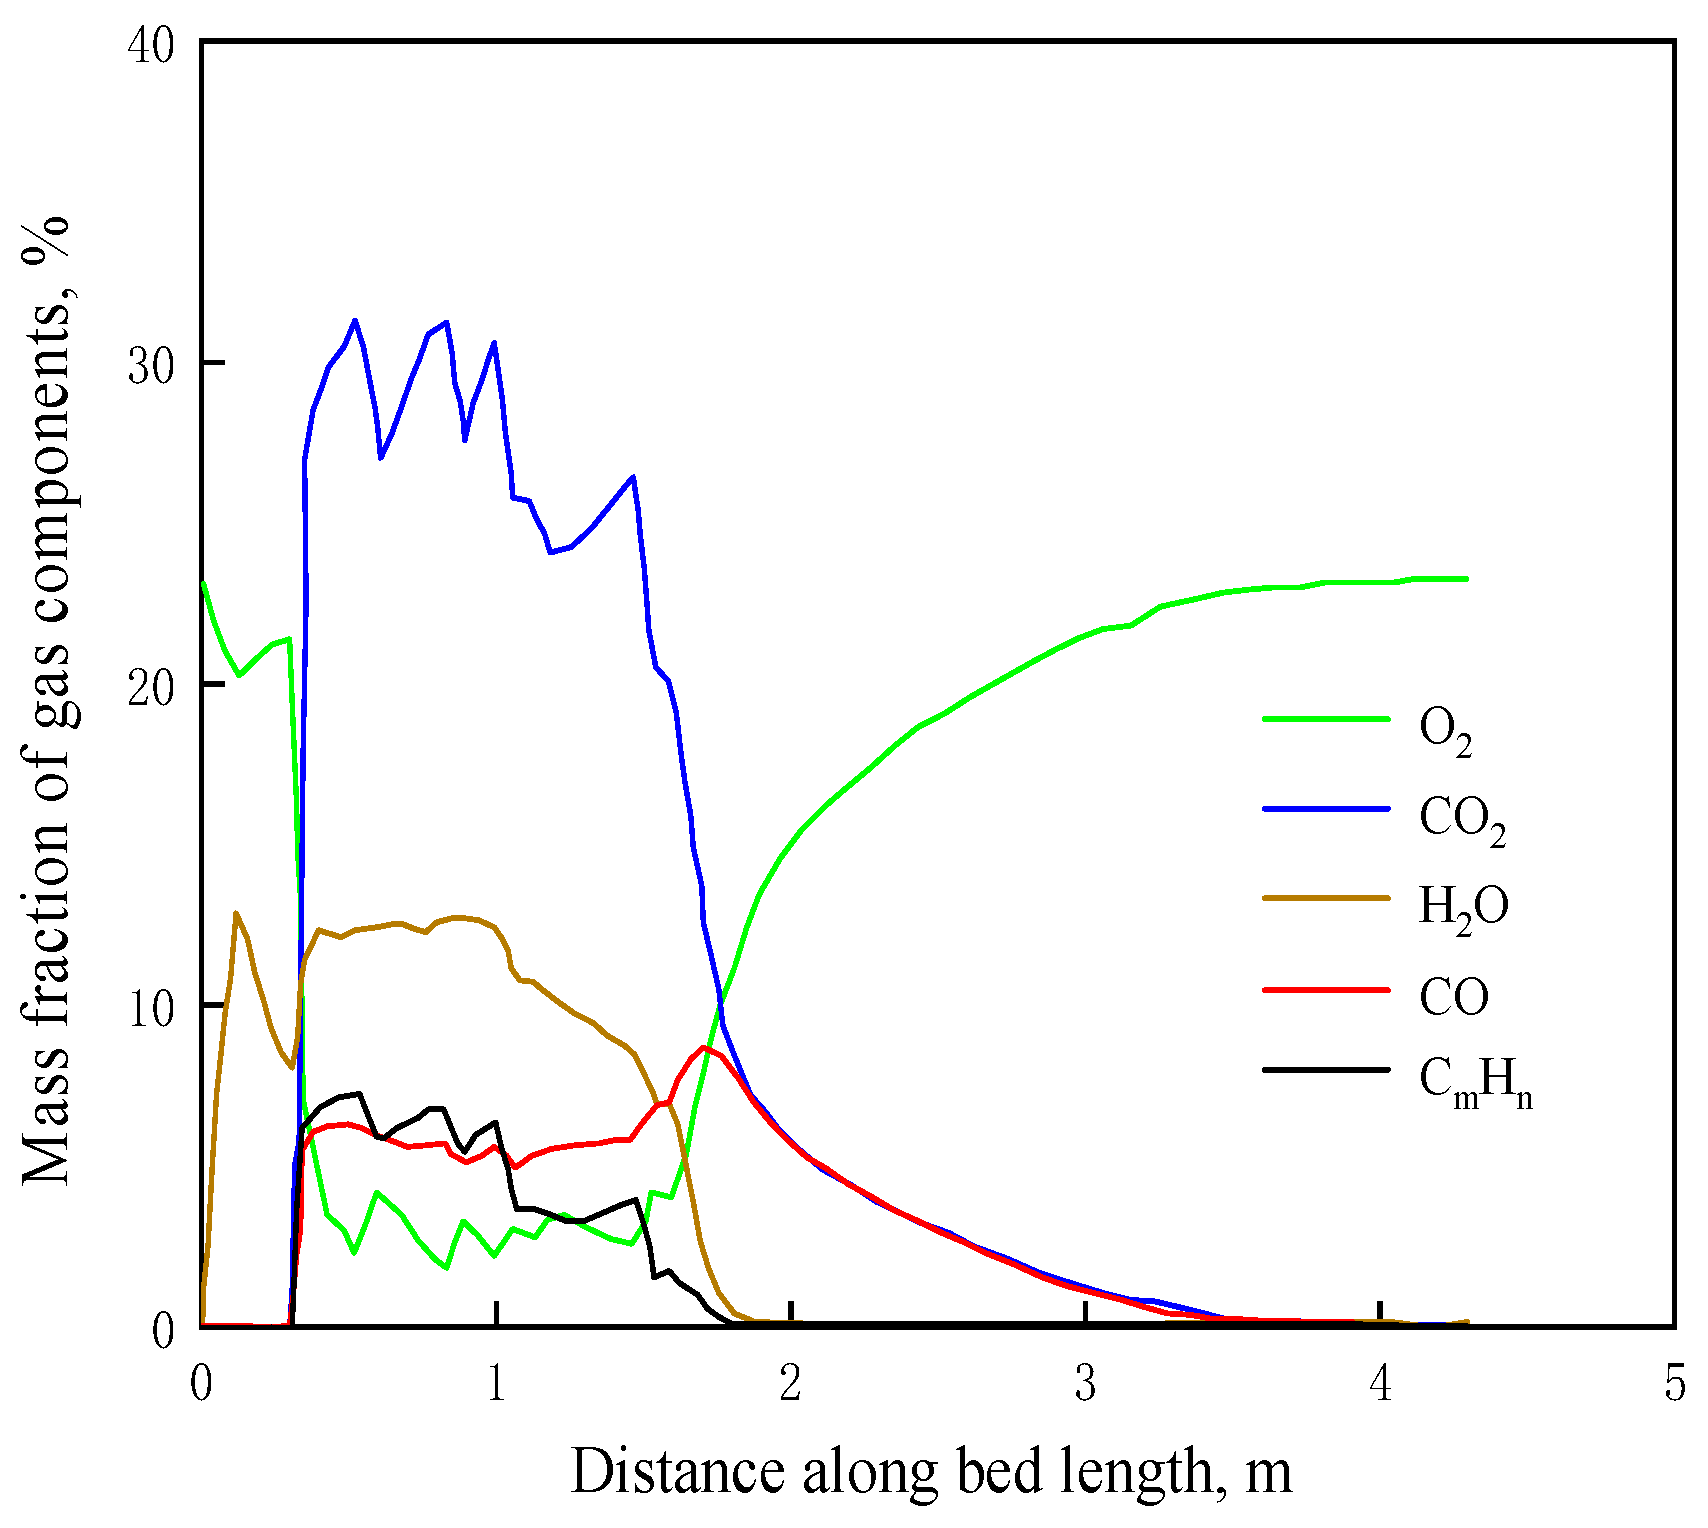
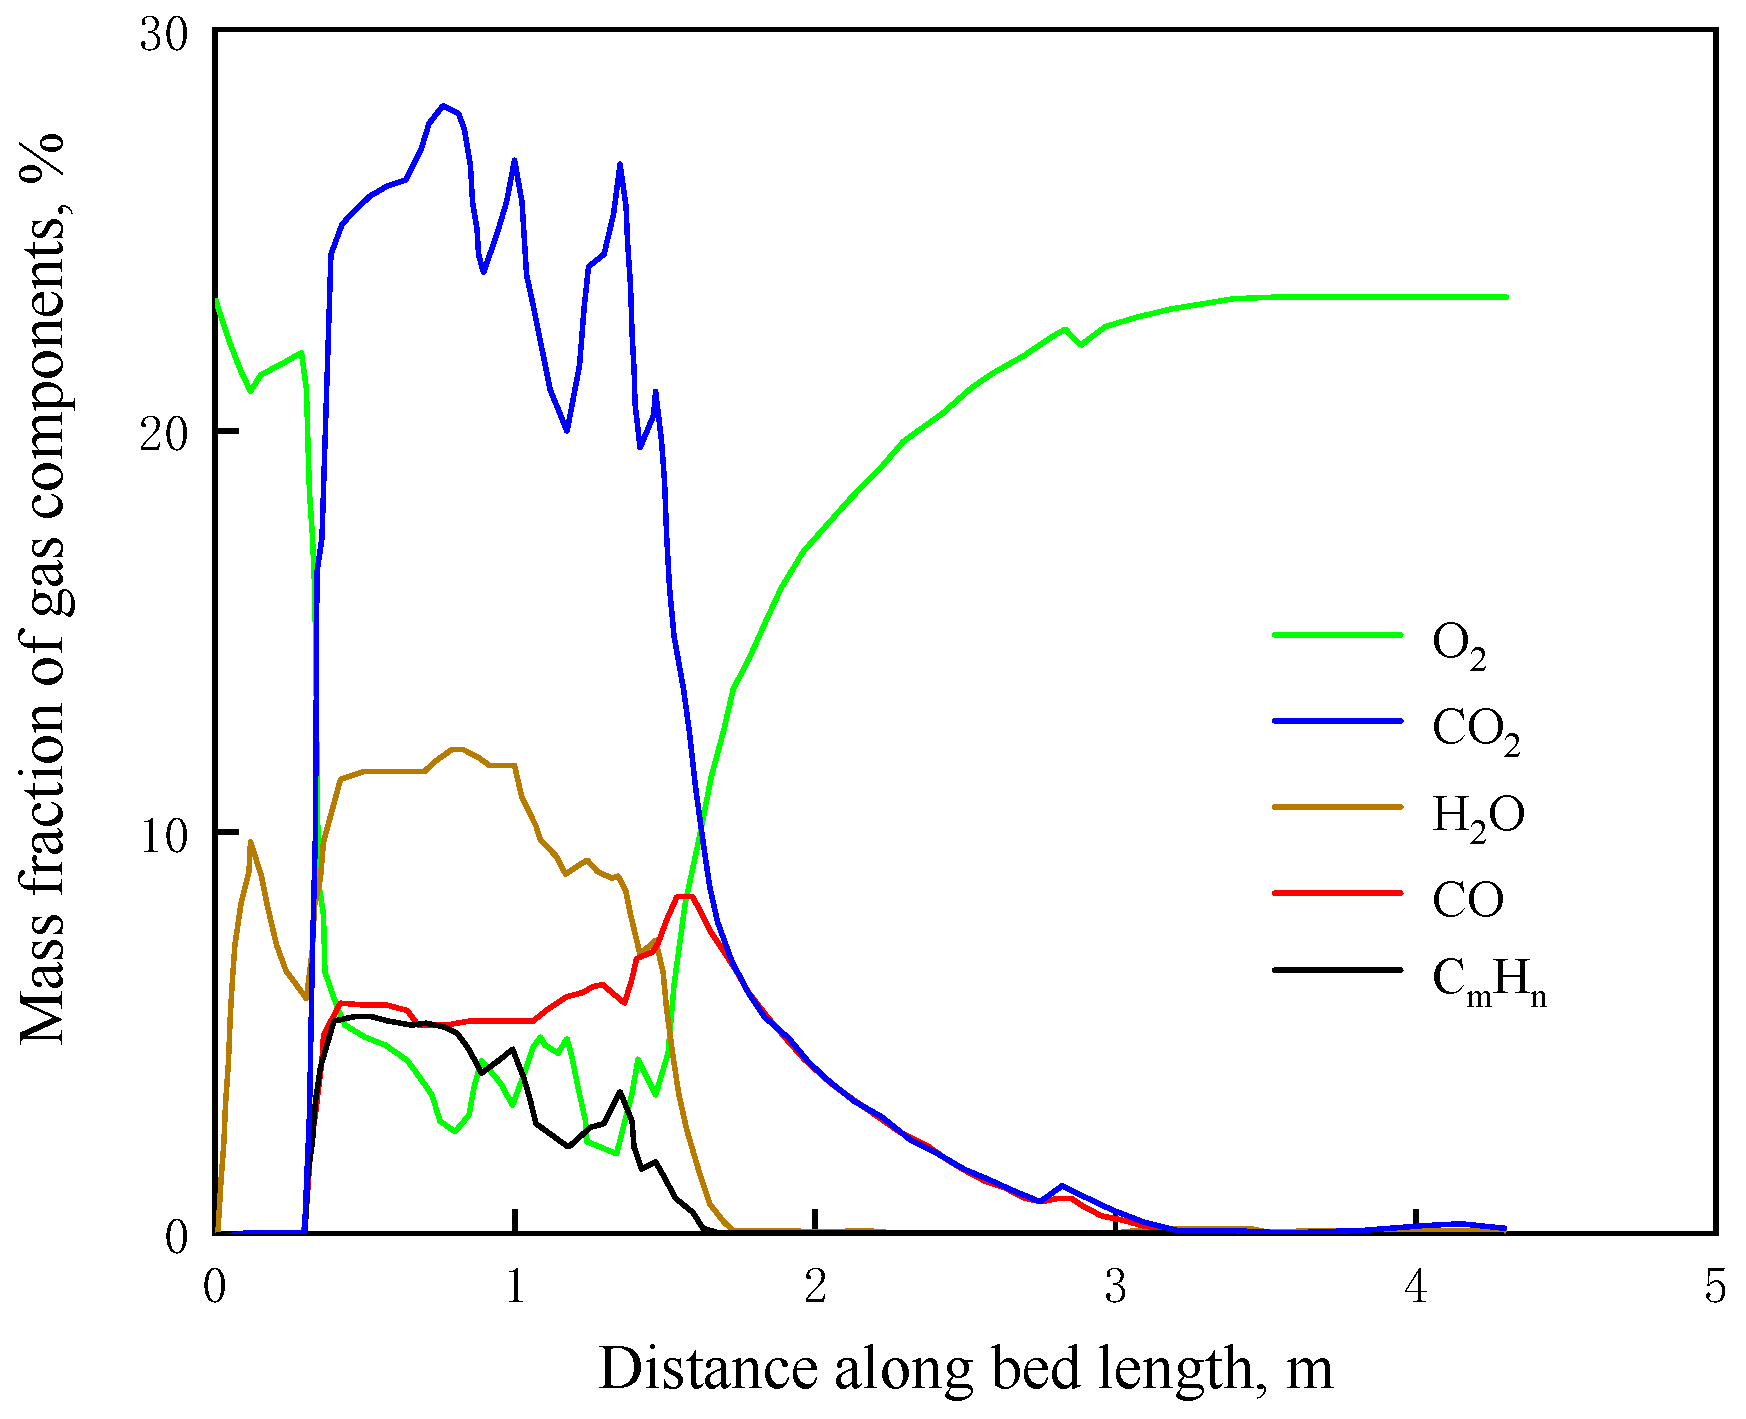
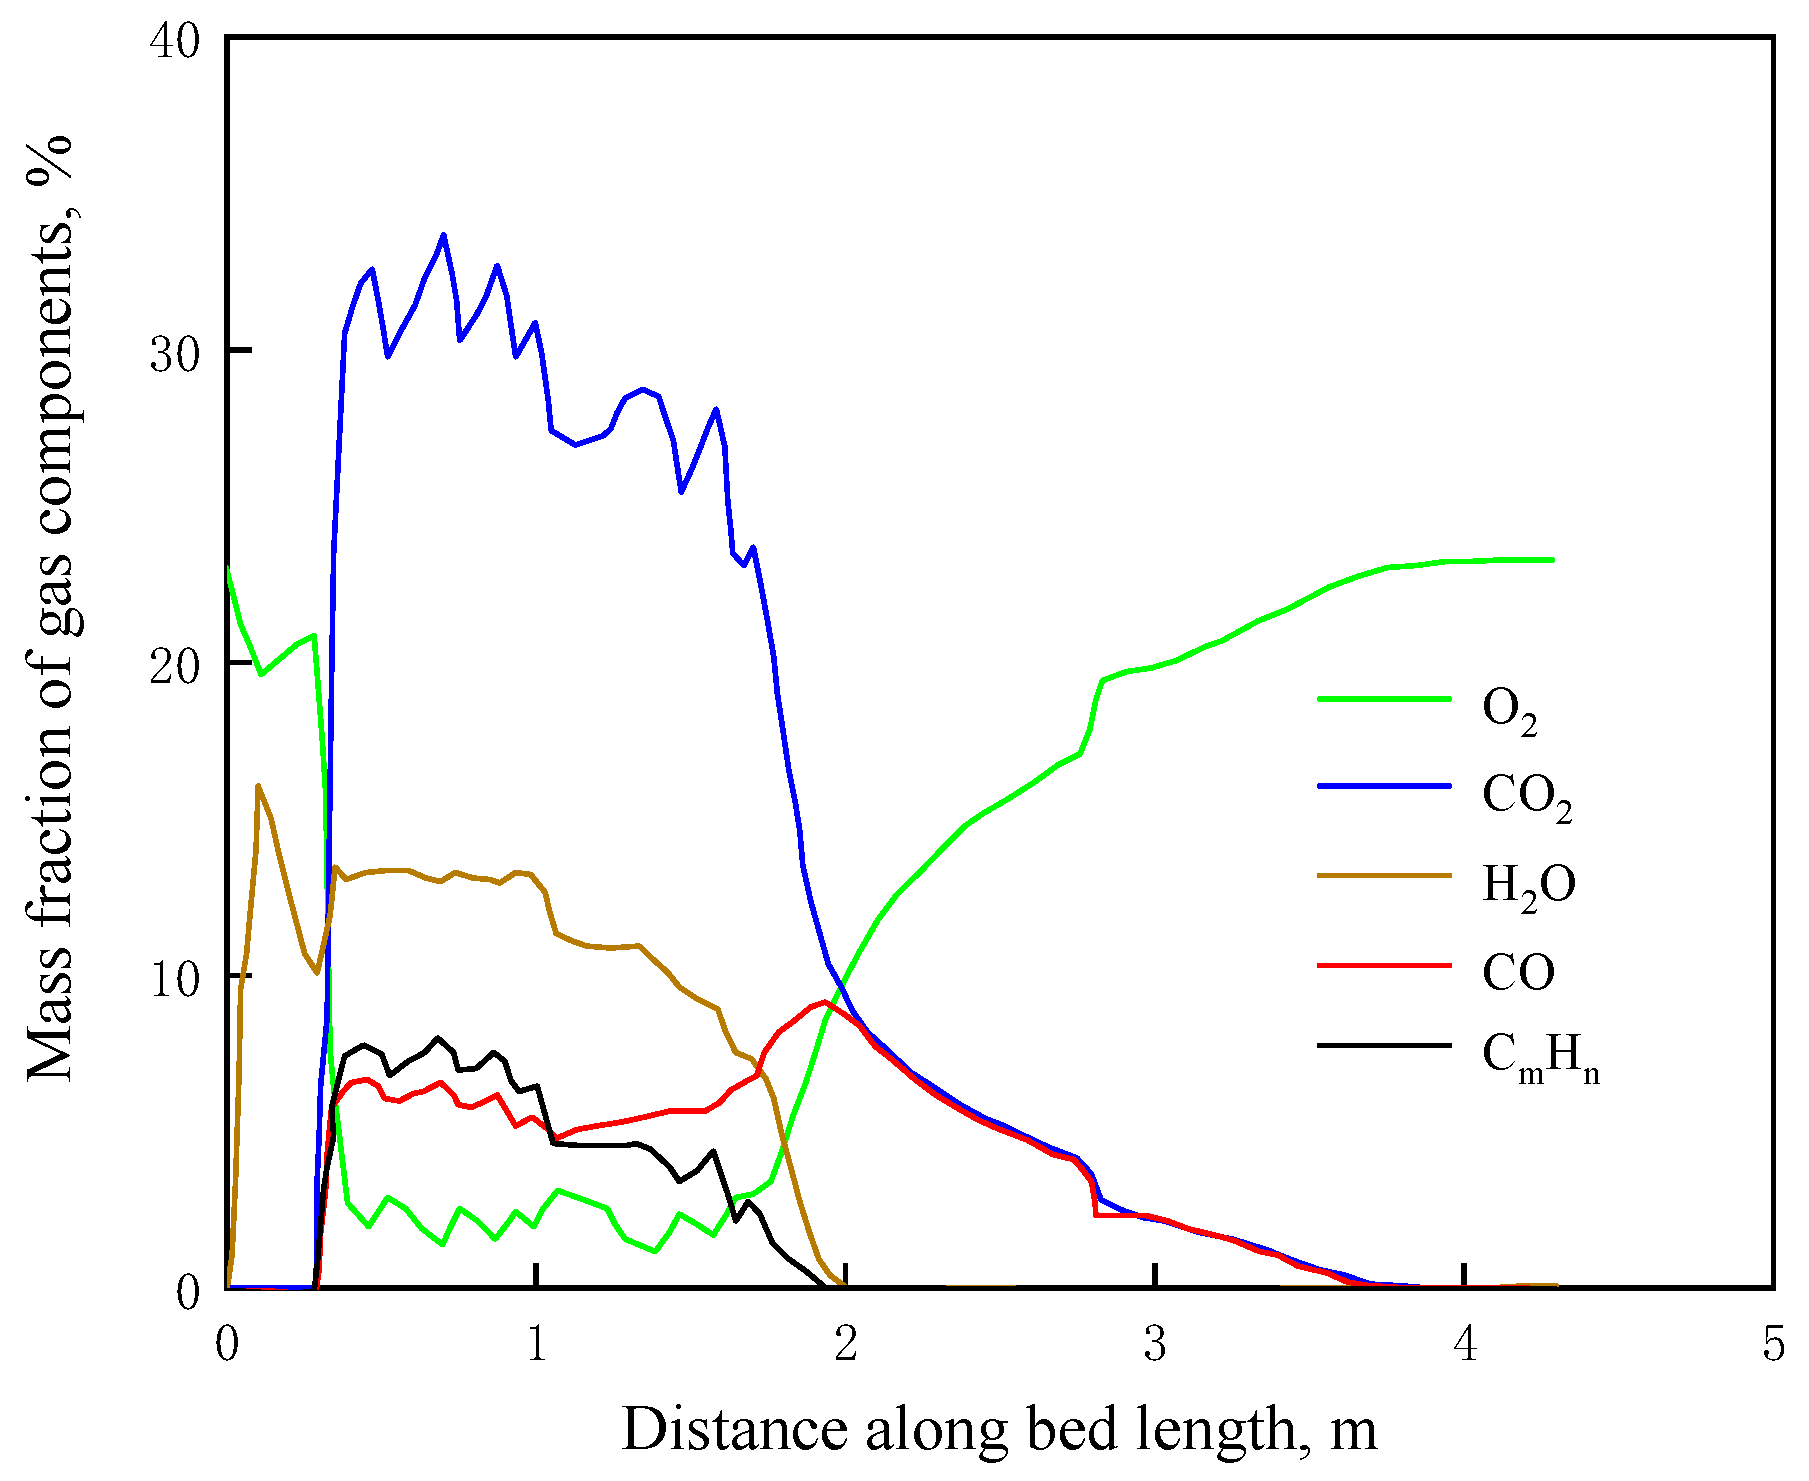
4.1. Grate-Firing Process

4.1.1. UAD Mode

Figure 2 shows the rates of moisture evaporation, volatile release, and char combustion. At the grate position of 0–0.3 m, only moisture evaporation occurs. Volatiles begin to be released at 0.3 m, and the release rate rapidly increases to a high value. The devolatilization process is intensive at 1–1.5 m and ends at about 1.8 m. Under the condition of moisture evaporation, the combustion rate of char is relatively low. Later, as volatile matter escapes and burns, the gas temperature increases significantly, as shown in Figure 3, resulting in a significant increase in the combustion rate of carbon, which results in the complete burnout of carbon at the tail of the furnace.
Figure 4 shows the mass fraction distribution curve of the flue gas components above the grate under UAD conditions. It can be seen that oxygen is in an excess state at both ends of the grate. At the start of the combustion process, the oxygen content decreases rapidly due to the release of volatiles and the combustion of some of the carbons and reaches the minimum value of 1.56% between 0.3 and 1.8 m. During the entire combustion process, the mass fraction of oxygen changes in a “sawtooth” shape. The reason is that after the burning out of the surface carbon, the ash shell will enwrap the internal carbon, by hindering the continuous diffusion of oxygen to the inside, so there is a brief slight rebound; after that, with the forward movement of the grate, the mutual extrusion between the fuels and the continuous primary air blowing will peel off the surface ash shell; as result, the direct contact between the carbon and the primary air will promote the intensive combustion of the carbon and reduce the oxygen mass fraction. This process repeats in turn, resulting in a sawtooth shape for the oxygen mass fraction.
The peak values of H2, CO, and CH4 all appear at 0.3–1.8 m on the grate, with mass fraction values of 0.17%, 8.5%, and 7.3%, respectively. The mass fraction distribution curve of CO2 also has a sawtooth shape because it corresponds to the consumption of oxygen with the peak value of 31.65%.

4.1.2. FAD Mode

Figure 5 shows the mass fraction distribution curve of the flue gas components above the grate under the FAD mode. Since there is no primary air inlet at the front 1.0 m of the grate, the air required for fuel combustion at the front 1 m of the grate depends entirely on the air diffusion in the adjacent wind chamber. The mass fraction distribution curve at the front 0.3 m of the grate has no obvious difference compared with the UAD mode, but at the same position of the grate, the oxygen content of the FAD mode is higher. Similar to the UAD mode, the oxygen content under the FAD mode is also excessive at both ends of the grate, and the minimum O2 mass fraction is 2.2%.
The peaks of H2, CO, and CH4 appear at 0.3–1.6 m of the grate, and the combustion of volatiles and fixed carbon finishes earlier than that in the UAD mode, with peak values of 0.15%, 8.2%, and 5.4%, respectively. Compared with UAD mode, the peak values of H2, CO, and CH4 are decreased. In principle, the FAD mode strengthens the combustion rate in the front part of the grate, and the formation of volatile gas should be increased. However, due to more air feeding into the front part, the mass fraction of gases does not increase but decreases by dilution.
The peak of CO2 mass fraction with a value of 28.17% appears at 0.3–1.6 m of the grate and is lower than that of the UAD mode. Similarly, it is consistent with the change in the volatile gas mass fraction. The reason was that excessive air was introduced into the front of the grate, which led to a decrease in the CO2 mass fraction in this zone. As shown in Figure 5, the fuel combustion on the grate will finish earlier, and the amount of oxygen will quickly recover after about 2 m along the moving direction of the grate. It also can be seen that the combustion condition at the rear is not good, the grate length is not fully utilized, and the efficiency will be greatly reduced.

4.1.3. RAD Mode

Figure 6 shows the mass fraction distribution curve of the flue gas components above the grate under the RAD mode. As in the first two cases, the combustion at the front of the grate still depends on the adjacent air diffusion, so even in the RAD mode, the mass fraction distribution of the flue gas composition above the front part of the grate also has no obvious difference from those in the first cases mentioned above. Since more than 60% of the air is passed in through the rear two wind boxes, the burning area is delayed accordingly. According to the oxygen content, the air supply in the first two air chambers is relatively small, so the combustion is only in the ignition phase. The minimum oxygen value is about 1.1%, and the stage with low oxygen content extends backward with a slow rise, after about 1.8 m, until 3.7 m. It can be seen that the utilization rate of the grate can be improved under the RAD mode.
The peaks of H2, CO, and CH4 appear at 0.3–2 m of the grate, with peaks of 0.18%, 8.9%, and 8.3%, respectively. The volatile gas production in the RAD mode is the highest out of the three air distribution modes, which can indirectly reflect the best combustion condition in the RAD mode. The volatile gas release can extend to about 2 m along the grate, which extends the effective length of the grate.
The peak value of CO2 mass fraction appears at 0.3–2 m of the grate with a value of 34.07%, which is the highest out of the three air distribution modes. Theoretically, it can also reflect that the fuel combustion condition is the best in the RAD mode.

4.2. Gas Combustion in Furnace Chamber

The flue gas mixing and temperature distribution in the furnace chamber under three air distribution modes were numerically calculated for this section. Three important indices for measuring combustion performance, namely the oxygen concentration, CO concentration, and temperature fields, were compared and analyzed.

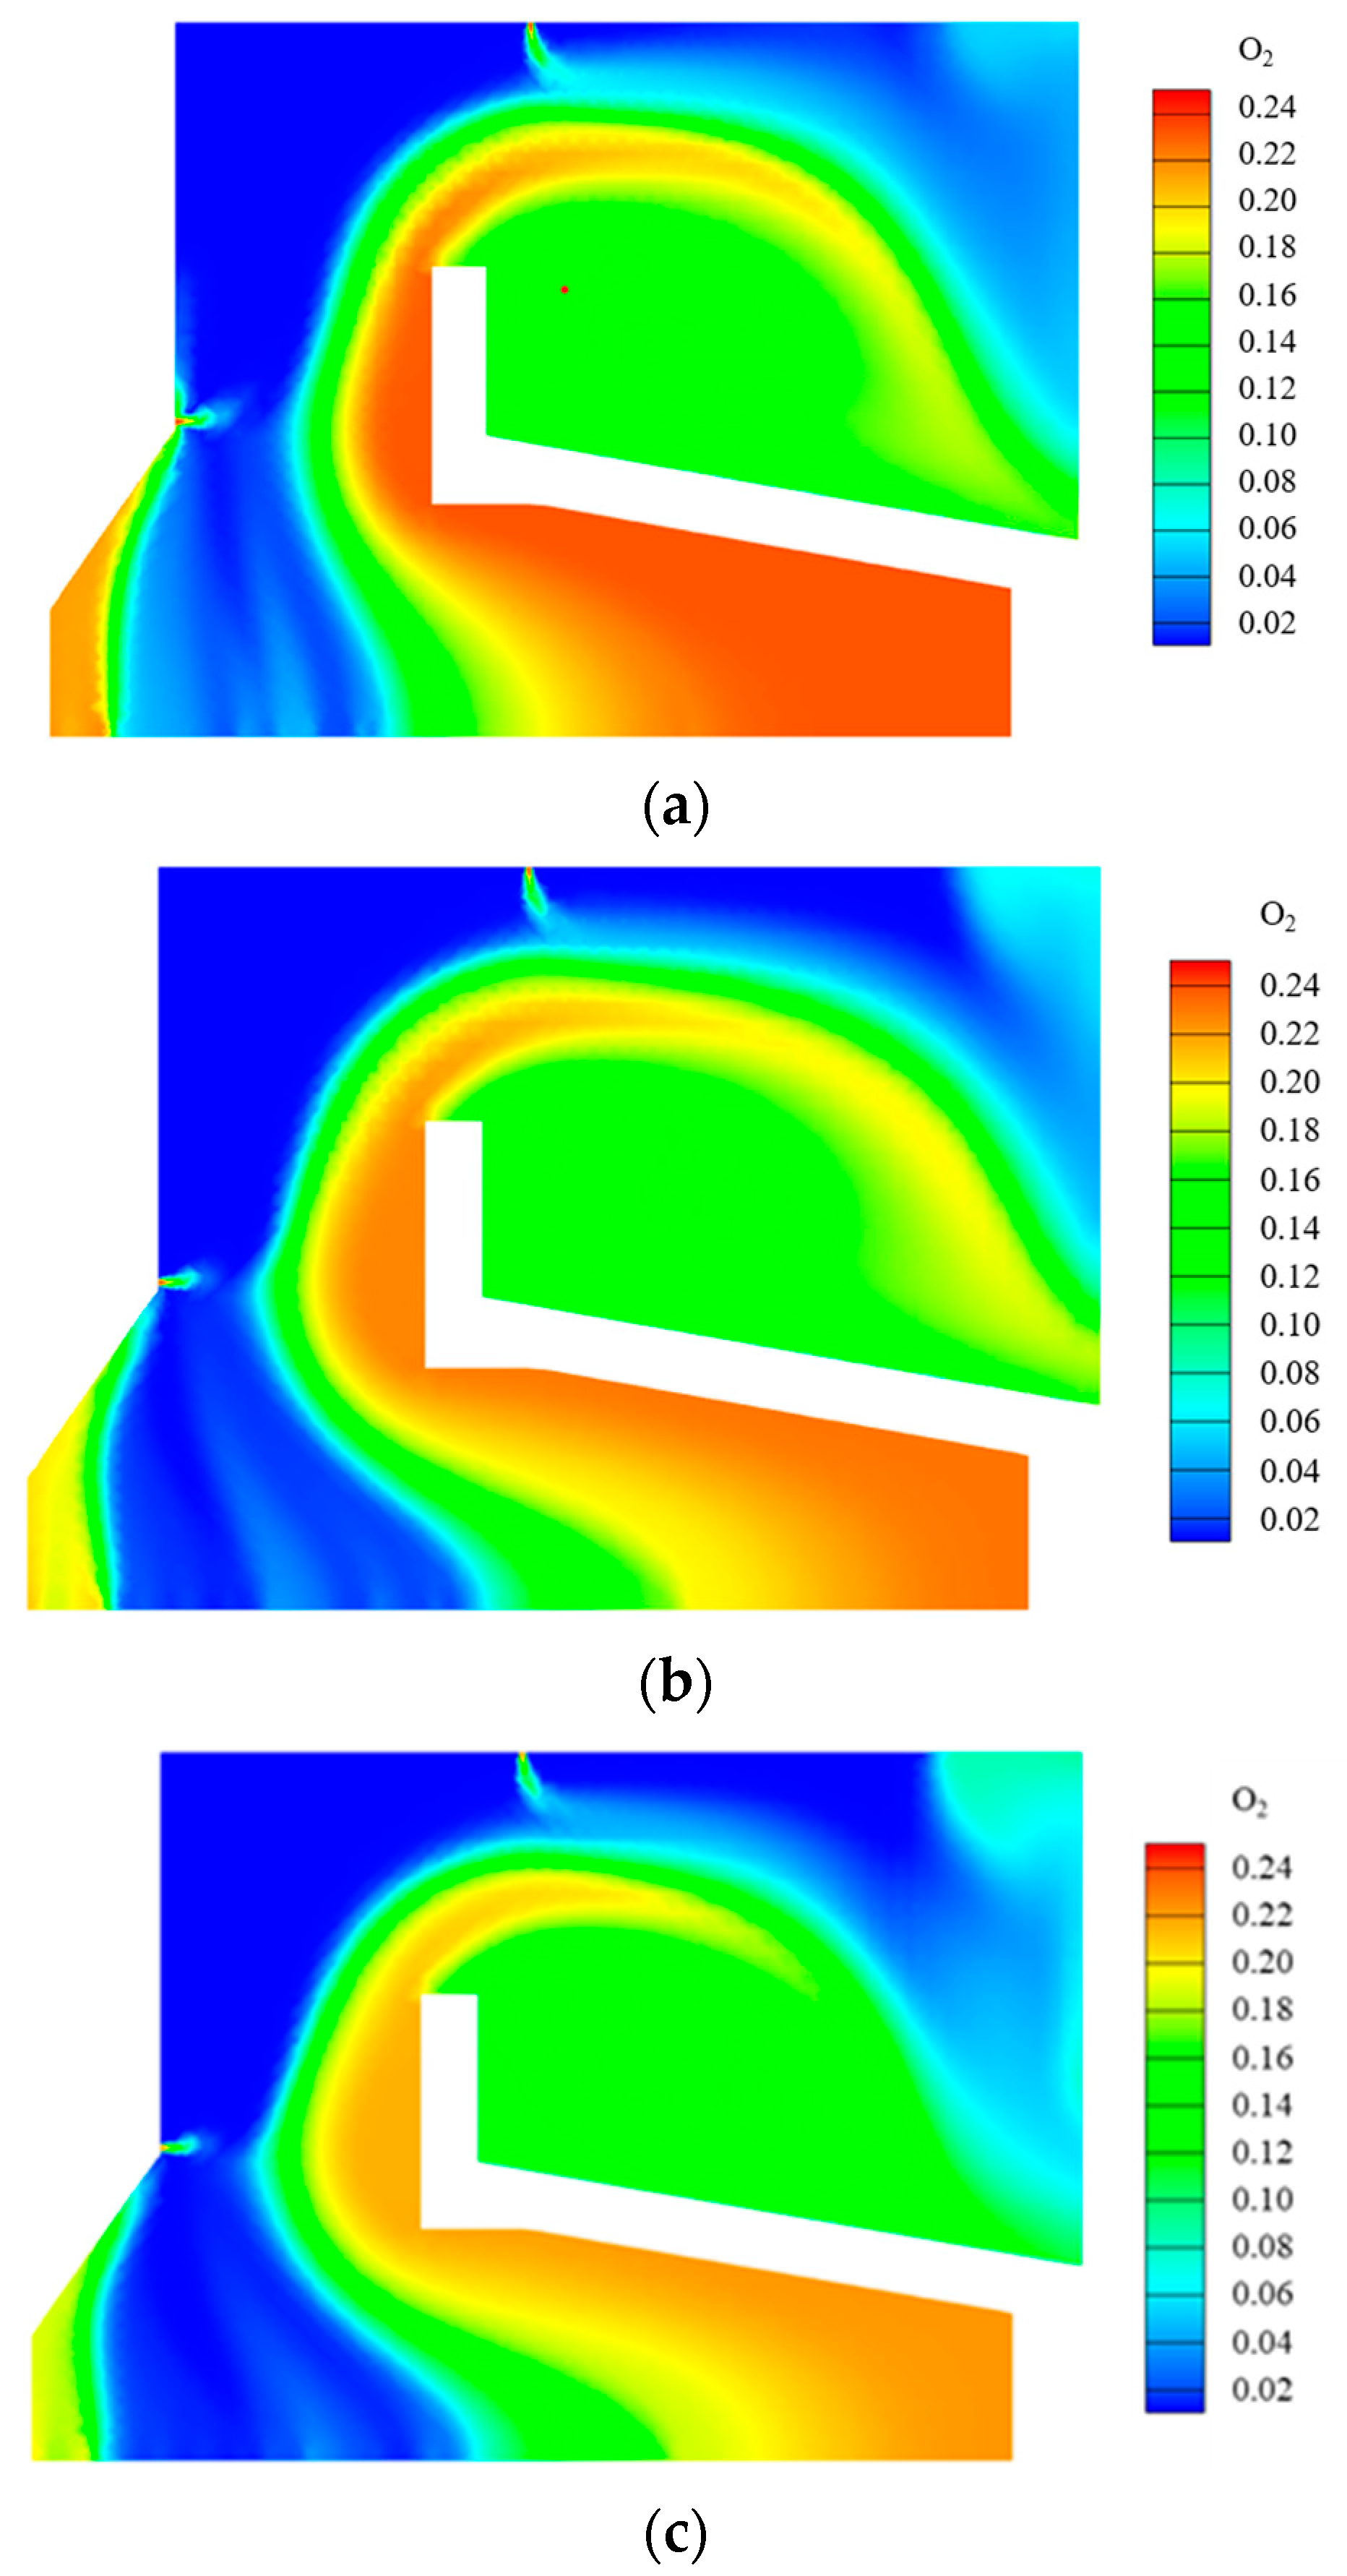
4.2.1. Oxygen Concentration Field

Figure 7 is the contour map of oxygen concentration in the furnace under three air distribution modes. It can be seen that the oxygen concentration distributions under the three air distribution modes are all “saddle”-shaped. However, compared with the UAD mode, the oxygen concentration in the FAD mode is higher in the whole section of the grate, and the width of the low oxygen concentration in the middle is shorter. In contrast, the oxygen concentration in the RAD mode is lower, and the width of the low oxygen concentration in the middle of the grate is longer. It is clear to find, in the FAD mode, that a large amount of air is introduced into the front of the grate, so the oxygen concentration in the front part is higher, and the combustion is intensive; such excessive oxygen causes the earlier finishing of combustion, so the oxygen content quickly returns to the air level. However, in the RAD mode, only a small amount of air is injected into the front of the grate, so the oxygen concentrations in the front and middle of the grate are lower than those of the UAD mode, because the oxygen is not sufficient in the whole combustion process, so the combustion duration is longer. In the condition of RAD mode, the range of low oxygen content covers the longer part of the grate, and the recovery of oxygen content is relatively slow; even in the end part of the grate, the oxygen concentration is still lower than that of the other air distribution modes.

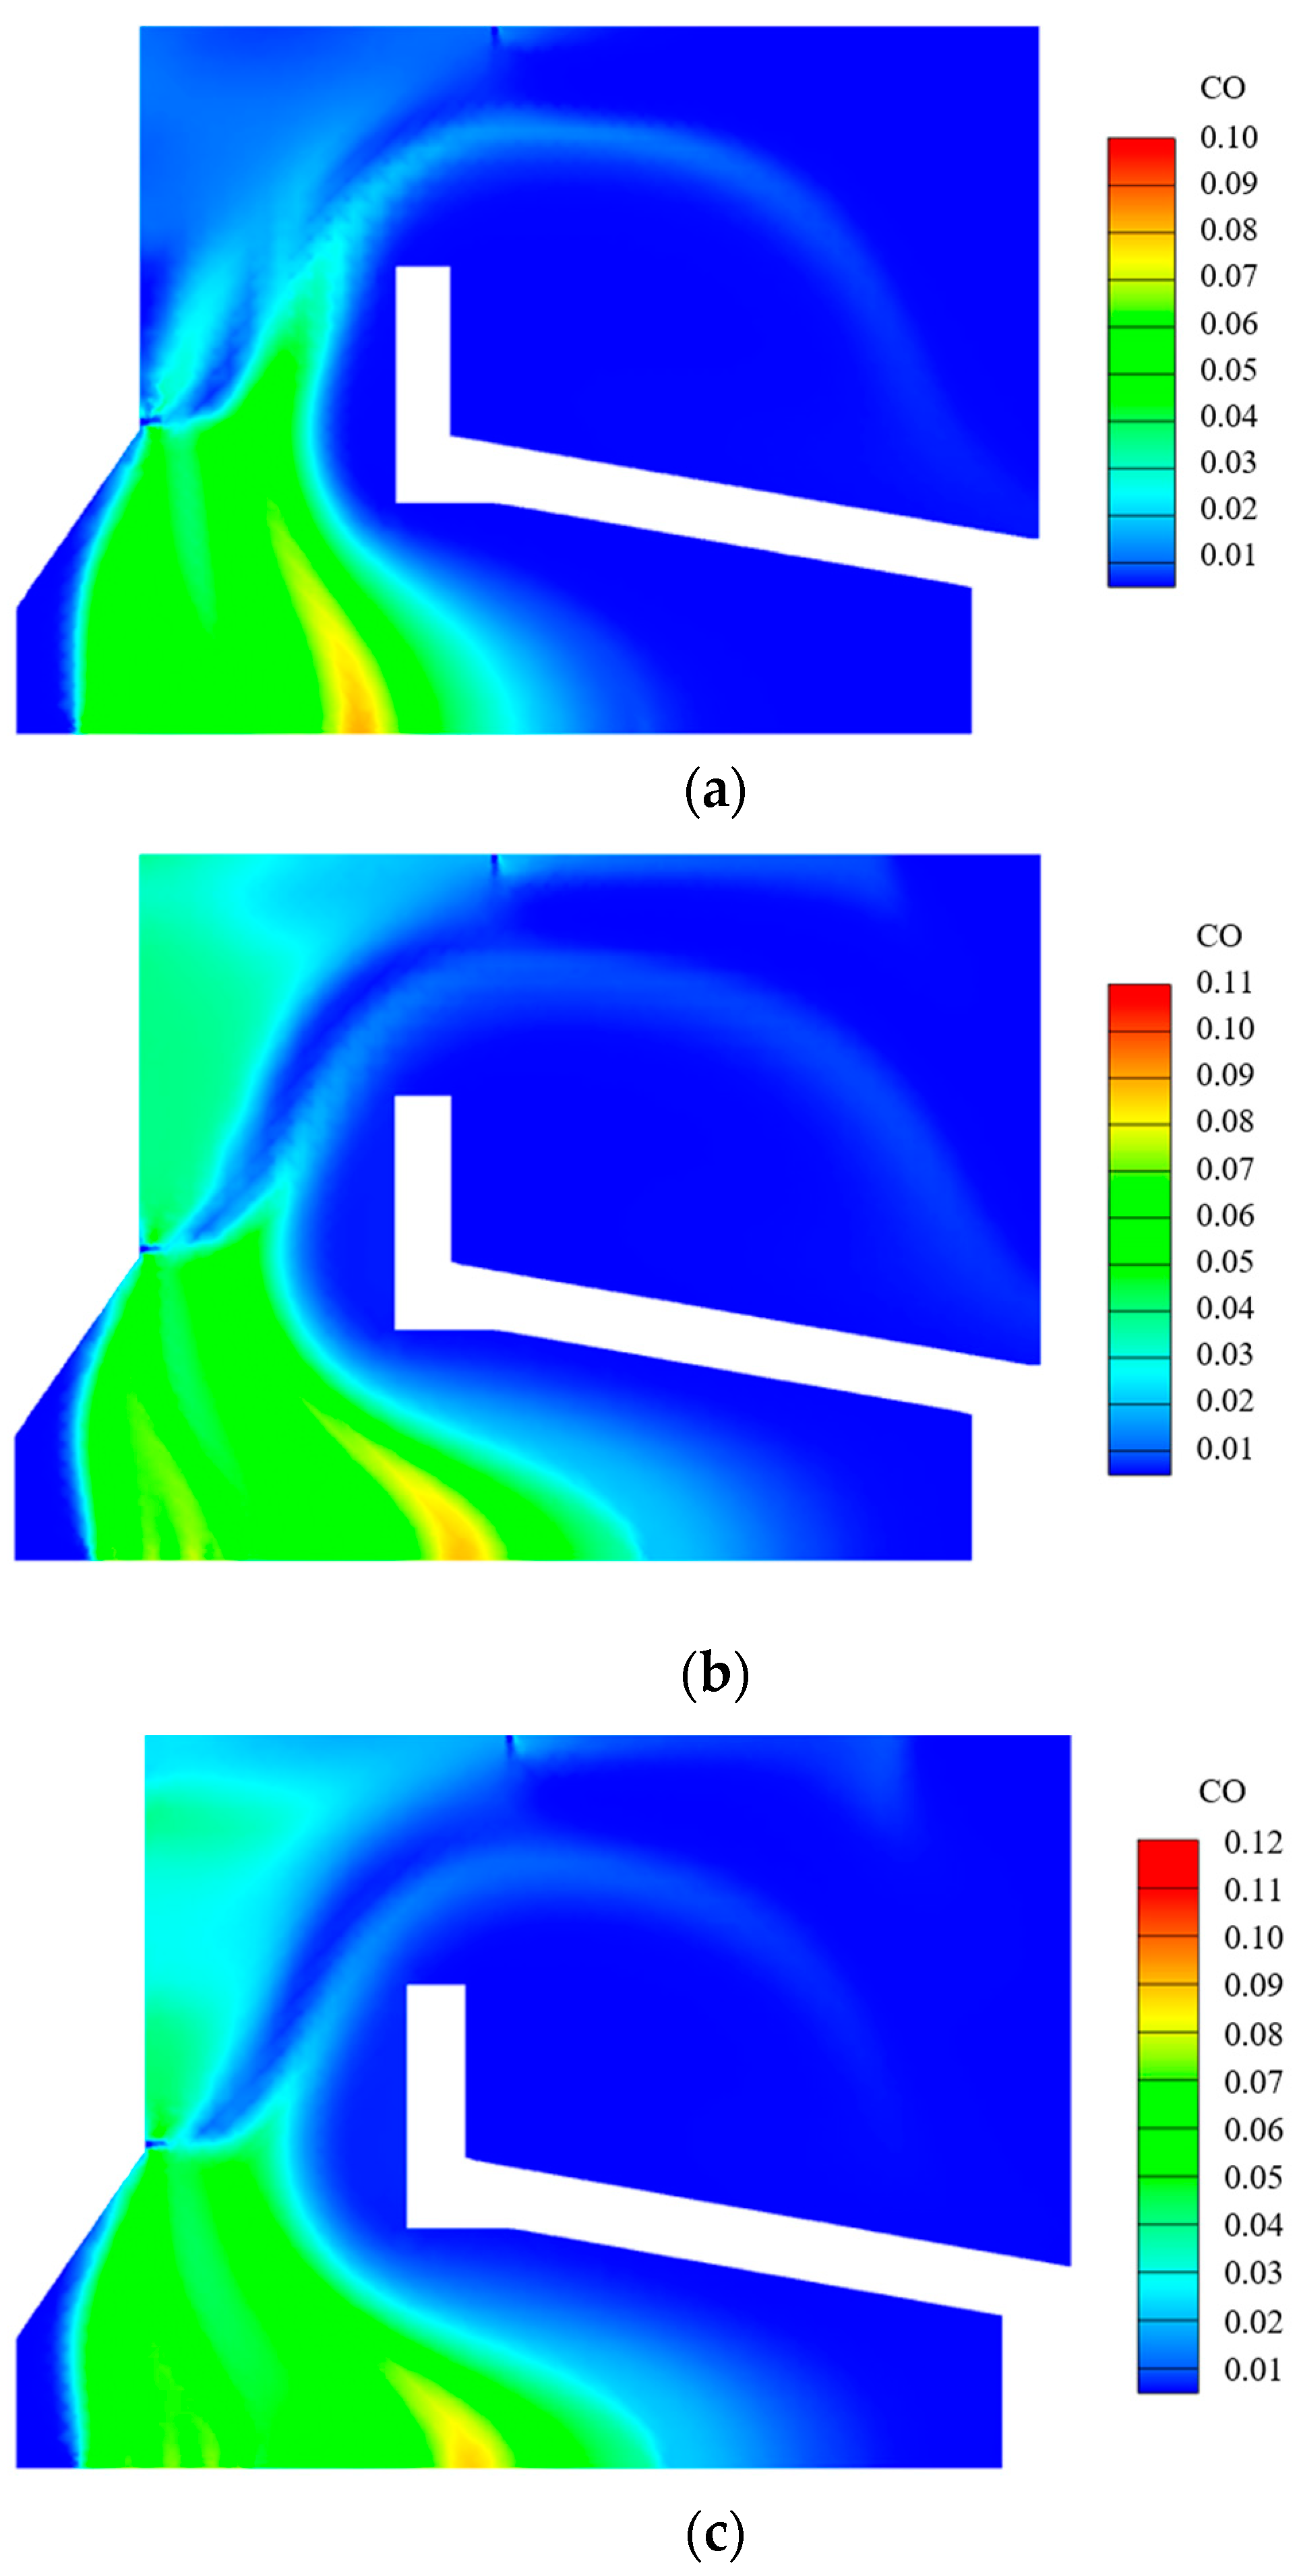
4.2.2. CO Concentration Field

Figure 8 shows the distribution of the CO concentrations in the furnace under three air distribution conditions. Under the condition of the FAD mode, the CO precipitation zone is narrower than those in the other two modes, followed by UAD mode and RAD mode in turn. In addition, the CO precipitation amount of the RAD mode is more than that in the other two modes. Therefore, the furnace is more likely to form a reducing atmosphere in such a delayed air distribution mode, and the reducing atmosphere is very beneficial to NOx emission reduction.

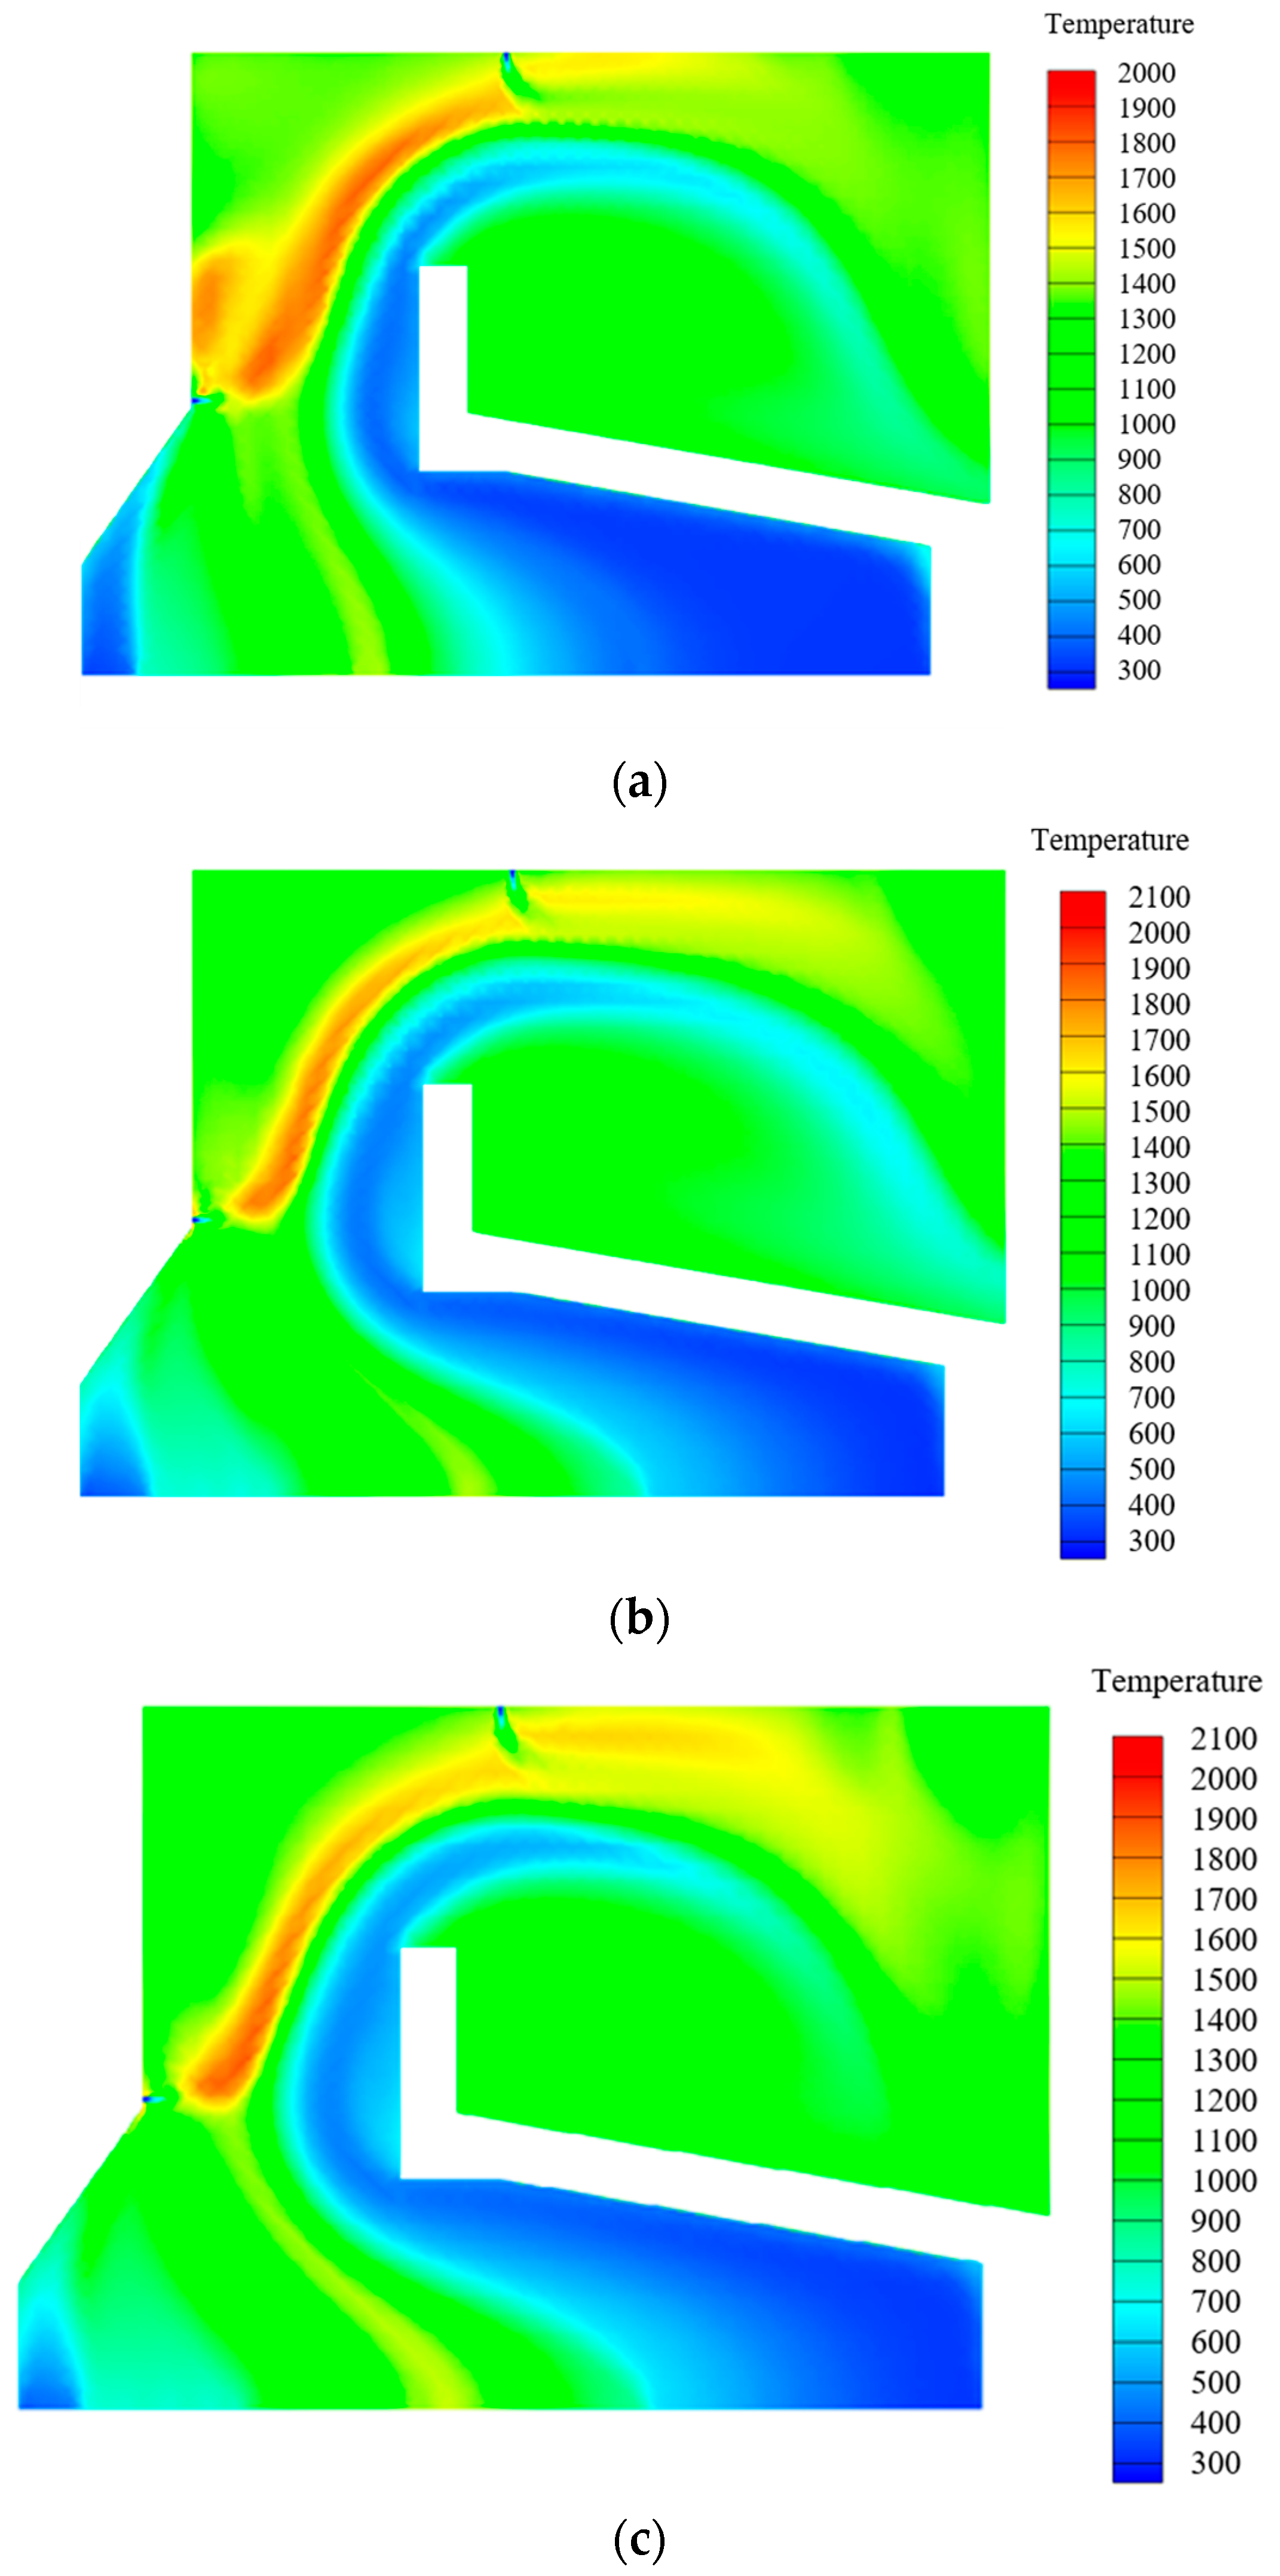
4.2.3. Temperature Field

The performance of the temperature field usually depends on two indicators; one is the average temperature, and the other is the uniformity of the temperature distribution in the combustion chamber. Figure 9 shows the contour maps of temperature distribution under three modes.
With the calculated data derived from Fluent, the average temperatures in the furnace chamber under the conditions of the FAD mode, UAD mode, and RAD mode are obtained as 996.5 K, 1002.3 K, and 1051.3 K, respectively. For a chain-grate furnace, the thermal radiation of the front and rear arches is an effective means for heating the bed, which is beneficial to the burnout of fuel in the moving bed. Therefore, the average temperature of the space below the throat of the furnace should be maintained at a relatively high level, which can reduce the carbon content in the bottom slag and improve the efficiency of the boiler. According to the calculation, the average temperatures of the lower part below the throat are 1074.3 K, 1081.0 K, and 1084.1 K under the above three modes. By comparison, the last mode is more favorable for the re-radiation of the furnace arch and the burning of the bed material.
In both the UAD mode and the FAD mode, the burning is violent in the front and middle part of the grate where the throat is located. Therefore, the flame will carry a higher amount of heat from the lower part through the throat to the tail of the furnace, resulting in a worse uniformity of temperature distribution in the furnace. The strong combustion zone of the RAD mode is located further than that of the other two modes, and a relatively uniform high-temperature environment can be obtained in the whole furnace. In addition, the flame may adhere to the wall under the condition of the FAD mode.
In summary, the RAD mode shows the best combustion performance in numerical simulation. Firstly, the amount of CO released is the highest, which is conducive to the formation of a reducing atmosphere beneficial for NOx reduction. Secondly, the highest average temperature provides a high-temperature environment for the burnout of the combustible contents.

4.3. NOx Emissions

Due to the lack of comparability in NOx volume fraction for exhaust gases with different volumes and temperatures, to compare the volume fraction of NOx under different conditions, it is generally converted to the emission concentration under the standard state of an oxygen concentration of 6%, as listed in Table 4 The order of NOx emission concentration is FAD mode > UAD mode > RAD mode.
The formation mechanism of NOx shows that the main way to reduce fuel NOx is to reduce the amount of oxygen and create a reducing atmosphere during the combustion process, which can reduce intermediate products such as HCN and NH3 to N2 [24]. As mentioned above, in the whole furnace, the order of oxygen concentration from high to low is [O2]FAD > [O2]UAD > [O2]RAD. For the CO concentration in the main combustion zone, the order from high to low is [CO]RAD > [CO]UAD > [CO]FAD. Combined with low oxygen concentration and high CO concentration, the NOx emission concentration can reach the minimum under the condition of the RAD mode.

5. Conclusions

In this study, the influence of the air distribution mode on the combustion performance of a 7 MW biomass grate-firing boiler used to produce hot air for drying grain in northeast China was numerically studied. The simulation results of biomass combustion on the grate and in the furnace were obtained under the conditions of three different air distribution modes, namely the FAD mode, UAD mode, and RAD mode. The RAD mode can not only enlarge the length of the combustion zone and increase the utilization rate of the grate but also effectively reduce the nitrogen oxide concentration at the furnace outlet by combining a low oxygen concentration and a high CO concentration.

Author Contributions

Conceptualization, N.H. and H.Y.; methodology, H.Y. and Y.J.; software, F.X.; validation, Q.W. and H.Y.; formal analysis, F.X. and N.H.; investigation, F.X. and H.Y.; resources, M.Z.; data curation, M.Z. and N.H.; writing—original draft preparation, F.X., H.W. and Q.W.; writing—review and editing, F.X. and H.W.; visualization, N.H.; supervision, H.Y. and M.Z.; project administration, N.H.; funding acquisition, N.H. All authors have read and agreed to the published version of the manuscript.

Funding

This research was funded by the Key Research and Development project of Changchun Science and Technology Bureau, grant number 21ZGM13, and Taiyuan City “unveiled the list of commanding” project: the flexibility of low-carbon power generation technology development for a high proportion of new energy consumption.

Data Availability Statement

Data are available on request from the authors. The data that support the findings of this study are available from the corresponding author upon reasonable request.

Acknowledgments

This research was supported by Jilin Shouqing Energy Co., Ltd.

Conflicts of Interest

The authors declare no conflict of interest.

References

  1. Khan, A.A.; Jong, W.; Jansens, P.J.; Spliethoff, H. Biomass combustion in fluidized bed boilers. Potential problems and remedies. Fuel Process. Technol. 2009, 90, 21–50. [Google Scholar] [CrossRef]
  2. Saidur, R.; Abdelaziz, E.A.; Demirbas, A.; Hossain, M.S.; Mekhilf, S. A review on biomass as a fuel for boilers. Renew. Sustain. Energy Rev. 2011, 15, 2262–2289. [Google Scholar] [CrossRef]
  3. Haberl, H.; Sprinz, D.; Bonazountas, M.; Cocco, P.; Desaubies, Y.; Henze, M.; Hertel, O. Correcting a fundamental error in greenhouse gas accounting related to bioenergy. Energy Policy 2012, 45, 18–23. [Google Scholar] [CrossRef] [PubMed]
  4. Zhang, L.; Xu, C.; Champagne, P. Overview of recent advances in thermo-chemical conversion of biomass. Energy Convers. Manag. 2010, 51, 969–982. [Google Scholar] [CrossRef]
  5. Sun, Y.; Yuan, Z.; Sun, Z. The status and future of bioenergy and biomass utilization in China. Renew. Energy Resour. 2006, 24, 78–82. [Google Scholar]
  6. Xu, C.; Hong, J.; Chen, J.; Han, X.; Lin, C.; Li, X. Is biomass energy really clean? An environmental life-cycle perspective on biomass-based electricity generation in China. J. Clean. Prod. 2016, 133, 767–776. [Google Scholar] [CrossRef]
  7. Yin, C.; Rosendahl, L.; Kær, S. Grate-firing of biomass for heat and power production. Prog. Energy Combust. Sci. 2008, 34, 725–754. [Google Scholar] [CrossRef]
  8. Ji, J. Numerical Modeling of the Combustion in Coal-Fired Traveling Grate Boilers and the Optimization of Arch and Air Distribution. Ph.D. Thesis, Shanghai Jiaotong University, Shanghai, China, 2008. [Google Scholar]
  9. Deng, M.; Nie, Y.; Yuan, Y.; Ma, R.; Shan, M.; Yang, X. The impact of oxygen content in the primary air supply on fuel burning rate and pollutant emissions in a forced-draft biomass stove. Fuel 2022, 321, 124129. [Google Scholar] [CrossRef]
  10. Zhou, M.; ParraÁlvarez, J.; Wu, Y.; Smith Sean, T.; Smith Philip, J. Large-eddy simulation of coal combustion in 15 MW pilot-scale boiler-simulation facility. AIChE J. 2021, 67, e17270. [Google Scholar] [CrossRef]
  11. Liu, Z. Influence of Air Distribution in the Furnace on Combustion Characteristics of the Boiler. China Special Equipment Safety 2013, 29, 7–10. [Google Scholar]
  12. Wang, Q.; Guan, J.; Sun, D.; Sun, B.; Sun, J. Numerical simulation of cold flow field in horizontal coal sootless combustion boiler furnace. Proc. Chin. Soc. Electr. Eng. 2003, 23, 164–167. [Google Scholar]
  13. Wang, J. Analysis of the Influence of the Boiler Arch on the Heat Transfer Process in the Furnace. Master’s Thesis, Dalian University of Technology, Liaoning, China, 2003. [Google Scholar]
  14. Xu, M. Numerical Simulation Study on the Effect of Arch Shape and Air Distribution Mode on the Combustion Performance of Chain Furnace. Master’s Thesis, Harbin Institute of Technology, Harbin, China, 2013. [Google Scholar]
  15. Ji, J.; Luo, Y.; Hu, L. Study on the mechanism of unsteady combustion related to volatiles in a coal-fired traveling grate boiler. Appl. Therm. Eng. 2008, 28, 145–156. [Google Scholar] [CrossRef]
  16. Wang, Y.; Sun, Q.; Wang, H.; Li, X.; Gao, J.; Du, Q.; Wu, S. Numerical modeling and optimization of nitrogen oxides reduction by biogas reburning in travelling grate boilers. Harbin Gongye Daxue Xuebao/J. Harbin Inst. Technol. 2019, 51, 52–57. [Google Scholar]
  17. Yu, Z.; Ma, X.; Liu, G. Structural Design and Numerical Simulation for Furnace Arch in Straw-fired Boiler. In Challenges of Power Engineering and Environment; Springer: Berlin/Heidelberg, Germany, 2007. [Google Scholar]
  18. Yang, Y.; Sharifi, V.; Swithenbank, J. Effect of air flow rate and fuel moisture on the burning behaviors of biomass and simulated municipal solid wastes in packed beds. Fuel 2004, 83, 1553–1562. [Google Scholar] [CrossRef]
  19. Yang, Y.; Goh, Y.; Zakaria, R.; Nasserzadeh, V.; Swithenbank, J. Mathematical modelling of MSW incineration on a travelling bed. Waste Manag. 2002, 22, 369–380. [Google Scholar] [CrossRef] [PubMed]
  20. Yang, Y.; Nasserzadeh, V.; Goodfellow, J.; Goh, Y.; Swithenbank, J. Parameter study on the incineration of municipal solid waste fuels in packed beds. J. Inst. Energy 2002, 75, 66–80. [Google Scholar]
  21. Xiong, L.; Lin, L.; Li, S. k-e Turbulent Model and its Application to the FLUENT. Ind. Heat. 2007, 36, 13–15. [Google Scholar]
  22. Shih, T.; Liou, W.; Shabbir, A.; Yang, Z.; Jiang, Z. A new k-e eddy viscosity model for high Reynolds number turbulent flows. Comput. Fluids 1995, 24, 227–238. [Google Scholar] [CrossRef]
  23. Miao, Z.; Dou, W.; Zhou, Q. Theoretical analysis of the characteristics of transverse air distribution in the air chamber of a fire-bed furnace. Therm. Energy Power Eng. 2001, 3, 380–382+460. [Google Scholar]
  24. Miao, M.; Zhou, T.; Hu, X.; Zhang, M.; Yang, H.R. Analysis of N2O reduction by components of red mud in bubbling fluidized bed. Fuel 2023, 333, 126476. [Google Scholar] [CrossRef]
Figure 1. The schematic diagram of the furnace.
Energies 16 07634 g001
Figure 2. Release rate curves of moisture, volatiles, and fixed carbon.
Energies 16 07634 g002
Figure 3. Gas temperature distribution curve above the grate.
Energies 16 07634 g003
Figure 4. Mass fraction distribution curve of gas components above the grate under UAD condition.
Energies 16 07634 g004
Figure 5. Mass fraction distribution curve of gas components above the grate under FAD condition.
Energies 16 07634 g005
Figure 6. Mass fraction distribution curve of gas components above the grate under RAD mode condition.
Energies 16 07634 g006
Figure 7. O2 concentration distribution in a furnace: (a) FAD, (b) UAD, (c) RAD.
Energies 16 07634 g007
Figure 8. CO concentration distribution in a furnace: (a) FAD, (b) UAD, (c) RAD.
Energies 16 07634 g008
Figure 9. Temperature distribution in a furnace: (a) FAD, (b) UAD, (c) RAD.
Energies 16 07634 g009
Table 1. Designed value of hot air furnace.
Item UnitDesigned Value
Power of furnace MW7.00
Fuel lower heating valuekJ/kg12,790.00
Fuel feed ratet/h2.40
Initial fuel layer heightm0.25
Design efficiency%83.12
The effective length of the gratem4.50
Width of gratem2.50
The heat load of the gratekW/m2875.00
Excess air ratio-2.00
Table 2. Ultimate and approximate analyses of fuel.
Ultimate (ar)/%CarHarOarNarSar
38.054.3035.450.490.09
Proximate (ar)/%MVFCA
8.1065.1013.2013.60
Table 3. Air volume distribution of different air distribution modes.
Primary Air Wind BoxABCD
Lengths of wind boxes, m0.761.020.760.76
FAD, %30.0040.0015.0015.00
UAD, %23.0031.0023.0023.00
RAD, %15.0020.0035.0030.00
Table 4. NOx emission at furnace outlet under different air distribution modes (6% O2).
FADUADRAD
Concentration, mg/Nm3133.50104.4076.60
Disclaimer/Publisher’s Note: The statements, opinions and data contained in all publications are solely those of the individual author(s) and contributor(s) and not of MDPI and/or the editor(s). MDPI and/or the editor(s) disclaim responsibility for any injury to people or property resulting from any ideas, methods, instructions or products referred to in the content.

