Abstract
Wettability, as a vital tool for analyzing and describing oil flow, plays a significant role in determining oil/water relative permeability, residual oil distribution, and on–site recovery efficiency. Although the contact angle method is widely used for measuring wetting behavior, it is susceptible to the effects of surface roughness, oil–water saturation, and the distribution of mixed wetting within the range of droplet sizes. Additionally, millimeter–scale droplets fail to accurately represent the wetting distribution and the influencing factors at the micro/nano–scale. Therefore, this study presents a comprehensive investigation of the microstructure and wettability of shale samples. The characterization of the samples was performed using scanning electron microscopy (SEM) and atomic force microscopy (AFM) techniques to gain insights into their microscopic features, surface properties, and wettability. Results demonstrate the following: (1) Quartz and clay minerals tended to exhibit rough surface topography, appearing as darker areas (DA) under scanning electron microscopy (SEM). It is worth noting that plagioclase minerals exhibited brighter areas (BA) under SEM. (2) An increase in the content of minerals such as quartz and clay minerals was observed to decrease the surface oil wetting behavior. In contrast, plagioclase feldspar exhibited an opposite trend. (3) Based on the adhesive forces of the samples towards oil or water, a wetting index, I, was established to evaluate the wettability of shale at a microscale. The dimensionless contact angle W, obtained by normalizing the contact angle measurement, also consistently indicated oil wetting behavior. (4) By comparing the differences between I and W, it was observed that surface roughness significantly affected the behavior of water droplets. The presence of roughness impeded the contact between the solid and liquid phases, thus influencing the accuracy of the wetting results. Organic matter also plays a significant role in influencing surface wettability, and its distribution within the shale samples can lead to localized variations in wettability.
1. Introduction
Unconventional oil and gas reservoirs have gained significant global attention as conventional reserves have become depleted and the demand for petroleum resources continues to rise. Among these reservoirs, shale oil has emerged as a crucial contributor to maintaining the energy balance [1,2,3]. However, the exploitation of shale oil resources presents substantial challenges [4,5]. Shale oil production currently faces challenges such as low yields and rapid decline in well productivity. The intricate micro/nano–scale pore–throat network units and the adsorption behavior of organic matter between mineral grains are critical factors influencing the flow of crude oil. The flowability of crude oil is significantly influenced by the complex physicochemical properties derived from the shale surface [6,7]. These properties are directly related to wettability, which characterizes and describes the interactions between the solid and liquid phases [8]. Wettability serves as a direct indicator of the extent and capability of these factors to affect the flow behavior of oil. Indeed, a detailed understanding of wettability is crucial for enhancing shale oil recovery. CO2 sequestration techniques commonly used in tight shale are influenced by various factors, such as fluid properties and surface characteristics. The key lies in understanding the micro– and nanoscale solid–liquid interactions, which include phenomena like changes in pH and the acidification of rocks when CO2 dissolves in reservoir water, altering wettability within the reservoir. Therefore, gaining further insights into solid–liquid interactions is fundamental to enhancing CO2–enhanced oil recovery efficiency, and it can also provide valuable guidance for the storage and utilization of carbon dioxide. Nevertheless, conventional macroscopic evaluation techniques struggle to accurately characterize these intricate patterns. Therefore, it is crucial to develop accurate and comprehensive assessment methods to understand solid–liquid interactions at micro– and nanoscales in shale formations.
Wettability, which describes the interfacial tension relationships between solid, liquid, and gas phases, is influenced by several factors [9,10,11]. These factors include surface roughness, temperature, pressure, mineral compositions, and organic matter [12]. Among these factors, surface roughness plays a crucial role in determining interfacial tension and, subsequently, wettability. The roughness of the solid surface affects the contact area and the degree of wetting by different phases [13]. Temperature and pressure variations can also alter the interfacial tension, thereby impacting wettability behavior. Furthermore, the mineral composition and organic matter within reservoir formations are recognized as primary factors governing shale wettability [6,7,14,15,16]. The distribution of minerals within the formation also plays a vital role in determining the overall wettability characteristics of a sample. Reservoirs rich in quartz, feldspar, and clay minerals tend to exhibit hydrophilic behavior, as quartz surfaces possess strong water–attracting capabilities [17,18]. Additionally, expandable clay minerals exhibit significant water absorption and swelling behavior [19], which can modify the roughness and surface forces at the solid–liquid interface. This, in turn, has a profound impact on the overall wettability state of the reservoir. Additionally, organic matter plays a crucial role in modifying the interfacial forces between solids and liquids [20]. One example is asphaltene, which possesses hydrophobic aromatic cores and hydrophilic polar groups. Asphaltene has the ability to spontaneously adsorb onto solid surfaces, thereby influencing the distribution of charged particles and interfacial tension at the solid–liquid interface [21]. This adsorption of asphaltene onto solids has been observed to alter surface wettability. Moreover, when asphaltene is adsorbed at the oil–water interface, it can affect surface potential, interfacial tension, and other related properties [22,23,24]. Moreover, the non–uniform and stochastic distribution of minerals and organic matter within shale formations leads to a heterogeneous distribution of mixed wettability, with the presence of oil–wet zones being particularly significant. These oil–wet zones have a detrimental effect on the efficiency of oil recovery. It has been observed that even after water flooding, substantial amounts of trapped oil remain on rock surfaces, indicating the limited micro–scale mobility of shale oil [25]. Based on this observation, Xi et al. [5] conducted a study to explore the relationship between mineral types, trapped oil, and pore structure in mixed–wettability shale reservoirs. The results revealed that macroscopic wettability outcomes were directly influenced by different laminae, mineral types, and the distribution of organic matter within the reservoir. Many researchers have extensively studied the interrelationships among the factors influencing wettability [9,10]. Their findings have further demonstrated and elucidated the complexity of shale wettability, which pose higher demands on the accuracy and applicability of wettability characterization methods [26].
In order to clarify and evaluate the wettability of samples, many testing methods have been proposed by predecessors. The measurement of contact angles between the wall surface and liquid droplets has been the most widely used method to quantify surface wettability [27,28,29]. Contact angle measurement is a valuable and robust theoretical model; however, its initial application was focused on macroscopic wettability and is subject to limitations imposed by various external factors. Challenges arise when the droplets being tested exhibit rolling behavior or when the sample surface is rough, making accurate contact angle determination difficult [30]. Furthermore, these measurements fail to capture the local wettability variations resulting from chemical heterogeneity or mineral distribution. Notably, several researchers [25,26,31] have observed different contact angles within adjacent areas, indicating the presence of trapped oil even within contact angles associated with water–wet conditions. This underscores the direct influence of microscale wettability distribution on contact angle measurements and the limited representativeness of this method. Nevertheless, other methods, such as the Amott wettability index, USBM method, and spontaneous imbibition, face challenges in accurately characterizing neutral wettability, being influenced by pore–throat structures, surface roughness, and the fact that they are complex and time–consuming [20,26,32,33,34,35,36]. Nevertheless, nuclear magnetic resonance only allows for the analysis of wettability variations between pore–throat channels of different diameters [20,36,37,38]. To gain a more comprehensive understanding of the specific microscopic influences on wettability, it is crucial to integrate these approaches with other techniques. In recent years, molecular dynamic simulations have become increasingly popular [39,40], enabling a detailed exploration of molecular interactions and movements at the microscale. However, these simulations do not provide a quantitative assessment of wettability for different samples. Therefore, there is a pressing need to develop new wettability evaluation methods that offer enhanced accuracy and applicability, particularly in assessing microscale rough surfaces.
AFM serves as a robust tool in the realm of scientific exploration. By leveraging the mechanical interactions generated when a flexible cantilever probe comes into contact with a solid surface, coupled with the knowledge of the cantilever’s elasticity, AFM enables the measurement of both surface topography and adhesion forces [41,42]. This technique has found extensive utility across various domains, including medicine, biology, and mineralogy, exemplifying its versatility and significance [43]. In recent years, atomic force microscopy (AFM) has gained popularity for conducting nanoscale investigations. Initially utilized for the surface scanning of rocks to generate 2D and 3D topographic maps [44], AFM has evolved to provide mechanical information by the development of droplet probes, which has enabled the measurement of nanoscale mechanical of interaction between oil droplets and solid surfaces. Shi et al. [21] conducted a study focusing on the surface forces of model oil droplets, including toluene and heptol, and their interactions with shale samples after oil washing. The findings revealed that the hydrophobic interactions on the surface of hydrophobic mica can overcome the steric hindrance caused by asphaltene interfacial adsorption, resulting in strong adhesion and attachment of the oil droplets. Later on, researchers explored surface modifications of gold–coated AFM probes using different chemical reagents to investigate specific interaction mechanisms between functional groups and solids, offering insights into dominant mechanical actions at the experimental level [45,46,47]. For instance, employing probe–based techniques to delineate adhesion curves between crude oil and calcite/dolomite has facilitated the understanding of the interactions between carbonate reservoir surfaces and crude oil [48]. Notably, AFM allows for the evaluation of mechanical properties between solids and liquids at the nanoscale, utilizing probes with radii ranging from 20 to 40 nm [49,50,51]. This range encompasses the majority of the smallest mineral sizes. The use of atomic force microscope probes can reduce the errors caused by surface roughness in measurements and enable a more precise and qualitative assessment of rocks using various types of probes. However, it is important to note that, to date, the numerical values of adhesion forces measured by AFM have not been directly linked to rock wettability. Instead, AFM has been utilized as a complementary tool in wettability research. Further investigations are required to integrate AFM measurements with other methods to comprehensively assess the microscopic wettability differences in shale reservoirs.
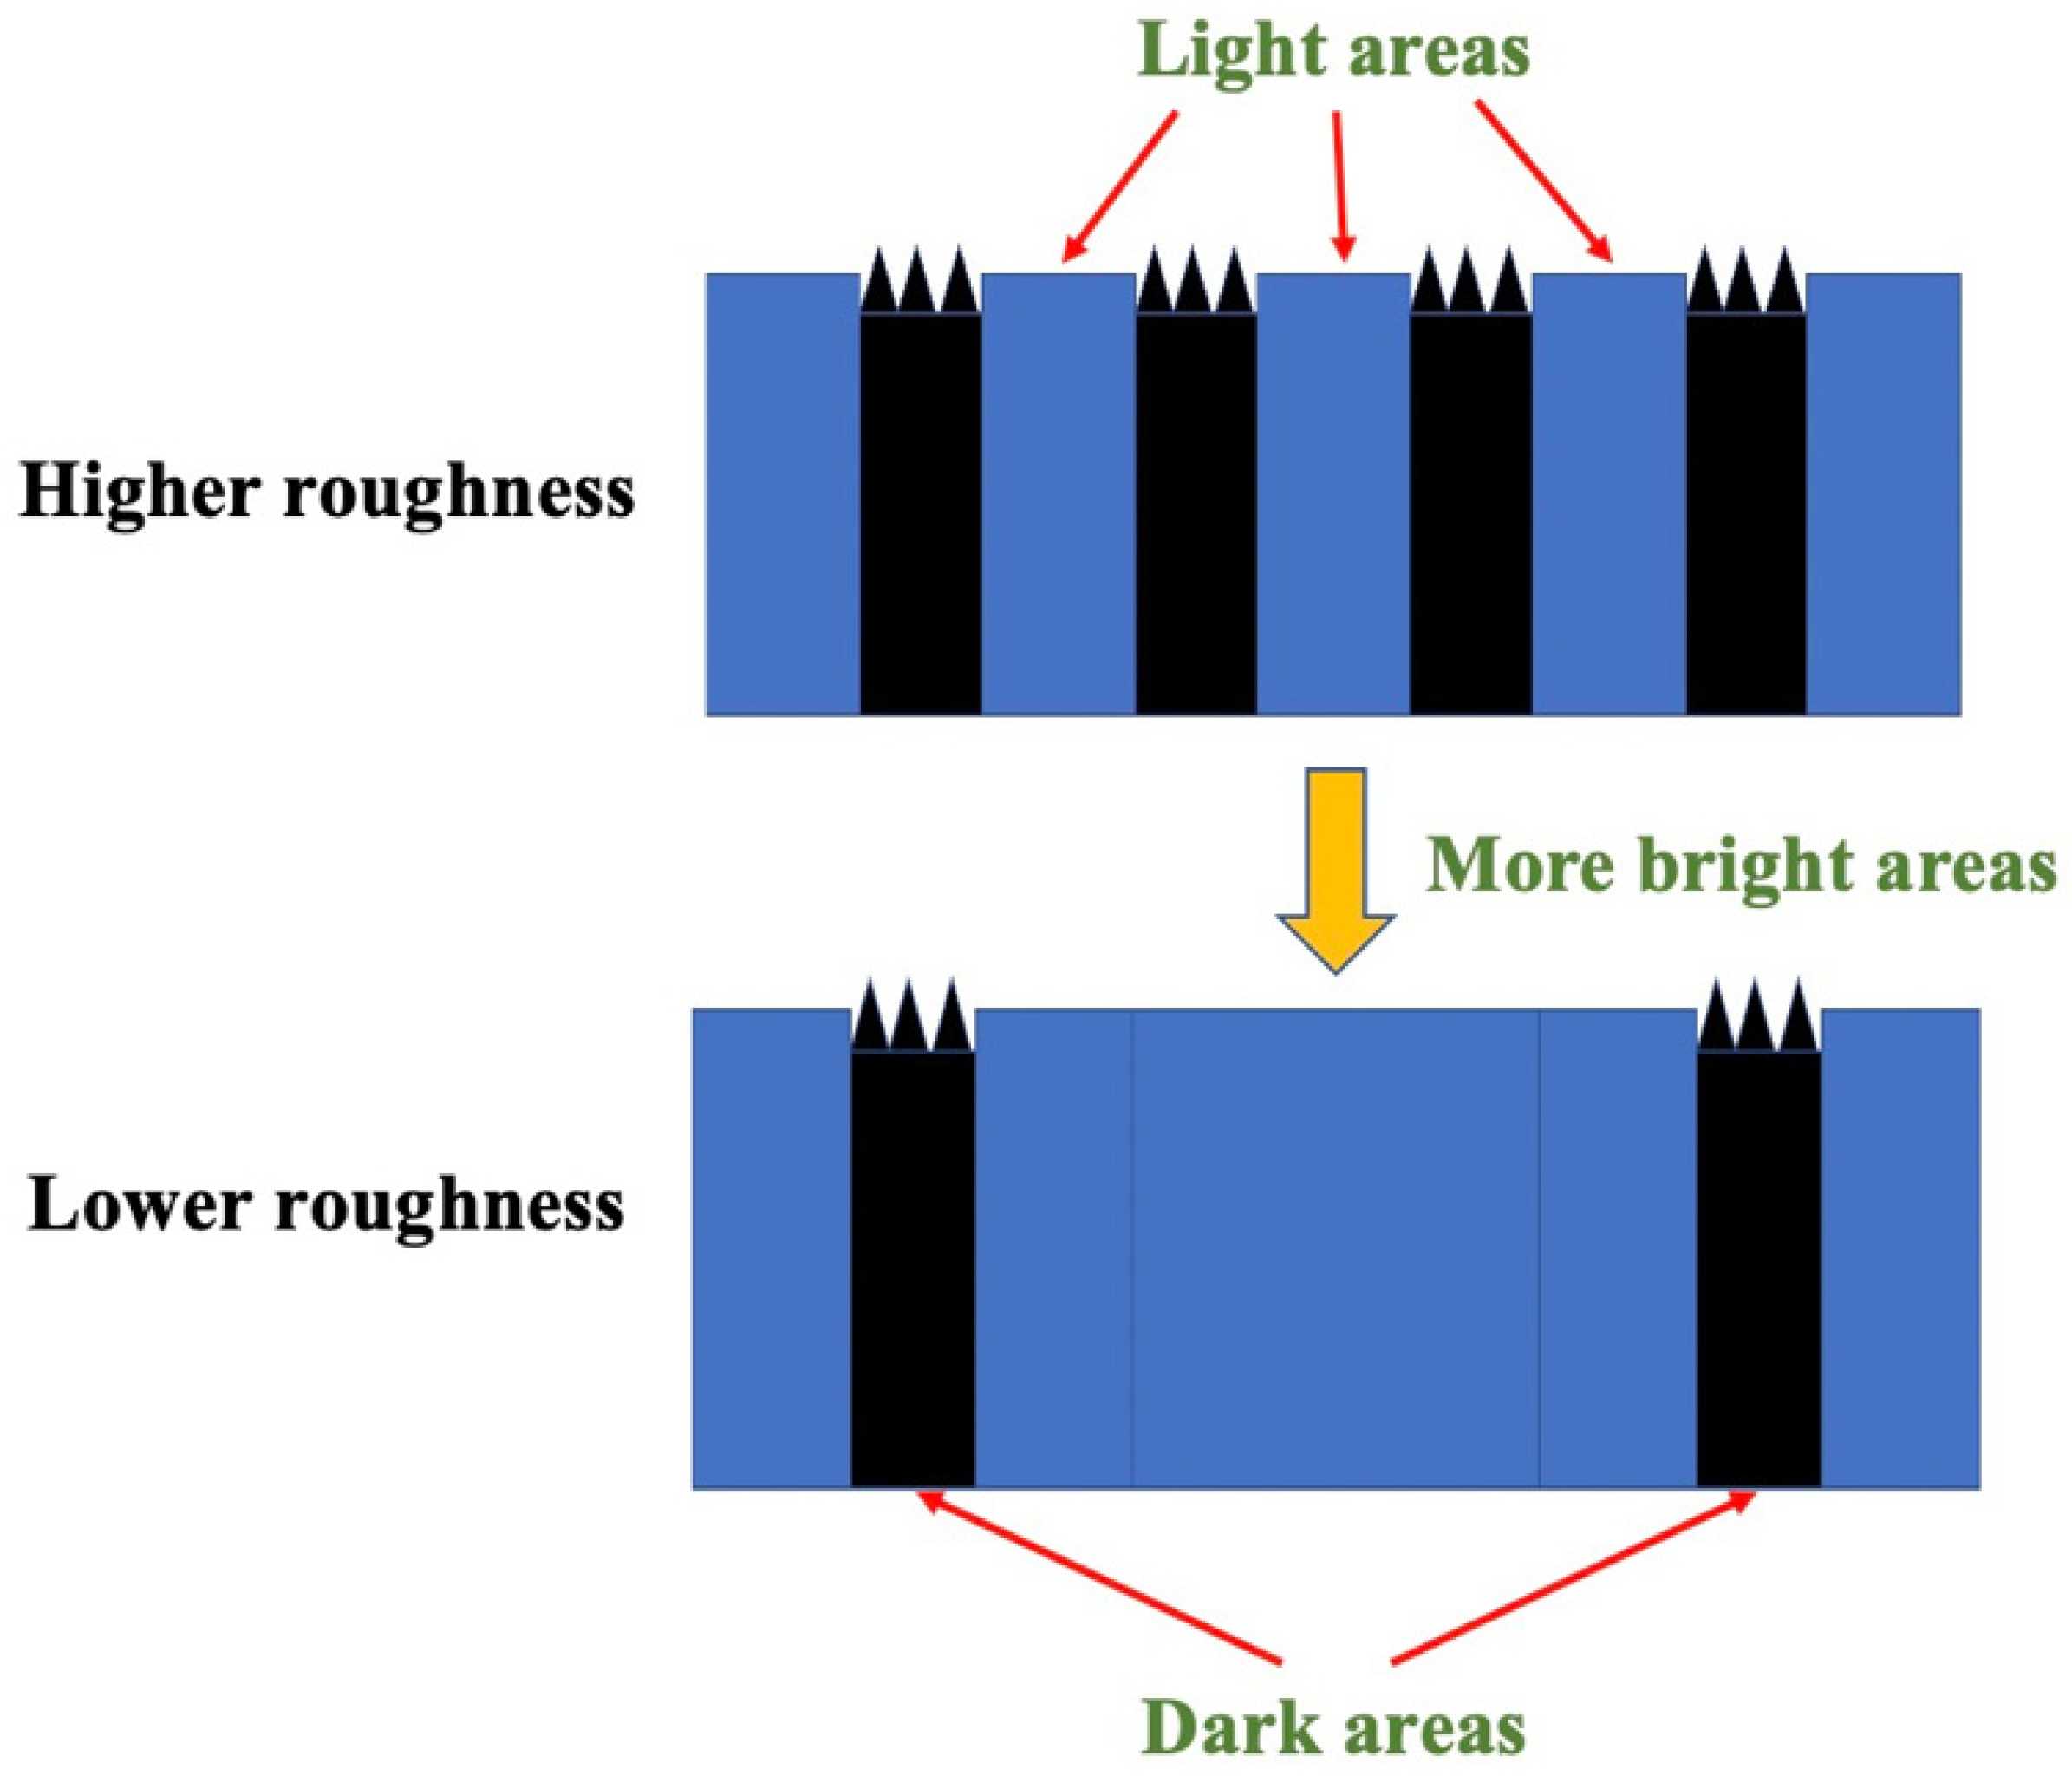
In this study, a combination of electron microscopy and surface morphology measurements was employed to identify distinct feature areas in the samples. Based on this foundation, an analysis was conducted to examine the correlation between mineral content, surface roughness, and wettability. To assess the adhesion forces between the sample surface and specific oil components, modified gold–sulfur bond probes were utilized to simulate the contact process between oil and rock. Additionally, hydrophilicity measurements of the sample surface were conducted using hydroxyl–functionalized AFM probes. The molecular interactions between the chemical probes and the sample surface provided insights into the variations in adhesion forces at the interface of the sample and water/oil droplets, directly associated with wettability. By coupling the shale surface force–distance curves obtained using two different probes, a dimensionless wettability index was established to evaluate wettability characteristics at microscale point locations. This research using the application of AFM in exploring wettability demonstrated its feasibility and addressed the challenges associated with microscale wetting measurements, laying a solid foundation for further investigations to enhance studies aimed at improving oil displacement efficiency.
2. Materials and Methods
2.1. Materials
Shale Samples
The shale samples used in this study were sourced from two distinct blocks, namely well JA (JA) and well JB (JB), within the Lucaogou Formation in Xinjiang, China. These samples predominantly consisted of quartz, feldspar, clay minerals (primarily kaolinite, illite, and chlorite), and a minor quantity of carbonate minerals. The mineralogical composition, as depicted in Table 1, represents a significant portion of mixed shale reservoirs and serves as an exemplary model system for terrestrial shale reservoirs.

Table 1.
Inorganic and organic components of the Lucaogou Formation of JA and JB.
These samples were derived from the retrieved 25 mm core samples. Subsequently, a 10 mm drill bit was used to extract material from the center of the samples, and in conjunction with mechanical cutting, they were processed into 2 mm–thick circular thin sections for AFM studies. During this process, the samples were not subjected to oil washing treatment to maintain them in a state as close as possible to their original condition in the geological formation, facilitating the measurement of solid–liquid adhesion forces.
2.2. Preparation of Sample Flat Surfaces
The sample surfaces were meticulously prepared using a combination of a Leica mechanical polishing machine and a state–of–the–art triple–beam argon ion milling machine. Firstly, the samples were sliced precisely into 2 mm thick sections to ensure uniformity. Subsequently, a meticulous polishing process was carried out, employing a series of sandpapers with varying surface roughness, namely 9 μm, 2 μm, and 0.5 μm. This step was crucial in eliminating any residual scratches caused by coarser sandpapers, thereby refining the surface quality of the samples. To further enhance the surface smoothness and eliminate any remaining imperfections, the polished samples underwent a meticulous ion milling process. Utilizing an argon ion beam, the samples were subjected to alternating polishing cycles, with voltages set at 5 kV and 2 kV, respectively. A working current of 2.0 mA was employed, and each polishing cycle had a duration of 20 min. This meticulous ion milling process ensured the attainment of an optimal surface condition for subsequent analysis. The surface characteristics of the polished samples were thoroughly examined using atomic force microscopy (AFM) in contact mode. Two–dimensional and three–dimensional morphology analyses were performed to capture the intricate details of the sample surfaces. Additionally, the average roughness parameter was determined to quantitatively assess the surface texture. This comprehensive characterization using AFM allowed for a precise evaluation of the sample surface topography, enabling a deeper understanding of its physical properties and features.
2.3. Contact Angle Measurements
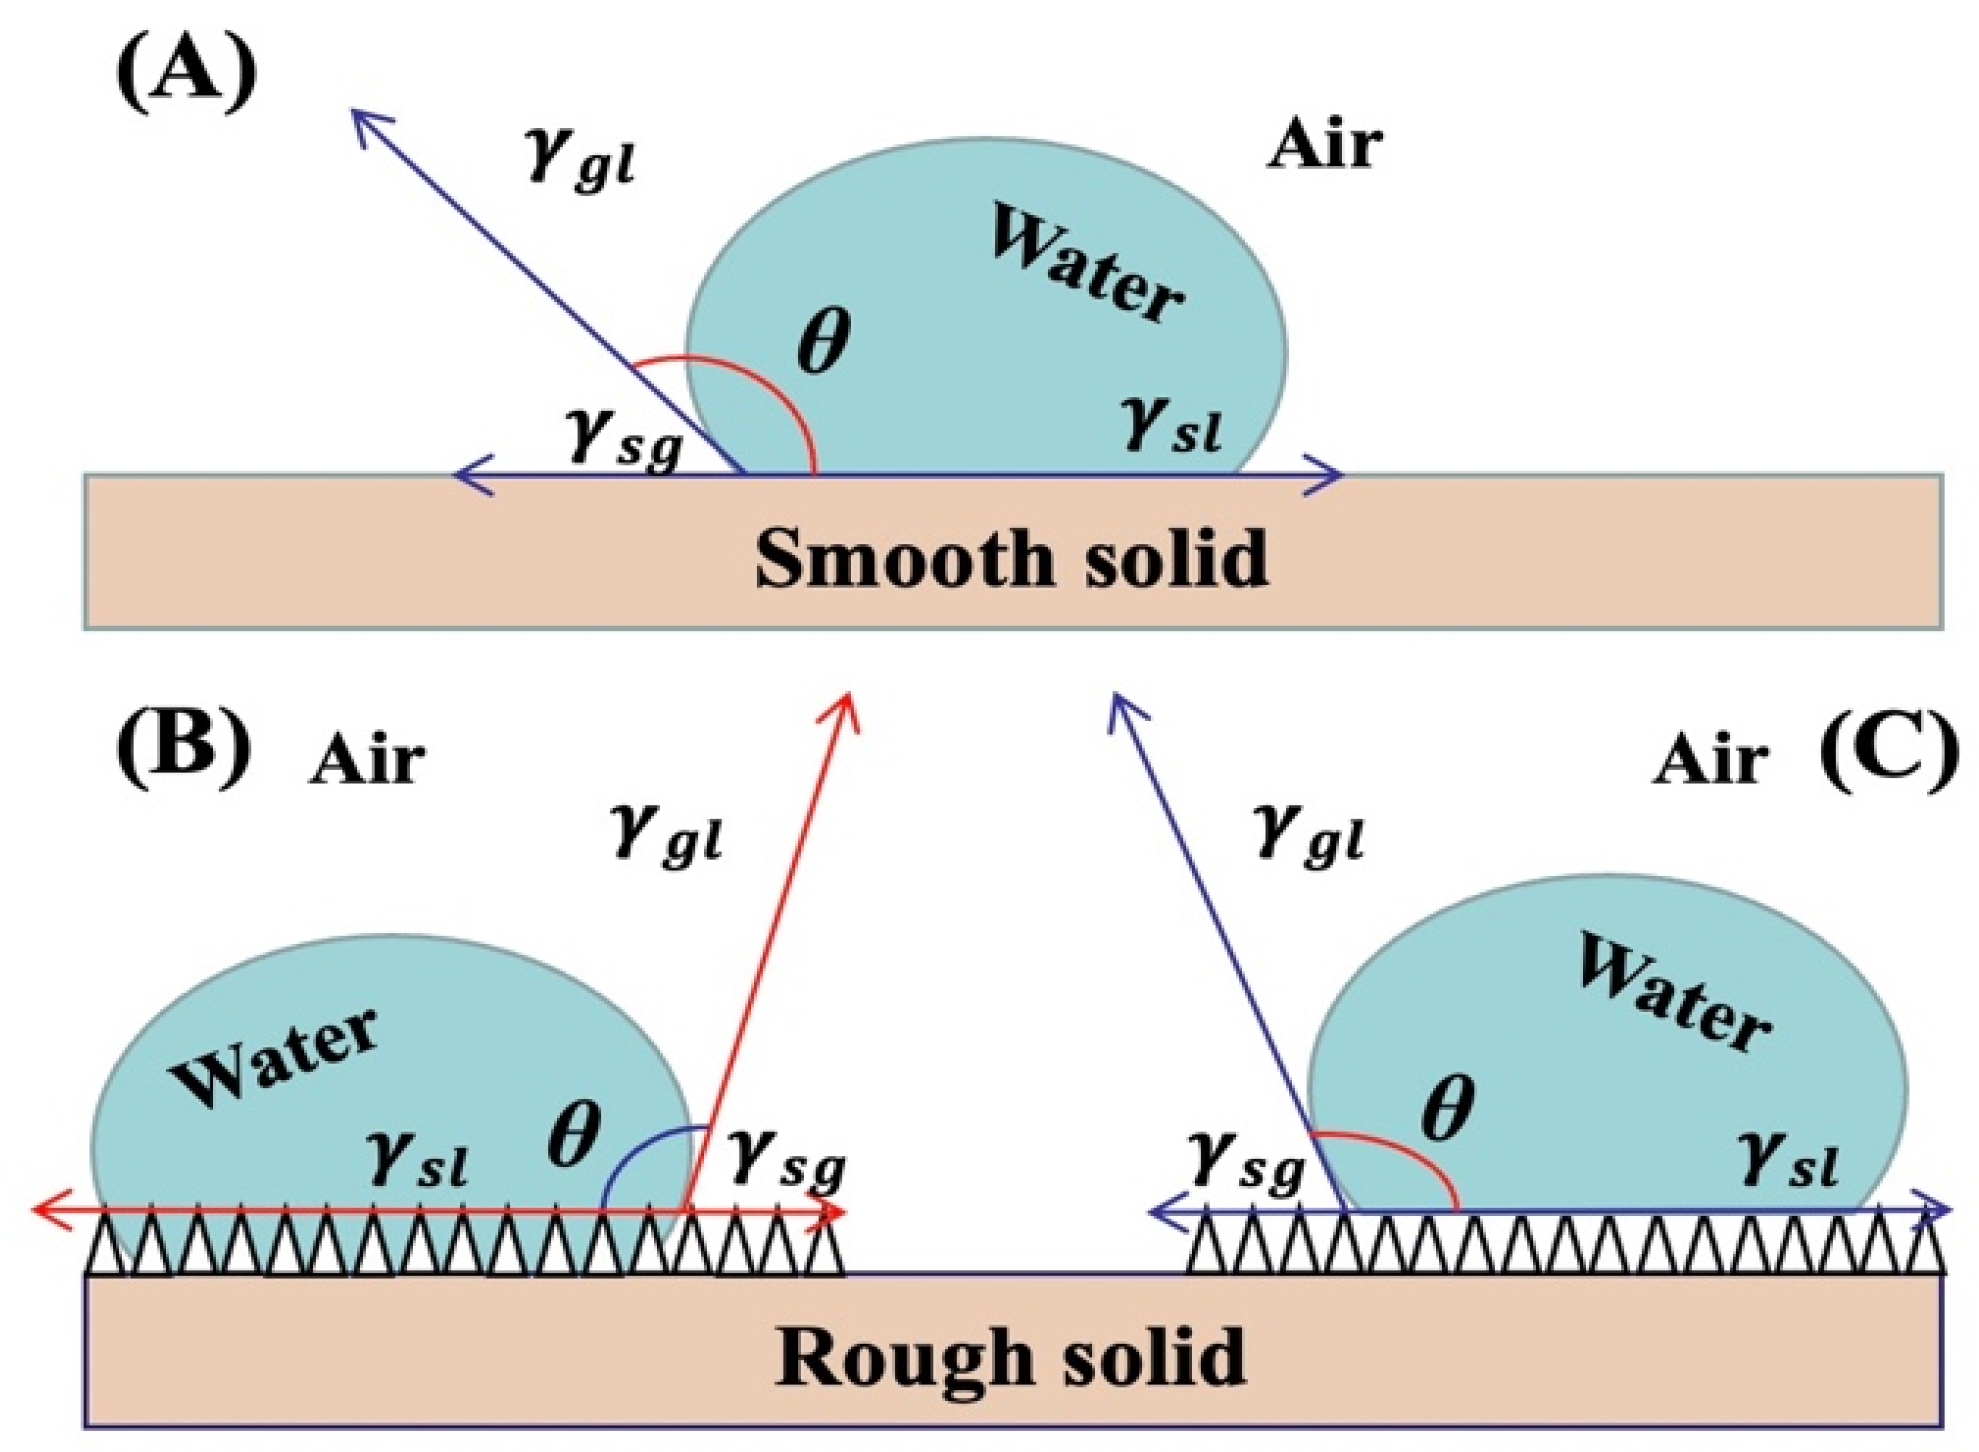
In this study, the wettability of three adjacent points on the surface of each shale sample was investigated using the sessile drop method. The sessile drop method is the most widely used technique for measuring contact angles; in this method, a pipette was manually used to drop distilled water onto the marked position (corresponding to the range of surface roughness measurements mentioned later in the text), and the contact moment between the solid–liquid interface and the liquid–gas interface was captured using a high–speed camera. Thus, the surface tension relationships among the solid–gas, gas–liquid, and solid–liquid interfaces were characterized, as shown in Figure 1. The coupling relationship based on the Young’s equation can be expressed as follows [10,12,21,22,23,52]:
In the equation, represent the surface tensions of the solid–gas, solid–liquid, and liquid–gas phases, respectively.
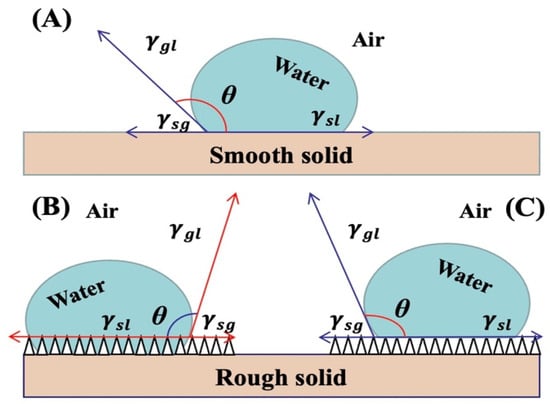
Figure 1.
The relationship between contact angle and interfacial tension: (A) contact angle on a smooth surface, (B) Wenzel contact angle on a rough surface, and (C) Cassie contact angle on a rough surface.
Figure 1.
The relationship between contact angle and interfacial tension: (A) contact angle on a smooth surface, (B) Wenzel contact angle on a rough surface, and (C) Cassie contact angle on a rough surface.
2.4. AFM Measurements
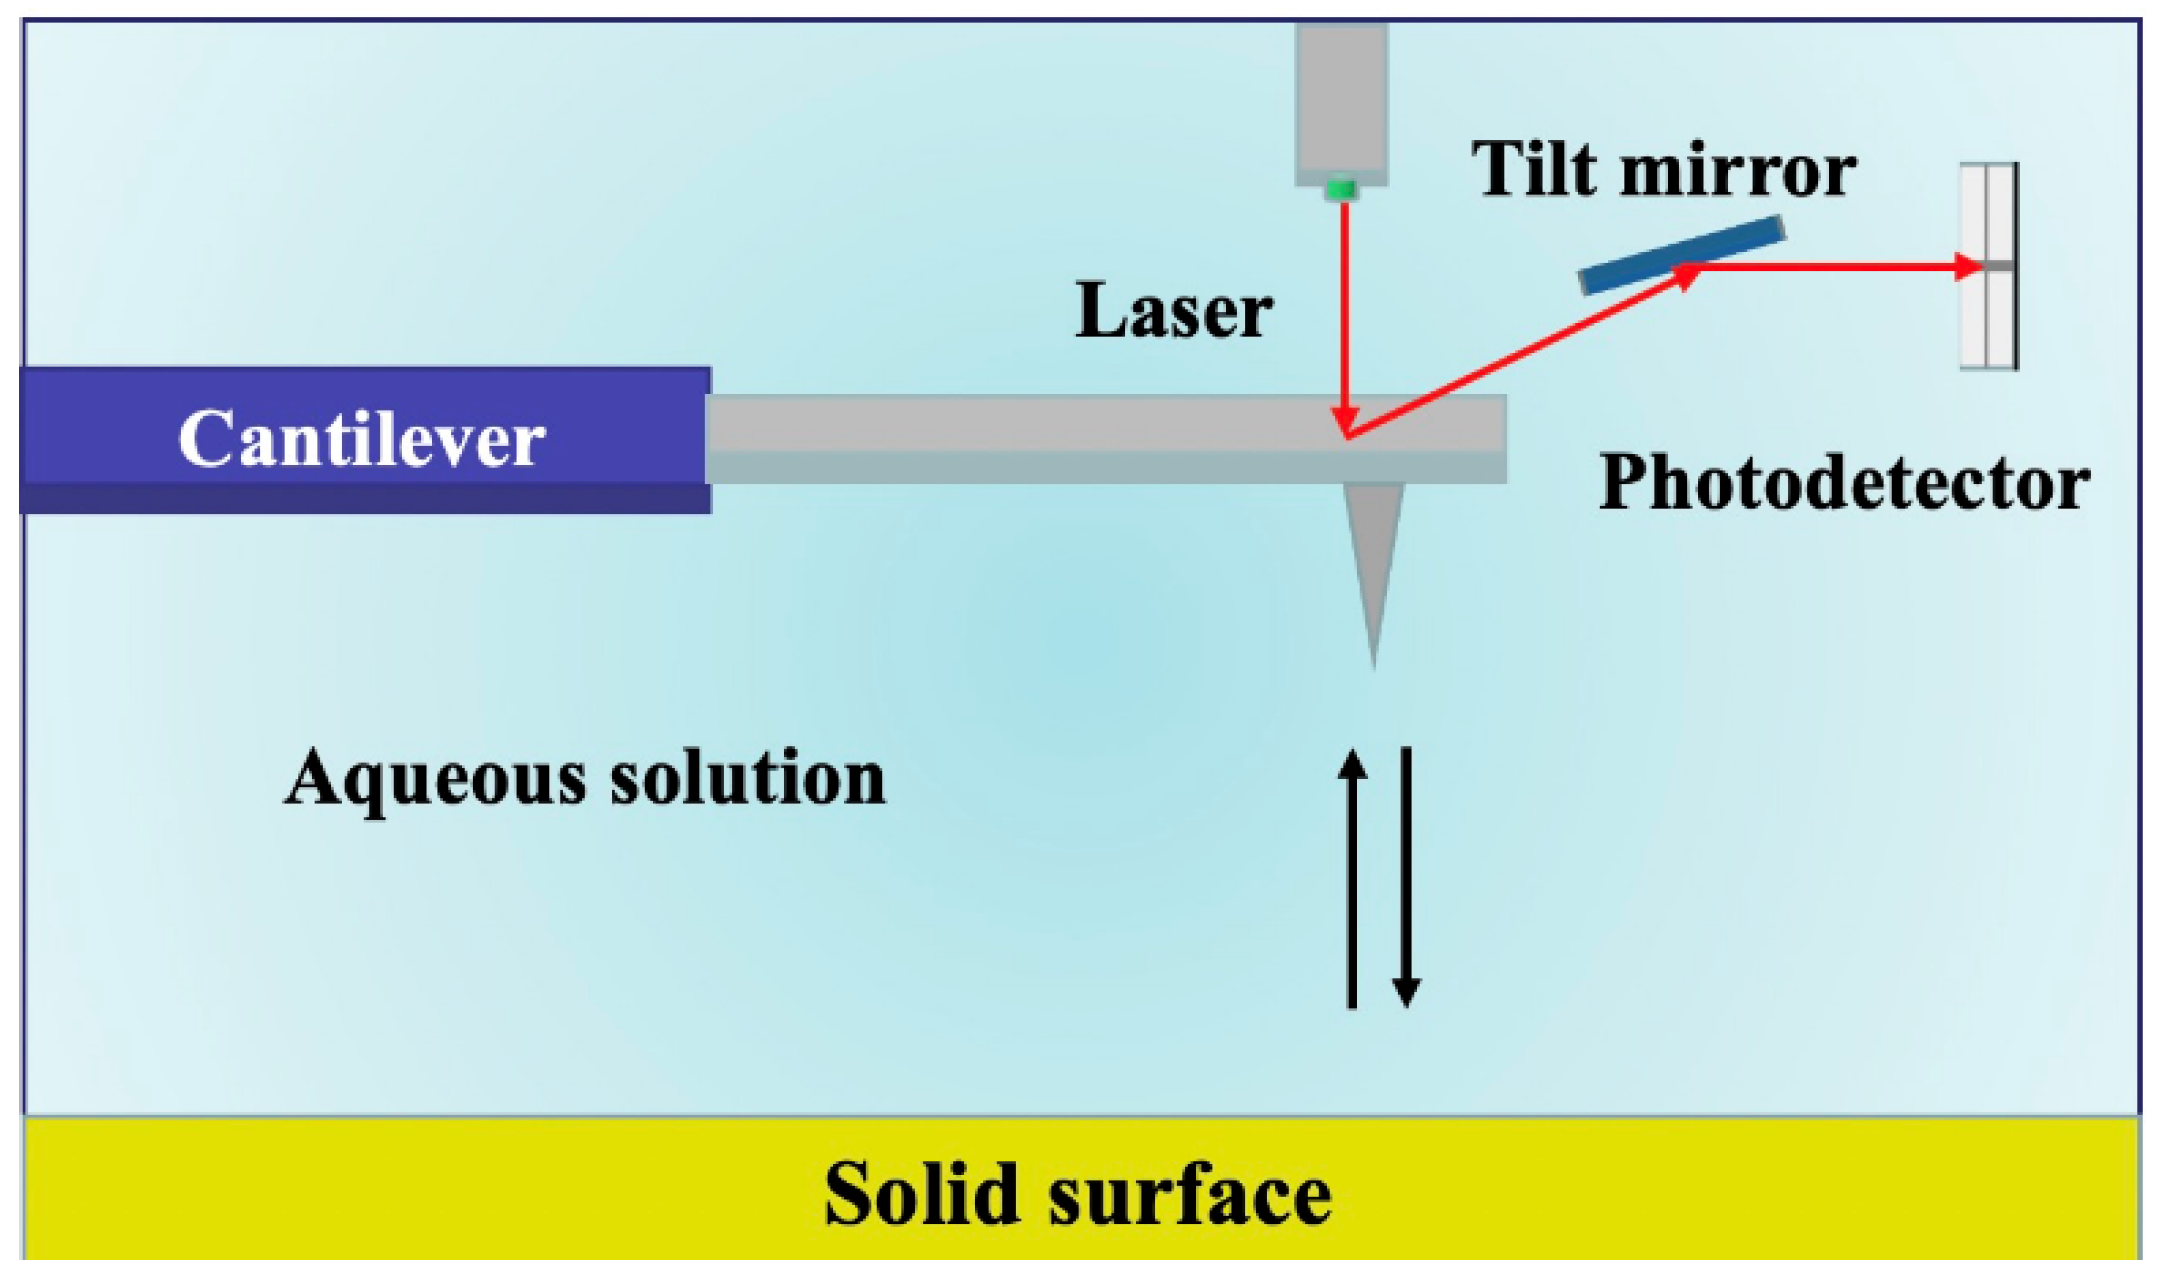
Notably, AFM operates in three primary modes: contact, non–contact, and tapping mode, each offering unique capabilities [44]. In our study, we employed the PeakForce mode, which offers distinct advantages by directly probing the vertical mechanical behavior of shale surfaces. The schematic diagram of the principle is shown in Figure 2. This choice allowed us to delve deeper into the intricacies of surface topography and ascertain the magnitude of adhesion forces. AFM measurements were performed on each polished sample using a tapping mode with a probe attached to the cantilever of the AFM instrument (Bruker, Billerica, MA, USA, model Multimode8). The cantilever probe had an elastic constant (k) of 0.350 N/m, a resonance frequency (f0) of 65 kHz, and a tip radius of 30 nm. All measurements were carried out in ambient air at room temperature (296.15 K) and atmospheric pressure (1 atm). A typical scan rate of 1 Hz was employed during the recording process, utilizing a scan head with a maximum range of 100 μm × 100 μm. The setpoint height was set to 200 nm, and the surface topography information was acquired using the PeakForce Quantitative Nanomechanical (QNM) mode. The scanning area for the experiment was set at 20 μm × 20 μm. Following the characterization of surface topography, chemically modified hydrophobic/hydrophilic probes were employed to perform surface mechanical measurements in force–indentation mode, enabling the determination of adhesion forces’ magnitude.
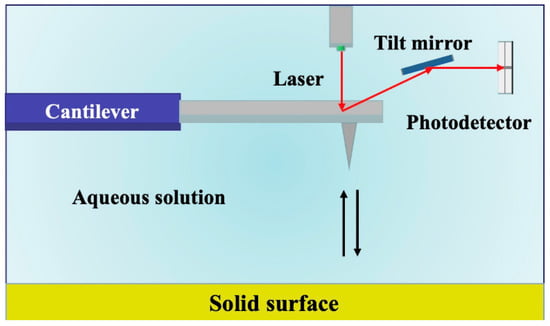
Figure 2.
Schematic diagram of the atomic force microscope.
2.4.1. AFM Probes
The analysis of adhesion forces and surface morphology imaging of the sliced shale samples was conducted using gold–coated cantilevers obtained from Bruker (USA) with a nominal spring constant of 0.350 N/m. These probes were subjected to surface modifications with different chemical moieties prior to usage, enabling the measurement of mechanical interactions at the sample–water interface. Silicon nitride probes were divided into two categories, representing crude oil components and aqueous solutions, respectively. (1) For the hydrophobic modification, the surface was treated with dodecanethiol. The gold–thiol bonds formed between the thiol groups and the gold–coated probes resulted in the self–assembly of a monolayer attached to the AFM tip. (2) To achieve hydrophilicity and represent water–solid interface interactions, the AFM probe surface was modified with hydroxyl groups. Before each experiment, the probes were thoroughly rinsed with ethanol to remove any physically adsorbed substances, followed by drying with nitrogen gas to prevent any potential impact on the experimental data due to adsorbed substances.
2.4.2. AFM Surface Roughness Measurement
Roughness plays a crucial role in describing the surface morphology state. To further quantify the variations in surface morphology and understand the changes in wetting behavior under different roughness conditions, several parameters were extracted from the AFM images. Among them, Ra represents the average roughness, which is calculated as the arithmetic mean of the absolute height deviations, and Rq represents the root mean square roughness, which is calculated as the root mean square of the height deviations [44,49,53,54,55]. When analyzing the roughness of the samples, it is essential to consider a few representative parameters. In this study, we selected Ra as a measure of the average roughness and Rq as an indicator of the root mean square roughness. Ra provides valuable insights into the average roughness of the sample surface and is determined using the following Formula (2) [44]:
The root mean square roughness (Rq), which characterizes the degree of surface roughness variation, is calculated using the following Formula (3):
where:
Nx and Ny represent the number of points along the x–axis and y–axis.
2.4.3. AFM Adhesion Measurement
To further elucidate the oil–wet/water–wet characteristics of shale samples, we employed functionalized probes to investigate the intermolecular forces at the probe–rock interface. The measured forces, representing either repulsion or attraction, were analyzed as positive or negative values, respectively. All force–distance curves contributing to the adhesive force map underwent a standardized data processing procedure. Initially, a baseline correction was applied to eliminate any unrelated vertical displacement between the probe tip and the surface, thereby isolating the relevant interaction. The contact point was then identified and set as the reference position. Subsequently, the height signal corresponding to the cantilever deflection was meticulously calibrated to accurately determine the vertical position of the tip. These meticulous steps ensured precise quantification of the adhesive forces. Under distilled water conditions, the adhesive interactions between the modified probes and the shale surface were captured through force–distance curves during the retraction process. To capture the heterogeneity of the shale sample observed under an optical microscope, five representative points were selected from each of the two distinct areas. These selected areas fell within the range of contact angle droplets and were subjected to water/oil adhesion force measurements.
2.5. Other Tests
We conducted a series of conventional tests to characterize the physical properties of the shale surface, including scanning electron microscopy (SEM). By performing secondary electron scans using SEM, we obtained images that revealed the rock features on the sample surface. These SEM images served as a supplementary tool for analyzing surface roughness and adhesion characteristics. Within the designated areas of the marked regions, the sample characteristics were precisely scanned under the fields of view of 10 μm and 5 μm. This detailed scanning enabled the subsequent classification and analysis of the sample features, including the identification of organic matter deposition areas and the understanding of the influence of mineral types on surface roughness.
3. Results
3.1. Contact Angle Measurements on Shale Sample Surfaces
The samples selected for contact angle measurements demonstrated a hydrophobic nature. In the case of JA, the contact angles ranged from 117.1° to 133°, with an average of 124.5° (Table 2). For JB, the contact angles ranged from 112.3° to 131.1°, with an average of 121.5°. These results indicate that JB well exhibited relatively weaker hydrophobicity compared to JA. It is worth noting that the contact angle measurements revealed variations in wettability among different points on the same sample. Previous studies have indicated that the contact angle is influenced by the distribution of mixed wetting within the contact area [6,7,56]. This phenomenon leads to local variations in wetting behavior and challenges the accuracy of wettability descriptions. The macroscopic assessment of wetting properties may overlook the presence of numerous oil droplets adhering to the surface. Therefore, a comprehensive understanding of the wettability characteristics requires a combined analysis of both macroscopic and microscopic aspects, taking into account the intricate wetting distribution at different length scales.

Table 2.
The results of contact angle measurements.
3.2. Shale Sample Roughness
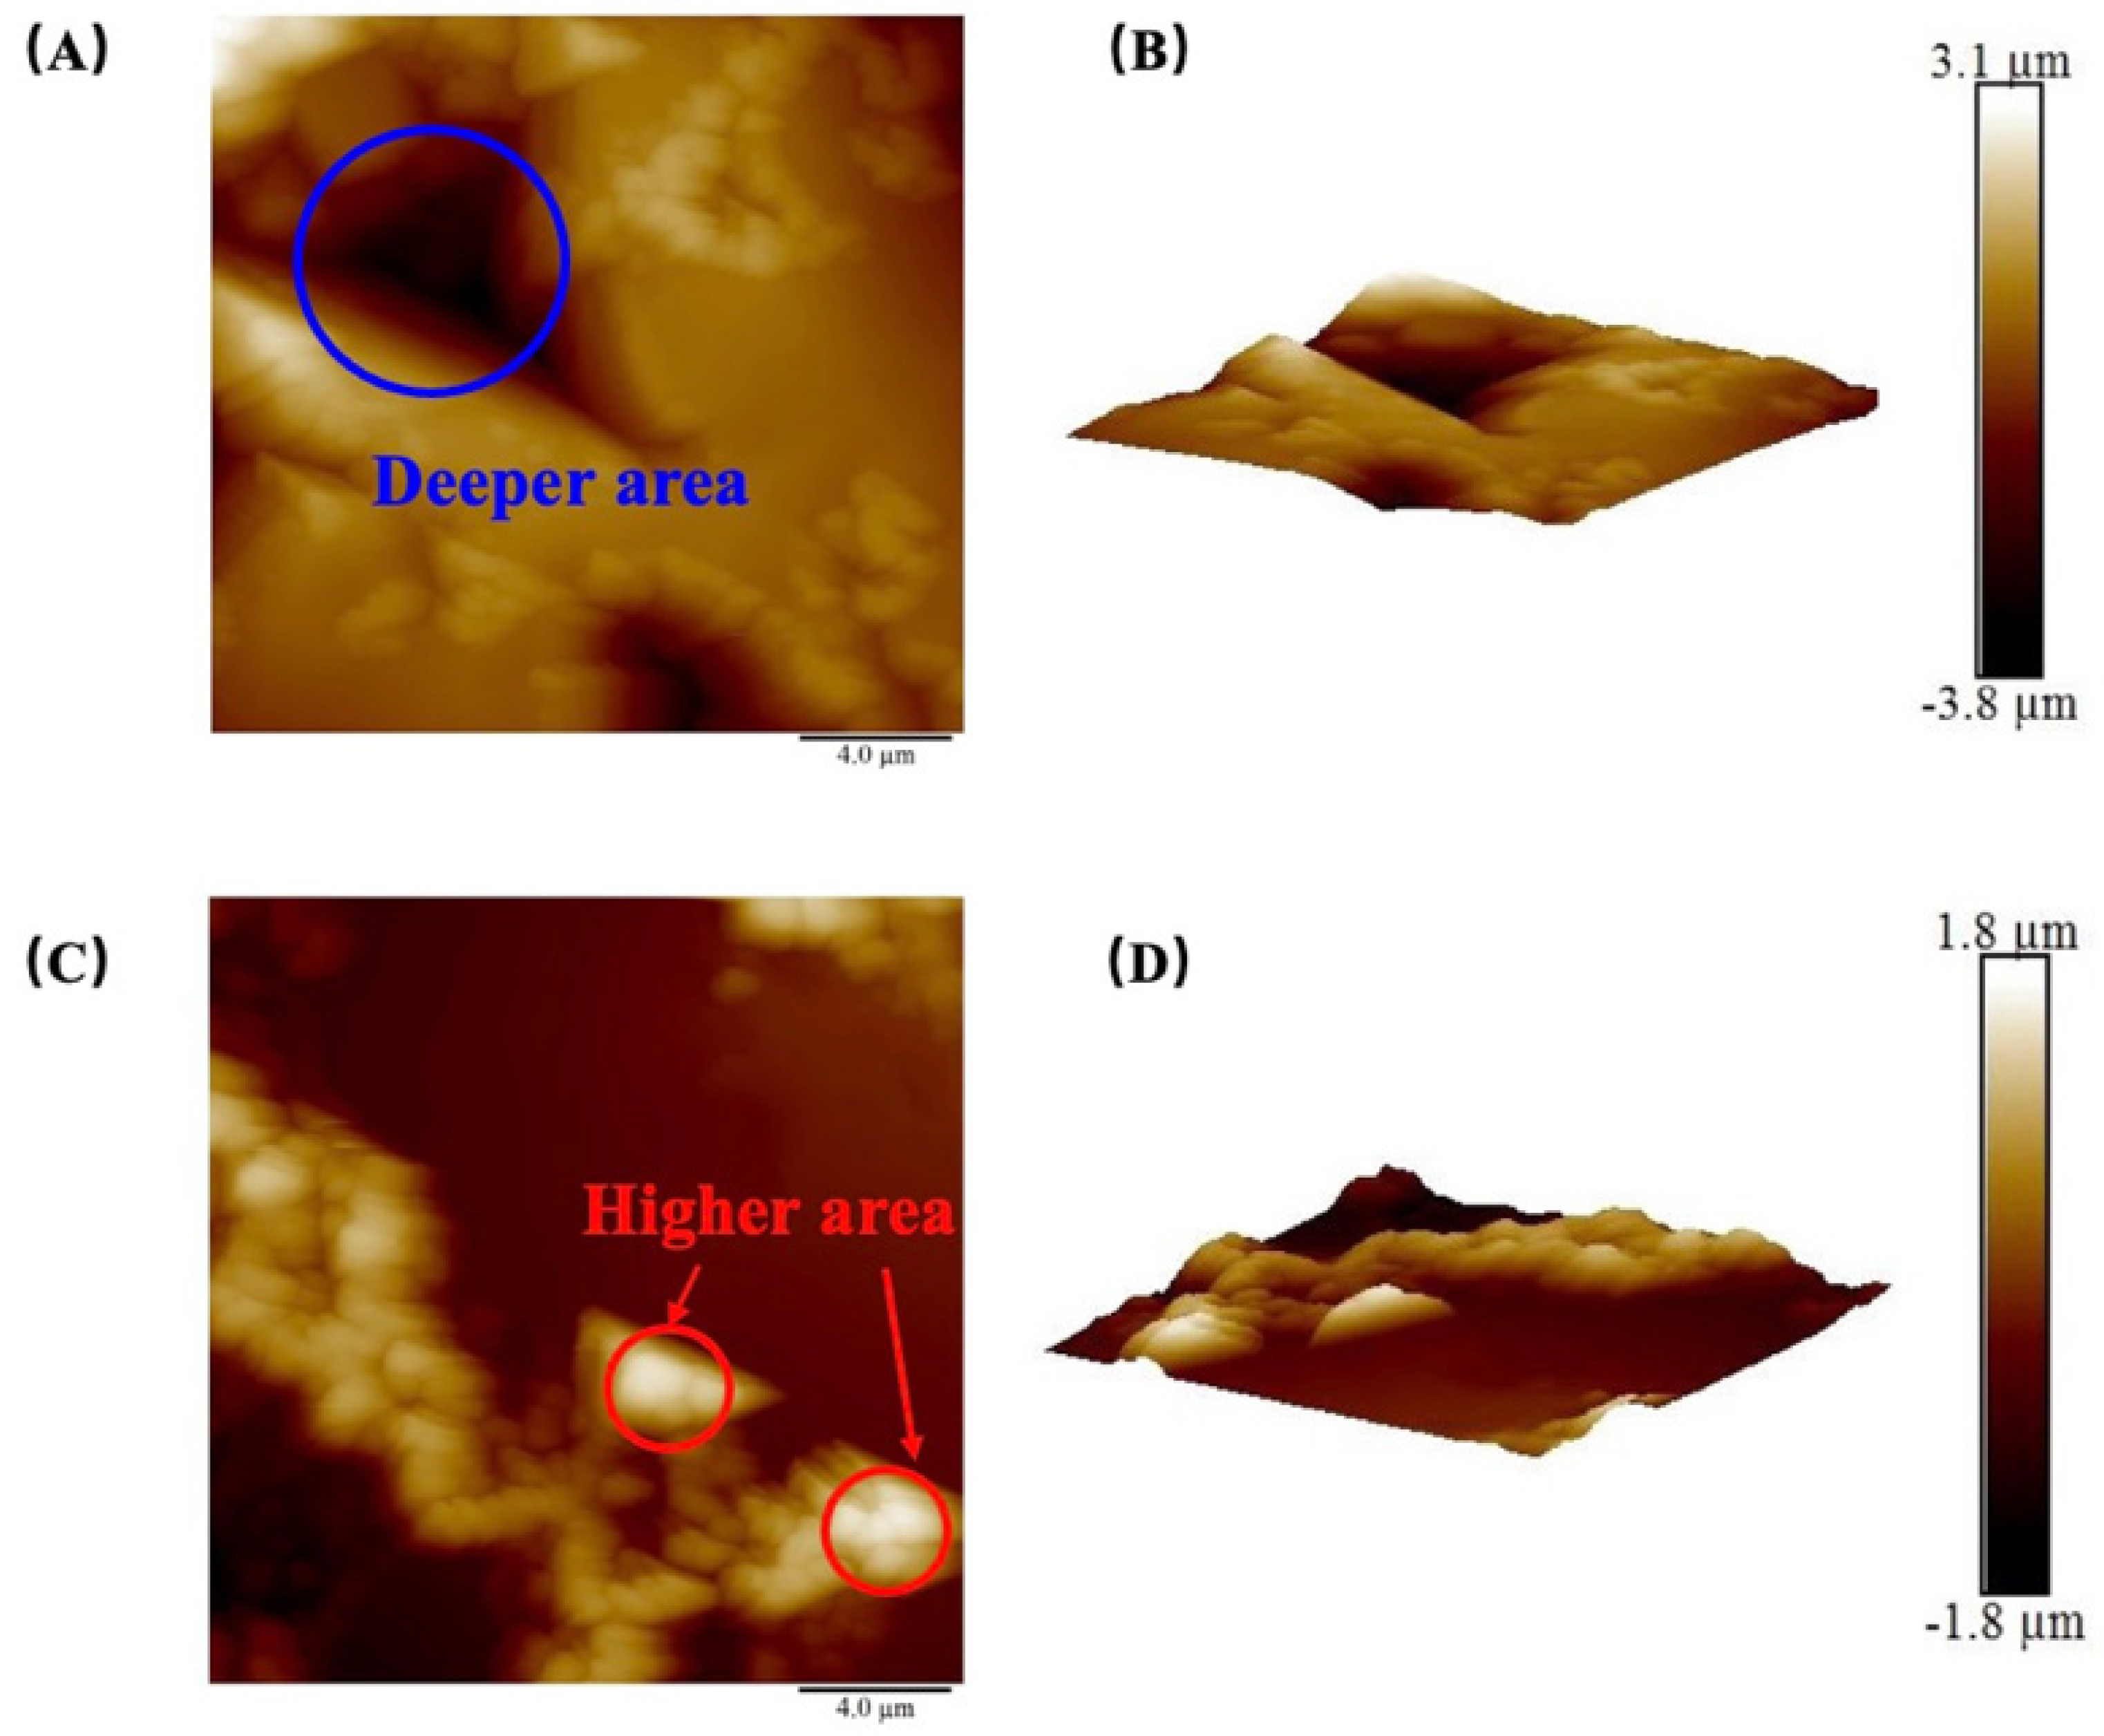
The surface morphology of the samples was characterized using AFM, and the 2D and 3D surface profiles of the shale are illustrated in Figure 3. In the 2D profile, the color depth serves to represent variations in height. Relevant characteristics can also be observed in the 3D topography image. The roughness data, obtained from the deflection of the probe, are summarized in Table 3. For the JA sample, the Ra values ranged from 396 nm to 692 nm, with an average of 535.6 nm. Regarding the JB sample, the Ra values ranged from 45.8 nm to 436 nm, with an average of 207.1 nm. These findings indicate that the JA surface exhibited a rougher texture compared to JB. In terms of Rq values, the JA sample showed a range from 477 nm to 698 nm, with an average of 617.2 nm. On the other hand, the Rq values for JB ranged from 80.7 nm to 539 nm, with an average of 272.8 nm. These results suggest that the surface roughness of the JA sample demonstrated greater variability in comparison to JB. It is noteworthy that the Rq values surpassed the Ra values, indicating that Rq is more sensitive to height variations, which aligns with previous research [57].
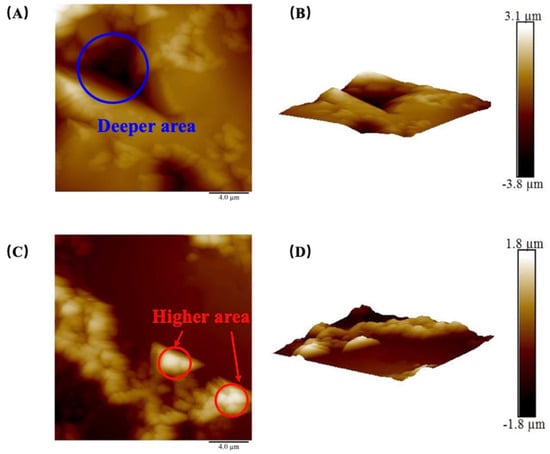
Figure 3.
(A) Two–dimensional surface morphology image and (B) 3D surface morphology image of sample JA–3; (C) 2D surface morphology image and (D) 3D surface morphology image of sample JB–1.

Table 3.
The surface roughness of the sample.
It should be noted that there was a significant variation in the average roughness and root–mean–square roughness among the four JB samples, despite using the same rock polishing method (the results are shown in Table 3). This discrepancy can be attributed to the impact of micro–scale pore and crack distributions on the AFM probe tip, which had a radius of approximately 20 nm. The selected areas of the samples in this study primarily exhibited roughness influenced by pores with radii ranging from 10 to 1000 nm. In Figure 3A, the DA corresponds to smaller height values, indicating the presence of well–developed micro–pores. The utilization of a smaller radius probe enables a more detailed characterization of the influence of heterogeneity on roughness.
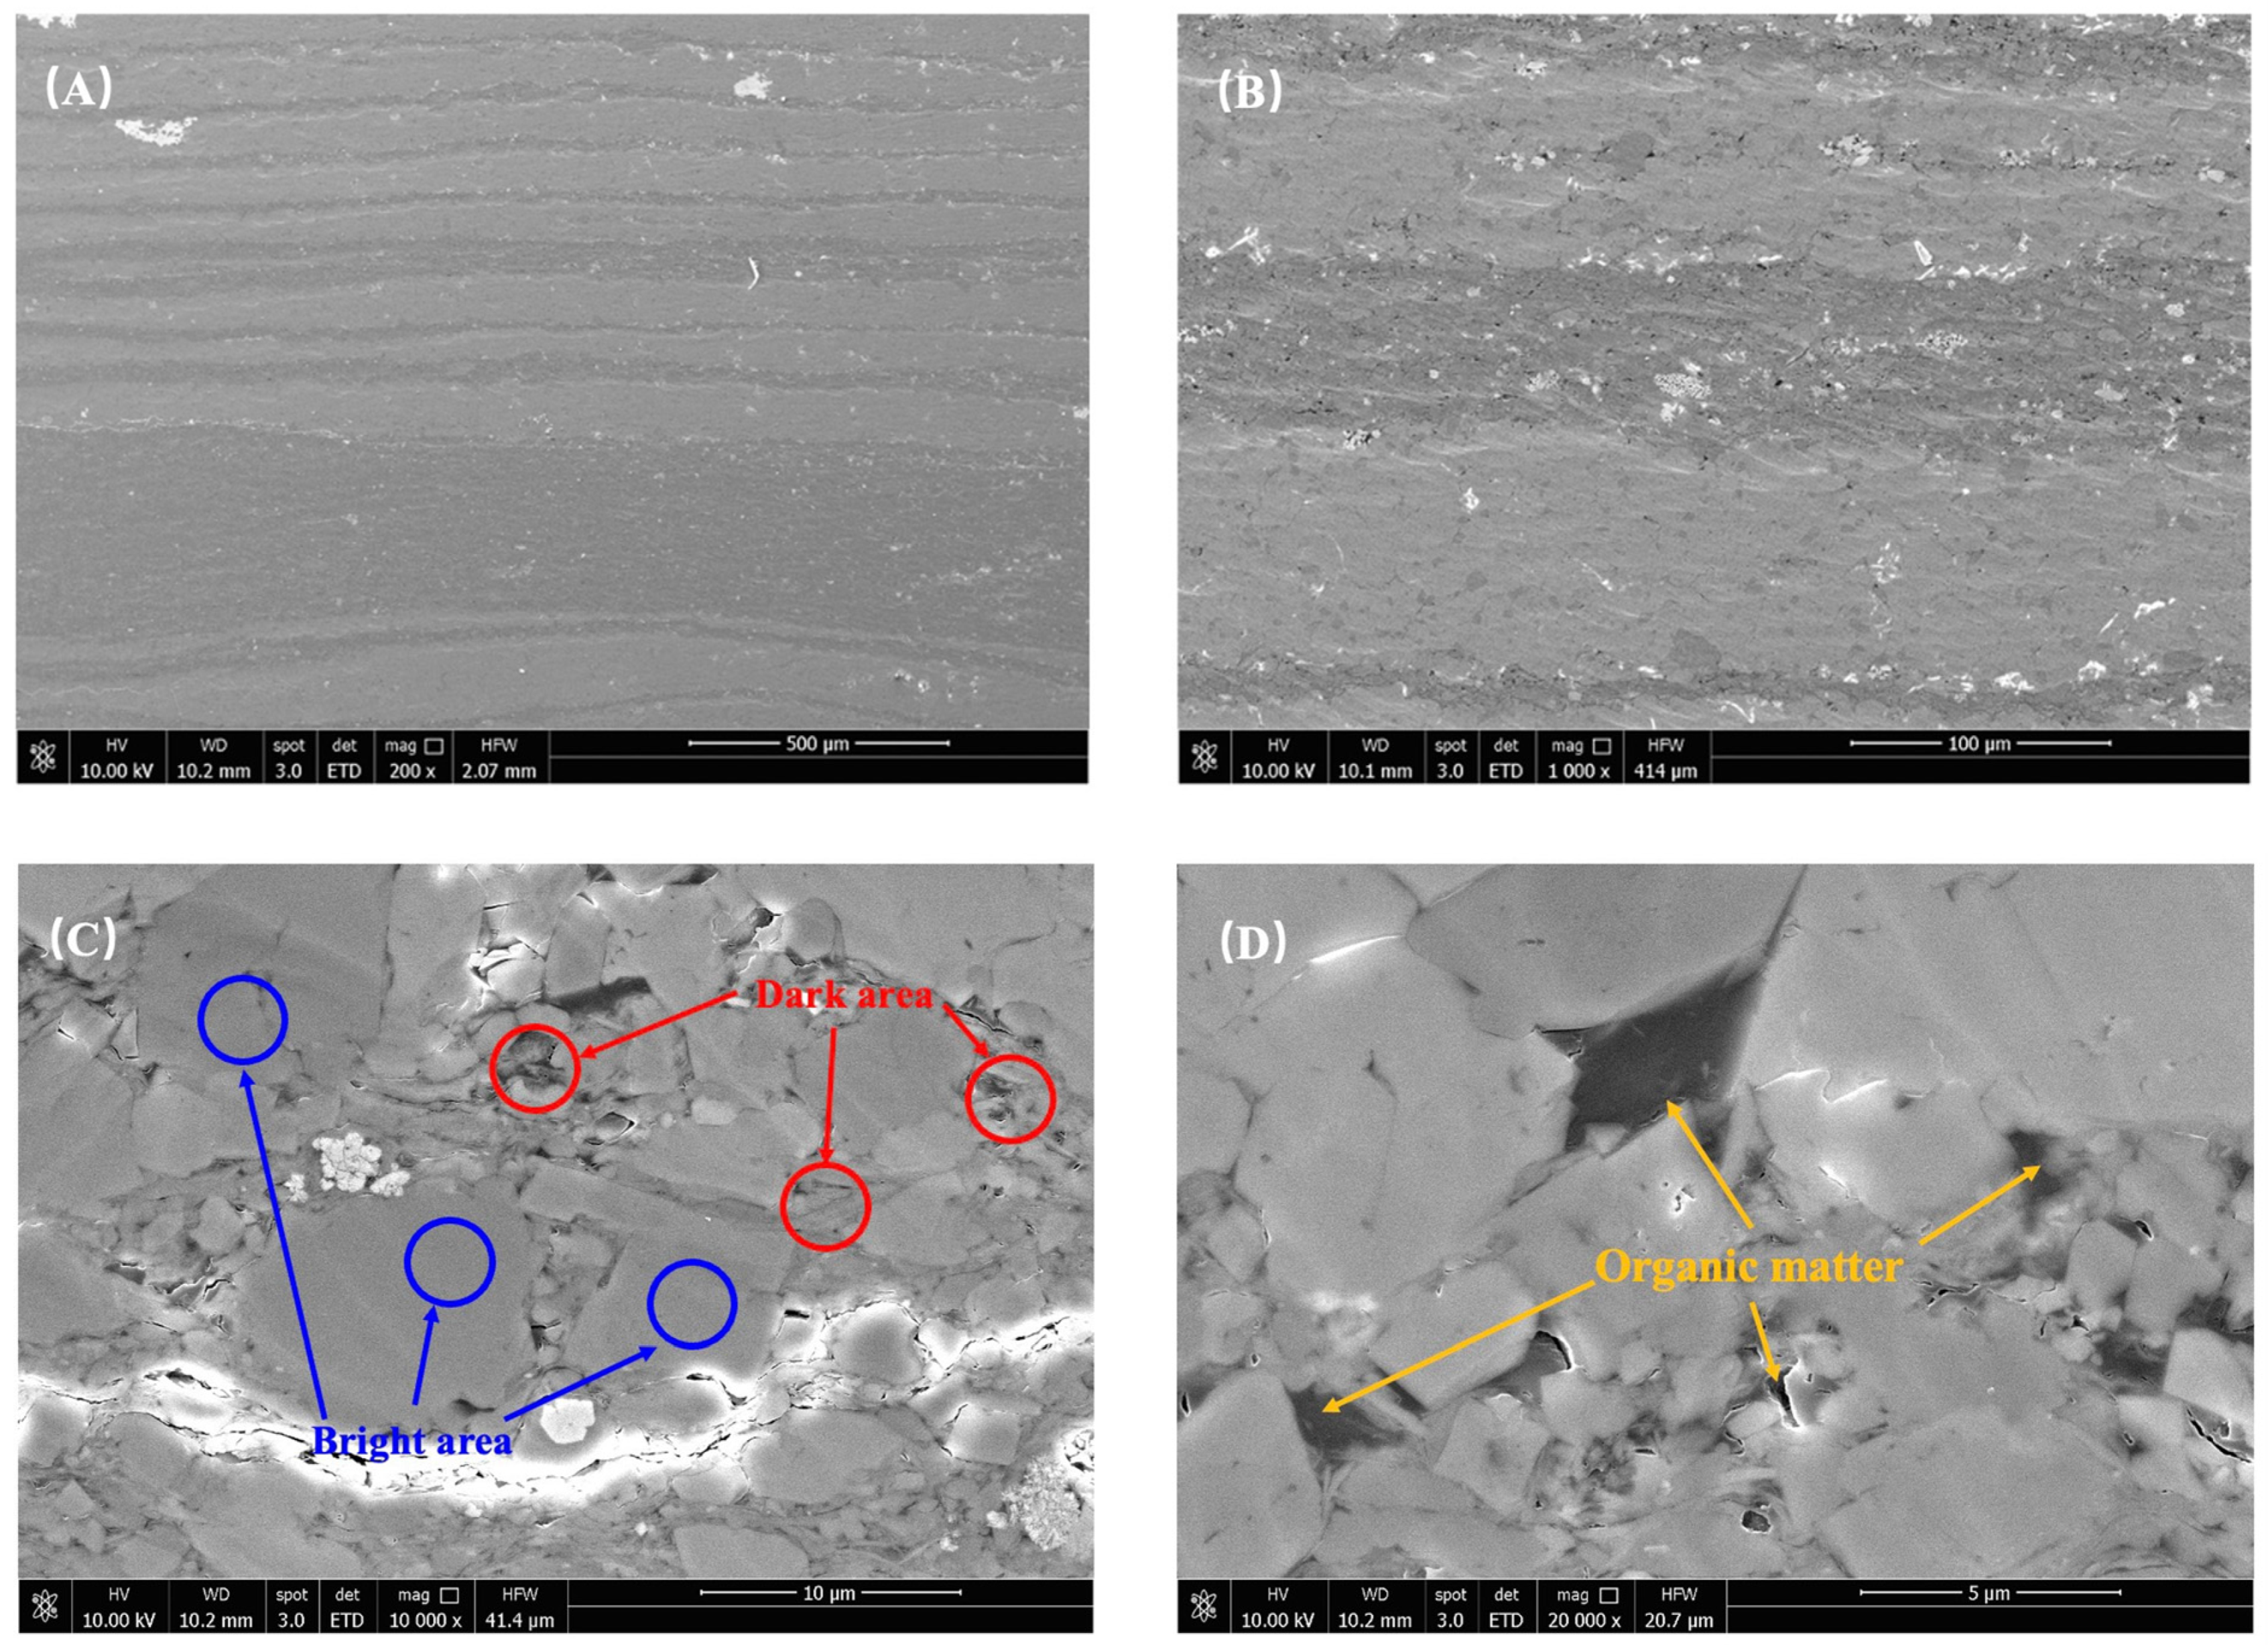
Furthermore, the variations in sample roughness can be attributed to the influence of organic and inorganic content. The experimental samples underwent additional analysis using scanning electron microscopy (SEM), as depicted in Figure 4. Taking sample JA–2 as an example, it was clearly observed that the interior of the dark area (DA) exhibited a more intricate and uneven roughness profile. These areas posed significant obstacles during the scanning process, resulting in higher overall roughness measurements. Notably, the DA emerged as the primary factor contributing to the increased roughness. Moreover, when examining the images at a smaller scale, it was evident that organic matter predominantly occupied the DA, with minimal presence in the bright area (BA). This phenomenon can be attributed to the deposition process of reservoir formation, where organic matter becomes bonded with fine minerals like clay and quartz, effectively filling the intergranular pores between larger mineral particles, such as plagioclase. This process establishes a favorable foundation for shale reservoir formation, contributing to pore development and storage capacity. Additionally, it facilitates the preservation and accumulation of organic matter. Consequently, under the combined influence of these factors, organic matter tends to be concentrated within the interior of the DA. The negative correlation observed between plagioclase feldspar (predominantly found in BA) and total organic carbon (TOC) can be attributed to the effective reduction of organic matter growth space by the development of plagioclase feldspar.
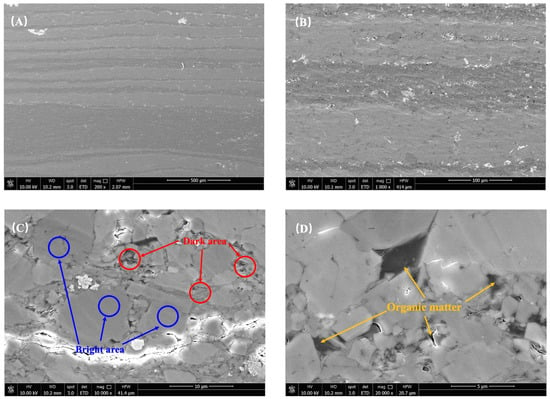
Figure 4.
The sample surface morphology is illustrated by (A,B), the distribution of dark and bright areas as shown in (C), while (D) highlights the occurrence of organic matter.
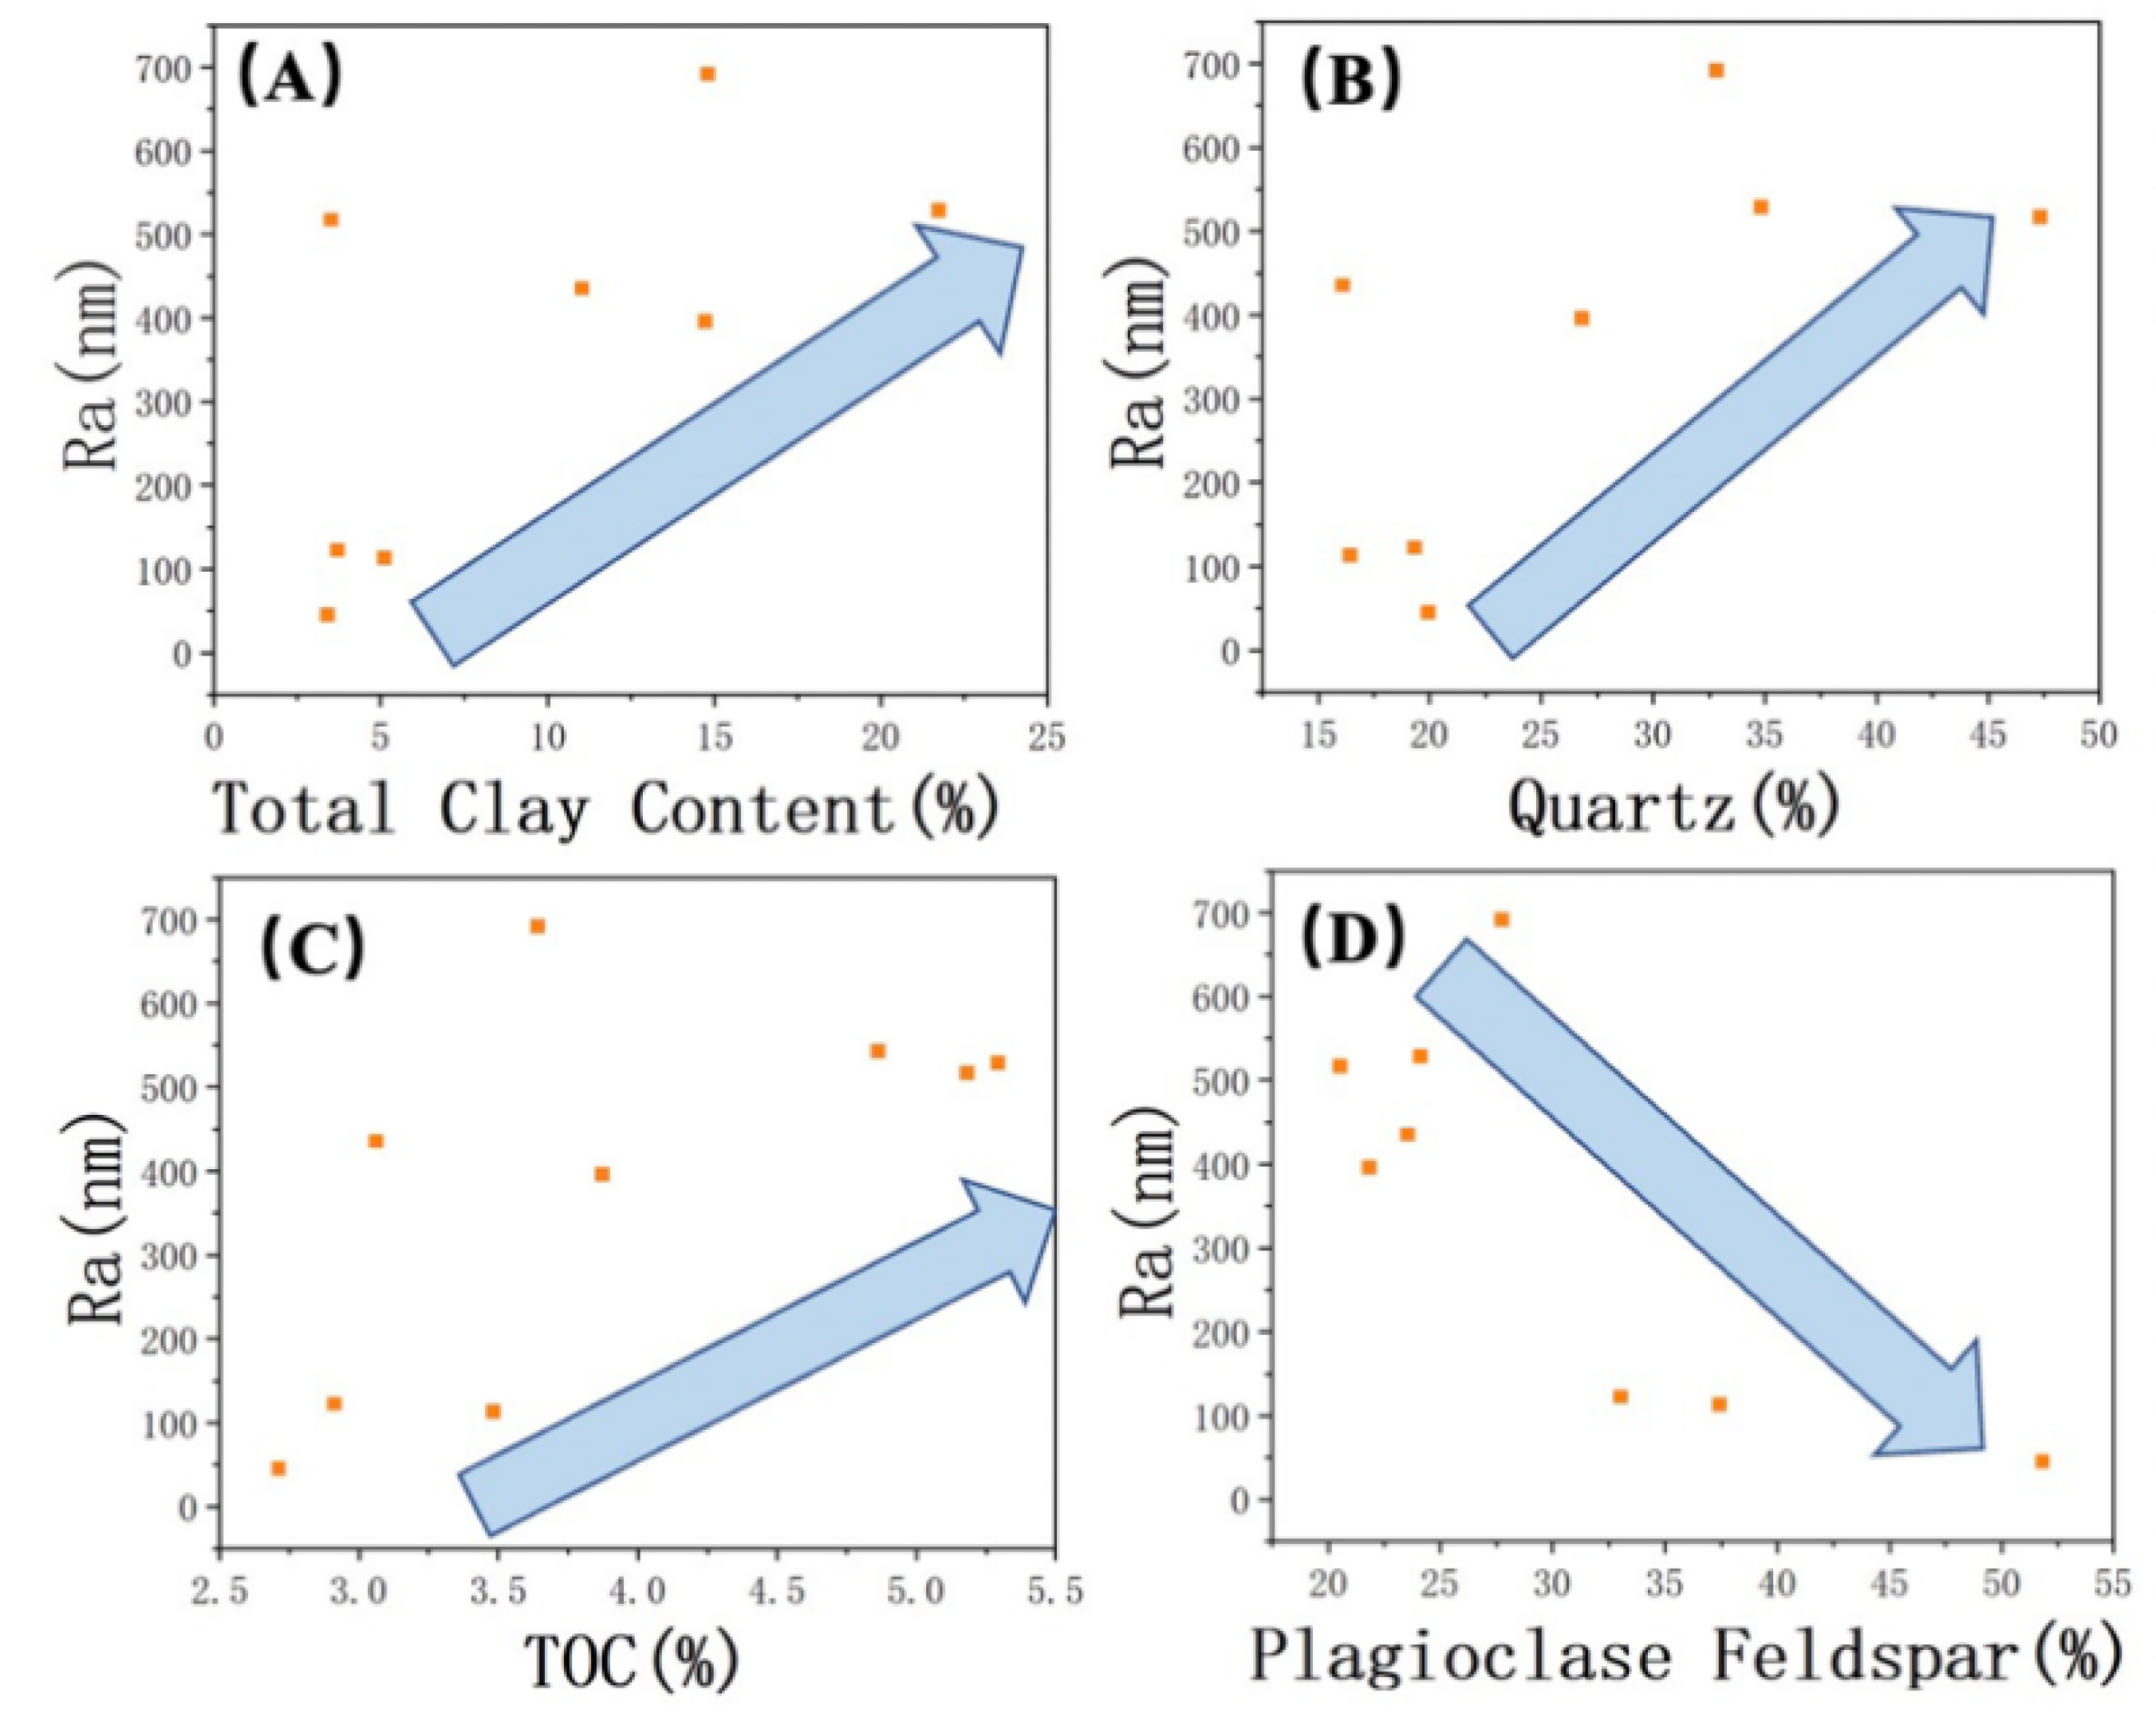
A detailed analysis was conducted to examine the relationships between inorganic and organic content and roughness. The results revealed a positive correlation between the content of minerals such as quartz, clay, and organic matter and surface roughness (from Figure 5A–C). On the other hand, a negative correlation was observed between the presence of plagioclase feldspar and roughness (Figure 5D). By combining the findings from scanning electron microscopy (SEM) studies, the relationship between the mineral composition of the Lucaogou Formation and different characteristic regions was elucidated. The BA in the SEM images correspond to plagioclase feldspar grains that are relatively larger and possess a smoother surface. While quartz grains may also exhibit larger grain sizes, the presence of numerous small surface pores can result in variations in surface roughness. Additionally, the inclusion of clay minerals and the occurrence of authigenic quartz with smaller grain sizes contribute to the formation of DA in association with clay minerals and organic matter (Figure 6).
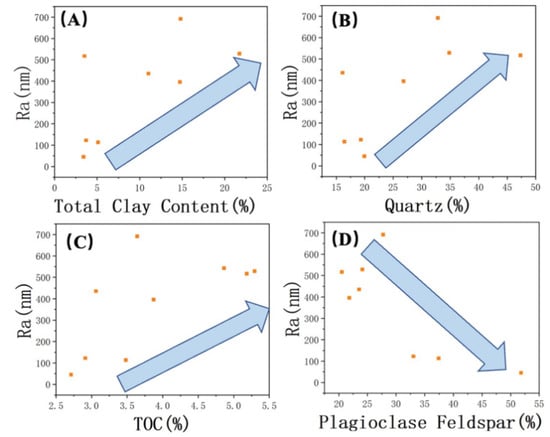
Figure 5.
Correlation of Ra with (A) total clay content, (B) quartz, (C) TOC, and (D) plagioclase. The arrows indicate trends.

Figure 6.
Correlation of TOC with (A) total clay content, (B) quartz, and (C) plagioclase. The arrows indicate trends.
We employed comprehensive methods, including low–temperature nitrogen adsorption and high–pressure mercury intrusion, to assess the size and distribution of pores and throats within the shale samples. The findings revealed that potassium feldspar and calcite are associated with larger pore throats, while dolomite and plagioclase exhibit medium–sized pore throats. Additionally, clay minerals and quartz, which contain micro– and nanopores, demonstrate a positive correlation with surface roughness. It is worth noting that, despite the development of larger–sized pore throats in plagioclase feldspar, the overall volume of these pore throats is considerably smaller compared to the volume of the mineral itself. As a result, plagioclase feldspar tends to possess a relatively smoother surface. Moreover, the presence of plagioclase feldspar in BA effectively inhibits the formation of DA, as shown in Figure 7. Furthermore, under the scanning electron microscope, it is evident that clay minerals with smaller particle sizes and quartz with higher roughness exhibit more irregular surface features during the agglomeration process (Figure 4C). The presence of associated organic matter, with its plasticity properties, can exacerbate this effect (Figure 4D). These conditions provide the prerequisites for the formation of higher surface roughness. (The correlation between roughness and the content of potassium feldspar, calcite, and dolomite was not evident due to the limited number of samples. Further research is conducted in the next phase to investigate this relationship in more detail.)
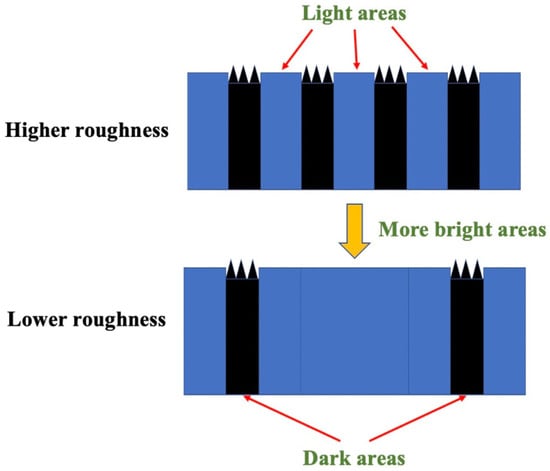
Figure 7.
Influence of the development of bright areas on roughness.
3.3. Adhesion Force of Shale Surface
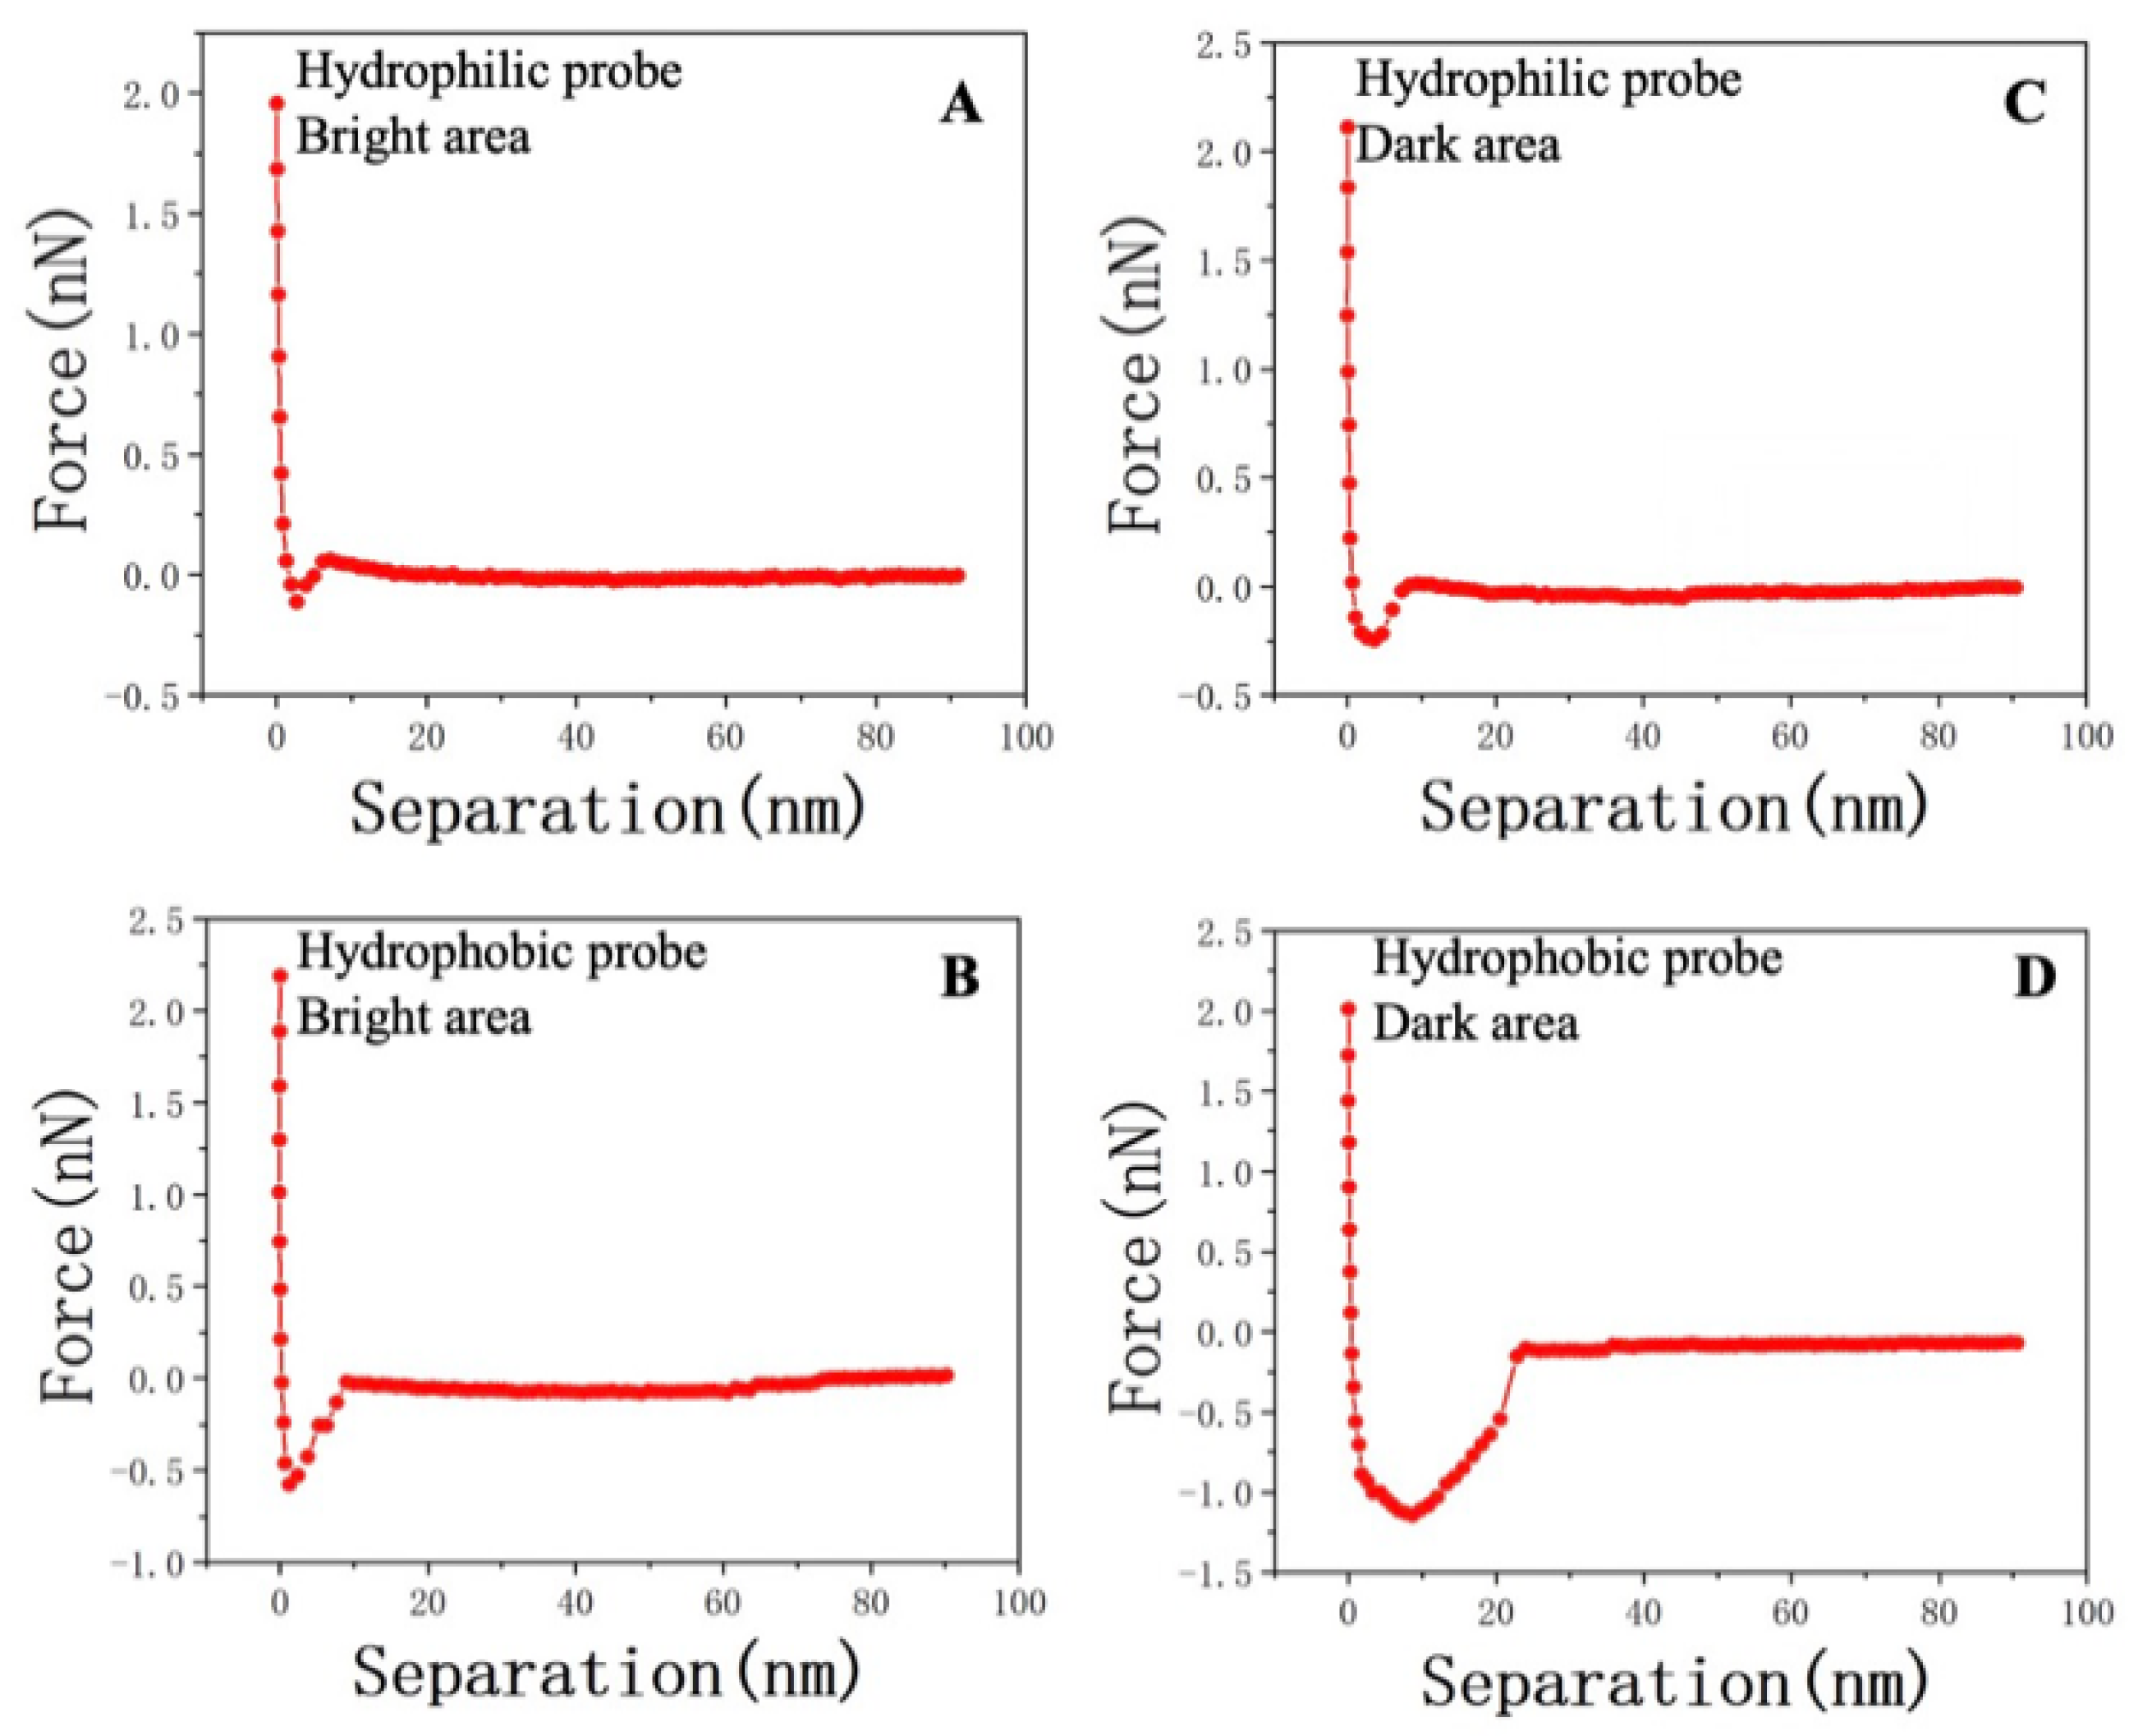
Figure 8 presents the mechanical variations in the probe–sample system within different characteristic areas. Figure 8A illustrates the interaction between the hydroxyl–functionalized probe and the surface in a distilled water environment. The retraction process occurred at around 2.0 nN, and as the cantilever further deformed, the interaction transitioned gradually from repulsion to attraction. The lowest point of the Y axis is the maximum adhesion. Comparing it with Figure 4D, it is evident that hydrophobic interactions dominated at the same position, as observed in Figure 8C,D. In a horizontal comparison, for probes with the same properties, the DA consistently exhibited stronger oil–wet or water–wet interactions, as deduced from the comparison between Figure 8A and Figure 8D.
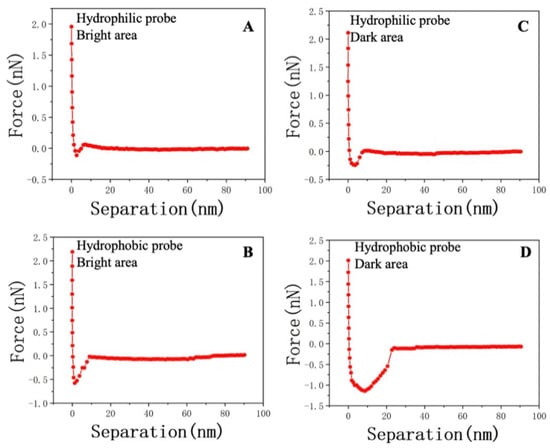
Figure 8.
(A) Adhesion force due to the hydrophilic interaction at point 2 in the BA of sample JA–2. (B) Adhesion force due to the hydrophobic interaction at point 2 in the BA of sample JA–2. (C) Adhesion force due to the hydrophilic interaction at point 1 in the DA of sample JA–2. (D) Adhesion force due to the hydrophobic interaction at point 1 in the DA of sample JA–2.
In order to further elucidate the adhesion characteristics of other locations within JA–2, an analysis was conducted on the adhesion forces, as presented in Table 4. The water adhesion forces of the five distinct positions predominantly originated from the BA, ranging from 0.25 to 0.31 nN, with an average of 0.3 nN. Conversely, the DA exhibited water adhesion forces ranging from 0.11 to 0.16 nN, with an average of 0.12 nN. Notably, a pronounced disparity was observed, indicating that the water adhesion forces in the DA were notably higher than those in the BA. Moreover, employing functionalized probes enabled the characterization of the force–distance curves of the oil–adhesive probes within the BA and DA, at the same selected points. The results mirrored the trend observed for hydrophilic probes, with the oil adhesion forces being comparatively lower in the BA when contrasted with the DA.

Table 4.
Hydrophobic/hydrophilic adhesion force magnitudes at different positions of sample JA–2.
It is worth noting that scanning electron microscopy (SEM) imaging revealed a higher accumulation of organic matter within the rough areas. The presence of organic matter in these DA indicates a greater degree of modification. By comparing the differences in the magnitudes of two distinct forces at various locations, it can be inferred that the areas enriched with organic matter exhibited a higher hydrophobic effect compared to hydrophilicity. Consequently, the existence of this DA contributed significantly to the overall hydrophobic characteristics of the sample, thereby enhancing its oil–wetting properties.
The same phenomenon was observed in other samples (with a measurement process similar to that of sample JA–2), as shown in Table 5 (all data in the table are average values).

Table 5.
The difference in adhesion force between oil and water.
4. Discussion
4.1. The Influence of Surface Roughness on Contact Angle
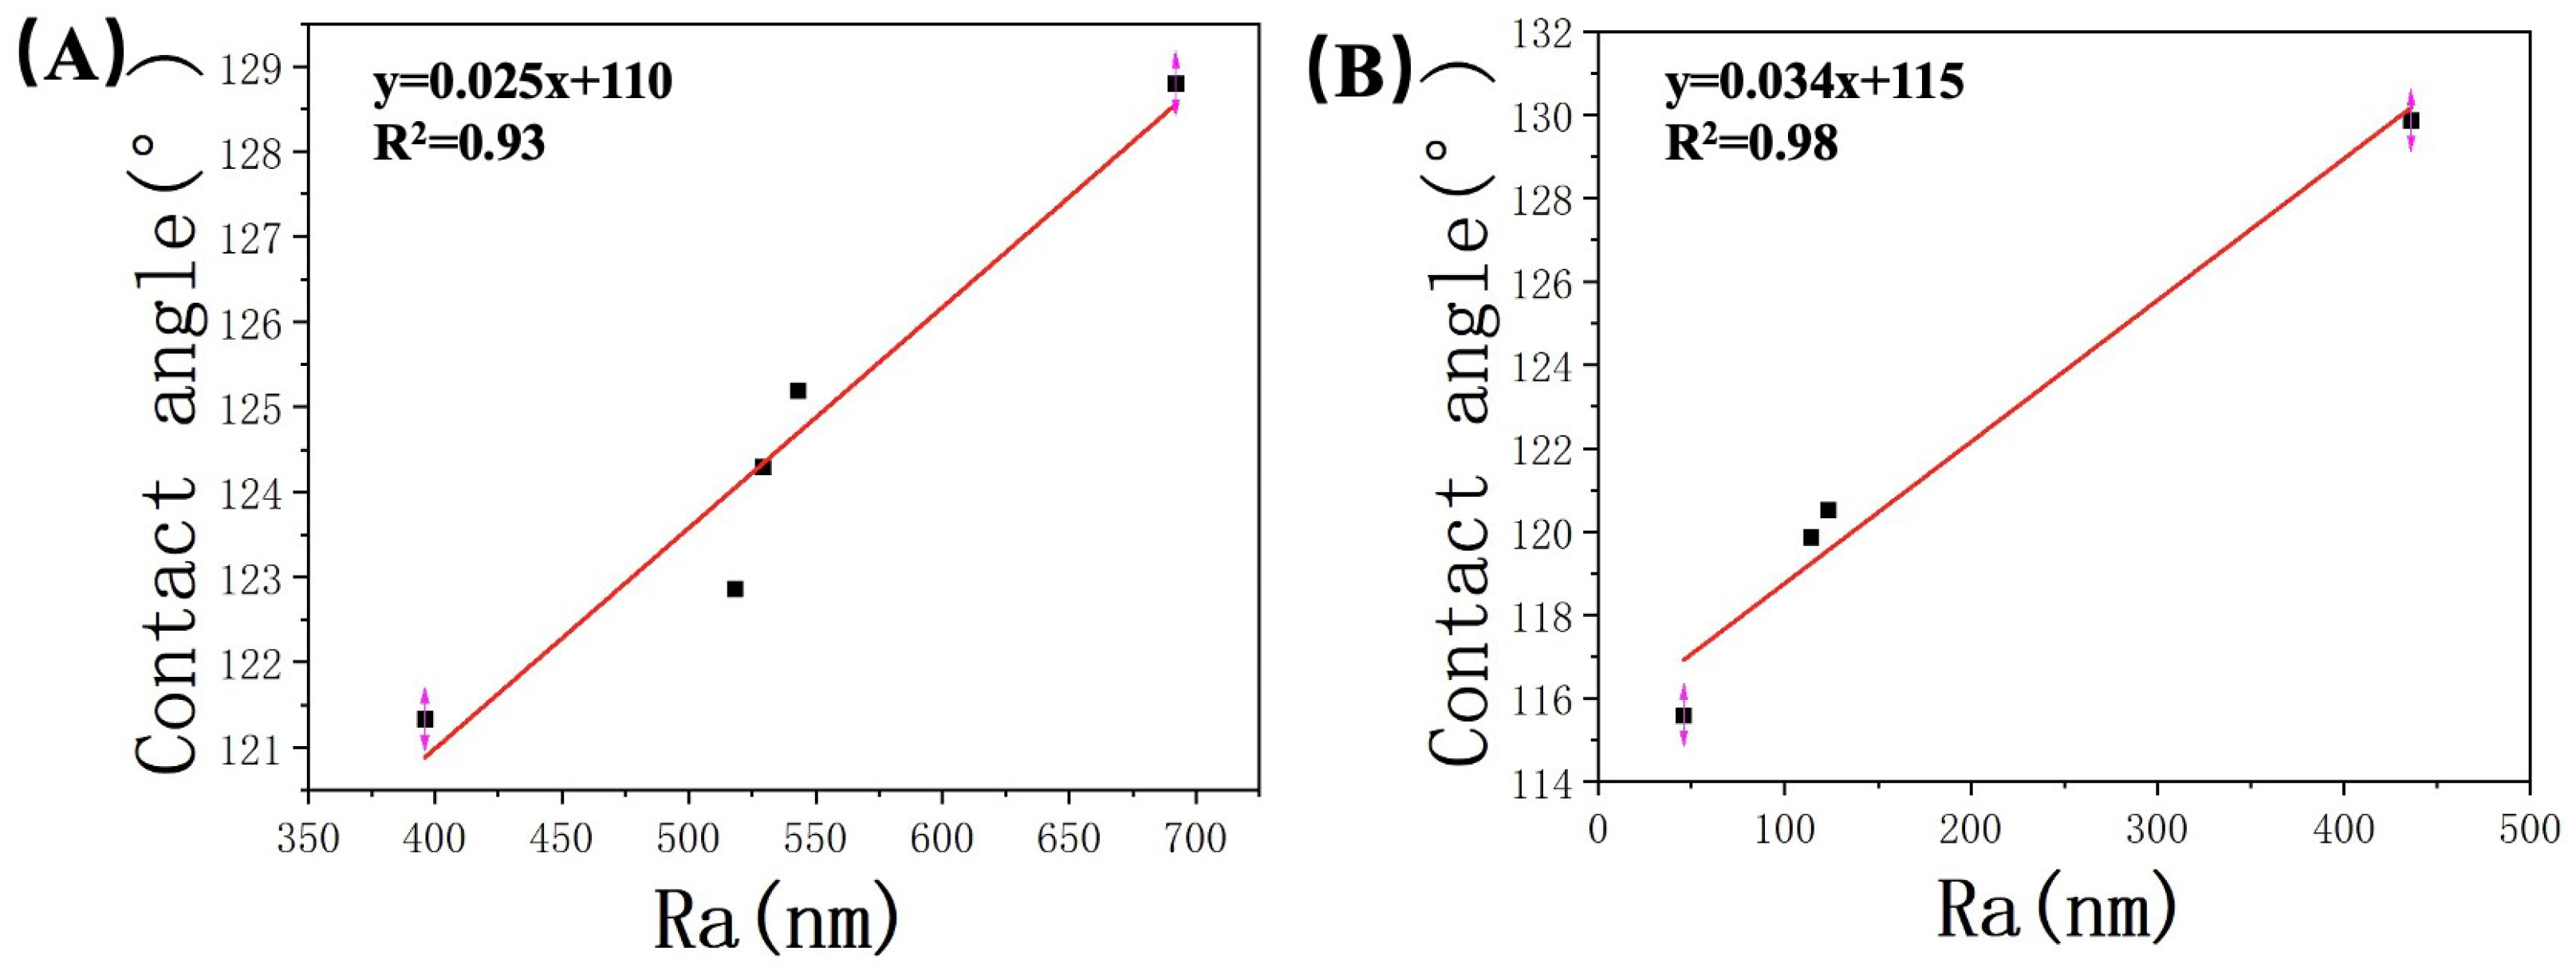
In this study, we conducted a comprehensive analysis of the relationship between contact angle and average roughness based on the data presented in Table 2 and Table 3. The results are graphically depicted in Figure 9, providing valuable insights into the observed trends. Our analysis revealed a clear and consistent linear increase in the contact angle as the average roughness of the samples increased. The correlation coefficients (R2) obtained were 0.93 and 0.97 for the two experiments, indicating a strong positive relationship between these two variables. This observation suggests that surface roughness plays a crucial role in determining the contact angle. Observed phenomenon can be attributed to the differences in the effective contact area caused by surface roughness. As the roughness of the surface increased, it created variations in the actual contact area between the sample and the liquid phase. Consequently, this disparity in contact area influenced the wetting behavior of the liquid on the surface, resulting in larger contact angles. Moreover, the presence of surface irregularities induced by increased roughness led to a higher proportion of the surface being occupied by air, which further reduced the wetting ability of the liquid and contributed to the observed increase in contact angle.
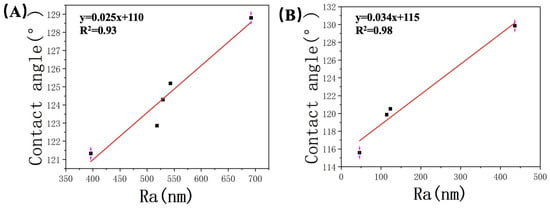
Figure 9.
Relationship between the roughness of (A) JA, (B) JB, and the contact angle.
Young’s equation has been widely used to evaluate wetting behavior and describes the wetting properties of materials based on interfacial tension. However, its applicability is limited to ideal flat surfaces that are uniform and smooth (as illustrated in Figure 1). Recognizing the influence of surface roughness, Wenzel introduced the concept of relative roughness to modify Young’s equation, aiming to represent the wetting behavior of natural samples [57,58]. In the Wenzel model, the liquid droplet fully penetrates and fills the surface asperities and pores. However, the Wenzel model is suitable for contact angles less than 90° and does not adequately describe the behavior of “liquids standing on the surface of a sample”. Therefore, it is necessary to use the Cassie model to discuss and analyze issues with contact angles greater than 90° [59]. In the Cassie model, the hydrophobic surface causes the liquid to be repelled, resulting in air being trapped between the liquid and solid interface. This phenomenon obstructs the contact between the liquid and the surface being measured, leading to measurement errors. The Cassie model can be described by the following equation:
In the equation, represents the apparent contact angle of the composite surface; represent the area ratios occupied by the gas and liquid phases on the solid surface (where ); represent the intrinsic contact angles at the solid–liquid and gas–liquid interfaces, respectively.
It is important to note that both the Wenzel and Cassie models have their respective limitations and assumptions. The Wenzel model assumes complete wetting and uniform surface roughness, while the Cassie model assumes air trapping and non–wetting behavior. Real–world surfaces often exhibit complex characteristics, including a combination of roughness, heterogeneity, and surface chemistry, which may require more sophisticated models or experimental approaches to accurately describe their wetting behavior.
Based on previous research, it has been established that increased surface roughness on hydrophobic surfaces exacerbates their hydrophobicity. This finding is consistent with the experimental results of our study, where the contact angles of samples from two different shale areas showed a positive correlation with roughness. When comparing JB with JA, the latter exhibited much higher roughness with its uneven surface, providing more favorable conditions for gas entrapment and fewer sites available for water molecules to reside. This further hinders the contact between the liquid and solid surface, enhancing the hydrophobic behavior. As a result, an increase in observed contact angles with increasing roughness can be expected.
4.2. The Effect of Mineral Content and Organic Matter on Contact Angle
By comparing the average contact angles, it was observed that JA exhibited stronger oil–wetting behavior compared to JB. To infer the mineralogical control on wetting properties, an assessment of the surface mineralogy of the studied samples was conducted. In our analysis of typical minerals found in the Xinjiang region, we found that the content of quartz and clay minerals exhibited a positive correlation with oil–wettability, while the presence of plagioclase feldspar exhibited an inverse relationship (Figure 10). Indeed, this observation aligns with the discussion in Section 3.2 regarding the relationship between different minerals and surface roughness. The observed trend can be attributed to changes in surface roughness, thus confirming the influence of surface roughness on contact angle. The rougher surface texture of minerals like quartz and clay minerals effectively hinders the contact between water droplets and the rock surface. This results in the hydrophobic parts of the surface being unable to make complete contact with the water droplets, enhancing the expression of hydrophobicity and promoting a higher contact angle. On the other hand, plagioclase feldspar, as a representative mineral with a smoother surface, does not impede the instant contact between the liquid and solid phases.

Figure 10.
Relationship between contact angle and (A) quartz, (B) total clay content, and (C) plagioclase feldspar. The arrows indicate trends.
Based on the above research, we also observed that the wettability of the samples is influenced by the degree of mineral modification by the crude oil. Although, previous researchers [20] classified clay minerals in the Lucaogou Formation samples as hydrophilic minerals. However, it is important not to overlook the interrelationship between clay minerals and organic matter, as they are commonly co–developed within shale formations (as shown in Figure 6A). These two components can have a significant influence on each other.
The wetting behavior of clay is predominantly controlled by residual organic matter, and the process of mineral modification by organic matter on shale wetting cannot be completely ruled out. Otherwise, this may lead to a biased representation of water wetting behavior in areas with relatively low organic matter content. Organic matter is considered to be the primary contributor to oil–wetting behavior, as highlighted by Passey et al. [52]. They proposed that organic matter adsorbed on hydrophilic rocks can cause a transition from hydrophilic to oil–wet surfaces, ultimately exhibiting oil–wet characteristics in the rock’s pore structure. Therefore, the presence of organic matter adds complexity to the wetting behavior of shale, as the wetting properties of organic–rich shale are influenced by both mineral composition and organic matter. Su et al. [28] found that shale rocks exhibiting mixed wetting behavior have a higher total organic carbon (TOC) content compared to water–wet rocks. This is attributed to the wetting behavior on the oil–wet rock surface primarily being influenced by the characteristics of organic matter. Consistent with the TOC results in this study (as shown in Table 1), the oil–wetting behavior is found to be enhanced with increasing TOC, with JA exhibiting higher TOC content compared to JB. Therefore, the occurrence and modification of organic matter on the rock surface are considered to be the fundamental factors influencing the formation of shale pore oil–wetting behavior. Areas with a longer exposure to organic matter attachment are more likely to exhibit higher oil–wetting characteristics. This is one of the reasons why sample JA in this study showed stronger oil–wetting behavior compared to JB. Further discussion and analysis on this topic can be found in the following two subsections.
4.3. The Influence of Wall Oil/Water Adhesion Forces on Wettability
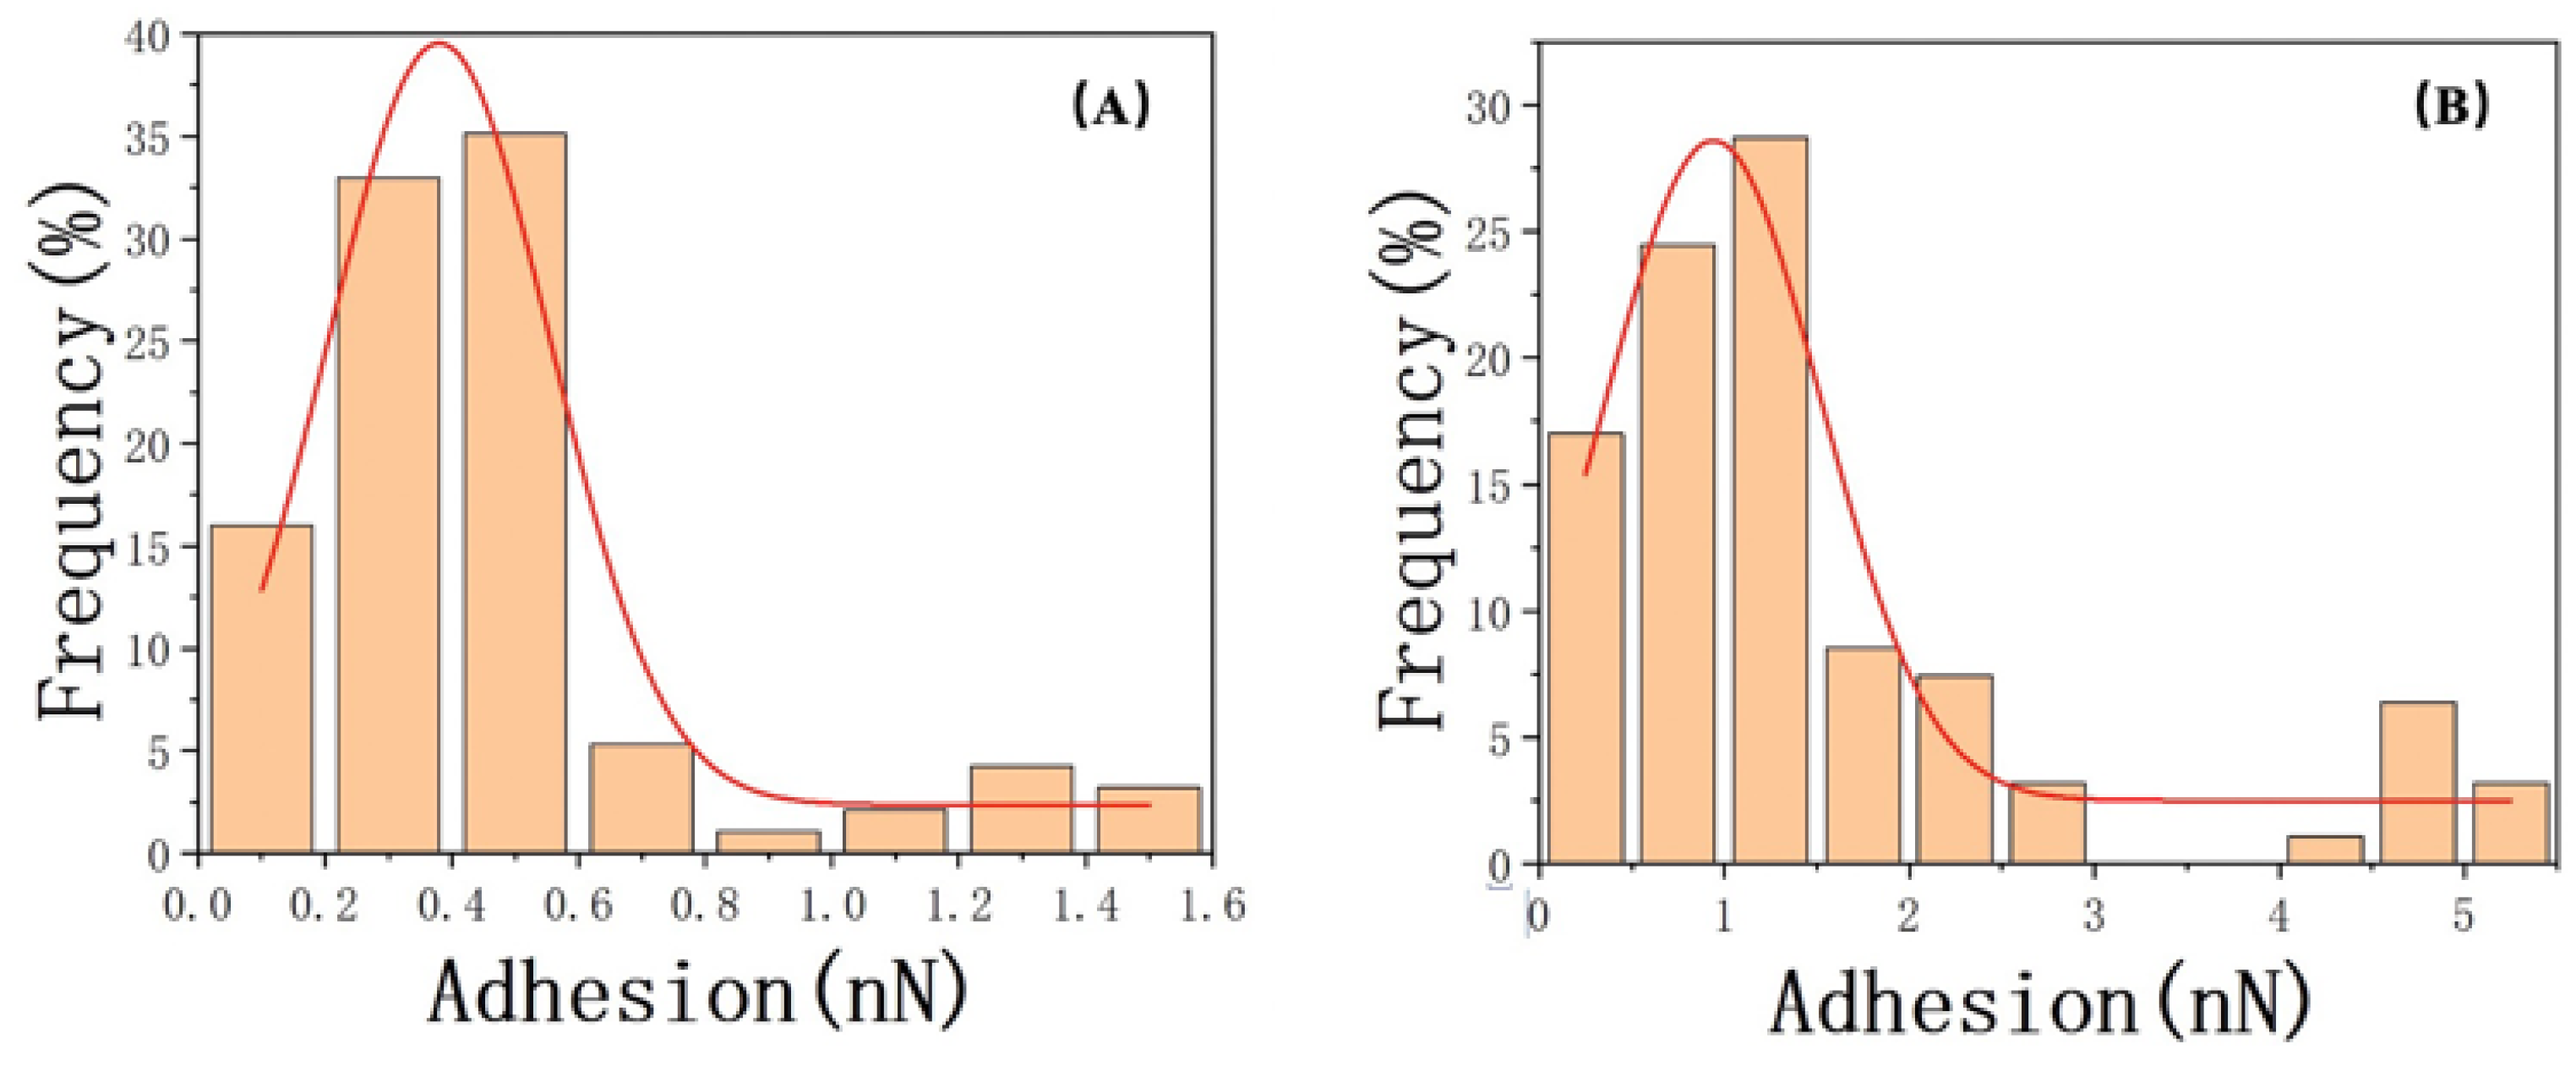
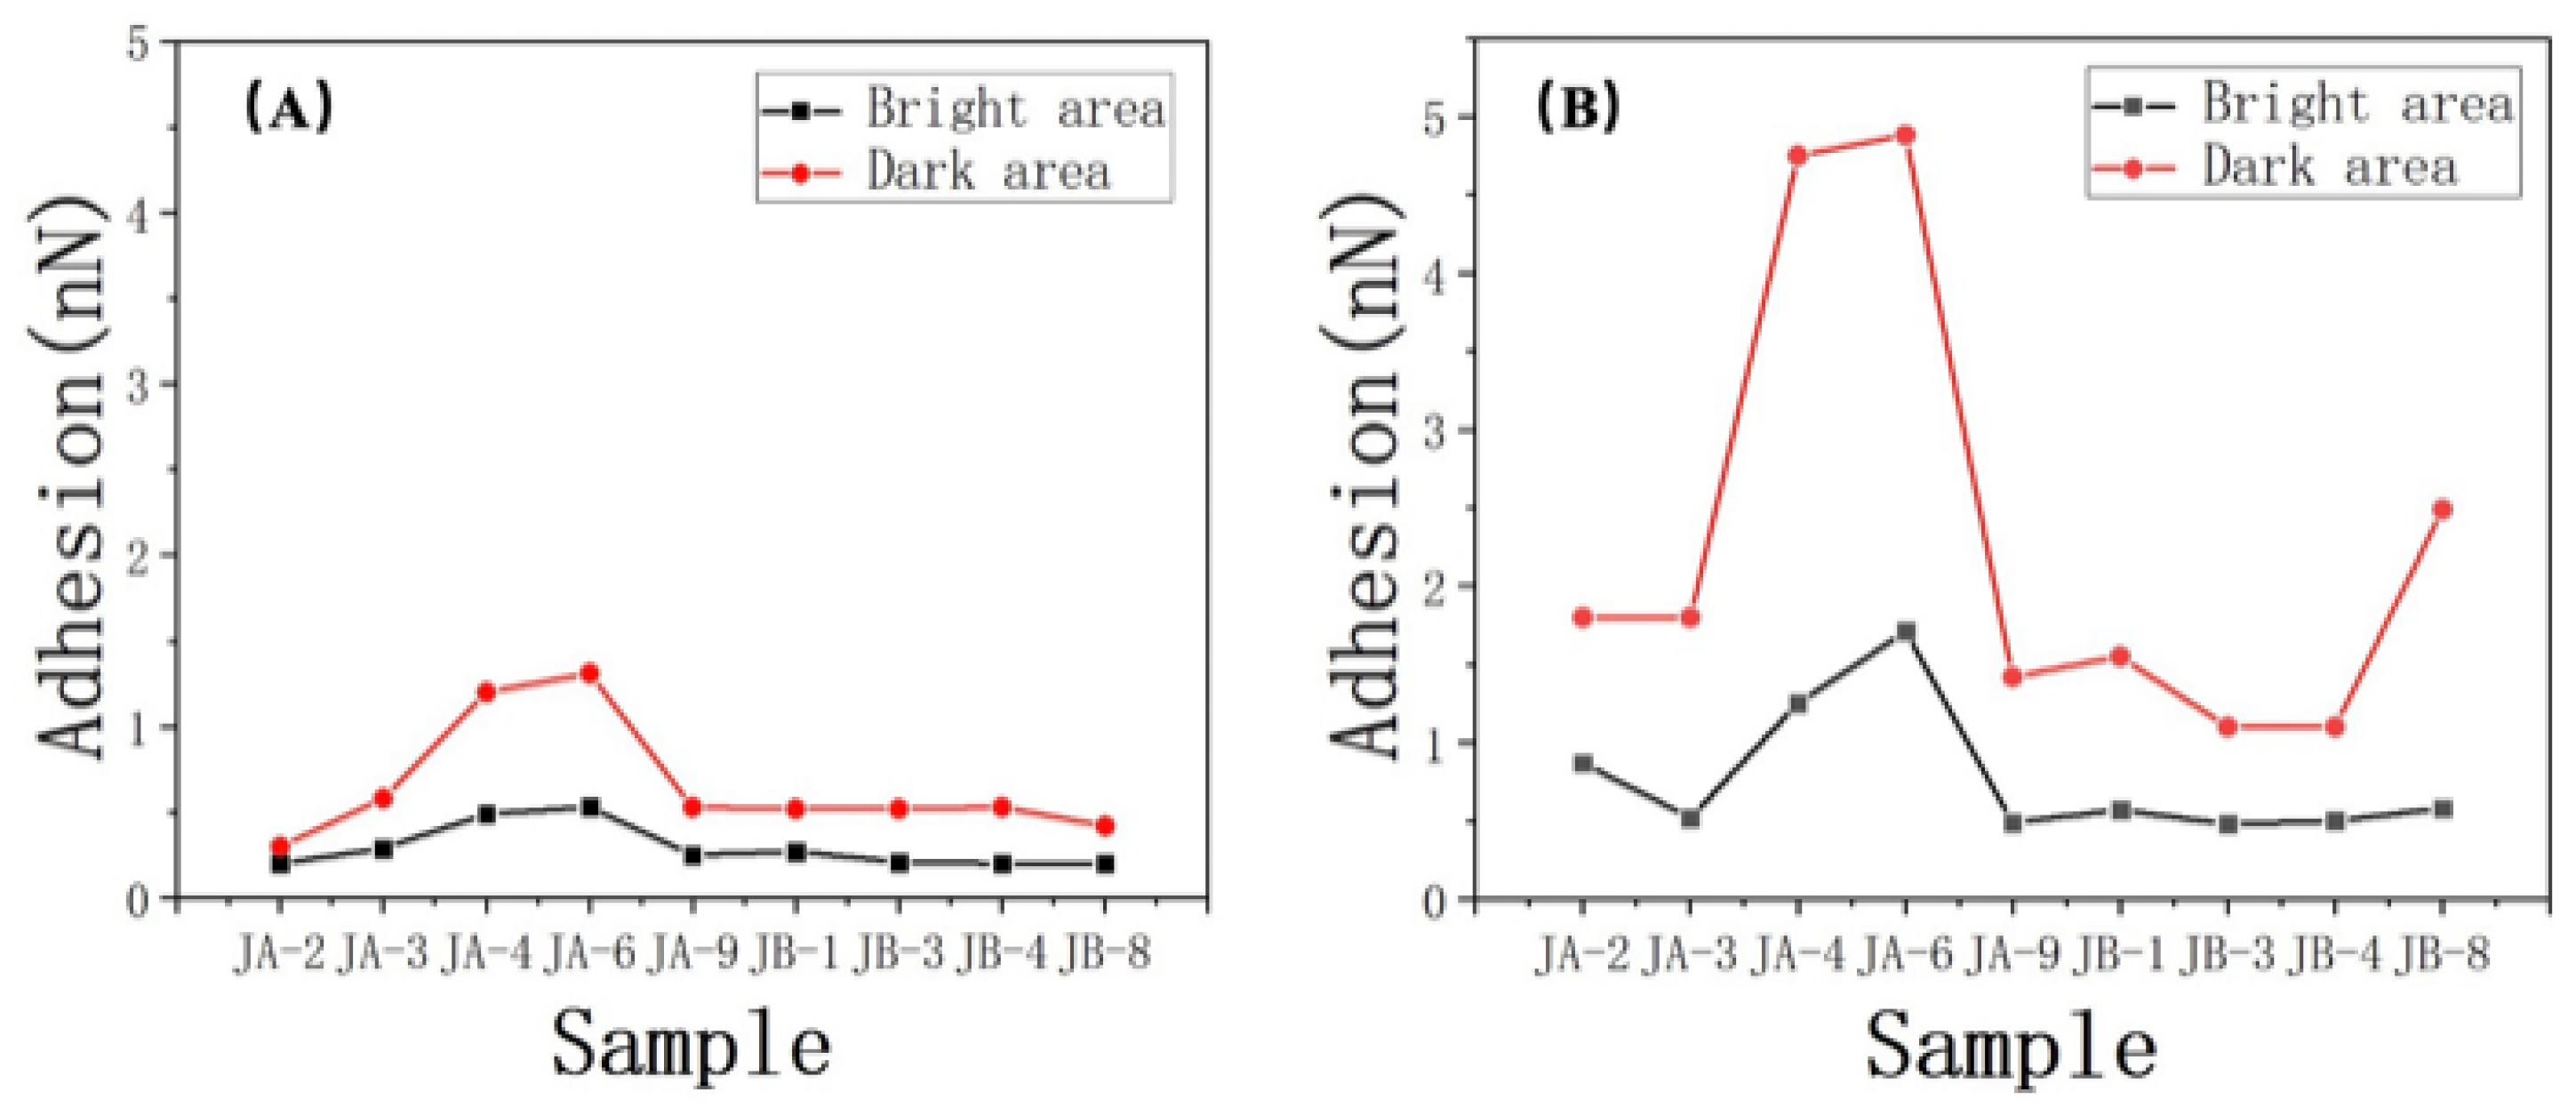
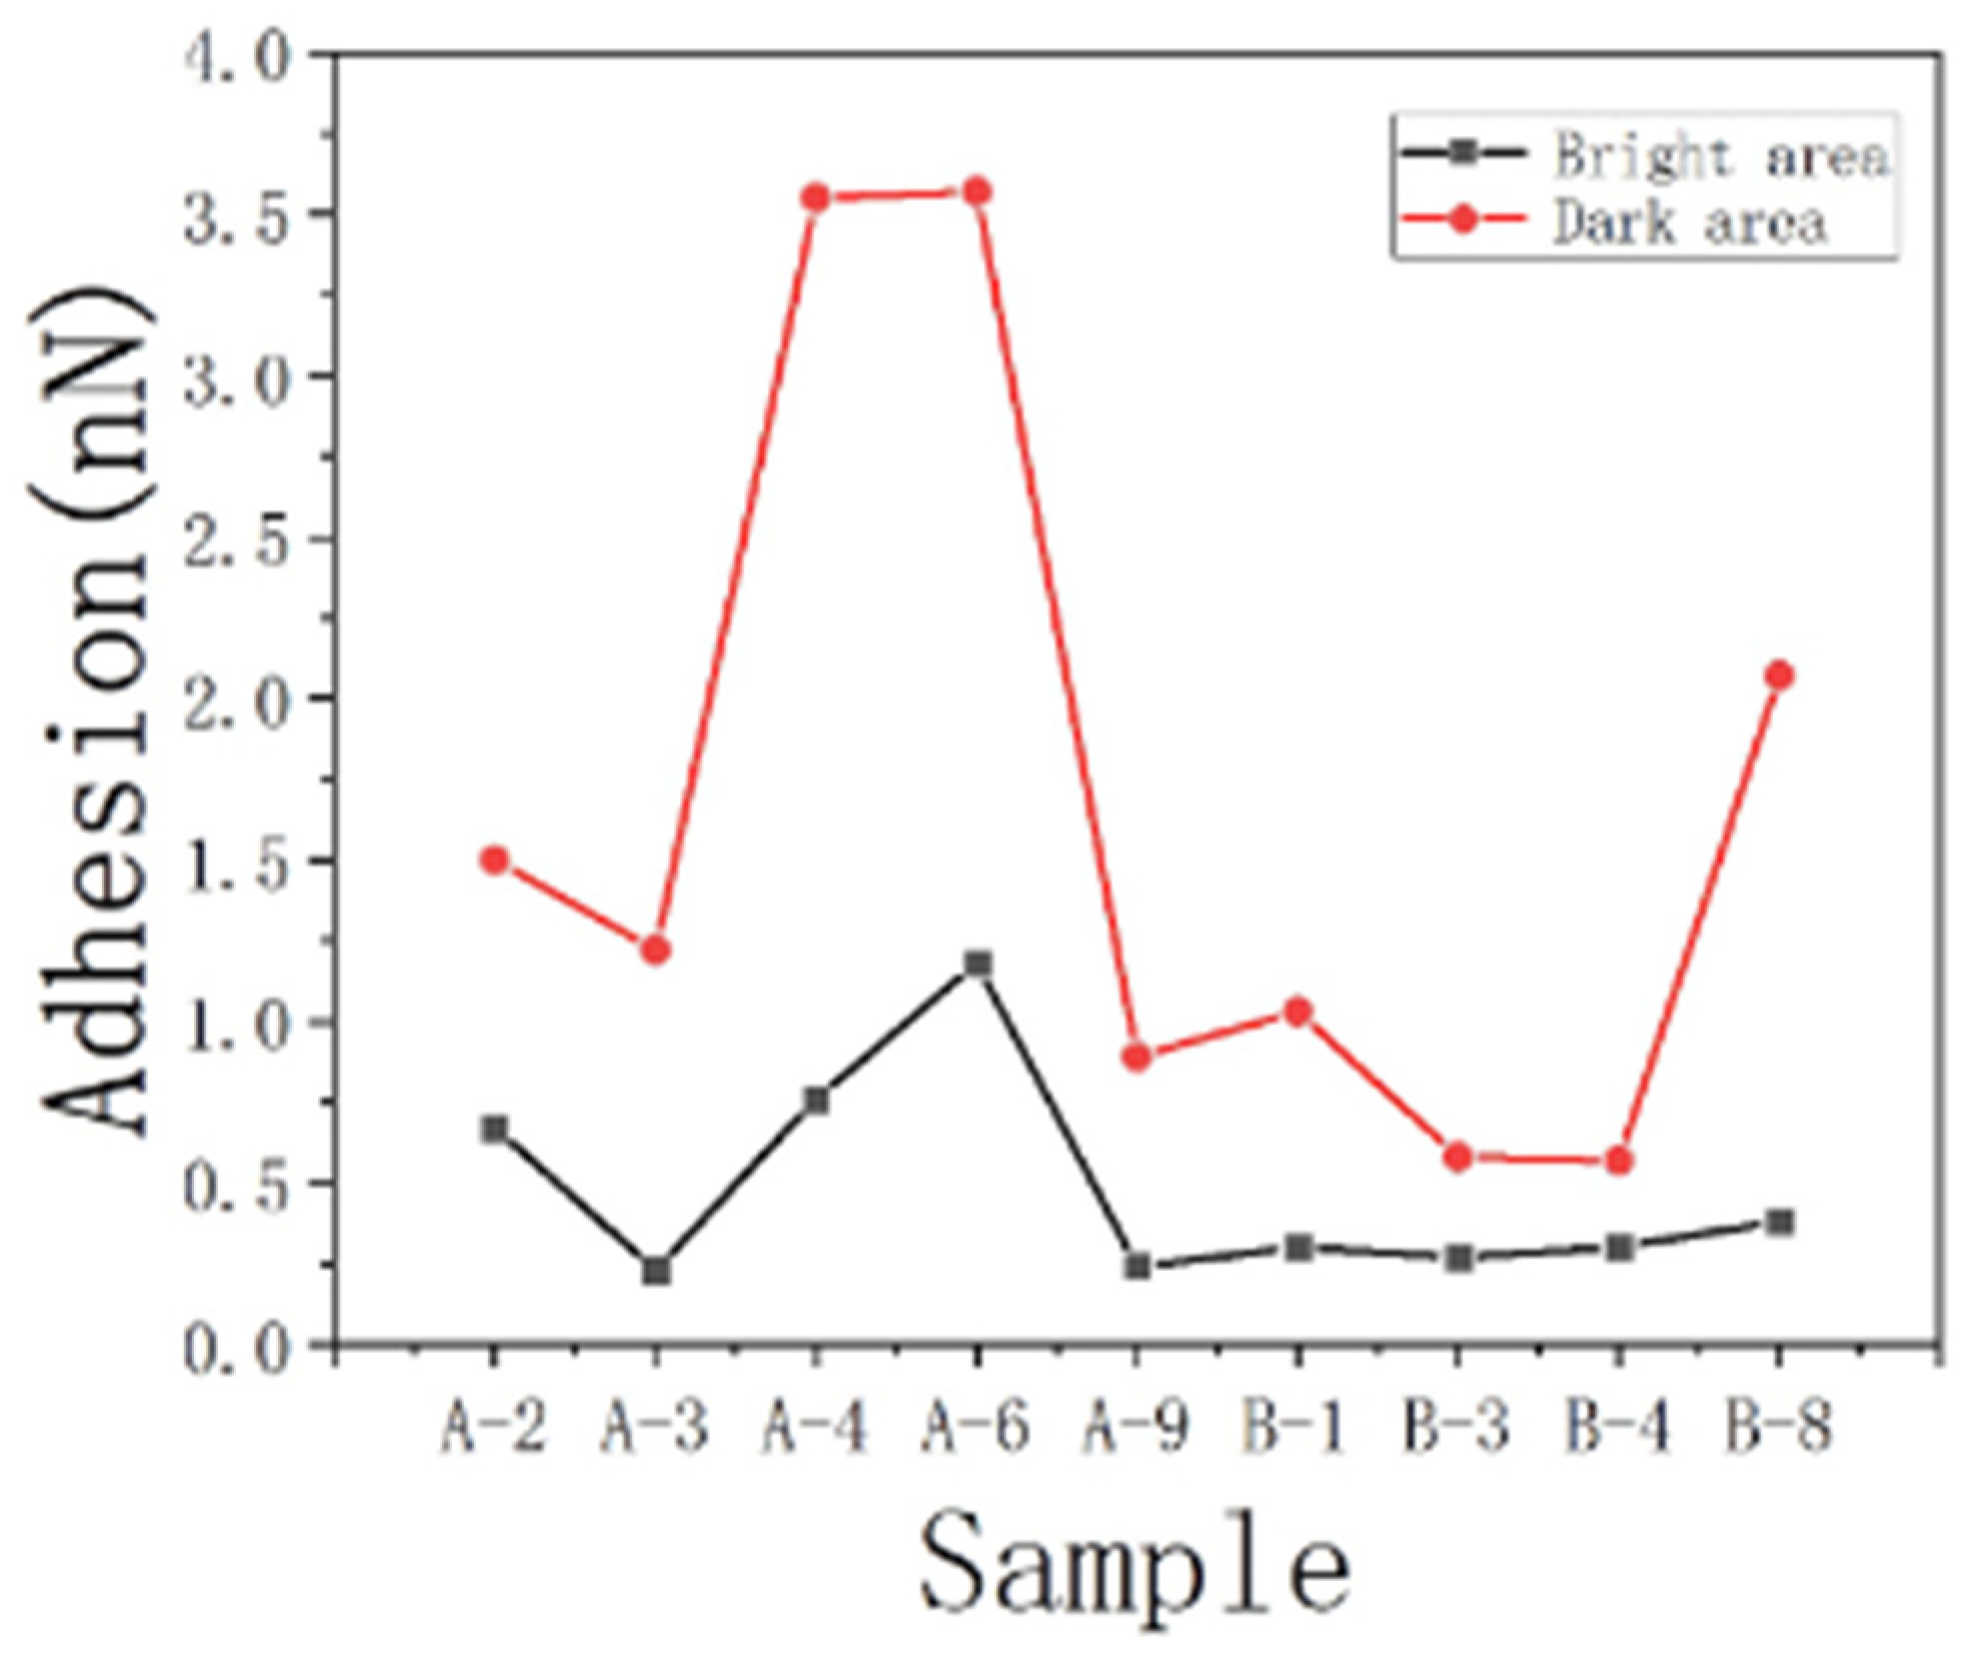
Regarding the measurement results of the contact angle, we employed atomic force microscopy (AFM) to investigate the adhesive forces of water and oil in different feature areas. Subsequently, we compared the obtained values using a Gaussian fitting and found a strong correlation between the fitted curves and the data, with correlation coefficients of 0.96 and 0.92, respectively. Figure 11 displays the Gaussian distributions (solid lines) fitted to the data. Notably, the water adhesive force on the sample surface was predominantly distributed around 0.35 ± 0.2 nN/m, which was significantly lower than the oil adhesive force, exhibiting a prominent peak at 0.94 ± 0.5 nN/m. Then, we examined the differences in adhesive forces between oil and water during the retraction process and their corresponding discrepancies (Table 5), which shed light on the governing factors of wettability. The results indicated that the oil adhesion forces in both types of characteristic regions were higher than the water adhesion forces (Figure 12).
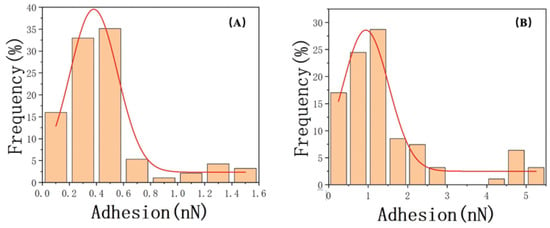
Figure 11.
Gaussian normal–distribution fitting of adhesion for (A) water and (B) oil.
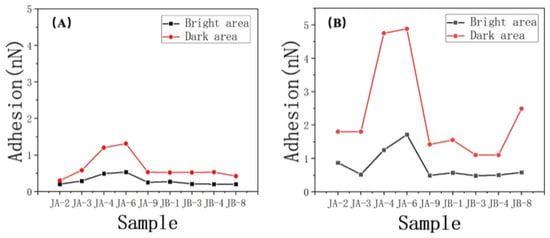
Figure 12.
Oil and water adhesion in the (A) bright area and (B) dark area.
However, there is a larger difference between oil and water adhesion forces in DA. In contrast, BA exhibited lower discrepancies (Figure 13). This observation implies that the oil droplet contributed significantly more to the wetting performance in DA compared to BA. Above, we discussed how the presence of organic matter can simultaneously enhance oil–wetting and water–wetting properties. However, it is worth noting that the wetting performance achieved by the oil droplet is notably stronger, underscoring its dominant role in determining wettability. This finding aligns with previous studies that highlighted the influence of organic matter on the surface properties, particularly its propensity to transform the surface from hydrophilic to hydrophobic. Furthermore, the higher interaction of gold–sulfur bonds observed on the DA surface compared to the bright surface corroborated the contribution of DA to the sample’s oil–wetting characteristics. To validate the universality of this pattern, we applied the same analysis to the data from other samples, as presented in Table 5. The consistent findings across multiple samples provided further support for the observed trend.
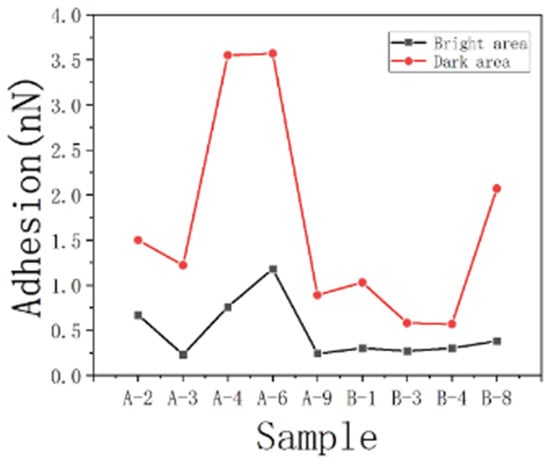
Figure 13.
Comparison of the adhesion difference between oil and water in different regions.
In order to investigate the relationship between shale adhesion forces and wettability, we conducted a fitting analysis of the oil/water adhesion force difference and the sum of the forces and proposed an AFM–based method to assess reservoir wettability. By measuring the adhesion forces at the oil–solid and water–solid interfaces, we established a dimensionless wettability index, denoted as I, to characterize the strength of wettability at the nanoscale. The specific formula is as follows:
In the equation, represents the magnitude of the adhesion force between oil and solid, and represents the magnitude of the adhesion force between water and solid. When 0 ≤ I ≤ 1, the sample is considered oil–wet, and when −1 ≤ I < 0, the sample is considered water–wet. Since the wettability index is normalized, its maximum value is 1. This evaluation method is still applicable to water–wet rock cores with a wettability index less than 0.
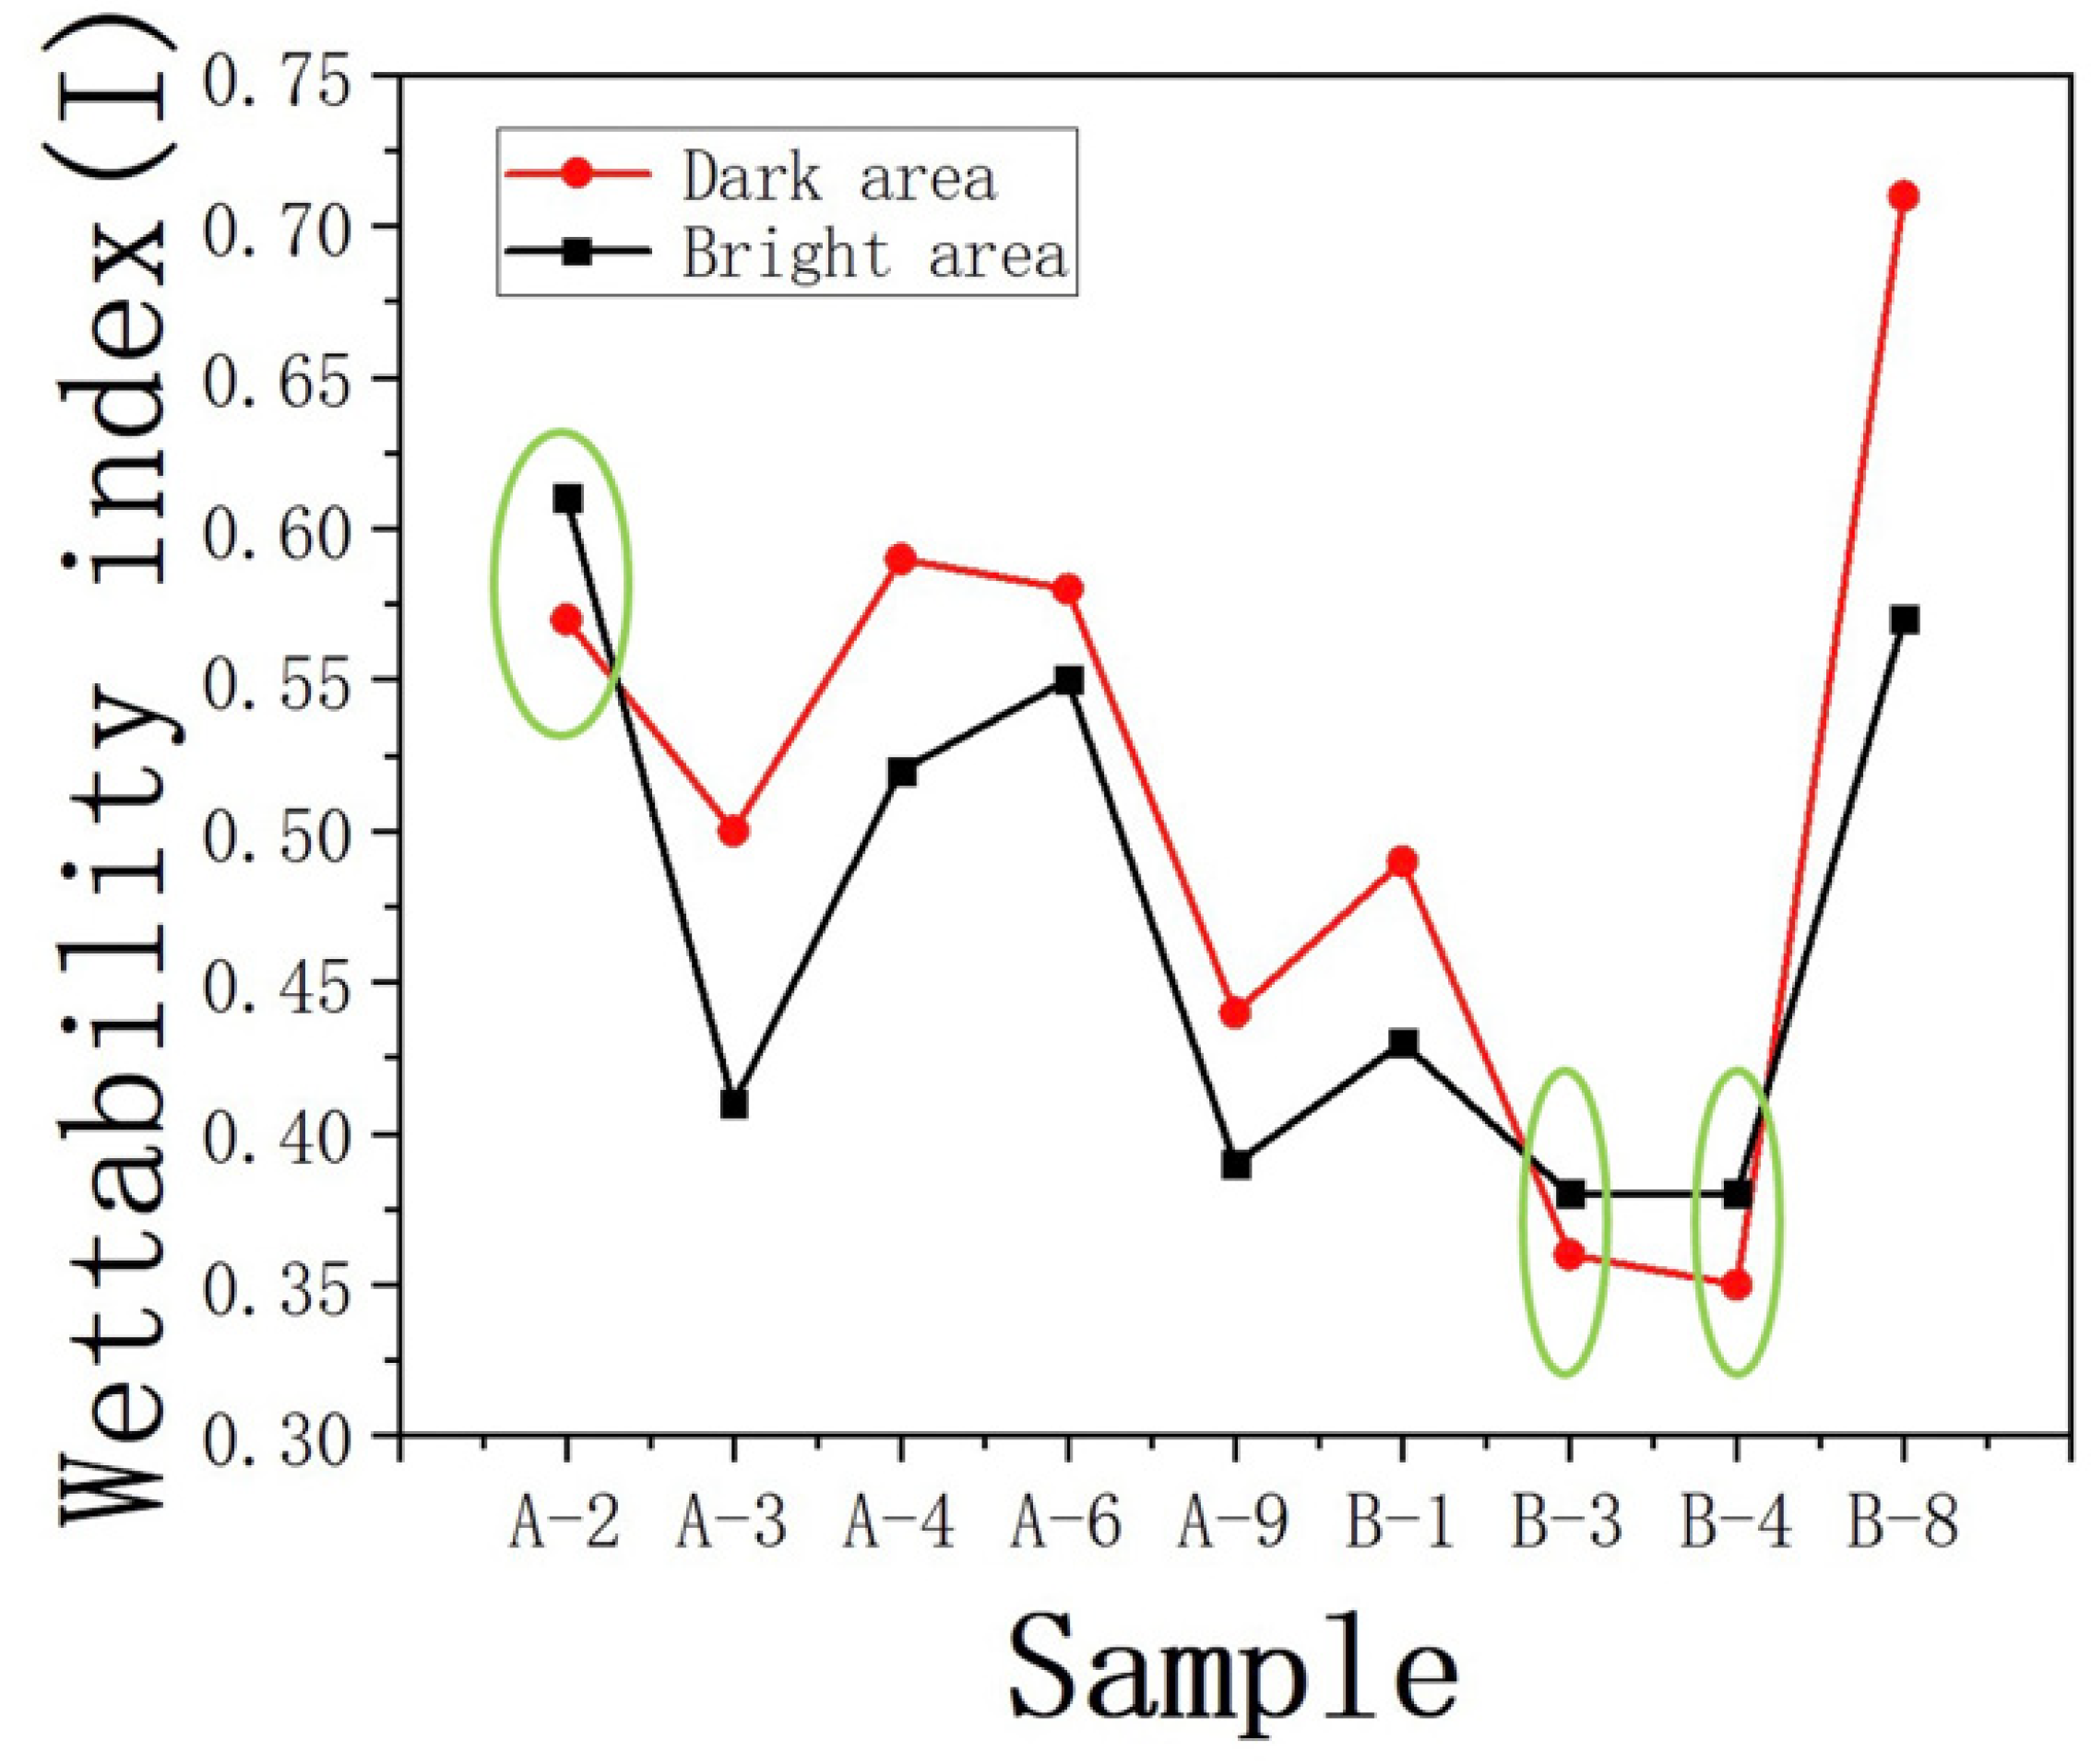
The wettability between the two distinct areas was assessed using the newly developed AFM evaluation method. The results, presented in Table 6, compare the average wettability indices of the BA and DA in each rock core. The adhesion behavior exhibited by hydrophobic and hydrophilic surfaces differed significantly under the two probes, highlighting the contrasting oil–rock/water–rock interactions that serve as the foundation for the nanomechanical wettability evaluation method. The findings revealed that the average wettability index of BA in each rock core sample was consistently lower than that of DA, indicative of a stronger hydrophobic nature in DA. These outcomes imply that the presence of DA contributes to enhanced hydrophobic behavior.

Table 6.
Wetting index of different characteristic regions.
A comparative analysis was conducted on the wetting index (I) for different regions. Significant differences were observed in the wetting index (I) for samples JA–2, JB–3, and JB–4 compared to the other samples (Figure 14). In comparison to DA, BA contributed to a stronger oil–wetting behavior. Through comparison, it was observed that these three samples exhibited smaller roughness values within their respective regions (as shown in the Table 3), with the BA occupying a larger area. In the case of similar oil–wetting characteristics, the presence of more extensive pore throats associated with the development of larger pores in plagioclase feldspar was observed. This provides more space for the retention of organic matter, resulting in a higher concentration of organic material within the pore throats developed in BA. This process also laid the foundation for the surface modification of plagioclase feldspar in the corresponding regions, leading to a stronger surface modification effect and higher oil–wetting behavior in those areas.
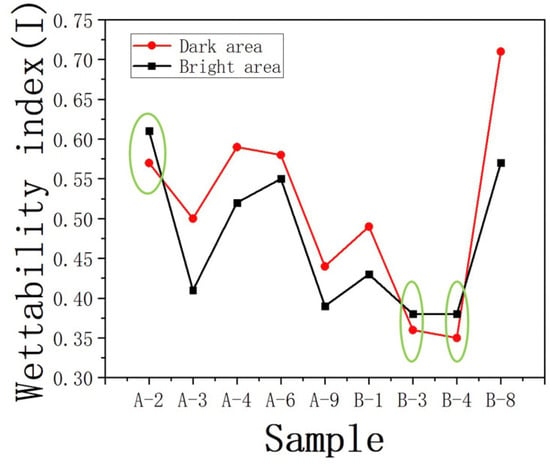
Figure 14.
Wettability index of different characteristic regions I.
It is also noteworthy that samples JB–3 and JB–4 exhibited a lower development of clay minerals compared to other samples in the JB region. The lower content of clay minerals in these samples is one of the factors contributing to the weaker oil–wetting behavior observed in DA. In addition, a discussion was conducted on the oil–wetting behavior of the surface of sample JB–8, which exhibited similar roughness to sample JB–3. It was found that the oil–wetting behavior in the DA of sample JB–8 was significantly higher than that in the BA. This is different from the observations in samples JA–2, JB–3, and JB–4, where the wetting indices in both areas were very similar. The discrepancy in oil–wetting behavior between the DA and BA of sample JB–8 can be attributed to the differences in the development of large–radius pores. The bright region of sample JB–8 exhibited fewer large–radius pores, which led to a greater retention of organic matter in situ. This facilitated stronger chemical modifications in DA. Indeed, the discussions highlighted the significant influence of organic matter distribution on the surface modification and wetting behavior of shale rocks. The location and concentration of organic matter play a crucial role in determining the wetting characteristics of shale formations.
This observation provides valuable insights into the wettability characteristics of the examined shale reservoirs and underscores the significance of comprehending the spatial distribution and variability of wettability within the reservoir.
The AFM wettability evaluation method was concurrently analyzed with the contact angle method to verify the accuracy of the AFM approach. To facilitate a more intuitive representation of oil wettability, the contact angle measurements were transformed into dimensionless values for direct comparison, as shown in Equation (7):
In the equation, θ represents the contact angle between gas, water, and the solid surface measured using the sessile drop method. When 0 ≤ W ≤ 1, the sample is considered oil–wet, and when −1 ≤ W < 0, the sample is considered water–wet. Ensuring the cleanliness of the sample surface and the interior of the pipette during the measurement process is crucial. Therefore, in the preparation process, distilled water and nitrogen gas were used to clean the surface residues of the shale, and the pipette and dropper were also cleaned to ensure the accuracy of the experimental results.
The established AFM wettability index (I) was compared to the wettability index (W) obtained through the contact angle method, facilitating a comprehensive analysis of the differences in solid–liquid interface interactions. This comparison allowed for a deeper understanding of the factors influencing wettability on shale surfaces. The comparison between the two methods revealed that the AFM wettability evaluation method provided consistent and complementary results to the contact angle measurements. By utilizing dimensionless values obtained from the contact angle method, a quantitative comparison was made between the two techniques, effectively highlighting both their similarities and differences in assessing oil wettability.
The obtained results from both the AFM wettability index (I) and the contact angle–based wettability index (W) indicated a preference for oil–wet behavior. However, there are notable differences in the degree of oil–wettability, which can be attributed to the influence of surface roughness. The use of AFM probes with a specific radius offered an advantage by minimizing the impact of surface inhomogeneity during the measurement process. As described by the data in Table 7. The wettability index (W) revealed that the JB sample exhibited a wettability range of 0.27 to 0.4 under different roughness conditions. Conversely, the JA sample demonstrated comparable differences in the wettability index, indicating a stronger hydrophobic nature attributed to the presence of surface roughness. Furthermore, by analyzing the discrepancies between I and W, the samples JA–2, JA–4, JA–6, and JB–8 exhibited significant differences in their wetting results, which can be attributed to the incomplete representation of oil–wettability by the contact angle. The rough areas of these four samples demonstrated the highest oil–wetting characteristics among the experimental samples. The strong heterogeneity in these regions prevented the water droplet from fully contacting the sample surface, thereby inhibiting the complete expression of higher oil–wetting characteristics. As a result, this discrepancy between the contact angle (W) and the wetting index (I) values was observed, indicating the limitations of the contact angle measurement in fully capturing the oil–wetting behavior.

Table 7.
Index W and I.
In summary, the AFM method offers an enhanced level of precision in evaluating surface wettability properties by effectively addressing the impact of roughness and providing valuable insights into the intrinsic wettability of the rock core. As a result, this method demonstrated applicability in assessing wettability for reservoirs.
4.4. The Impact of Mixed Wetting Distribution on Overall Reservoir Wettability
The non–uniqueness of wettability magnitudes is apparent from the varied values of the wettability index (I) obtained at different points on the samples. Deglint et al. [7] proposed that microscale contact angles indicate the wetting behavior ranging from hydrophilic to mixed–wetting, while macroscopic contact angle values reflect the phenomenon of mixed wetting. This suggests that the wetting distribution at the microscale has a significant influence on the overall wetting behavior. The heterogeneous distribution of minerals and organic matter contributes to the diverse wettability properties observed on the surface of the rock core, which is the fundamental cause of mixed wettability. However, it is important to note that all measured locations on the samples in this study consistently exhibited oil–wet behavior, including both DA and BA. The presence of hydrophilic minerals did not result in any water–wet sites due to the extended immersion of the samples in oil–bearing formations. This prolonged exposure led to the formation of an oil film and surface modifications, promoting the development of oil–wettability. Meanwhile, the development of oil–wetting characteristics was related to the difference in pore sizes between adjacent regions. When large pores are extensively developed, more organic matter tends to enter these larger pore throats and undergo wetting modifications on a larger scale and over a larger range of the mineral surface. These factors contribute to the overall sample, exhibiting a more pronounced oil–wet state.
5. Conclusions
Wettability plays a critical role in assessing reservoir characteristics, such as movable oil content and recovery potential. The traditional contact angle measurement method has several limitations and challenges in the measurement process. To overcome the limitations of traditional wettability evaluation methods, this study employed atomic force microscopy (AFM) and contact angle measurements to assess the surface morphology, roughness, and mechanical properties of mixed shale reservoir samples from Xinjiang, China.
- Correlation analysis was conducted regarding the mineral content and surface roughness. It was found that an increase in the content of minerals such as quartz, clay, and organic matter contributed to enhanced surface roughness. On the other hand, the presence of plagioclase feldspar showed an opposite trend. Building upon this, an analysis of the wetting behavior based on different mineral contents was conducted, revealing that the influence of mineral content on the contact angle originated from variations in surface roughness.
- By investigating the adhesive interactions between hydrophilic/hydrophobic probes and the shale surface at the nanoscale, significant disparities in energy and force were observed between oil–repellent and water–repellent pore walls. The analysis demonstrated that, as the hydrophobicity of the rock core increased, the interaction forces between oil and rock became significantly stronger, as evident from both contact angle measurements and AFM force curves.
- Based on the measurement results of adhesive forces, the impact of organic matter on the overall wettability of the samples was thoroughly examined. The findings highlighted that, in contrast to mineral components, the presence of organic matter emerged as the key factor influencing in situ reservoir wettability. The development of intergranular and intragranular pore networks provided space for the occurrence of crude oil, while also laying the foundation for its own oil–wetting characteristics. Notably, in the DA containing organic matter, the oil–solid adhesion force exhibited a significant increase, a phenomenon that conventional methods fail to assess.
- Leveraging force mechanical findings, a novel method based on AFM, was developed to evaluate mixed wettability in reservoirs. The calculated wettability indices, W and I, exhibited discrepancies. It was determined that these differences originated from surface roughness, which was effectively mitigated by the nanoscale radius of the probe, thereby providing reliable support. This approach enabled the characterization of wettability at the nano/micrometer scale, while incorporating the evaluation of crude oil detachment difficulty through mechanical curves.
In conclusion, this study contributes valuable insights into the interplay between organic matter, mineral distribution, roughness, and wetting behavior.
Author Contributions
Conceptualization, L.S.; Methodology, X.H.; Formal analysis, X.H. and J.L.; Investigation, C.F., Z.Z., X.P. and M.D.; Writing—original draft, X.H.; Supervision, Z.Y.; Project administration, L.S.; Funding acquisition, Z.Y. and J.L. All authors have read and agreed to the published version of the manuscript.
Funding
This research was supported by the National Natural Science Foundation of China (No. 41972123) “Microscopic occurrence of pore water in shale matrix and its control mechanism on shale gas output”; The Major Project of CNPC’s “CCUS oil displacement geological body fine description and reservoir en-gineering key technology research” (No. 2021ZZ01-03); Petrochina Science and Technology Research Project “shale oil development mechanism and development technology research” (No. 2022KT-10-01).
Data Availability Statement
Data are contained within the article.
Conflicts of Interest
The authors declare no conflict of interest.
References
- Wang, M.; Li, M.; Li, J.B.; Liang, X.; Zhang, J.X. The key parameter of shale oil resource evaluation: Oil content. Pet. Sci. 2022, 19, 1443–1459. [Google Scholar] [CrossRef]
- Hu, T.; Pang, X.; Jiang, F.; Wang, Q.; Liu, X.; Wang, Z.; Jiang, S.; Wu, G.; Li, C.; Xu, T.; et al. Movable oil content evaluation of lacustrine organic–rich shales: Methods and a novel quantitative evaluation model. Earth-Sci. Rev. 2021, 214, 103545. [Google Scholar] [CrossRef]
- Zou, C.; Ma, F.; Pan, S.; Zhang, X.; Wu, S.; Fu, G.; Wang, H.; Yang, Z. Formation and distribution potential of global shale oil and the developments of continental shale oil theory and technology in China. Earth Sci. Front. 2023, 30, 128. [Google Scholar] [CrossRef]
- Wang, M.; Ma, R.; Li, J.; Lu, S.; Li, C.; Guo, Z.; Li, Z. Occurrence mechanism of lacustrine shale oil in the Paleogene Shahejie Formation of Jiyang depression, Bohai Bay Basin, China. Pet. Explor. Dev. Online 2019, 46, 833–846. [Google Scholar] [CrossRef]
- Xi, K.; Zhang, Y.; Cao, Y.; Gong, J.; Li, K.; Lin, M. Control of micro–wettability of pore–throat on shale oil occurrence: A case study of laminated shale of Permian Lucaogou Formation in Jimusar Sag, Junggar Basin, NW China. Pet. Explor. Dev. 2023, 50, 334–345. [Google Scholar] [CrossRef]
- AlRatrout, A.; Blunt, M.J.; Bijeljic, B. Wettability in complex porous materials, the mixed–wet state, and its relationship to surface roughness. Proc. Natl. Acad. Sci. USA 2018, 115, 8901–8906. [Google Scholar] [CrossRef]
- Deglint, H.J.; Clarkson, C.R.; Ghanizadeh, A.; Debuhr, C.; Wood, J. Comparison of micro–and macro–wettability measurements and evaluation of micro–scale imbibition rates for unconventional reservoirs: Implications for modeling multi–phase flow at the micro–scale. J. Nat. Gas Sci. Eng. 2019, 62, 38–67. [Google Scholar] [CrossRef]
- Liu, J.; Sheng, J.J. Experimental investigation of surfactant enhanced spontaneous imbibition in Chinese shale oil reservoirs using NMR tests. J. Ind. Eng. Chem. 2019, 72, 414–422. [Google Scholar] [CrossRef]
- Ding, F.; Gao, M. Pore wettability for enhanced oil recovery, contaminant adsorption and oil/water separation: A review. Adv. Colloid Interface Sci. 2021, 289, 102377. [Google Scholar] [CrossRef]
- Deng, X.; Kamal, M.S.; Patil, S.; Hussain, S.; Zhou, X. A review on wettability alteration in carbonate rocks: Wettability modifiers. Energy Fuels 2019, 34, 31–54. [Google Scholar] [CrossRef]
- Liu, F.; Wang, M. Review of low salinity waterflooding mechanisms: Wettability alteration and its impact on oil recovery. Fuel 2020, 267, 117112. [Google Scholar] [CrossRef]
- Arif, M.; Abu–Khamsin, S.A.; Iglauer, S. Wettability of rock/CO2/brine and rock/oil/CO2–enriched–brine systems: Critical parametric analysis and future outlook. Adv. Colloid Interface Sci. 2019, 268, 91–113. [Google Scholar] [CrossRef]
- Amin, J.S.; Nikooee, E.; Ayatollahi, S.; Alamdari, A. Investigating wettability alteration due to asphaltene precipitation: Imprints in surface multifractal characteristics. Appl. Surf. Sci. 2010, 256, 6466–6472. [Google Scholar] [CrossRef]
- Pan, B.; Clarkson, C.R.; Younis, A.; Song, C.; Debuhr, C.; Ghanizadeh, A.; Birss, V. New methods to evaluate impacts of osmotic pressure and surfactant on fracturing fluid loss and effect of contact angle on spontaneous imbibition data scaling in unconventional reservoirs. Fuel 2022, 328, 125328. [Google Scholar] [CrossRef]
- Jagadisan, A.; Heidari, Z. Impacts of competitive water adsorption of kerogen and clay minerals on wettability of organic–rich mudrocks. SPE Reserv. Eval. Eng. 2020, 23, 1180–1189. [Google Scholar] [CrossRef]
- Ferrari, J.V.; de Oliveira Silveira, B.M.; Arismendi–Florez, J.J.; Fagundes, T.; Silva, M.; Skinner, R.; Ulsen, C.; Carneiro, C. Influence of carbonate reservoir mineral heterogeneities on contact angle measurements. J. Pet. Sci. Eng. 2021, 199, 108313. [Google Scholar] [CrossRef]
- Zdziennicka, A.; Szymczyk, K.; Jańczuk, B. Correlation between surface free energy of quartz and its wettability by aqueous solutions of nonionic, anionic and cationic surfactants. J. Colloid Interface Sci. 2009, 340, 243–248. [Google Scholar] [CrossRef] [PubMed]
- Laird, D.A. Layer charge influences on the hydration of expandable 2:1 phyllosilicates. Clays Clay Miner. 1999, 47, 630–636. [Google Scholar] [CrossRef]
- Shi, K.Y.; Chen, J.Q.; Pang, X.Q.; Jiang, F.; Hui, S.; Zhao, Z.; Chen, D.; Cong, Q.; Wang, T.; Xiao, H.; et al. Wettability of different clay mineral surfaces in shale: Implications from molecular dynamics simulations. Pet. Sci. 2023, 20, 689–704. [Google Scholar] [CrossRef]
- Su, S.; Jiang, Z.; Shan, X.; Zhu, Y.; Wang, P.; Luo, X.; Li, Z.; Zhu, R.; Wang, X. The wettability of shale by NMR measurements and its controlling factors. J. Pet. Sci. Eng. 2018, 169, 309–316. [Google Scholar] [CrossRef]
- Shi, C.; Xie, L.; Zhang, L.; Lu, X.; Zeng, H. Probing the interaction mechanism between oil droplets with asphaltenes and solid surfaces using AFM. J. Colloid Interface Sci. 2020, 558, 173–181. [Google Scholar] [CrossRef] [PubMed]
- Taqvi, S.T.; Almansoori, A.; Bassioni, G. Understanding the role of asphaltene in wettability alteration using ζ potential measurements. Energy Fuels 2016, 30, 1927–1932. [Google Scholar] [CrossRef]
- Rocha, J.A.; Baydak, E.N.; Yarranton, H.W.; Sztukowski, D.M.; Ali–Marcano, V.; Gong, L.; Shi, C.; Zeng, H. Role of aqueous phase chemistry, interfacial film properties, and surface coverage in stabilizing water–in–bitumen emulsions. Energy Fuels 2016, 30, 5240–5252. [Google Scholar] [CrossRef]
- Salou, M.; Siffert, B.; Jada, A. Interfacial characteristics of petroleum bitumens in contact with acid water. Fuel 1998, 77, 343–346. [Google Scholar] [CrossRef]
- Jin, X.; Li, G.; Meng, S.; Wang, X.; Liu, C.; Tao, J.; Liu, H. Microscale comprehensive evaluation of continental shale oil recoverability. Pet. Explor. Dev. 2021, 48, 256–268. [Google Scholar] [CrossRef]
- Yao, Y.; Wei, M.; Kang, W. A review of wettability alteration using surfactants in carbonate reservoirs. Adv. Colloid Interface Sci. 2021, 294, 102477. [Google Scholar] [CrossRef]
- Roshan, H.; Al–Yaseri, A.Z.; Sarmadivaleh, M.; Iglauer, S. On wettability of shale rocks. J. Colloid Interface Sci. 2016, 475, 104–111. [Google Scholar] [CrossRef]
- Mirchi, V.; Dejam, M.; Alvarado, V. Interfacial tension and contact angle measurements for hydrogen–methane mixtures/brine/oil–wet rocks at reservoir conditions. Int. J. Hydrogen Energy 2022, 47, 34963–34975. [Google Scholar] [CrossRef]
- de Oliveira Silveira, B.M.; dos Santos Gioria, R.; Florez, J.J.A.; Fagundes, T.; Silva, M.; Skinner, R.; Ulsen, C.; Carneiro, C.; Ferrari, J. Influence of oil aging time, pressure and temperature on contact angle measurements of reservoir mineral surfaces. Fuel 2022, 310, 122414. [Google Scholar] [CrossRef]
- Cwickel, D.; Paz, Y.; Marmur, A. Contact angle measurement on rough surfaces: The missing link. Surf. Innov. 2017, 5, 190–193. [Google Scholar] [CrossRef]
- Sharifigaliuk, H.; Mahmood, S.M.; Al–Bazzaz, W.; Khosravl, V. Complexities driving wettability evaluation of shales toward unconventional approaches: A comprehensive review. Energy Fuels 2021, 35, 1011–1023. [Google Scholar] [CrossRef]
- Gao, Z.; Fan, Y.; Hu, Q.; Jiang, Z.; Chen, Y. The effects of pore structure on wettability and methane adsorption capability of Longmaxi Formation shale from the southern Sichuan Basin in China. AAPG Bull. 2020, 104, 1375–1399. [Google Scholar] [CrossRef]
- Wu, Y.; Luo, Q.; Chu, Z.; Li, Y.; Sun, L.; Shi, X.; Li, Z.; Ren, W.; Yuan, B. Microscale Reservoir Wettability Evaluation Based on Oil–Rock Nanomechanics. Energy Fuels 2023, 37, 6697–6704. [Google Scholar] [CrossRef]
- Peng, S.; Reed, R.M.; Xiao, X.; Yang, Y.; Liu, Y. Tracer–guided characterization of dominant pore networks and implications for permeability and wettability in shale. J. Geophys. Res. Solid Earth 2019, 124, 1459–1479. [Google Scholar] [CrossRef]
- Alinejad, A.; Dehghanpour, H. Evaluating porous media wettability from changes in Helmholtz free energy using spontaneous imbibition profiles. Adv. Water Resour. 2021, 157, 104038. [Google Scholar] [CrossRef]
- Gupta, I.; Rai, C.; Sondergeld, C. Study impact of sample treatment and insitu fluids on shale wettability measurement using NMR. J. Pet. Sci. Eng. 2019, 176, 352–361. [Google Scholar] [CrossRef]
- Liang, C.; Xiao, L.; Jia, Z.; Guo, L.; Luo, S.; Wang, Z. Mixed Wettability Modeling and Nuclear Magnetic Resonance Characterization in Tight Sandstone. Energy Fuels 2023, 37, 1962–1974. [Google Scholar] [CrossRef]
- Newgord, C.; Tandon, S.; Heidari, Z. Simultaneous assessment of wettability and water saturation using 2D NMR measurements. Fuel 2020, 270, 117431. [Google Scholar] [CrossRef]
- Yong, W.; Zhou, Y. A molecular dynamics investigation on methane flow and water droplets sliding in organic shale pores with nano–structured roughness. Transp. Porous Media 2022, 144, 69–87. [Google Scholar] [CrossRef]
- Tian, H.; Liu, F.; Jin, X.; Wang, M. Competitive effects of interfacial interactions on ion–tuned wettability by atomic simulations. J. Colloid Interface Sci. 2019, 540, 495–500. [Google Scholar] [CrossRef]
- Koetniyom, W.; Suhatcho, T.; Treetong, A.; Thiwawong, T. AFM force distance curve measurement for surface investigation of polymers compound blend with metal nanoparticles. Mater. Today Proc. 2017, 4, 6205–6211. [Google Scholar] [CrossRef]
- Luo, Y.; Andersson, S.B. A continuous sampling pattern design algorithm for atomic force microscopy images. Ultramicroscopy 2019, 196, 167–179. [Google Scholar] [CrossRef] [PubMed]
- Kulkarni, T.; Tam, A.; Mukhopadhyay, D.; Bhattacharya, S. AFM study: Cell cycle and probe geometry influences nanomechanical characterization of Panc1 cells. Biochim. Biophys. Acta (BBA)-Gen. Subj. 2019, 1863, 802–812. [Google Scholar] [CrossRef]
- Lu, Y.; Liu, D.; Cai, Y.; Gao, C.; Jia, Q.; Zhou, Y. AFM measurement of roughness, adhesive force and wettability in various rank coal samples from Qinshui and Junggar basin, China. Fuel 2022, 317, 123556. [Google Scholar] [CrossRef]
- Liu, F.; Yang, H.; Wang, J.; Zhang, M.; Chen, T.; Hu, G.; Zhang, W.; Wu, J.; Xu, S.; Wu, X.; et al. Salinity–dependent adhesion of model molecules of crude oil at quartz surface with different wettability. Fuel 2018, 223, 401–407. [Google Scholar] [CrossRef]
- Liu, S.; Xie, L.; Liu, J.; Zhong, H.; Wang, Y.; Zeng, H. Probing the interactions of hydroxamic acid and mineral surfaces: Molecular mechanism underlying the selective separation. Chem. Eng. J. 2019, 374, 123–132. [Google Scholar] [CrossRef]
- Wang, J.; Li, J.; Xie, L.; Shi, C.; Liu, Q.; Zeng, H. Interactions between elemental selenium and hydrophilic/hydrophobic surfaces: Direct force measurements using AFM. Chem. Eng. J. 2016, 303, 646–654. [Google Scholar] [CrossRef]
- Dickinson, L.R.; Suijkerbuijk, B.M.J.M.; Berg, S.; Marcelis, F.; Schniepp, H. Atomic force spectroscopy using colloidal tips functionalized with dried crude oil: A versatile tool to investigate oil–mineral interactions. Energy Fuels 2016, 30, 9193–9202. [Google Scholar] [CrossRef]
- Lu, Z.; Liu, Q.; Xu, Z.; Zeng, H. Probing anisotropic surface properties of molybdenite by direct force measurements. Langmuir 2015, 31, 11409–11418. [Google Scholar] [CrossRef] [PubMed]
- Stevens, R.M. New carbon nanotube AFM probe technology. Mater. Today 2009, 12, 42–45. [Google Scholar] [CrossRef]
- Gao, Z.; Xie, L.; Cui, X.; Hu, Y.; Sun, W.; Zeng, H. Probing anisotropic surface properties and surface forces of fluorite crystals. Langmuir 2018, 34, 2511–2521. [Google Scholar] [CrossRef] [PubMed]
- Siddiqui, M.A.Q.; Ali, S.; Fei, H.; Roshan, H. Current understanding of shale wettability: A review on contact angle measurements. Earth-Sci. Rev. 2018, 181, 1–11. [Google Scholar] [CrossRef]
- Li, Y.; Yang, J.; Pan, Z.; Tong, W. Nanoscale pore structure and mechanical property analysis of coal: An insight combining AFM and SEM images. Fuel 2020, 260, 116352. [Google Scholar] [CrossRef]
- Wang, S.; Liu, S.; Sun, Y.; Jiang, D.; Zhang, X. Investigation of coal components of Late Permian different ranks bark coal using AFM and Micro–FTIR. Fuel 2017, 187, 51–57. [Google Scholar] [CrossRef]
- Liu, X.; Nie, B.; Wang, W.; Wang, Z.; Zhang, L. The use of AFM in quantitative analysis of pore characteristics in coal and coal–bearing shale. Mar. Pet. Geol. 2019, 105, 331–337. [Google Scholar] [CrossRef]
- Alhammadi, A.M.; AlRatrout, A.; Singh, K.; Bijeljic, B.; Blunt, M. In situ characterization of mixed–wettability in a reservoir rock at subsurface conditions. Sci. Rep. 2017, 7, 10753. [Google Scholar] [CrossRef]
- Zhu, M.; Liu, Y.; Chen, M.; Xu, Z.; Li, L.; Zhou, Y. Metal mesh–based special wettability materials for oil–water separation: A review of the recent development. J. Pet. Sci. Eng. 2021, 205, 108889. [Google Scholar] [CrossRef]
- Wenzel, R.N. Resistance of solid surfaces to wetting by water. Ind. Eng. Chem. 1936, 28, 988–994. [Google Scholar] [CrossRef]
- Watanabe, T.; Yoshida, N. Wettability control of a solid surface by utilizing photocatalysis. Chem. Rec. 2008, 8, 279–290. [Google Scholar] [CrossRef]
Disclaimer/Publisher’s Note: The statements, opinions and data contained in all publications are solely those of the individual author(s) and contributor(s) and not of MDPI and/or the editor(s). MDPI and/or the editor(s) disclaim responsibility for any injury to people or property resulting from any ideas, methods, instructions or products referred to in the content. |
© 2023 by the authors. Licensee MDPI, Basel, Switzerland. This article is an open access article distributed under the terms and conditions of the Creative Commons Attribution (CC BY) license (https://creativecommons.org/licenses/by/4.0/).

