1. Introduction
Power systems are experiencing increasing penetration of renewable energy. The strong uncertainty of renewables makes the power system dispatching problem complex. So, the research of optimal dispatching methods for power systems with high renewable energy penetration is of great importance [
1,
2,
3,
4,
5].
Traditional optimization-based dispatching methods suffer from modeling difficulties and calculating complexity, which make it difficult to meet the real-time decisions of complex power systems [
6,
7,
8]. In contrast, data-driven dispatching methods represented by reinforcement learning have the advantages of strong adaptability to environmental uncertainty, high real-time decision efficiency, and a balance between short-term and long-term benefits [
9,
10,
11,
12,
13,
14].
Data-driven dispatch methods can be further divided into single-scene and multi-scene dispatch. Single-scene data-driven decisions are relatively simple and widely used, but the problem of dispatching operating scenario data differences is usually ignored. Ref. [
15] proposed microgrid dispatch strategies based on asynchronous dominant actor-critic (A3C) algorithms. Ref. [
16] proposed a robust economic dispatch strategy for virtual power plants and ref. [
17] proposed an energy storage system control strategy for a combined wind–solar storage system scenario based on deep reinforcement learning (DRL). Ref. [
18] proposed an optimal dispatch method for integrated energy systems by using the proximal policy optimization (PPO) algorithm for considering security constraints.
The above data-driven dispatch methods in a single scenario usually suffer from the problem of a limited number of scenarios in the training samples, which leads to a large difference between the actual operating scenarios of the power system and the training scenarios, known as the distributional drift problem [
19]. Therefore, a multi-scenario dispatch method is proposed. Ref. [
20] proposed a joint optimization model for a multi-scenario microgrid with wind–photovoltaic–load storage with particle swarm optimization (PSO). Ref. [
21] proposed a generation–load coordinated optimal dispatch method, considering the multi-scenario uncertainty of wind power. Ref. [
22] proposed a dispatch method in multiple generation–load scenarios using the deep deterministic policy gradient (DDPG) algorithm, prioritizing operational security and efficiency. Ref. [
23] aimed at reducing the wind power curtailment rate, considering different wind farms under different scenarios.
Current multi-scenario dispatch methods still have some limitations, and there are still fewer studies on how to utilize massive, high-dimensional data to better screen the features representing generation–load and give accurate decisions. Therefore, it is necessary to analyze complex scenarios and optimize scheduling under multi-scenarios.
To address this issue, this paper proposes a scenario division method for power system dispatch. Firstly, the features of massive source and load are mined according to historical data, and a data-driven feature set is constructed. Secondly, the clustering model is used to divide multiple scenarios and construct the scheduling model for each scenario. Finally, based on the intelligent decision algorithm, the unit scheduling decision is realized. The contributions are as follows:
To address the limitations of data-driven dimensionality reduction methods, a data-driven dimensionality reduction method combined with power system physical indicators is proposed to construct system operational features. The extracted features are more interpretable and comprehensive than the traditional data-driven scenario division method.
Based on the above integrated physical and data-driven features, the Gaussian Mixture Model (GMM)-based power system scenario division method is proposed, which can effectively identify the differences in the features of each operation section.
Based on scenario division, a multi-scenario data-driven dispatching model using a proximal strategy optimization algorithm is proposed for the rapid decision making of power system dispatch.
The remainder of the paper is organized as follows.
Section 2 proposes the framework of multi-scenario data-driven dispatch.
Section 3 constructs the power system’s operational features.
Section 4 proposes scenario division methods.
Section 5 proposes a data-driven dispatch model of the power system.
Section 6 validates the methods by simulations. Finally,
Section 7 concludes the paper.
2. Framework of Power System Dispatch with Scenario Division
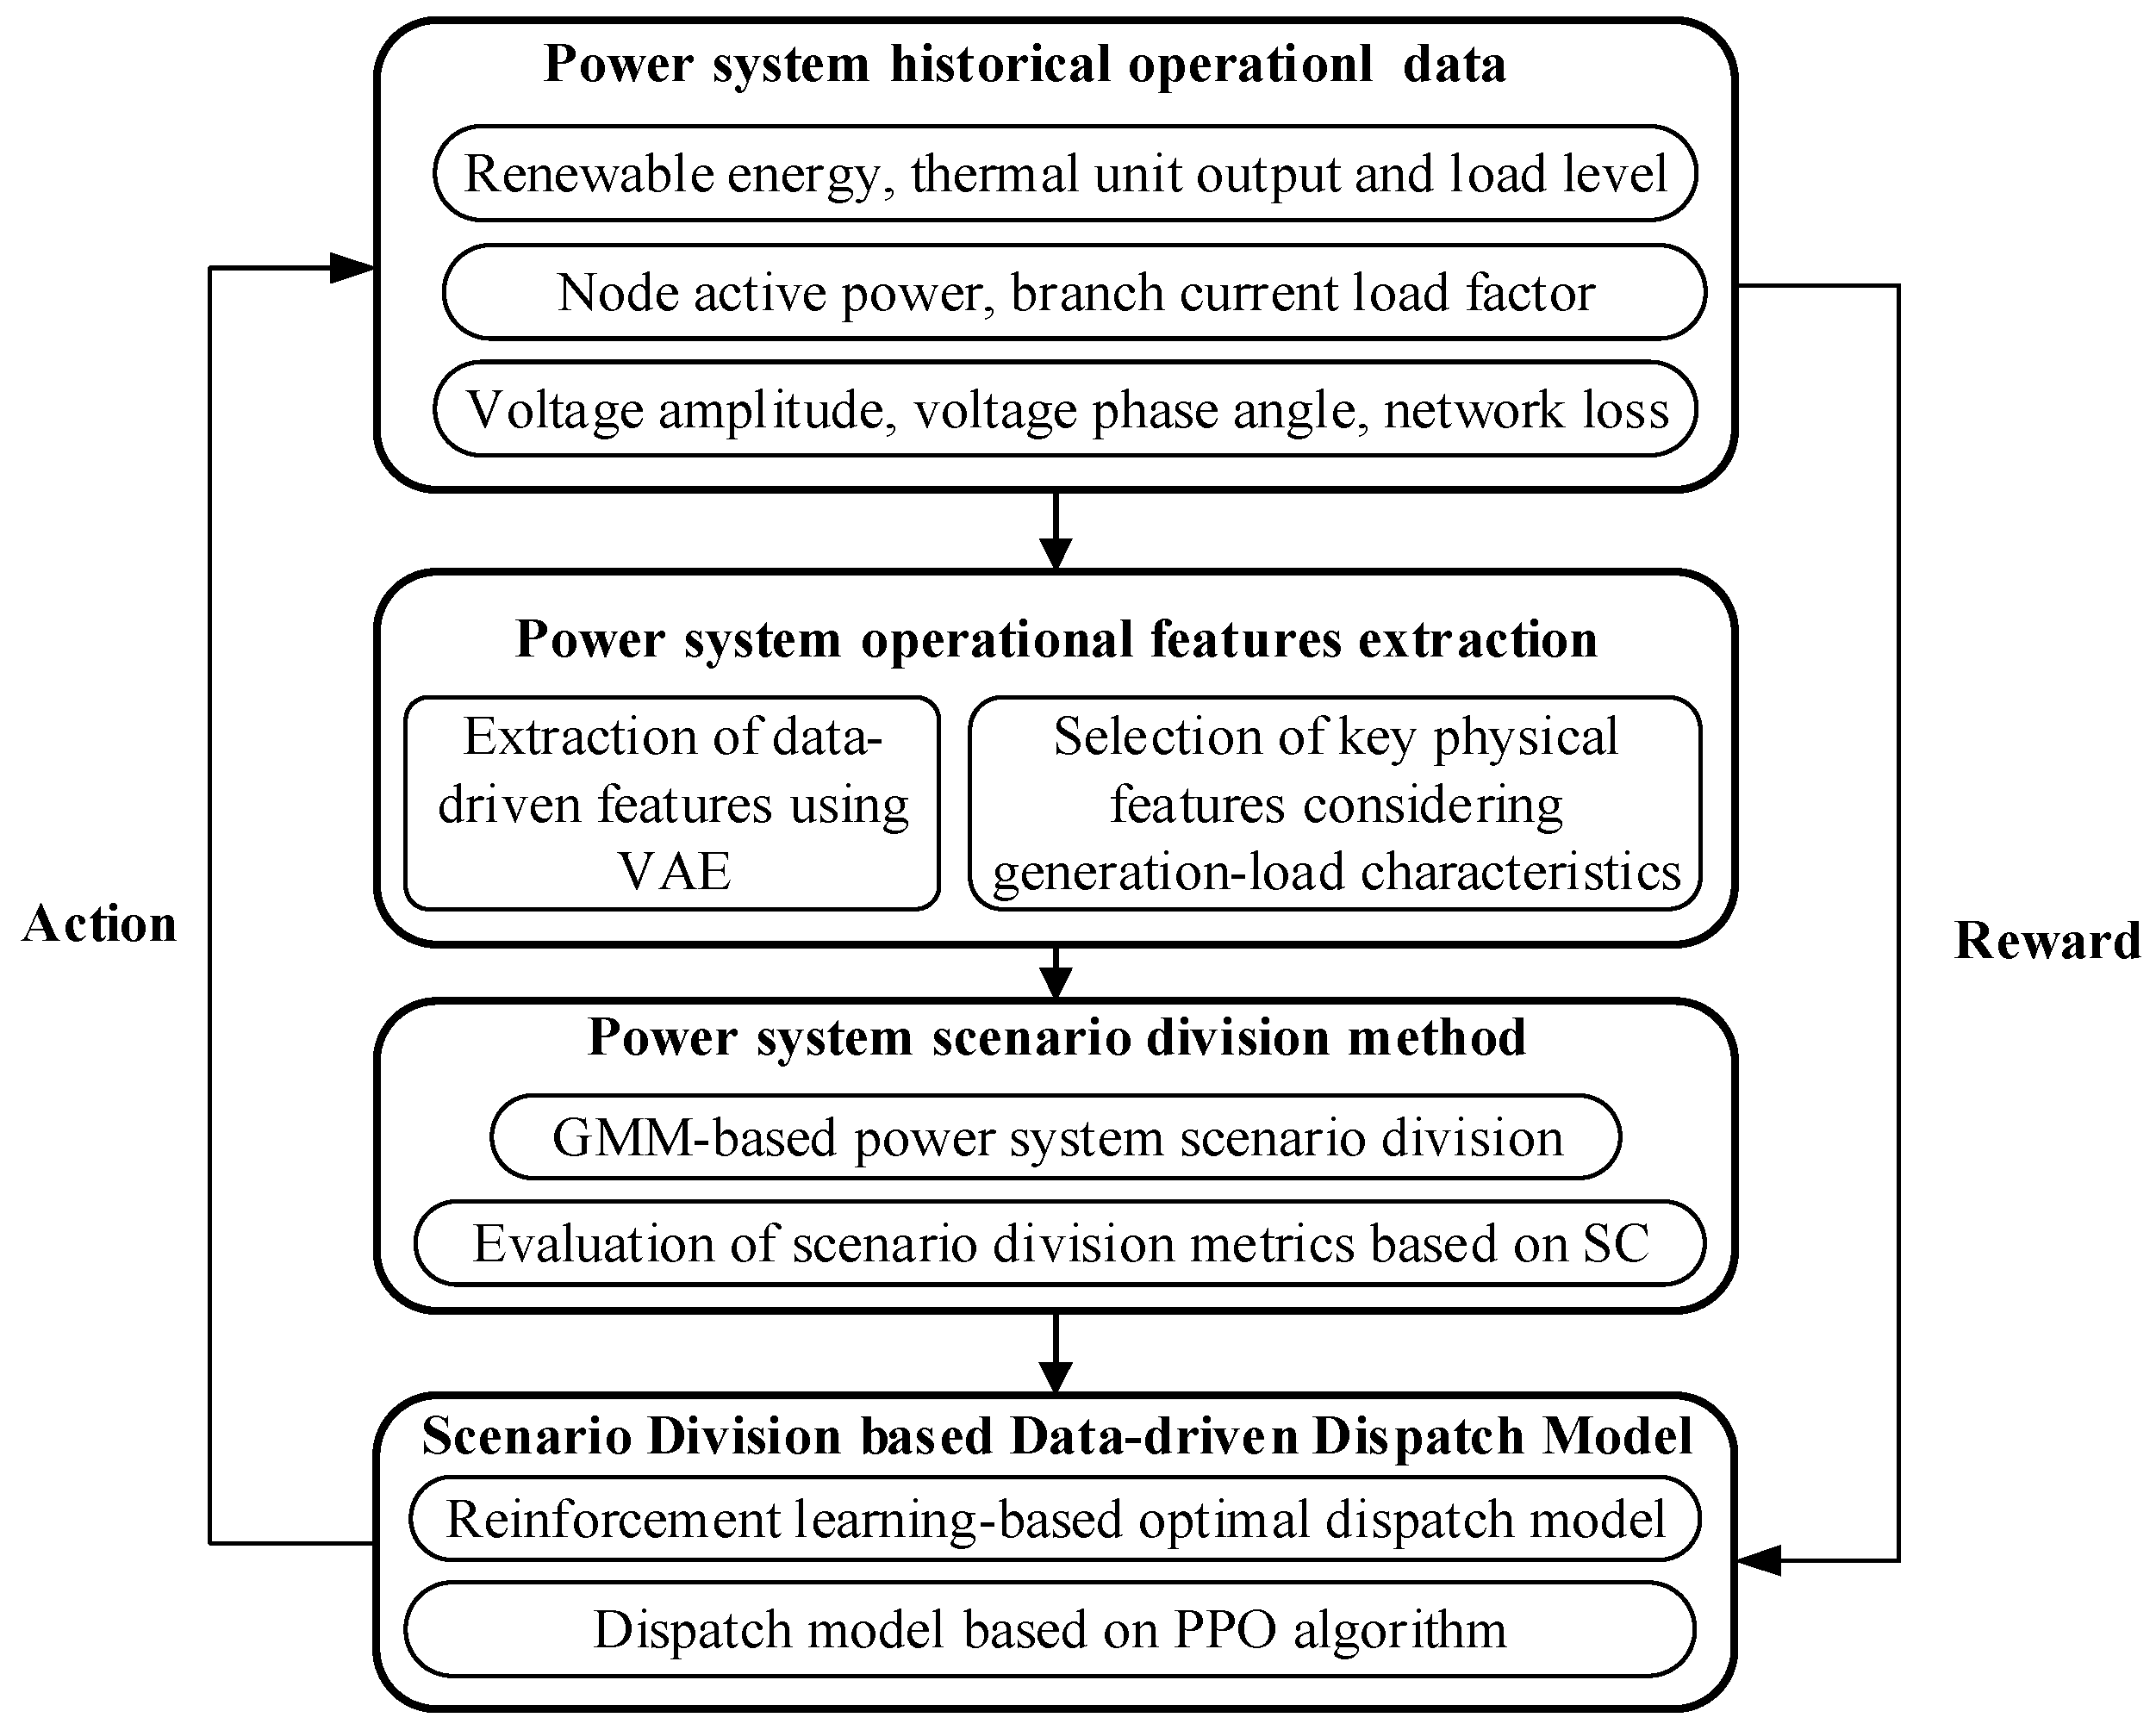
The framework of the proposed power system dispatch with scenario division is shown in
Figure 1.
Firstly, the power system historical operation sections are obtained, which cover the operating data of thermal and renewable generations, loads, and the grid. These operation sections represent the operating states of the grid at a certain historical instant [
24]. Next, the data-driven features are extracted using a variational autoencoder (VAE) based on probability distribution, and the power system’s key physical features are selected considering the generation–load features. Then, the GMM-based clustering method is used to divide the operation sections into scenarios, and the division is verified based on the Silhouette Coefficients (SC). Finally, in the offline stage, a reinforcement learning-based dispatch model is established for each divided scenario, and the scenario-specific agent is trained based on the PPO algorithm. In the online stage, the scenario-specific agent is used to realize fast online decision making for power system dispatch.
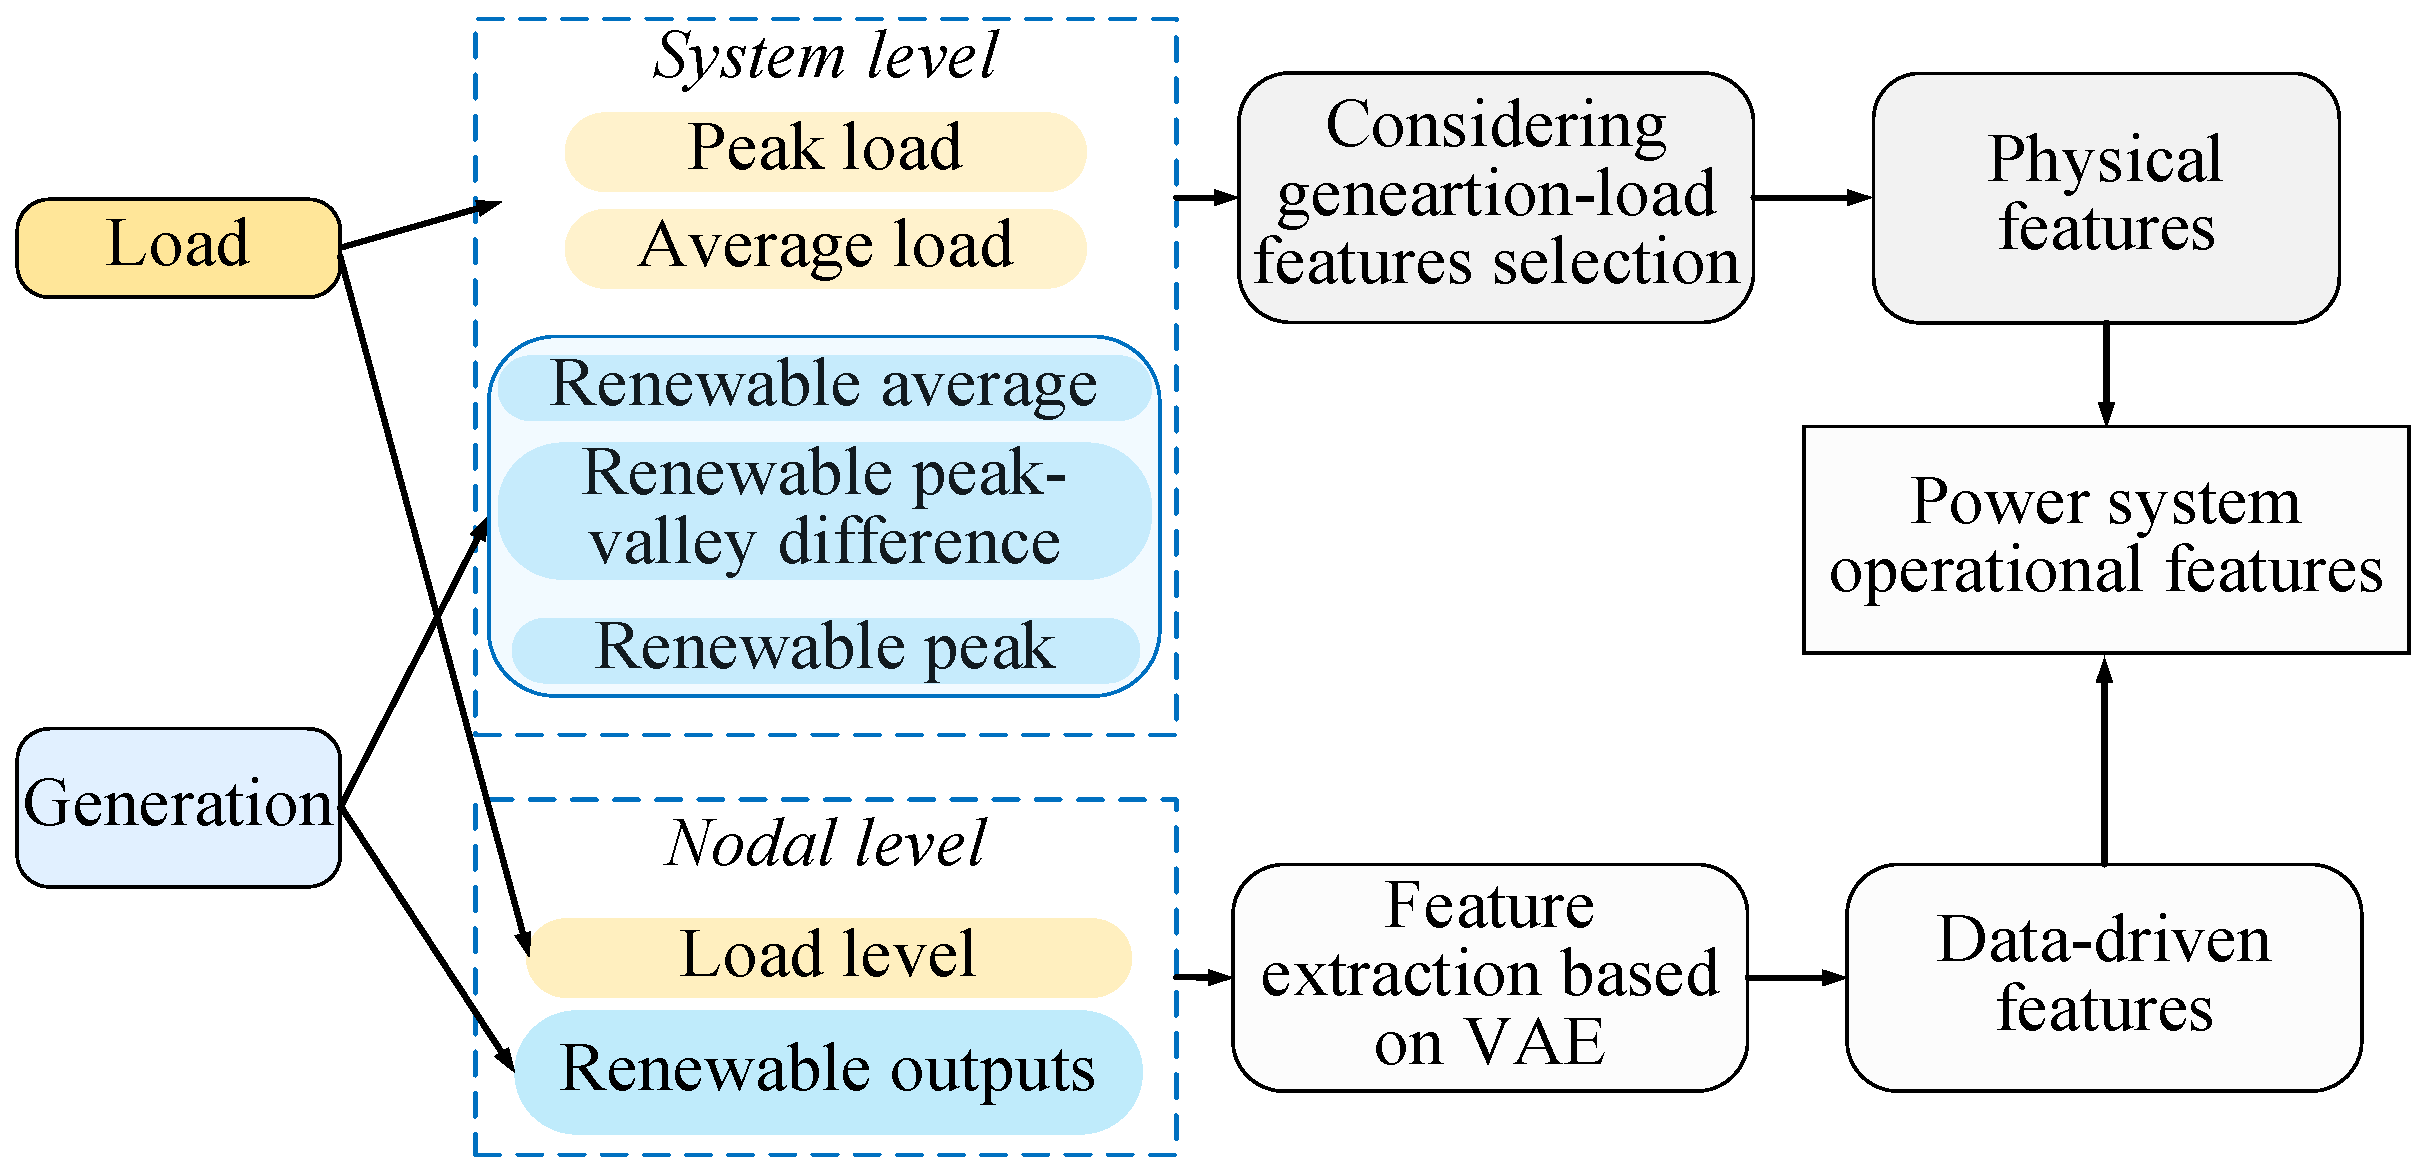
3. Power System Operational Features
The power system operational data have a massive scale, large dimension, and multiple spatiotemporal scales. A feature extraction method integrating the data-driven and physical features is proposed and shown in
Figure 2, which will provide a strong basis for the operational scenario division later. As shown in
Figure 2, the system level features reflect the overall operating trend of the power system, and the nodal level features reflect the overall load and generation level of the power system. Therefore, at the system level and nodal level, physical feature selection and the construction of VAE-based feature extraction models are used for key feature mining in this paper.
Among the system level, peak load and average load present the trend of load, and renewable average, renewable peak-valley difference, and renewable peak present the trend of renewables. Among the nodal level, load levels reflect the operating condition of the power system, and high load levels indicate a high demand for electricity in the system. Renewable outputs reflect the system’s renewable processing, and high renewable outputs indicate sufficient renewable energy resources.
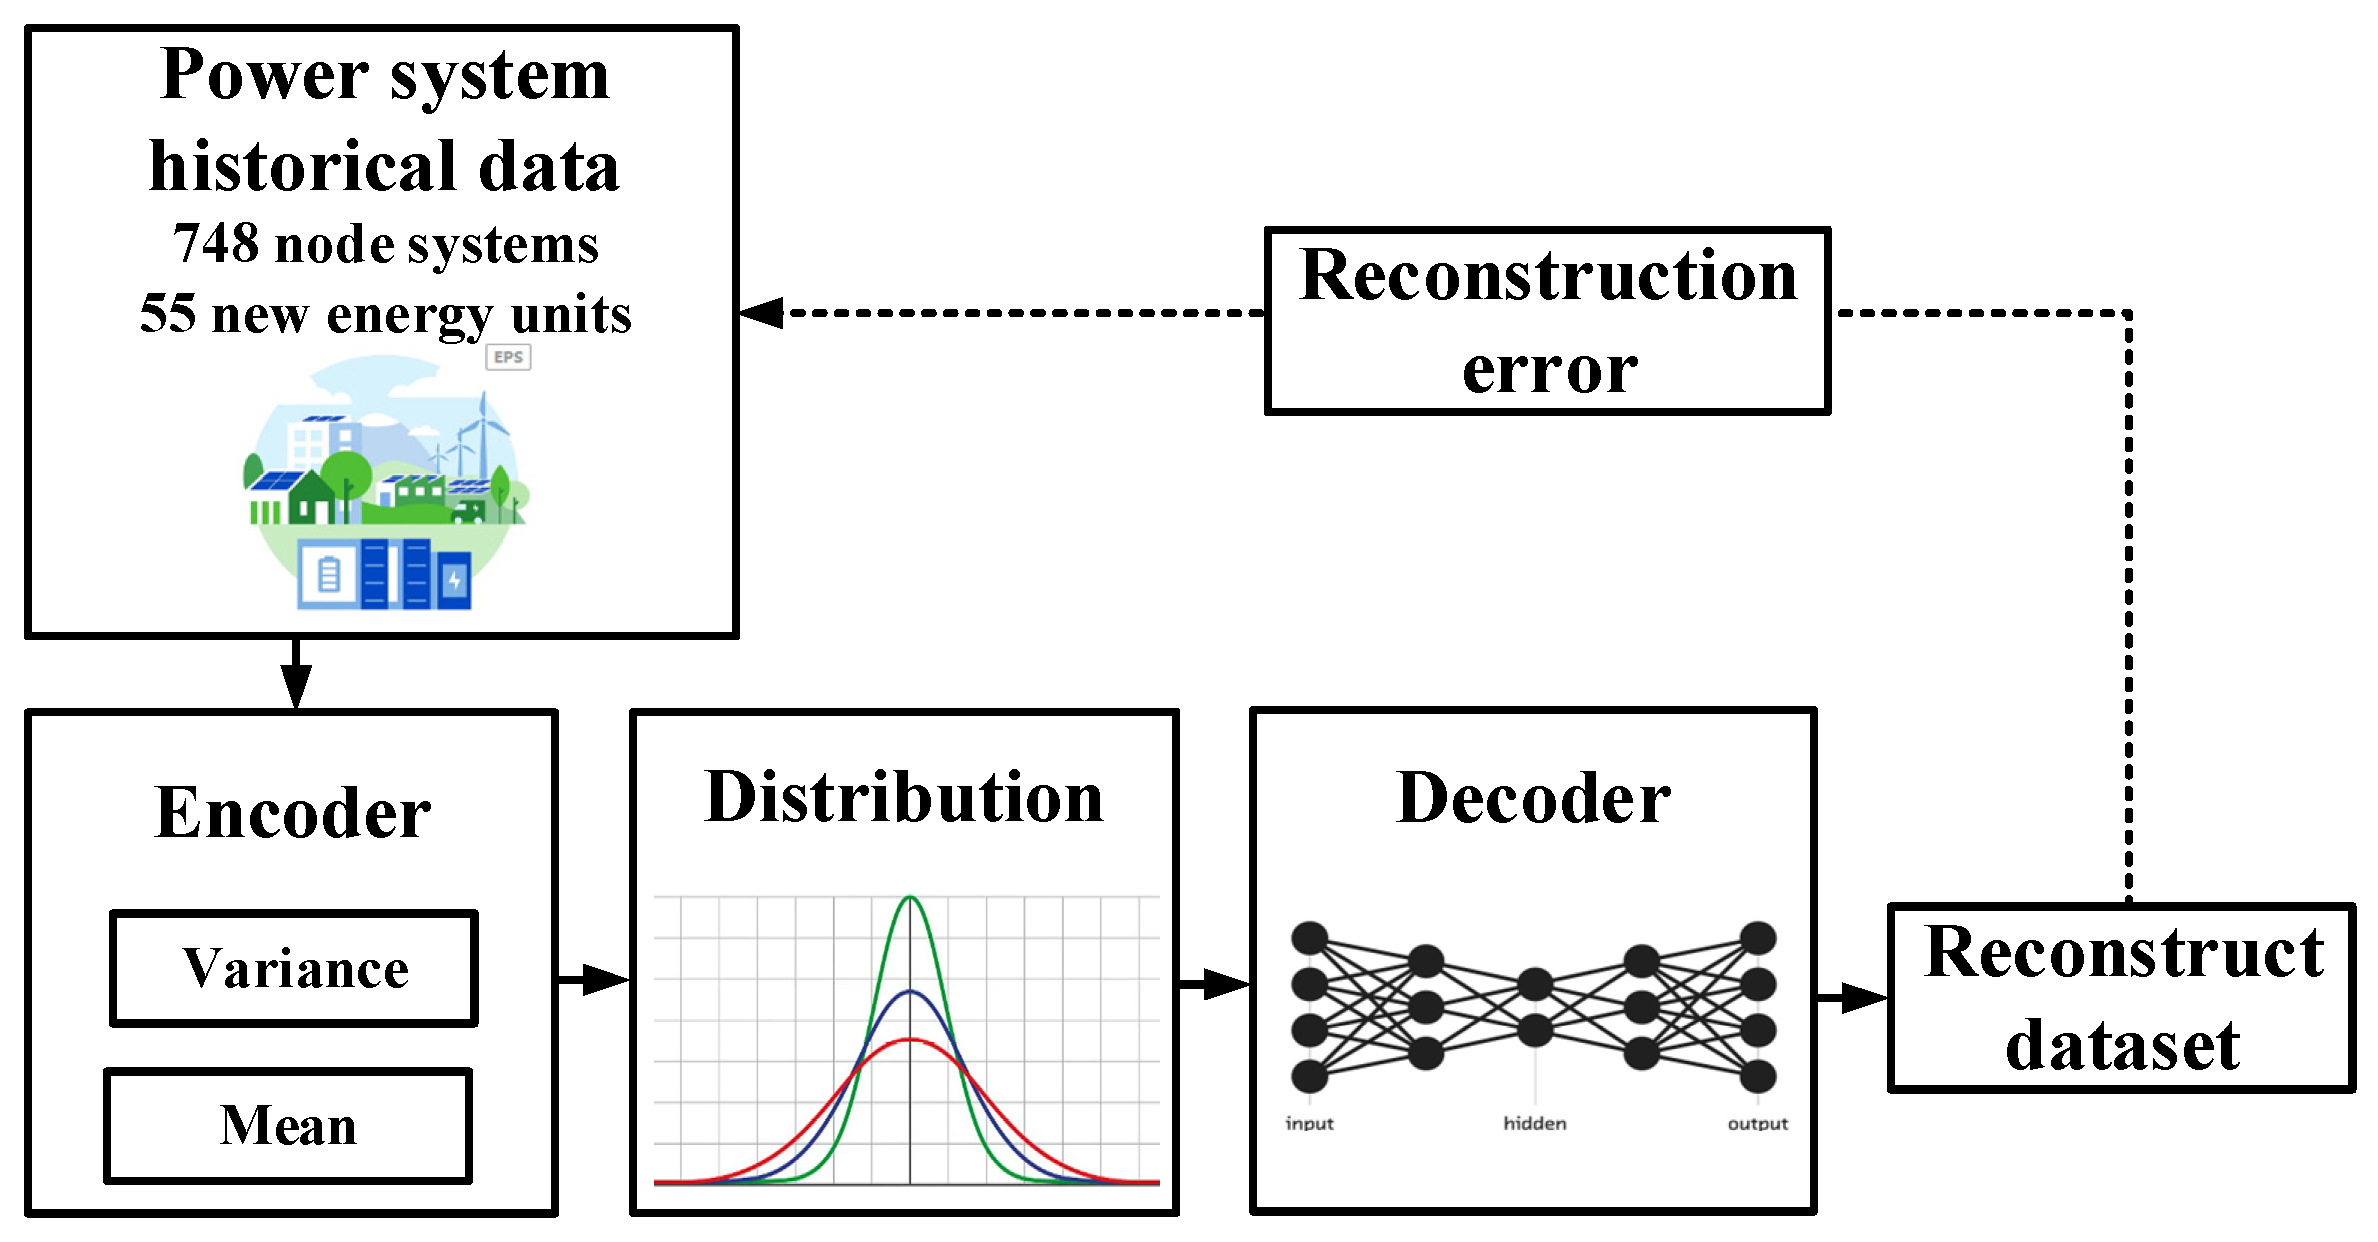
3.1. Data-Driven Feature Extraction Using VAE
By maximizing information retention and minimizing reconstruction loss of the decoder, VAE can reduce the hidden layer feature space dimension and extract features. Thus, the negative impact of generation–load uncertainty on subsequent power system dispatch operations can be effectively eliminated. The structural diagram of the feature extraction model based on VAE is shown in
Figure 3. As shown in
Figure 3, the mean and variance are extracted by the decoder to fit the data distribution. Then, the dataset is reconstructed through a decoder. During the network iteration process, the network is iteratively corrected by using the reconstruction error between the original dataset and the reconstructed dataset.
As shown in
Figure 3, the VAE contains an encoder and a decoder. The encoder is the inferred network
with parameter
, which is used to generate the variable probability distribution of the hidden variable
z. The decoder is the generative network
with parameter
, which reduces the approximate probability distribution of the original data
z. The two probability distribution density models are constructed by multilayer neural networks [
25,
26,
27,
28], which can effectively characterize the high-dimensional data of the operation section.
The specific steps of VAE-based data-driven feature extraction proposed in this paper are as follows:
- (1)
Pre-processing the original power system historical operation section data so that the data satisfy a normal distribution with a mean of 0 and a variance of 1.
- (2)
Using the pre-processed data as the input to the VAE model, the encoder maps the input data to the mean vector and variance vector in the latent space.
- (3)
Sampling from the latent space to obtain the hidden variables containing Gaussian noise.
- (4)
The decoder maps the hidden variables in Step 3 back to the original high-dimensional data space and calculates the reconstruction loss.
- (5)
Minimizing the loss function using the backpropagation algorithm, updating the model parameters by stochastic gradient descent until the reconstruction loss is less than a threshold, and ensuring that the maximization evidence is under session.
The hidden variables obtained by the above steps are used as key data-driven features to characterize the high-dimensional data of the power system operation section data.
3.2. Physical Features Considering Generation–Load Features
Generation and load uncertainty is the main factor causing the difference in data distribution of the power system operation sections. The limitations of the neural network-based VAE data dimensionality reduction method are more prominent when constructing features that divide multiple scenarios. Although its powerful nonlinear transformation capability can effectively extract the data-driven features of high-dimensional data, the data-driven features only consider the complex mapping relationship from the data level, which inevitably causes a certain degree of loss of the original information. Therefore, it is very necessary to consider the key physical features that can effectively portray the generation–load features, fully explore the information related to the generation–load uncertainty in the power system, and construct more refined scenario division features to fully reflect the variability of different operation sections.
During the Chinese Spring Festival in 2023, the maximum penetration rate of renewable energy in Guangdong Province reached 30%, which is a historical peak level. Under the influence of strong cold air, renewable output increases steeply from 2600 MW to 9190 MW, causing a lack of system adjustment capacity. This example demonstrates the complexity and fast changes of operational scenarios under increasing penetration of renewable energy. So, it is necessary to select key physical features to reflect the variability of power system operation sections considering the features of generation and load. According to refs. [
29,
30,
31,
32], the key physical features that consider the generation and load features are selected as shown in
Table 1.
In this paper, the above physical features are combined with VAE-based extraction of operation section features to construct features that divide multiple scenarios. This can improve the overall performance of the data-driven dispatch model based on scenario division.
4. GMM-Based Power System Scenario Division
The data-driven features extracted by VAE and the key physical features considering the generation–load features are used as the basis for scenario division. The GMM-based scenario division method is proposed in this section. The divided scenarios will support the construction of dispatch models later.
Firstly, based on the Akaike Information Criterion (AIC), the optimal number of scenario categories considering the fitting accuracy and the number of parameters is as follows:
Then, the GMM is used to divide the features, and the screened features are input into the GMM for scenario division; each operational scenario category and operation section with obvious differences in generation–load features can be obtained, where the probability distribution of GMM is as follows:
The number of sub-Gaussian models in the mixed model is K; is the probability density function; , , , and are the first probability distribution model and its expectation, variance (or covariance), and model distribution weights, respectively, satisfying and .
Finally, the SC [
32] is used as a criterion for the effectiveness of scenario division to verify the rationality of scenario division. The contour coefficient reflects the degree of data density within the same scenario and the degree of data dispersion between different scenarios and can be used as an evaluation index to judge the effectiveness of scenario division:
where
a is the average distance between the current data and other data in the same category;
b is the average distance between the current data and the closest data in another category.
5. Power System Dispatch with Improved Scenario Division
5.1. Reinforcement Learning-Based System Dispatch Model
The power system dispatch problem is a sequential decision-making problem which can be modeled as a Markovian decision process and solved using reinforcement learning. The Markov decision process is constructed as follows.
5.1.1. State Space
The state space at the time instant
t includes the powers of thermal units, renewable units, loads, and branches:
where
and
are the active and reactive powers of unit
G at the time
t;
and
are the active and reactive powers of the load at each node at the time
t;
is the voltage amplitude of each node at the time
t;
is the grid loss (network loss value) at the time
t;
indicates the actual branch current versus the rated current capacity at the time
t.
5.1.2. Action Space
The agent action space
at time instant
t contains the active power
for thermal units and the active power
for renewable units:
5.1.3. Reward
To meet the multi-dispatch objectives of safety, reliability, economy, and environmental protection of the power system, the reward function is set as follows:
Line-crossing limit situation (positive reward):
where
denotes the number of branches and
denotes the current loading rate of the branch
l at the time
t.
Consumption of renewable units (positive incentives):
where
denotes the number of renewable units;
and
denote the active output and maximum output of
k renewable units at the time
t, respectively.
Balance unit power over the limit (negative reward):
where
denotes the number of balancing units;
denotes the actual active output and the maximum output of balancing units
i at the time
t.
Unit operating costs (negative incentives):
where
denotes the total number of units,
denotes the actual active output of the unit
, and
,
, and
denote the cost factor of the unit
i, respectively.
Time steps (positive reward):
where
is the step length of the agent’s exploration.
The reward terms
and
are normalized as follows:
In summary, the domain values of the reward terms
,
, and
are [0, 1], and the domain values of the reward terms
and
are [–1, 0]. The total reward formula is as follows:
where
is the award of the
term at time
, and
is the coefficient.
The setting coefficient
appropriately can balance the weight of each reward function and avoid overlooking certain rewards. For certain specific goals,
can also help the agent focus on a certain type of goal and focus on learning, which can enable the agent to learn the best strategy faster. In this paper, considering the dispatch needs of safety, green, and economy,
is set as follows:
where
reflects the safety of dispatch decisions, so
is set to 4;
reflects the green environmental protection degree and economy of dispatch decisions, so
is set to 2. In this paper, other goals are given secondary attention, so they are set to 1.
5.2. Reinforcement Learning-Based System Dispatch Model
The operational scenario-specific power system dispatch model based on the PPO algorithm is constructed in this subsection.
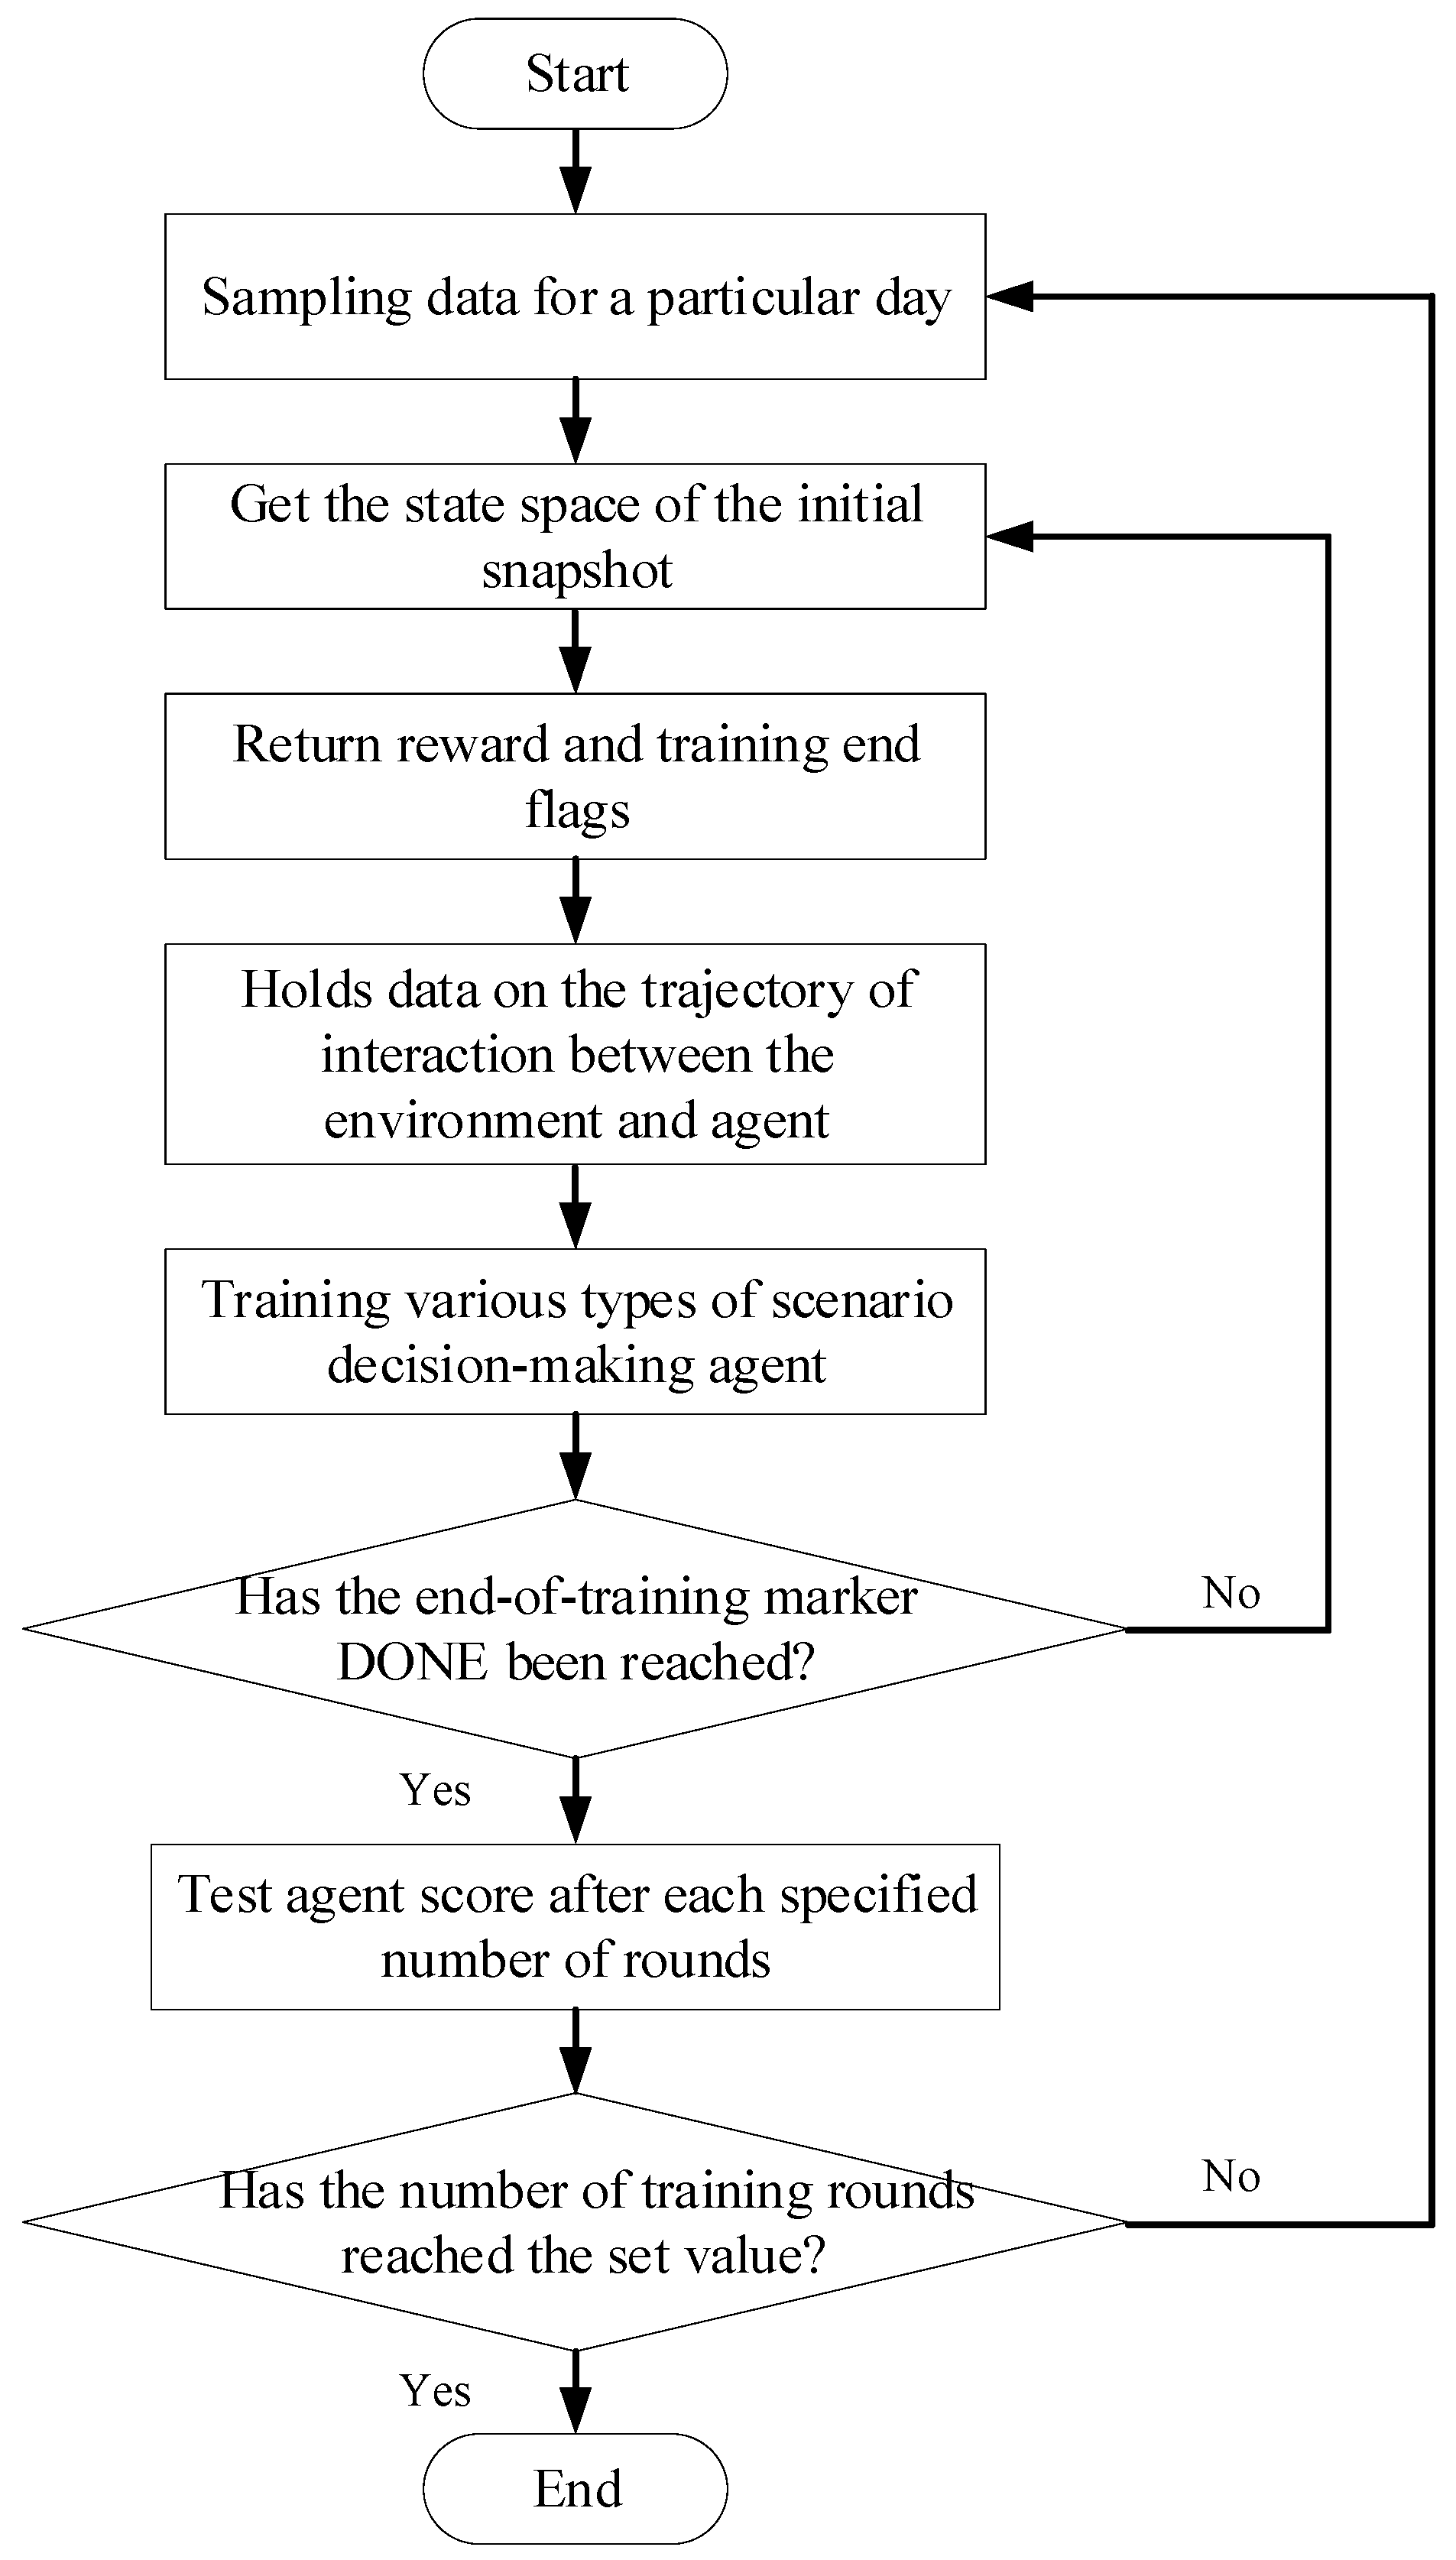
5.2.1. Off-Line Training
Each operational scenario agent is established and trained through continuous interaction with the power system simulation environment. The training steps are shown in
Figure 4.
5.2.2. Online Decision
The execution of the dispatch takes the following steps:
The dispatching center obtains the power system operation section state information.
The power system operational scenario features are extracted based on the VAE, which fuses key physical features, and the GMM is used to determine the operational scenarios to which they belong.
The scenario agent makes decisions based on the obtained power system operational state information, outputs joint actions, and issues power dispatching adjustment instructions.
Each generating unit enters a new state after output regulation according to the schedule and at the same time, feeds the reward to the scenario agent.
6. Simulation
6.1. Simulation Setup
To verify the effectiveness of the proposed scenario division-based power system dispatching method, a real power system model in a province of China is used for validation. The system contains 748 nodes, 55 renewable units, and 187 thermal units with a dispatch interval of 15 min. 300 days of data are selected from the grid historical data, and the dataset is pre-processed and normalized before training.
The simulations are conducted in Pytorch framework on a PC with an i7-11700 CPU and 32 GB memory. The encoder and decoder of VAE use the same network structure with Relu activation function, a learning rate of 0.00001, and 9000 training rounds.
6.2. Simulation Result Analysis
(1) Feature extraction result based on VAE.
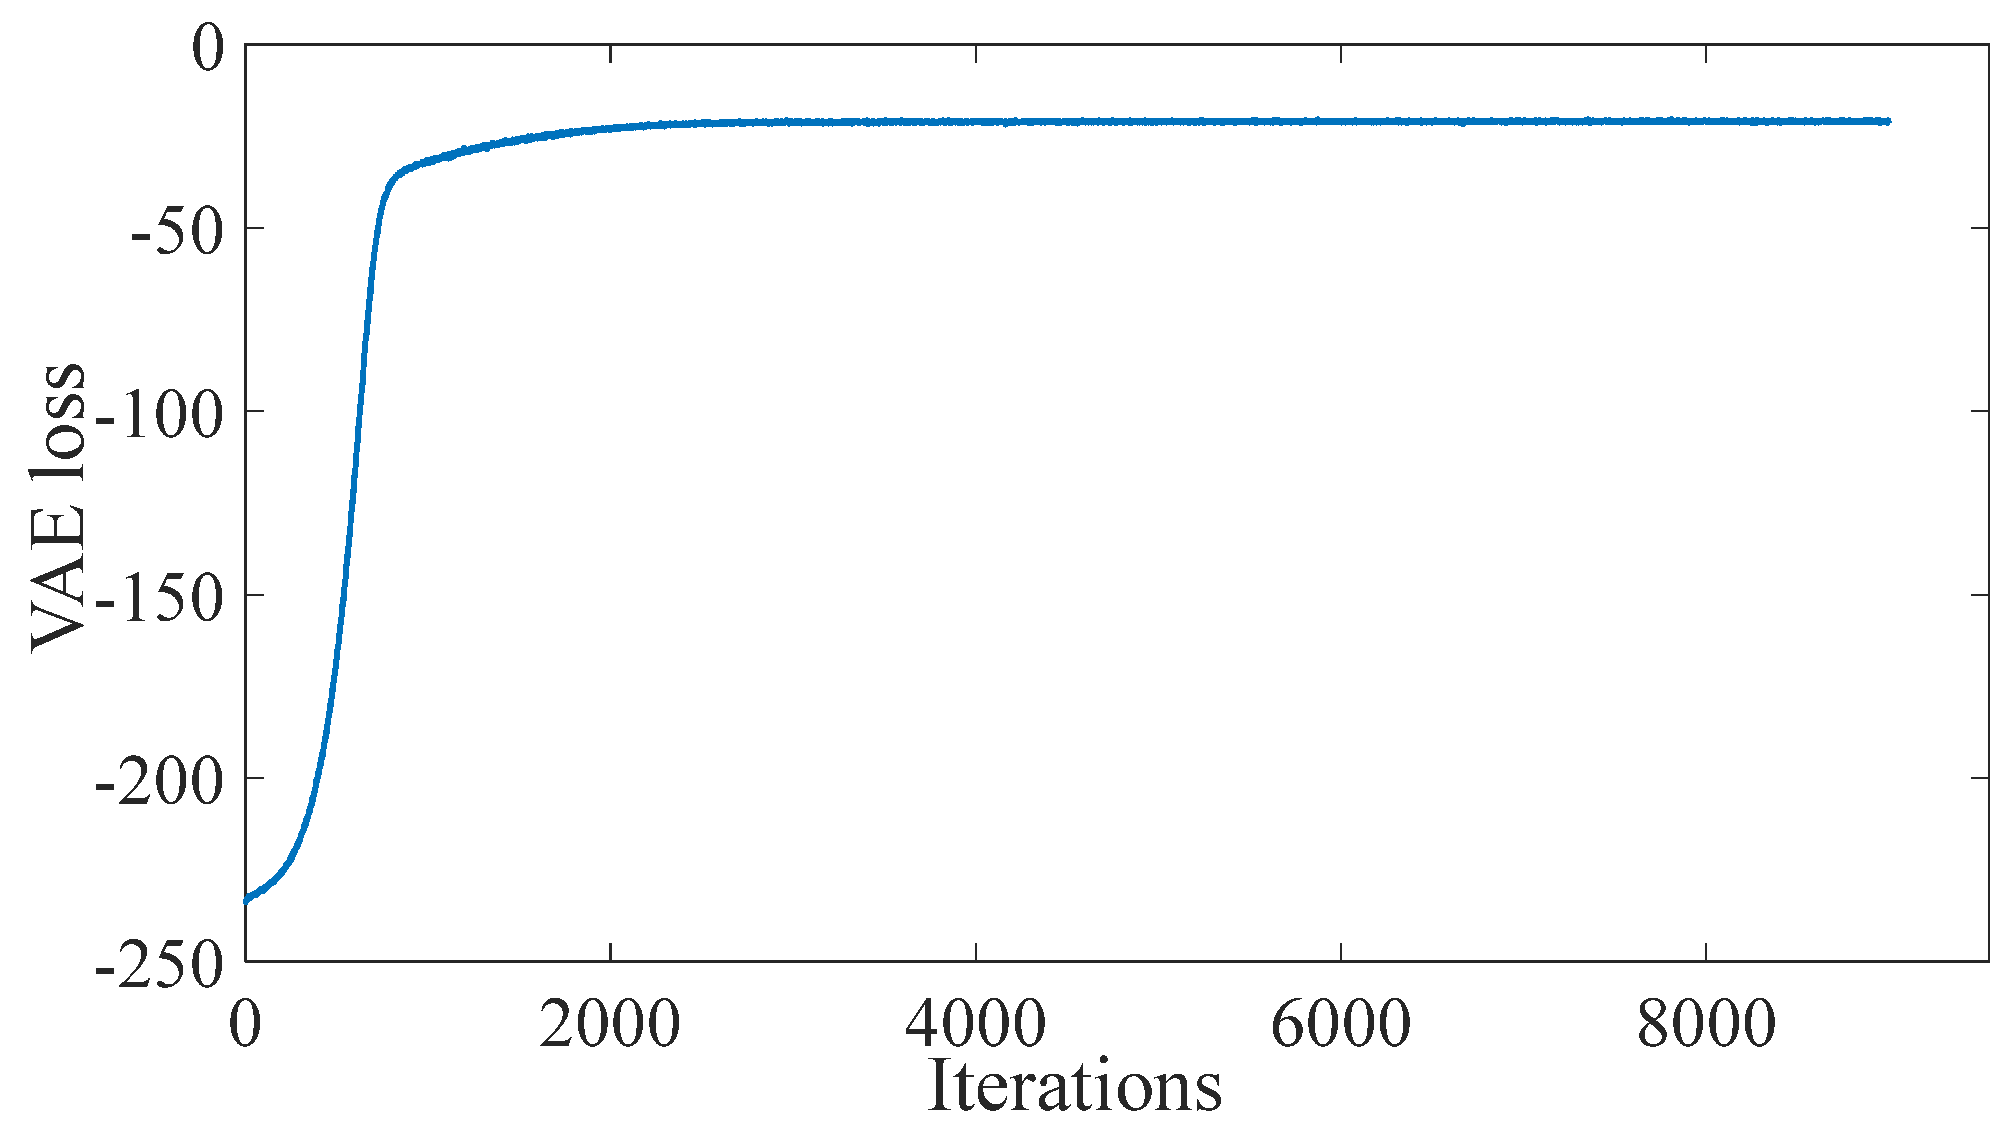
The system operation section has 303 dimensions of information (containing 55 renewable units and 248 loads). The trend of the loss function of the VAE model is shown in
Figure 5. As shown in
Figure 5, at the initial stage of 0–1000 iterations, the loss function gradually increases. This is because in the initial stage, the model is learning the feature representation of the data and attempting to minimize reconstruction errors. After approximately 2000 iterations, the loss function begins to converge. This means that the VAE model has learned about the potential structure and feature expression of the data. In the simulation of the paper, 48 dimensional data-driven features were extracted from 303 dimensional original data through the VAE model.
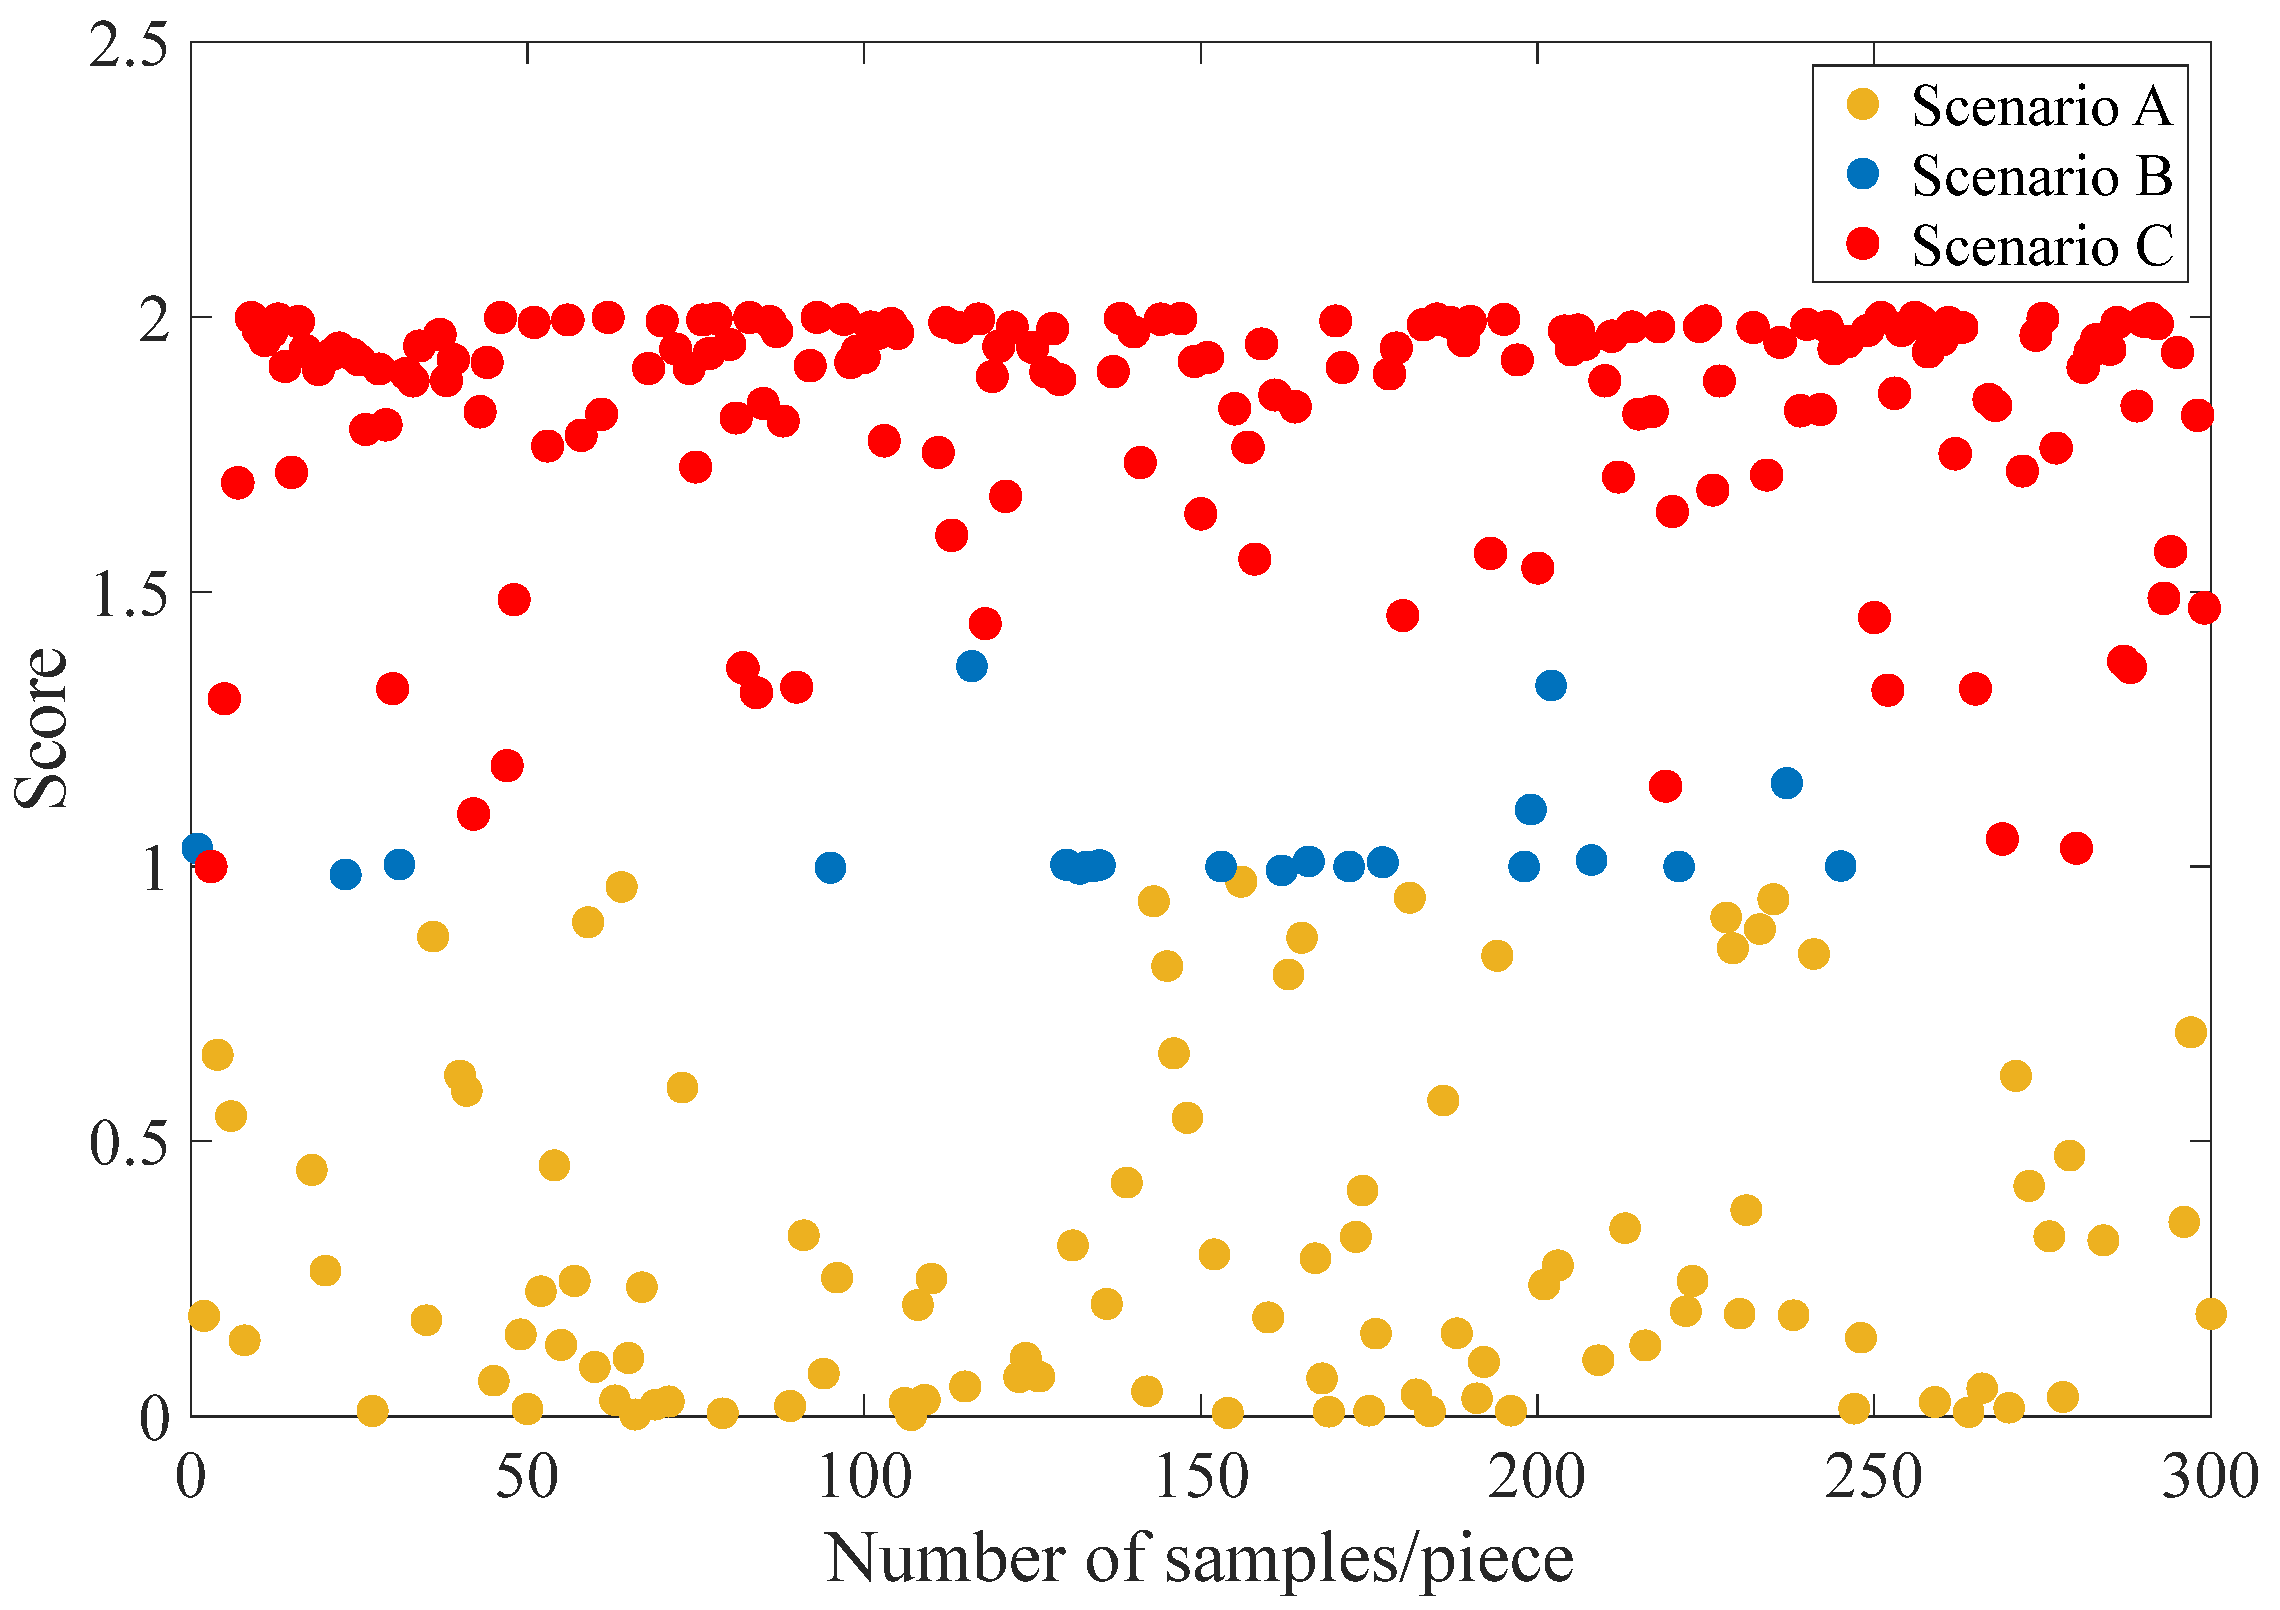
(2) Scenario division results based on GMM.
The optimal number of scenario division categories is determined to be three, based on the AIC criterion. The 300−day data are divided into three scenarios based on the GMM; the results of scenario division are shown in
Figure 6. The basic idea of the GMM is to decompose data into a mixture of multiple Gaussian distribution components, where each Gaussian distribution component corresponds to a scenario. Therefore, the three types of scenarios divided by features based on the scenario division model represent the probability distribution of the three types of features. As shown in
Figure 6, scenario B has relatively fewer days of scenario division compared with scenarios A and C. But the difference in score intervals among different scenarios is obvious, which effectively verifies the rationality of scenario division.
Table 2 shows the comparison of the proposed method and the scenario division only based on VAE extraction features by using the SC values. From the table, it can be seen that the features constructed based on the method of this paper can effectively improve the division effect, and the correlation of each operation section in the operational scenario is higher.
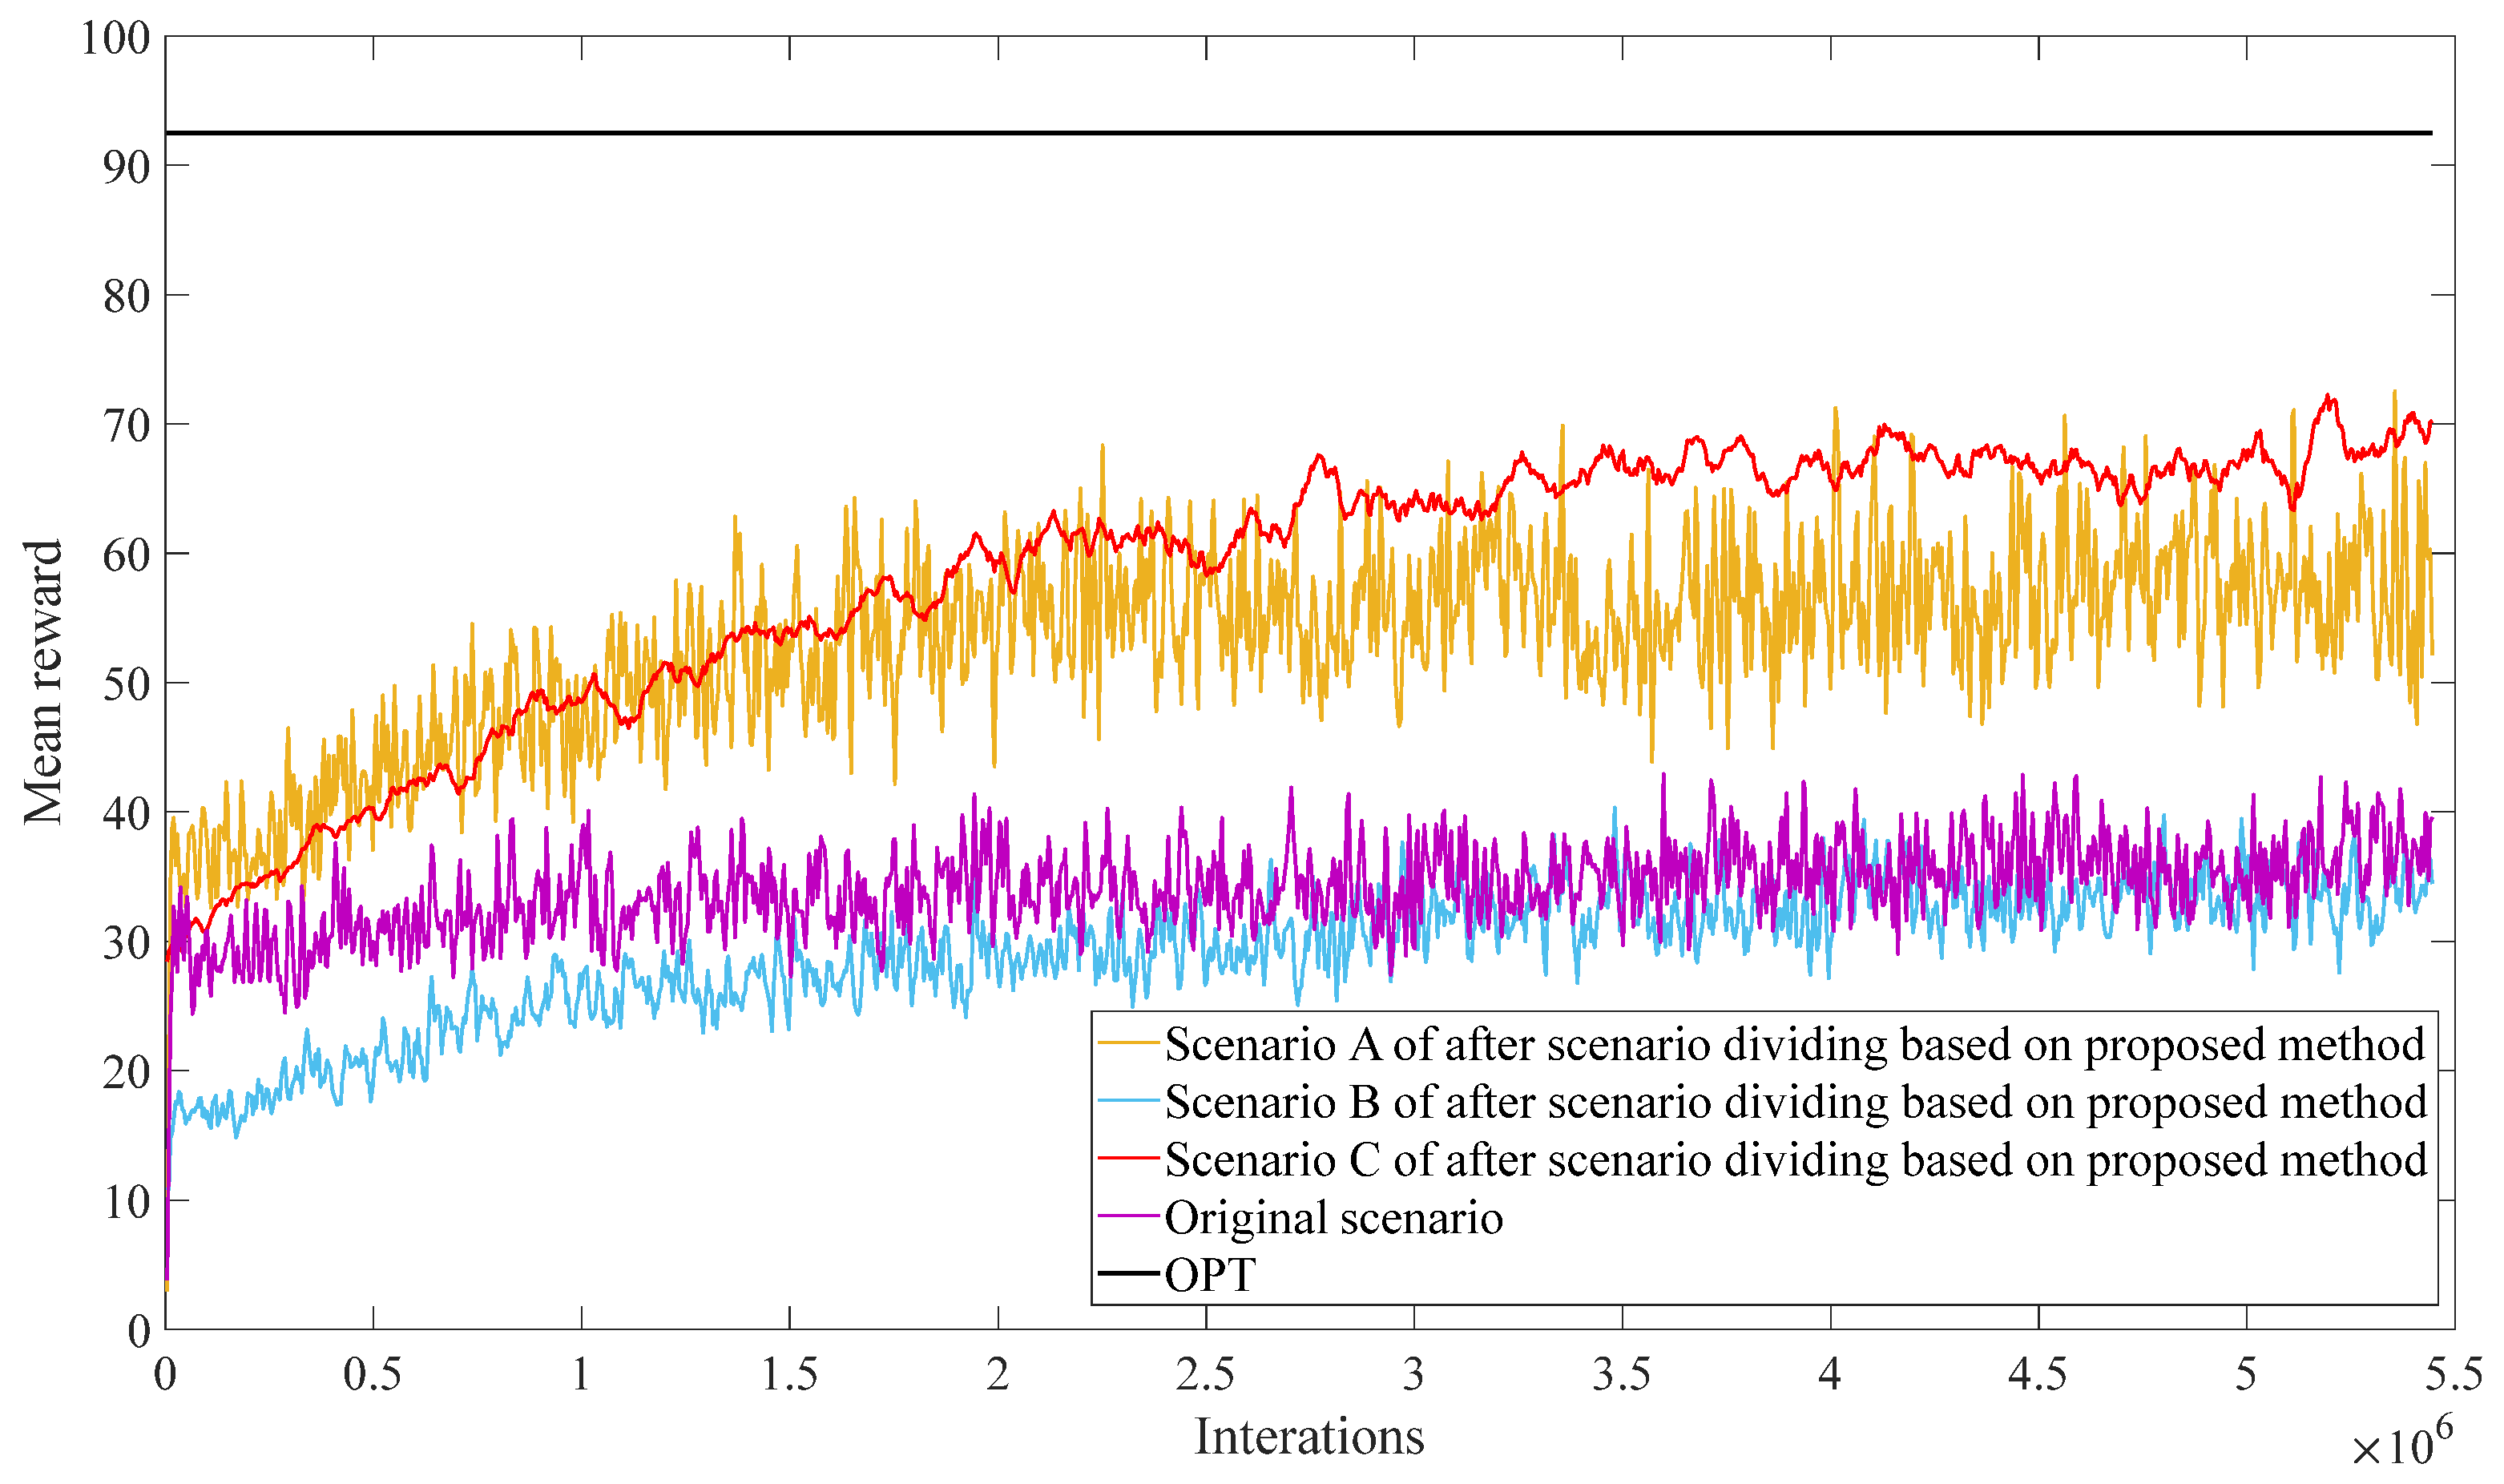
(3) Dispatch results based on the proposed method.
To verify the effectiveness of the proposed method, the proposed method was compared with the convex optimization problem (OPT) and single scenario methods (original scenario), respectively. The comparison of results from different scenarios and methods are shown in
Figure 7 and
Table 3. As shown in
Figure 7, from the comparison of the mean reward of scenario A and C based on the proposed method with the original scenario, it can be seen that scenario division can effectively improve the training effectiveness of agents and accelerate agents learning efficiency. The reason why the mean reward of scenario B is lower than the mean reward of the original scenario is that there are fewer samples in scenario B, making it difficult for reinforcement learning agents to achieve optimal decision making through training. In addition, the reason why the mean reward based on the OPT is higher than the mean reward based on the proposed method is that the OPT is usually based on mathematical models and objective functions for solving and have the ability to achieve global optimization. In contrast, reinforcement learning is a method of searching through trial and error and learning, which may make it difficult to find the global optimal solution in problems with large search space and complexity. But the average single-step solving time of the OPT is 19.82 s, and the decision time of the method proposed in this paper is 0.003 s. Compared to the OPT, the decision-making efficiency of the method proposed has been improved by 99.98%. In summary, the method proposed in this paper can effectively improve the efficiency of the reinforcement learning agent’s training and decision making.
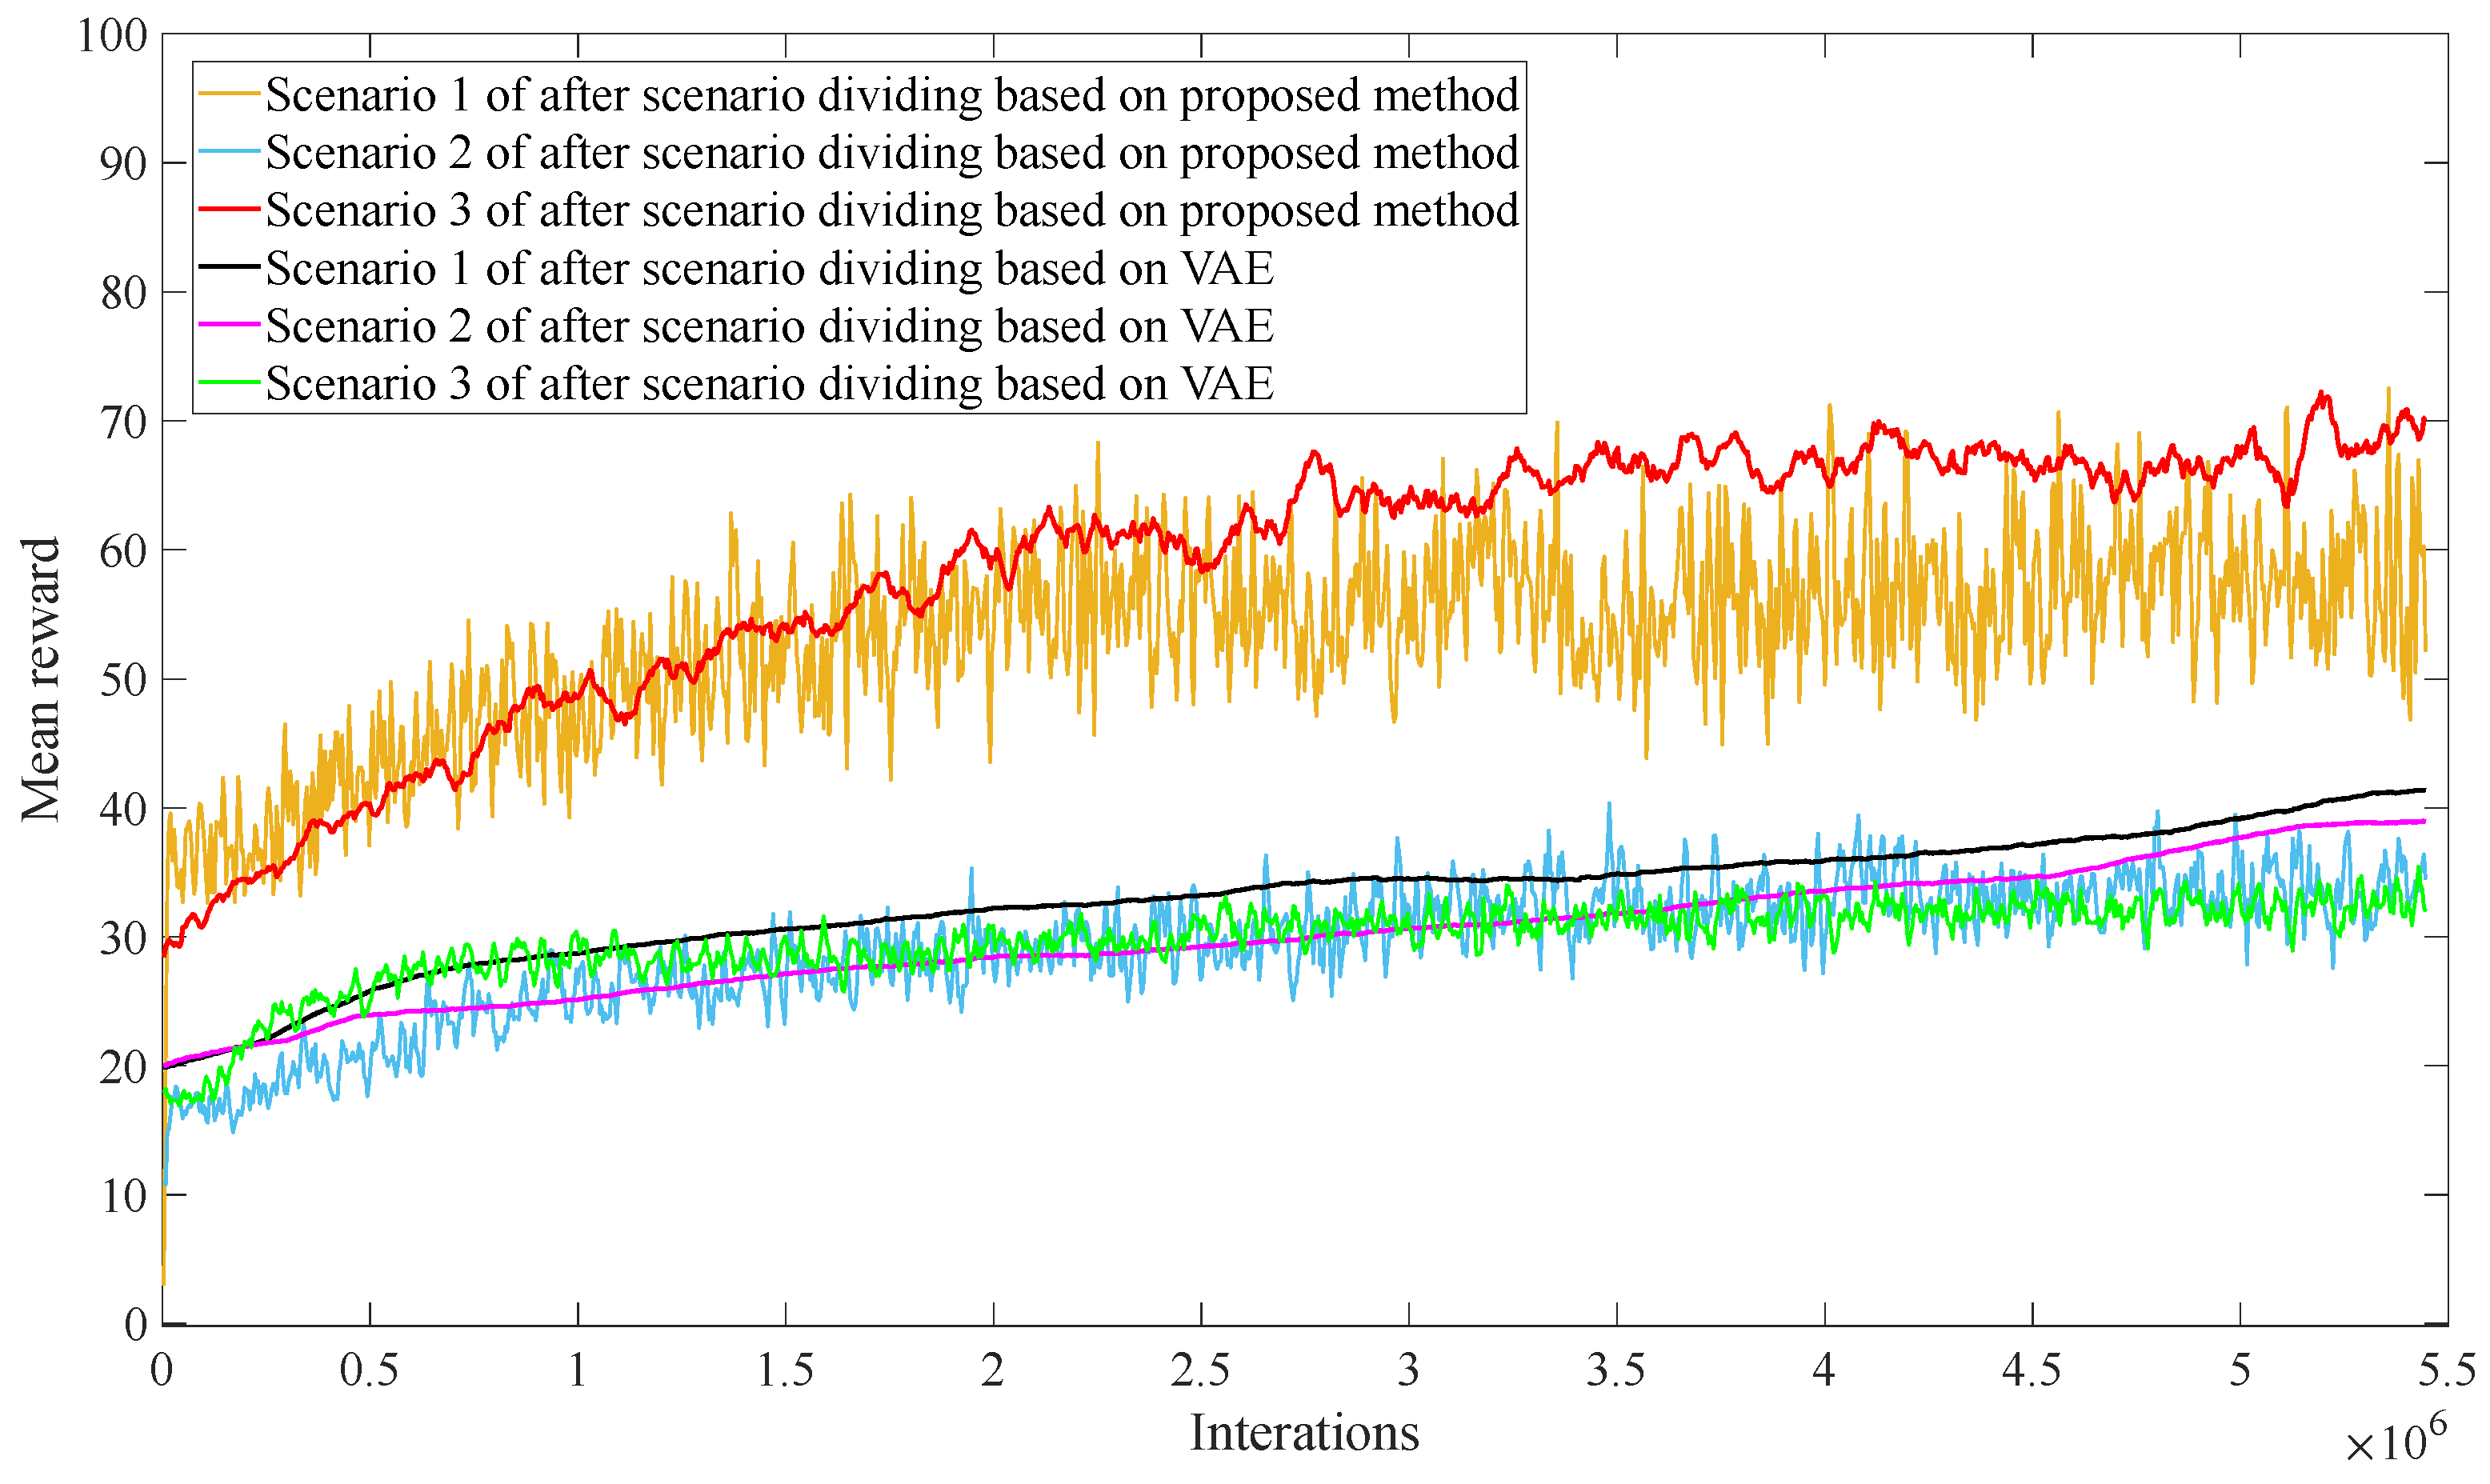
To further validate the advantages of the proposed method, a comparison was made between the proposed method and the method based on VAE. The comparison results are shown in
Figure 8. As shown in
Figure 8, the mean reward values of the method proposed in this paper are significantly higher than the method based on VAE during the agent training process in both scenario A and scenario C. Compared to the method based on VAE, the mean reward value of the proposed method in scenario A is increased by 43.51% and that in scenario C is increased by 35.3%. Overall, the method proposed in this paper can prevent agents from making decisions directly on the dispatch scenarios with uncertainty distribution and reduce the learning difficulty.
Based on the analysis of power system dispatch results, the output power dispatch results of renewable energy with and without scenario division are shown
Figure 9. The renewable energy consumption rate refers to the ratio of the actual output power of renewable energy used by the system to the total output power of renewable energy at the current time. As shown in
Figure 9, the renewable energy consumption rate of nodes 13–22 with scenario division are significantly improved compared to without scenario division. Overall, the decision results of the proposed method are better in renewable energy consumption.
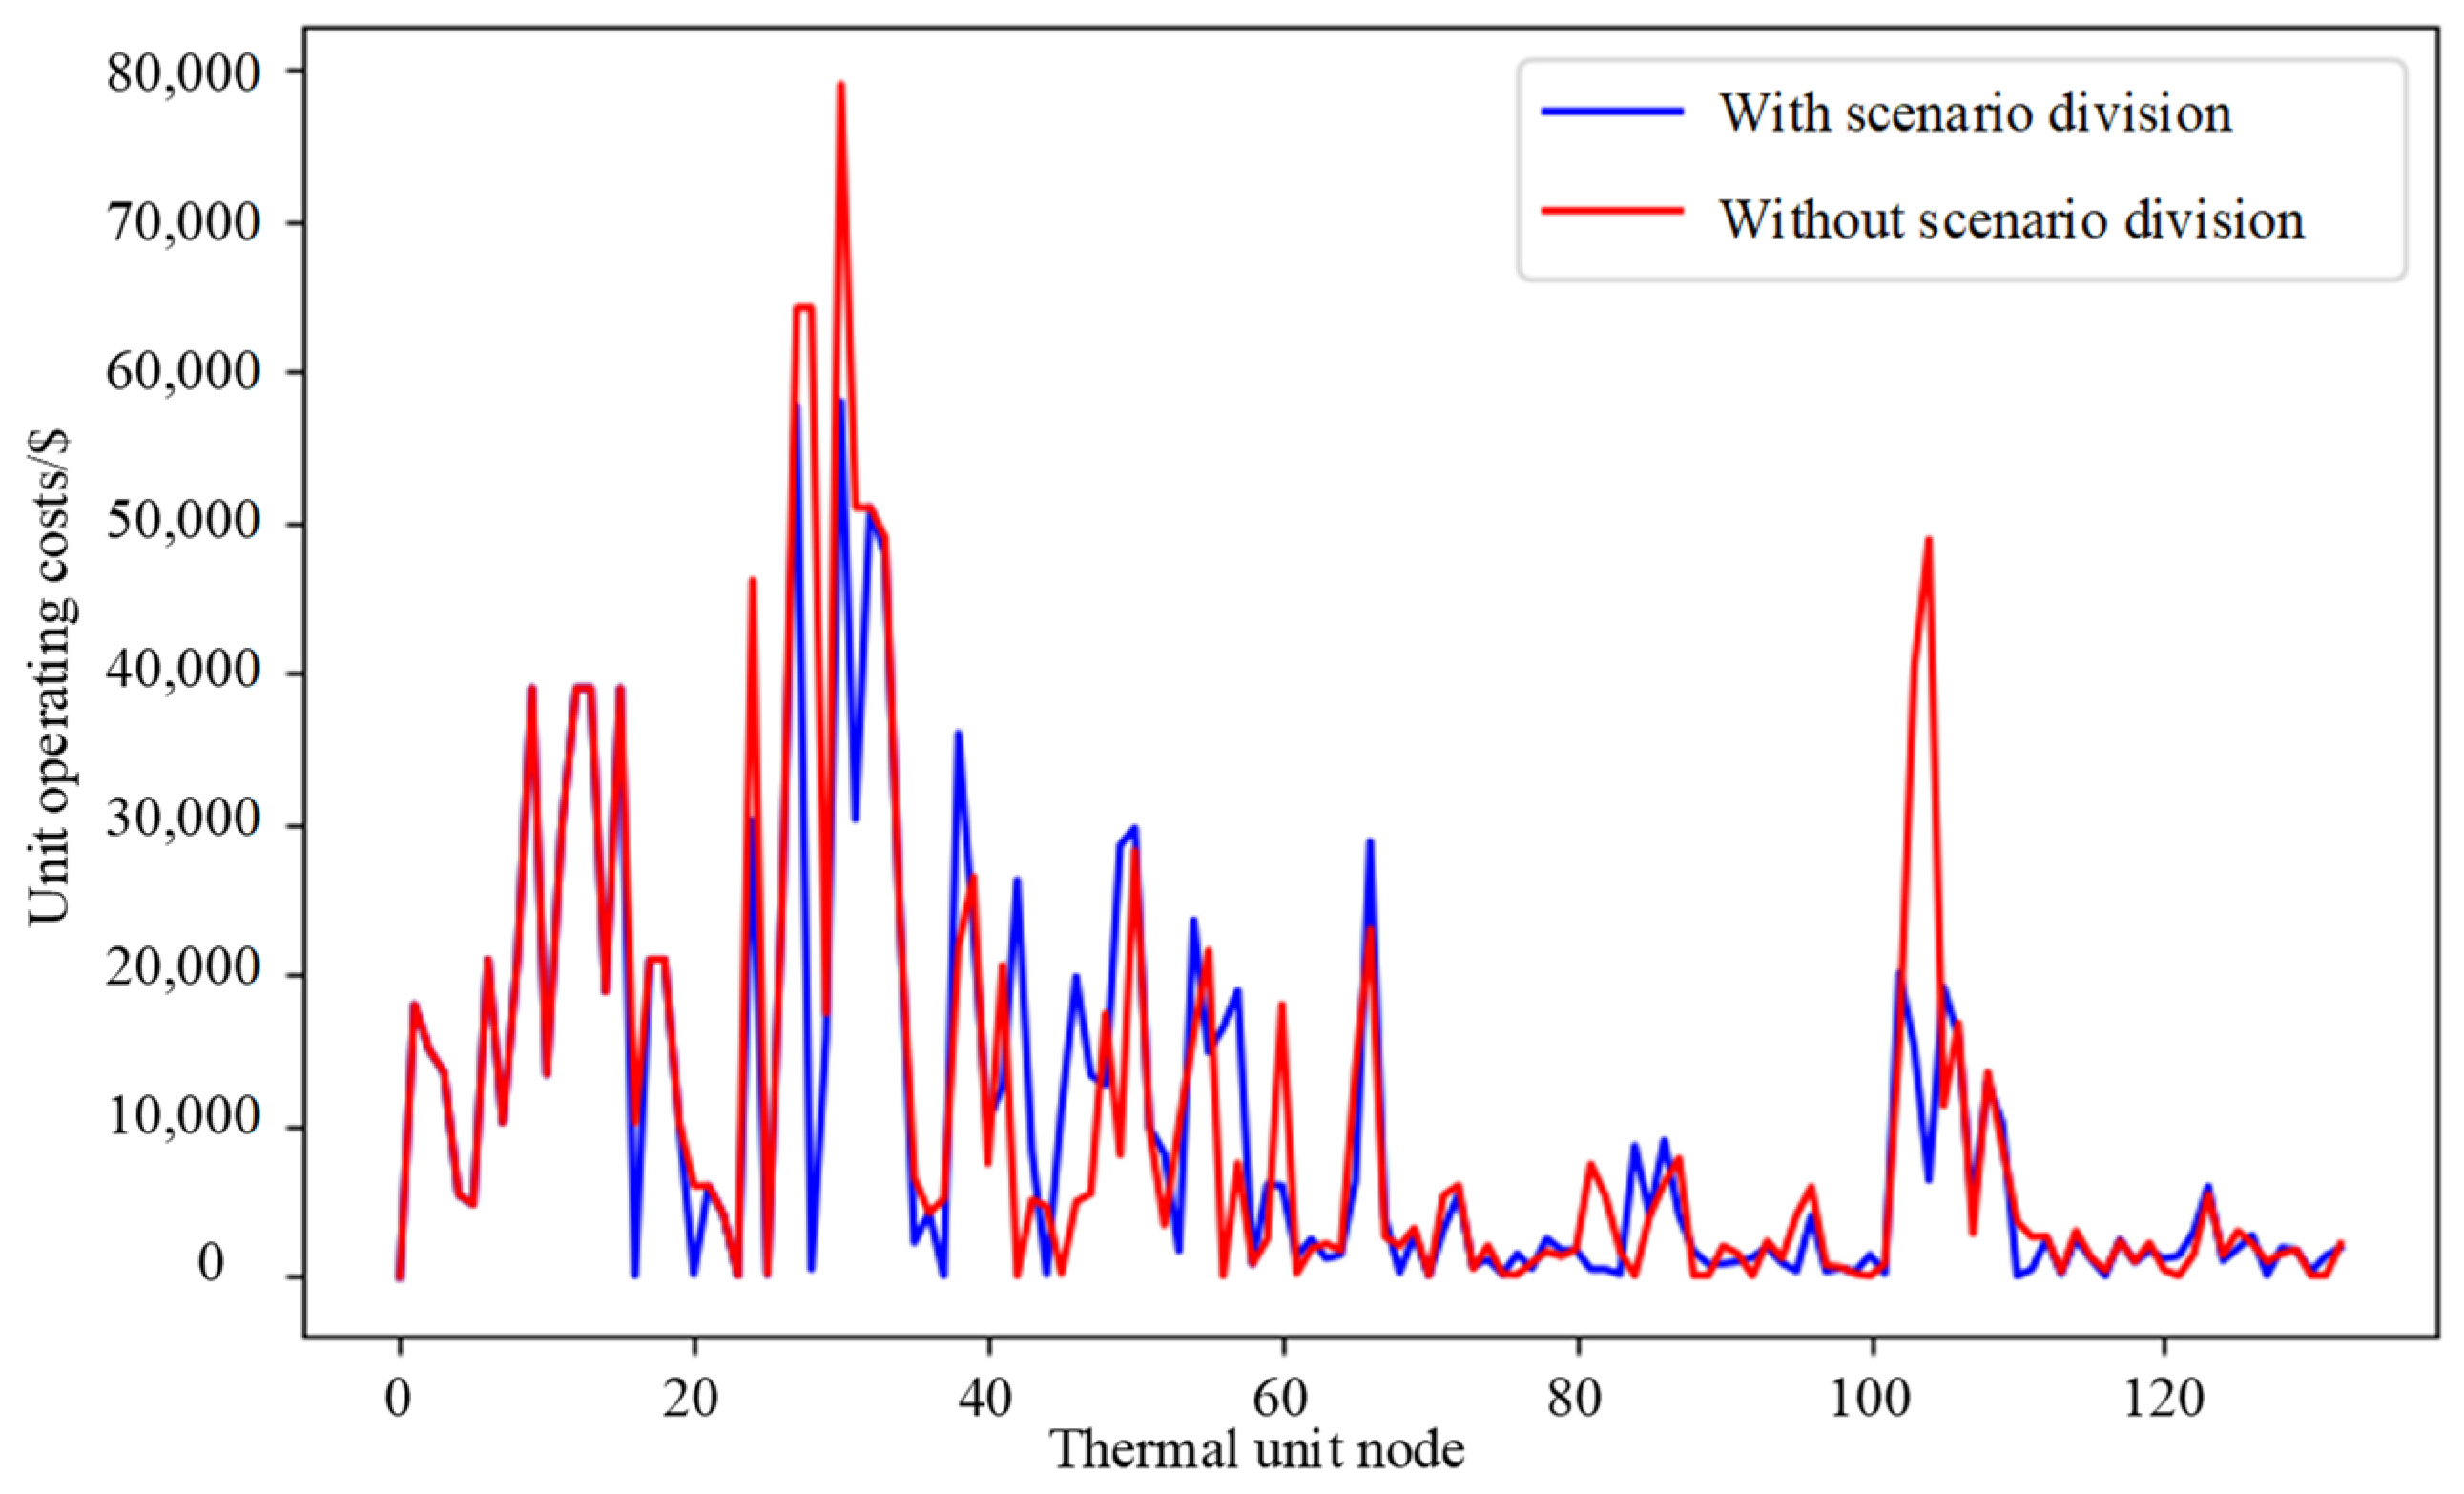
From the perspective of operating costs in the power system dispatch, unit operating cost with and without the scenario division are shown in
Figure 10. As shown in
Figure 10, the unit operating cost without the scenario division is USD 1,335,901, and the unit operating cost after scenario division is USD 1,266,477. The overall power system operating cost is reduced by 5.196%, and the peak of the unit operating cost is reduced.
7. Conclusions
A multi-scenario data-driven dispatch method based on scenario division integrating VAE-generated and physical features is proposed and verified by simulations.
To address the power system dispatch problem under multiple and fast-changing operational scenarios, firstly, VAE is used to extract the potential data-driven features, which can reduce the redundancy of high-dimensional features and accurately describe the operation features of generation–load data to the greatest extent. At the same time, the key physical features are selected, considering the features of generation–load, which are interpretable and can screen the operation features from the overall level and changing trend of generation–load. This provides a more comprehensive and interpretable feature. Based on these features, the GMM is used to divide the scenarios and distinguish the scenarios with obvious differences in generation–load operation features. Using SC to evaluate the effectiveness of scenario division. Finally, the dispatching model of each scenario is constructed and the precise dispatching decision under each scenario is given. Compared with a single scenario dispatching decision, this method is more accurate and reasonable for the actual dispatching requirements.
Author Contributions
Conceptualization, W.H. and S.C.; Methodology, L.L.; Software, H.Z.; Formal analysis, J.R.; Data curation, X.Z. and H.L.; Supervision, L.C. All authors have read and agreed to the published version of the manuscript.
Funding
This research is funded by the [Science and Technology Project of China Southern Power Grid Digital Grid Research Institute] under grant number [670000KK52220002]. The APC is funded by the [Science and Technology Project of China Southern Power Grid Digital Grid Research Institute] under grant number [670000KK52220002].
Data Availability Statement
The data presented in this study are available on request from the corresponding author. The data are not publicly available due to security concerns.
Conflicts of Interest
The authors declare no conflict of interest.
Nomenclature
| Sets and Parameters |
| Set of state space |
| Set of action space |
| Encoder network with parameter |
| Decoder network with parameter |
| Hidden network parameter |
| Variables |
| / | Active/reactive power output of unit G at the time t |
| / | Active/reactive power load at each node at the time t |
| The voltage amplitude of each node at the time t |
| Network loss value at the time t |
| Branch current load factor at the time t |
| Award of the i term at the time t |
References
- Xin, B. Accelerating the construction of new power system to help achieve the “double carbon” goal. Econ. Dly. 2021, 1, 16–18. [Google Scholar]
- The Cost of Financing for Renewable Power. IRENA Homepage. 2023. Available online: https://www.irena.org/Publications/2023/May/The-cost-of-financing-for-renewable-power (accessed on 31 August 2023).
- Zheng, W.; Chen, Y.; Zhou, B. Concept of Operation and Control System on Yunnan New Power System. South. Power Syst. Technol. 2022, 16, 72–78. [Google Scholar]
- Liu, X.; Li, X.; Zhu, J.; Duan, H.; Yu, L.; Yu, T. Review and Prospect on Frequency Response Models of New Power System. South. Power Syst. Technol. 2022, 16, 38–47. [Google Scholar]
- Liu, X.; Wang, H.; Deng, W.; Guo, Z.; Ding, G. Cross-Regional New Energy Consumption Strategy Considering Different Time Scales. South. Power Syst. Technol. 2023, 17, 37–46. [Google Scholar]
- López-Garza, E.; Domínguez-Cruz, R.F.; Martell-Chávez, F.; Salgado-Tránsito, I. Fuzzy Logic and Linear Programming-Based Power Grid-Enhanced Economical Dispatch for Sustainable and Stable Grid Operation in Eastern Mexico. Energies 2022, 15, 4069. [Google Scholar] [CrossRef]
- Han, X.; Mu, C.; Yan, J.; Niu, Z. An autonomous control technology based on deep reinforcement learning for optimal active power dispatch. Int. J. Electr. Power Energy Syst. 2023, 145, 108686. [Google Scholar] [CrossRef]
- Liu, Y.; Wu, L.; Li, J. A Fast LP-Based Approach for Robust Dynamic Economic Dispatch Problem: A Feasible Region Projection Method. IEEE Trans. Power Syst. 2020, 35, 4116–4119. [Google Scholar] [CrossRef]
- Wei, T.; Chu, X.; Yang, D.; Ma, H. Power balance control of RES integrated power system by deep reinforcement learning with optimized utilization rate of renewable energy. Energy Rep. 2022, 8, 544–553. [Google Scholar] [CrossRef]
- Luo, J.; Zhang, W.; Wang, H.; Wei, W.; He, J. Research on Data-Driven Optimal Scheduling of Power System. Energies 2023, 16, 2926. [Google Scholar] [CrossRef]
- Seo, M.; Vecchietti, L.F.; Lee, S.; Har, D. Rewards prediction-based credit assignment for reinforcement learning with sparse binary rewards. IEEE Access 2019, 7, 118776–118791. [Google Scholar] [CrossRef]
- Li, X.; Han, X.; Yang, M. Day-Ahead Optimal Dispatch Strategy for Active Distribution Network Based on Improved Deep Reinforcement Learning. IEEE Access 2022, 10, 9357–9370. [Google Scholar] [CrossRef]
- Chen, H.; Zhuang, J.; Zhou, G.; Wang, Y.; Sun, Z.; Levron, Y. Emergency load shedding strategy for high renewable energy penetrated power systems based on deep reinforcement learning. Energy Rep. 2023, 9, 434–443. [Google Scholar] [CrossRef]
- Yang, J.; Zhang, J.; Wang, H. Urban traffic control in software defined internet of things via a multi-agent deep reinforcement learning approach. IEEE Trans. Intell. Transp. Syst. 2020, 22, 3742–3754. [Google Scholar] [CrossRef]
- Munir, M.S.; Abedin, S.F.; Tran, N.H.; Han, Z.; Huh, E.-N.; Hong, C.S. Risk-Aware Energy Scheduling for Edge Computing with Microgrid: A Multi-Agent Deep Reinforcement Learning Approach. IEEE Trans. Netw. Serv. Manag. 2021, 18, 3476–3497. [Google Scholar] [CrossRef]
- Lin, L.; Guan, X.; Peng, Y.; Wang, N.; Maharjan, S.; Ohtsuki, T. Deep Reinforcement Learning for Economic Dispatch of Virtual Power Plant in Internet of Energy. IEEE Internet Things J. 2020, 7, 6288–6301. [Google Scholar] [CrossRef]
- Fang, D.; Guan, X.; Hu, B.; Peng, Y.; Chen, M.; Hwang, K. Deep reinforcement learning for scenario-based robust economic dispatch strategy in Internet of energy. IEEE Internet Things J. 2021, 8, 9654–9663. [Google Scholar] [CrossRef]
- Huang, S.; Li, P.; Yang, M.; Gao, Y.; Yun, J.; Zhang, C. A control strategy based on deep reinforcement learning under the combined wind-solar storage system. IEEE Trans. Ind. Appl. 2021, 57, 6547–6558. [Google Scholar] [CrossRef]
- Liang, X.; Zhu, X.; Kang Chen, S.; Jin, X.; Du, Z. Endowing data-driven models with rejection ability: Out-of-distribution detection and confidence estimation for black-box models of building energy systems. Energy 2023, 263, 125858. [Google Scholar] [CrossRef]
- Wang, H.; Wu, X.; Sun, K.; Du, X.; He, Y.; Li, K. Economic Dispatch Optimization of a Microgrid with Wind–Photovoltaic-Load-Storage in Multiple Scenarios. Energies 2023, 16, 3955. [Google Scholar] [CrossRef]
- Qian, L.; Lin, S.; Wang, W.; Quach, D.C. Research on Source-load Coordinated Dispatch Based on Multi-scenario Wind Power Consumption. In Proceedings of the 2021 3rd International Conference on Smart Power & Internet Energy Systems (SPIES), Shanghai, China, 25–28 September 2021; pp. 421–425. [Google Scholar]
- Han, X.; Shi, W.; Yuan, X.; Hao, Y. Multi-scene Scheduling of Power System with Renewable Energy Based on DDPG. In Proceedings of the 2023 8th Asia Conference on Power and Electrical Engineering (ACPEE), Tianjin, China, 14–16 April 2023; pp. 1892–1897. [Google Scholar]
- Zhu, Z.; Zhao, J.; Zhang, S.; Li, X. Research on Wind Power Capacity Evaluation Based on Risk Theory and Unit Commitment Under Multi-Scenarios. In Proceedings of the 2020 IEEE 4th Conference on Energy Internet and Energy System Integration (EI2), Wuhan, China, 30 October–1 November 2020; pp. 2551–2555. [Google Scholar]
- Tao, W.; Qian, Y.; Zhang, Y.; Ma, H.; Leng, H.; Ma, M. Survey of Deep Clustering Algorithm Based on Autoencoder. Comput. Eng. Appl. 2022, 58, 16–25. [Google Scholar]
- Gu, X.; Liu, T.; Li, S.; Wang, T.; Yang, X. Temporal and Spatial Similarity Mining of Power Grid Snapshot for Future State Prediction. Trans. China Electrotech. Soc. 2022, 37, 6145–6156. [Google Scholar]
- Liu, Z.; Gao, Y.; Guo, J.; Li, Y.; Gu, D.; Wen, Y. Abnormal detection of electricity theft using a deep auto-encoder Gaussian mixture model. Power Syst. Prot. Control. 2022, 50, 92–102. [Google Scholar]
- Kingma, D.; Salimans, T.; Jozefowicz, R.; Chen, X.; Sutskever, I.; Welling, M. Improved Variational Inference with Inverse Autoregressive Flow. In Proceedings of the 30th International Conference on Neural Information Processing Systems, Barcelona, Spain, 5–10 December 2016; pp. 4743–4751. [Google Scholar]
- Hu, B.; Xie, K.; Shao, C. Review of new power system risks under the dual carbon target: Characteristics, indicators and assessment methods. Autom. Electr. Power Syst. 2023, 47, 1–15. [Google Scholar]
- Song, J.; He, C.; Li, X.; Liu, Z.; Tang, J.; Zhong, W. Daily load curve clustering method based on feature index dimension reduction and entropy weight method. Autom. Electr. Power Syst. 2019, 43, 65–72. [Google Scholar]
- Liu, W.; He, X.; Wu, F.; Jiang, Z.; Zhong, Y. New energy generation output characteristic index and its data application. Power Syst. Clean Energy 2020, 36, 85–92. [Google Scholar]
- Ge, Z.; Zhang, Q.; Qi, X.; Liu, H.; Zhang, C.; Xu, Z. Index system for renewable energy output characteristics considering flexible demand. Proc. CSU-EPSA 2018, 30, 30–37. Available online: https://www.eia.gov/outlooks/aeo/pdf/aeo2019.pdf (accessed on 31 August 2023).
- Wu, H.; He, Y.; Zhao, B.; Li, P.; Ji, Y.; Wu, M. Research on dynamic equivalent of wind farm based on improved K-Means clustering algorithm. Acta Energiae Solaris Sin. 2018, 39, 3232–3238. [Google Scholar]
| Disclaimer/Publisher’s Note: The statements, opinions and data contained in all publications are solely those of the individual author(s) and contributor(s) and not of MDPI and/or the editor(s). MDPI and/or the editor(s) disclaim responsibility for any injury to people or property resulting from any ideas, methods, instructions or products referred to in the content. |
© 2023 by the authors. Licensee MDPI, Basel, Switzerland. This article is an open access article distributed under the terms and conditions of the Creative Commons Attribution (CC BY) license (https://creativecommons.org/licenses/by/4.0/).


