Article

Dielectric Breakdown Strength of PDMS Elastomers after Mechanical Cycling †

by
Emmanuel Taine
1,2,
Thomas Andritsch
1,*,
Istebreq A. Saeedi
1 and
Peter H. F. Morshuis
3
1
The Tony Davies High Voltage Laboratory, University of Southampton, Southampton SO17 1BJ, UK
2
R&D Laboratory, SBM Offshore, 06510 Le Broc, France
3
Solid Dielectric Solutions, 2311 SG Leiden, The Netherlands
*
Author to whom correspondence should be addressed.
This paper is an extended version of our paper published in 2022 IEEE 4th International Conference on Dielectrics (ICD), Palermo, Italy, 3–7 July 2022; pp. 21–24, doi:10.1109/ICD53806.2022.9863500.
Energies 2023, 16(21), 7424; https://doi.org/10.3390/en16217424
Submission received: 3 October 2023 / Revised: 27 October 2023 / Accepted: 31 October 2023 / Published: 3 November 2023

Abstract

:
PDMS-based composites such as silicone elastomers are commonly found in high-voltage engineering, especially in outdoor insulation as coatings or structural elements or at interfaces between network elements, such as cable sealing ends (CSE). They are also promising prospects for dielectric elastomer generators (DEG), which are retrieving electrostatic energy from large strain amplitudes. The upper limit of energy conversion from these transducers is determined by the dielectric breakdown strength (DBS). Therefore, developing reliable systems that operate under high electric fields and variable repeated strains requires a thorough understanding of the mechanisms behind electrical breakdown and its coupling to mechanical cycling. In this study, the effect of Mullins damage and mechanical fatigue on silicone elastomers has been investigated. An electro-mechanical instability model that considers cyclic softening allows for predicting the evolution of the breakdown strength depending on the loading history. The results highlight the importance of the “first cycle,” where up to a 30% reduction in the mean DBS was measured. However, subsequent mechanical fatigue only marginally contributes to the degradation, which is a promising perspective for the long-term performance of any silicone elastomer as long as the precise impact of the first cycle is known.

1. Introduction

Polydimethylsiloxane (PDMS) based elastomers can be used in soft transducers, which are suitable for a wide range of potential applications such as sensors, soft robotics, energy harvesting, and biomedical devices. They consist of an elastomeric film, which is coated on both sides with compliant electrodes to form a stretchable capacitor. A number of DEG devices were proposed [1] with a particular interest in novel wave energy converters [2,3,4] due to the potentially high conversion efficiency at large strain amplitudes at low frequencies of ocean waves. The convertible energy of DEG scales with the strain amplitude, dielectric permittivity, and the applied electric field. Despite its low permittivity, PDMS is a popular choice for DEG due to its high stretchability, good aging resistance, and high electrical resistivity. Its versatility and ease of processing also allow the formulation of nanocomposites in order to tailor the mechanical and electrical properties to several electrical applications. For DEG, the dielectric breakdown strength bounds the ultimate convertible energy, and that physical limit is of primary importance because of its quadratic contribution to the energy output. The DBS of dielectric elastomers has been widely investigated, and a variety of parameters are found to influence the electrical limits. Among them, elastomer stiffness [5,6,7] and amount of pre-stretch [8,9,10] can determine the onset of electrical failure. The breakdown strength of PDMS is also reported to change with the thickness of the dielectric layer [11,12,13], the shape of the electrodes [12,13], and their size [10,14]. The choice of PDMS in high-voltage applications is often driven by a particular environment that requires stretchability. Although strain and electric field result from different mechanical and electrical sources, cross-interactions can build up, resulting in premature failures. These synergetic effects are scarcely explored in the literature, and this study aims to better understand the effect of mechanical loading on the DBS. Electro-mechanical instabilities are acknowledged as the dominant failure mechanisms in dielectric elastomers; therefore, the relation between mechanical properties and electrical limits is of particular importance in these soft materials subjected to extreme loadings.
Meanwhile, elastomers are highly nonlinear materials for which the mechanical response varies with time, temperature, strain rate, or load history. A particular feature of highly filled elastomers is known as the Mullins effect, which corresponds to a reduction in mechanical stress on the second and subsequent mechanical loadings. This softening has various interpretations, including damage in the elastomer matrix, filler network alteration, or rubber–filler interface changes [15]. For the specific case of silica-filled PDMS, this reduction is typically attributed to the disentanglement of adjacent chains [16] or detachment/slippage on the filler surface of chains having reached their limit of extensibility [17]. Additionally, under cyclic mechanical loadings, filled elastomers are prone to additional softening, which is often considered the result of stress relaxation [18]. Alternatively, the Mullins effect and cyclic softening could be related to one single process caused by sliding and friction between polymeric chains and fillers [19].
The relation between mechanical properties and electric breakdown has been widely investigated. When a dielectric elastomer film is subjected to an electric field, the electrostatic pressure is thinning the membrane and increasing the internal mechanical stress. When the voltage increases further and exceeds a critical threshold V c , the equilibrium between electrostatic and mechanical stresses becomes unstable, causing huge, localized strains (Figure 1). This phenomenon is known as pull-in instability or electro-mechanical instability (EMI), which can cause an electrical breakdown if the resulting strain or electric field exceeds the material’s intrinsic limits [20]. EMI is acknowledged as the main cause of dielectric breakdown in the absence of defects. An early description of EMI was proposed by Stark and Garton for stiff polymers with a model relating the breakdown strength to permittivity and Young’s modulus [21]. Extensions of this model have been proposed to account for non-linear elasticity in polymers [22] and highly stretchable elastomers [6,11,23]. Therefore, the softening induced by the Mullins effect is expected to change the dielectric breakdown strength, and experimental results on silicone support this assumption [24].
The first part of this study further discusses the crucial role of the first cycle and extends the preliminary results presented in [7]. The long-term performance of dielectric elastomers remains an exploration field. The influence of millions of squared drive voltage applications on PDMS dielectric actuators has been investigated with regard to electrode performance [25] and dielectric breakdown strength [9]. However, degradation of the dielectric properties after large mechanical cyclic loadings remains scarcely investigated. In the second part of this study, a series of low-cycle fatigue tests were carried out at various stretch amplitudes, and then electrical breakdown tests were performed on the fatigued specimens. Based on the observed softening, an electro-mechanical instability model was proposed, which allows the prediction of the reduction in breakdown voltage from the mechanical damage accumulated.

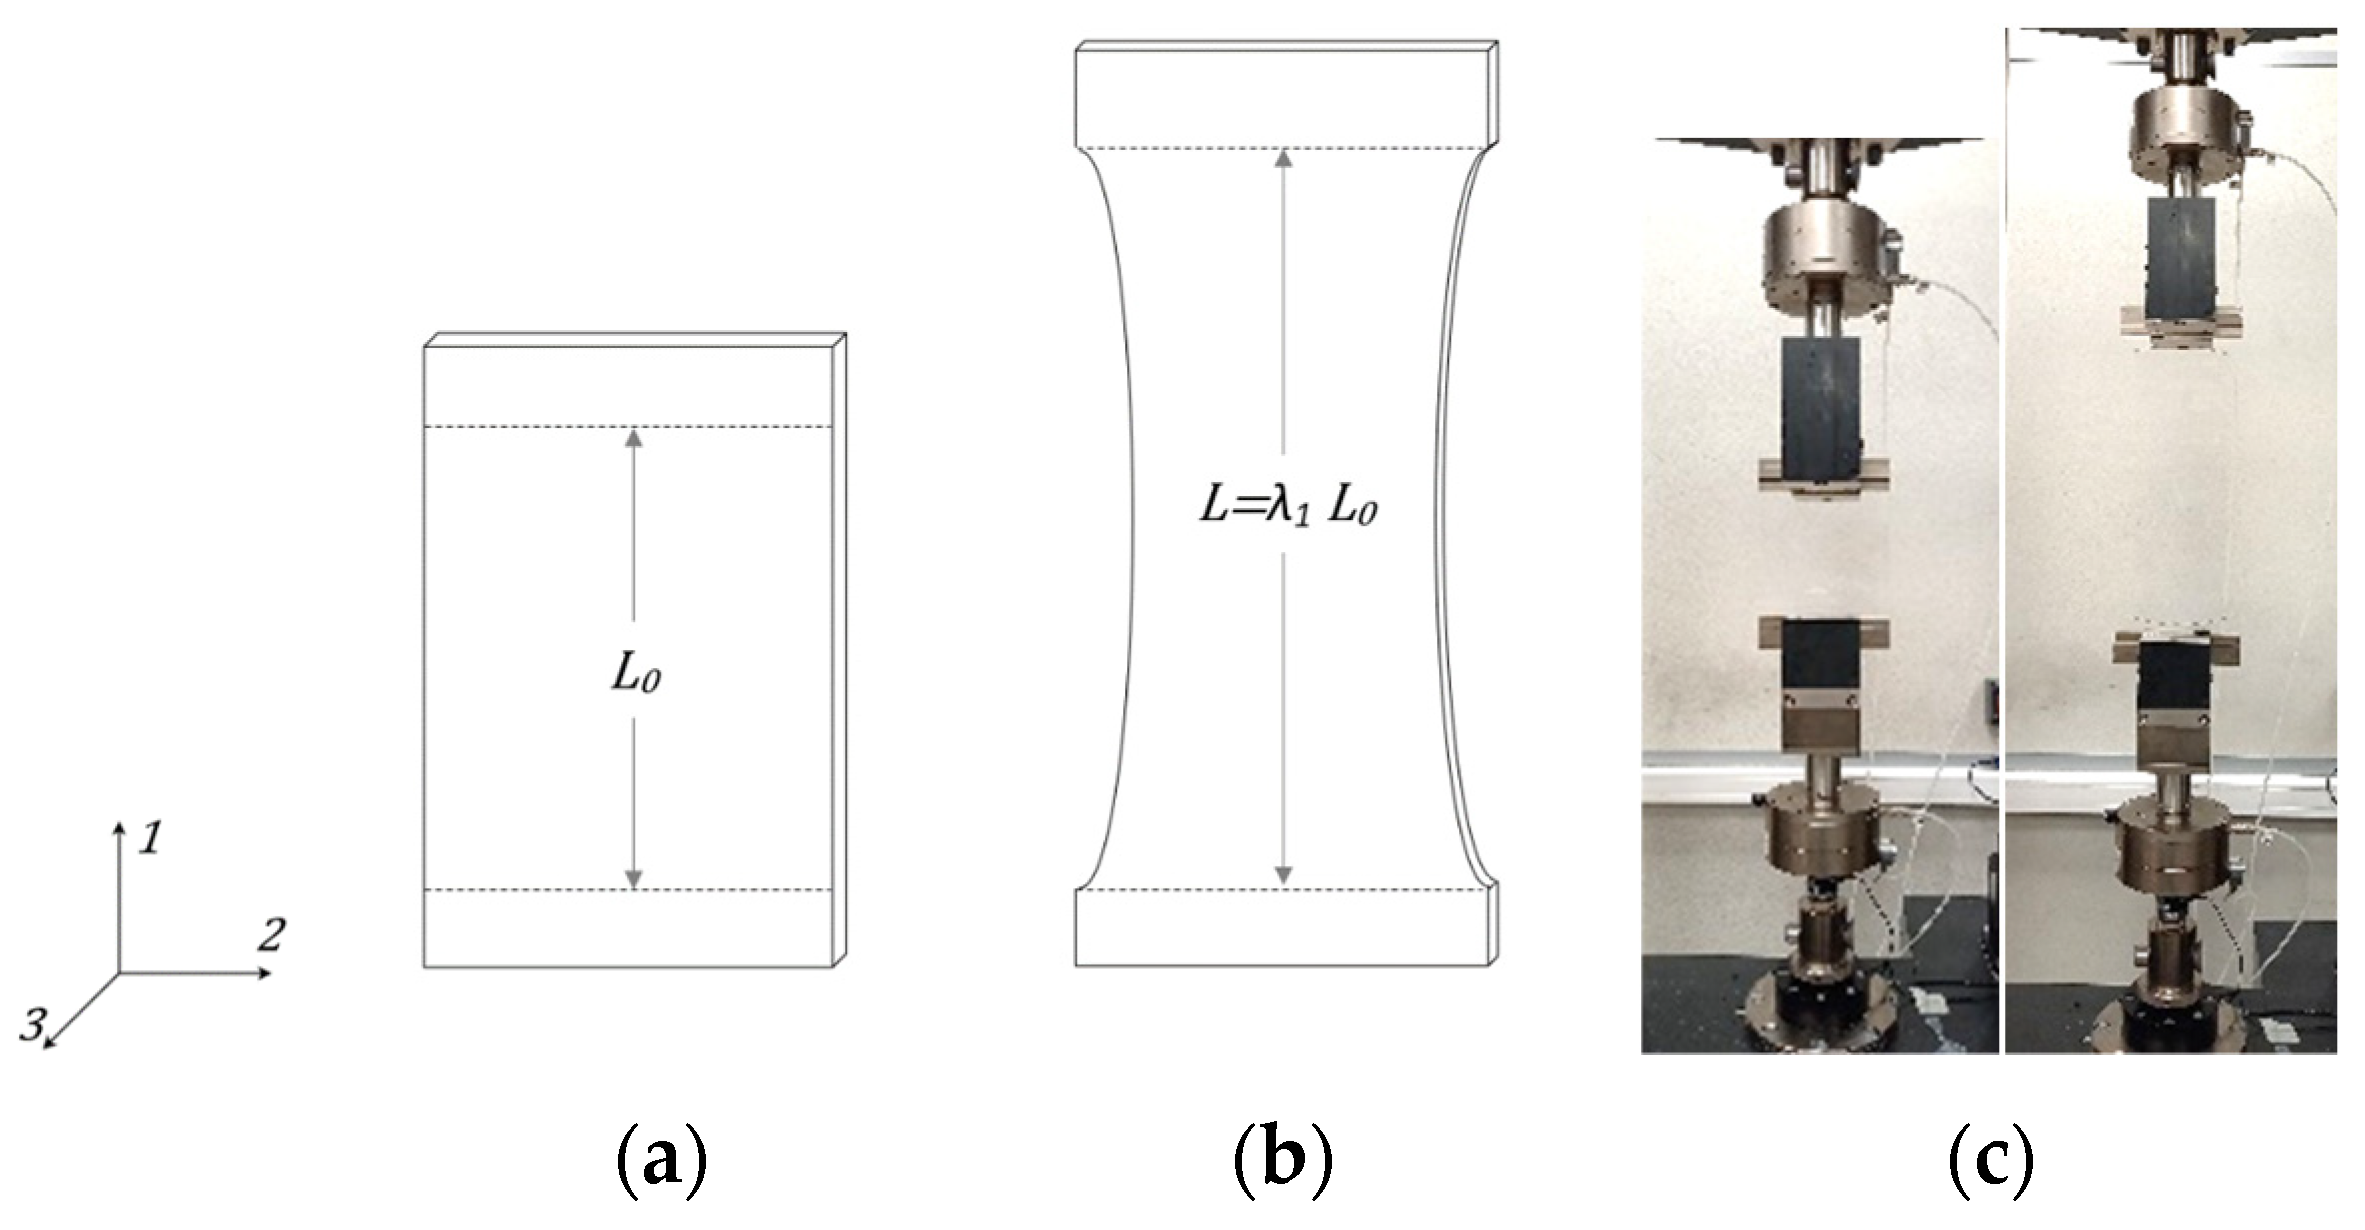
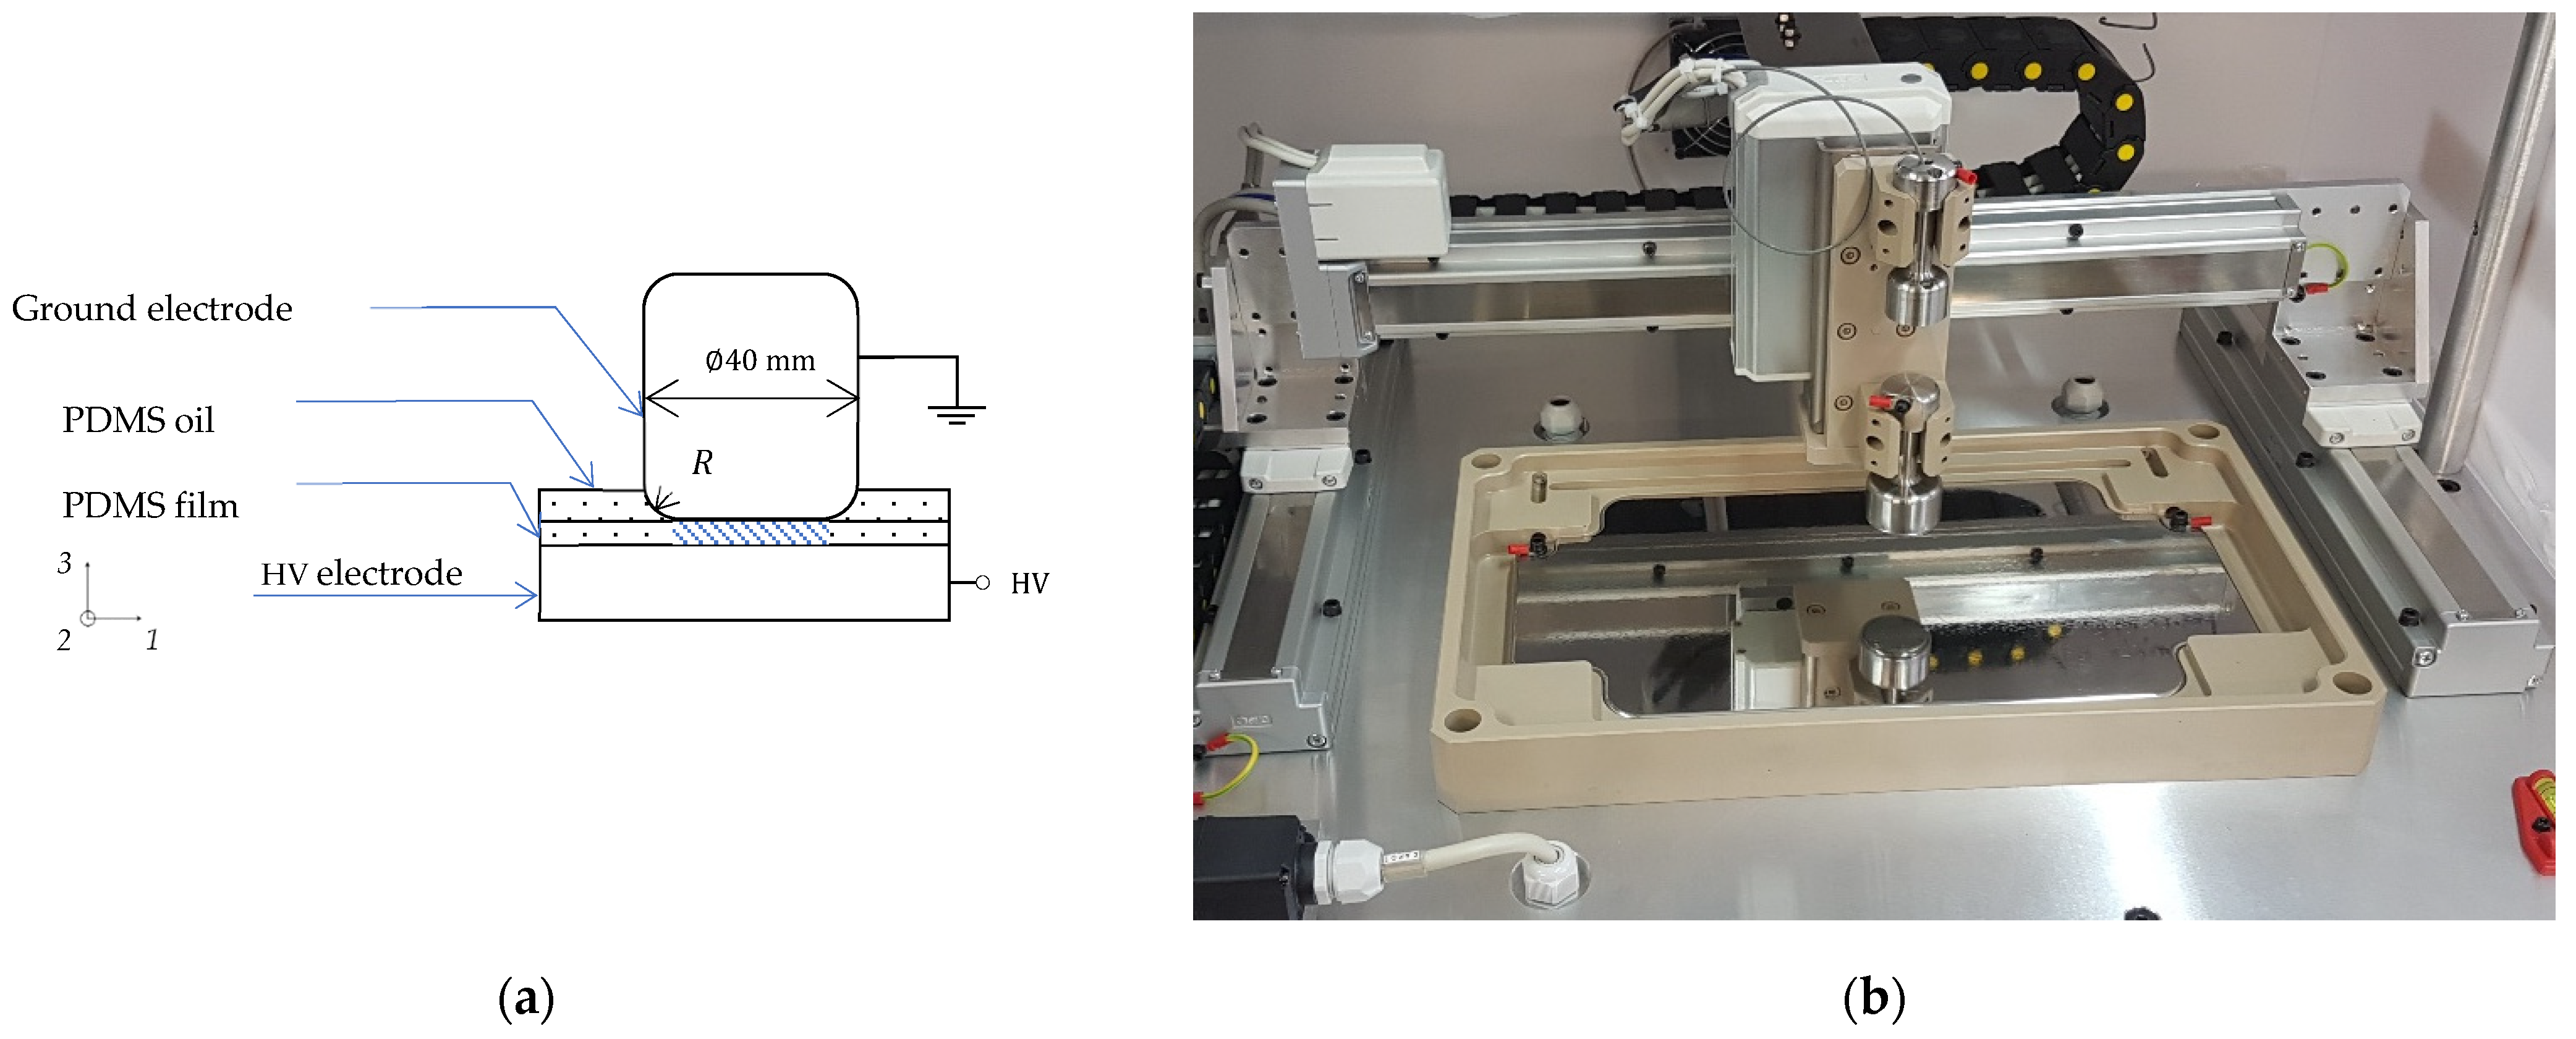
2. Materials and Methods

The two dielectric elastomers have been prepared for analysis from two components, platinum catalyzed, liquid silicone rubbers (LSRs) with a shore hardness of 50 ShA and 70 ShA, respectively. Variation in the silica content between the two formulations gives different mechanical responses and Mullins damages under cyclic loadings. These LSRs were diluted in a volatile silicone fluid using a turbine mixer under a vacuum environment (~100 mbar). The resulting mixtures were coated on a polyester carrier film using a roll-to-roll coating process entirely enclosed in a clean room environment (ISO 8). A first crosslinking was performed at 110 °C for a duration of 10 min, then the dielectric elastomers were peeled from their polyester carriers, and a final post-curing was performed at 120 °C for a duration of 15 h to complete the crosslinking reaction and eliminate the volatile residuals.
Samples were cut from the PDMS thin films in a rectangular shape of 300 mm length and 200 mm width (Figure 2a). For the mechanical loading, the samples were placed in a tensile test machine (Zwick/Roell Z100, Ulm, Germany) controlled in displacement at a fixed strain rate of 3%·s−1. Samples were held into pneumatic clamps to prevent slippage in the jaws under load. The tensile stretch was defined as λ 1 = L / L 0 with L, the distance between the clamps (Figure 2b) and L 0 to the initial length of the sample ( L 0 = 220 mm). Incompressibility of the elastomers λ 1 λ 2 λ 3 = 1 yields an equal stretch in the direction of the width and thickness λ 2 = λ 3 = λ 1 1 2 .
The nominal tensile stress was defined as T 1 = F / A 0 , with F the force measured by the load cell and A 0 the original cross-sectional area. The machine was loading the sample up to a pre-defined value of maximal stretch λ 1 m a x before releasing completely the mechanical stress before the electrical test, individual samples were evaluated at different levels of maximal stretch for the two formulations.
Additionally, the effect of multiple cycles on the dielectric breakdown strength has been investigated for the 70 ShA elastomer. Individual samples were elongated to different pre-defined values of maximal stretch (respectively, λ 1 m a x = 1.3 , λ 1 m a x = 1.7 , and λ 1 m a x = 2.4 ). Then, samples were fully released following a triangular displacement-controlled pattern at a crosshead speed of 6 mm/s. This sequence constitutes one mechanical cycle, which was repeated 1000 times before submitting the samples to the DBS evaluation. For the higher stretch amplitude evaluated ( λ 1 m a x = 2.4 ), intermediate breakdown strength measurements were performed after 10 and 100-cycle repetitions, respectively.
After mechanical cycling, the dielectric membranes are installed on an in-house developed breakdown tester, which allows measuring the DBS automatically in multiple locations on the tensile test sample. The PDMS dielectric elastomer film is deposited on a 304 stainless steel plate having a mirror finish polishing on which a DC power supply is connected (Heinzinger PNC 30 kV, Rosenheim, Germany). Ethanol is used to ease the sample installation and to prevent trapped air at the interface between the sample and the high-voltage electrode. Before starting any measurement, a rest time of 3 h is respected to ensure the desorption of solvent residuals. For each testing location, the film thickness is preliminary measured using an Eddy current displacement sensor (Micro-Epsilon EddyNCDT DT3100/EPS08, Ortenburg, Germany). The sensor is integrated into a cylindrical holder with a vertical offset between the sensor head and the lower surface of the cylinder, preventing contact with the measuring object (Figure 3a). The sensor holder is automatically positioned on the stainless-steel plate at the future locations of the breakdown measurements, and this calibration step gives the value of the offset δ 0 . The same measurement is repeated at the surface of the film to obtain the local dielectric thickness d 0 = δ δ 0 . Repeatability of the thickness measurement was found to be 1 μm and mean membrane thicknesses were 138 ± 5 µm for the 70 ShA and 105 ± 3 µm for the 50 ShA. The corresponding thickness distributions (gathering the measurements of all the tested specimens) are represented in Figure 3c.
Then, the elastomer film is immersed in a silicone fluid to prevent flashover. For the ground electrode, a 40 mm diameter cylinder of stainless steel 304 is used (Figure 4a), for which all edges have been rounded to a 3.2 mm radius, such as limiting electric field enhancement at that location [13,26]. This electrode is actuated by a 3-axis motor to the first testing location, where the cylinder is deposited on the dielectric elastomer, and only the mass of the cylinder contributes to the contact pressure at the film interface. Subsequently, a positive DC voltage V is applied across the dielectric elastomer using a ramp of 500 V/s. Assuming that the thickness is uniform across the tested location, the electric field E across a linear membrane is obtained from the initial dielectric thickness as E = V / d 0 . The breakdown voltage V B D is detected from a sharp increase in the current measurement, and the corresponding DBS is calculated from (1) [27].
E B D = V B D / d 0
After lifting the ground electrode, the motor automatically advances to the next testing location and repeats the breakdown process there. Using only the stretched surface and ignoring the part of the sample that was previously clamped in the tensile test machine, a maximum of 23 breakdown points can be measured (Figure 3b). Samples were stored and tested in a climate-controlled room, where the temperature and relative humidity were maintained at 23 °C and 50%, respectively.
Experimental breakdown results of every single mechanical testing scenario are fitted with a two-parameter Weibull distribution. The probability density function of a Weibull distribution is given by (2), where η is the scale parameter and β the shape parameter. The mean of the Weibull distribution is given by (3), with Γ being the gamma function [28].
f E = β E β 1 η β e E η β
E ¯ = η Γ 1 β + 1
For each material, a virgin unstretched sample was tested to attain a reference point and evaluate the effect of the subsequent mechanical loadings.

3. Model

3.1. Hyperelastic Model

The mechanical properties of the two elastomers have been modeled using an Ogden–Roxburgh hyperelastic model. The detailed methodology and results were introduced in a previous work [7]. In this approach, the Mullins effect is accounted for through a damage parameter D , which evolves with the maximal strain energy density W m a x   reached in the mechanical loading history of the elastomer [29]:
D = 1 1 r e r f W m a x W ~ m + b W m a x
where r , m , and b are material parameters, e r f ( x ) is the error function, W m a x is the evolving maximum strain energy density reached throughout the deformation history and W   ~ the strain energy density function of a virgin material. Under a uniaxial test condition applied along direction i , the Cauchy stress (5) and the nominal stress (6) are represented as follows:
σ i = D µ λ i α λ i α 2
T i = σ i λ i
Figure 5 shows the experimental tensile test results of the two elastomers and the Ogden–Roxburgh model obtained from the material parameters of Table 1.

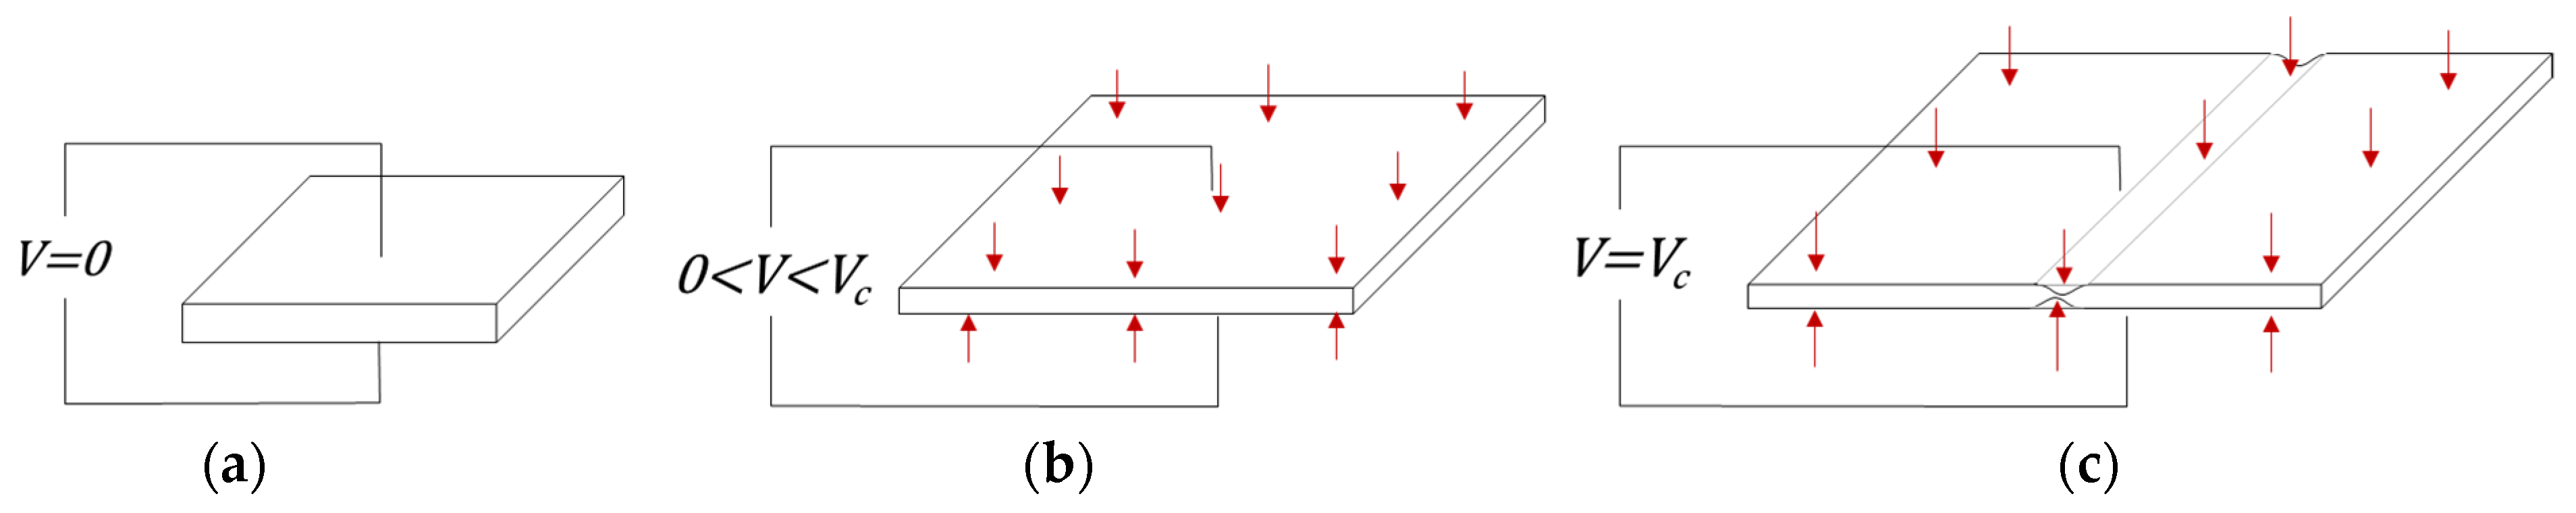
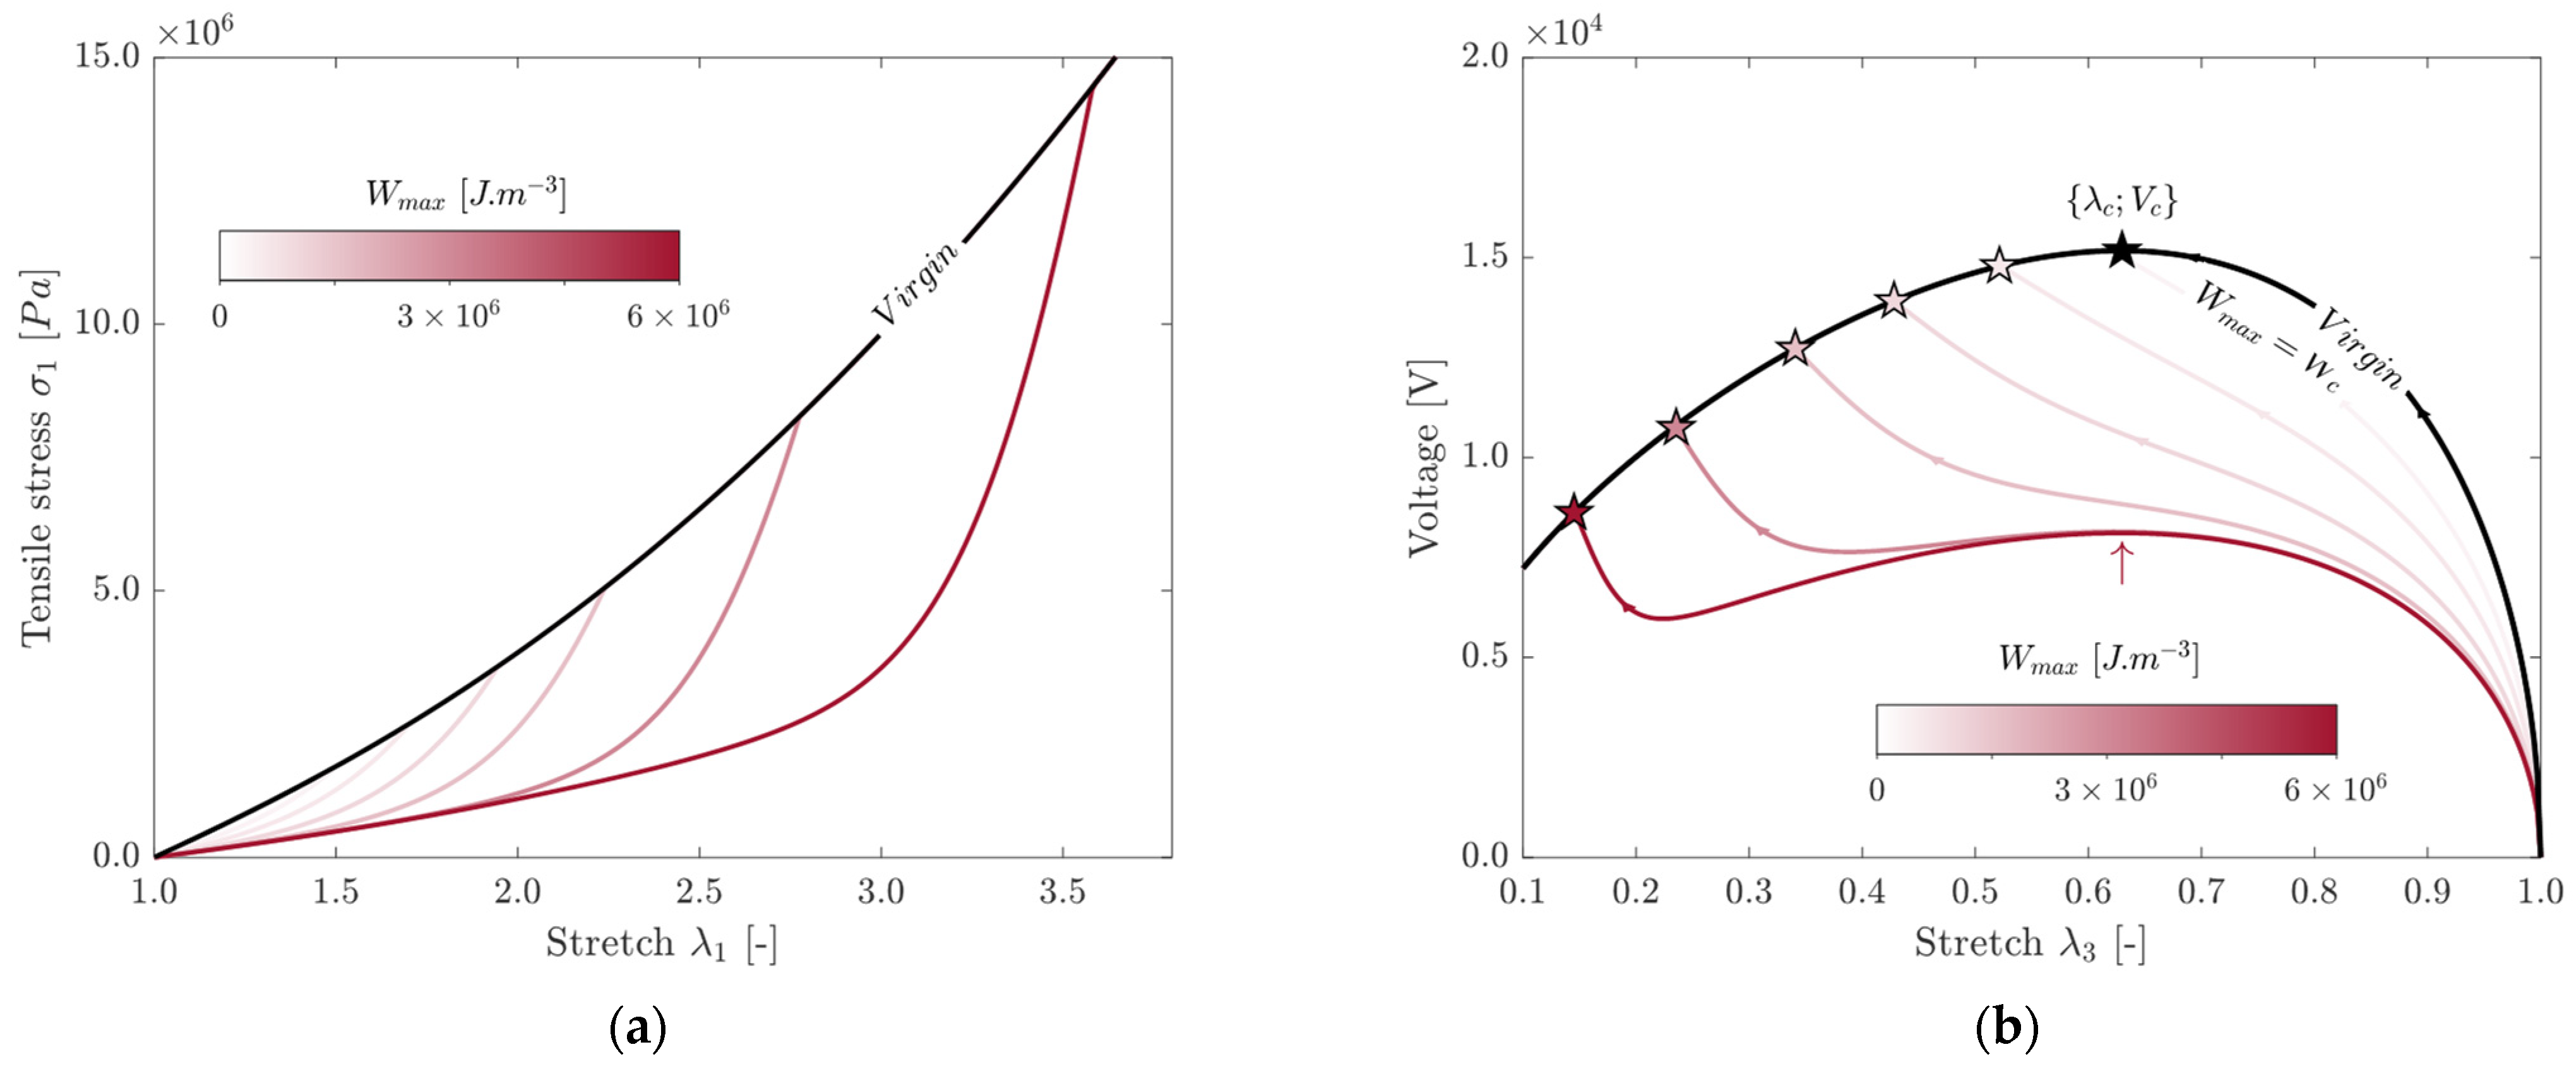
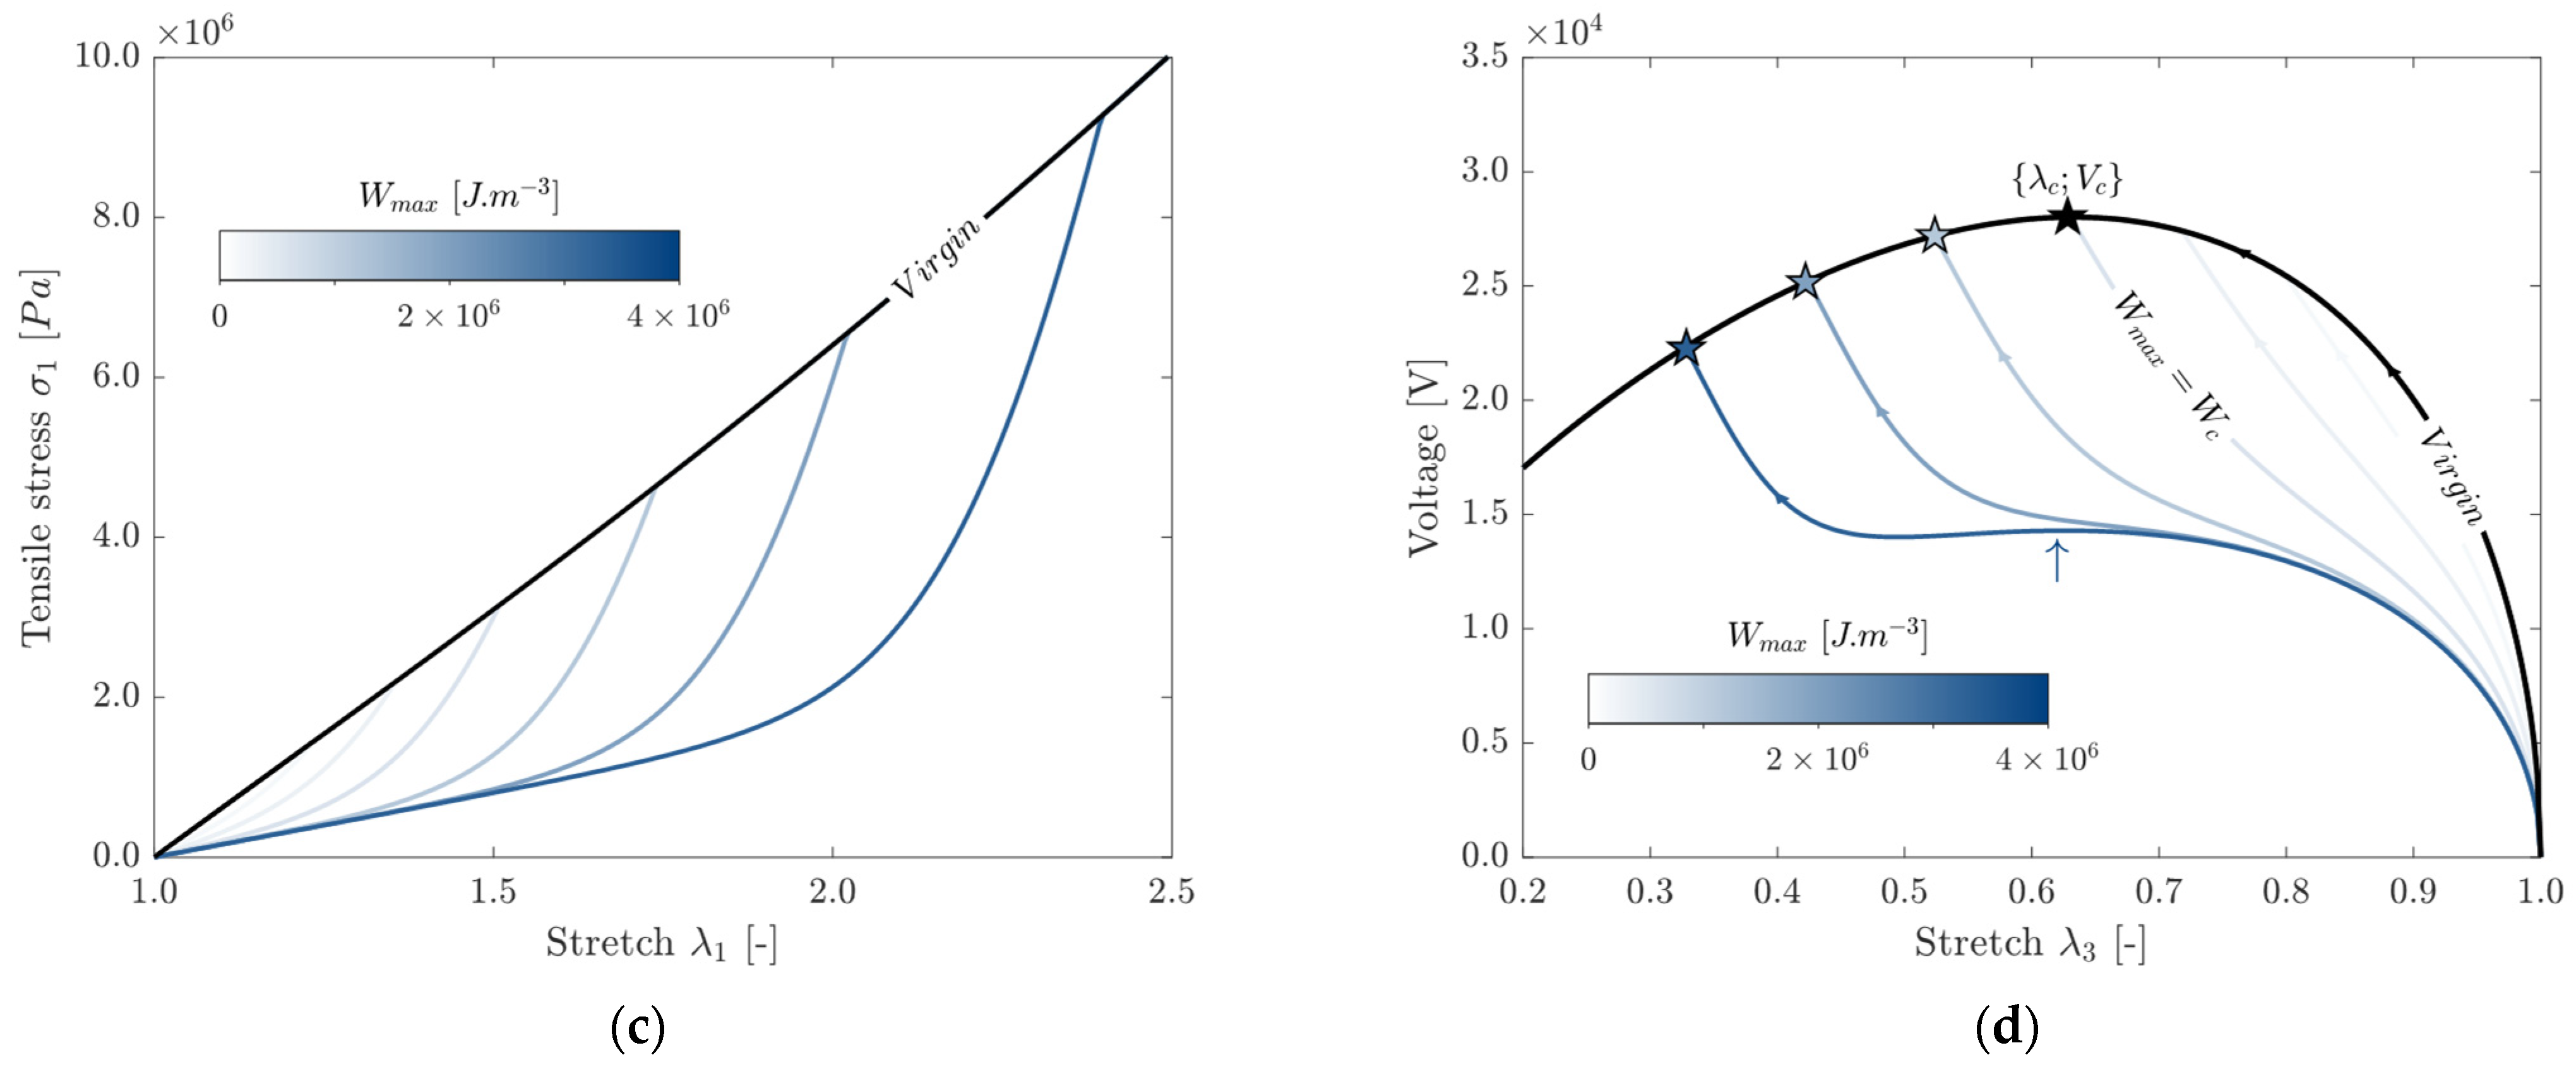
3.2. Electro-Mechanical Model

When subjected to an external voltage V , a dielectric elastomer experiences a Maxwell compressive stress σ E that reduces its thickness to d = λ 3 d 0 . The equation of this electrostatic compressive stress is given by (7) with ε 0   is the vacuum permittivity and ε r is the relative permittivity of the dielectric elastomer. This equation only holds if the permittivity is stretch-independent. In previous works [30,31], a variation of the permittivity with the applied stretch was reported for acrylic elastomers, whereas the permittivity of natural rubber was found insensitive to stretch. In our study, a stretch-independent relative permittivity of ε r   = 2.7 was measured, and that value is used in our model.
σ E = ε 0 ε r V d 2
At equilibrium, the mechanical stress (5) balances the electrostatic stress (6), and the relation between voltage and compressive stretch is given by (8). Voltage-induced actuation depends on the historical loading through the value of the damage parameter D. In this approach, the friction at the interface between the dielectric layer and electrodes is considered negligible, and the stiffness of the surrounding inactive material (not covered by electrodes) is assumed to have a marginal contribution on the actuation stretch of the active region.
V = λ 3 d 0 D µ ε 0 ε r λ 3 α λ 3 α 2
For a virgin material, the damage parameter D is inactive (taking the value 1), and λ 3 decreases (corresponding to compressive stretch) when the voltage increases (going from right to left in Figure 6b,d). This trend is observed until a maximum critical point { λ c ; V c }   at which no additional increase in the voltage is required to cause further deformation. This yields extreme deformations, causing an electrical breakdown because of the monotonic decrease in the voltage curve beyond that critical point. The model predicts a critical voltage V c   = 15 kV for the virgin unloaded 50 ShA and V c = 28 kV for 70 ShA used in this study.
When considering a sample that has been stretched prior to the breakdown experiment, the Mullins effect alters the material’s response to electrical stress, and the resultant voltage curve follows a different path before recovering one of the virgin materials. If the historical strain energy density W m a x applied in the tensile experiment is below a threshold W c , no consequence is predicted for the breakdown, as the irreversible critical point is identical to the point of the original virgin material. However, if W m a x   of a material has been raised above W c in its loading history, its voltage curve will not pass through the instability point and will recover the curve of the virgin material in an unstable region (where thickness collapses without the need for additional voltage). This leads to breakdown voltages lower than V c initiated at the locations of the colored stars, presented in Figure 6b,d.
Interestingly, for materials with significantly high values of historical SED, the voltage curve indicates a local maximum (upward arrow in Figure 6b,d). However, the decrease in the voltage is not monotonic beyond this local “pull-in instability”; thus, a further increase in voltage is required before recovering the permanently decreasing curve at the location of the stars (Figure 6b,d). A local instability does not necessarily imply an electrical breakdown [11,20]. However, once the curve of the virgin material is reached, the voltage becomes immediately unstable, resulting in a snap-through, which will ineluctably cause an electrical breakdown.

4. Results and Discussion
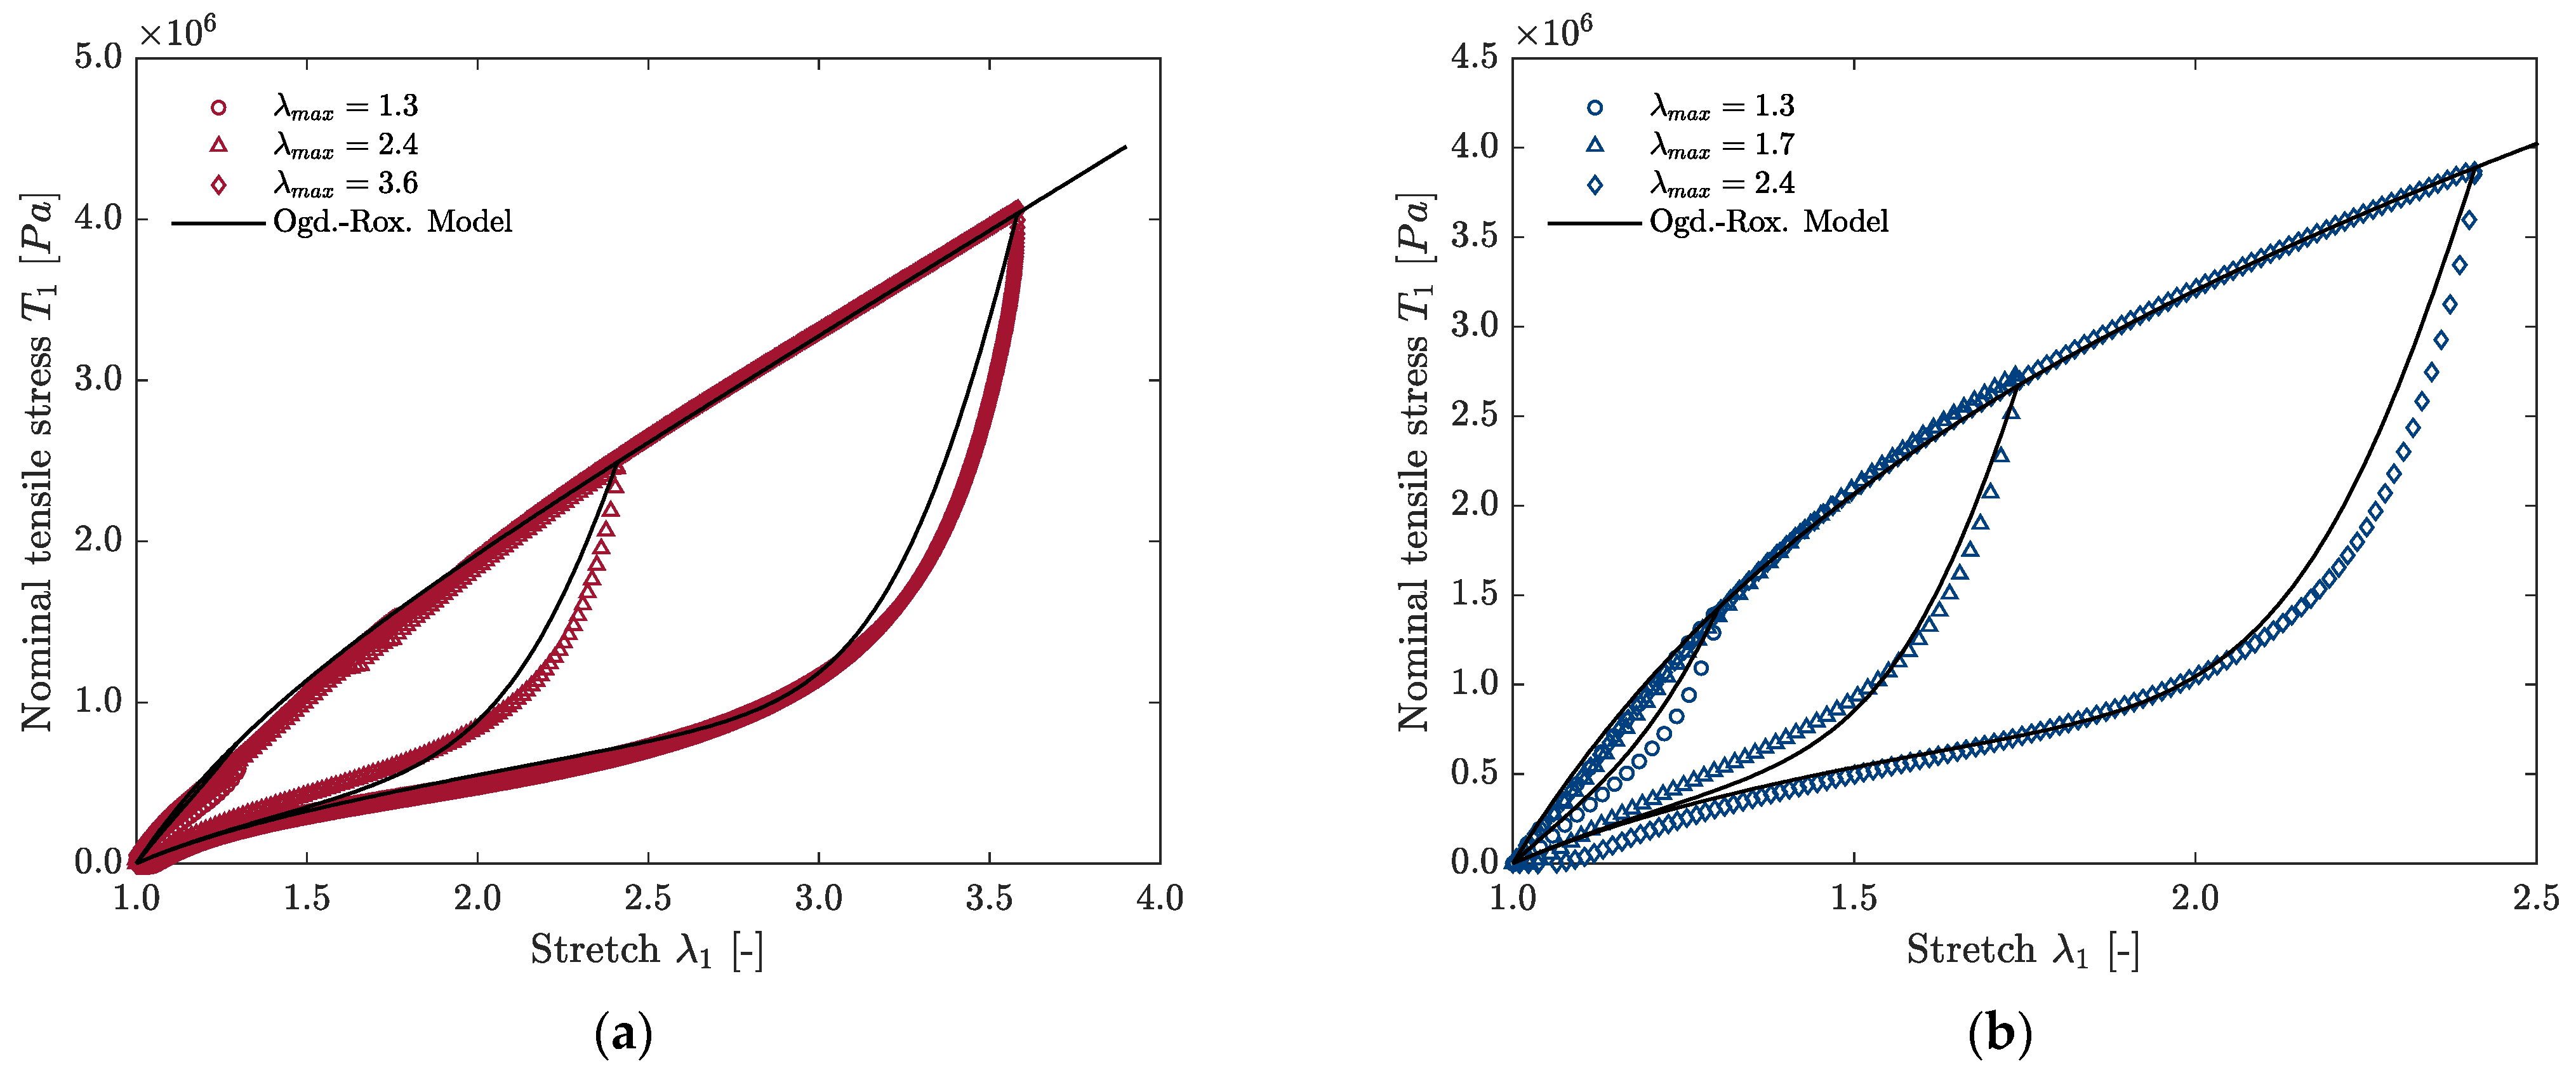
4.1. Mullins Effect

To confirm the theoretical predictions from the proposed model, the experimental DBS was measured for various values of maximum historical SED obtained from the tensile test experiment (Figure 7). The reported breakdown values for both model and experimental data were obtained from (1). For each individual mechanical loading case, the Weibull probability density function of the experimental electrical failures (2) is represented vertically. For the virgin sample and the first loading case of the 70 ShA elastomer, electrical breakdowns were not reached for all the testing locations due to the voltage limitation of the DC power supply. These corresponding data were treated as suspensions in the evaluation of the Weibull parameters and are represented by upward arrows in Figure 7b. For the virgin 50 ShA material, the mean of the experimental failure was measured at E ¯ = 140 ± 6   V · µ m 1 , whereas for the 70 ShA material, a significantly higher DBS of E ¯ = 224 ± 9   V · µ m 1 was obtained (uncertainties were determined from the two-sided 95% confidence bound interval). This increase in the DBS was anticipated by the EMI model introduced in Section 3.2 due to the substantial variation in mechanical properties between the two elastomers considered. For the 50 ShA material, the model predicts a breakdown value of 145 V·µm−1, and that value is contained within the confidence bounds of the experimental results. For the 70 ShA material, a breakdown strength of 205 V·µm−1 is calculated for a virgin material, which is only 8% lower than the mean experimental value. The historical SED threshold under which no consequence is expected on the DBS has been verified experimentally as the mean DBS of the samples previously stretched to λ m a x = 1.3 are very similar to the ones of the virgin materials ( E ¯ = 135 ± 6 V·µm−1 for the 50 ShA and E ¯ = 210 ± 7 V·µm−1 for the 70 ShA). Above this threshold, the overall feature of the Mullins damage is also predicted accurately compared with experimental data obtained for the most severe loading cases. This finding confirms that breakdown is initiated at the location of the stars, and the local instability observed on the highly stretched samples is not causing a breakdown. The behavior observed here supports previous works [11] where it was found that pull-in instability does not necessarily imply an electrical failure. The Mullins damage is found to cause a plateau in the stretch–voltage curve (Figure 6b,d). This feature is interesting for dielectric elastomer actuators for which obtaining a large stretch amplitude from a low voltage variation is desirable from a transducer efficiency perspective. Although a preliminary stretch of the elastomer beyond its operating domain can be used to enhance its actuation response, further measurement would be required to conclude whether the plateau could be exploited or not. The instability phenomenon might lead to localized inhomogeneous deformation, which is known as creasing, cratering, snap-through, or wrinkling, and the typical distance between creases was found to be approximately the same as the thickness of the film [32]. In our experimental setup, the electrode covers a relatively wide surface (40 mm diameter), and the actuation region is hidden underneath the steel cylinder, preventing direct observation of the actuation mechanisms.
In the Ogden–Roxburgh model, the damage parameter D is considered a scalar value indifferent to the direction of the principal strain. In the tensile experiment, the strain is applied along direction 1 (Figure 2), whereas the elastomer expands equibiaxially in the plane of the dielectric sheet when voltage increases. The Mullins effect-induced damage might preferably occur in the tensile direction, resulting in enhanced actuation along this axis. Further tests would be required to verify this anisotropy in the Mullins softening, with the possible outcome of tailoring the actuation response of dielectric elastomer actuators along a preferred orientation. This could be an alternative to the existing solutions that use orientated fibers to restrict deformation in one direction [33].
As the Mullins effect is found to reduce the breakdown strength significantly, it is worth discussing any potential mitigation to that degradation mechanism. The Mullins damage is attributed to complex interactions between polymeric chains and fillers. Therefore, it could be of interest to limit the silica content in PDMS composites while trying to stiffen the mechanical response using alternative strategies. Varying the crosslinking density of the elastomer network or changing the chemistry of the crosslinker could be considered in future research studies.

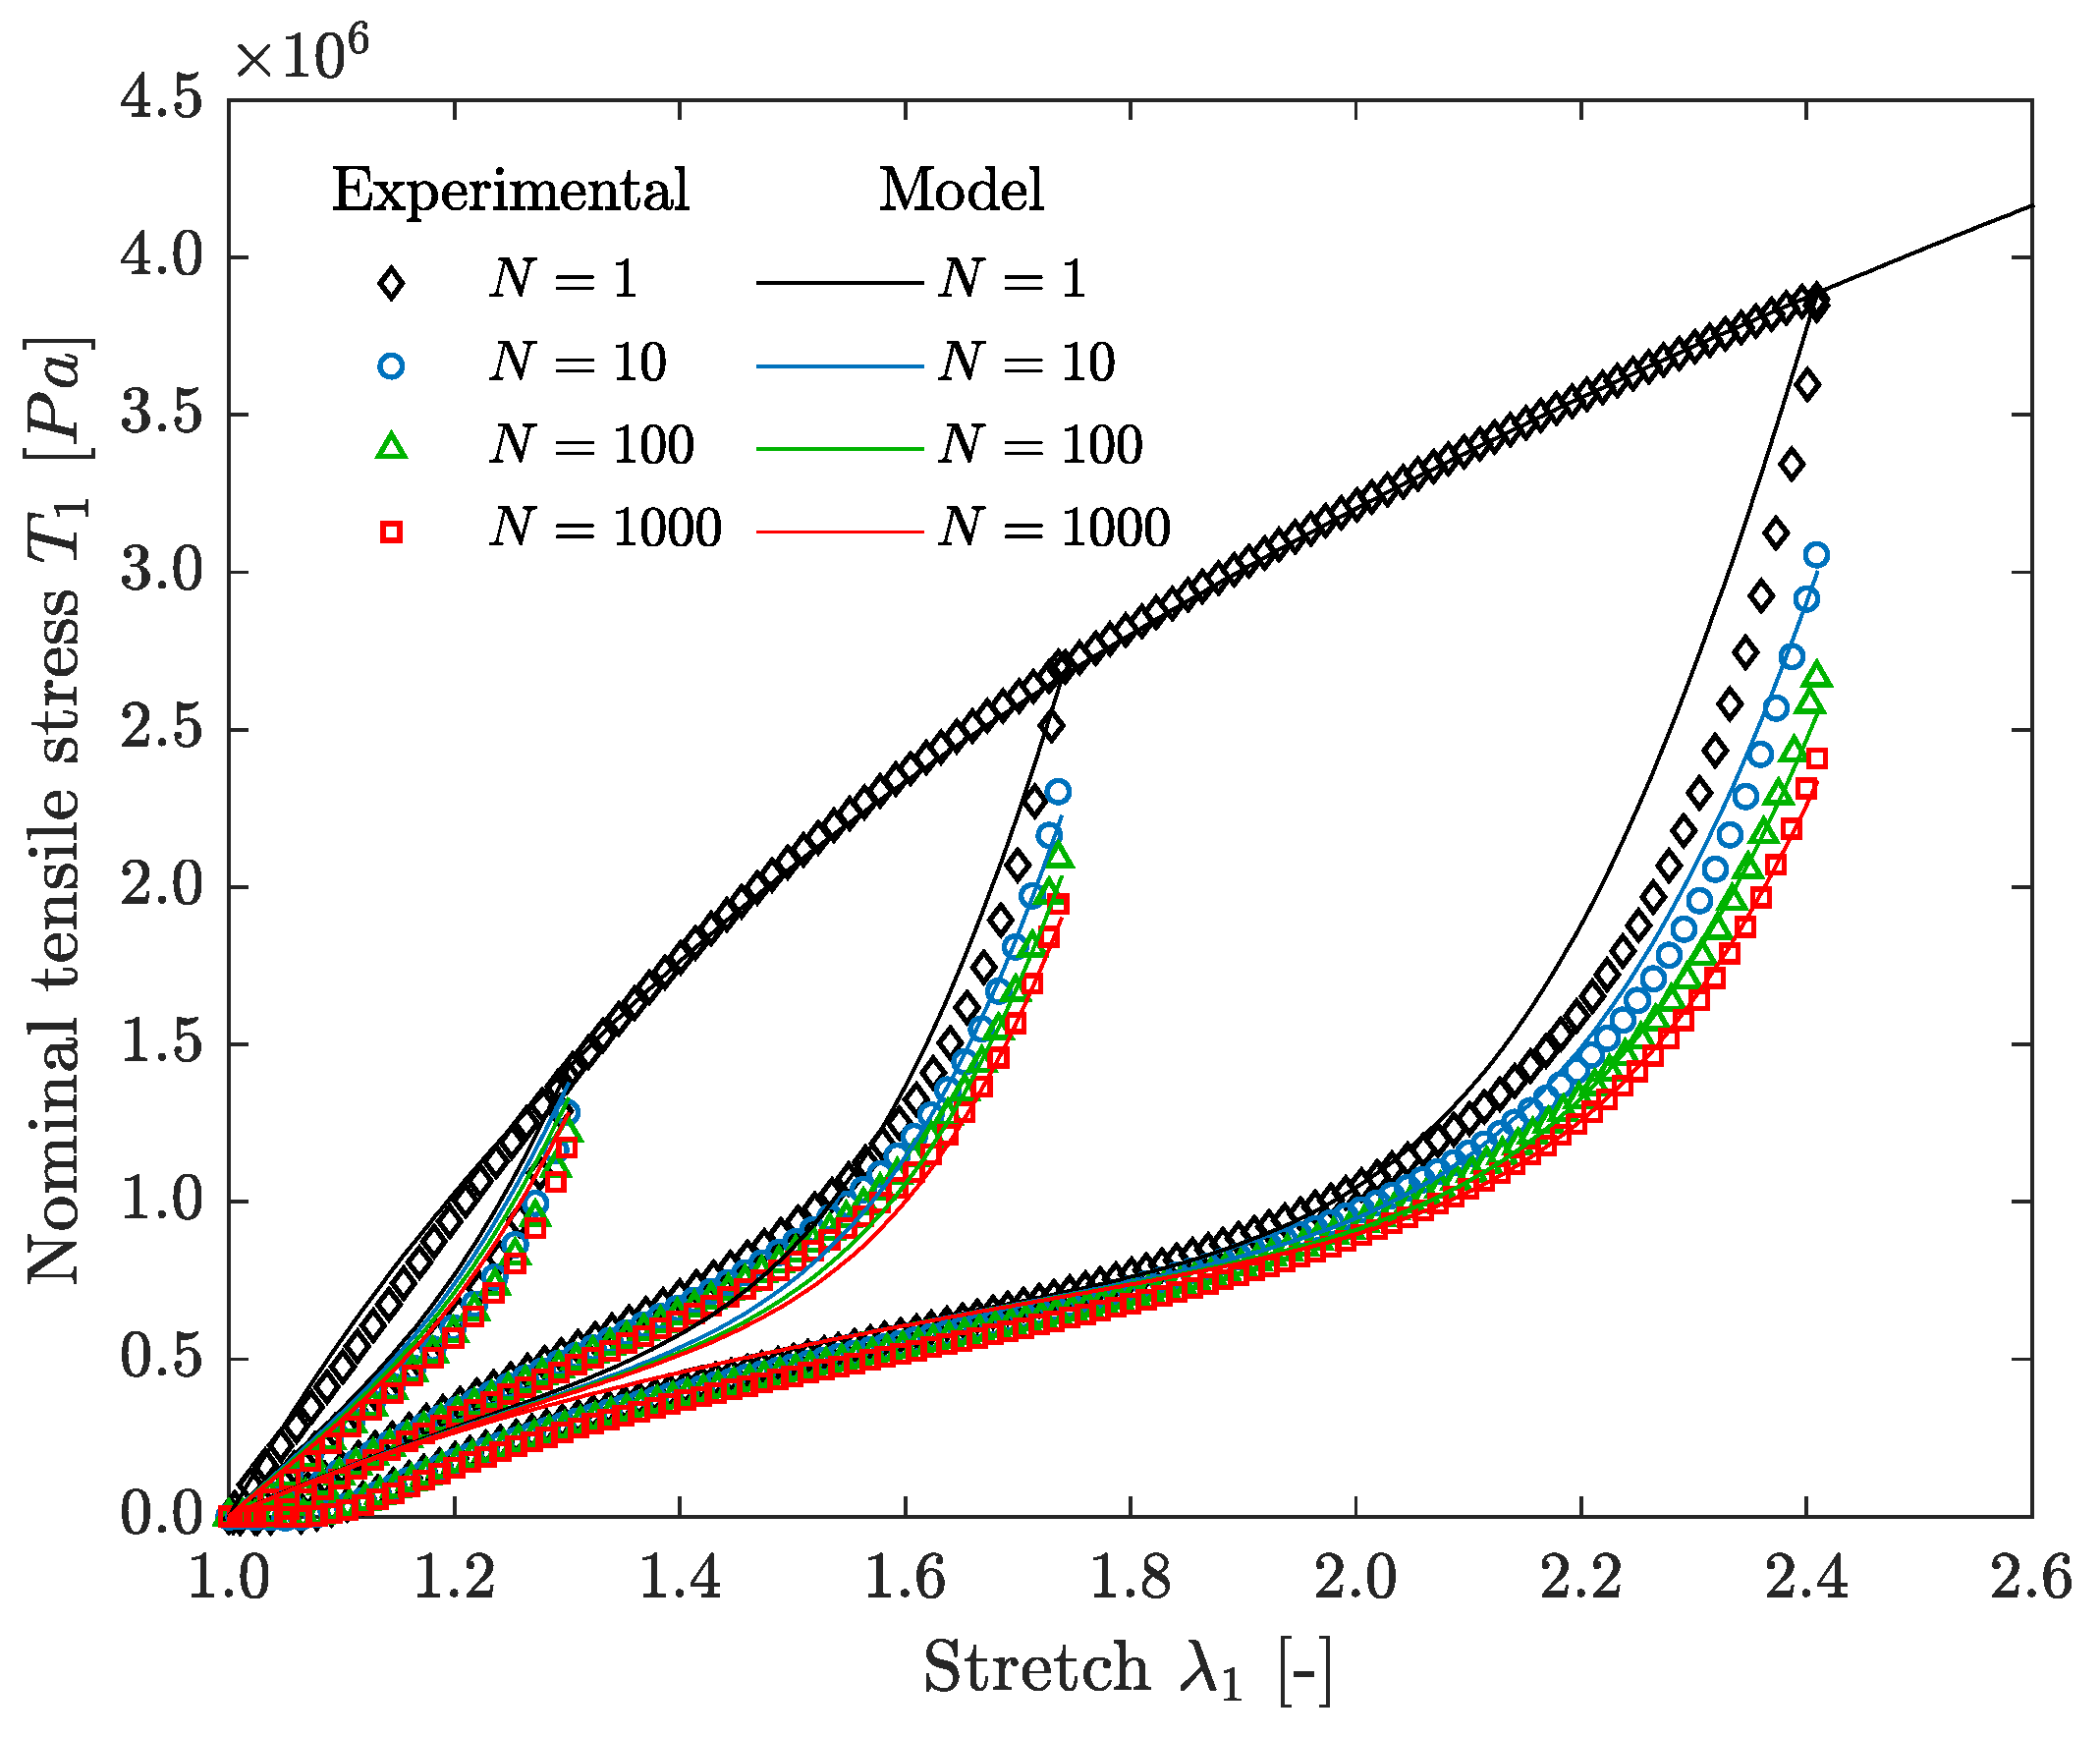
4.2. Mechanical Cycling
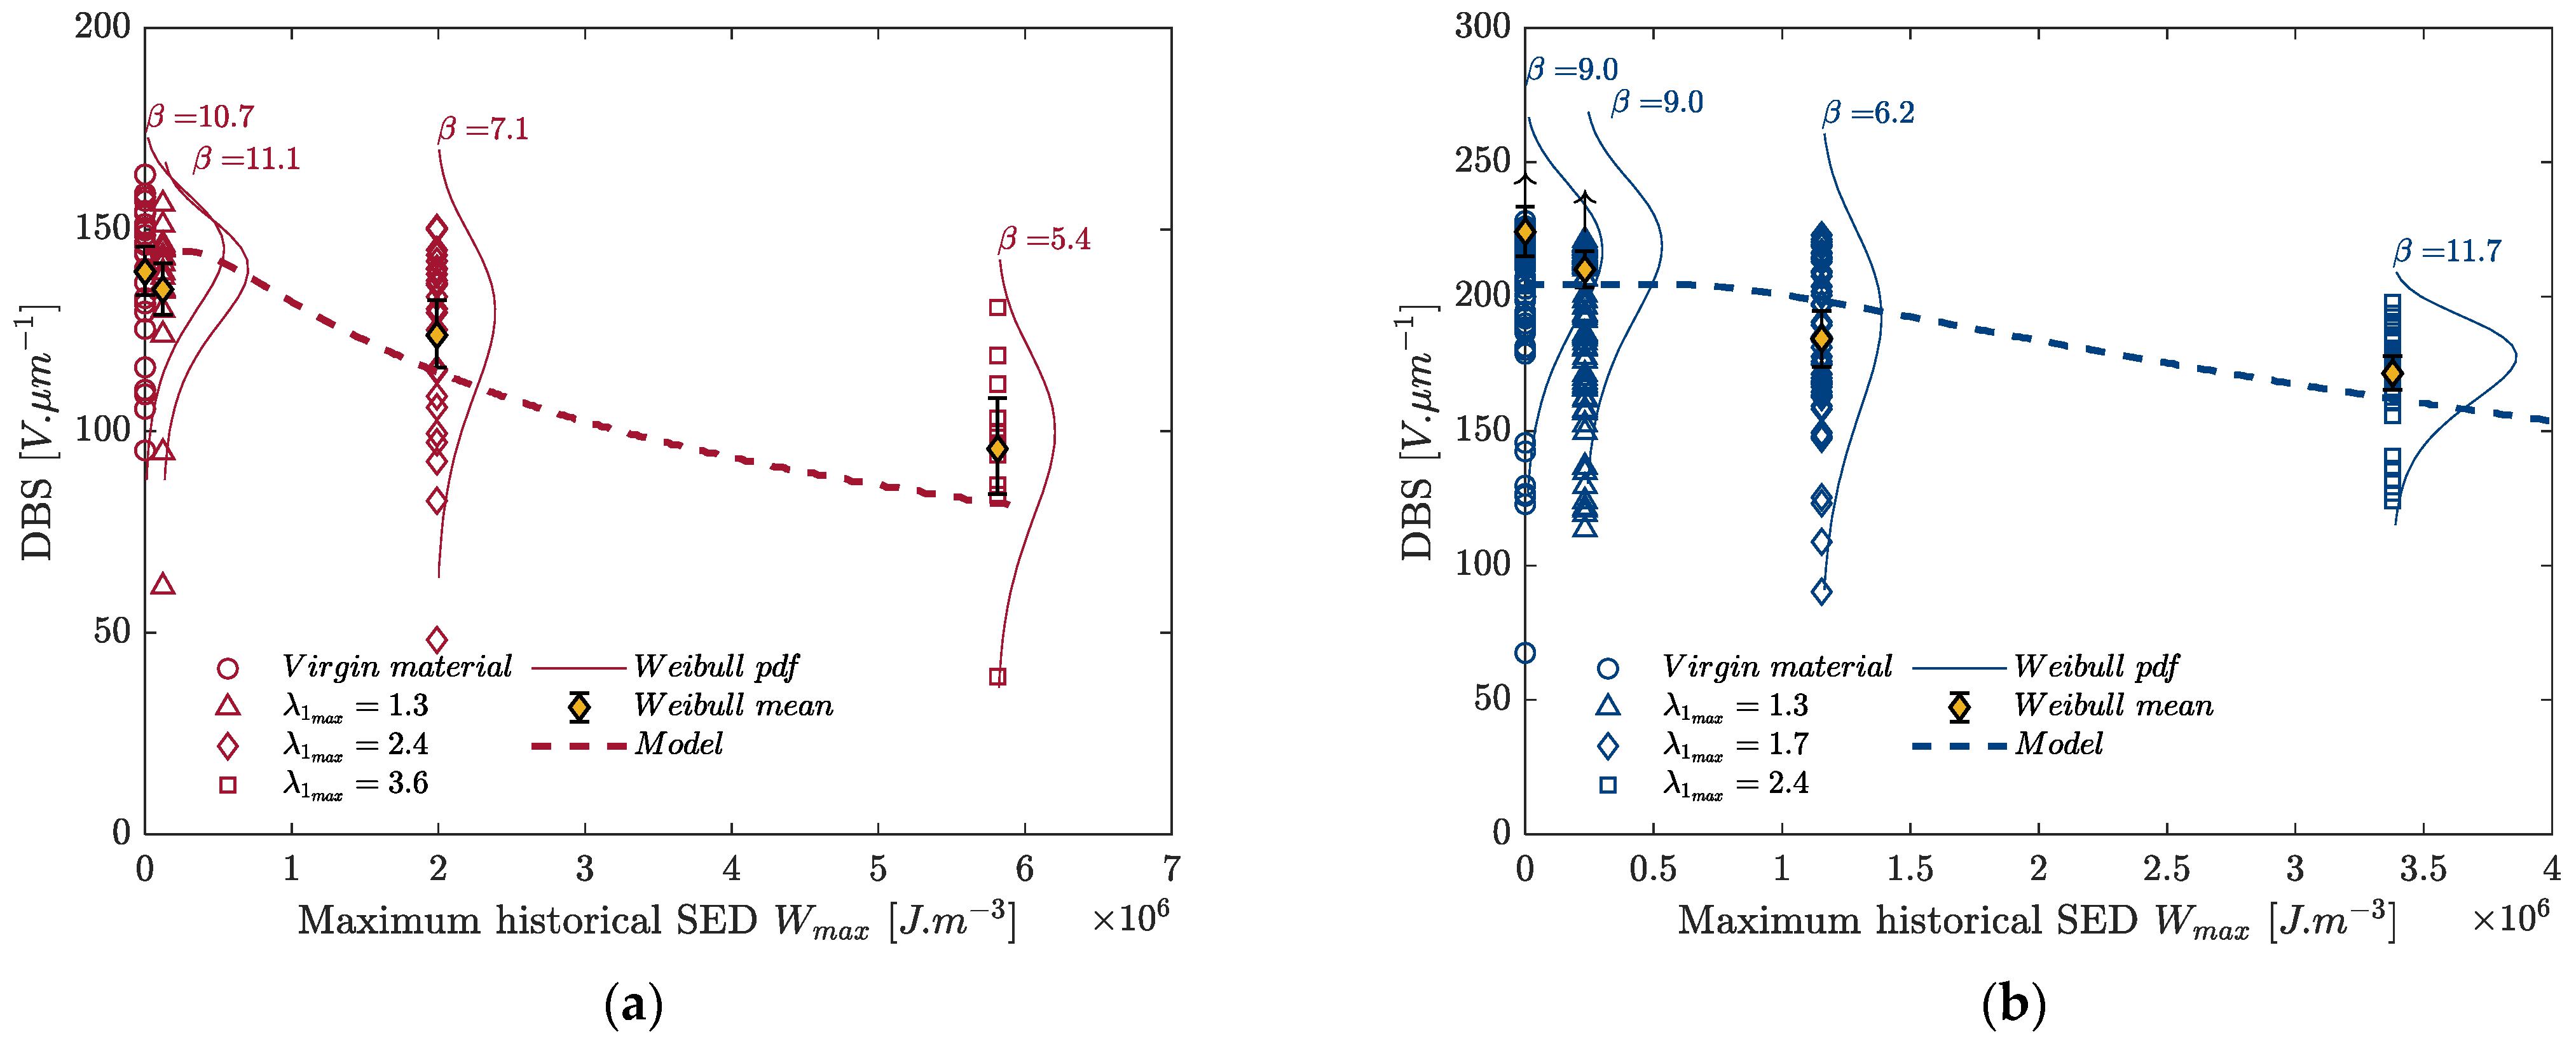
With the effect of cycle accumulation, the mechanical response is modified, leading to a softening of the elastomer and a reduction in the maximal stress reached in the mechanical cycle. Subsequent to the first cycle, minor changes are observed in the stress–stretch response between the loading and unloading phase, indicating that viscous losses can be considered negligible in proportion to the Mullins damage. Therefore, for the sake of clarity, it is chosen to display only the unloading curves in Figure 8, where the softening behavior is represented for the three stretch amplitudes evaluated. For the samples stretched to λ 1 m a x = 1.3 , the mechanical response is almost unaffected when the number of cycles increases. However, for the two other loading cases ( λ 1 m a x = 1.7 and λ 1 m a x = 2.4 ), the softening is significant and culminates in about a 40% reduction in the peak tensile stress after 1000 cycles.
From a modeling perspective, this softening can be interpreted as an increase in the Mullins damage with the number of cycles. A modification of the Ogden–Roxburgh model is introduced where the value of W m a x in (4) is replaced by a variable W * , which increases with the number N of mechanical cycles (9). An exponential function (10) is chosen for the expression of W *   as it was found to represent the experimental cycle-induced softening accurately.
D = 1 1 r e r f W * W ~ m + b W *
W * = W m a x e A ( 1 1 N B )
Parameters A = 0.24 and B = 0.25 were calculated, such as minimizing the error between the evolving experimental tensile stress and the stress derived from the modified Ogden–Roxburgh model (Figure 8). This approach constitutes a convenient way to model the experimental results but is only valid if the maximal stretch remains constant during the fatigue experiment. In the case of more complex random loadings, a different softening is expected, which would require the implementation of more sophisticated constitutive models.
Using this modified damage parameter in (8) allows us to predict the evolution of the EMI in the stretch–voltage diagram based on the number of cycle repetitions (Figure 9). For the lower stretch amplitude ( λ 1 m a x = 1.3 ), the location of the critical instability is found unaffected as the instability is identical to the snap-through of the virgin material, as represented by the black star in Figure 9. For the larger stretch amplitudes, only minor reductions in the breakdown voltage are expected after mechanical fatigue, as the location of the snap-through is marginally modified compared to a sample stretched only once ( N = 1 ). In other words, the softening caused by the Mullins effect predominantly contributes to the location of the EMI, whereas the role of fatigue softening appears negligible.
To verify these model predictions, experimental breakdown tests were performed on unstretched film after a different number of mechanical cycles at three given stretch amplitudes (Figure 10). A good agreement was found between the EMI model and the mean of the Weibull distributions. It indicates that at this relatively low number of cycles, the breakdown strength is still driven by EMI. In this experimental setup, the number of cycles was limited to one thousand mechanical cycles because of the limited capacity of the tensile machine or premature failure of the samples in the clamping system. Extrapolating the result to long-term fatigue is not expected to affect the breakdown response further as the Mullins damage tends to stabilize towards an asymptotic endpoint as the number of cycles increases. However, for a large number of cycles, one could expect micro-cracks to propagate/nucleate, resulting in local electric weak points that cannot be captured from a global mechanical characterization. However, this type of flaw was not observed in the most severely loaded sample ( λ m a x = 2.4 and N = 1000 cycles) with microscope inspection under ×700 magnification, further fatigue experiments on longer duration can constitute future research work to better understand the long-term performance of dielectric elastomer generators.

4.3. Energy Density

The convertible energy W e of DEGs is known to increase linearly with the relative permittivity ε r and quadratically with an increasing applied electric field (11) [1].
W e ε r E B D 2
Intense research activities are devoted to developing material formulations with higher relative permittivity [34], which is valuable for decreasing the operating voltage of dielectric actuators or enhancing their actuation stretch. However, it is worth discussing its beneficial contribution to DEGs. Inserting (8) into (11) shows that the convertible energy is actually independent of ε r for a system in which the failure mechanism is driven by electro-mechanical instabilities (12). In other words, a rise in the relative permittivity is equally balanced by a reduction in the breakdown voltage in the overall energy balance. Although the underlying conclusion only holds if the relative permittivity remains unchanged with the accumulated mechanical damage, that property shall be considered carefully when attempting to develop new material formulations with enhanced energy densities.
W e λ c 2 D µ λ c α λ c α 2
Increasing the pre-stretch of the dielectric elastomer is a strategy that is often reported to prevent electro-mechanical instability and can be an option to overcome the limitation between permittivity and breakdown strength. However, in large-scale DEG, the failure mechanism is rarely driven by EMI, as the probability of defect-related breakdowns scales with the size of the transducer [14]. In such a case, increasing the permittivity might still be beneficial to increase the energy density of DEG.

5. Conclusions

The influence of multiple mechanical cycles on the DBS of PDMS elastomers has been investigated. The stretch amplitude of the first cycle was found to be of primary importance because the Mullins effect significantly changes the onset of electro-mechanical instability. Using stiffer PDMS elastomers is one approach for increasing the dielectric breakdown strength of a virgin material; however, this beneficial enhancement is partially counteracted by a higher softening resulting from the Mullins damage.
Subsequently, after this first loading, the breakdown strength remains nearly stable up to 1000 cycles. These experimental results are consistent with theoretical predictions obtained from a hyperelastic model that uses the damage accumulated along the fatigue experiment to derive the evolution of the electro-mechanical instability.
The outcome of this study helps to understand the relationship between dielectric performance and mechanical properties and contributes to gaining knowledge on the long-term reliability of DEGs. This constitutes one of the key milestones to reach before deploying these systems in commercial applications.

Author Contributions

Conceptualization, E.T., T.A., I.A.S. and P.H.F.M.; methodology, E.T., T.A., I.A.S. and P.H.F.M.; software, E.T.; validation, E.T., T.A., I.A.S. and P.H.F.M.; formal analysis, E.T., T.A., I.A.S. and P.H.F.M.; investigation, E.T., T.A., I.A.S. and P.H.F.M.; resources, T.A. and P.H.F.M.; data curation, E.T.; writing—original draft preparation, E.T.; writing—review and editing, E.T., T.A., I.A.S. and P.H.F.M.; visualization, E.T.; supervision, T.A. and I.A.S.; project administration, P.H.F.M. All authors have read and agreed to the published version of the manuscript.

Funding

This research was funded by SBM Offshore in the frame of the S3 Wave Energy Converter.

Data Availability Statement

Data presented in this study are available at the following DOI: https://doi.org/10.6084/m9.figshare.24334924.v2 (accessed on 1 November 2023).

Conflicts of Interest

SBM Offshore is funding a research project that aims at increasing the energy density of dielectric elastomer generators. The project is held by P.M., who acts as project coordinator and expert consultant. The University of Southampton is an academic partner for this project. The content of our study presents part of the work performed in the frame of this research project. E.T. is an employee of SBM Offshore and a PhD student from the University of Southampton. T.A. and I.S. are with the University of Southampton. P.M. acts as a project coordinator and expert consultant for the project. We hereby declare that the funder has no role in the study’s design, in the collection, analysis, or interpretation of data, or the writing of the manuscript. The funder has reviewed and approved the manuscript without asking for modifications to the original version.

References

  1. Moretti, G.; Rosset, S.; Vertechy, R.; Anderson, I.; Fontana, M. A review of dielectric elastomer generator systems. Adv. Intell. Syst. 2020, 2, 2000125. [Google Scholar] [CrossRef]
  2. Kornbluh, R.D.; Eckerle, J.; McCoy, B. A Scalable Solution to Harvest Kinetic Energy; SPIE Newsroom: Bellingham, WA, USA, 2011. [Google Scholar]
  3. Jean, P.; Wattez, A.; Ardoise, G.; Melis, C.; Van Kessel, R.; Fourmon, A.; Barrabino, E.; Heemskerk, J.; Queau, J.P. Standing wave tube electro active polymer wave energy converter. In Proceedings of the Electroactive Polymer Actuators and Devices (EAPAD), San Diego, CA, USA, 12–15 March 2012; SPIE: Bellingham, WA, USA, 2012; pp. 75–95. [Google Scholar]
  4. Moretti, G.; Rosati, G.; Daniele, L.; Forehand, D.; Ingram, D.; Vertechy, R.; Fontana, M. Modelling and testing of a wave energy converter based on dielectric elastomer generators. Proc. R. Soc. A 2019, 475, 20180566. [Google Scholar] [CrossRef] [PubMed]
  5. Vudayagiri, S.; Zakaria, S.; Yu, L.; Hassouneh, S.; Benslimane, M.; Skov, A. High breakdown-strength composites from liquid silicone rubbers. Smart Mater. Struct. 2014, 23, 105017. [Google Scholar] [CrossRef]
  6. Kollosche, M.; Kofod, G. Electrical failure in blends of chemically identical, soft thermoplastic elastomers with different elastic stiffness. Appl. Phys. Lett. 2010, 96, 071904. [Google Scholar] [CrossRef]
  7. Taine, E.; Andritsch, T.; Saeedi, I.; Morshuis, P. Effect of mechanical loading history on the electrical breakdown strength of dielectric elastomers. In Proceedings of the 2022 IEEE 4th International Conference on Dielectrics (ICD), Palermo, Italy, 3–7 July 2022; IEEE: Piscataway, NJ, USA, 2022; pp. 21–24. [Google Scholar]
  8. Kofod, G.; Sommer-Larsen, P.; Kornbluh, R.D.; Pelrine, R. Actuation response of polyacrylate dielectric elastomers. J. Intell. Mater. Syst. Struct. 2003, 14, 787–793. [Google Scholar] [CrossRef]
  9. Iannarelli, A.; Niasar, M.G.; Ross, R. The effects of static pre-stretching on the short and long-term reliability of dielectric elastomer actuators. Smart Mater. Struct. 2019, 28, 125014. [Google Scholar] [CrossRef]
  10. Zakaria, S.; Morshuis, P.H.F.; Benslimane, M.Y.; Yu, L.; Skov, A.L. The electrical breakdown strength of pre-stretched elastomers, with and without sample volume conservation. Smart Mater. Struct. 2015, 24, 055009. [Google Scholar] [CrossRef]
  11. Gatti, D.; Haus, H.; Matysek, M.; Frohnapfel, B.; Tropea, C.; Schlaak, H.F. The dielectric breakdown limit of silicone dielectric elastomer actuators. Appl. Phys. Lett. 2014, 104, 052905. [Google Scholar] [CrossRef]
  12. Gerratt, A.P.; Bergbreiter, S. Dielectric breakdown of PDMS thin films. J. Micromech. Microeng. 2013, 23, 067001. [Google Scholar] [CrossRef]
  13. Förster-Zügel, F.; Grotepaß, T.; Schlaak, H. Characterization of the dielectric breakdown field strength of PDMS thin films: Thickness dependence and electrode shape. In Proceedings of the Electroactive Polymer Actuators and Devices (EAPAD), San Diego, CA, USA, 9–12 March 2015; SPIE: Bellingham, WA, USA, 2015; p. 94300D. [Google Scholar]
  14. Taine, E.; Andritsch, T.; Saeedi, I.A.; Morshuis, P.H.F. Size effect and electrical ageing of PDMS dielectric elastomer with competing failure modes. Smart Mater. Struct. 2023, 32, 105021. [Google Scholar] [CrossRef]
  15. Diani, J.; Fayolle, B.; Gilormini, P. A review on the Mullins effect. Eur. Polym. J. 2009, 45, 601–612. [Google Scholar] [CrossRef]
  16. Hanson, D.E.; Hawley, M.; Houlton, R.; Chitanvis, K.; Rae, P.; Bruce Orler, E.; Wrobleski, D.A. Stress softening in silica-filled polydimethylsiloxane provide insight into a mechanism for the Mullins effect. Polymer 2005, 46, 10989–10995. [Google Scholar] [CrossRef]
  17. Clément, F.; Bakobza, L.; Monnerie, L. On the Mullins effect of in silica-filled polydimethylsiloxane networks. Rubber Chem. Technol. 2001, 74, 847–870. [Google Scholar] [CrossRef]
  18. Georgousis, G.; Roumpos, K.; Kontou, E.; Kyritsis, A.; Pissis, P.; Koutsoumpis, S.; Mičušík, M.; Omastová, M. Strain and damage monitoring in SBR nanocomposites under cyclic loading. Compos. Part B Eng. 2017, 131, 50–61. [Google Scholar] [CrossRef]
  19. Cantournet, S.; Desmorat, R.; Besson, J. Mullins effect and cyclic stress softening of filled elastomers by internal sliding and friction thermodynamics model. Int. J. Solids Struct. 2009, 46, 2255–2264. [Google Scholar] [CrossRef]
  20. Koh, S.J.A.; Li, T.; Zhou, J.; Zhao, X.; Hong, W.; Zhu, J.; Suo, Z. Mechanisms of large actuation strain in dielectric elastomers. J. Polym. Sci. Part B Polym. Phys. 2011, 49, 504–515. [Google Scholar] [CrossRef]
  21. Garton, C.G.; Stark, K.H. Electric strength of irradiated polythene. Nature 1995, 176, 1225–1226. [Google Scholar]
  22. Zhao, X.; Suo, Z. Electromechanical instability in semicrystalline polymers. Appl. Phys. Lett. 2009, 95, 031904. [Google Scholar] [CrossRef]
  23. Akbari, S.; Rosset, S.; Shea, H.R. Improved electromechanical behavior in castable dielectric elastomer actuators. Appl. Phys. Lett. 2013, 102, 071906. [Google Scholar] [CrossRef]
  24. Zhang, M.; Denes, I.; Buchmeiser, M.R. Interplay between Mechanical Fatigue and Network Structure and Their Effects on Mechanical and Electrical Properties of Thin Silicone Films with Varying Stoichiometric Imbalance. Macromol. Chem. Phys. 2016, 217, 1558–1568. [Google Scholar] [CrossRef]
  25. Vertechy, R.; Chen, Y.; Agostini, L.; Moretti, G.; Fontana, M.; Berselli, G. Fatigue life performances of silicone elastomer membranes for dielectric elastomer transducers: Preliminary results. In Proceedings of the Electroactive polymer actuators and devices (EAPAD), Denver, CO, USA, 4–7 March 2019; p. 27. [Google Scholar]
  26. ASTM-D149-20; Standard Test Method for Dielectric Breakdown Voltage and Dielectric Strength of Solid Electrical Insulating Materials at Commercial Power Frequencies. ASTM: West Conshohocken, PA, USA, 2020.
  27. Carpi, F.; Anderson, I.; Bauer, S.; Frediani, G.; Gallone, G.; Gei, M.; Graaf, C.; Jean-Mistral, C.; Kaal, W.; Kofod, G.; et al. Standards for dielectric elastomer transducers. Smart Mater. Struct. 2015, 24, 105025. [Google Scholar] [CrossRef]
  28. Nelson, W.B. Accelerated Testing: Statistical Models, Test Plans, and Data Analysis; John Wiley & Sons: Hoboken, NJ, USA, 1990. [Google Scholar]
  29. Ogden, R.W.; Roxburgh, D.G. A pseudo-elastic model for the Mullins effect in filled rubber. Proc. R. Soc. Lond. 1999, 455, 2861–2877. [Google Scholar] [CrossRef]
  30. Hyouk Ryeol, C.; Kwangmok, J.; Nguyen Huu, C.; Minyoung, J.; Igmo, K.; Jachoon, K.; Joonho, L.; Jonghoon, L.; Jaedo, N.; Misuk, C.; et al. Effects of prestrain on behavior of dielectric elastomer actuator. In Proceedings of the Smart Structures and Materials 2005: Electroactive Polymer Actuators and Devices (EAPAD), San Diego, CA, USA, 7–10 March 2005; SPIE: Bellingham, WA, USA, 2005; pp. 283–291. [Google Scholar]
  31. Tröls, A.; Kogler, A.; Baumgartner, R.; Kaltseis, R.; Keplinger, C.; Schwödiauer, R.; Graz, I.; Bauer, S. Stretch dependence of the electrical breakdown strength and dielectric constant of dielectric elastomers. Smart Mater. Struct. 2013, 22, 104012. [Google Scholar] [CrossRef]
  32. Wang, Q.; Tahir, M.; Zang, J.; Zhao, X. Dynamic Electrostatic Lithography: Multiscale On-Demand Patterning on Large-Area Curved Surfaces. Adv. Mater. 2012, 24, 1947–1951. [Google Scholar] [CrossRef] [PubMed]
  33. Lu, T.; Huang, J.; Jordi, C.; Kovacs, G.; Huang, R.; Clarke, D.R.; Suo, Z. Dielectric elastomer actuators under equal-biaxial forces, uniaxial forces, and uniaxial constraint of stiff fibers. Soft Matter 2012, 8, 6167–6173. [Google Scholar] [CrossRef]
  34. Madsen, F.B.; Daugaard, A.E.; Hvilsted, S.; Skov, A.L. The Current State of Silicone-Based Dielectric Elastomer Transducers. Macromol. Rapid Commun. 2016, 37, 378–413. [Google Scholar] [CrossRef]
Figure 1. (a) Dielectric elastomer at rest, (b)thinned by an electric field, (c) and electro-mechanical instability (c). The electro-static pressure is schematically represented by red arrows.
Energies 16 07424 g001
Figure 2. Tensile test sample: (a) unloaded; (b) stretched to λ 1 ; (c) corresponding experimental setup. Axes of the coordinate system are denoted as 1, 2, and 3.
Energies 16 07424 g002
Figure 3. (a) Schematic representation of the thickness measurement using the Eddy current sensor, (b) location of measurement points on the tensile test sample, (c) distribution of thickness measurements for the two elastomers evaluated.
Energies 16 07424 g003
Figure 4. (a) Schematic of the breakdown setup; (b) automated multipoint DBS tester.
Energies 16 07424 g004
Figure 5. Mullins effect and strain softening behavior modeled with an Ogden–Roxburgh model: (a) 50 ShA material; (b) 70 ShA material.
Energies 16 07424 g005
Figure 6. Uniaxial tensile stress derived from the Ogden–Roxburgh model (left column) and evolution of the critical instability (right column) for (a,b) the 50 ShA material; (c,d) the 70 ShA material. Initiation of the critical instability is represented with stars.
Energies 16 07424 g006aEnergies 16 07424 g006b
Figure 7. Comparison of experimental data to the EMI model: (a) 50 ShA material; (b) 70 ShA material.
Energies 16 07424 g007
Figure 8. Softening of the 70 ShA material with cycling.
Energies 16 07424 g008
Figure 9. Evolution of the critical instability in the stretch–voltage diagram. The critical instability of a virgin material is represented with a black star.
Energies 16 07424 g009
Figure 10. Evolution of the dielectric breakdown strength with mechanical cycling after a maximal stretch of: (a) λ 1 = 1.3 ; (b) λ 1 = 1.7 ; (c) λ 1 = 2.4 .
Energies 16 07424 g010aEnergies 16 07424 g010b
Table 1. Ogden and Ogden–Roxburgh parameters [7].
ParameterSymbol50 ShA70 ShAUnit
Ogdenµ1.01 × 1062.58 × 106Pa
α 2.11.61
Ogden–Roxburgh r 1.41.35
m 7.0 × 1053.4 × 105
b 0.20.26
Disclaimer/Publisher’s Note: The statements, opinions and data contained in all publications are solely those of the individual author(s) and contributor(s) and not of MDPI and/or the editor(s). MDPI and/or the editor(s) disclaim responsibility for any injury to people or property resulting from any ideas, methods, instructions or products referred to in the content.

