Article

Biogas Production—The Effect of the Zinc Concentration on the Profile of Volatile Fatty Acids in Fermentation Mixtures

by
Marcin Cichosz
1,2,*,
Sławomir Łazarski
2,3,*,
Andrzej Butarewicz
3 and
Urszula Kiełkowska
1
1
Department of Chemical Technology, Faculty of Chemistry, Nicolaus Copernicus University in Toruń, 7 Gagarin Street, 87-100 Toruń, Poland
2
MCMP Sp. z o.o., 5 Świerkowa Street, 86-300 Grudziądz, Poland
3
Faculty of Civil Engineering and Environmental Sciences, Bialystok University of Technology, 45A Wiejska Street, 15-351 Bialystok, Poland
*
Authors to whom correspondence should be addressed.
Energies 2023, 16(21), 7425; https://doi.org/10.3390/en16217425
Submission received: 13 September 2023 / Revised: 31 October 2023 / Accepted: 31 October 2023 / Published: 3 November 2023
(This article belongs to the Special Issue Advances in Bioenergy)

Abstract

:
The development of renewable energy sources is one of the most important paths for today’s economy to follow. Currently, the process of obtaining energy from the combustion of methane extracted by methane fermentation is gaining importance. To improve its efficiency and the speed of the fermentation process and enzyme activation, this study analyzed the effect of the addition of zinc as a micronutrient to fermentation processes using corn silage. The zinc concentration in the fermenter required to stimulate fermentation processes was determined. Studies were conducted to determine inhibitory and toxic concentrations. The determination of the influence of zinc ions on the VFA profile and the value of the carbon-to-methane conversion coefficient is important for the economic aspects of obtaining biogas with the highest methane content. The carbon-to-methane conversion factor and the effect of the addition of zinc on the value of this factor were determined. During the course of the research, modern analytical chemistry methods and techniques were used. The purpose of this study was to determine the optimal concentration of zinc in the digester to maximize the methane yield of the fermentation process.

Graphical Abstract

1. Introduction

1.1. Problem Statement

Potentially toxic elements (PTEs) are ions that are in the process of anaerobic decomposition that accumulate outside the bacterial cell through precipitation [1] with CO32−, S2−, and OH ions [2] and intracellular microbial uptake [3]. One of the processes of removing heavy metal ions from the reaction environment is adsorption on plant material and inert parts.
The identification of biomolecules bound to metals and the elucidation of their functions in biological systems is handled by metallomics. A biological molecule bound to alkali metals or alkaline earth metals, which exist mainly as free ions, is called a metallomolecule [4].

1.2. Current Ongoing Solution

Bacterial cell walls have a strong affinity for metal cations in aqueous solution [5,6,7]. Bioassays show that the negative charge of the cell wall comes mainly from carboxyl, phosphate, and hydroxyl groups distributed on the cell surface [8] under natural conditions and in contaminated water systems [9]. The dissociation reactions of these three selected groups can be represented by Equations (1)–(3):
R − COOH ⇄ R − COO + H+
R − POH ⇄ R − PO + H+
R − OH ⇄ R − CO + H+
where R represents a bacterial cell with the corresponding group located on the surface.
Interactions between metal cations in aqueous solution and deprotonated functional groups on the bacterial cell surface can be represented by Equations (4)–(6) [9].
Ma+ + R − COO ⇄ R − COO(M)(a−1)+
Ma+ + R − PO ⇄ R − PO(M)(a−1)+
Ma+ + R − O ⇄ R − O(M)(a−1)+
The functional groups of amino acids contained in the bacterial cell wall are among the most active when binding heavy metals [10]. For the sake of illustration, a series of chemical reaction equations describing metal-binding processes is presented; glycine is taken as a representative amino acid.
Zn2+ + HGly ⇄ Cu(HGly)2+
Cu2+ + HGly ⇄ Cu(HGly)2+
Ni2+ + 3HGly ⇄ Ni(Gly)32+
Under natural conditions, we also have a process of absorption and excretion of metal cations. This process is often referred to as bacterial resistance to metal or metalloid content. Bacteria have developed various mechanisms of resistance to toxic metals and semi-metals. One of these is the active efflux of the substance outside the cell, thereby causing the intracellular concentration of the metal to be reduced to subtoxic levels [11]. Another may be a change in the form of the compound to one that is more suitable for the secretory system or less toxic to the cell itself. In bacterial cells, each of the defense procedures is transcriptionally regulated by the content of the metal in question [12].
Metalloproteins are electron transport proteins, and their function as transporters is associated with a reversible change in the metal valence [13].
One of the many forms of metals in cells is metalloenzymes. This is a subclass of metalloproteins with specific catalytic functions. As a large group of molecular tools that determine the plan and strategies of chemical reactions, they mediate the conversion of various forms of energy [14]. Their catalytic centers contain metal ions coordinated by side groups of specific amino acids, and their most common ligands are the thiol group of cysteine, the imidazole group of histidine, the carboxyl groups of glutamic and aspartic acids, and the phenolic group of tyrosine. Characteristic metalloenzymes for methanogenesis are formylmethanefuran dehydrogenase, which contains a protein cofactor (methyltetrahydro-methanopterin) with zinc, which catalyzes the first step of the CO2 reduction reaction to CH4 involving methanfuran and methanogenic bacteria such as Methanobacterium thermoautotrophicum and others. Also characteristic of methanogenesis are methyl-coenzyme M reductase, which contains the coenzyme F430 porphinoid as a prosthetic group with nickel; heterodisulfide reductase, which contains iron–sulfur flavoproteins; and two hydrogenases with nickel atoms [15]. Micronutrients are commonly added to prepared sets in biogas plants. They often contain large amounts of metals, and not all of them are necessary for the fermentation process.

1.3. Proposed Solution in This Work

Not all of the above-mentioned metalloproteins are specific to methanogenic bacteria; however, this brief overview of biologically active compounds containing both toxic and non-toxic metals provides a glimpse of the enormous role of cell function.
Zn(II) ions are found in methanogenic hydrogenases of hetero- and autotrophic bacteria and bacteria that reduce SO42− ions. Zinc ions are also found in formate dehydrogenase and superoxide dismutase [16].
The effect of Zn2+ on the efficiency of the methane fermentation whose substrate was silage of various species of hard corn was analyzed. A feature that distinguishes zinc from many other substances that have an impact on the methane fermentation process is that it is not biodegradable and can be accumulated during the process [17]. Heavy metal toxicity has been found to be one of the main reasons for the failure of the methanogenesis process. The toxic effects of heavy metal accumulation have been attributed to the disruption of the enzyme structure and function through the binding of metals to various functional groups present in protein molecules or the exchange with naturally occurring metals in the prosthetic groups of enzymes [18]. Zn is an important component of enzymes, e.g., hydrogenase, formate dehydrogenase, and superoxide dismutase, and it has essential roles in protein, carbohydrate, and lipid metabolism [19]. The main aim of this work was to assess the impact of the concentration of zinc(II) ions on the conversion rate of coal into methane (β). This paper presents analytical methods for sample preparation and the determination of the zinc content in the fermentation mixture. A new coefficient of performance of the fermentation process was also developed, which is the coal-to-methane conversion factor (β). The aim of this project was to determine the influence of zinc cations in the fermentation mixture on the carbon-to-methane conversion coefficient, which will help us to determine the dynamics and improve the economics of the methane fermentation process for energy purposes.

1.4. Summary of the Current Research Novelty and Objective of This Work

In this study, the preconcentration technique was used to analyze the content of the mineral in the fermentation mixture. A new rate for the conversion of coal contained in the fermentation mixture into methane was also used. The work contains a lot of experimental information. It describes, in detail, the preparation of the fermentation process and chemical analyses. Finally, it interprets the obtained results and determines the dependence of the influence of the zinc content in the fermentation mixture on the carbon-to-methane conversion coefficient.
This article includes an analysis of the fermentation process of ten varieties of hard corn, with the aim of selecting the most suitable feedstock in terms of the magnitude of the conversion rate of carbon contained in the biomass to methane. We also analyzed the effect of zinc on the efficiency of this conversion and, thus, on the efficiency of biogas production and the energy value of this product.
The scientific purpose of this work was to determine the effect of the zinc concentration on the conversion rate of carbon contained in biomass to methane, as well as its stimulating, inhibiting, and toxic roles in methane-forming processes. To this end, the change in the concentration of volatile fatty acids in the fermentation mixture—the so-called “precursors of methane production”—was analyzed, and on this basis, conclusions were drawn as to the correctness of the fermentation processes carried out, and the causes of the stimulation, toxic effect, or inhibition of the methane fermentation process were determined. In doing so, the basic information on metallomics, i.e., the identification of biomolecules associated with metals and their functions in biological systems, was verified.

2. Preparation of the Material for the Fermentation Process—Study Methodology

The realization of our scientific and application goals required the development of a research methodology for the analysis of volatile fatty acids containing one to seven carbon atoms per molecule. A technique for the preconcentration of zinc from fermentation filtrate liquid according to the procedure described by Gordeeva V.P. [20] was used, and we adapted a methodology for the determination of fiber-ADF and NDF [21].
The performance of the experimental part required the adaptation of measurement techniques such as elemental analysis [22], gas chromatography [23], atomic absorption spectroscopy [24], X-ray fluorescence analysis [25], potentiometry [24], and thermal analysis [26].
This work contains detailed information on biogas production and practical information about the fermentation process, which gives it an applied character.
Ten varieties of hard corn (Zea mays var. indurata) (Table 1) were tested to determine their suitability as feedstock for biogas production [27] and to analyze the effect of zinc on the efficiency of the methane fermentation process. The biomass came from experimental crops grown for biogas production, which were cultivated on a leached brown soil made from light dusty soil, belonging to bonitation class IIIa. Sugar beets were used as a forecrop, while spring barley was grown as a pre-crop. The soil makeup was as follows: P2O5—163 mg∙kg−1, K2O—154 mg∙kg−1, MgO—127 mg∙kg−1, and pH(KCl) = 6.4. The supplier of the material for the study was RAGT SEMENCES Polska Sp. z o.o. 10A Sadowa St., 87-148 Łysomice (φ 53° 5′ 9.215″ N, λ 18° 36′ 48.868″ W). Prior to the first fermentation process, the contents of carbon, nitrogen, and hydrogen, as well as the micro- and macroelements in the fermentation material, were determined.
FAO coefficient—This is the coefficient of earliness of a variety, that is, the length of the growing season. It is determined by the so-called “FAO number”, which ranges from 100 to 1000. The higher the number, the later the variety—that is, the longer the growing season. For the conditions in Poland, varieties with an earliness factor of up to 300 FAO are recommended. Recently, the objectivity of assessing the length of the growing season of varieties on the basis of earliness classes has been questioned. Other criteria used for evaluating this trait, such as heat requirements, are proposed. Earliness is also related to the fertility of corn—early varieties, for understandable reasons (shorter growth and development), produce lower yields. k stands for corn silage, and z represents grain.
The sum of effective temperatures on a 6 °C basis—This is a criterion that takes into account the thermal requirements of individual corn varieties as determined by Equation (10):
T e f = i = a i = b T i m a x T i m i n 2 6 [ ° C ]
where T e f is the sum of effective temperatures, Ti(max) is the maximum temperature on the “i”-th day of vegetation, Ti(min) is the minimum temperature on the “i”-th day of vegetation, a is the first day of vegetation, and b is the last day of vegetation.
In order to properly estimate the effect of heavy metals on the methane fermentation process, it was necessary to determine their content in the feedstock. It was also necessary to make an assessment that allowed us to characterize the so-called matrix of the fermentation process—in the present case, silage from the entire above-ground part of the plant. The total carbon, nitrogen, and hydrogen contents, the amounts of organic and mineral compounds, and the fiber content characteristics of the plant material were determined. Below, the course of the various analyses is presented.

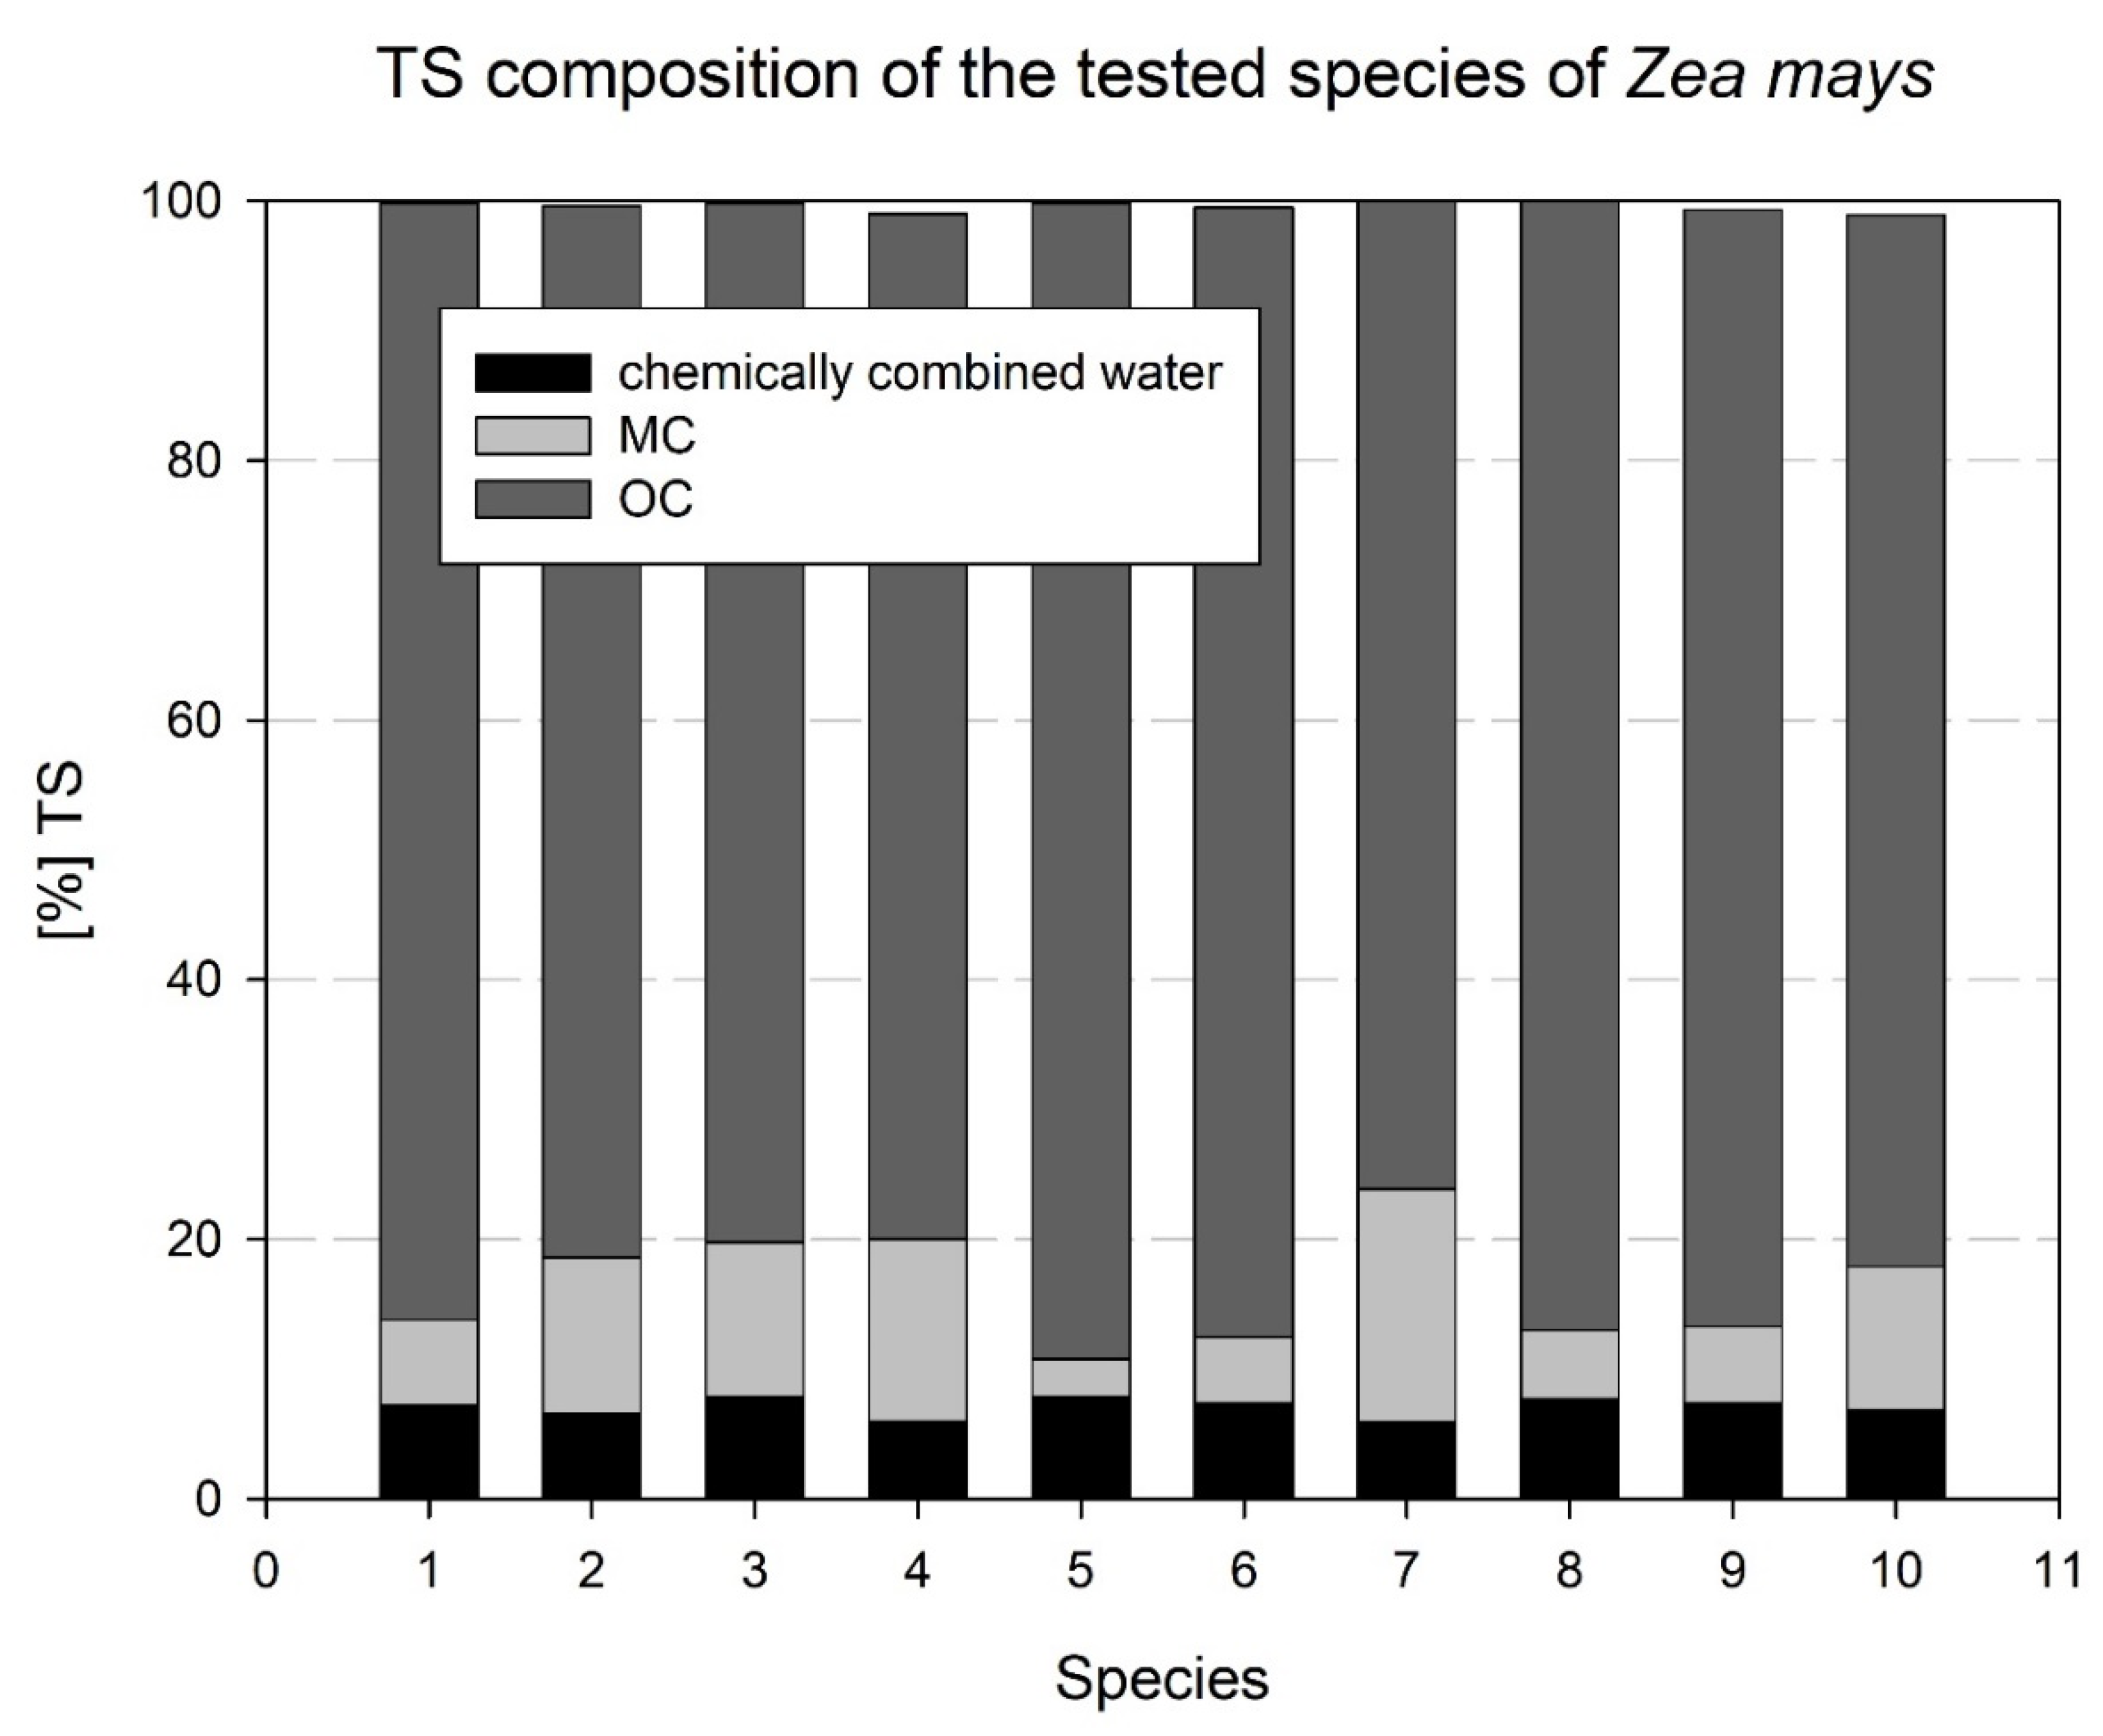
2.1. Thermal Analysis

The raw test material—samples of about 20 g each—was dried in a Radwag weighing–drying machine with free air flow at 105 °C to a constant weight. Three repetitions were made for each corn variety tested. The results of the dry matter (TS) content analysis are summarized in Table 2. The TS content was calculated according to Equation (11):
T S = m 2 · 100 % m 1 [ % ]
where m1 is the mass of the raw material and m2 is the mass of the dried material.
TYREXX (10) has the highest TS content at 38.40%, while MAXXIS (1) has the lowest content at 31.97%. These values reflect the respective FAO numbers; the early variety, MAXXIS, contains a lower dry matter content than the late variety, TYREXX.
The sample was dried to a constant mass at 105 °C, ground in a vibrating ball mill made from silicon carbide, and sieved through a polymer sieve with a mesh diameter of 0.063 mm. Samples prepared in this way were placed in tightly sealed glass vessels and left at temperatures of less than 4 °C for further analysis.
A thermal analysis of individual varieties was performed using a Simultaneous TGA-DTA Thermal Analysis thermoanalyzer from TA Instruments (type SDT 2960, New Castle, DE, USA). The analysis parameters were as follows:
  • Atmosphere above the sample: air—variant I; nitrogen—variant II;
  • Temperature range: 20–1000 °C;
  • Heating speed: 10 °C∙min−1.
The analysis was performed under different oven atmospheres to compare their effects on the decomposition process. An example of an analysis of a selected corn variety is shown in Figure 1.
The bound water contents of the tested varieties were similar, ranging from 5.9 to 7.9%. The mass proportion of mineral compounds ranged from 2.9 to 18%. The PIXXIA variety had the lowest mineral compound content, while the SAXXOO variety had the highest content. The content of organic compounds was determined in the air atmosphere. It represents the difference between the total mass loss at 550 °C and the content of bound water. The highest organic compound content of 89% was shown by the PIXXIA variety, while the lowest content of 76% was shown by the SAXXOO variety.
The volatile organic compounds (which have a boiling point of up to 250 °C) were determined in a nitrogen atmosphere. Their contents ranged from 5.8 to 12% OC. The highest concentration of VOCs was found in the TYREXX variety, and the lowest was found in the MAXXYM variety. The highest VOC content was found for a species with an FAO number of 550, the late variety. The lowest, however, was found for a species whose FAO is 310.
In summary, the highest content of organic compounds—potential substrates for the methane fermentation process—was identified in the PIXXIA variety. The contents of each fraction are shown in Figure 2.

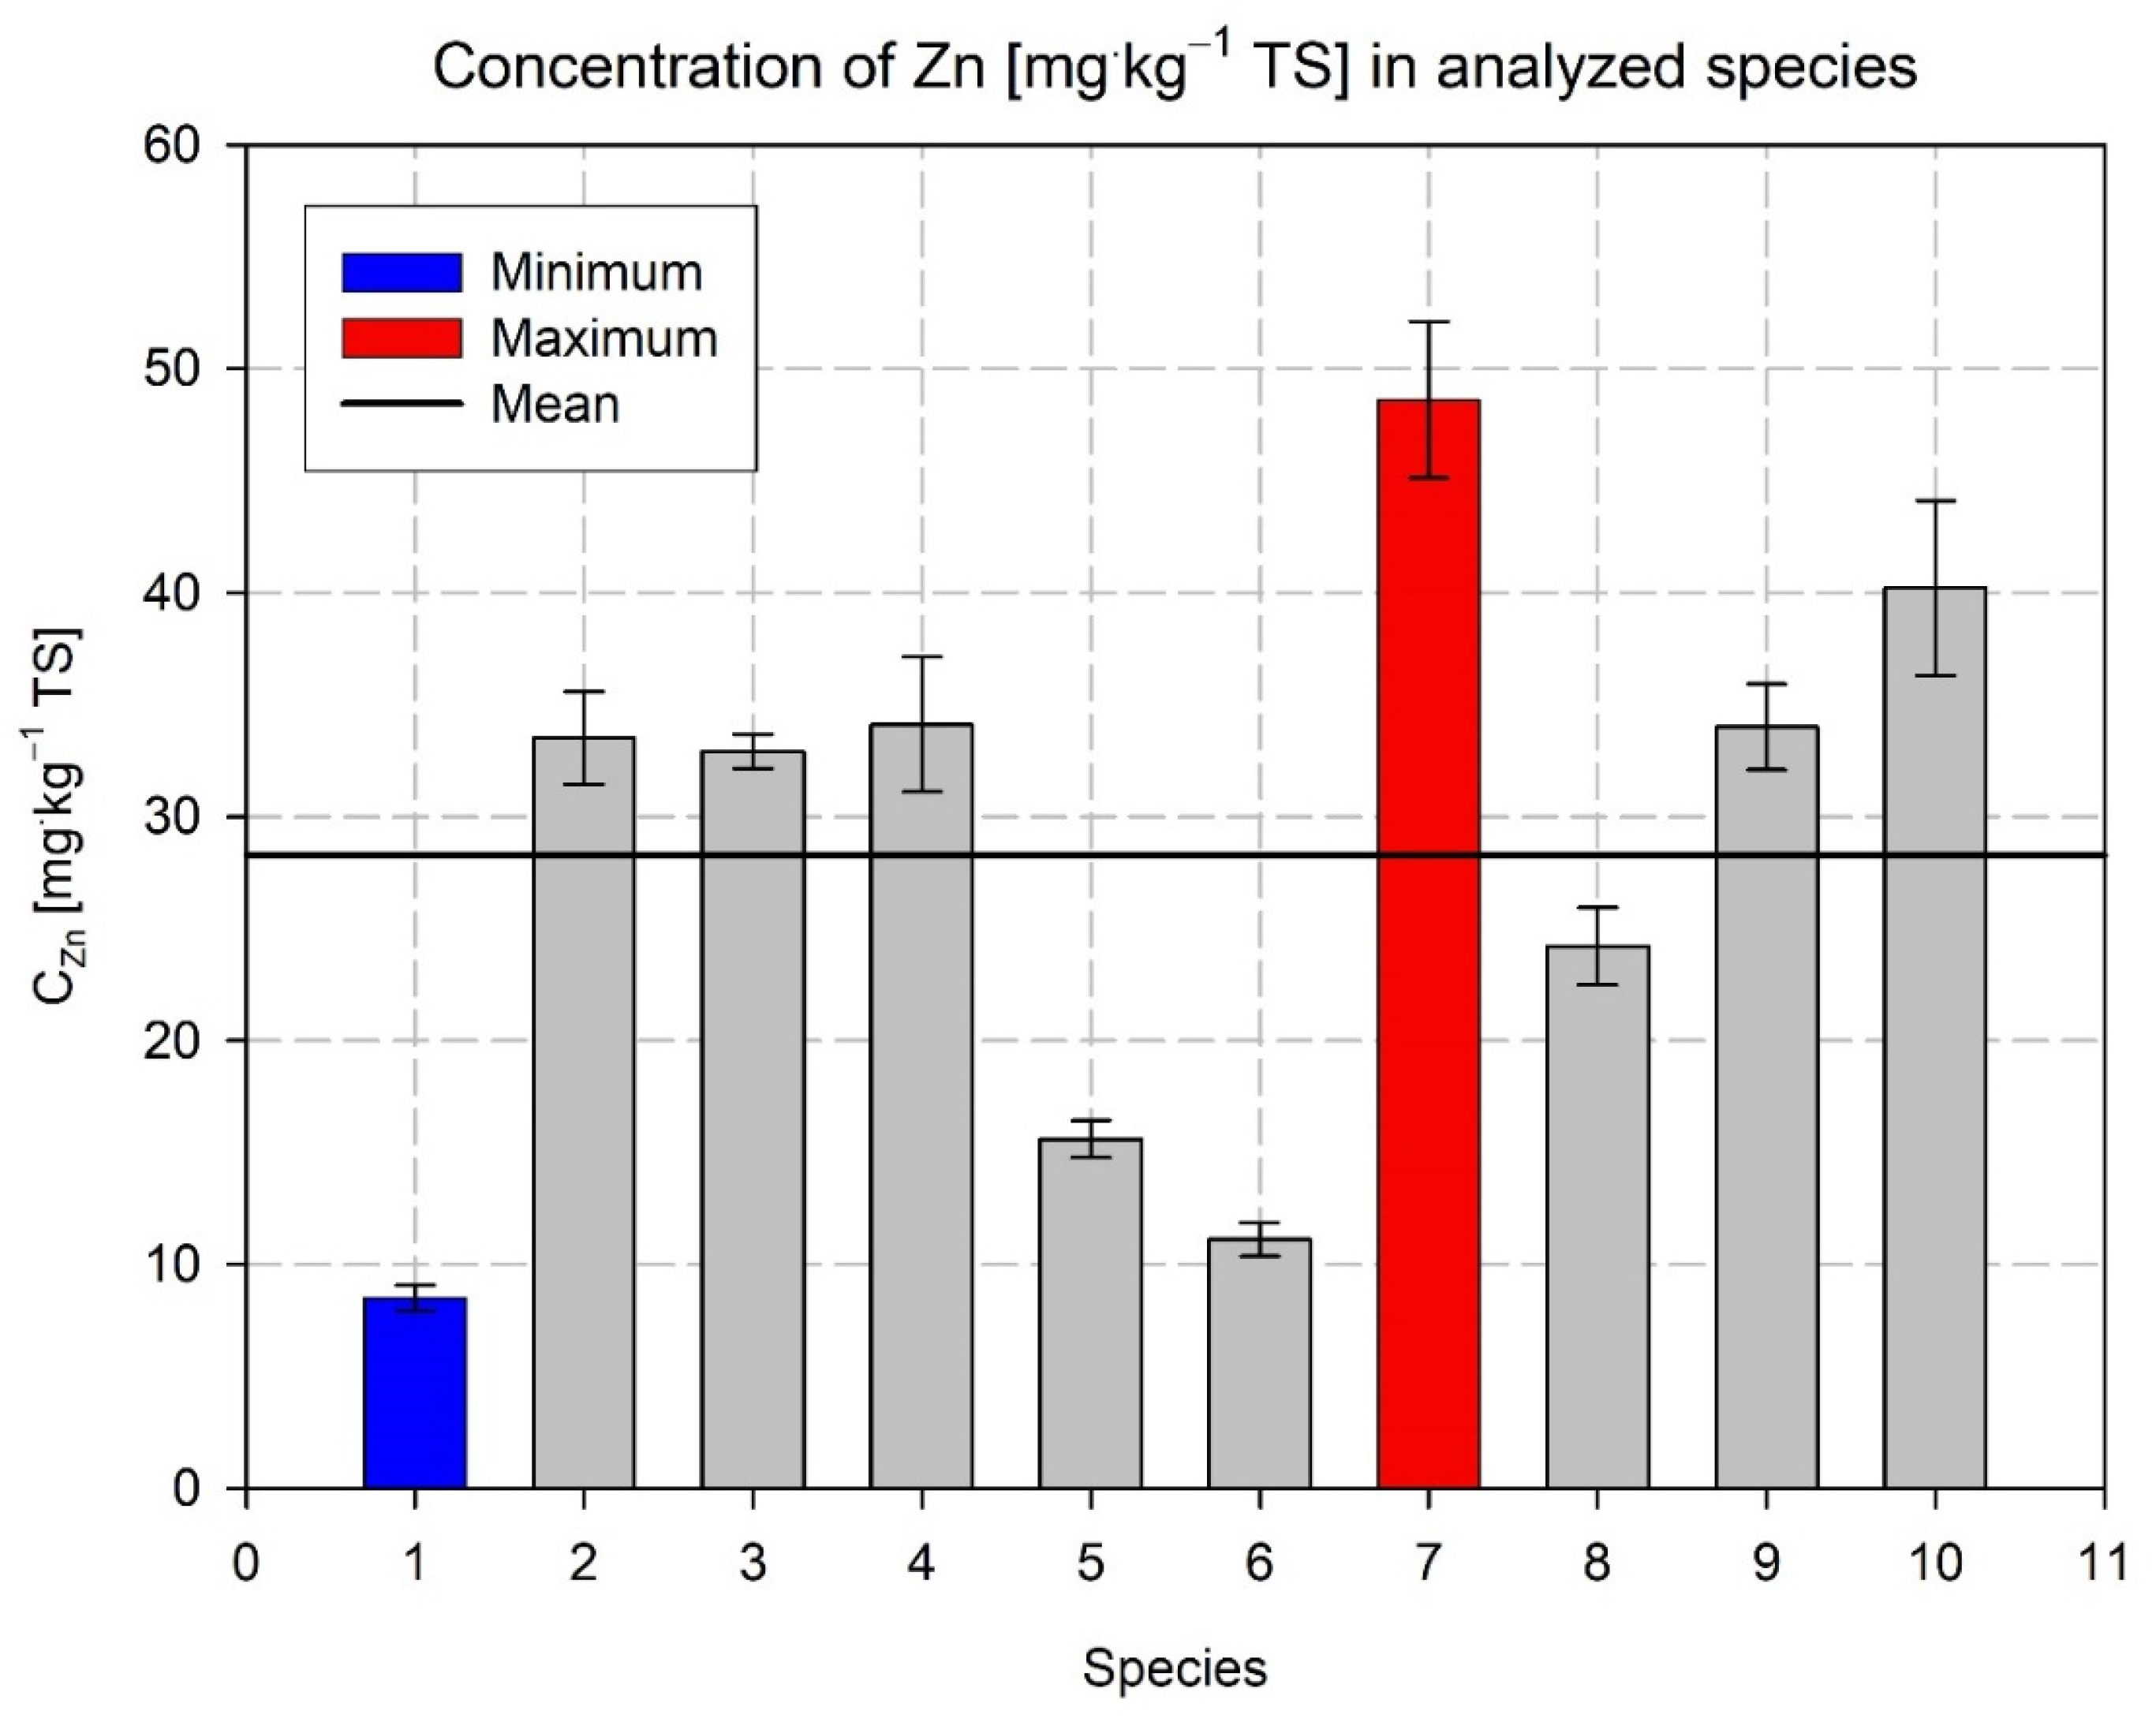
2.2. X-ray Fluorescence and Reference Method

The wavelength-dispersive X-ray fluorescence technique was used to study the contents of the selected metals in plant materials. Qualitative and quantitative analyses were performed using an S8 TIGER Series 2 vacuum sequential spectrometer from Brucker, Billerica, MA, USA. The X-ray fluorescence method uses similar quantification methods to most spectroscopic methods. The basis is the measurement of line intensities from standards and standard curves.
About 0.7 g of shredded plant material was dried at 105 °C until a solid mass was obtained. The next step in the sample preparation was the removal of the main component—organic matter. The decomposition of cellulose and lignin under microwave radiation was carried out in a NW Magnum II apparatus from ERTEC, Kolbaskowo, Poland. The process was carried out at 250 °C under a pressure of 80 atm. It was a wet mineralization process with the addition of nitric acid(V)—about 5 cm3—assisted by microwave radiation. The resulting clear and colorless solution was quantitatively transferred to a 50 cm3 flask and supplemented with double-distilled water.
The masses of samples subjected to microwave mineralization are shown in Table 3.
In order to reduce the analysis time for the test solutions as much as possible, an easy and quick metal preconcentration technique using DETATA (Chemistry Department, Moscow State University, Moscow, Russia) ion exchange filters was used for laboratory pre-treatment. These are cellulose filters with chemically attached DETATA groups. These groups are derivatives of diethylenetriaminepentaacetic acid (DETAPAC). To obtain a DETATA filter, cellulose is treated with DETAPAC acid in the presence of a suitable catalyst. The result is a DETATA group attached to a solid substrate such as cellulose [28,29].
Groups of the carboxyl–amine type are characterized by the strong chelating properties of metal ions, and this was used in the above analysis.
All reagents and reagents used were of analytical purity. Double-distilled water was used.
The preconcentration process began with the determination of the optimal analyte flow rate through the filter. For this purpose, a Byospectr-type attachment was prepared, in which a DETATA-type filter was placed according to the manufacturer’s instructions. Then, 2000 cm3 of standard solution containing 200 μg Zn2+ was prepared, after which 100 cm3 of the standard solution was concentrated on DETATA-type filters at a rate of 0.5 to 15 cm3 -min−1, resulting in 10 μg of zinc per filter. Then, the filters were subjected to a drying process at 60 °C to constant weight (for about 60 min). The dried filters were arranged in measuring cassettes and subjected to a fluorescence X-ray analysis. To prepare the calibration curves, a series of calibration solutions were prepared containing 0, 1, 2, 5, and 10 μg Zn2+ in 100 cm3 using 1 mg-cm−3 calibration solutions for the FAAS (Flame Atomic Absorption Spectrometry) method. This produced an acidified solution of Zn2+ ions. For each of the prepared solutions, 100 cm3 samples were concentrated in triplicate. The filters were dried and subjected to WD-XRF analysis with the parameters shown in Table 4.
A calibration curve was obtained for zinc, the parameters of which are shown in Table 5.
The certified reference materials presented in Table 6 were used to calculate the recovery.
For zinc, two certified reference materials were selected. In Table 6, the blue color indicates the analyte concentration value at the lower limit of the analyzed concentration range, and the red color indicates the value at the upper limit of the analyzed concentration range. The reference materials underwent the same preparation operations as the plant material under study and were analyzed using the same methodology. Table 7 summarizes the concentrations obtained and the calculated recovery values.
The recovery values obtained were in the range of 98.2–107.9%. The recovery should be 95–105% for the main component and 80–120% for impurities (these values depend on the concentration of the analyte in the sample and the test method, among other factors).
Figure 3 shows the results of the analysis of the zinc content in the dry matter of the tested hard corn varieties carried out using the WD-XRF technique with preconcentration of the analyte using the DETATA technique. The average zinc content was 28.3 mg Zn-kg−1 TS. The lowest content (blue color) occurred in the MAXXIS variety, which contained 8.5 mg Zn-kg−1 TS. The highest content (red color) was recorded in the SAXXO variety; it was 48.6 mg Zn-kg−1 TS. The zinc content of the plants was in the range of 10–70 mg Zn-kg−1 TS. The determined average content for the ten varieties fell within this range but was clearly underestimated.
FAAS was chosen as the reference method for the DETATA-WD-XRF technique using the SavantAA Sigma AAS instrument from GBC, Keysborough, Australia.
For the purposes of this publication, as well as the analytical needs, the standard curve method was used. A solution of 1000 ± 0.005 g Zn-dm−3 in a 0.5 mol solution of SpectrosoL®-type nitric acid(V), manufactured by BDH Laboratory Supplies Poole, BH15 1TD England, was used as the standard material. Calibration curve and it’s parameters in Table 8.
In practice, we often undergo several independent tests to verify the same hypothesis, leading to the rejection or acceptance of the null hypothesis at different levels of significance.
Data for the F-Snedecor test for each calibration curve are shown in Table 9.
The calculations show that, for the determination of Zn2+ ions using the FAAS and WD-XRF methods (Table 10), for F < Fkr, it follows that the obtained standard deviations do not differ in a statistically significant way. Thus, the compared zinc determination procedures do not show differences in terms of precision. The method of fluorescence X-ray analysis with wavelength dispersion and DETATA-type preconcentration is more sensitive than the flame atomic absorption spectrometry method.
The first step in the planned experiment to determine the effect of zinc on the efficiency of the methane fermentation process was to select the hard corn variety with the best methanogenic characteristics.
Methane fermentation processes were carried out in a periodic manner in an apparatus that consisted of five fermenters with a capacity of 10 dm3 made from food-grade approved stainless steel and equipped with a heating jacket, a concentrically placed stirrer with a seal, and valves that allow dosing of substances and the collection of fermentation material for analysis. A GasData GFM 430 gas analyzer from GasData, Coventry, UK, was used to test the separated biogas.
During the fermentation process, the content of lower fatty acids was also analyzed using the method of analyzing the composition of the supernatant phase using gas chromatography with the flame detector (HS-GC-FID) technique. A Varian 3800 gas chromatograph (Agilent Technologies, Santa Clara, CF, USA) with an autosampler from Tekmar (Mason, OH, USA) was used in the study with a Nukol® TM 50 m capillary column (Merck Life Science Ltd., Warszawa, Poland), where polyethylene glycol was the stationary phase.
The volume of biogas released was measured once per day using a suitable measuring system. The results are expressed in cm3 d−1 and plotted on the ordinate axis; the abscissa axis was the hydraulic holding time (HRT) expressed in d−1. The daily volume of biogas expressed as a function of the hydraulic holding time was described with a five-parameter Weibull equation:
y = y 0 + a c 1 c 1 c c · x x 0 b + c 1 c 1 c c 1 · e x x 0 b + c 1 c 1 c c + c 1 c
where a and b are the scale parameters, of which a is the peak height parameter and b is the peak width parameter, c is the shape parameter, x0 is the position of the peak maximum, and y0 is the value put down on the ordinate axis at time 0.

3. Study Results and Their Interpretation

3.1. Analysis of Fermentation Processes

Fermentation processes of ten varieties of hard corn under study without metal additives were carried out to select the variety with the highest methane production efficiency. Each process was conducted in two batches of five varieties at a time.
An appropriate amount of corn silage ground into fragments of less than 1 cm was added to tap water at a temperature of about 21 °C so that the dry matter content was about 8–9% (see Table 11 for details). Fermenters were closed, blown with nitrogen, and checked for leaks using a capillary U-tube. For pH correction, 50% NaOH and 84% H3 PO4 were used.
During the course of the process, once a day, we measured the following:
-
The volume of biogas released;
-
The concentrations of CH4, CO2, O2, H2S, H2, and NH3;
-
The contents of volatile fatty acids, such as
  • methane (formic),
  • ethane (acetic),
  • propane (propionic),
  • butane (butter),
  • 2-methylpropane (iso-butyrate),
  • pentane (valerian),
  • 2-methylbutane (iso-valerate),
  • hexane (capron),
  • 2-methylpentane (iso-capron),
  • heptane (enant);
-
The pH;
-
The temperature.

3.1.1. Volume of Biogas Released

An example graph of the relationship V (cm3 -dm−1) = f(HRT (d)) (Equation (12)) for SILEXX along with the fitted five-parameter Weibull equation is shown in Figure 4. The fitting parameters were a = 6367.14; b = 50.18; c = 1.64; x0 = 55.92; and y0 = 233.14. The coefficient of determination was 0.9912. The calculation of the integral denoted within 0–120 (area under the plot of the function) made it possible to determine the total volume of biogas obtained during the fermentation process (expressed in cm3). For the SILEXX variety, this volume was 416.2 dm3 of the biogas obtained during the entire periodic process. The magnitudes of the parameters of the Weibull equation and the volume of biogas obtained for each variety are summarized in Table 12. All parameters refer to standard conditions.

3.1.2. Biogas Composition

The biogas analysis was carried out using a gas analyzer equipped with six analytical channels. The biogas composition was determined using the infrared spectroscopy technique for all components except for oxygen, which was analyzed using the electrochemical detection technique. The range of analyzed concentrations of biogas components is shown in Table 13.
The biogas composition was tested once per day. The changes in the concentrations of the main biogas components, CH4 and CO2, for the MAXXYM variety are shown in Figure 5.
Figure 5 shows that the initiation time of the fermentation process for the uninoculated mass was about 12 days. In order to determine the average methane content of the resulting biogas, the following process was carried out: the sum of the areas under the curves for changes in the concentrations of methane (red) and carbon(IV) oxide (blue) reflects approximately 100% of the evolved gas. The ratio of the areas of these fields allowed us to determine the average biogas composition throughout the fermentation process. For example, for the MAXXYM variety, the curve for the carbon(IV) oxide concentration can be described using two types of equations:
In the interval 0–19.7250, d is a first-degree equation: y = ax + b;
In the interval 19.7250–120, d is a third-degree equation: y = cx3 + dx2 + ex + f.
The curve for the change in the methane concentration was described using the five-parameter Weibull equation from 0 to 120 days (Equation (12)). To avoid confusion between the curve describing the change in volume and the curve describing the change in the methane concentration, the symbolism of the parametric constants in the Weibull equation was changed to a = g, b = h, c = i, x0 = xc, and y0 = yc, respectively. The total amount of biogas released was denoted as the sum of the fields (Equation (13)):
P C = P L + P Q + P W
where PC is the total area; PL is the area under the function of the CO2 concentration over time, described by a simple equation; PQ is the area under the function of CO2 concentration over time, described by a third-degree equation; and PW is the area under the function of the CH4 concentration over time, described by a Weibull equation.
The average methane concentration was determined from the corresponding ratio of the areas expressed by Equation (14):
% C H 4 = P W P C
where %CH4 is the average percentage of methane in the biogas released.
The parameters for calculating the average methane content of the biogas released are summarized in Table 14.
The sizes of the surface areas and the average methane contents of the biogas for the first fermentation process without metal addition and without inoculum are shown in Table 15.
The average methane content released during the fermentation process was 48.15%, ranging from 38.5% for the MAXXIS variety to 60.8% for the TEXXUD variety.
Knowing the volume of biogas separated and the average methane concentration, it is possible to calculate the amount of methane that was formed during the periodic fermentation process (Equation (15)).
V C H 4 [ d m 3 ] = V b i o g a s [ d m 3 ] · C C H 4 [ % ]
Knowing the volume of methane produced, it is possible to calculate the carbon-to-methane conversion factor in the fermentation process. This coefficient, calculated according to Equation (16), is characteristic of the corresponding variety and determines its suitability for biogas purposes.
β C C H 4 , 120 = n C C H 4 e q n C E A
Here, β C C H 4 , 120 is the carbon-to-methane conversion factor in a methane fermentation process lasting 120 days, n C C H 4 e q = V C H 4 [ d m 3 ] 22,4 [ d m 3 m o l ] is the number of moles of carbon contained in the methane produced based on normal conditions, and n C E A = m [ g ] · T S [ % ] · C E A [ % ] 12 [ g m o l ] is the number of moles of carbon in the fermentation feedstock resulting from the elemental analysis (m—mass of silage feedstock; TS—average dry matter content of corn silage; CEA—carbon content of corn silage).
The magnitude of the conversion factor to methane and the values of n C C H 4 e q i n C E A for individual hard corn varieties are shown in Table 16.
The magnitude of the conversion factor to methane for the tested varieties ranged from 0.2687 for the MAXXIS variety to 0.4787 for the PIXXIA variety. The results of the fermentation carried out and the procedure performed to identify the most efficient variety in terms of the methane yield are unequivocal and typify the same variety—PIXXIA.
This variety was used in the remainder of the conducted experiment as a fermenter bed matrix for testing the effects of selected heavy metals on the efficiency of the methane fermentation process.

3.1.3. Volatile Fatty Acid Analysis

A qualitative analysis of the volatile fatty acids contained in the fermentation mixture was carried out using the gas chromatography technique through a headspace analysis using a flame ionization detector. A Varian 3800-type instrument with an autosampler and sample thermostat from TEKMAR(Mason, OH, USA) was used for the analysis.
When conducting the analysis, a standard (46975-U Supelco) containing ten carboxylic acids—namely, methane C1; ethane, C2; propane, C3; butane, n-C4; 2-methylpropane, i-C4; pentane, n-C5; 3-methylbutane, i-C5; hexane, n-C6, 4-methylpentane, i-C6; and heptane, n-C7.
The chromatographic parameters were as follows: the capillary column was of the NukolTM type (Supelco), the column length was 50 m, the inner diameter was 0.25 mm, the stationary layer thickness was 0.25 μm, the carrier gas was helium of purity 5.0, the flow rate was 20 cm-s−1 (p = 0.8 Ba) at 70 °C, and the temperature program was 8 min at 70 °C, heating from 70 °C to 170 °C at a rate of 5 °C-minute−1, and then for 12 min at 170 °C with an injection chamber temperature of 220 °C and a detector temperature of 250 °C.
The qualitative analysis was carried out using Merck KGaA, Darmstadt, Germany certified reference material Volatile Free Acid Standard Mix In Deionized Water 46975-U. Appropriate dilutions of the above reference material were used to produce the calibration curves. The composition of the CRM (Certified Reference Material) is shown in Table 17.
Due to the lack of separation of the peaks derived from C1 and C2, the concentrations of these acids were treated together as C2 and had a value of 1261.60 mg-dm−3 in the standard.
Twenty solutions were prepared for the calibration curves.
The determination of the volatile organic compounds required analytical procedures to comply with two important conditions:
-
The determination of the analytes at very low concentration levels;
-
The preparation of samples for analysis without introducing additional compounds into the environment.
These conditions were fulfilled using the supersurface phase (head space) method of analysis. To perform the analysis, 5 μL of each solution was transferred into a 22 cm−3 vial, sealed with a Teflon septum cap, and placed in an autosampler, where it was subjected to annealing at 140 °C. Once the equilibrium was established, a chromatographic analysis of the supernatant phase was performed. Each sample was analyzed in triplicate to obtain an average peak area value.
The obtained calibration curves are characterized by a relative standard deviation of less than 4%, with one exception—for the sum of the acids, methanoic and ethanoic, it was 4.11%. The determination coefficients were greater than 0.9910 in all cases. A recovery analysis was carried out for the prepared analytical method.
Table 18 shows the characteristics of the solution used for the analysis and the calculated recovery values.
The determined recovery values range from 99.0 to 102.2%. All values are within the 95–105% range, which is considered appropriate for the main component of the mixture analyzed.
For the analysis of the volatile fatty acids, 1 cm3 of the fermentation liquid was taken and cooled to about 5 °C. Then, 0.1 cm3 of concentrated sulfuric acid(VI) was added, and the container was tightly closed and cooled again to about 5 °C. A total of 5 μL of the mixture was taken and placed in a tightly sealed vial for analysis. Then, it was placed in a thermostatic autosampler and subjected to a chromatographic analysis. Each sample was analyzed in triplicate. If the content of any of the analytes was too low, 10 cm3 of the fermentation liquid was taken and placed in a round-bottom flask, followed by the addition of 1 cm3 of concentrated sulfuric acid(VI) and distilled at boiling point. The first 0.5 cm3 of the distillate was used to analyze the VFA content. A total of 5 μL of the distillate was taken, and the method proceeded as it did for the fermentation liquid.
For example, Figure 6 and Figure 7 show the changes in the contents of individual acids for the fermentation process for the MAXXIS corn variety.
From the data presented in Figure 6 and Figure 7, it can be seen that the concentration of the sum of methanoic and ethanoic acids reached its maximum value on the 38th day of the fermentation process and was 463 mg∙dm−3. At the beginning of the process, it was 12 mg∙dm−3, while on the 120th day, the last day of the process, it was 93 mg∙dm−3.
The initial concentration of propanoic acid was 74 mg∙dm−3. It reached two maxima: on the 22nd day of the fermentation process, it was 239 mg∙dm−3, and on the 67th day, it was 169 mg∙dm−3.
The concentration of butanoic acid at the beginning of the process was 12 mg∙dm−3. It reached a maximum value after 29 days, at 55 mg∙dm−3, and on the 120th day, it was 6 mg∙dm−3. The concentration of 2-methylpropanoic acid reached a maximum value of 23 mg∙dm−3 on the 23rd day of fermentation. No such acid was detected at the beginning or after the 120th day of the process.
Pentanoic acid stood out with the highest maximum concentration among the analyzed acids from n-C4 to n-C7 of 73 mg∙dm−3 on the 31st day of the fermentation process. At the beginning of the process, its concentration was 7 mg∙dm−3, and at the end, it was 3 mg∙dm−3.
The concentration of 3-methylbutanoic acid at the beginning of the fermentation process was 3 mg∙dm−3. The maximum value, 25 mg∙dm−3, was reached after the 33rd day, while the presence of acid was not found after the 120th day of fermentation. The concentration of hexanoic acid at the beginning of the fermentation process was 6 mg∙dm−3. The maximum value, 46 mg∙dm−3, was reached after the 28th day of fermentation, and at the end of the process, the presence of this acid was not found. No 4-methylpentanoic acid was found at the beginning or end of the process, while its maximum concentration, 12 mg∙dm−3, was found on the 21st day of the fermentation process. Heptanoic acid was also not found at the beginning or end of the fermentation process, and its maximum concentration was found on the 25th day of fermentation and was 23 mg∙dm−3.
From the analysis, it can be concluded that the concentrations of the branched volatile fatty acids (i-C4, i-C5, and i-C6) were about half those of the other acids, except for heptanoic acid, as well as the main components, i.e., the sum of the methanoic and ethanoic acids and propanoic acid. The maximum concentration of all acids occurred between the 21st and 38th days of the fermentation process. The total concentration of acids, as per acetic acid, falling at the maximum point of the acidogenic phase, was about 810 mg∙dm−3.

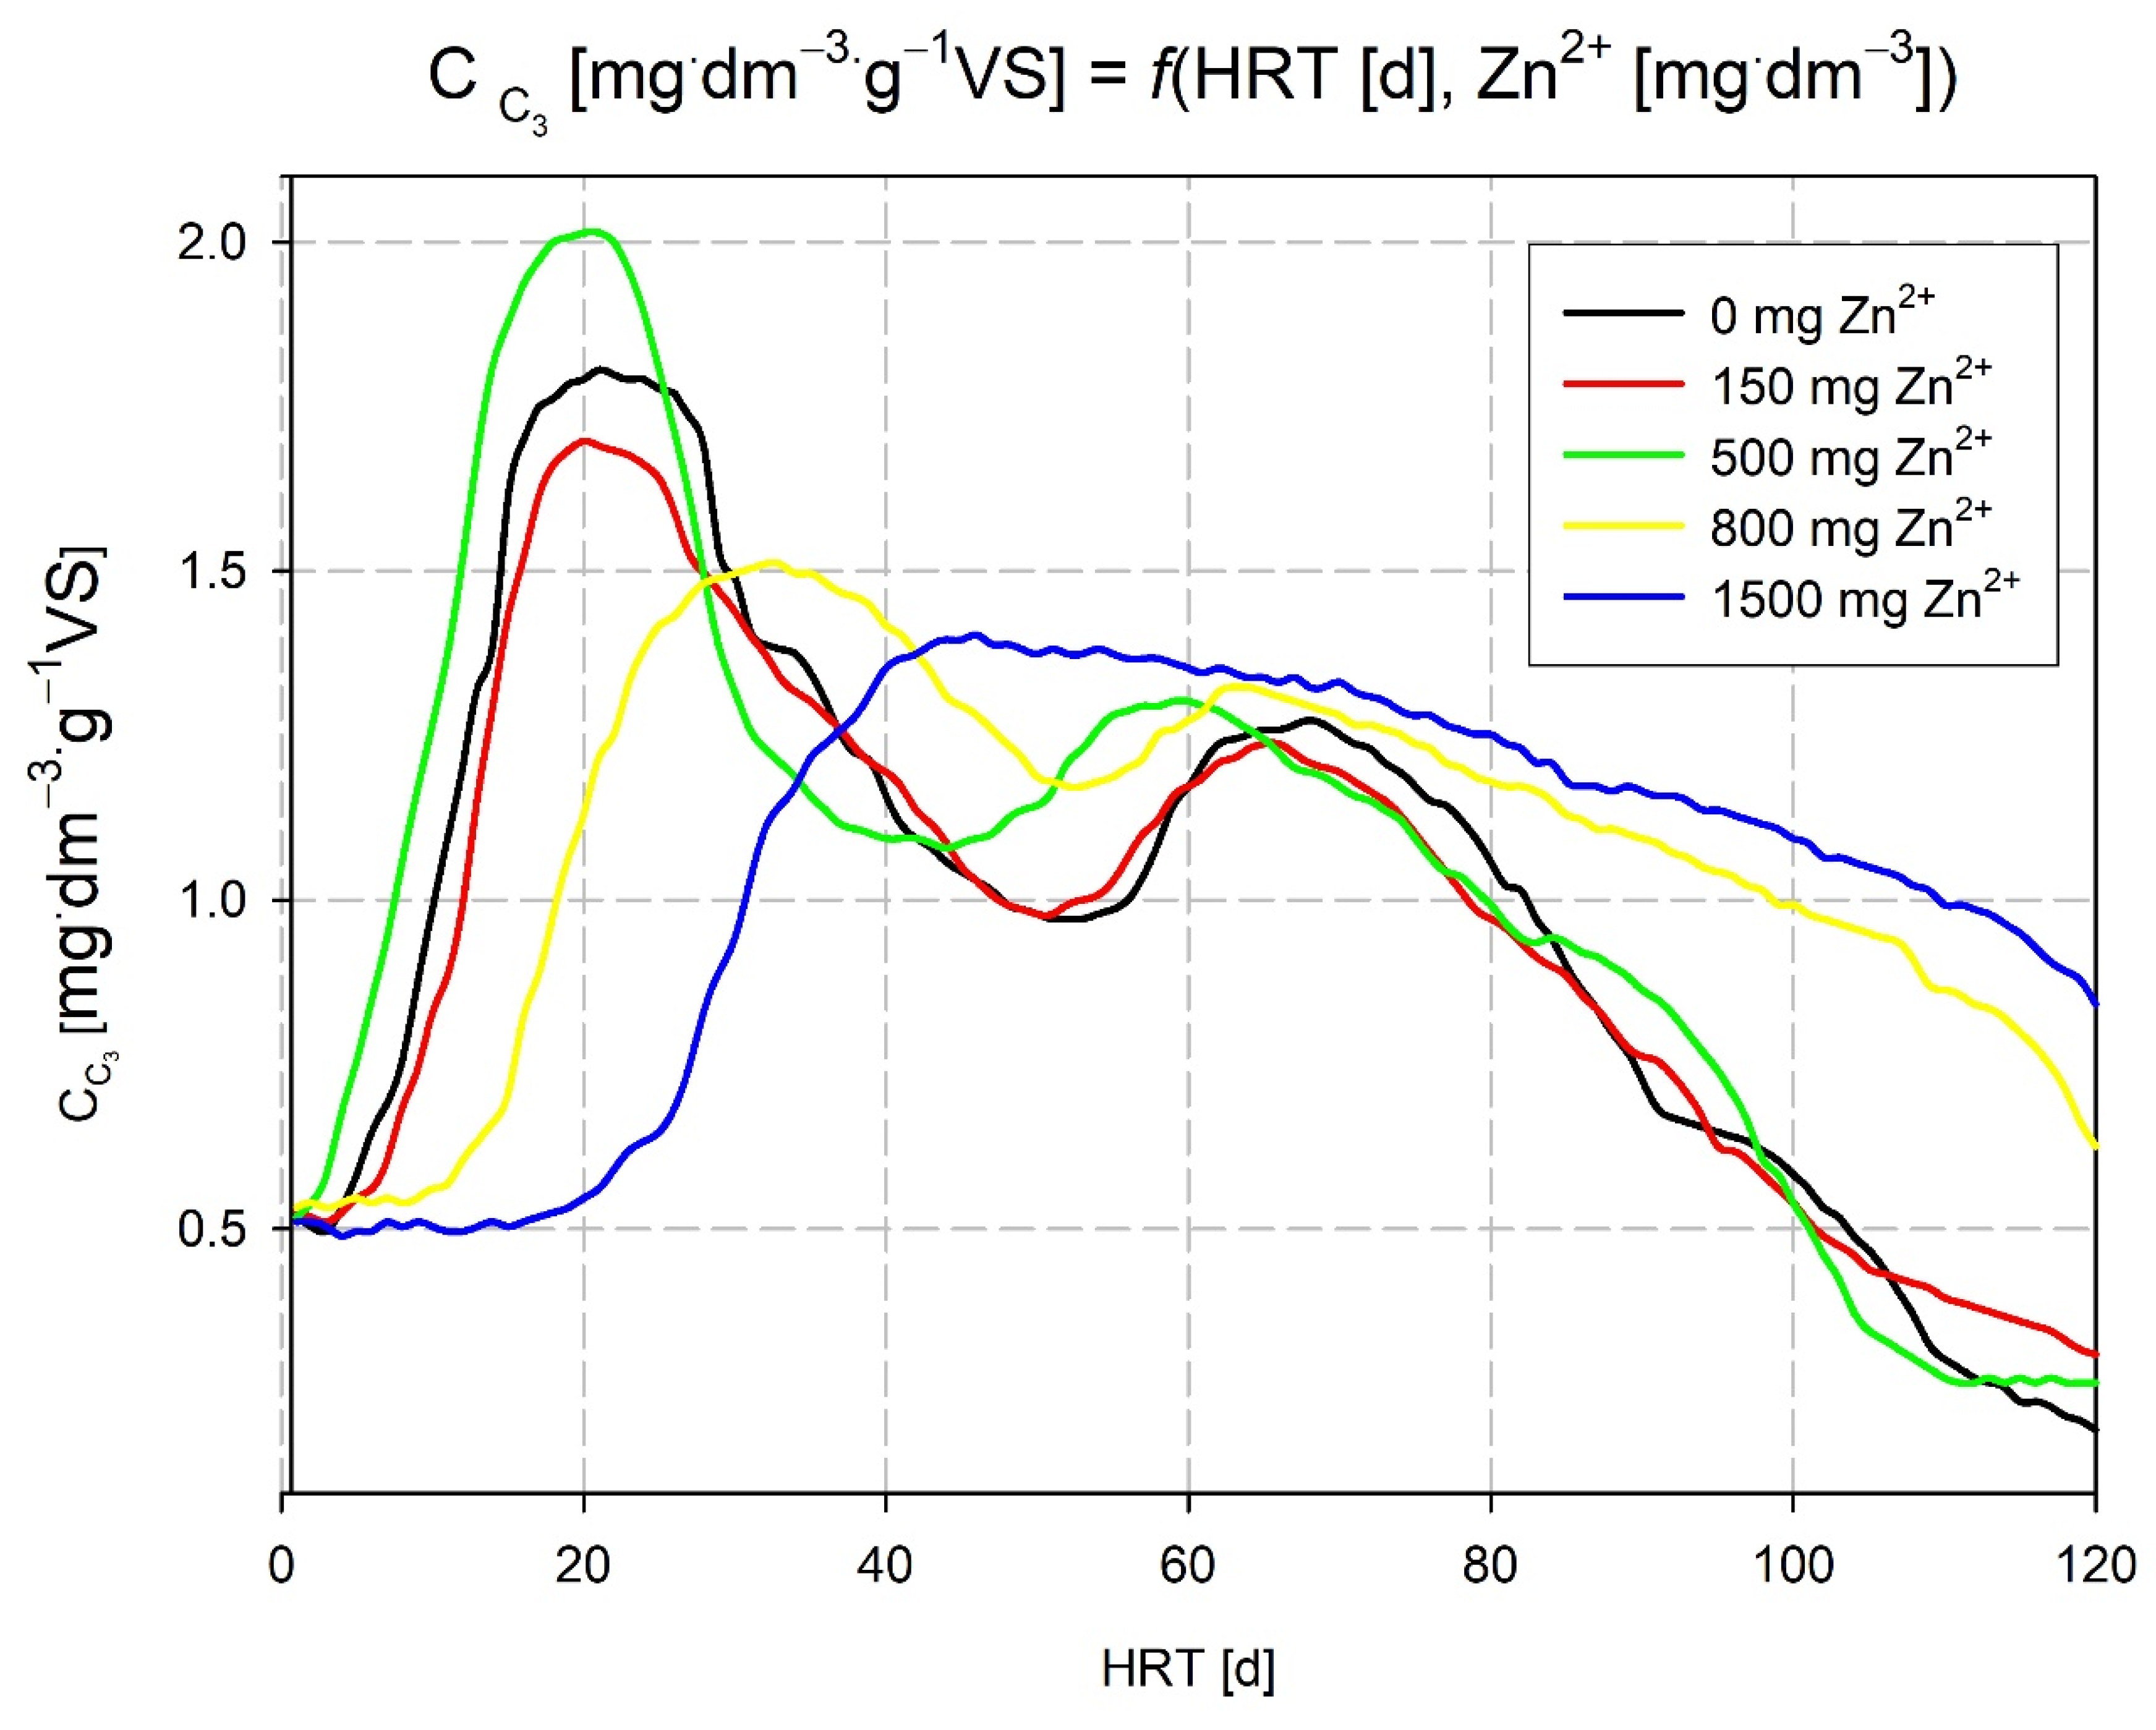
3.2. Analysis of the Effect of the Zn2+ Ion Content in the Fermentation Supernatant on the Efficiency of the Hard Corn Methane Fermentation Process

A total of 6000 g of water was placed in the fermenters, the appropriate amount of zinc(II) ions (0, 150, 500, 800, and 1500 mg) was added to 50 cm3 of distilled water. The specified masses of selected corn silage (PIXXIA) and inoculum were added, mixed, and sealed tightly. To displace oxygen from the system, nitrogen was supplied to each fermenter at a rate of about 5 dm3 -min−1 for about 30 min. After this step, thermostatting and stirring of the fermenters’ contents began. After the temperature had reached about 38 °C (about 4 h), 50 cm3 of each fermentation liquid was sampled to analyze the zinc ion and LKT contents in the solution.
By analyzing the change in the methane concentration in the biogas released, it can be concluded that the addition of Zn2+ ions has a differential effect on the methanogenesis process. Considering the maximum concentration of methane in biogas and the time taken for the fermentation process to be completed, it should be concluded that the concentration of Zn2+ ions in the first two fermenters had no effect on the above parameters.
The stimulating effect of zinc(II) cations was observed up to a concentration value of 44.5 mg∙dm−3. Above this concentration, the process inhibits biogas secretion. For the process where the concentration of Zn2+ ions was 71.7 mg∙dm−3, the volume of biogas secreted was 90.4% of the volume of biogas produced through the fermentation process without the addition of zinc(II) ions. For a Zn2+ concentration of 127 mg∙dm−3, the volume of biogas produced was 75.4% of the volume produced in the basic process. Stimulating efflux was recorded for concentrations of 17.0 and 44.5 mg Zn2+ -dm−3, and the volumes of biogas released with respect to the basic process were, respectively, 105.1% and 117.5%.
For a more precise analysis of the effect of zinc(II) ions on the efficiency of the fermentation process, the carbon-to-methane conversion factor was determined for each fermentation process. For this purpose, Table 19 summarizes the area of the fields calculated in the same way as in Table 15, and the carbon contents of the bioreactors, determined using an elemental analysis, are shown.
The variation in the conversion factor β C C H 4 , 120 as a function of the concentration of zinc(II) ions in the liquid phase of the methane fermentation process is shown in Figure 8.
Figure 8 shows that the carbon-to-methane conversion rate varies, initially increasing, reaching a maximum, and then decreasing, depending on the concentration of Zn2+ ions contained in the fermentation liquid.
Due to the fact that the change in the conversion factor and the volume of biogas secreted coincide, it follows that the total number of both heterotrophic and autotrophic microorganisms may change during fermentation processes with different amounts of Zn2+ ions, because it is not the composition of the secreted biogas that varies but only its volume, as evidenced by the similarity of the relationships considered.
In the experiment under review, the conversion factor was determined via the quantity, not the chemical composition, of the biogas released.
In terms of the concentration of acids, the sum of methane and ethane and propane also showed a significant dependence on the concentration of Zn2+ ions in the filtrate liquid. This indicates that zinc(II) ions have some influence on the processes of acidogenesis and acetogenesis. Figure 9 shows the dependence of the maximum concentration of C2 acids on the HRT and the concentration of Zn2+ ions in the filtrate fermentation liquid.
Figure 9 shows that the concentration of Zn2+ has a differential effect on the total acid production, including both methanoic and ethanoic acids. The hydraulic holding time, which characterizes the fermentation course of the batch process, initially increases slightly with an increasing Zn2+ concentration and then decreases (17 and 44.5 mg Zn2+ dm−3), increasing significantly for a Zn2+ concentration of 127 mg∙dm−3. This relationship indicates a change in the acid concentration profile of C2, as shown in Figure 10. The concentration profiles of C2 during the fermentation processes carried out with the addition of Zn2+ ions show quite a wide variation. The C2 profile for the process carried out in reactor 1 reaches a maximum value on the 37th day of the process, and the plateau persists until about the 40th day. For the process running in fermenter 2, the plateau of the maximum C2 concentration extends from the 41st to the 56th day of the process, while the plateau for the maximum C2 concentration in the third fermenter is from the 37th to the 62nd day of the fermentation process.
The increase in the time taken to reach the maximum acid concentration is due to a faster acetogenesis process or a decrease in the activity of heterotrophic methanogenic bacteria and the accumulation of hydrolysis products; however, for the concentration of Zn2+ ions of 44.5 mg∙dm−3, there was no decrease in biogas release and no change in the concentration of methane in the biogas, so the above situation was due to the higher production of C2 acids.
As the concentration of zinc(II) cations increased in fermenters 4 and 5, the maximum value of the C3 concentration profile shifted toward higher HRTs.
By analyzing the change in the propionic acid concentration (shown in Figure 10), it was found that there were two extremes for the relationship C C3 (mg∙dm−3∙g−1VS) = f(HRT (d)), which appeared during the processes carried out in reactors 1, 2, 3, and 4.
The C3 concentration profile3 in reactor 5 was characterized by “blurring” and the occurrence of a single maximum, indicating that the formation as well as the utilization of propanoic acid in the fermentation process was disrupted. For Zn2+ concentrations of 17.0 and 44.5 mg∙dm−3, a shortening of the HRT, i.e., an acceleration of the time taken to reach the maximum propanoic acid concentration, was found. A clear stimulating effect of Zn2+ ions was observed regarding their concentration in the fermentation liquid of 44.5 mg∙dm−3. The inhibition of the process, on the other hand, was found for Zn2+ concentrations of greater than 71.7 mg Zn2+∙dm−3.
By analyzing changes in the concentrations of intermediate substrates of the methanogenesis process, LKT, it is possible to select groups of organisms involved in this process with a high probability and to analyze the influences of various substances on the methane fermentation process. Changes in the concentration of LKT (from n-C4 to n-C7) and the effect of the addition of Zn2+ ions on the fermentation process, especially on the acidogenesis phase (maximum acid concentration), were recorded, and significant results for the additional information were obtained. It was shown that, in the fermentation process, the time of occurrence for the maximum concentration of LKT depends on the concentration of Zn2+ ions in the filtrate fermentation liquid. For butanoic acid, the HRT of its maximum concentration with an increasing Zn2+ ion concentration initially decreased, reaching its minimum for a value of 44.5 mg Zn2+∙dm−3, and then reached a maximum value at a Zn2+ ion concentration of 127 mg∙dm−3.
The maximum concentration of the 2-methylpropanoic and pentanoic acids during the fermentation process initially increased slightly, and then for a Zn2+ ion concentration of 44.5 mg∙dm−3, it reached a minimum and then increased again.
For the hexanoic, 4-methylpentanoic, and heptanoic acids, an increase in the concentration of zinc(II) ions caused the HRT to shift toward larger retention times in each case. Hence, we concluded that the presence of Zn2+ ions in the filtrate fermentation liquid at concentrations above 44.5 mg∙dm−3 prolonged the formation of n-C6, i-C6 and n-C7.

4. Conclusions

During the fermentation process, the adsorption of metal ions on the feedstock and their precipitation in the form of hardly soluble sulfides takes place. During the conducted experiment, the above process also took place. By analyzing the content of Zn2+ ions in the filtrate fermentation liquid, the degree of the removal of Zn2+ ions from the solution was calculated. For reactors 2–5, it was, respectively, 46.0, 45.3, 42.,0, and 43.3%. The presented results lead to the conclusion that the degree of removal of Zn2+ ions from the liquid phase of the fermentation process does not depend on the amount of added zinc(II) in the range of 150–1500 mg Zn. The results also allow us to conclude that the processes based on adsorption and precipitation are the main ones that are responsible for the removal of zinc ions from the liquid environment in the methane fermentation process.
The relationship shown in Figure 8 shows that the influence of the zinc ion concentration is significant. A stimulating effect on the conversion of carbon contained in biomass into methane was noted for concentrations up to 45 mg∙dm−3 in the fermentation mixture. The β-factor for this concentration value was the highest at 0.62. Above this concentration, the β-factor began to decline to the initial value at a zinc ion concentration of 64 mg∙dm−3. When the concentration of zinc ions was increased, the size of β decreased to a value of 0.39 at a concentration of 125 mg∙dm−3 Zn2+.
In summary, in terms of the effect exerted by Zn2+ ions contained in the fermentation supernatant during the methane fermentation process of hard corn, it was found that Zn2+ cations have stimulating properties when their concentration does not exceed 45–55 mg∙dm−3. Above this limit, Zn2+ ions have inhibitory properties.
In the studied concentration range, no toxic properties of Zn2+ ions were found.

Author Contributions

Conceptualization, M.C. and S.Ł.; methodology, M.C. formal analysis, M.C. and U.K.; writing—original draft preparation, M.C.; writing—review and editing, U.K.; visualization, S.Ł.; supervision, U.K. and A.B. All authors have read and agreed to the published version of the manuscript.

Funding

The authors acknowledge the financial support from The Ministry of Education and Science who funded this research—“ZIREG—Integrated Program of the Białystok University of Tech-nology for Regional Development”—within the Implementation Ph.D. study of Sławomir Łazarski.

Data Availability Statement

The data supporting reported results you can found: https://repod.icm.edu.pl/dataset.xhtml?persistentId=doi:10.18150/N1ZKFF.

Conflicts of Interest

The authors declare no conflict of interest.

References

  1. Ginter, M.O.; Grobicki, A.M. Analysis of anaerobic sludge containing heavy metals: A novel technique. Water Res. 1995, 29, 2780–2784. [Google Scholar] [CrossRef]
  2. Callander, I.J.; Barford, J.P. Precipitation, chelation, and the availability of metals as nutrients in anaerobic digestion. II. Applications. Biotechnol. Bioeng. 1983, 25, 1959–1972. [Google Scholar] [CrossRef] [PubMed]
  3. MacNicol, R.D.; Beckett, P.H.T. The distribution of heavy metals between the principal components of digested sewage sludge. Water Res. 1989, 23, 199–206. [Google Scholar] [CrossRef]
  4. Haraguchi, H. Metallomics as integrated biometal science. J. Anal. At. Spectrom. 2004, 19, 5–14. [Google Scholar] [CrossRef]
  5. Christ, H.; Oberholser, K.; Shank, N.E.; Nguyen, M.T. Nature of bonding between metallic ions and algal cell walls. Environ. Sci. Technol. 1981, 15, 1212–1217. [Google Scholar] [CrossRef]
  6. Harvey, R.W.; Leckie, J.O. Sorption of lead onto two gram-negative marine bacteria in seawater. Mar. Chem. 1985, 15, 333–344. [Google Scholar] [CrossRef]
  7. de Lurdes, M.; Gonçalves, S.; Sigg, L.; Reutlinger, M.; Stumm, W. Metal ion binding by biological surfaces: Voltammetric assessment in the presence of bacteria. Sci. Total Environ. 1987, 60, 105–119. [Google Scholar] [CrossRef]
  8. Beveridge, T.J.; Murray, R.G. Sites of metal deposition in the cell wall of Bacillus subtilis. J. Bacteriol. 1980, 141, 876–887. [Google Scholar] [CrossRef]
  9. Fein, J.B.; Daughney, C.J.; Yee, N.; Davis, T.A. A chemical equilibrium model for metal adsorption onto bacterial surfaces. Geochim. Et. Cosmochim. Acta 1997, 61, 3319–3328. [Google Scholar] [CrossRef]
  10. TienCt; Huang, C.P. Formation of surface complexes between heavy metals and sludge particles. In Heavy Metals in the Environment; Elsevier Science Publishers BV: Amsterdam, The Netherlands, 1991; pp. 195–311. [Google Scholar]
  11. Rosen, B.P. Bacterial resistance to heavy metals and metalloids. JBIC J. Biol. Inorg. Chem. 1996, 1, 273–277. [Google Scholar] [CrossRef]
  12. Konings, W.N.; Kaback, H.R.; Lolkema, J.S. Transport Processes in Eukaryotic and Prokaryotic Organisms; Elsevier: Amsterdam, The Netherlands, 1996. [Google Scholar]
  13. Siemion, I.Z. Biostereochemia; Państwowe Wydaw: Warsaw, Poland, 1985. [Google Scholar]
  14. Zhou, Q.; Lin, Y.; Li, X.; Yang, C.; Han, Z.; Zeng, G.; Lu, L.; He, S. Effect of zinc ions on nutrient removal and growth of Lemna aequinoctialis from anaerobically digested swine wastewater. Bioresour. Technol. 2018, 249, 457–463. [Google Scholar] [CrossRef] [PubMed]
  15. Blomberg, M.R.A.; Borowski, T.; Himo, F.; Liao, R.-Z.; Siegbahn, P.E.M. Quantum Chemical Studies of Mechanisms for Metalloenzymes. Chem. Rev. 2014, 114, 3601–3658. [Google Scholar] [CrossRef] [PubMed]
  16. Adams, M.W.W.; Jin, S.L.C.; Chen, J.-S.; Mortenson, L.E. The redox properties and activation of the F420)-non-reactive hydrogenase of Methanobacterium formicicum. Biochim. Et. Biophys. Acta (BBA) Protein Struct. Mol. Enzymol. 1986, 869, 37–47. [Google Scholar] [CrossRef]
  17. Yang, S.; Wen, Q.; Chen, Z. Impacts of Cu and Zn on the performance, microbial community dynamics and resistance genes variations during mesophilic and thermophilic anaerobic digestion of swine manure. Bioresour. Technol. 2020, 312, 123554. [Google Scholar] [CrossRef] [PubMed]
  18. Chen, Y.; Cheng, J.J.; Creamer, K.S. Inhibition of anaerobic digestion process: A review. Bioresour. Technol. 2008, 99, 4044–4064. [Google Scholar] [CrossRef]
  19. Cestonaro do Amaral, A.; Kunz, A.; Radis Steinmetz, R.L.; Justi, K.C. Zinc and copper distribution in swine wastewater treated by anaerobic digestion. J. Environ. Manag. 2014, 141, 132–137. [Google Scholar] [CrossRef]
  20. Gordeeva, V.P.; Statkus, M.A.; Tsysin, G.I.; Zolotov, Y.A. X-ray fluorescence determination of As, Bi, Co, Cu, Fe, Ni, Pb, Se, V and Zn in natural water and soil extracts after preconcentration of their pyrrolidinedithiocarbamates on cellulose filters. Talanta 2003, 61, 315–329. [Google Scholar] [CrossRef]
  21. Hu Yongguang, D.Z.; Wang Sheng, M.A. Determination of shearing force by measuring NDF and ADF in tea stems with hyperspectral imaging technique. IFAC-PapersOnLine 2018, 51, 849–854. [Google Scholar] [CrossRef]
  22. Huang, Y.-F.; Lo, S.-L. Predicting heating value of lignocellulosic biomass based on elemental analysis. Energy 2020, 191, 116501. [Google Scholar] [CrossRef]
  23. Yin, D.-m.; Mahboubi, A.; Wainaina, S.; Qiao, W.; Taherzadeh, M.J. The effect of mono- and multiple fermentation parameters on volatile fatty acids (VFAs) production from chicken manure via anaerobic digestion. Bioresour. Technol. 2021, 330, 124992. [Google Scholar] [CrossRef]
  24. Mondal, B.C.; Das, D.; Das, A.K. Preconcentration and separation of copper, zinc and cadmium by the use of 6-mercapto purinylazo resin and their application in microwave digested certified biological samples followed by AAS determination of the metal ions. J. Trace Elem. Med. Biol. 2002, 16, 145–148. [Google Scholar] [CrossRef]
  25. Le, D.M.; Sørensen, H.R.; Meyer, A.S. Elemental analysis of various biomass solid fractions in biorefineries by X-ray fluorescence spectrometry. Biomass Bioenergy 2017, 97, 70–76. [Google Scholar] [CrossRef]
  26. Chen, Y.; Wang, Z.; Lin, S.; Qin, Y.; Huang, X. A review on biomass thermal-oxidative decomposition data and machine learning prediction of thermal analysis. Clean. Mater. 2023, 9, 100206. [Google Scholar] [CrossRef]
  27. Arendt, E.K.; Zannini, E. 2—Maizes. In Cereal Grains for the Food and Beverage Industries; Arendt, E.K., Zannini, E., Eds.; Woodhead Publishing: Sawston, UK, 2013. [Google Scholar]
  28. Beklemishev, K.; Stoyan, A. Sorption–Catalytic Determination of Manganese Directly on a Paper-based Chelating Sorbent. Analyst 1997, 122, 1161–1166. [Google Scholar] [CrossRef] [PubMed]
  29. Beklemishev, M.K.; Dolmanova, I.F.; Petrova, Y.Y. Sorption–catalytic testing of copper on a paper-based sorbent with attached alkylamino groups. Analyst 1999, 124, 1523–1527. [Google Scholar] [CrossRef]
Figure 1. Comparison of analyses for species 5 in different furnace atmospheres. The dashed line indicates that the analysis was performed in a nitrogen atmosphere.
Energies 16 07425 g001
Figure 2. Composition of the tested hard corn species expressed in (%) TS.
Energies 16 07425 g002
Figure 3. Zn concentration in the analyzed materials.
Energies 16 07425 g003
Figure 4. Dependence of the volume of biogas released (cm3 -dm−1) on the duration of the process for the SILEXX variety.
Energies 16 07425 g004
Figure 5. Changes in the concentrations of the main biogas components during the fermentation process for the MAXXYM variety.
Energies 16 07425 g005
Figure 6. Changes in the concentrations of the C2 and C3 acids during the first fermentation process for the MAXXIS variety.
Energies 16 07425 g006
Figure 7. Changes in the concentrations of residual acids during the first fermentation process of the MAXXIS variety.
Energies 16 07425 g007
Figure 8. Variation in the carbon conversion factor depending on the concentration of zinc(II) ions in the fermentation liquid.
Energies 16 07425 g008
Figure 9. Concentration of C2 acids depending on the concentration of Zn2+ ions in the fermentation mixture during the process.
Energies 16 07425 g009
Figure 10. Concentration of C3 acids depending on the concentration of Zn2+ ions in the fermentation mixture during the process.
Energies 16 07425 g010
Table 1. Corn varieties (subspecies) used in the experiment *.
No.
(Designation)
VarietyFactor
FAO
UseTotal Effective Temperature
Based on 6 °C
1MAXXIS330k/zk—1570 °C
z—1760 °C
2MAXXYM310kk—1520 °C
3SILEXX320kk—1530 °C
4TEXXUD320k/zk—1570 °C
z—1760 °C
5PIXXIA430k/zk—1620 °C
z—1790 °C
6RIXXER380k/zk—1600 °C
z—1780 °C
7SAXXOO380kk—1590 °C
8DK604540k/zk—1790 °C
z—1980 °C
9TIXXUS520k/zk—1780 °C
z—1970 °C
10TYREXX550k/zk—1800 °C
z—1990 °C
* described in the text.
Table 2. Results of the analysis of the dry matter content of corn silage at 105 °C.
VarietyTS1
(%)
TS2
(%)
TS3
(%)
TSmedium
(%)
RSD
(%)
132.0131.9431.9631.970.10
236.0135.9635.6735.880.50
338.2138.2738.2738.250.14
434.0134.0233.9533.990.12
535.0635.0835.0035.050.12
632.0332.0531.9632.010.14
732.6332.5532.5532.580.15
835.9736.2635.7035.980.77
934.5034.8534.4934.610.59
1038.4238.4638.3238.400.20
RSD denotes the relative standard deviation.
Table 3. Sample weights of the tested corn varieties subjected to the process of mineralization.
SpeciesSample Weight
m1 (g)m2 (g)m3 (g)
10.70300.74150.7154
20.74540.71240.7412
30.71150.70150.7144
40.77280.73250.7210
50.70300.72470.7325
60.70210.71470.7415
70.74130.71220.7524
80.75680.74230.7155
90.74180.76440.7321
100.75550.70450.7521
Table 4. Parameters used for the fluorescence X-ray analysis.
ElementAnalytical Line
(mÅ)
Left Background Point
(mÅ)
Right Background Point
(mÅ)
Exposure Time
(s)
ZnKβ 1298.61240135060
Table 5. Statistical parameters used for the calibration curve for the determination of zinc using the WD-XRF technique with the DETATA-type preconcentration.
AnalyteEquationR2srLOD
(μg∙Filter−1)
Zny = 1855x + 7200.99540.321.29
Table 6. Certified reference materials.
StandardZn
NCS ZC730102.9
NCS ZC7301226
NCS ZC7301451
CTA-OTL-149.9
CTA-VTL-243.3
Table 7. Statistical parameters used for the calibration curve for the determination of zinc using the WD-XRF technique with DETATA-type preconcentration.
AnalyteExpected Value
(mg∙kg−1 TS)
Value Received
(mg kg−1 TS)
Retrieved From
(%)
Zn2.9049.93.0349.6104.599.3
Table 8. Summary of the statistical parameters used for the calibration curves made by the FAAS method.
AnalyteEquationR2srLOD
(mg-dm)−3
Zny = 5.437-10−2 x + 8.129-10−30.99960.070.32
Table 9. Parameters used for the F-Snedecor test.
AnalyteFFkrf1f2s12S22
Zn9.61016.30559.61–10−21.00–10−2
Table 10. Comparison of the FAAS and WD-XRF methods with DETATA preconcentration.
AnalyteFactor
Determination
Deviation
Standard
Regression
Detection Limit
(mg-dm)−3
Coefficient of Variation
(%)
FAASWD-XRFFAASWD-XRFFAASWD-XRFFAASWD-XRF
Zn0.99950.99570.100.310.430.122.798.51
Table 11. Parameters of the first fermentation process. The duration of the process was 120 days.
VarietyInputTS
In the Fermenter
(%)
VS
(g)
Water (g).Silage (g).
MAXXIS600020108.02139
MAXXYM17207.99111
SILEXX17908.02115
TEXXUD18508.01117
PIXXIA17707.98126
RIXXER20008.00139
SAXXOO19507.99118
DK60417107.98119
TIXXUS18007.99124
TYREXX15808.00102
Table 12. The values of the parameters of the Weibull equation and the amount of biogas obtained.
VarietyParameterr2Vbiogas
abcx0y0(dm3)(dm3.g VS−1)
MAXXIS6454.3943.461.7157.89241.380.9884374.52.70
MAXXYM6615.1542.051.9649.47243,030.9826356.53.20
SILEXX6367.1450.181.6455.92233.140.9912416.23.62
TEXXUD5598.8558.441.6354.67120.350.9890399.23.41
PIXXIA6012.2048.621.3245.51691.450.9463440.93.51
RIXXER4802.0165.951.3052.38128.760.9746348.32.50
SAXXOO5214.4158.481.4651.12244.580.9842387.83.28
DK6046231.8241.871.9248.57244.810.9904340.02.86
TIXXUS5486.6851.261.7951.03208.470.9875363.72.94
TYREXX5978.2845.331.8256.27198.670.9910350.23.42
Table 13. GFM 430 gas analyzer specifications—range of concentrations analyzed.
AnalyteScope
Determinability
AccuracyResponse Time
(s)
CH40–100%0.2% at 5%20
1% at 30%
3% at 100%
CO20–100%0.1% at 10%30
3% at 50%
5% at 100%
O20–25%0.5%20
H2 S0–1500 ppm5%30
H20–1000 ppm5%30
NH30–1000 ppm5%30
Table 14. Parameters of the functions describing the changes in the methane and carbon(IV) oxide concentrations over time for the hard corn varieties tested.
VarietyParameter Values for CH4Parameter Values for CO2
ghixcycr2abr2cdefr2
MAXXIS58.4968.521.7251.621.120.99296.12−4.300.9548−0.00020.06−4.14130.80.9852
MAXXYM61.3671.111.6655.011.530.98533.69−5.720.9789−0.00020.06−4.40139.10.9606
SILEXX60.9770.831.6153.561.910.99313.18−7.220.9756−0.00020.04−3.90131.10.9766
TEXXUD62.9074.411.7057.402.110.98644.66−9.350.9494−0.00020.05−3.80129.10.9630
PIXXIA59.3663.271.5146.516.170.97792.91−2.680.9812−0.00030.07−4.50125.90.9913
RIXXER48.8981.351.2748.346.620.95795.22−4.580.9914−0.00030.07−4.81149.90.9432
SAXXOO52.1478.441.6849.564.810.98144.58−4.110.9984−0.00020.06−4.92137.40.9844
DK60456.2974.161.5952.833.880.99433.61−2.570.9916−0.00030.06−3.84142.80.9949
TIXXUS60.2771.471.6257.344.120.98965.91−6.640.9862−0.00030.06−4.24168.60.9919
TYREXX53.3564.911.6149.165.730.99624.29−5.370.9975−0.00020.06−4.73148.70.9823
Table 15. Magnitudes of the area under functions representing changes in the CH4 and CO2 concentrations over time.
VarietyPLPQBorderPWPC%CH4
MAXXIS686680415.6951469412,18438.5
MAXXYM624622419.7252501211,86042.3
SILEXX657327222.70935036896556.2
TEXXUD578283117.89335297870660.8
PIXXIA689365722.70935170951654.3
RIXXER736440217.69724607974647.3
SAXXOO789333219.48545080920155.2
DK604602626918.9875504411,91542.3
TIXXUS787625117.4861517912,21742.4
TYREXX685579419.1657473011,20942.2
Table 16. Magnitude of the coefficient β C C H 4 , 120 and the values of n C C H 4 e q i n C E A .
Variety
n C E A
n C C H 4 e q
β C C H 4 , 120
MAXXIS23.966.440.2687
MAXXYM22.006.730.3060
SILEXX21.9910.440.4749
TEXXUD23.2610.840.4660
PIXXIA22.3310.690.4787
RIXXER23.047.350.3192
SAXXOO22.479.560.4253
DK60422.646.420.2836
TIXXUS22.196.880.3102
TYREXX22.046.600.2993
Table 17. Composition of Supelco’s certified reference material 46975-U.
AcidMass
(g∙mol−1)
C of the Standard
(mmol∙dm−3)
C
(mg∙dm−3)
C146.0310.85499.4
C260.0510.16610.1
C374.0810.49777.1
i-C488.1110.08888.1
n-C488.1110.08888.1
i-C5102.1310.321054
n-C5102.1310.291051
i-C6116.169,921152
n-C6116.1610.031165
n-C7130.1910.231332
Table 18. Calculated recovery values for the individual acids.
AcidQuantity Declared
(mg-dm−3)
Quantity Received (Recovery)
(%)
C2315.4101.5
C3194.399.2
i-C4222.0101.9
n-C4222.0101.2
i-C5263.5102.2
n-C5262.799.0
i-C6288.1100.5
n-C6291.3100.3
n-C7333.099.5
Table 19. Summary of the parameters used to calculate the carbon conversion factor for fermentation processes with the addition of Zn2+ ions.
BioreactorPCPWr2 for PW% CH4 n C C H 4 e q n C E A β C C H 4 , 120 1
1953151730.977054.311.722.60.5177
2992854170.974454.612.322.10.5566
3954252170.915954.713.822.30.6188
4789343310.918754.910.722.30.4798
5721739110.977554.28.822.30.3946
1 Carbon-to-methane conversion factor over a 120 day period calculated according to Equation (16).
Disclaimer/Publisher’s Note: The statements, opinions and data contained in all publications are solely those of the individual author(s) and contributor(s) and not of MDPI and/or the editor(s). MDPI and/or the editor(s) disclaim responsibility for any injury to people or property resulting from any ideas, methods, instructions or products referred to in the content.

