Article

Characterization and Comparison of DSSCs Fabricated with Black Natural Dyes Extracted from Jamun, Black Plum, and Blackberry

1
Center for Nanotechnology, Department of Natural Sciences, Coppin State University, Baltimore, MD 21216, USA
2
National High Magnetic Field Laboratory, Florida State University, Tallahassee, FL 32310, USA
3
Department of Materials Design and Innovation, University at Buffalo, Buffalo, NY 14260, USA
4
Department of Mechanical Engineering Technology, SUNY—Buffalo State, 1300 Elmwood Avenue, Buffalo, NY 14222, USA
5
Center of Excellence for Advanced Materials Research (CEAMR) & Department of Chemistry, King Abdulaziz University, P.O. Box 80203, Jeddah 21589, Saudi Arabia
6
Department of Chemistry, Comilla University, Cumilla 3506, Bangladesh
7
Department of Pharmaceutics, College of Pharmacy, King Saud University, P.O. Box 2457, Riyadh 11451, Saudi Arabia
8
Department of Chemistry, University of Chittagong, Chittagong 4331, Bangladesh
9
Department of Chemistry, Khulna University of Engineering & Technology, Khulna 9203, Bangladesh
10
Department of Chemistry, American International University-Bangladesh (AIUB), Dhaka 1229, Bangladesh
11
Department of Pharmaceutical Sciences, North South University, Dhaka 1229, Bangladesh
*
Authors to whom correspondence should be addressed.
Energies 2023, 16(20), 7187; https://doi.org/10.3390/en16207187
Submission received: 6 September 2023 / Revised: 13 October 2023 / Accepted: 19 October 2023 / Published: 21 October 2023
(This article belongs to the Special Issue Trends and Prospects in Dye-Sensitized Solar Cells)

Abstract

:
In this report, natural dyes extracted from three different, black-colored fruits were used as photosensitizers for the construction of dye-sensitized solar cells (DSSCs). The natural dyes were extracted from the dark-colored peels of jamun (also known as Indian black plum), black plum, and blackberry fruit. These natural dyes contain polyphenolic compounds—most prominently anthocyanins—which interact strongly with titanium dioxide (TiO2) semiconductors and accordingly enhance the efficiency of DSSCs. The natural dyes extracted from the various fruits were characterized utilizing UV-Vis and fluorescence spectroscopy. The interaction between the dyes and TiO2 was monitored with FTIR and Raman spectroscopy. The fabricated DSSCs were characterized via current–voltage measurements and electrochemical impedance analysis. DSSCs fabricated with jamun produced the highest efficiency of 1.09% with a short-circuit current of 7.84 mA/cm2, an open-circuit voltage of 0.45 V, and a fill factor of 0.31. The efficiencies of the DSSCs from black plum and blackberry were 0.55% and 0.38%, respectively. The flow of charge occurring at the interfaces between the natural dye and the TiO2 layers were investigated using electrochemical impedance spectroscopy (EIS). To the best of our knowledge, this study is the first to directly compare three distinct types of black DSSCs. Computation analysis was also carried out utilizing SCAPS-1D software (version 3.3.07), which revealed how the type of defects in the devices impacts their performance.

1. Introduction

There is an ever-growing need for energy in every country, and the prime sources of energy in the world are fossil fuels such as coal, natural gas, bituminous sand, and oil. Nevertheless, these materials are deemed suboptimal sources of energy due to their status as primary contributors to pollution, which poses their persistent use in significant environmental challenges [1,2,3]. Therefore, the growth of renewable energy is crucial to meeting the increasing energy demand of the world.
In recent times, there has been significant exploration of many types of renewable energy, including solar, wind, hydro, biomass, and geothermal. Among them, solar energy stands out as the most abundant resource [1,2,3]. Solar cells convert sunlight to electricity, and it can be harnessed by people from all parts of the world.
DSSCs transform solar energy into electrical energy by photosensitization of the cell [4,5,6,7,8,9,10,11]. The efficiency of this conversion depends, to a large extent, on the quality of the dye sensitizer used in the fabrication of the solar cell [12,13,14,15]. Over the past two decades, several classes of dyes—including ruthenium compounds, [15,16,17,18,19,20]. Porphyrins [21,22,23] and cyanines [24,25] have been synthesized, characterized, and applied in the design of efficient DSSCs. However, these dyes are at times expensive and not completely safe for the environment. Consequently, there is growing interest in the use of natural dyes extracted from plants as photosensitizers in the construction of DSSCs [26,27,28,29,30,31,32,33,34,35]. The use of natural dyes in DSSCs is a promising development as a result of the following reasons: (1) most natural dye pigments, such as anthocyanins, carotenoids, flavonoids, and chlorophylls, have anchoring groups that strongly bind the dye to TiO2 electrodes, which allows for easy charge transfer; (2) they are more economical since they are obtained through a simple extraction process (cold press, solvent extraction), as opposed to an expensive chemical synthesis process in the case of synthetic dyes; (3) plants are abundant in supply and the natural dye can be extracted from various parts of the plants including fruit, leaves, flowers, roots, and bark.
In this study, natural dyes from three black fruits, as shown in Figure 1, were explored for use as sensitizers in the design of a solar cell. Since the pigment is mostly concentrated in the peels of the fruits, the dye for sensitization was extracted from the peels.
In addition to the experimental study, we also accomplished computational analysis of the three DSSCs using SCAPS-1D software (version 3.3.07.) and projected different types of defects present in the three devices as well as their energy positions, densities, and their influence on the photovoltaic performance of the devices. Numerous types of defects, such as oxygen vacancies (Vo), Ti interstitials (Tii), and hydroxyl groups, are commonly present during the synthesis of TiO2 semiconductors [36,37,38,39,40]. These defects change the electronic structure of TiO2, especially the oxygen vacancy (Vo), which affects the optical and electronic properties of TiO2 [40,41,42]. Vo is primarily found in TiO2 at the subsurface level, though with an applied electric field, it can be stable at the surface level of TiO2 [43,44]. The transformation of Ti4+ to Ti3+ accelerates with the increasing defect density of Vo [45]. The Ti atoms also become relaxed around the Vo by decreasing the Ti–O bond length [38].

2. Experimental Section

2.1. Materials

The counter electrode was prepared using colloidal graphite obtained from Ted Pella, Inc., (Redding, CA, USA). TiO2 powder (Degussa P-25) and iodide/triiodide redox couple were used as the electrolyte medium and were purchased from the Institute of Chemical Education of the University of Wisconsin-Madison, Department of Chemistry (Madison, WI, USA). FTO glass slides were purchased from Hartford Glass Company (Hartford City, IN, USA). NaOH, C3H6O, C2H5OH, and CH3COOH were purchased from Sigma-Aldrich (St. Louis, MO, USA), and were utilized without undergoing additional purification steps.

2.2. Characterization Techniques

TiO2 paste was pasted on FTO slides employing a WS-650 Series Spin Processor from Laurell Technologies Corporation (Lansdale, PA, USA). The performance of the cell was evaluated applying a 150 W fully reflective solar simulator provided by Sciencetech Inc., London, ON, Canada. The solar simulator produced a standard illumination of air mass 1.5 global (AM 1.5 G) with an irradiation of 100 mWcm−2. The 600 Potentiostat/Galvanostat/ZRA, manufactured by GAMRY Instruments (Warminster, PA, USA), was referenced. Spartan ‘14, developed by Wavefunction, Inc. (Irvine, CA, USA), was used to perform the HOMO and LUMO computations. FTIR spectra were found with a Thermo Nicolet iS50 FTIR. The samples were placed on a crystal of ATR-FTIR, and the spectra were scanned within the wavenumber range of 600–4000 cm−1. Thermo Fisher Scientific Co., Ltd. (Waltham, MA, USA) smart Raman spectrometer model DXR was used for the Raman study. Morphological and elemental analysis of the TiO2 photoanode was carried out with a field emission scanning electron microscope (JSM 7100F, JEOL.COM, Peabody, MA, USA) furnished with energy-dispersive X-ray spectroscopy for elemental analysis.

2.3. Natural Dye Extraction

Jamun is a fruit that has very light-colored flesh surrounded by a rich, dark purple skin. The dye was extracted from the peel of the fruit due to its high concentration of anthocyanin. The blackberries and black plum were handled in a similar fashion and the natural dyes were extracted employing a commercial blender extractor. The dye extraction process was performed through an order of steps. No organic solvent was used in the extraction of the natural pigments in the jamun, blackberry, and black plumb. About 50 g of fresh whole blackberry, 50 g fresh peels of black plum, and 50 g of fresh peels of Jamun were each placed in a commercial juicer (Big Mount Pro Juice Extractor by Hamilton Beach) at room temperature (25 °C) and the juice extracted from the solid parts of the fruit. The extracted juice was filtered and centrifuged at 6000 RPM for 30 min, followed by decantation to remove any precipitate present in the extract. The dark-colored extract was applied in sensitizing the respective TiO2.

2.4. Fabrication of Jamun, Black Plum, and Blackberry DSSC

The electrodes were made using a modified version of a method described in a previously published paper [46,47,48,49,50]. To make the photoanode, a thin film of TiO2 was deposited using a spin coater on the conducting side of an FTO glass, and then annealed at 380 °C for 2 h. After an hour of immersion in TiCl4 solution, the TiO2-coated FTO glass was annealed once more for 30 min. Subsequently, the substrate was submerged for an extended duration of time, specifically overnight, in a dye solution that had been recently made. On the conductive side of the FTO glass, colloidal graphite was applied to create the counter electrode, i.e., the cathode. In order to create a solar cell, the corresponding dye-sensitized photoanodes and carbon electrodes were sandwiched over a redox iodine/iodide electrolyte solution.

2.5. Simulation Methods

SCAPS is a software application designed for simulating one-dimensional solar cells, which was developed by the Electronics and Information Systems (ELIS) department at the University of Gent [51,52,53]. SCAPS captures the analytical physics of the PV device, but it is not restricted to transport mechanisms, electric field distributions, individual carrier current densities, or recombination profiles. SCAPS has the most AC and DC electrical measurements when compared to other simulation software, which includes open-circuit voltage (Voc), short circuit current density (Isc), fill factor (FF), power conversion efficiency (PCE), quantum efficiency (QE), spectral response, generation, and recombination profile. These physical quantities can be calculated under varying levels of lighting and temperature, as well as in both illuminated and unilluminated conditions. Three coupled differential equations serve as a basis for it, Poisson (1) and continuity equations for holes (2) and electrons (3), as follows:
d d x ε x d ψ d x = q [ p x n x + N d + x N a x + p t x n t ( x ) ]
d p n d t = G p p n p n 0 τ p p n μ p d ξ d x μ p ξ d p n d x + D p d 2 p n d x 2
d n p d t = G n n p n p 0 τ n + n p μ n d ξ d x + μ n ξ d n p d x + D n d 2 n p d x 2
Here, the symbol ψ represents the electrostatic potential, q denotes the charge of an electron, D represents the diffusion coefficient, G represents the generation rate, ξ represents the permittivity, and n, p, nt, and pt represent the quantities of free holes, free electrons, trapped holes, and trapped electrons, respectively. The term N a denotes the concentration of ionized acceptor-like dopants, while N d + represents the concentration of ionized donor-like dopants.

2.6. Device Architecture

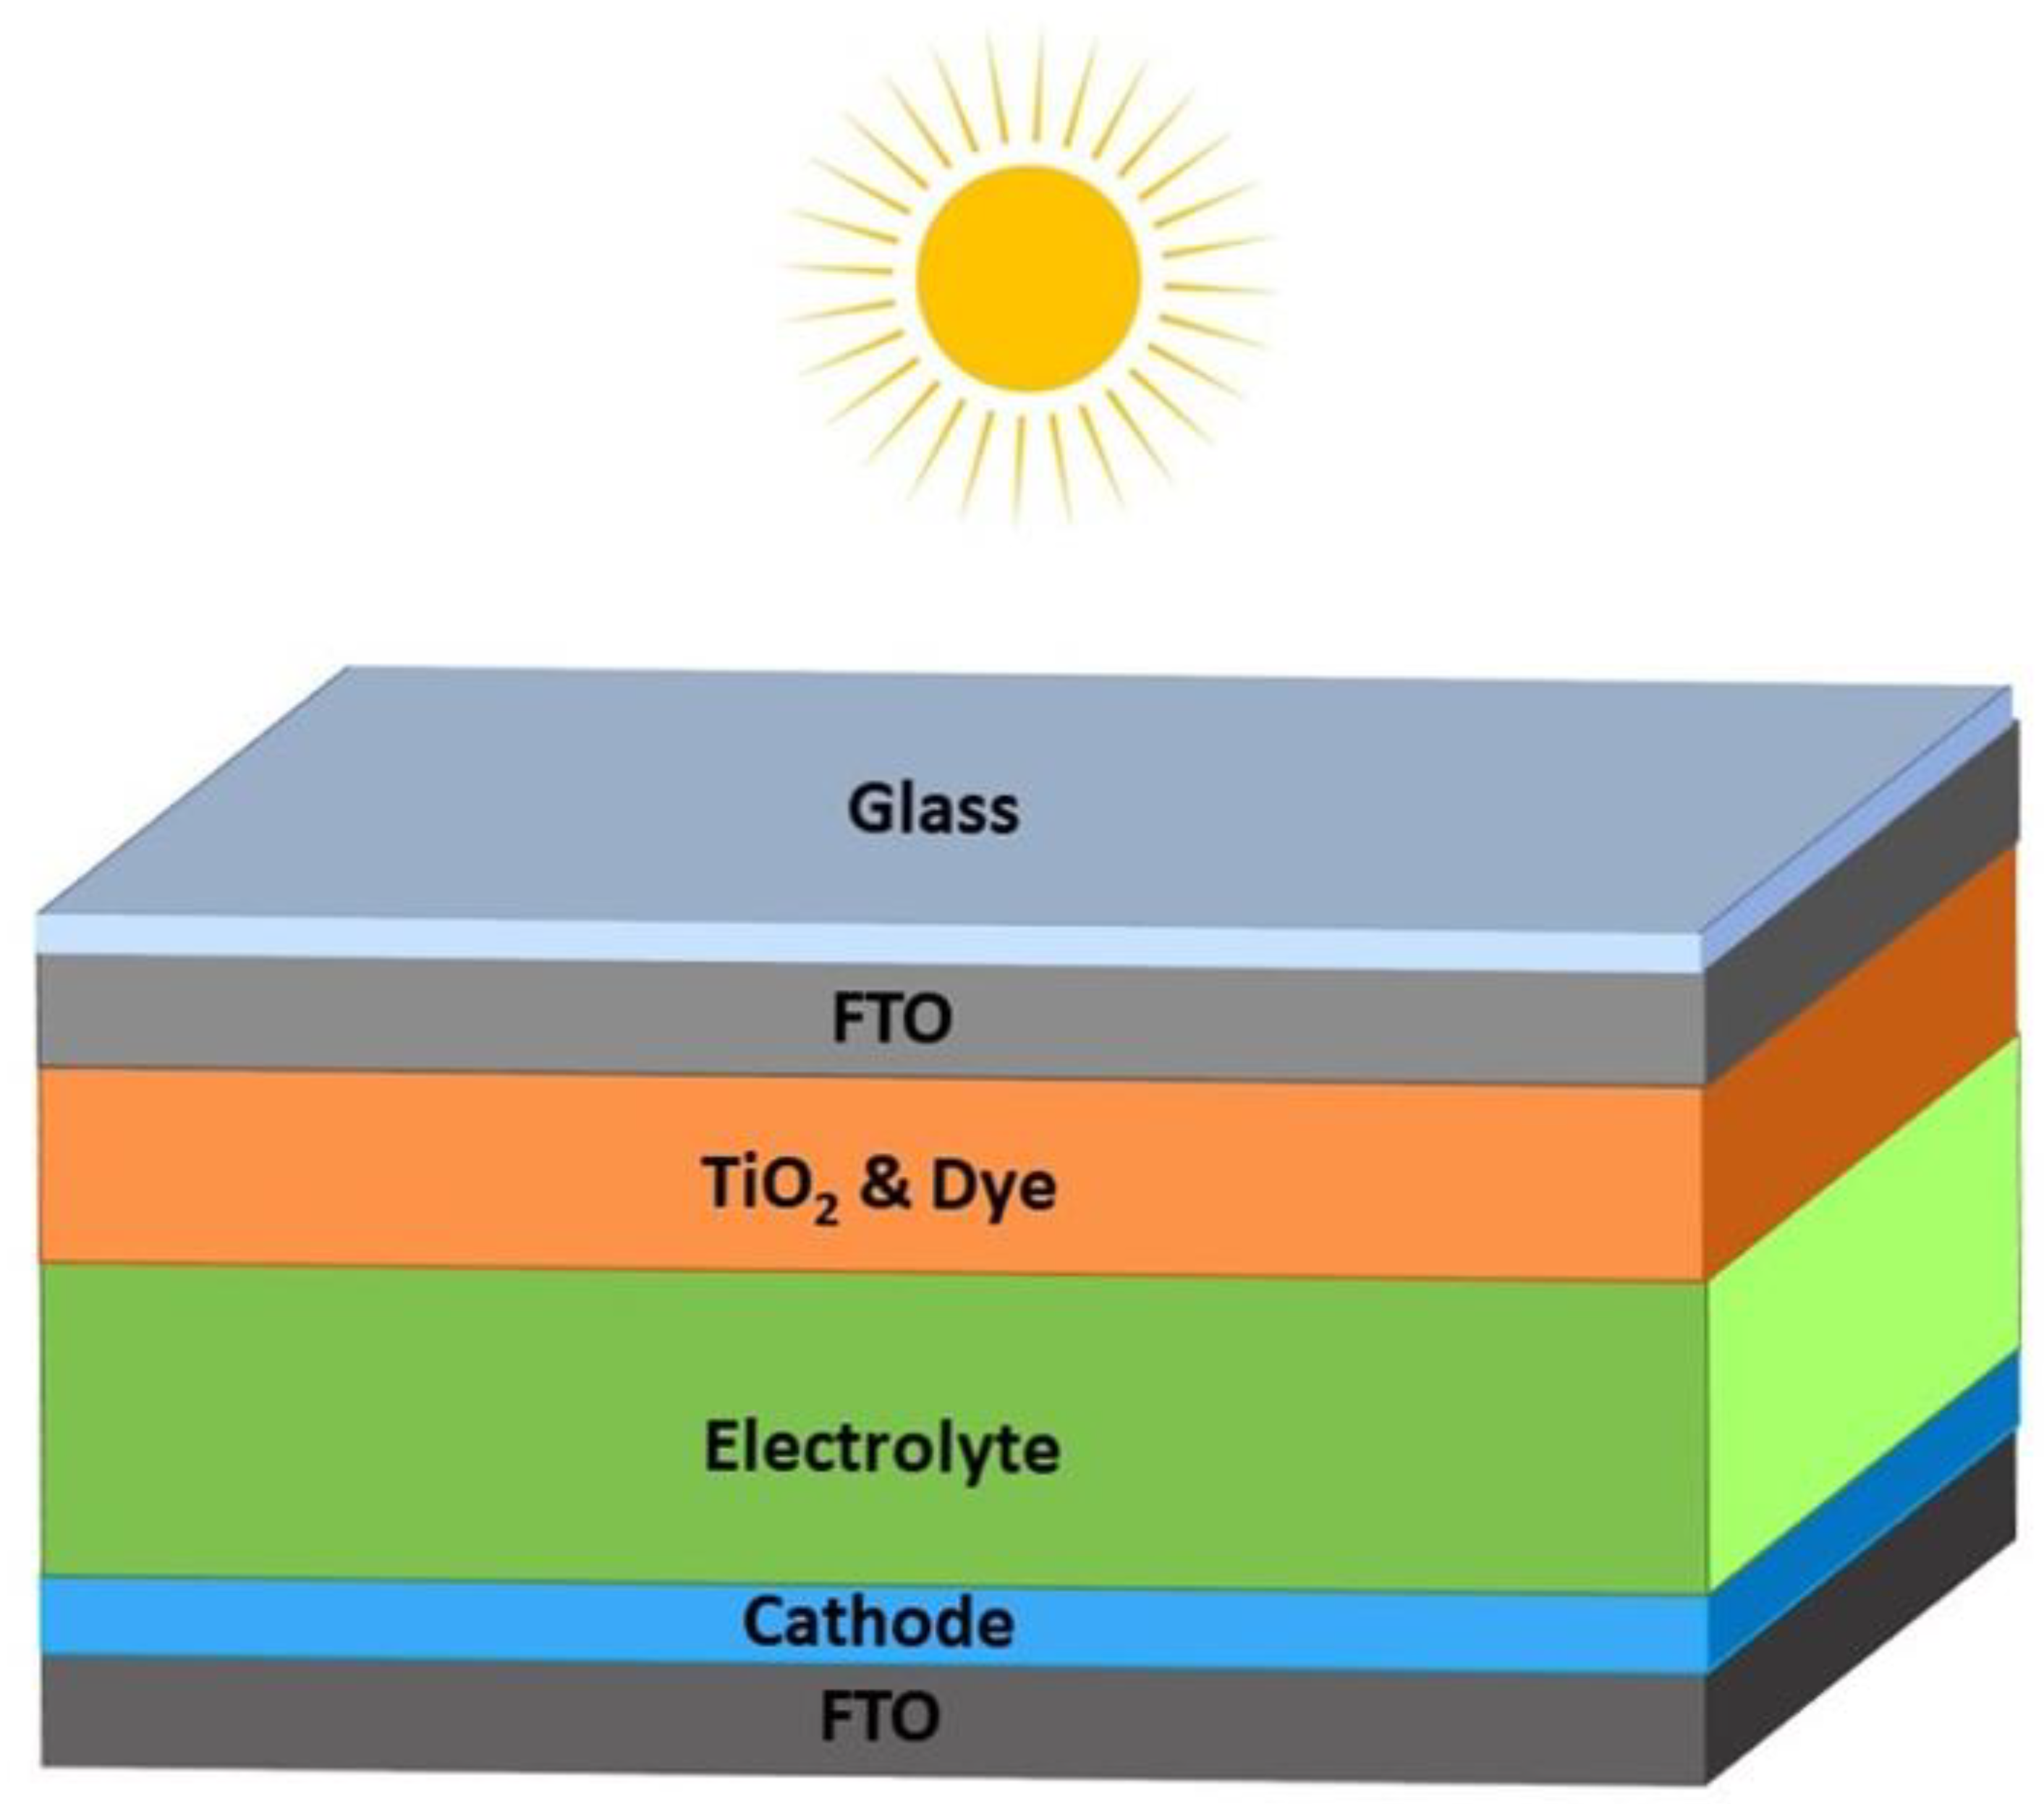
Figure 2 is a schematic illustration of the DSSC. The default operating temperature is set to 300 K and the illumination condition is set to the global AM 1.5 standard. The device consists of an anode and a cathode separated by the electrolyte. The anode is made up of an FTO-coated glass plate with a layer of dye-sensitized TiO2 film. The cathode comprises an FTO-coated glass plate with a layer of colloidal graphite. This setup allows for the generation of current when light is incident on the device.

2.7. Simulation Parameters

Different key parameters of the different layers of the DSSC used in SCAPS-1D software are illustrated in Table 1. The parameters were gathered from a variety of experimental works, some reasonable estimates, and published literature [54,55,56,57,58,59,60,61]. The defective properties of the three natural dye-sensitized TiO2 films used for our simulation study are also shown in Table 2.

3. Results and Discussion

3.1. Absorption Spectroscopy Measurements

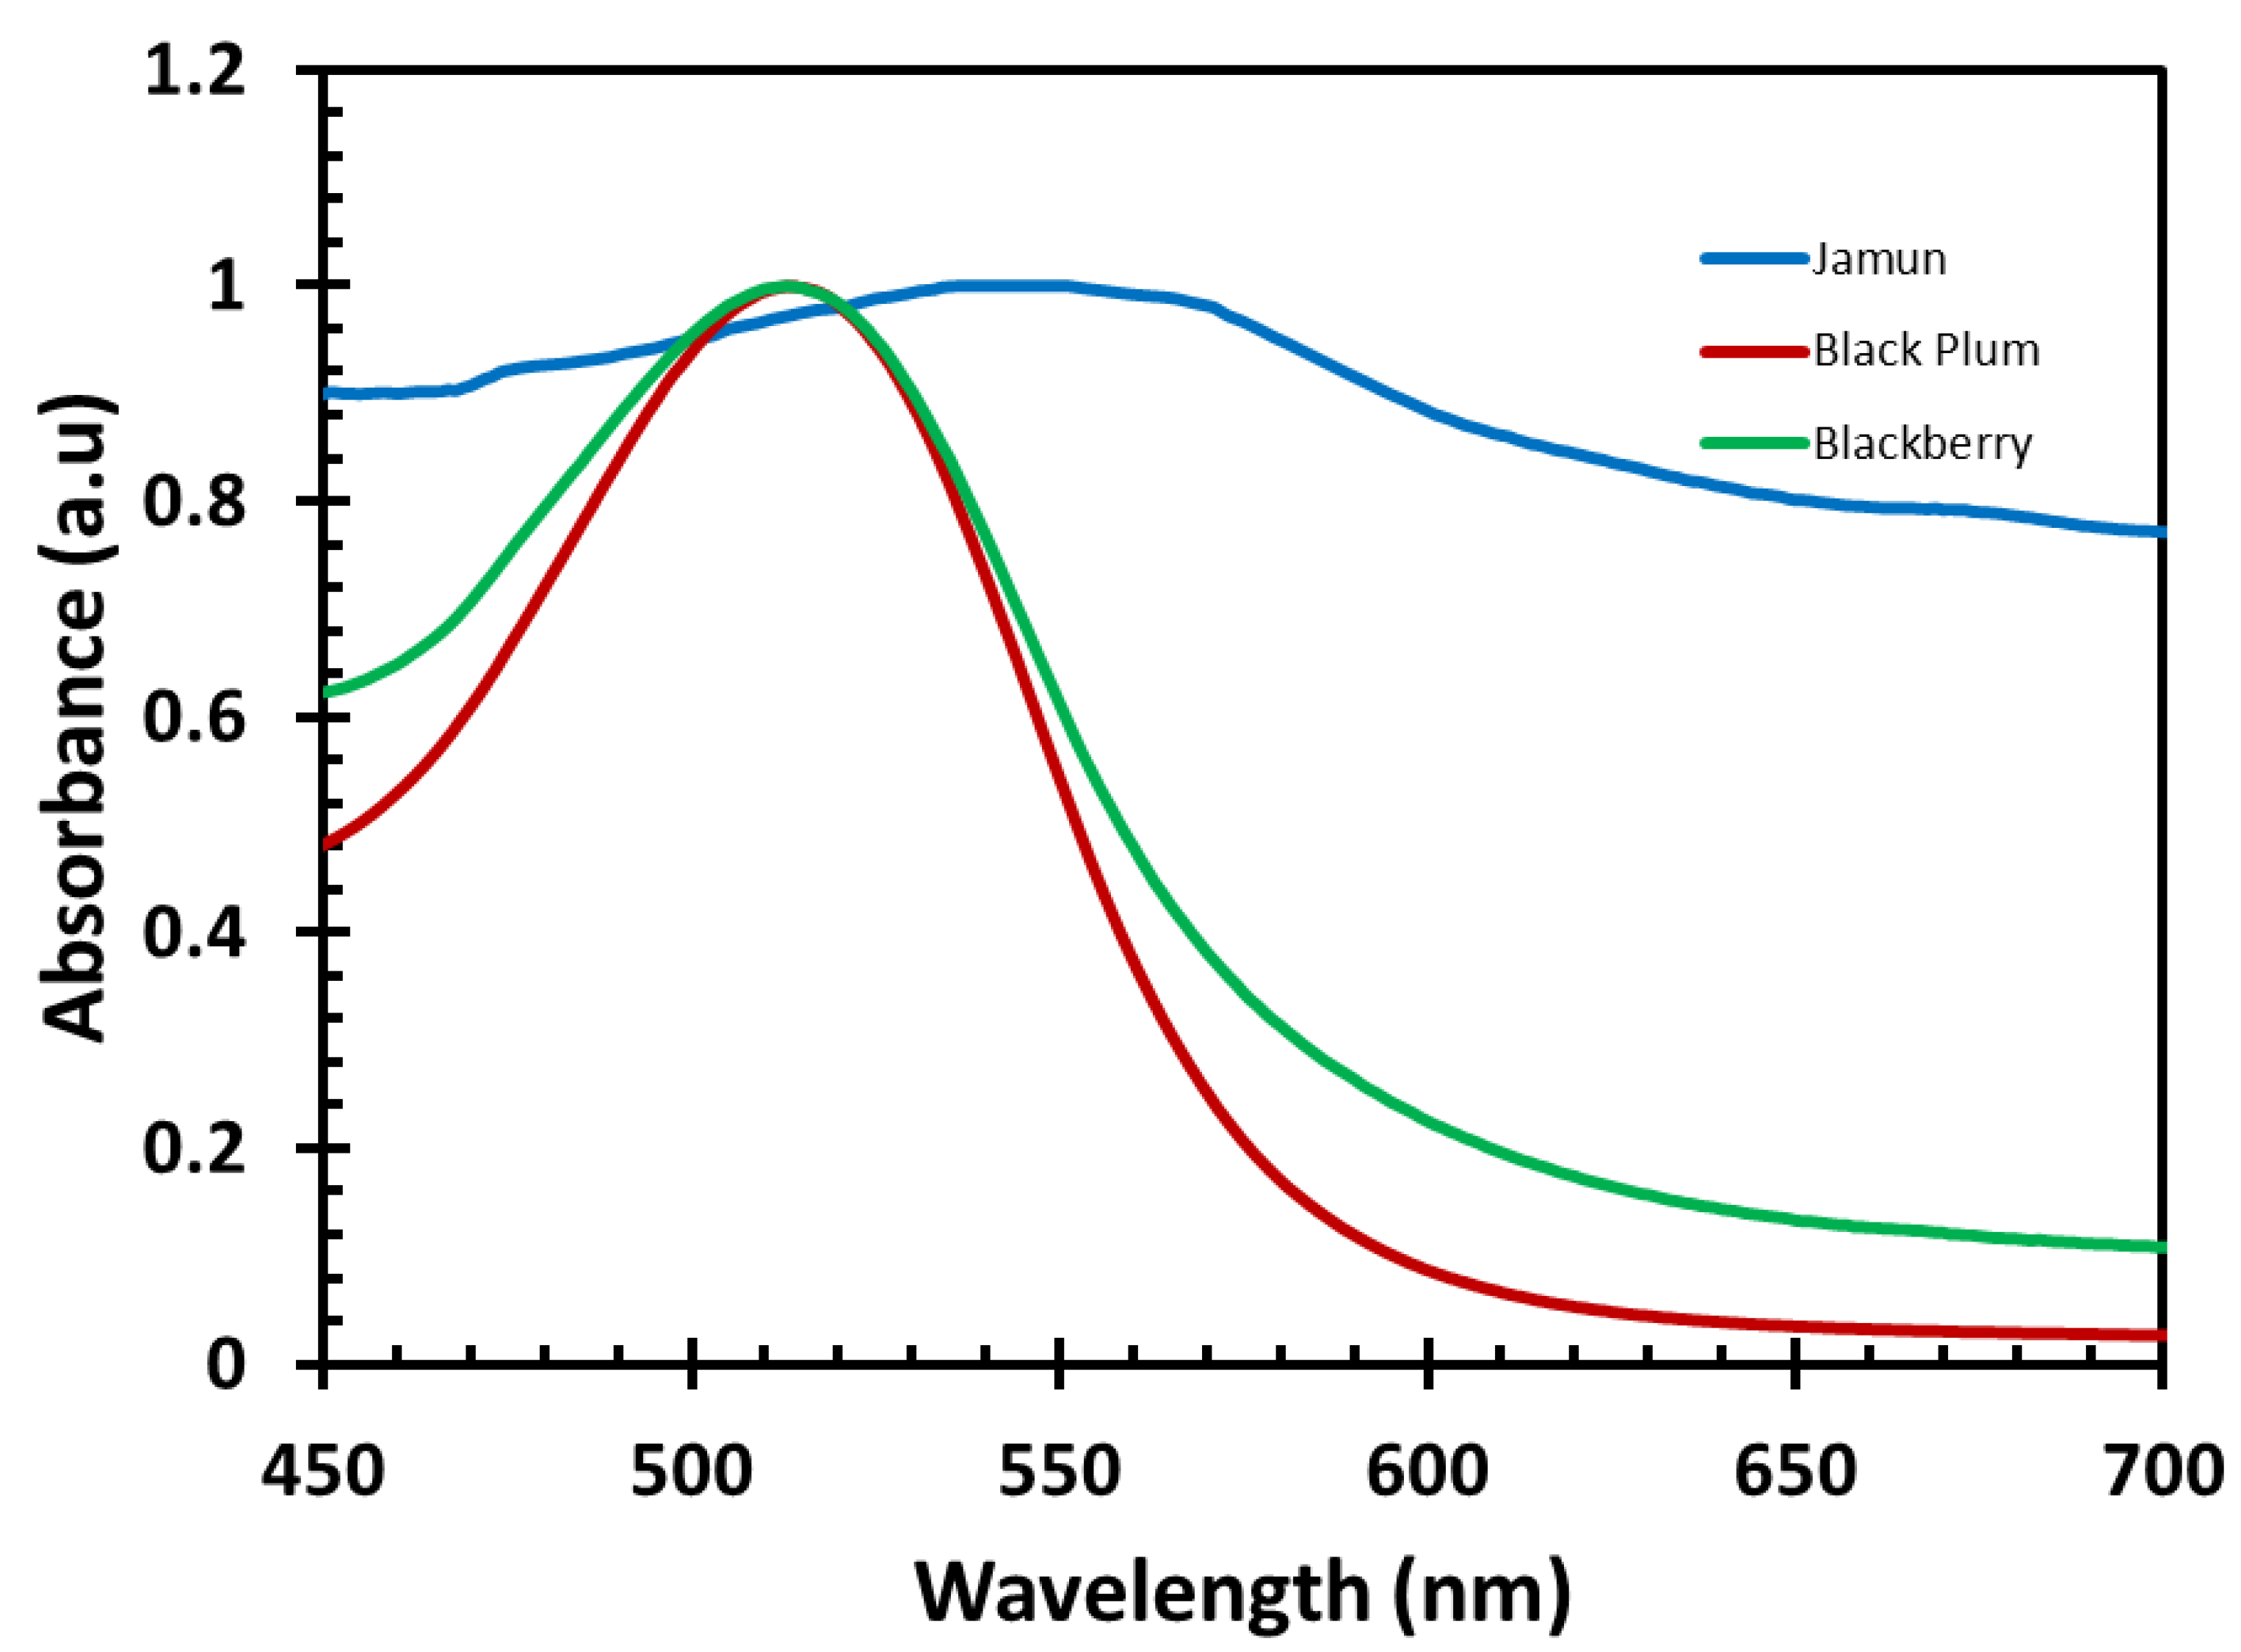
The UV-Vis absorption spectra show the tendency of the dye to absorb photons in order to make a transition from the ground state to an excited state for the ejection of electrons into the TiO2 semiconductor. UV-visible spectroscopy was employed to ascertain the photophysical properties of the natural dyes derived from three distinct black fruits. The UV-Vis spectra are displayed in Figure 3. The spectrum shows a wavelength with maximum absorption for the dye extracted from jamun at 550 nm, whilst the absorptions of black plum and blackberry were shifted to a hypsochromic region and appear at 514 nm and 513 nm, respectively. The maximum absorption that occurs in the near-visible region (400–525 nm) is indicative of the presence of anthocyanin in the natural dyes [61,62]. On the other hand, the band of absorption corresponding to jamun was slightly red-shifted.
In addition, the band of transition corresponding to the dye extracted from the jamun was broader than that of the other two fruits, which suggests that this dye has the capacity to absorb more energy, thus improving the performance of the cell.

3.2. Emission Studies

The emission studies were employed on all three natural dyes, and the results are shown in Figure 4. The wavelength of emission of blackberry was 571 nm, and that of black plum was 582 nm. The emission wavelength of jamun was red-shifted to 680 nm. The spectra of dye extracted from jamun was broader and consisted of two peaks at 605 nm and 680 nm. The spectra of all three dyes, as displayed in Figure 4, reveal a unique pattern of emission of jamun fruit dye compared to two other fruit dyes that exhibited similar characteristics.

3.3. Fourier Transformed Infrared (FTIR) Analysis

The black natural dye-sensitized TiO2 electrodes were characterized with FTIR to study the interaction between the dye and TiO2. The spectra showed signals in the range of 600–4000 cm−1, which are displayed in Figure 5.
Stretching common to all the dye-sensitized TiO2 electrodes include several weak stretches at 1070, 1370, 1400 cm−1. A strong vibration was observed at 1640 and 3420 cm−1, and a weak shoulder appeared at 2920 cm−1. The stretching at 3420 and 1640 cm−1 was due to the symmetrical and bending (asymmetric) vibration of the -OH group, respectively. The shoulder at 2920 cm−1 belongs to the saturated hydrocarbon groups, specifically the methyl group. The stretch at 1370 cm−1 may be indicative of the O-H in the plane deformation in anthocyanins [63]. The band at 1400 cm−1 may be attributed to the stretching of the Ti-0-Ti unit. The stretching corresponding to the =C-O-C group in anthocyanins accounts for a weak peak at 1070 cm−1. Among the three dyes and their anchoring with TiO2, jamun sensitizer shows more signatures as an indication of more interaction with this panchromatic surface, hence more effective charge transfer between these two photodynamic substances.

3.4. Raman Spectroscopy Analysis

The interaction between the various natural dyes and the TiO2 was further assessed with Raman studies. Raman spectroscopy was employed to investigate the characteristics of natural dye-sensitized TiO2 films within the spectral range of 200–3400 cm−1, as demonstrated in Figure 6. The presence of the D and G bands observed at 1490 and 1950 cm−1, respectively, aligns with prior research findings that associated these peaks with the significant disorder displayed by sp3 carbons [35]. The interaction between the TiO2 nanoparticles and the different dyes is indicated by the existence of the additional peaks.

3.5. Field Emission Scanning Electron Microscopy (FESEM) and Energy Dispersive X-ray Spectroscopy (EDS)

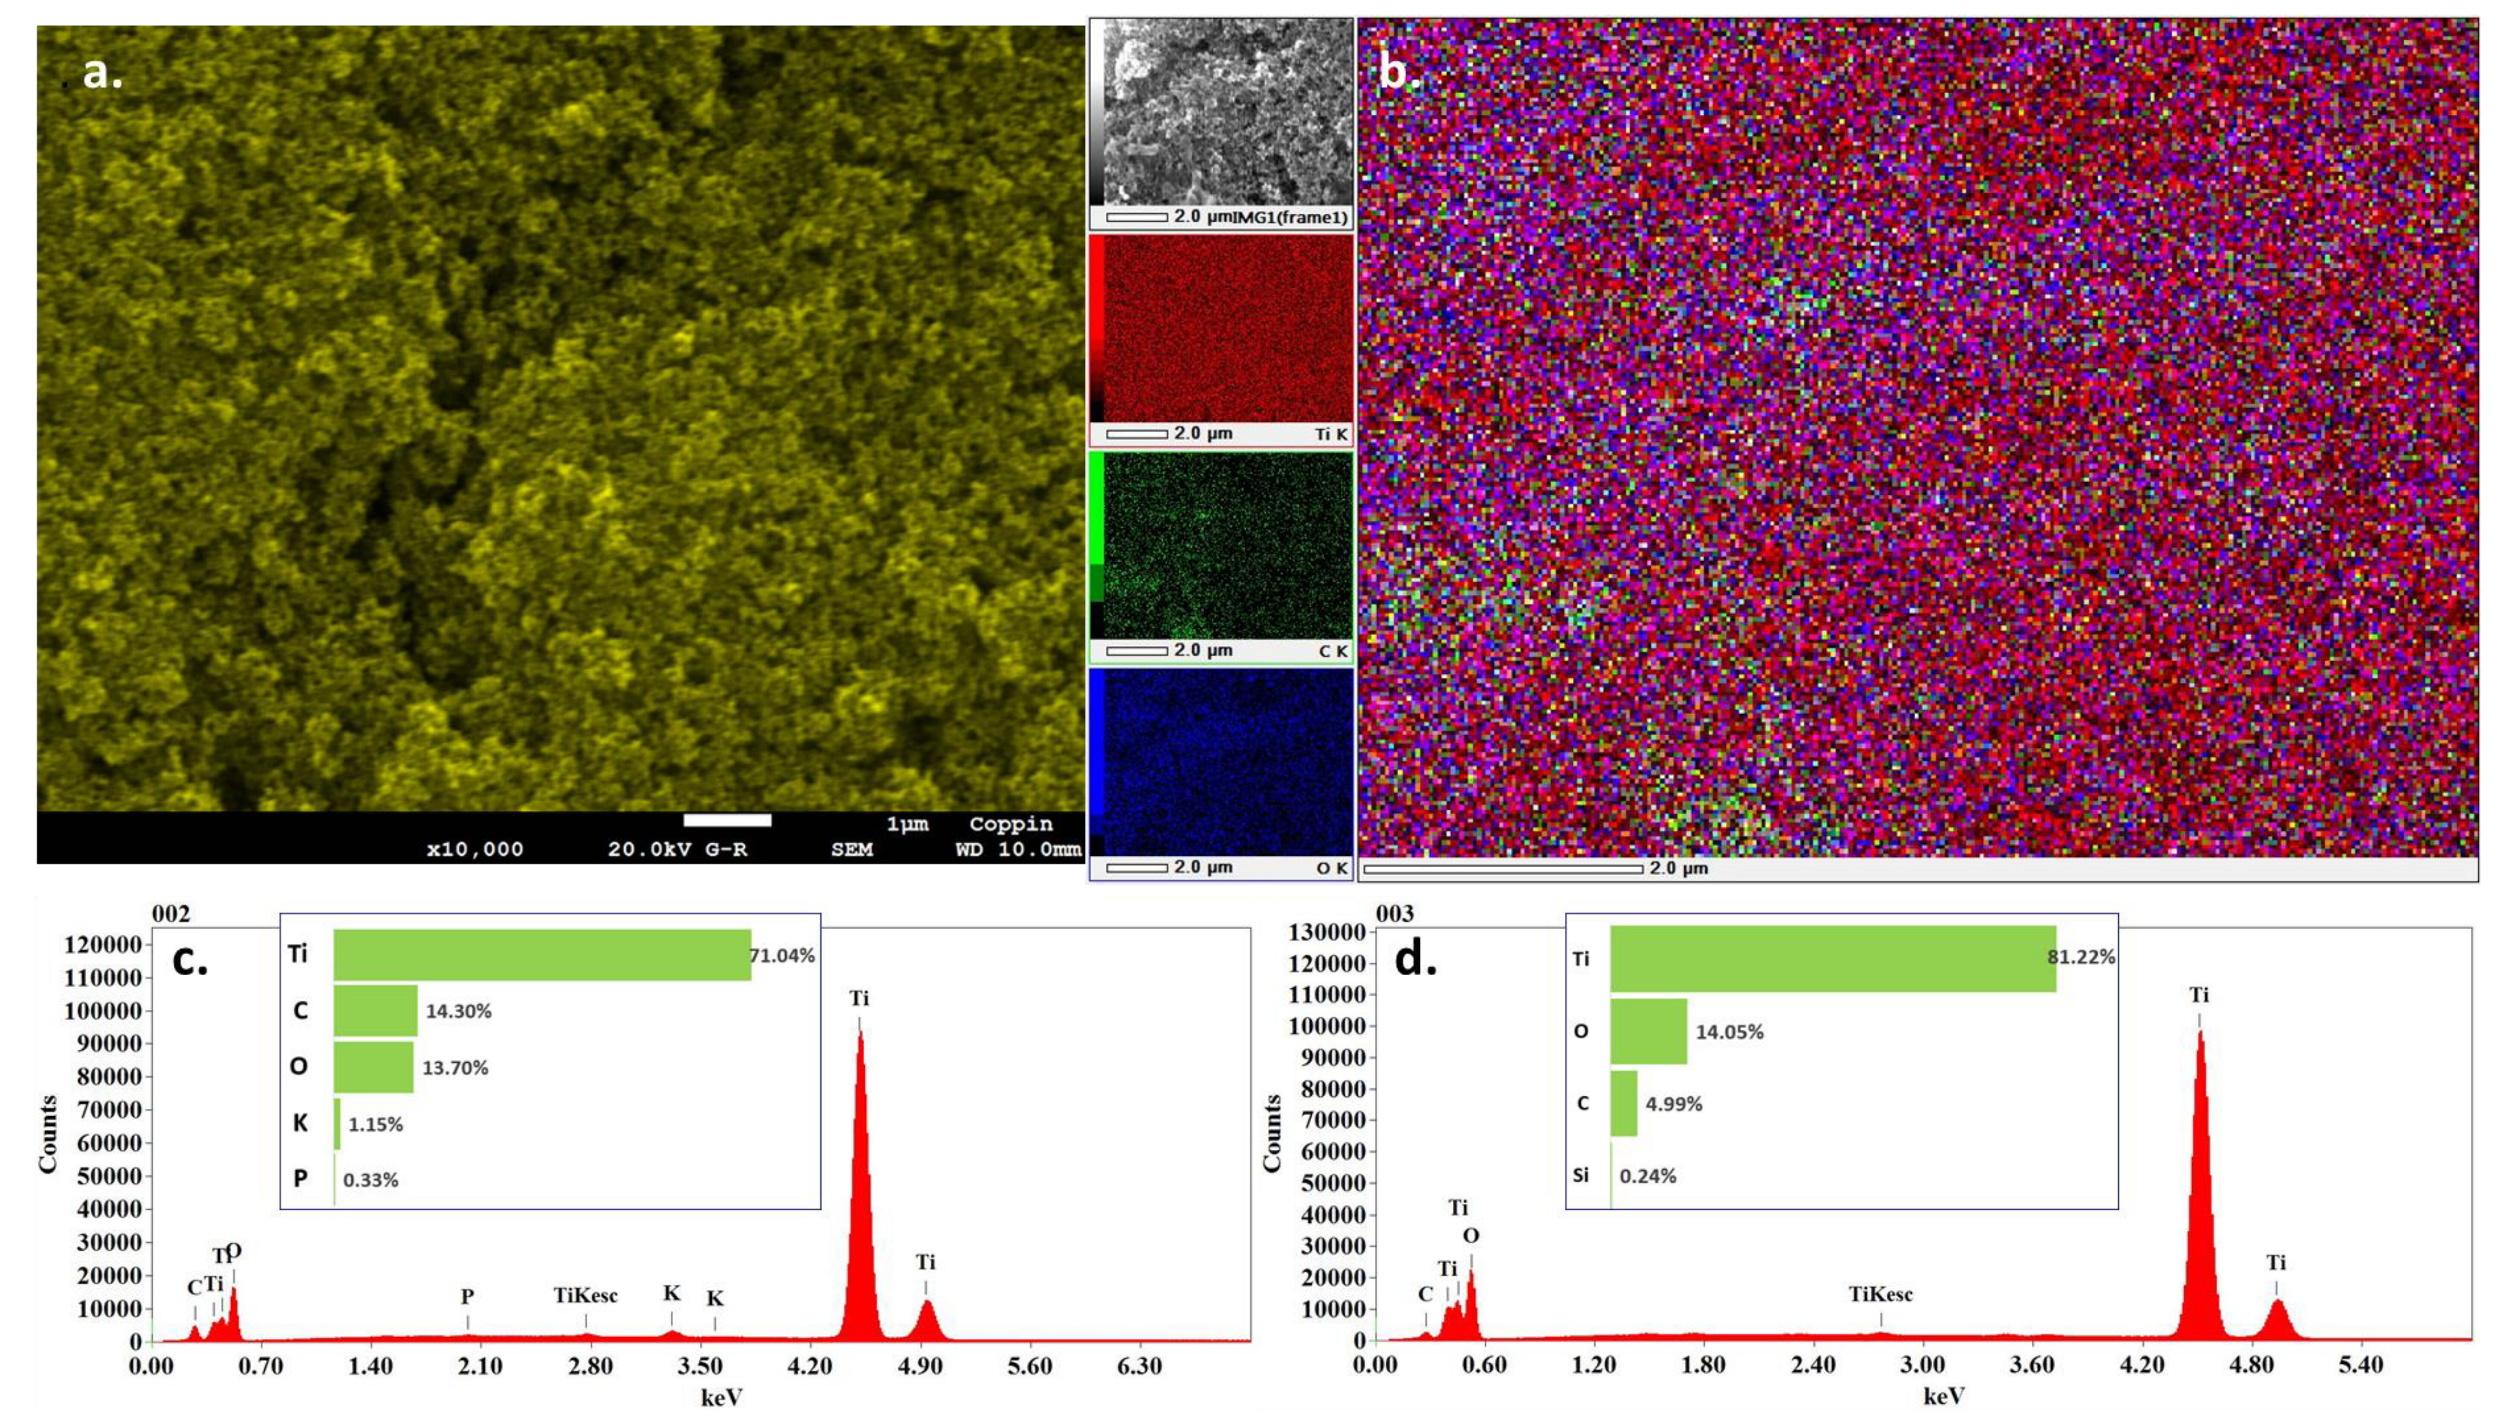
FESEM imaging was carried out on the jamun dye-sensitized TiO2 to study the porosity and morphological features of the titanium dioxides and how they allow for adsorption and retention of the dye sensitizer. The FESEM image of the jamun dye-sensitized TiO2 together with its mapping analysis as well as the EDS of both the sensitized TiO2 film and that of bare TiO2 is displayed in Figure 7. The image of the Jamun slide (a) displays a sponge-like structure of the TiO2 film comprising spherical nanoparticles consistent with reports [64]. The nanoparticles are bound to each other in an unordered fashion but without fractures or gaps, ensuring a good interparticle connectivity, which allows for the transport of charge. The mapping analysis (b) illustrates the presence of titanium, carbon, oxygen, and phosphorus. The TiO2 is the main component and is revealed in the color of the image.
EDS of jamun dye-sensitized TiO2 (c) and that of the bare TiO2 (d) provide information about the attachment of the dye to TiO2. In the case of jamun dye-sensitized TiO2 film, the percentage of carbon present was 14.3%, whereas for that of the bare TiO2, the percentage of carbon was 4.99%. The difference in the percentages is due to the presence of the dye on the titanium, which increases the amount of carbon present. The jamun dye has several carbon-rich organic molecules that are responsible for the difference in carbon content between the dye-sensitized film and the bare TiO2.
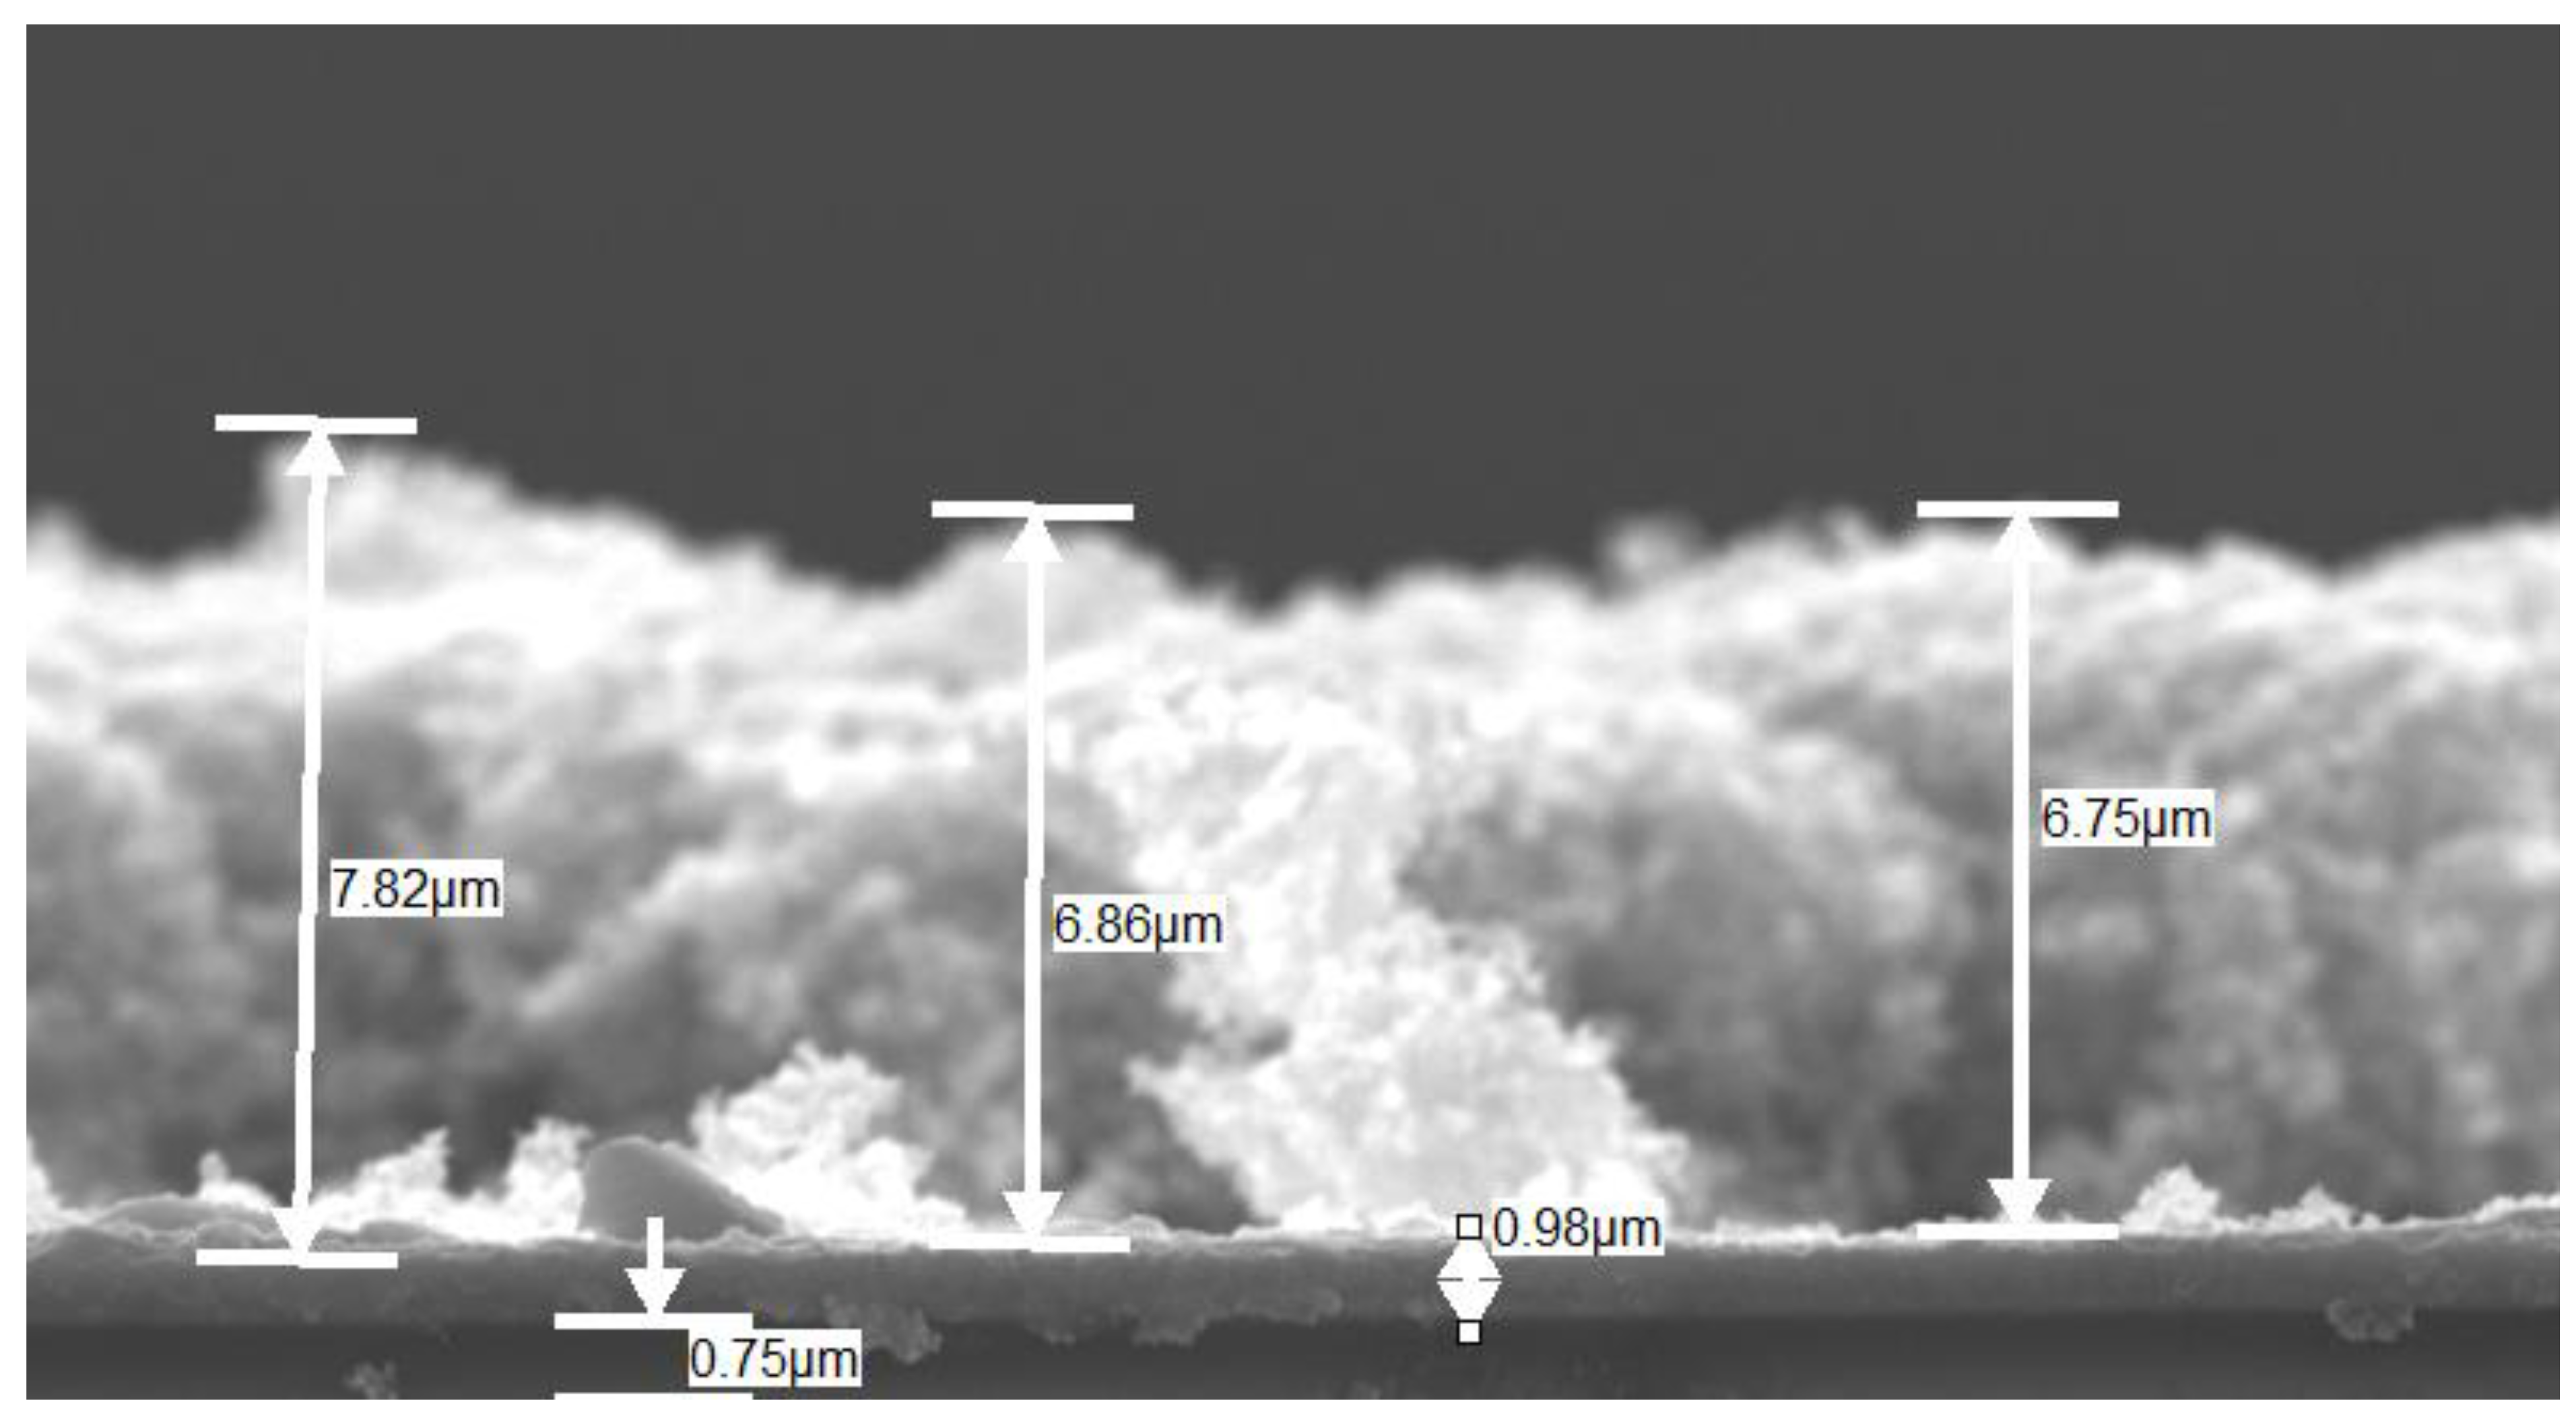
The TiO2-coated FTO glass was further characterized via FESEM cross-sectional imaging. The performance of DSSC is influenced by the thickness of the TiO2 film [65]. The cross-sectional image, as displayed in Figure 8, reveals the thickness of the TiO2 film on the FTO glass. The average thickness of the TiO2 layer was estimated at 7.14 µm. This thickness allows for the smooth transport of charge.

3.6. Current and Voltage Characteristics

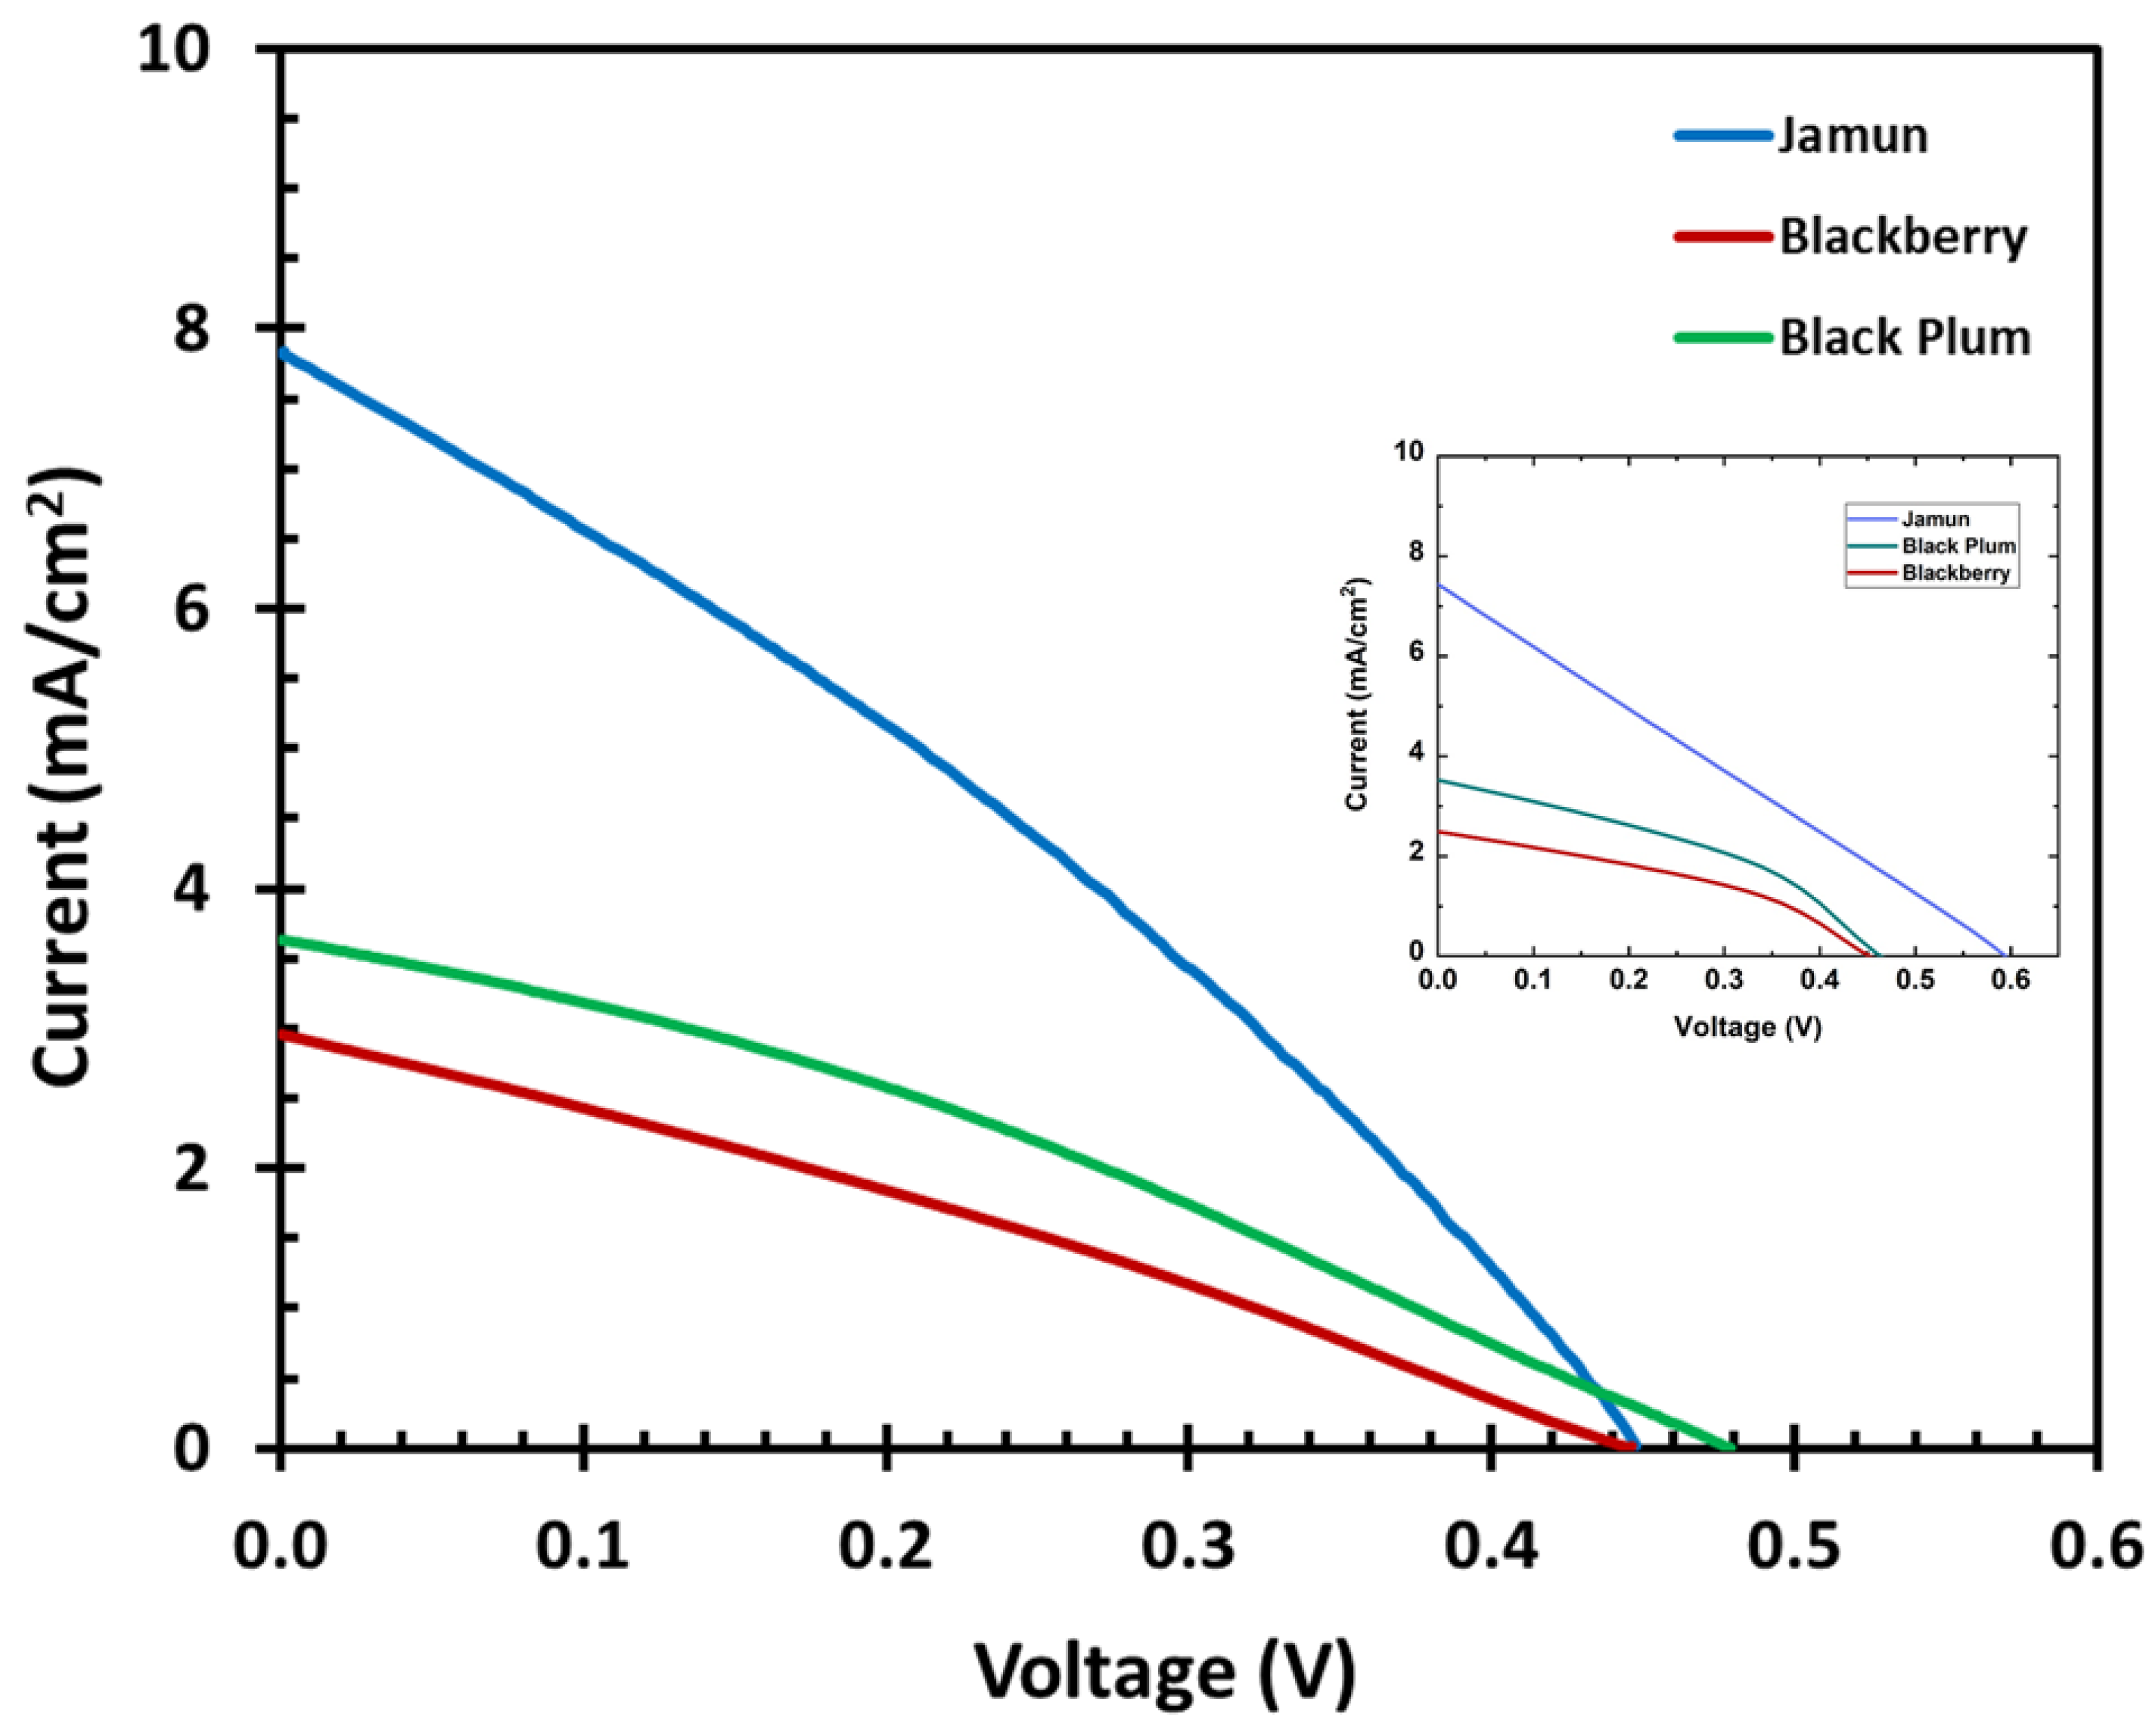
The performance of the dye-sensitized PV was assessed through the measurements of the Voc, Isc, FF, maximum voltage (Vmax), and maximum current (Imax) of the cell, conducted under 1 sun illumination (100 mW/cm2). The IV characteristics measurements of the deposited solar cell are displayed in Table 3 and Figure 9. The inset in Figure 9 is current versus voltage curve of the three DSSCs from the simulation study. The PCE of the DSSC was computed using the formula displayed in Equation (4), where ŋ is PCE and Pin is the input power.
η = I S C · V O C · F F P i n
The DSSC fabricated with jamun provided the highest solar-to-electric PCE of 1.09%, with a Voc of 0.45 V, Isc of 7.84 mA/cm2, and an FF of 0.31. In the other hand, low efficiencies were obtained for black plum and blackberry dyes with values calculated as 0.55% and 0.38%, respectively. These results are consistent with the UV-Vis, FTIR, and Raman analyses. Also, these experimental data are consistent with values obtained through the simulation, as demonstrated in the inset in Figure 9. The high congruence between the experimental and simulation numbers provides confidence in the validity of these results.

3.7. Electrochemical Impedance Spectroscopic (EIS) Study

EIS measurements were conducted in order to assess the charge transfer efficiency and resistance characteristics of the produced DSSCs [66,67,68,69]. EIS data are presented in Nyquist and Bode plots, as showed in Figure 10 and Figure 11, respectively.
The Nyquist plot often exhibits two or three semicircles. A smaller semicircle observed at a higher frequency can be attributed to the presence of a charge transfer resistance at the interface between the cathode and electrolyte. Conversely, a bigger semicircle indicates the existence of a charge transfer resistance at the TiO2/dye/electrolyte interface. The jamun had lower resistance in comparison to the black plum. The lower charge transfer resistance thus contributed to the relatively higher efficiency.
The Bode plot relates peak frequencies to the lifetime (τ) of the charge. The lifetime is in reverse proportion to the peak frequency, as presented in Equation (5).
τ = 1 2 π f
The Bode plot of the jamun has a lower frequency, thus indicating a reasonably longer electron lifetime, which eventually indicates higher DSSC efficiency. A long electron lifetime is favorable for a DSSC device, as it could advance the Isc from which the efficiency of the cell is calculated.

3.8. Correlations between Simulation and Experimental Data

The experimental data obtained were consistent with those of data generated through computation analysis. In our simulation study, we induced different types of defects in the dye-sensitized TiO2 films, which are illustrated in Table 2. One of the major reasons for dye-sensitized TiO2 films’ low efficiency is the formation of various types of point defects during their fabrication [70]. Both shallow and deep level defects can be presented during the synthesis of TiO2. Oxygen vacancy (Vo) at the surface level of TiO2 is one of the deep-level defects, which has an energy level above 2.2 eV from the valance band maximum (VBM) of TiO2 [71]. The coupling between the 3D orbitals of the two under-coordinated Ti atoms creates a σ bond that generates these deep-level defects. [72]. To match the simulation values with experimental results, were used deep-level defects in the proposed simulation study for the DSSC fabricated with jamun dye. For these purposes, the defect density parameter with 2.5 × 1017 cm−3 at the energy level for 2.2 eV above the VBM of TiO2 was used, and this simulation provided approximately the same efficiency as found with the experimental data. On the other hand, it was reported that subsurface level oxygen vacancy (Vo), hydroxyl group, and Ti interstitial (Tii) also create shallow-level defects in TiO2 [73]. These shallow defects can be hypothesized to occur at 0.1–0.2 eV below the conduction band minimum (CBM) of TiO2 [73]. In our computational analysis of the other two DSSCs, we induced shallow-level defects in them. For DSSCs of black plum and blackberry, shallow-level defects with concentrations of 1.0 × 1020 cm−3 and 1.0 × 1022 cm−3 generated nearly the same photovoltaic outputs as the experiment, respectively. The results of both the experimental and computational analyses for the solar cell outputs are shown in Table 4.
Because the simulation results complemented the experimental values by using the only possible defect configurations, the model can predict that all the devices that are subjected to high-level defects during their fabrication, which might result in poor efficiency responses, as illustrated in Table 2. These results can also be used to predict that the DSSC with jamun dye has deep-level defects, but the density is lower than the DSSCs with other dyes, making its PCE higher than the others. However, we also predict that the DSSCs with black plum and blackberry had shallow-level defects, but their densities were very high, especially in the DSSC with blackberry dye, which has 100-fold more defects than the DSSC with black plum. Thus, it has the lowest solar cell efficiency among the three DSSCs.
The incident light is absorbed by the solar cell, resulting in the formation of electron–hole pairs and generates electrical energy from photon energy. For optimal overlapping with the solar spectrum, ideal dyes should have high absorbance intensity over a broad region that ensures the better harvesting of solar energy [74]. Dyes with high absorbance pick up more photons with which to excite electrons in the conduction band.
In Figure 12, we compare our three natural dyes’ absorbances with the N719 dye [75]. From the 450 to 575 nm region, the N719 dye possesses high absorption of incident light compared to the jamun, black plum, and blackberry dyes. N719 dye-sensitized TiO2 resulted in a photovoltaic PCE of 6.45% due to its high absorbance [75] while the poor absorbance intensity of our three natural dyes is also a reason for the low PCE in our experiment.

4. Conclusions

Natural dyes extracted from jamun, blackberry, and black plum were characterized and utilized in the fabrication of DSSCs. The DSSC fabricated with jamun provided the highest solar-to-electric PCE of 1.09%, a Voc of 0.45 V, an Isc of 7.84 mA/cm2, and an FF of 0.31. The PCEs of black plum and blackberry were 0.55% and 0.38%, respectively. The EIS measurements, in terms of Nyquist and Bode plots, were consistent with the current and voltage measurements. Furthermore, the results are also consistent with the UV-Vis measurements. Natural dyes from three black fruits could be potentially used as sensitizers in the design of a solar cell. The simulation results almost match the experimental values by using the only possible defect properties shown in Table 2. It was predicted that deep-level defects would be present in DSSC fabricated with jamun and shallow-level defects would be present in DSSCs fabricated with black plum and blackberry. Defect density was highest in the DSSC with blackberry and lowest in the DSSC with jamun. A high level of defect density and low absorbance of the black plum and blackberry dyes were also responsible for the low PCE of the two devices. On the other hand, experimental data showed high absorbance of jamun, and simulation predicted low defect density in the dye, which in combination provided the device’s best performance.

Author Contributions

Conceptualization, M.R.J., S.A., M.M.R. (Mohammed M. Rahman), J.I., F.I.C., M.A.Y., M.H.S. and J.U.; Formal analysis, A.S., W.G., M.R.J., M.T.I., S.A., M.M.R. (Mohammed M. Rahman), M.A.M.P., M.K., M.A.Y. and M.M.R. (Mohammad Mahbub Rabbani); Investigation, A.S., W.G., M.T.I., M.A.M.P., M.K., J.I. and F.I.C.; Methodology, A.S., W.G., J.I. and F.I.C.; Resources, M.K., J.I., F.I.C., M.M.R. (Mohammad Mahbub Rabbani), M.H.S. and J.U.; Software, M.R.J., M.T.I., S.A., M.M.R. (Mohammed M. Rahman) and M.A.M.P.; Supervision, M.R.J., S.A., M.H.S. and J.U.; Validation, M.R.J., M.K., J.I., F.I.C., M.M.R. (Mohammad Mahbub Rabbani) and M.H.S.; Visualization, W.G., M.A.M.P. and M.K.; Writing—original draft, A.S., W.G., M.R.J., S.A., M.M.R. (Mohammed M. Rahman), M.A.M.P., J.I., F.I.C., M.A.Y., M.M.R. (Mohammad Mahbub Rabbani), M.H.S. and J.U.; Writing—review and editing, A.S., W.G., M.K., J.I., M.M.R. (Mohammad Mahbub Rabbani), M.H.S. and J.U. All authors have read and agreed to the published version of the manuscript.

Funding

This research received no external funding.

Data Availability Statement

Data sharing is not applicable to this article.

Acknowledgments

This study was supported by Constellation (E2—Energy to Educate grant program) and the United States Department of Education (USDE-SAFRA Title III Grant). The authors extend special thanks to the Office of Institutional Advancement, Coppin State University, for the administrative support. The authors would also like to extend their sincere appreciation to Researchers Supporting Project Number (RSP2023R301), King Saud University, Riyadh, Saudi Arabia. The content is exclusively the responsibility of the authors and does not necessarily represent the official views of the funding agencies.

Conflicts of Interest

The authors declare no conflict of interest.

References

  1. Mohtasham, J. Review Article-Renewable Energies. Energy Procedia 2015, 74, 1289–1297. [Google Scholar] [CrossRef]
  2. Vershinina, K.Y.; Dorokhov, V.V.; Nyashina, G.S.; Romanov, D.S. Environmental Aspects and Energy Characteristics of the Combustion of Composite Fuels Based on Peat, Oil, and Water. Solid Fuel Chem. 2019, 53, 294–302. [Google Scholar] [CrossRef]
  3. Cséfalvay, E.; Horváth, I.T. Sustainability Assessment of Renewable Energy in the United States, Canada, the European Union, China, and the Russian Federation. ACS Sustain. Chem. Eng. 2018, 6, 8868–8874. [Google Scholar] [CrossRef]
  4. Richhariya, G.; Kumar, A.; Tekasakul, P.; Gupta, B. Natural dyes for dye sensitized solar cell: A review. Renew. Sustain. Energy Rev. 2017, 69, 705–718. [Google Scholar] [CrossRef]
  5. Nazeeruddin, M.K.; Baranoff, E.; Grätzel, M. Dye-sensitized solar cells: A brief overview. Sol. Energy 2011, 85, 1172–1178. [Google Scholar] [CrossRef]
  6. Ren, Y.; Sun, D.; Cao, Y.; Tsao, H.N.; Yuan, Y.; Zakeeruddin, S.M.; Wang, P.; Grätzel, M. A Stable Blue Photosensitizer for Color Palette of Dye-Sensitized Solar Cells Reaching 12.6% Efficiency. J. Am. Chem. Soc. 2018, 140, 2405–2408. [Google Scholar] [CrossRef]
  7. Bhand, S.; Salunke-Gawali, S. Amphiphilic photosensitizers in Dye Sensitized Solar Cells. Inorganica Chim. Acta 2019, 495, 118955. [Google Scholar] [CrossRef]
  8. Ludin, N.A.; Mahmoud, A.A.-A.; Mohamad, A.B.; Kadhum, A.A.H.; Sopian, K.; Karim, N.S.A. Review on the development of natural dye photosensitizer for dye-sensitized solar cells. Renew. Sustain. Energy Rev. 2014, 31, 386–396. [Google Scholar] [CrossRef]
  9. Wang, T.-H.; Huang, T.-W.; Tsai, Y.-C.; Chang, Y.-W.; Liao, C.-S. A photoluminescent layer for improving the performance of dye-sensitized solar cells. Chem. Commun. 2015, 51, 7253–7256. [Google Scholar] [CrossRef] [PubMed]
  10. Stathatos, E. Dye sensitized solar cells: A new prospective to the solar to electrical energy conversion Issues to be solved for efficient energy harvesting. J. Eng. Sci. Technol. Rev. 2012, 4, 9–13. [Google Scholar] [CrossRef]
  11. Anantharaj, G.; Lakshminarasimhan, N. Interfacial Modification of Photoanode|Electrolyte Interface Using Oleic Acid Enhancing the Efficiency of Dye-Sensitized Solar Cells. ACS Omega 2018, 3, 18285–18294. [Google Scholar] [CrossRef] [PubMed]
  12. Kesavan, R.; Attia, F.M.; Su, R.; Anees, P.; El-Shafei, A.; Adhikari, A.V. Asymmetric Dual Anchoring Sensitizers/Cosensitizers for Dye Sensitized Solar Cell Application: An Insight into Various Fundamental Processes inside the Cell. J. Phys. Chem. C 2019, 123, 24383–24395. [Google Scholar] [CrossRef]
  13. Khamrang, T.; Seetharaman, A.; Kumar, M.D.; Velusamy, M.; Jaccob, M.; Ramesh, M.; Kathiresan, M.; Kathiravan, A. New D–D′–A Configured Dye for Efficient Dye-Sensitized Solar Cells. J. Phys. Chem. C 2018, 122, 22241–22251. [Google Scholar] [CrossRef]
  14. Sharmoukh, W.; Cong, J.; Gao, J.; Liu, P.; Daniel, Q.; Kloo, L. Molecular Engineering of D–D−π–A-Based Organic Sensitizers for Enhanced Dye-Sensitized Solar Cell Performance. ACS Omega 2018, 3, 3819–3829. [Google Scholar] [CrossRef] [PubMed]
  15. Kundu, A.; Shit, A.; Nandi, S. Carbon Dot Assisted Synthesis of Nanostructured Polyaniline for Dye Sensitized Solar Cells. Energy Fuels 2017, 31, 7364–7371. [Google Scholar] [CrossRef]
  16. O’Regan, B.; Grätzel, M. A low-cost, high-efficiency solar cell based on dye-sensitized colloidal TiO2 films. Nature 1991, 353, 737–740. [Google Scholar] [CrossRef]
  17. Zhang, X.; Zhang, J.-J.; Xia, Y.-Y. A comparative theoretical investigation of ruthenium dyes in dye-sensitized solar cells. J. Photochem. Photobiol. A Chem. 2007, 185, 283–288. [Google Scholar] [CrossRef]
  18. Ali, M.M.; Pervez, W.; Ghann, W.; Uddin, J. Photophysical Studies of Ruthenium-Based Complexes and the Performance of Nanostructured TiO2 Based Dye Sensitized Solar Cells. J. Nanomed. Nanotechnol. 2019, 10, 1–5. [Google Scholar] [CrossRef]
  19. Oh, J.; Ghann, W.; Kang, H.; Nesbitt, F.; Providence, S.; Uddin, J. Comparison of the performance of dye sensitized solar cells fabricated with ruthenium-based dye sensitizers: Di-tetrabutylammonium cis-bis(isothiocyanato)bis(2,2′-bipyridyl-4,4′- di-carboxylato) ruthenium(II) (N719) and tris(bipyridine)ruthenium(II) chloride (Ru-BPY). Inorganica Chim. Acta 2018, 482, 935–943. [Google Scholar]
  20. Aghazada, S.; Nazeeruddin, M.K. Ruthenium Complexes as Sensitizers in Dye-Sensitized Solar Cells. Inorganics 2018, 6, 52. [Google Scholar] [CrossRef]
  21. Mathew, S.; Yella, A.; Gao, P.; Humphry-Baker, R.; Curchod, B.F.E.; Ashari-Astani, N.; Tavernelli, I.; Rothlisberger, U.; Nazeeruddin, K.; Grätzel, M. Dye-sensitized solar cells with 13% efficiency achieved through the molecular engineering of porphyrin sensitizers. Nat. Chem. 2014, 6, 242–247. [Google Scholar] [CrossRef] [PubMed]
  22. Zeng, K.; Lu, Y.; Tang, W.; Zhao, S.; Liu, Q.; Zhu, W.; Tian, H.; Xie, Y. Efficient solar cells sensitized by a promising new type of porphyrin: Dye-aggregation suppressed by double strapping. Chem. Sci. 2018, 10, 2186–2192. [Google Scholar] [CrossRef]
  23. Birel, Ö.; Nadeem, S.; Duman, H. Porphyrin-Based Dye-Sensitized Solar Cells (DSSCs): A Review. J. Fluoresc. 2017, 27, 1075–1085. [Google Scholar] [CrossRef]
  24. Ghann, W.; Kang, H.; Emerson, E.; Oh, J.; Chavez-Gil, T.; Nesbitt, F.; Williams, R.; Uddin, J. Photophysical properties of near-IR cyanine dyes and their application as photosensitizers in dye sensitized solar cells. Inorganica Chim. Acta 2017, 467, 123–131. [Google Scholar] [CrossRef]
  25. Pepe, G.; Cole, J.M.; Waddell, P.G.; McKechnie, S. Molecular engineering of cyanine dyes to design a panchromatic response in co-sensitized dye-sensitized solar cells. Mol. Syst. Des. Eng. 2016, 1, 86–98. [Google Scholar] [CrossRef]
  26. Phinjaturus, K.; Maiaugree, W.; Suriharn, B.; Pimanpaeng, S.; Amornkitbamrung, V.; Swatsitang, E. Dye-sensitized solar cells based on purple corn sensitizers. Appl. Surf. Sci. 2016, 380, 101–107. [Google Scholar] [CrossRef]
  27. Lim, A.; Ekanayake, P.; Lim, L.B.L.; Bandara, J.S. Co-dominant effect of selected natural dye sensitizers in DSSC performance. Spectrochim. Acta Part A Mol. Biomol. Spectrosc. 2016, 167, 26–31. [Google Scholar] [CrossRef]
  28. Aung, S.H.; Hao, Y.; Oo, T.Z.; Boschloo, G. Kinetic study of carminic acid and santalin natural dyes in dye-sensitized solar cells. J. Photochem. Photobiol. A Chem. 2016, 325, 1–8. [Google Scholar] [CrossRef]
  29. Dai, Q.; Rabani, J. Photosensitization of nanocrystalline TiO2 films by pomegranate pigments with unusually high effi-ciency in aqueous medium. Chem Commun. 2001, 20, 2142–2143. [Google Scholar] [CrossRef] [PubMed]
  30. Noda, Y.; Kaneyuki, T.; Mori, A.; Packer, L. Antioxidant activities of pomegranate fruit extract and its anthocyanidins: Del-phinidin, cyanidin, and pelargonidin. J. Agric. Food Chem. 2002, 50, 166–171. [Google Scholar] [CrossRef] [PubMed]
  31. Hou, D.-X.; Fujii, M.; Terahara, N.; Yoshimoto, M. Molecular Mechanisms behind the Chemopreventive Effects of Antho-cyanidins. J. Biomed. Biotechnol. 2004, 2004, 321–325. [Google Scholar] [CrossRef] [PubMed]
  32. Iwuji, O.; Ghann, W.; Iwuji, C.; Uddin, J. Dragon Fruit Dye as a Sensitizer for Dye-Sensitized Solar Cells. Nanosci. J. 2018, 1, 5–8. [Google Scholar]
  33. Sanjay, P.; Isaivani, I.; Deepa, K.; Madhavan, J.; Senthil, S. The preparation of dye sensitized solar cells using natural dyes extracted from Phytolacca icosandra and Phyllanthus reticulatus with ZnO as photoanode. Mater. Lett. 2019, 244, 142–146. [Google Scholar] [CrossRef]
  34. Das, S.K.; Ganguli, S.; Kabir, H.; Khandaker, J.I.; Ahmed, F. Performance of Natural Dyes in Dye-Sensitized Solar Cell as Photosensitizer. Trans. Electr. Electron. Mater. 2019, 21, 105–116. [Google Scholar] [CrossRef]
  35. Ghann, W.; Kang, H.; Sheikh, T.; Yadav, S.; Chavez-Gil, T.; Nesbitt, F.; Uddin, J. Fabrication, Optimization and Characterization of Natural Dye Sensitized Solar Cell. Sci. Rep. 2017, 7, 41470. [Google Scholar] [CrossRef] [PubMed]
  36. Thompson, T.L.; Yates, J.T. TiO2-based Photocatalysis: Surface Defects, Oxygen and Charge Transfer. Top. Catal. 2005, 35, 197–210. [Google Scholar] [CrossRef]
  37. Lu, G.; Linsebigler, A.; Yates, J.T. Ti3+ Defect Sites on TiO2(110): Production and Chemical Detection of Active Sites. J. Phys. Chem. 1994, 98, 11733–11738. [Google Scholar] [CrossRef]
  38. Naldoni, A.; Allieta, M.; Santangelo, S.; Marelli, M.; Fabbri, F.; Cappelli, S.; Bianchi, C.L.; Psaro, R.; Dal Santo, V. Effect of Nature and Location of Defects on Bandgap Narrowing in Black TiO2 Nanoparticles. J. Am. Chem. Soc. 2012, 134, 7600–7603. [Google Scholar] [CrossRef]
  39. Nowotny, M.K.; Bak, T.; Nowotny, J. Electrical Properties and Defect Chemistry of TiO2 Single Crystal. I. Electrical Conductivity. J. Phys. Chem. B 2006, 110, 16270–16282. [Google Scholar] [CrossRef]
  40. Pan, X.; Yang, M.-Q.; Fu, X.; Zhang, N.; Xu, Y.-J. Defective TiO2 with oxygen vacancies: Synthesis, properties and photocatalytic applications. Nanoscale 2013, 5, 3601–3614. [Google Scholar] [CrossRef] [PubMed]
  41. Nakamura, I.; Negishi, N.; Kutsuna, S.; Ihara, T.; Sugihara, S.; Takeuchi, K. Role of oxygen vacancy in the plasma-treated TiO2 photocatalyst with visible light activity for NO removal. J. Mol. Catal. A: Chem. 2000, 161, 205–212. [Google Scholar] [CrossRef]
  42. Pacchioni, G. Oxygen Vacancy: The Invisible Agent on Oxide Surfaces. Chemphyschem 2003, 4, 1041–1047. [Google Scholar] [CrossRef]
  43. Cheng, H.; Selloni, A. Surface and subsurface oxygen vacancies in anataseTiO2 and differences with rutile. Phys. Rev. B 2009, 79, 092101. [Google Scholar] [CrossRef]
  44. Setvin, M.; Schmid, M.; Diebold, U. Aggregation and electronically induced migration of oxygen vacancies inTiO2 anatase. Phys. Rev. B 2015, 91, 195403. [Google Scholar] [CrossRef]
  45. Ako, R.T.; Ekanayake, P.; Young, D.J.; Hobley, J.; Chellappan, V.; Tan, A.L.; Gorelik, S.; Subramanian, G.S.; Lim, C.M. Evaluation of surface energy state distribution and bulk defect concentration in DSSC photoanodes based on Sn, Fe, and Cu doped TiO. Appl. Surf. Sci. 2015, 351, 950–961. [Google Scholar] [CrossRef]
  46. Kabir, D.; Forhad, T.; Ghann, W.; Richards, B.; Rahman, M.M.; Uddin, N.; Rakib, R.J.; Shariare, M.H.; Chowdhury, F.I.; Rabbani, M.M.; et al. Dye-sensitized solar cell with plasmonic gold nanoparticles modified photoanode. Nano-Structures Nano-Objects 2021, 26, 100698. [Google Scholar] [CrossRef]
  47. Saadmim, F.; Forhad, T.; Sikder, A.; Ghann, W.; Ali, M.M.; Sitther, V.; Ahammad, A.J.S.; Subhan, A.; Uddin, J. Enhancing the Performance of Dye Sensitized Solar Cells Using Silver Nanoparticles Modified Photoanode. Molecules 2020, 25, 4021. [Google Scholar] [CrossRef] [PubMed]
  48. Karim, F.; Sikder, A.; Ghann, W.; Green, K.; Ozturk, B.; Ali, M.M.; Uddin, J. Nanostructured Dye Sensitized Solar Cells with Different Counter Electrodes. Am. J. Phys. Chem. 2020, 9, 1. [Google Scholar] [CrossRef]
  49. Ghann, W.E.; Kang, W.H.; Uddin, J.; Chowdhury, F.A.; Khondaker, S.I.; Moniruzzaman, M.; Kabir, M.H.; Rahman, M.M. Syn-thesis and Characterization of Reduced Graphene Oxide and Their Application in Dye-Sensitized Solar Cells. ChemEngineering 2019, 3, 7. [Google Scholar] [CrossRef]
  50. Ghann, W.; Kang, H.; Uddin, J.; Gonawala, S.J.; Mahatabuddin, S.; Ali, M.M. Dendrimer-based Nanoparticle for Dye Sensitized Solar Cells with Improved Efficiency. J. Nanomed. Nanotechnol. 2018, 9, 1000496. [Google Scholar] [CrossRef] [PubMed]
  51. Decock, K.; Zabierowski, P.; Burgelman, M. Modeling metastabilities in chalcopyrite-based thin film solar cells. J. Appl. Phys. 2012, 111, 3686651. [Google Scholar] [CrossRef]
  52. Decock, K.; Khelifi, S.; Burgelman, M. Modelling multivalent defects in thin film solar cells. Thin Solid Film. 2011, 519, 7481–7484. [Google Scholar] [CrossRef]
  53. Burgelman, M.; Nollet, P.; Degrave, S. Modelling polycrystalline semiconductor solar cells. Thin Solid Film. 2000, 361–362, 527–532. [Google Scholar] [CrossRef]
  54. Bak, T.; Nowotny, M.K.; Sheppard, L.R.; Nowotny, J. Mobility of electronic charge carriers in titanium dioxide. J. Phys. Chem. C 2008, 112, 12981–12987. [Google Scholar] [CrossRef]
  55. Dette, C.; Pérez-Osorio, M.A.; Kley, C.S.; Punke, P.; Patrick, C.E.; Jacobson, P.; Giustino, F.; Jung, S.J.; Kern, K. TiO2 Anatase with a Bandgap in the Visible Region. Nano Lett. 2014, 14, 6533–6538. [Google Scholar] [CrossRef] [PubMed]
  56. Earnshaw, A.; Greenwood, N.N. Chemistry of the Elements; Butterworth-Heinemann: Oxford, UK, 1997. [Google Scholar]
  57. Enright, B.; Fitzmaurice, D. Spectroscopic determination of electron and hole effective masses in a nanocrystalline semiconductor film. J. Phys. Chem. 1996, 100, 1027–1035. [Google Scholar] [CrossRef]
  58. Lakhdar, N.; Hima, A. Electron transport material effect on performance of perovskite solar cells based on CH3NH3GeI. Opt. Mater. 2019, 99, 109517. [Google Scholar] [CrossRef]
  59. Fitton, B. The mobilities of holes and electrons in iodine single crystals. J. Phys. Chem. Solids 1969, 30, 211–215. [Google Scholar] [CrossRef]
  60. Jahantigh, F.; Safikhani, M.J. The effect of HTM on the performance of solid-state dye-sanitized solar cells (SDSSCs): A SCAPS-1D simulation study. Appl. Phys. A 2019, 125, 276. [Google Scholar] [CrossRef]
  61. Simhony, M. Measurements on the dielectric constant of iodine single crystals in various crystallographic directions. J. Phys. Chem. Solids 1963, 24, 1297–1300. [Google Scholar] [CrossRef]
  62. Cherepy, N.J.; Smestad, G.P.; Grätzel, M.; Zhang, J.Z. Ultrafast Electron Injection: Implications for a Photoelectrochemical Cell Utilizing an Anthocyanin Dye-Sensitized TiO2 Nanocrystalline Electrode. J. Phys. Chem. B 1997, 101, 9342–9351. [Google Scholar] [CrossRef]
  63. Aboulouard, A.; Gultekin, B.; Can, M.; Erol, M.; Jouaiti, A.; Elhadadi, B.; Zafer, C.; Demic, S. Dye sensitized solar cells based on titanium dioxide nanoparticles synthesized by flame spray pyrolysis and hydrothermal sol-gel methods: A comparative study on photovoltaic performances. J. Mater. Res. Technol. 2019, 9, 1569–1577. [Google Scholar] [CrossRef]
  64. Kao, M.; Chen, H.; Young, S.; Kung, C.; Lin, C. The effects of the thickness of TiO2 films on the performance of dye-sensitized solar cells. Thin Solid Film. 2009, 517, 5096–5099. [Google Scholar] [CrossRef]
  65. Favaro, L.; Balcão, V.; Rocha, L.; Silva, E.; Oliveira, J., Jr.; Vila, M.; Tubino, M.; Favaro, L.I.L.; Balcão, V.M.; Rocha, L.K.H.; et al. Physicochemical Characterization of a Crude Anthocyanin Extract from the Fruits of Jussara (Euterpe edulis Martius): Potential for Food and Pharmaceutical Applications. J. Braz. Chem. Soc. 2018, 29, 2072–2088. [Google Scholar] [CrossRef]
  66. Wu, J.; Lan, Z.; Lin, J.; Huang, M.; Huang, Y.; Fang, L.; Luo, G. Electrolytes in Dye-Sensitized Solar Cells. Chem. Rev. 2015, 115, 2136–2173. [Google Scholar] [CrossRef]
  67. Sarker, S.; Ahammad, A.J.S.; Seo, H.W.; Kim, D.M. Electrochemical Impedance Spectra of Dye-Sensitized Solar Cells: Fundamentals and Spreadsheet Calculation. Int. J. Photoenergy 2014, 2014, 851705. [Google Scholar] [CrossRef]
  68. Wang, Q.; Moser, J.-E.; Grätzel, M. Electrochemical Impedance Spectroscopic Analysis of Dye-Sensitized Solar Cells. J. Phys. Chem. B 2005, 109, 14945–14953. [Google Scholar] [CrossRef]
  69. von Hauff, E. Impedance Spectroscopy for Emerging Photovoltaics. J. Phys. Chem. C 2019, 123, 11329–11346. [Google Scholar] [CrossRef]
  70. Das, T.K.; Ilaiyaraja, P.; Sudakar, C. Template assisted nanoporous TiO2 nanoparticles: The effect of oxygen vacancy defects on photovoltaic performance of DSSC and QDSSC. Sol. Energy 2018, 159, 920–929. [Google Scholar] [CrossRef]
  71. Wang, X.; Feng, Z.; Shi, J.; Jia, G.; Shen, S.; Zhou, J.; Li, C. Trap states and carrier dynamics of TiO2 studied by photoluminescence spectroscopy under weak excitation condition. Phys. Chem. Chem. Phys. 2010, 12, 7083–7090. [Google Scholar] [CrossRef]
  72. Hao, Y.-N.; Chen, T.; Zhang, X.; Zhou, H.; Ma, Y. Ti-Ti σ bond at oxygen vacancy inducing the deep defect level in anatase TiO2 (101) surface. J. Chem. Phys. 2019, 150, 224702. [Google Scholar] [CrossRef] [PubMed]
  73. Porto, S.P.S.; Fleury, P.A.; Damen, T.C. Raman Spectra of TiO2, MgF2, ZnF2, FeF2, and MnF. Phys. Rev. B 1967, 154, 522–526. [Google Scholar] [CrossRef]
  74. Clifford, J.N.; Martínez-Ferrero, E.; Viterisi, A.; Palomares, E. Sensitizer molecular structure-device efficiency relationship in dye sensitized solar cells. Chem. Soc. Rev. 2010, 40, 1635–1646. [Google Scholar] [CrossRef] [PubMed]
  75. Prima, E.C.; Nugroho, H.S.; Nugraha; Refantero, G.; Panatarani, C.; Yuliarto, B. Performance of the dye-sensitized quasi-solid state solar cell with combined anthocyanin-ruthenium photosensitizer. RSC Adv. 2020, 10, 36873–36886. [Google Scholar] [CrossRef] [PubMed]
Figure 1. Jamun, black plum, and blackberry fruits from which dye was extracted for the study.
Energies 16 07187 g001
Figure 2. A schematic representation of the DSSC.
Energies 16 07187 g002
Figure 3. Absorption spectra of jamun, black plum, and blackberry fruit extract.
Energies 16 07187 g003
Figure 4. Fluorescence of different natural dyes extracted from jamun, black plum, and blackberry. ((a) 2D spectra; (b) 3D spectra of blackberry, black plum, and jamun fruit dyes).
Energies 16 07187 g004
Figure 5. FTIR spectra of the three different natural dye-sensitized TiO2 electrodes.
Energies 16 07187 g005
Figure 6. Raman spectrum of three natural dye-sensitized TiO2 electrodes.
Energies 16 07187 g006
Figure 7. FESEM image of jamun-sensitized TiO2 (a) with its elemental mapping analysis (b) and the energy dispersive X-ray analysis of jamun-sensitized TiO2 (c) and bare TiO2 (d).
Energies 16 07187 g007
Figure 8. Cross-sectional image of TiO2 on FTO glass displaying the thickness of the titanium oxide layer on the FTO glass.
Energies 16 07187 g008
Figure 9. Current and voltage measurement of DSSCs fabricated with natural dye extracted from jamun, black plum, and blackberry under 1 sun illumination at 100 mW/cm2. Inset: current vs. voltage graph of the three DSSCs from the simulation study.
Energies 16 07187 g009
Figure 10. Nyquist plot of DSSCs fabricated with dyes extracted from jamun, black plum, and blackberry fruits.
Energies 16 07187 g010
Figure 11. Bode plot of DSSCs fabricated with dyes extracted from jamun, black plum, and blackberry fruits.
Energies 16 07187 g011
Figure 12. Comparison of absorption intensity of the three dyes with the N719 dye.
Energies 16 07187 g012
Table 1. Parameters of different layers of the DSSCs used in SCAPS-1D.
Parameters/LayersFTOTiO2 and DyeI/I3 (Electrolyte)Reference
Relative permittivity, εr91030[58,60,61]
Bandgap energy (eV)3.53.21.3[55,56,58,60]
Electron affinity (eV)44.22.22[58,60]
Electron mobility (cm2/V.s)33200200[54,58,59,60]
Hole mobility (cm2/V.s)850100[54,58,59,60]
Donor concentration, Nd (cm−3)2.0 × 10161.35 × 10110[58,60]
Acceptor concentration, Na (cm−3)001.35 × 10¹¹[58,60]
Conduction band density of states/Nc (cm−3)2.2 × 10181.8 × 10191.0 × 1018[57,58,59,60]
Valence band density of states/Nv (cm−3)1.8 × 10193.5 × 10191.0 × 1019[57,58,59,60]
Radiative recombination (cm3/s)2.3 × 10−52.3 × 10−55.0 × 10⁻⁶
Table 2. Parameters of defects in different dye-sensitized TiO2 films used in SCAPS-1D.
Parameters/DyesJamunBlack PlumBlackberry
Defect typeNeutralSingle donorSingle donor
Capture cross-section electrons (cm2)1.0 × 10−151.0 × 10−151.0 × 10⁻¹⁵
Capture cross-section holes (cm2)1.0 × 10−151.0 × 10−151.0 × 10⁻¹⁵
Energetic distributionSingleSingleSingle
Reference for defect energy level EtAbove EvBelow EcBelow Ec
Energy level with respect to reference (eV)2.20.20.1
Characteristic energy (eV)0.10.10.1
Defect density, Nt (cm−3)2.5 × 10171.0 × 10201.0 × 1022
Table 3. Comparison of the PV performance of jamun-, black plum-, and blackberry-based DSSCs.
Voc
(V)
Isc (mA/cm2)Vmp
(V)
Imp (mA/cm2)Fill FactorEfficiency (%)
Jamun0.457.840.264.250.311.09
Black plum0.483.630.252.160.320.55
Blackberry0.452.960.241.580.290.38
Table 4. Comparison of the experimental and computational PV performance of jamun-, black plum-, and blackberry-based DSSCs.
DyeVoc (V)Jsc (mA/cm2)Vmp (V)Imp (mA/cm2)Fill FactorEfficiency (%)
Jamun (experimental)0.457.840.264.250.311.09
Jamun (simulation)0.597.420.33.70.251.11
Black plum (experimental)0.483.630.252.160.320.55
Black plum (simulation)0.463.540.32.080.380.62
Blackberry (experimental)0.452.960.241.580.290.38
Blackberry (simulation)0.452.50.31.420.380.43
Disclaimer/Publisher’s Note: The statements, opinions and data contained in all publications are solely those of the individual author(s) and contributor(s) and not of MDPI and/or the editor(s). MDPI and/or the editor(s) disclaim responsibility for any injury to people or property resulting from any ideas, methods, instructions or products referred to in the content.