Abstract
The article discusses the evaluation of potential heat production options for a large-scale district heating system in Narva (Estonia). Heat is currently generated at the Balti Power Plant’s CHP unit using local oil shale mixed with biomass. The CHP unit consists of two circulating fluidised bed boilers and a reheat steam turbine. According to the development strategy, the district heating system is expected to achieve carbon neutrality in the future. Various options and parameter variations should be analysed. The following scenarios were compared: (1) baseline scenario featuring an existing CHP extraction steam turbine; (2) alternative Scenario I featuring a CHP backpressure steam turbine; and (3) alternative Scenario II featuring a CHP gas turbine. To evaluate the above scenarios, a comprehensive energy/exergy analysis was performed, and economic indicators were calculated. The primary energy consumed, as well as the heat and electricity generated, were all taken into account. Based on this analysis, a scenario was selected using multiple-criteria decision-making that will improve energy efficiency and reliability of the system.
Keywords:
district heating; CHP; efficiency; electrical and thermal loads; efficiency; exergy; heat; turbine; demand; scenario 1. Introduction
Rising energy prices, the effects of the pandemic on the social and economic lives of all countries, and global energy transition processes characterised by a massive increase in the use of green energy sources and the transformation of global energy markets are currently affecting the energy industry. This resulted in a decrease in cogeneration electricity production in terms of heat consumption during periods of lower spot prices in the electricity market, especially during the global pandemic, and created conditions for unbalanced production and consumption of heat and electricity according to optimal parameters. However, during the energy crisis of winter 2022, there was a significant demand for the production of both power and thermal energy. Furthermore, the war in Ukraine has significantly exacerbated the issue of improving the reliability of electricity and heat supply.
Centralised combined heat and power (CHP) plants have been identified as a priority for meeting the European energy sector’s decarbonisation targets. Increased use of CHP and renewable energy sources is widely recognised by the EU administration as an effective way to improve the overall energy efficiency of energy systems, reduce CO2 emissions, and minimise dependence on imported fuels. The heating sector is often characterised by old, inefficient equipment that loses a lot of heat. According to [1], the heating sector accounts for the majority of energy consumption and carbon emissions in Germany.
The purpose of this study is to analyse the possibilities of using various turbine modifications for the existing CHP and to determine the best scenario. Furthermore, the paper establishes the primary comparisons of the characteristics and performance indicators of the scenarios and calculates the ratios of thermal load fuel consumption and fuel savings for various scenarios. The practical value of the paper is in the implementation of methodological provisions for selecting a rational option for CHP plant renovation. This will improve the efficiency of heat supply system sources and aid in the selection of the most effective directions for their transformation.
Estonia’s energy sector is one of the most carbon-intensive in the EU. According to the EU climate and energy framework, the EU aims to reduce Estonian CO2 emissions by at least 70% compared to 1990 (6500 t/a) or reach a new target of 55% compared to 1990 (9800 t/a) by 2030. By 2050, it is planned to reduce emissions by 80–90% compared to 1990 [2]. In Estonia, the target has been raised to 81% (9800 t/y) in 2021. It is expected to further increase to 85% (3300 t/y) by the end of 2022 in order to reach zero emissions by 2050 [3]. The transition from the 2050 target to 100% renewable energy in the EU has been analysed as a series of steps in [4]. Each step represents a significant technological advancement. At the same time, the decline of the oil shale industry threatens the local economy of Narva, a city in eastern Estonia.
Narva has a CHP plant with a maximum heat capacity of up to 160 MWDH and an electrical capacity of up to 215 MWel (depending on the heat capacity). In addition to the CHP unit, heat can also be supplied via the boiler house in the event of the unit’s failure or during maintenance. The emergency boiler house has three boilers with a total heat capacity of 240 MW. Average district heating production in Narva is approximately 450 GWh/a, peak demand in winter is approximately 160 MWth, and summer supply is only approximately 15 MWth.
To increase the efficiency and flexibility of the heating sector, European regulators are looking into combining different generation systems, particularly cogeneration plants [5]. Through energy and exergy analyses of the cogeneration mode, it is possible to increase electricity generation, improve heat load, and reduce heat loss in the DH network [6]. A review of the literature explores technical solutions aimed at improving the flexibility of CHP plants, considering the potential transition to 4th generation district heating, which improves efficiency and balances the thermal and electrical loads of CHP plants [7]. The importance of CHPs in the integrated energy sector was analysed in [8]. The use of low-carbon capacities after system integration, as well as the installation of heat pumps and electric boilers, was described in [9]. The heating system’s energy and exergy efficiencies were investigated, with the energy and exergy flow diagrams presented in [10]. The importance of identifying appropriate methods and reference parameters was discussed in [11], with a particular emphasis on applications that require the determination of allocation factors and potential effects, followed by the selection of a renovation scenario. In [12], exergy and economic analyses of CHPs were performed in order to determine the specific exergy-economic rates and CO2 emissions of end products. Much better indicators of economic and environmental sustainability, demonstrated using actual project inputs, were noted in [13], implying that similar concepts can be developed for other networks in accordance with the approach leading to a flexible modular DH solution based on CHP. According to the review of the literature, various modelling approaches are focused on optimisation algorithms for the integration issue of the electric power industry and thermal power industry [14].
2. Methodology
This paper compares different heat production scenarios in Narva’s district heating network. The following methodologies use the basic principles of analysis: thermal efficiency analysis, exergy analysis, and the concept of energy conservation. Based on the second law of thermodynamics, the efficiency factor is the most basic indicator of a system’s (or process’s) efficiency in relation to the energy used. Efficiency is defined as the ratio of useful energy used in the system (useful work) to total energy supplied. Process energy efficiency analysis for various process improvement options and selection of the most efficient option can be used to justify the adoption of energy efficiency improvement methods. This paper compares different heat supply scenarios for Narva’s heating network during operation and different values of specific power generation for heat consumption, which characterise the power/thermal energy generated ratio. In this article, the efficiency indicators of various types of heat supply sources are calculated using the ratio of generated types of energy, and the following heat supply technologies are compared:
- Baseline scenario—a CHP extraction steam turbine.
- Alternative scenario I—a CHP backpressure steam turbine.
- Alternative scenario II—a CHP gas turbine.
2.1. Baseline Scenario: A CHP Extraction Steam Turbine
This scenario reflects the existing heat generation process in Narva’s district heating network. A CHP extraction steam turbine requires replacing the existing CHP unit with 70–100% wood waste-based biomass CFB boilers that use the same steam turbine to supply heat to Narva. The plant is expected to be able to operate without a heat load.
The CHP plant will cover the full load of Narva. The CHP plant consists of a biofuel boiler (a mixture of oil shale and biomass, and in the future only 100% biomass) that generates high-pressure steam, a steam turbine, and a set of heat exchangers that recover heat from the turbine’s exhaust steam [15].
Figure 1 depicts the analysed baseline scenario for a CHP steam turbine. The district heater uses steam from crossover pipes between the intermediate and low-pressure parts of the turbine to heat the DH circulating water. The peak load receives extra steam from the hot reheat steam line. The facility’s maximum DH load is 160 MW and the maximum outlet water temperature is 120 °C. The DH water temperature at the inlet ranges from 40 °C to 60 °C. Narva’s annual heat demand is approximately 450 GWh [16]. Simplified models demonstrated the relationship between fuel input and heating plant output.
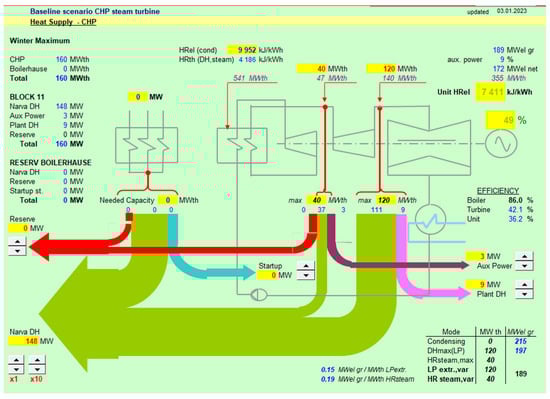
Figure 1.
Simplified process flow diagram of the CHP extraction steam turbine in the baseline scenario.
2.2. Alternative Scenario I: A CHP Backpressure Steam Turbine
A combined heat and power plant with backpressure turbines in which electricity generation is entirely dependent on heat demand is referred to as a CHP backpressure steam turbine. The low demand for heat in the summer complicates the operation of CHP plants using this type of turbine.
The flow rate of live steam in the case of a backpressure turbine is equal to the flow rate of steam discharged from the turbine to the network heater. Figure 2 depicts a schematic diagram of a CHP plant with backpressure turbines.
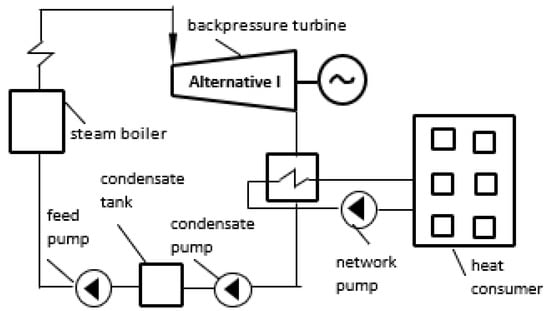
Figure 2.
Schematic diagram of a CHP plant with a backpressure turbine.
The generation of electricity at CHP plants with backpressure turbines is entirely dependent on the demand of industrial and municipal enterprises for thermal energy. In the summer, when there are no thermal loads, steam from the turbine is only used to cover the load of hot water supply and is thus consumed in a limited amount. The bulk of the steam flow enters the condenser. In the winter, the network heater receives the most steam from the heat extraction, while the condenser receives the least.
2.3. Alternative Scenario II: A CHP Gas Turbine
A gas turbine-based CHP plant is one that operates by converting the heat of combustion products from gaseous or liquid fuel into mechanical work performed in a gas turbine. Figure 3 depicts a schematic diagram of a CHP with gas turbines.
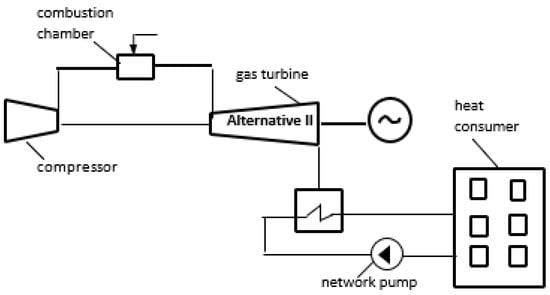
Figure 3.
Schematic diagram of a CHP plant with a gas turbine.
Internal losses accompany the compressor and gas turbine’s compression and expansion processes the value of which is estimated using the internal relative efficiency of the gas turbine and compressor.
If the gaseous byproducts of combustion exhausted in the gas turbine are routed to the heat recovery steam generator (HRSG), the resulting steam can only be used in the steam turbine cycle for additional electrical energy generation (combined steam-gas cycle power plant), or additional electrical and thermal energy generation (steam-gas cycle CHP).
Purified atmospheric air enters the gas turbine through the air intake and then into the compressor, where adiabatic compression occurs. The compressed air then enters the combustion chamber, where fuel is constantly supplied and burned. The combustion products then enter the gas turbine and expand, completing the useful work of the gas turbine cycle. The compressor, which is located on the same shaft as the gas turbine, consumes a significant portion of the useful work.
3. Case Study
3.1. Heat Demand Characteristics
Narva’s district heating network follows a 120/70 °C temperature schedule. The actual temperatures at the district heating network’s inlet and outlet are based on the outdoor temperature in 2021 (see Figure 4) and the demand for district heating (see Figure 5).
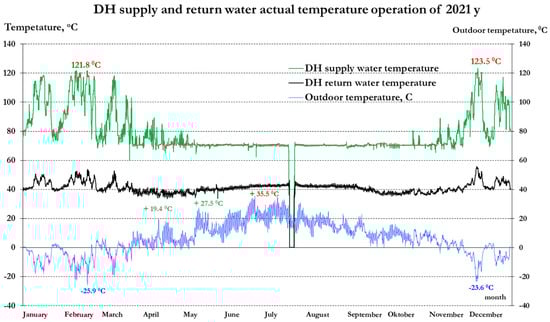
Figure 4.
Actual supply and return water temperatures for the Narva district heating system in 2021.
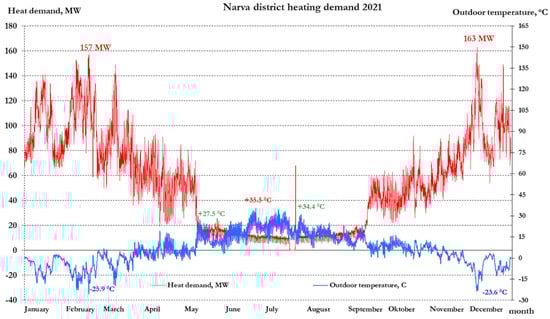
Figure 5.
Actual heat demand for the Narva district heating system in 2021.
Because so-called qualitative control is commonly used in Estonian district heating systems, the supply temperature to the district heating network is determined by the outside temperature, while the flow in the district heating pipeline remains constant. The temperature of the return water changes with qualitative control, but this cannot be controlled directly by the heat producer.
The temperature curve of the supply and return network water affects the consumption of network water (kg/s), which transfers the necessary amount of heat to the heating systems (Equation (1)).
where QH is the thermal load of the district heating heater, MW; cp is the specific heat capacity of water, J/kg⋅K; ts is the supply temperature, K; tr is the return temperature, K.
In the case of qualitative control, the supply and return temperatures of the district heating system depend on the ambient air temperature, but in order to heat domestic hot water to the required temperature (55 °C), the flow temperature must be maintained around 65 °C. If the supply temperature is regulated at the heat producer, the return temperature is calculated for each temperature regime and is determined by consumer behaviour and the settings of the heating units (Figure 6).
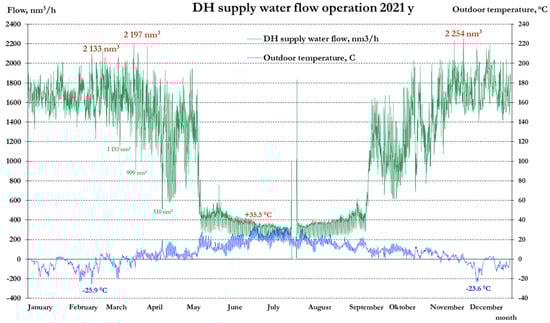
Figure 6.
Supply water flow rate of Narva’s district heating network in 2021.
The heat balance equation for a network heater allows us to determine the heating steam flow rate needed to cover the heat load (Equation (2)).
where hH is the enthalpy of the steam coming from the turbine to the district heating heater, kJ/kg; h′H is the enthalpy of the condensate at the heater outlet, kJ/kg.
In the absence of heating loads during the summer, steam from heating extraction is only used to cover the load of hot water supply (Figure 7) and is thus taken in a limited amount. In the winter, the network heater receives the most steam after the intermediate pressure turbine cylinder (120 Mwth), and peak load steam is taken from the hot reheat steam line before the intermediate pressure turbine cylinder (60 MWth) to cover the full heat load of up to 180 MW, as shown in Figure 7.
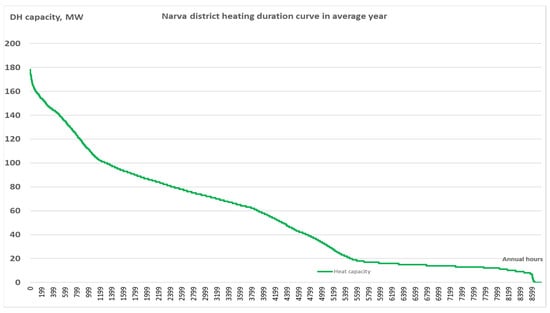
Figure 7.
Narva district heating average annual duration curves.
3.2. Optimal Scenario Indicators
3.2.1. Energy Efficiency
The efficiency of power production is calculated using electrical efficiency:
where Bf is fuel consumption, tonnes; QLHV is the lower calorific value of fuel, MWh/tonne; NT is the electrical energy of extraction turbine/backpressure turbine/gas turbine, MWh;
A CHP unit’s overall efficiency is the sum of its electricity generation and useful heat output. The efficiency of a CHP plant producing electricity and heat can be calculated using the following energy efficiency equation (Equation (3)):
where QH is the thermal energy of district heating, MWh.
The fuel consumption at the CHP plant can be determined using the heat balance equation of the steam generator (Equation (5)).
where ηb is boiler efficiency, %; hfw is the enthalpy of feed water at the inlet to steam generators kJ/kg; h1 is the enthalpy of superheated steam, kJ/kg.
Since these scenarios consider a mix of fuels (oil shale and biomass), the term ‘standard fuel’ (coal equivalent) with a lower heating value QLHV = 29.31 MJ/kg is used in this paper.
3.2.2. Exergy Efficiency
Exergy efficiency is calculated using unequal types of energy, which are summed up in the numerator of Equation (6), i.e., the previously determined ratio of electric power to heat load can be used as a more objective indicator of the heat supply source’s efficiency. It can be determined as follows:
where LDHw is the useful work of network water, MWh;
If the value of the exergy efficiency, which is the ratio of thermal work to the energy of the consumed fuel, is used to evaluate the quality of boiler hot water, then the efficiency of a hot water boiler or boiler must be evaluated using the value of the exergy efficiency, which is the ratio of thermal work to the energy of the consumed fuel.
During the entire operation of the heat supply system, the temperature of the network water passing through the heating devices is maintained at a higher level rather than dropping to the ambient temperature. The temperature of the network water in the return pipeline is determined by the heating network’s temperature schedule. This means that in heating systems, not all exergy is spent on doing the heat work necessary to raise the temperature of the heated outdoor air. This portion of the exergy is returned to the hot water boiler. The quality of the heat supply source (hot water boiler/hot water boiler house) is evaluated using its thermal efficiency (the ratio of heat supplied with network water to the energy of fuel consumption; boiler efficiency, heat consumption for auxiliary equipment, and heat loss in the DH heat exchanger are all taken into account).
The ease and efficiency with which the heat from the burned fuel is transferred to the network water characterises the operation of a hot water boiler. The boiler has an efficiency of 90% or higher. At the same time, the hot water boiler’s exergy efficiency does not exceed 20–40%. Such a significant discrepancy in efficiency values makes it difficult to fully assess its effectiveness because focusing on one or more efficiency factors leads to radically different conclusions.
Water in the district heating network is heated to 70–120 °C in a hot water boiler, transferring a significant amount of thermal energy but little working energy or exergy. This means that only the exergy portion of the transferred heat is capable of performing thermal work, i.e., raising the temperature of a heated body (air). Except for boiler losses, all energy from the combusted fuel is transferred to heated water as a heat flow. Nevertheless, the working portion of this flow, or its exergy, is negligible. The majority of the energy in the burned fuel is converted into anergy, which is a non-working state. Thermal work is only performed as a result of network water exergy in the heating devices of the heating system during thermal interaction, which is then used to raise the temperature of the heated air.
3.2.3. CO2 Emissions
The boilers in each scenario will be capable of burning up to 100% of oil-shale and wood-based biomass. The addition of biomass to the mix allows for maximum CO2 savings and the potential elimination of all emissions from fossil fuel systems. Carbon dioxide emissions can be calculated using the formula listed below that takes into account the efficiency of the CHP unit ηCHP and the carbon dioxide emission factor of the specific CO2 emission per MWh of oil shale consumption for an oil shale fluidised bed unit = 0.37 tCO2/MWth.
where is the specific CO2 emission factor, tCO2/MWh, is the share of biomass, is the energy efficiency of the heat load. Because biomass cannot be used in alternative scenario II, this indicator will only be calculated for the baseline scenario and alternative scenario I.
Figure 8 depicts the contribution to reducing the environmental impact of heat and power production using oil-shale and biomass co-combustion 40% and 70% biomass (thermal energy input) for baseline scenario and alternative scenario I.
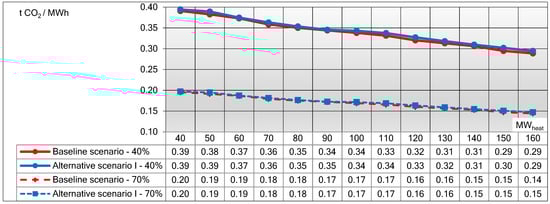
Figure 8.
CO2 emissions under baseline scenario and alternative scenario I from a mix of oil shale and biomass (40% and 70%).
4. Results
Quantitative indicators of energy use are reflected in the thermal efficiency of processes, but their qualitative aspects are ignored. In this regard, exergy analysis methods have been developed to assess the efficiency of energy-related technological processes. Exergy is the maximum amount of work that any thermodynamic system can do during the reversible transition from a state with specific parameters to a state of equilibrium with the environment. Exergy efficiency is defined as the ratio of usefully absorbed exergy to spent exergy. Although the exergy analysis condition for improving energy efficiency is formulated similarly to thermal efficiency, the exergy analysis produces excellent results. When the exergy efficiency of some power units is compared to the thermal efficiency, the exergy efficiency is 1.5–2 times lower (for example, ηex = 45%, ηb = 90% for a steam generator). The exergy efficiency is low due to significant heat loss from the fuel and heat transfer.
As a result of the exergy analysis, the main approaches to improving the efficiency of energy technological processes, namely combustion and heat transfer processes, can be highlighted.
The transition from a hot water boiler to cogeneration sources of heat supply is accompanied by an increase in electrical energy production while maintaining the same volumes of thermal energy production. If we consider the baseline scenario (CHP steam turbine) as Narva’s current heat source, the switch to alternative scenario II (CHP gas turbine) results in a 1.5-fold increase in electricity. To conduct a comparative analysis, the calculation results were summarised in Table 1.

Table 1.
Comparison of energy supply source indicators.
As shown in the table, the commissioning of new highly efficient combined-cycle energy sources under alternative scenario I (CHP gas turbine) will result in a significant increase in electricity generation while reducing heat production. To make up for the lost thermal energy, a heating water boiler must be installed, limiting the most efficient way to generate electricity via heat consumption. Thus, this scenario is characterised as unbalanced in terms of optimal production and consumption of heat and power, leading to significant excess fuel consumption.
As can be seen in Table 1, the share of generated electrical energy in the determination of exergy efficiency far outweighs the share of heat flow exergy. Alternative scenario II (CHP gas turbine) has an exergy efficiency of 42%, while the baseline scenario (CHP steam turbine) has an exergy efficiency of only 33%.
Energy efficiency, which refers to the efficiency of the fuel consumed, decreases as electricity generation increases. This makes it difficult to assess the true quality of the heat supply source. For a comparative assessment of the quality of heat supply sources, it is recommended to use the value of the exergy efficiency. The proportion of generated electrical energy in determining exergy efficiency far outweighs the proportion of heat flow exergy. Alternative scenario II (CHP gas turbine) has the highest exergy efficiency of 42%, while the baseline scenario (CHP steam turbine) has an exergy efficiency of only 33%.
Baseline scenario (CHP extraction steam turbine) has an energy efficiency of 78%, whereas alternative scenario II (CHP gas turbine) has a thermal efficiency of 68%. At the same time, alternative scenario I has a thermal efficiency of 76%.
As a result, alternative scenario II (CHP gas turbine) generates the most useful energy. It’s worth noting that the generation of electrical energy at the CHP gas turbine exceeds the thermal energy supplied via the source. When there is a low demand for electricity but a high demand for heat, the question of whether new combined cycle energy sources should be introduced may arise. It is necessary to compare the baseline scenario (CHP extraction steam turbine) and alternative scenario II (CHP gas turbine) as sources of heat and power operating in the Narva district heating system. We will compile a table of performance indicators for the compared energy supply sources to analyse the results of the calculation.
The amount of fuel consumed is a clear and objective indicator of the energy supply source’s efficiency. The electrical efficiency in the baseline scenario (0.37) corresponds to the fuel consumption in scenario II (0.37), with the maximum production of the same amount of electricity and heat. However, switching to separate generation of the same amount of electricity (using a CHP gas turbine) and thermal energy (using a hot water boiler), as described in scenario II, decreases efficiency by 4% to (0.33). Given that the capital costs for construction under scenario II (CHP gas turbine) are 30–40% higher than under scenario II (CHP gas turbine), the feasibility is called into question. The renovation of the existing CHP costs two times less under the baseline scenario (CHP steam turbine).
Table 2 provides the energy and exergy balances for all scenarios.
Table 2.
Comparative total energy and exergy balances of the boiler unit for all scenarios.
According to this exergy balance, the losses consist of losses incurred during the combustion process, heat transfer and air suction.
Under all heat supply scenarios, the same amount of thermal energy is produced (140, 120, 100, and 80 MWth), whereas electricity generation remains constant at a minimum of 44 MWel. The values for the scenarios are given in Table 3.
Table 3.
Baseline scenario values for different heat loads.
The amount of fuel consumed is a clear and objective indicator of the energy supply source’s efficiency in the scenarios. As shown in Table 3, the amount of fuel consumed at maximum heat generation under all three scenarios is at its lowest in the baseline scenario (8.26 kg/s). When we consider that capital costs during construction under the two alternative scenarios are 40–50% higher than during construction under the alternative scenario, the question of expediency arises. When comparing the considered energy supply sources with a heating coefficient TPR = 3.2 in which the consumption of thermal energy is more than three times that of electrical energy, we see that the efficiency of the baseline scenario, estimated based on the standard fuel consumption for the production of thermal and electrical energy, was 156.9 g/kWh. In alternative scenarios, the minimum specific consumption of reference fuel decreases as the thermal factor decreases, as shown in Table 3.
Relevant features from the standpoint of indicator calculations include the fact that alternative scenario I uses backpressure turbines with tightly interconnected electrical and thermal loads. The thermal load is used as the primary load in the scheme, and the electrical load is calculated from the steam flow through the turbine and thus can be greater or less than that indicated for all schemes, which has an effect on both technical, economic, and financial indicators. As a result, we use a steam turbine CHP plant as the baseline scenario, because the transition to alternative Scenario II is accompanied by a 1–2-fold increase in electricity, whereas the transition to alternative Scenario I comes with a 3+fold increase. A comparison of scenario cogeneration sources reveals that the most thermal energy (140 MW) is generated under the baseline scenario with the least amount of standard fuel consumption.
As the presented comparative analysis of various sources of heat supply has demonstrated, it is more convenient to produce electrical and thermal energy at steam turbine CHP plants; however, such a path for further development of heat supply cannot be recognised as promising because all of the shortcomings inherent in the existing district heating system are preserved. As a result, with the continued development of heat supply, alternative sources and technologies of low-temperature heat supply must be introduced.
It is critical to remember that the feasibility of implementing any scenario must be considered in relation to the conditions of each specific facility, taking into account the thermal scheme’s characteristics and the plant’s operating mode. The latter is crucial because, when a heat-extraction steam turbine is operating on a thermal schedule, using steam extractions before the thermal is impractical.
The well-known effective strategies to increase the thermal efficiency of the steam-power cycle, namely the regeneration system, are ignored when introducing steam-gas technologies.
Under the baseline scenario, significant thermal efficiency reserves can be realised by making more extensive use of regenerative steam extraction from CHP plants.
Specific CO2 emissions were calculated for variable heat load scenarios with biomass shares of 40% and 70%. The results are depicted in Figure 8.
5. Conclusions and Discussion
Different scenarios of possible heat supply for the Narva district heating network were compared, including a scenario where an existing extraction CHP steam turbine completely replaces fossil fuel with biomass and covers both base and peak loads (with boiler house as backup), a scenario with a CHP backpressure steam turbine, a scenario with a CHP gas turbine. The overarching goal of the various scenarios for power supply solutions is to identify technologies that best meet the needs of DH from a technical standpoint. The system efficiency analysis revealed that the baseline scenario (CHP extraction steam turbine) made the best use of the input primary energy at various heat loads.
In the future, the use of a heat pump to preheat circulating network water should be investigated as the most promising option for improving a district heating system’s energy efficiency. Network water is supplied by a network pump to the condensers of parallel-connected vapor-compression heat pumps with an electric drive and then, already heated, to the main heat exchanger, where it is further heated according to the network temperature schedule. It is necessary to select the optimal parameters and determine the maximum water temperature after the HP condenser in order to evaluate the energy efficiency of the combined HP as an additional heat source for district heating. In this scenario, the heat pump’s conversion factor must be at least equal to the value that ensures the primary energy costs for heat generation via the combined HP station and the main source are the same.
As a result, in the scenario under consideration, replacing a hot water boiler with a combined heat pump can potentially reduce annual fuel consumption for heat generation by up to 10%. The creation of combined heat pumping stations with electrically driven heat pumps as part of the main operation mode allows for the reduction of total fuel consumption by utilising low-grade thermal energy from renewable and secondary sources.
Author Contributions
Methodology, P.R.; Formal analysis, A.H.; Writing—original draft, P.R.; Writing—review & editing, A.D., A.H. and A.V.; Visualization, K.L.; Supervision, A.V. All authors have read and agreed to the published version of the manuscript.
Funding
This research received no external funding.
Data Availability Statement
Restrictions apply to the availability of these data. Data was obtained from energy company and are available from the authors with the permission of energy company.
Conflicts of Interest
The authors declare no conflict of interest.
Nomenclature
| Abbreviations | |
| CHP | combined heat and power |
| DH | district heating |
| CFB | circulating fluidised bed |
| HPR | heat to power ratio |
| Parameters | |
| G | network water flow rate, m3/h |
| Q | thermal load, MW |
| cp | specific heat of water, J/kg⋅K |
| D | heating steam flow rate, kg/s |
| h | enthalpy of steam, kJ/kg |
| η | efficiency, % |
| N | electrical energy, MWh |
| B | fuel consumption, t |
| QLHV | calorific value of fuel, MWh/t |
| t | temperature, °C |
| L | useful work, MWh |
| k | carbon dioxide emission coefficient, tCO2/MWth |
| s | share of biomass |
| Subscripts | |
| DH | district heating |
| H | heat |
| s | supply |
| r | return |
| T | turbine |
| f | fuel |
| fw | feedwater |
| b | boiler |
| ef | energy efficiency |
| ex | exergy efficiency |
| bio | biomass |
References
- Bloess, A. Impacts of heat sector transformation on Germany’s power system through increased use of power-to-heat. Appl. Energy 2019, 239, 560–580. [Google Scholar] [CrossRef]
- Available online: http://ec.europa.eu/environment/action-programme/ (accessed on 17 November 2022).
- Lee, S.H.; Lee, T.H.; Jeong, S.M.; Lee, J.M. Economic analysis of a 600 MWe ultra supercritical circulating fluidized bed power plant based on coal tax and biomass co-combustion plans. Renew. Energy 2019, 138, 121–127. [Google Scholar] [CrossRef]
- Connolly, D.; Lund, H.; Mathiesen, B.V. Smart Energy Europe: The technical and economic impact of one potential 100% renewable energy scenario for the European Union. Renew. Sustain. Energy Rev. 2016, 60, 1634–1653. [Google Scholar] [CrossRef]
- Badami, M.; Gerboni, R.; Portoraro, A. Determination and assessment of indices for the energy performance of district heating with cogeneration plants. Energy 2017, 127, 697–703. [Google Scholar] [CrossRef]
- Zhang, H.; Liu, X.; Liu, Y.; Duan, C.; Dou, Z.; Qin, J. Energy and exergy analyses of a novel cogeneration system coupled with absorption heat pump and organic Rankine cycle based on a direct air-cooling coal-fired power plant. Energy 2021, 229, 120641. [Google Scholar] [CrossRef]
- Lepiksaar, K.; Mašatin, V.; Latõšov, E.; Siirde, A.; Volkova, A. Improving CHP flexibility by integrating thermal energy storage and power-to-heat technologies into the energy system. Smart Energy 2021, 2, 100022. [Google Scholar] [CrossRef]
- Jimenez-Navarro, J.; Kavvadias, K.; Filippidou, F.; Pavicevic, M.; Quoilin, S. Coupling the heating and power sectors: The role of centralised combined heat and power plants and district heat in a European decarbonised power system. Appl. Energy 2020, 270, 115134. [Google Scholar] [CrossRef]
- Dominkovic, D.F.; Stunjek, G.; Blanco, I.; Madsen, H.; Krajacic, G. Technical, economic and environmental optimization of district heating expansion in an urban agglomeration. Energy 2020, 197, 117243. [Google Scholar] [CrossRef]
- Terhan, M.; Comakli, K. Energy and exergy analyses of natural gas-fired boilers in a district heating system. Appl. Therm. Eng. 2017, 121, 380–387. [Google Scholar] [CrossRef]
- Noussan, M. Allocation factors in Combined Heat and Power systems - comparison of different methods in real applications. Energy Convers. Manag. 2018, 173, 516–526. [Google Scholar] [CrossRef]
- Gao, J.; Zhang, Q.; Wang, X.; Song, D.; Liu, W.; Liu, W. Exergy and exergoeconomic analyses with modeling for CO2 allocation of coal-fired CHP plants. Energy 2018, 152, 562–575. [Google Scholar] [CrossRef]
- Kazagic, A.; Merzic, A.; Redzic, E.; Tresnjo, D. Optimization of modular district heating solution based on CHP and RES—demonstration case of the Municipality of Visoko. Energy 2019, 181, 56–65. [Google Scholar] [CrossRef]
- Pavicevic, M.; Kavvadias, K.; Puksec, T.; Quoilin, S. Comparison of different model formulations for modelling future power systems with high shares of renewables—The Dispa-SET Balkans model. Appl. Energy 2019, 252, 113425. [Google Scholar] [CrossRef]
- Rušeljuk, P.; Lepiksaar, k.; Siirde, A.; Volkova, A. Economic Dispatch of CHP Units through District Heating Network’s Demand-Side Management. Energies 2021, 14, 4553. [Google Scholar] [CrossRef]
- Rušeljuk, P.; Volkova, A.; Lukić, N.; Lepiksaar, K.; Nikolić, N.; Nešović, A.; Siirde, A. Factors Affecting the Improvement of District Heating. Case Stud. Est. Serb. Clim. Technol. 2021, 24, 521–533. [Google Scholar] [CrossRef]
Disclaimer/Publisher’s Note: The statements, opinions and data contained in all publications are solely those of the individual author(s) and contributor(s) and not of MDPI and/or the editor(s). MDPI and/or the editor(s) disclaim responsibility for any injury to people or property resulting from any ideas, methods, instructions or products referred to in the content. |
© 2023 by the authors. Licensee MDPI, Basel, Switzerland. This article is an open access article distributed under the terms and conditions of the Creative Commons Attribution (CC BY) license (https://creativecommons.org/licenses/by/4.0/).