Abstract
In hydrogen energy systems, the polymer electrolyte fuel cell (PEFC) is an important component. The purpose of this study is to clarify the effect of separator thickness (s.t.) in PEFC on the distributions of mass such as H2, O2, H2O and current density when PEFC is operated at 363 K and 373 K. The relative humidity (RH) of supply gases also impacts the operation. The numerical simulation (using a 3D model) with COMSOL Multiphysics has been conducted to analyze the characteristics of PEFC. It has been observed that the molar concentration of H2 using s.t. of 2.0 mm is smaller compared with the thinner s.t. cases at the initial operation temperature of a cell (Tini) = 363 K and 373 K. The molar concentration of O2 using s.t. of 2.0 mm is smaller compared with the thinner s.t. cases at Tini = 373 K, as well as the case for the RH of supply gases at the anode of 40%RH and cathode of 40%RH (A40%RH/C40%RH) irrespective of Tini. Additionally, it has been clarified that the molar concentration of H2O maintains a low value along with the gas channel at Tini = 373 K using s.t. of 1.5 mm and 1.0 mm. Moreover, it has been clarified that the current density using s.t. of 2.0 mm is the highest among the different s.t. irrespective of Tini, which is the most remarkable in the case of A40%RH&C40%RH.
1. Introduction
The Japanese New Energy and Industry Technology Development Organization (NEDO) road map of 2017 says that higher temperature operation (e.g., 363 K and 373 K) is required for the stationary and mobility application use of polymer electrolyte fuel cells (PEFC) [1]. The PEFC system with a Nafion-type membrane as a polymer electrolyte membrane (PEM) is usually operated under 353 K [2,3,4]. There are many benefits when the PEFC system is operated at a higher temperature, i.e., 363 K and 373 K, and they are: (i) the kinetics improvement at an electrode, (ii) the cooling system can be smaller because of the increase in the temperature gap between the PEFC stack system and the coolant, and (iii) the durability enhancement to CO contained in the H2 reformed from hydrocarbon [5]. However, we should overcome the following demerits: (i) damage of PEM; (ii) electrode elution; (iii) performance drop due to uneven distribution of gas flow, pressure, temperature, voltage and current in PEFC [6]. The even distributions of gas, H2O and current density provide not only higher power generation performance but also a longer lifetime when we operate the PEFC system at higher temperatures [6,7].
According to the literature survey, some studies have been conducted for high-temperature PEFC (HTPEFC), which focus on the development of components consisting of PEFC.
Regarding PEM, several studies have investigated to development of a new material for HTPEFC. The PEFC equipped with a phosphoric acid-doped polybenzimidazole membrane could be operated from 393 K to 433 K [8]. It has been reported that the power densities are 0.254 W/cm2, 0.299 W/cm2 and 0.389 W/cm2 at the current density of 0.7 A/cm2, 0.8 A/cm2 and 0.9 A/cm2, respectively when operated at 393 K, 413 K and 433 K, respectively. It is obtained by the improvement of proton conductivity at higher temperature operation. The other study [9] has developed the polybenzimidazole/graphene oxide composite membrane. The PEFC stack consisting of 12 individual cells equipped with the membrane has performed the power density of 3.6 W/cm2 at the current density of 0.67 A/cm2 when operated at 433 K, resulting from the improvement of proton conductivity at higher temperature operation.
Regarding the catalyst layer, some studies have investigated the structure and preparation process. The catalyst layer having different microstructures and the effect of Pt on the performance, as well as the degradation of HTPEFC, have been investigated. It has been found that mass transfer is affected remarkably by the impacts of microstructures and Pt catalysts [10]. It has also revealed that the catalyst preparation process is important to obtain higher power generation performance. The other investigation has reported the impact of Pt pulse electrodeposition on the power generation characteristics of HTPEFC [11]. The mass activities of membrane electrode assemble (MEA) having the anode electrode modified by Pt pulse electrodeposition is 437.2 mW/mg-Pt, which is almost 1.36 times larger than that of the pristine MEA.
Regarding the gas diffusion layer (GDL), some studies have investigated the structure, such as porosity and thickness. The numerical study has revealed that the effect of uneven porosity distribution is more considerable when the current densities are higher [12]. It has also been reported that the reaction kinetics are hardly affected by changing the porosity configurations. The other numerical study has revealed that thickness and porosity exhibit the opposite impact on diffusion flux, reducing with the increase in GDL thickness but increasing with the increase in porosity [13]. It has also been reported that the optimum thickness for anode GDL and cathode GDL would be 80 μm–120 μm and 140 μm–170 μm, respectively, and the optimum value for GDL porosity ranges from 35% to 45%.
Regarding separators, several studies have investigated the structure. The previous study [14] carried out a 3D numerical simulation to understand the effect of the interdigitated flow field on not only mass transfer characteristics but also power generation characteristics. This study has revealed that the interdigitated flow provides not only better power generation performance compared with the parallel flow but also similar characteristics as the serpentine flow. In addition, there exists the optimum ratio of channel-to-rib to obtain the higher power density. The other numerical study has focused on the rib design [15]. The results have shown that the ratio of channel-to-rib influences the distributions of gas diffusion, electron conduction and current density in the porous electrodes significantly. Moreover, the optimum ratio of channel-to-rib is 1, which provides a peak power density of 0.428 W/cm2 at the current density of 1.2 A/cm2. The widths of the top and bottom edges of the anode and cathode flow channels have been investigated as an independent variable with a constrained range for the optimization of the performance of HTPEFC [16]. It has been reported that the trapezoidal structure of the cross-sectional area of the flow channel is the best shape to obtain the highest power generation performance. It has also revealed that the pressure drop and the output power of the optimal model are 1.7% and 6.5% larger than those of the original model at 0.4 V, respectively. The other experimental study has investigated the effect of flow field plate misalignment on the GDL intrusion, and the characteristics of HTPEFC operated at 433 K [17]. The shear stress can be focused on the MEA due to clamping and misalignment. This study has reported that the deviation of the intrusion depth can reduce in the hydraulic diameter by approximately 1.3% for a 1 cm × 1 cm channel. The misalignment has an impact on not only MEA and GDL but also gas tightness. It has been claimed that the misalignment causes cracks in the catalyst-coated membrane, resulting in a decrease in cell performance.
The studies conducted by the authors have examined the temperature distribution on not only the separator back surface but also the interface between PEM and the cathode catalyst layer changing the separator thickness experimentally and numerically, respectively [18,19]. They have also investigated the power generation performance by the polarization curve changing the separator thickness (s.t.). According to the investigation changing s.t. by 2.0 mm, 1.5 mm and 1.0 mm, including the saddle part and channel part, s.t. of 2.0 mm, is the best to obtain the higher performance because of large heat capacity, while the temperature distribution is wider. However, there is no report investigating the effect of s.t. on the distributions of mass such as H2, O2, H2O and current density on the interface between PEM and catalyst layer at the anode and the cathode in a single HTPEFC. The distributions of them on the interface between the PEM and catalyst layer at the anode side and the cathode side have a large influence on the electrochemical reaction, i.e., the power generation performance of the HTPEFC system.
Therefore, this study aims to clarify the effect of s.t. on the distributions of mass such as H2, O2, H2O and current density on the interface between PEM and catalyst layer at the anode and the cathode in a single HTPEFC. We carry out the numerical simulation by means of a 3D model with COMSOL Multiphysics composed of multi-physics simulation function codes. s.t. is varied to 2.0 mm, 1.5 mm and 1.0 mm, where s.t. of 2.0 mm has the saddle thickness (sd.t.) of 1.0 mm and the channel height (c.h.) of 1.0 mm, s.t. of 1.5 mm has sd.t. of 0.5 mm and c.h. of 1.0 mm, and s.t. of 1.0 mm has sd.t. of 0.5 mm and c.h. of 0.5 mm, respectively. Nafion NRE-211 and TGP-H-030 are adopted as PEM and GDL, respectively. We change the operation temperature by 353 K, 363 K and 373 K. This study also investigates the RHs of supply gas at the anode with 80%RH and cathode with 80%RH (A80%RH/C80%RH), anode with 80%RH and cathode with 40%RH (A80%RH/C40%RH), anode with 40%RH and cathode with 80%RH (A40%RH/C80%RH) and anode with 40%RH and cathode with 40%RH (A40%RH/C40%RH).
2. Numerical Simulation
Governing Equations
We have carried out the numerical simulation utilizing a multi-physics simulation software (i.e., COMSOL Multiphysics). In COMSOL Multiphysics, the simulation function code for PEFC is installed, including the continuity formula, the Brinkman formula to consider a momentum transfer phenomenon, the Maxwell–Stefan formula to consider a diffusion transfer phenomenon and Butler–Volmer formula to consider an electrochemical reaction phenomenon. Some researchers conducted the numerical simulation for HTPEFC using the software ANSYS FLUENT [20,21]. This software has the simulation codes consisting of a mass conversion equation, momentum conversion equation, species conversion equation, energy conversion equation, charge conversion equation and Butler–Volmer equation. The distributions of mass, temperature and current density were calculated and reported. On the other hand, some researchers conducted the numerical simulation for HTPEFC using the original procedure [16,22]. The continuity equation, Navier–Stokes equation, species conversion equation, Maxwell–Stefan equation, Butler–Volmer equation and charge conversion equation were considered in these studies. The distributions of mass, gas velocity and current density were calculated and reported. On the contrary, many papers reported the numerical simulation results for HTPEFC using the software COMSOL Multiphysics [4,12,14,23,24], which was also used in this study. The simulation codes in this software have been explained in this study. The distributions of mass, temperature and current density were calculated and validated well in these reports. Therefore, the authors think the software COMSOL Multiphysics used in this study is reliable.
Firstly, the continuity formula considering the gas species in porous media in single cell of PEFC, e.g., catalyst layer, MPL and GDL, as well as the gas channel, can be defined as follows:
where εp means the porosity (-), ρ means the density (kg/m3), u means the velocity vector (m/s), Qm means the mass source term (kg/(m3·s)) and t means the time (s).
Brinkman formula treating the relationship between the pressure and gas flow velocity solved in porous media in a single cell of PEFC, e.g., catalyst layer, MPL and GDL, as well as in the gas channel, can be defined as follows:
where p means the pressure (Pa), means the viscosity (Pa·s), I means the unit vector (-), κ means the permeability (m2), and F means the force vector (kg/(m2·s2)), e.g., gravity. Maxwell–Stefan formula considering the mass transfer phenomena such as the diffusion phenomenon, ion transfer phenomenon and convection transfer phenomenon can be defined as follows:
where Ni means the vector-type molar flow rate on the interface between PEM and electrode (mol/(m2·s)), Di means the diffusion constant (m2/s), Ci means the ion i concentration (mol/m3), zi means the ion valence (-), um,i means the ion i mobility ((s·mol)/kg), F means the Faraday constant (C/mol), φl means the electrical potential of liquid [25] (V), J means the molar flow rate of the convection transfer phenomenon (mol/(m2·s)) and Ri,tot means the species’ reaction rate (mol/(m3·s)).
Butler–Volmer formula considers the electrochemical reaction phenomenon as follows:
where i means the current density (A/m2), i0 means the exchange current density (A/m2), αa means the charge transfer coefficient at anode (-), η means the activation over-potential [25] (V), R means the gas constant (J/(mol·K)), T means the temperature (K), αc means the charge transfer constant at the cathode side (-), φs means the electrical potential of solid [25] (V), Eeq means the equilibrium electric voltage [25] (V).
The 3D model of a single PEFC applied in the present study is the same as the authors’ previous study [26] except for the separator shape. Figure 1 shows the 3D model of a single PEFC for s.t. of 2.0 mm, 1.5 mm and 1.0 mm. These structures follow the commercial single cell applied in the experimental studies conducted by the authors [18,27,28]. The cell has a serpentine flow channel separator composed of five gas channels with a width of 1.0 mm for a gas channel and ribs with a width of 1.0 mm for a rib. The number of gas channels is five, which follows the structure of the actual cell [18]. Table 1 lists the geometrical parameters applied to the 3D model. Table 2 and Table 3 show physical parameters and operation conditions, respectively. The initial operation temperature of a cell (Tini) is varied to 353 K, 363 K and 373 K. Regarding 353 K, we adopt it to examine the characteristics at a normal temperature with the characteristics at a higher temperature. This study has investigated the RHs of supply gases for A80%RH/C80%RH, A80%RH/C40%RH, A40%RH/C80%RH and A40%RH/C40%RH. We set the flow rate of supply gas at the stoichiometric ratio of 1.5, where the volume flow rate of supply gas at the anode side and the cathode side is 0.210 NL/min and 0.105 NL/min, respectively. The stoichiometric ratio (s.r.) of 1.0, which indicates the flow rate of supply gas, can be expressed by Equation (7).
where CH2 means the molar flow rate on the consumed H2 (mol/s), I means the loaded current (A) and zH2 means the electrons moles exchanged in the reaction (=2) (-), CH2 means the molar flow rate following s.r. of 1.0. The CO2 means the molar flow rate on the consumed O2 (mol/s), which means half of CH2 (which is expressed by Equation (8)).

Figure 1.
3D model of single PEFC (a) s.t. of 2.0 mm = sd.t.: 1.0 mm + c.h.: 1.0 mm, (b) s.t. of 1.5 mm = sd.t.: 0.5 mm + c.h.: 1.0 mm, (c) s.t. of 1.0 mm = sd.t.: 0.5 mm + c.h.: 0.5 mm.


Table 1.
Geometrical parameters of components in single cell of PEFC applied for 3D model in the numerical simulation in this study [14,29,30,31,32,33].
Table 2.
Physical parameters for gases, components and electrochemical reactions set in the numerical simulation in this study.
Table 3.
Operation conditions for power generation applied for the numerical simulation in this study.
We can except H2, which is produced from renewable energy using an H2O electrolyzer, will be applied to the PEFC system to construct a zero-CO2-emission society in the near future. If H2 is produced by an H2O electrolyzer, O2 can be co-produced. We think that H2 and O2 produced from the H2O electrolyzer are available for PEFC. We would like to propose the energy system composed of renewable energy, an H2O electrolyzer, and a PEFC system operated using H2 and O2 produced by H2O electrolysis. Consequently, we adopt O2 as the cathode gas for this numerical study. When we adopt O2 as a cathode gas, we can obtain a higher current density on the interface between PEM and the catalyst layer, especially under the rib, compared to the case using air as a cathode gas [25].
In this study, we set the same assumptions as the authors’ previous study [26,43]. When we operate PEFC at a higher temperature, i.e., 363 K and 373 K, PEM and catalyst later are easy to be dehydrated because of the exponential increase in the saturation of H2O vapor with the increase in temperature [44]. The performance of the O2 reduction reaction that occurred at the cathode side is affected by means of the humidification of the ionomer in the electrode with H2O [42]. It can be considered that the proton conductivity of PEM is influenced by the humidification condition, providing an impact on the performance of the H2 oxidization reaction. Consequently, we focus on distributions of mass such as H2, O2, H2O and current density on the interface between PEM and catalyst layer at the anode side and the cathode side, which indicate the performance of H2 oxidization reaction as well as O2 reduction reaction, and exhibits the calculation results below.
In this study, the analysis points from A to K have been adopted, following the authors’ previous study [26], to investigate the effect of s.t. on distributions of mass such as H2, O2, H2O and current density. This analysis has calculated the mean value on the cross-sectional area on the interface between PEM and catalyst layer at the anode side or the cathode side at each point, covering both parts under the gas channel and under rib.
3. Results and Discussion
3.1. In-Plane Distribution of Molar Concentration of H2 on the Interface between PEM and Catalyst Layer at the Anode among Various s.t.
Figure 2, Figure 3 and Figure 4 exhibit comparisons of the molar concentration of H2 along with the gas channel on the interface between PEM and catalyst layer at the anode changing Tini as well as the RH of supply gas among different s.t., respectively. It is seen from Figure 2, Figure 3 and Figure 4 that the molar concentration of H2 keeps the approximately same value along with the gas flow except for using s.t. of 1.0 mm. It is thought that this is due to the H2 permeability through porous media being high [20,26]. As a result, H2 is consumed uniformly along with the gas channel. Regarding the case of s.t. of 1.0 mm, the velocity and the concentration of H2 are higher because the cross-sectional area of the gas channel is one-fourth compared to the case of c.h. of 1.0 mm, i.e., the case of s.t. of 2.0 mm and 1.5 mm. We can see that the molar concentration of H2 drops at the analysis points of C, E, G, I and K using s.t. of 1.0 mm. Since the analysis points of C, E, G and I are corner parts of the serpentine separator and the analysis point of K is the outlet of the cell [26], it is thought that the gas diffusion of H2 toward the through-plane direction from the separator to the catalyst layer at the anode side is affected by the velocity and concentration of H2 in the gas channel more. In addition, it is revealed from Figure 2, Figure 3 and Figure 4 that the molar concentration of H2 using s.t. of 1.0 mm is smaller compared with that in the other s.t. cases at Tini = 363 K and 373 K. Since Tini = 363 K and 373 K are higher temperature operation conditions, it might be easy to dry up PEM and electrode. Since the velocity and the concentration of H2 in the gas channel are higher in the case of using s.t. of 1.0 mm, we can believe that the drying impact at Tini = 363 K and 373 K is bigger compared with the other s.t. As a result, the performance of the H2 oxidization reaction becomes lower, providing a small molar concentration of H2.
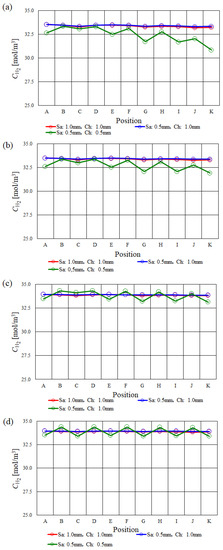
Figure 2.
Molar concentration of H2 along with the gas channel on the interface between PEM and catalyst layer at the anode among various s.t. at Tini = 353 K. (a) A80%RH/C80%RH, (b) A80%RH/C40%RH, (c) A40%RH/C80%RH, (d) A40%RH/C40%RH.
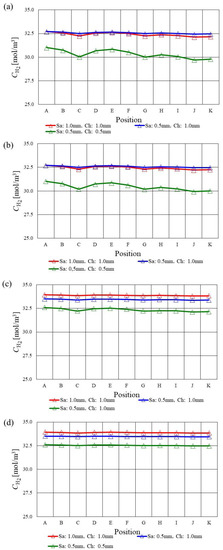
Figure 3.
Molar concentration of H2 along with the gas channel on the interface between PEM and catalyst layer at the anode among various s.t. at Tini = 363 K. (a) A80%RH/C80%RH, (b) A80%RH/C40%RH, (c) A40%RH/C80%RH, (d) A40%RH/C40%RH.
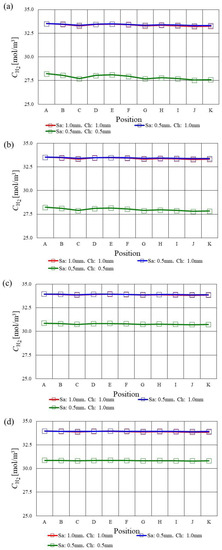
Figure 4.
Molar concentration of H2 along with the gas channel on the interface between PEM and catalyst layer at the anode among various s.t. at Tini = 373 K. (a) A80%RH/C80%RH, (b) A80%RH/C40%RH, (c) A40%RH/C80%RH, (d) A40%RH/C40%RH.
3.2. In-Plane Distribution of Molar Concentration of O2 on the Interface between PEM and Catalyst Layer at the Cathode among Various s.t.
Figure 5, Figure 6 and Figure 7 exhibit comparisons of the molar concentration of O2 along with the gas channel on the interface between PEM and catalyst layer at the cathode changing Tini and RH of supply gas among different s.t., respectively. It is seen in Figure 5, Figure 6 and Figure 7 that the molar concentration of O2 reduces along with the gas channel at Tini = 353 K and 363 K. It is known that the O2 reduction reaction is conducted well along the gas channel [43]. Additionally, we can see from Figure 5, Figure 6 and Figure 7 that the molar concentration of O2 reduces at the analysis points of C and G especially. Since the analysis points of C and G are corner parts of the serpentine separator, H2O may accumulate there [45,46]. As a result, the O2 diffusion inhibition occurs at these points [18], causing a decrease in the molar concentration of O2.
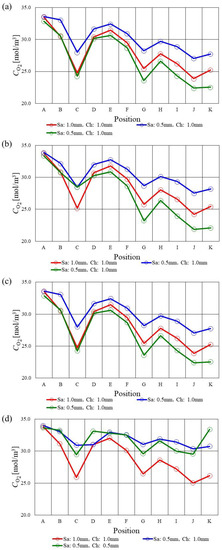
Figure 5.
Molar concentration of O2 along with the gas channel on the interface between PEM and catalyst layer at the cathode among various s.t. at Tini = 353 K. (a) A80%RH/C80%RH, (b) A80%RH/C40%RH, (c) A40%RH/C80%RH, (d) A40%RH/C40%RH.
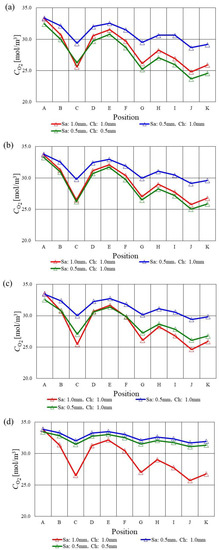
Figure 6.
Molar concentration of O2 along with the gas channel on the interface between PEM and catalyst layer at the cathode among various s.t. at Tini = 363 K. (a) A80%RH/C80%RH, (b) A80%RH/C40%RH, (c) A40%RH/C80%RH, (d) A40%RH/C40%RH.
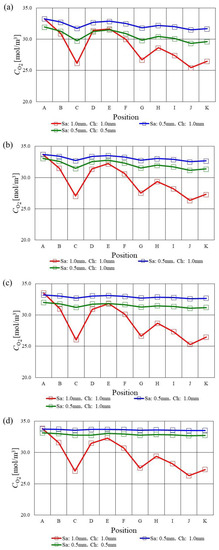
Figure 7.
Molar concentration of O2 along with the gas channel on the interface between PEM and catalyst layer at the cathode among various s.t. at Tini = 373 K. (a) A80%RH/C80%RH, (b) A80%RH/C40%RH, (c) A40%RH/C80%RH, (d) A40%RH/C40%RH.
Moreover, it is observed from Figure 5, Figure 6 and Figure 7 that the molar concentration of O2 keeps a high value along with the gas channel at Tini = 373 K using s.t. of 1.5 mm and 1.0 mm. In other words, the molar concentration of O2 using s.t. of 2.0 mm is smaller at Tini = 373 K, which can also be observed for A40%RH/C40%RH regardless of Tini. Table 4 lists the experimental data on the temperature of separator back surface under some conditions as an example [18]. In this table, the positions follow the authors’ previous experimental study [18]. It is seen from Table 4 that the temperature of separator back surface increases with the decrease in s.t. In this study, the voltage data obtained by the authors’ previous experimental study [18] were adopted as the boundary condition in the numerical simulation in this study, following the assumption as same as the authors’ previous studies [26,43]. It can be said that the voltage data were obtained following the experimental phenomena. In addition, the pressure of supply gas at the inlet of cell was set at 0.4 MPa in the previous power generation experiment [18], and the numerical simulation in this study is shown in Table 3. Moreover, the gas pressure at the outlet of the cell was an atmospheric pressure in the previous power generation experiment [18] and the numerical study in this study. Therefore, the pressure gradients along the channel in the cell cause the power generation experiment and the numerical simulation in this study. In this study, the continuity formula and Brinkman formula were considered, resulting in the pressure gradients along the channel in the cell being calculated. Consequently, it might be thought that the pressure gradients along the channel increase with the decrease in the channel height, i.e., cross-sectional area of channel, causing the decrease in the total voltage of the cell with the decrease in s.t.
Table 4.
Comparison of temperature of separator back surface among different s.t. at 363 K for A40%RH, C40%RH [18].
In addition, A40%RH/C40%RH is a dry condition, resulting in PEM and catalyst layer considered as easily dehydrated [18]. The proton conductivity of PEM decreases due to the dehydration of PEM at higher temperature operation, resulting in a large ohmic over-potential [47]. Under the low RH condition, the ionomer in catalyst layer at the cathode side is hard to be hydrated by the H2O migrated through PEM from the anode to the cathode, which is important for the performance of O2 reduction reaction at the cathode side [44]. The large ohmic overpotential is mainly caused by ionic and electronic resistances. The ionic resistance is associated with the resistance of PEM and ionomer of the catalyst layer [48]. Considering these phenomena, the catalyst layer is relatively humidified using s.t. of 2.0 mm due to the thickest s.t. Therefore, the O2 reduction reaction in catalyst layer at the cathode side progressed well compared to the other s.t. cases. As a result, the molar concentration of O2 using s.t. of 2.0 mm is smaller at Tini = 373 K as well as for A40%RH/C40%RH.
3.3. In-Plane Distribution of Molar Concentration of H2O on the Interface between PEM and Catalyst Layer at the Cathode among Various s.t.
Figure 8, Figure 9 and Figure 10 exhibit comparisons of molar concentration of H2O along with the gas channel on the interface between PEM and catalyst layer at the cathode changing Tini and RH of supply gas among various s.t., respectively. It is seen in Figure 8, Figure 9 and Figure 10 that the molar concentration of H2O increases at the analysis points of C, G, J and K. Since the analysis points of C and G are the corner parts of the serpentine separator, H2O may accumulate there [45,46]. In addition, it can be thought that H2O in gas flowing through the gas channel accumulates near the outlet of cell [28,49], i.e., the analysis points of J and K. Therefore, the molar concentration of H2O reduces at the analysis points of C, G, J and K. On the other hand, we can observe that the molar concentration of H2O keeps a low value along with the gas channel at Tini = 373 K using s.t. of 1.5 mm and 1.0 mm. It is clear from the previous studies [50,51] that the proton conductivity of PEM increases with not only increasing temperature but also increasing RH. The saturation pressure of H2O vapor increases exponentially with increasing temperature [44], resulting in it possibly being easier to dry PEM at a higher temperature. When the proton conductivity of PEM reduces, the performance of O2 reduction reaction at the cathode side decreases because of the lack of proton [43]. We can claim that the molar concentration of H2O reduces using s.t. of 1.5 mm and 1.0 mm, resulting from the low performance of O2 reduction reaction producing H2O.
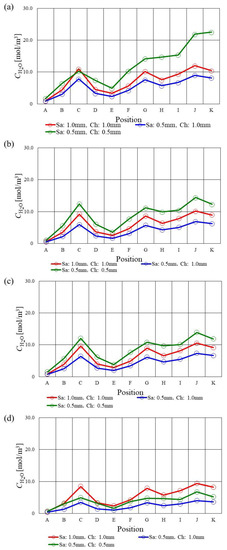
Figure 8.
Molar concentration of H2O along with the gas channel on the interface between PEM and catalyst layer at the cathode among various s.t. at Tini = 353 K. (a) A80%RH/C80%RH, (b) A80%RH/C40%RH, (c) A40%RH/C80%RH, (d) A40%RH/C40%RH.
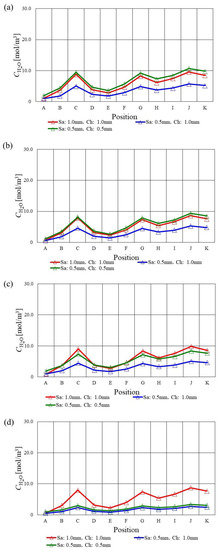
Figure 9.
Molar concentration of H2O along with the gas channel on the interface between PEM and catalyst layer at the cathode among various s.t. at Tini = 363 K. (a) A80%RH/C80%RH, (b) A80%RH/C40%RH, (c) A40%RH/C80%RH, (d) A40%RH/C40%RH.
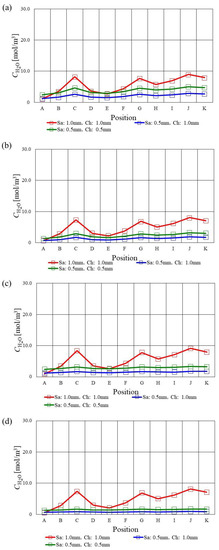
Figure 10.
Molar concentration of H2O along with the gas channel on the interface between PEM and catalyst layer at the cathode among various s.t. at Tini = 373 K. (a) A80%RH/C80%RH, (b) A80%RH/C40%RH, (c) A40%RH/C80%RH, (d) A40%RH/C40%RH.
In this study, the phase state of H2O is a vapor since the saturation is below 1.0 under the investigated conditions in this study, which is the same as the previous studies by the authors [26,43]. Therefore, the assumption treating H2O as a vapor in this study is valid.
3.4. In-Plane Distribution of Current Density on the Interface between PEM and Catalyst Layer at the Cathode among Various s.t.
Figure 11, Figure 12 and Figure 13 indicate comparisons of current density along with the gas channel on the interface between PEM and catalyst layer at the cathode changing Tini and RH of supply gas among various s.t., respectively. It is seen from Figure 11, Figure 12 and Figure 13 that the current density reduces along with the gas channel. H2 and O2 are consumed along with the gas channel, resulting in the concentration of H2 and O2, which is a driving force to diffuse toward the catalyst layer, reducing along with the gas channel. Additionally, we can clarify from Figure 11, Figure 12 and Figure 13 that the current density using s.t. of 2.0 mm is the highest among the various s.t. irrespective of Tini. This tendency is more remarkable for A40%RH/C40%RH. A40%RH/C40%RH is a dry condition, resulting in PEM and catalyst layer possibly being dehumidified easily. The proton conductivity of PEM decreases because of the dehydration of PEM at higher temperature operation, resulting in the ohmic over-potential being large [47]. Since the heat capacity in the case of using s.t. of 2.0 mm is the largest, the dehydration of PEM and catalyst layer would be smaller compared with the thinner s.t. cases, even A40%RH/C40%RH, which is a dry condition. Consequently, the current density in case of using s.t. of 2.0 mm is the highest among the different s.t. At Tini = 373 K, the current densities in case of using s.t. of 1.5 mm and 1.0 mm are very low. The dehydration of PEM and catalyst layer causes the reduction in the performance of H2 oxidization as well as O2 reduction, resulting in large ohmic and activation over-potential. As a result, the current densities in case of using s.t. of 1.5 mm and 1.0 mm become lower. Table 5 and Table 6 list the ohmic resistance and the reaction and diffusion resistance in case of s.t. = 2.0 mm, 1.5 mm and 1.0 mm obtained by the impedance measurement conducted in the authors’ previous experimental study [18]. According to Table 5 and Table 6, comparing the ohmic resistance, the reaction and diffusion resistance for s.t. = 2.0 mm with those for s.t. = 1.5 mm and 1.0 mm, it is known that the ohmic resistance, the reaction and diffusion resistance for s.t. = 2.0 mm are smaller than those for s.t. = 1.5 mm and 1.0 mm relatively. Therefore, it can be claimed that the current density in case of using s.t. of 2.0 mm is the highest among the various s.t. due to small ohmic and activation over-potential.
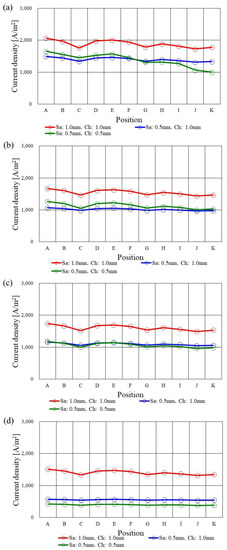
Figure 11.
Current density along with the gas channel on the interface between PEM and catalyst layer at the cathode among various s.t. at Tini = 353 K. (a) A80%RH/C80%RH, (b) A80%RH/C40%RH, (c) A40%RH/C80%RH, (d) A40%RH/C40%RH.
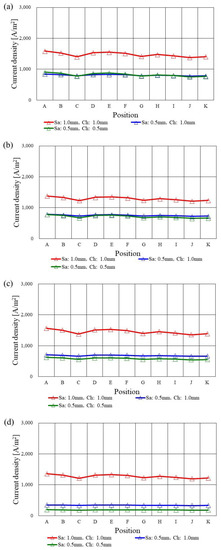
Figure 12.
Current density along with the gas channel on the interface between PEM and catalyst layer at the cathode among various s.t. at Tini = 363 K. (a) A80%RH/C80%RH, (b) A80%RH/C40%RH, (c) A40%RH/C80%RH, (d) A40%RH/C40%RH.
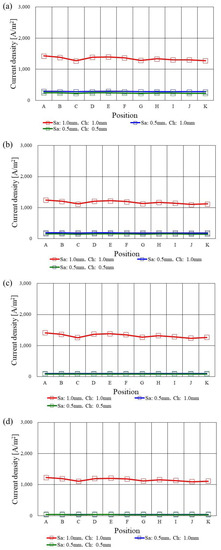
Figure 13.
Current density along with the gas channel on the interface between PEM and catalyst layer at the cathode among various s.t. at Tini = 373 K. (a) A80%RH/C80%RH, (b) A80%RH/C40%RH, (c) A40%RH/C80%RH, (d) A40%RH/C40%RH.
Table 5.
Comparison of the ohmic resistance among various s.t. changing Tini and RH of supply gas.
Table 6.
Comparison of the reaction and diffusion resistance among various s.t. changing Tini and RH of supply gas.
According to the experimental study investigating the impact of separator thickness on the power generation performance, i.e., the evaluation by the polarization curve, at a higher temperature, i.e., 363 K and 373 K [18], the power generation performance in the case of using s.t. of 2.0 mm is higher than that using s.t. of 1.5 mm and 1.0 mm. It is easy to dehydrate PEM under high-temperature operation conditions. The heat capacity in case of using s.t. of 2.0 mm is larger, resulting in the dehydration of PEM and catalyst layer being smaller compared with the thinner s.t. cases. Consequently, we can confirm that the power generation performance in case of using s.t. of 2.0 mm is higher compared to that using s.t. of 1.5 mm and 1.0 mm.
According to the authors’ previous study [30], it is known that the thinner thickness of PEM and GDL is better for obtaining higher power generation performance under higher temperature operation conditions. It is because the mass transfer, the electron and the proton conductivity are promoted with the decrease in thickness of PEM and GDL. However, it is revealed from this study that the thickness of the separator can be optimized based on the thermal properties of the separator. In other words, the optimization procedure of thickness is different among PEM, GDL and separator. They are new findings and valuable results to design the component of HTPEFC.
3.5. Comparison with the Other Studies and Future Work
This study compares the I–V experimental data [18] and the total current of a whole single cell summarizing the current density at each position obtained by the numerical simulation in this study. In this study, the voltage obtained by the power generation experiment and the earth ground was set at the cathode electrode and the anode electrode, respectively, as the boundary condition following the assumption as same as the authors’ previous studies [26,43]. Therefore, the voltage is the same between the numerical simulation and the experiment. In the experiment, the constant current is loaded, resulting in the total voltage corresponding to the loaded current being obtained. In the authors’ experimental study [18], the current was set at 20 A (= 0.80 A/cm2). In the numerical simulation in this study, the local current density is calculated by setting the voltage difference between the cathode electrode and the anode electrode, as explained above. In the experimental study, it was very challenging to measure the in-plane distributions of voltage and temperature at the same time. Therefore, the in-plane distribution of voltage was not obtained. Consequently, the constant voltage, which was the same as the total voltage obtained by the authors’ experimental study [18] under each experimental condition, was set at every position as the voltage difference between the cathode electrode and the anode electrode in single-cell for the numerical simulation in this study. The total voltage and the total current obtained by the numerical simulation in this study and the authors’ previous experimental study [18] are listed in Table 7, Table 8 and Table 9.
Table 7.
Comparison of total voltage and total current between the numerical simulation in this study and the authors’ previous experimental study at 353 K [18].
Table 8.
Comparison of total voltage and total current between the numerical simulation in this study and the authors’ previous experimental study at 363 K [18].
Table 9.
Comparison of total voltage and total current between the numerical simulation in this study and the authors’ previous experimental study at 373 K [18].
It is seen from Table 7, Table 8 and Table 9 that there is a current difference between the numerical simulation in this study and the authors’ previous experimental study [18]. It might be influenced by the assumption setting the constant voltage at every position in a single cell in the numerical simulation in this study. It is thought that the voltage has an in-plane distribution actually causing the impact on the value of current density at each position. As described above, though it is very challenging to measure the in-plane distributions of voltage and temperature at the same time, the authors would like to try it in the near future. In addition, this study assumed the isothermal condition for the numerical simulation. Since it is thought that the temperature distribution influences the current density distribution [52], the authors are going to investigate the numerical simulation under the non-isothermal condition to compare the numerical simulation results obtained under the isothermal condition as well as the experimental results in the near future.
The previous 3D numerical simulation study was conducted to clarify the distributions of H2, O2 and current density in single channel flow of HTPEFC changing the channel configuration [16]. According to this report, the molar concentration of O2 decreased from the inlet to the outlet along the gas channel. In addition, the current density on the surface of PEM also decreased from the inlet to the outlet along the gas channel.
These results are similar to the results shown in this study. However, these results were obtained by one straight channel model, not a serpentine flow channel model. Therefore, the rapid decrease in the molar concentration of O2 was not observed in this reference [16], while it is observed at the corner parts of the separator in this study. The other previous 3D numerical simulation study was conducted to clarify the distributions of H2, O2 and H2O in single channel flow of HTPEFC by COMSOL Multiphysics [23]. According to this report, the molar concentration of O2 decreased from the inlet to the outlet along the gas channel. In addition, the molar concentration of H2O increased from the inlet to the outlet along through gas channel. These results are similar to the results shown in this study. However, these results were obtained by one straight channel model, not a serpentine flow channel model. Therefore, it was not observed that the rapid decrease in the molar concentration of O2 as well as the rapid increase in the molar concentration of H2O in this reference [23], while they are observed at the corner of the separator in this study.
In the numerical simulation in this study, the isothermal condition was assumed as same as the authors’ previous study [29]. The authors would like to calculate the temperature distribution in the cell by the numerical simulation and comparing the simulation results with the experimental data obtained in the authors’ previous study [18] in the near future.
4. Conclusions
This study has examined the effect of s.t. on the distributions of mass such as H2, O2, H2O and current density on the interface between the PEM and catalyst layer at the anode side and the cathode side in a single cell of PEFC at Tini = 353 K, 363 K and 373 K. The 3D numerical simulation model has been developed, and the analysis has also been carried out for different RH of supply gases. The following conclusions have been found after doing the investigations on the obtained results:
- (i)
- The molar concentration of H2 keeps approximately the same value along with the gas flow except for in the case of using s.t. of 1.0 mm.
- (ii)
- Regarding s.t. of 1.0 mm, the molar concentration of H2 drops at the points of C, E, G, I and K since the velocity and concentration of H2 in the gas channel is high due to the smaller cross-sectional area of the gas channel. The molar concentration of H2 is smaller compared with the other s.t. cases at Tini = 363 K and 373 K.
- (iii)
- The molar concentration of O2 decreases along with the gas channel at Tini = 353 K and 363 K, while the molar concentration of O2 decreases at the analysis points of C and G especially due to accumulating H2O there.
- (iv)
- The molar concentration of O2 in the case of using s.t. of 2.0 mm is smaller compared with the thinner separator cases at Tini = 373 K, which can also be observed for A40%RH/C40%RH regardless of Tini. Since the catalyst layer is relatively humidified in the case of using s.t. of 2.0 mm because of the large heat capacity, the O2 reduction reaction in the catalyst layer at the cathode progressed well compared with the other s.t.
- (v)
- The molar concentration of H2O decreases at the points of C, G, J and K since H2O accumulates there.
- (vi)
- The molar concentration of H2O keeps a low value along with the gas channel at Tini = 373 K in the case of using s.t. of 1.5 mm and 1.0 mm due to the decrease in the performance of O2 reduction reaction.
- (vii)
- The current density decreases along with the gas channel since the concentration of H2 and O2, which is a driving force to diffuse toward the catalyst layer, decreases along with the gas channel.
- (viii)
- The current density in case of using s.t. of 2.0 mm is the highest among the various s.t. irrespective of Tini, which is the most remarkable for A40%RH/C40%RH. It can be thought that the dehydration of PEM and electrode would be smaller compared with the other s.t. cases.
- (ix)
- At Tini = 373 K, the current densities in case of using s.t. of 1.5 mm and 1.0 mm are very low since the dehydration of PEM and catalyst layer causes the reduction in the performance of H2 oxidization as well as O2 reduction, providing large ohmic and activation over-potential.
- (x)
- From the viewpoint of PEFC manufacturing, this study has revealed that the thickness of the separator is optimized based on the thermal properties of the separator. In addition, this study has revealed that the optimization procedure of thickness is different among PEM, GDL and separator.
Author Contributions
Conceptualization and writing—original draft preparation, A.N.; methodology and software, D.M. and K.T.; data curation, S.I.; writing—review and editing, M.L.K. All authors have read and agreed to the published version of the manuscript.
Funding
This research was funded by Mie University.
Data Availability Statement
Not applicable.
Conflicts of Interest
The authors declare no conflict of interest.
References
- NEDO (New Energy and Industry Technology Development Organization). Available online: https://www.nedo.go.jp/content/100871973 (accessed on 7 December 2022). (In Japanese)
- Zhang, G.; Kandlikar, S.G.A. Critical Review of Cooling Technique in Proton Exchange Membrane Fuel Cell Stacks. Int. J. Hydrogen Energy 2012, 37, 2412–2429. [Google Scholar] [CrossRef]
- Agbossou, K.; Kolhe, M.; Hamelin, J.; Bose, T.K. Performance of a Stand-Alone Renewable Energy System Based on Energy Storage as Hydrogen. IEEE Trans. Energy Convers. 2004, 19, 633–640. [Google Scholar] [CrossRef]
- Zhang, J.; Zhang, C.; Hao, D.; Ni, M.; Huang, S.; Liu, D.; Zheng, Y. 3D Non-isothermal Dynamic Simulation of High Temperature Proton Exchange Membrane Fuel Cell in Start-up Process. Int. J. Hydrogen Energy 2021, 46, 2577–2593. [Google Scholar] [CrossRef]
- Li, Q.; He, R.; Jensen, J.O.; Bjerrum, N.J. Approaches and Recent Development Polymer Electrolyte Membrane for Fuel Cells Operating above 100 °C. Chem. Mater. 2003, 15, 4896–4915. [Google Scholar] [CrossRef]
- Lee, C.Y.; Wng, F.; Kuo, Y.W.; Tsai, C.H.; Cheng, Y.T.; Cheng, C.K.; Lin, J.T. In-situ Measurement of High-temperature Proton Exchange Membrane Fuel Cell Stack Using Flexible Five-in-one Micro Sensor. Sensors 2016, 16, 1731. [Google Scholar] [CrossRef]
- Lee, C.Y.; Weng, F.B.; Kuo, Y.W.; Cheng, Y.T.; Cheng, C.K.; Tsai, C.H.; Lee, T.J. Persistent Effect Test for High Temperature Resistant Integrated Microsensor Embedded in High Temperature Proton Exchange Membrane Fuel Cell Stack. Sens. Actuators A Phys. 2016, A250, 202–209. [Google Scholar] [CrossRef]
- Ryu, S.K.; Vinothkannan, M.; Kim, A.R.; Yoo, D.J. Effect of Type and Stoichiometry of Fuels on Performance of Polybenzimidazole-based Proton Exchange Membrane Fuel Cells Operating at the Temperature Range of 120–160 °C. Energy 2022, 238, 121791. [Google Scholar] [CrossRef]
- Budak, Y.; Devrim, Y. Micro-cogeneration Application of a High-temperature PEM Fuel Cell Stack Operated with Polybenzimidazole Based Membranes. Int. J. Hydrogen Energy 2022, 45, 35198–35207. [Google Scholar] [CrossRef]
- Zhang, J.; Wang, H.; Li, W.; Zhang, J.; Lu, D.; Yan, W.; Xiang, Y.; Lu, S. Effect of Catalyst Layer Microstructure on Performance and Stability for High Temperature Polymer Electrolyte Membrane Fuel Cells. J. Power Source 2021, 505, 230059. [Google Scholar] [CrossRef]
- Kim, D.K.; Kim, H.; Park, H.; Oh, S.; Ahn, S.H.; Kim, H.J.; Kim, S.K. Performance enhancement of high-temperature polymer electrolyte membrane fuel cells using Pt pulse electrodeposition. J. Power Source 2019, 438, 227022. [Google Scholar] [CrossRef]
- Kanchan, B.K.; Randive, P.; Pati, S. Implications of Non-uniform Porosity Distribution in Gas Diffusion Layer on the Performance of a High Temperature PEM Fuel Cell. Int. J. Hydrogen Energy 2021, 46, 18571–18588. [Google Scholar] [CrossRef]
- Xia, L.; Ni, M.; He, Q.; Xu, Q.; Cheng, C. Optimization of Gas Diffusion Layer in High Temperature PEMFC with the Focuses on Thickness and Porosity. Appl. Energy 2021, 300, 117357. [Google Scholar] [CrossRef]
- Agarwal, H.; Thosar, A.U.; Bhat, S.D.; Lele, A.K. Interdigitated Flow Field Impact on Mass Transport and Electrochemical Reaction in High-temperature Polymer Electrolyte Fuel Cell. J. Power Source 2022, 532, 231319. [Google Scholar] [CrossRef]
- Xia, L.; Xu, Q.; He, Q.; Ni, M.; Seng, M. Numerical Study of High Temperature Proton Exchange Membrane Fuel Cell (HT-PEMFC) with a Focus on Rib Design. Int. J. Hydrogen Energy 2021, 46, 21098–21111. [Google Scholar] [CrossRef]
- Huang, T.; Wang, W.; Yuan, Y.; Huang, J.; Chen, X.; Zhang, J.; Kong, X.; Zhang, Y.; Wan, Z. Optimization of High-temperature Proton Exchange Membrane Fuel Cell Flow Channel Based on Genetic Algorithm. Energy Rep. 2021, 7, 1374–1384. [Google Scholar] [CrossRef]
- Hoppe, E.; Janssen, H.; Muller, M.; Lehnert, W. The Impact of Flow Field Plate Misalignment on the Gas Diffusion Layer Intrusion and Performance of a High-temperature Polymer Electrolyte Fuel. J. Power Source 2021, 501, 230036. [Google Scholar] [CrossRef]
- Nishimura, A.; Kojima, Y.; Ito, S.; Hu, E. Impacts of Separator Thickness on Temperature Distribution and Power Generation Characteristics of a Single PEMFC Operated at Higher Temperature of 363 and 373 K. Energies 2022, 15, 1558. [Google Scholar] [CrossRef]
- Nishimura, A.; Kono, N.; Toyoda, K.; Mishima, D.; Kolhe, M.L. Impact of Separator Thickness on Temperature Distribution in Single Cell of Polymer Electrolyte Fuel Cell Operated at Higher Temperature of 90 °C and 100 °C. Energies 2022, 15, 4203. [Google Scholar] [CrossRef]
- Nanadegani, F.S.; Lay, E.N.; Sunden, B. Computational Analysis of the Impact of a Micro Porous Layer (MPL) on the Characteristics of a High Temperature PEMFC. Elecrochim. Acta 2020, 333, 135552. [Google Scholar] [CrossRef]
- Zhang, G.; Wu, L.; Qin, Z.; Wu, J.; Xi, F.; Mou, G.; Wang, Y.; Jiao, K. A Comprehensive Three-dimensional Model Coupling Channel Multi-phase Flow and Electrochemical Reactions in Proton Exchange Membrane Fuel Cell. Adv. Appl. Energy 2021, 2, 100033. [Google Scholar] [CrossRef]
- Zhang, T.; Li, J.; Li, Q.; Yu, M.; Sun, H. Combination Effects of Flow Field Structure and Assembly Force on Performance of High Temperature Proton Exchange Membrane Fuel Cells. Int. J. Energy Res. 2021, 45, 7903–7917. [Google Scholar] [CrossRef]
- Das, S.K.; Gibson, H.A. These Dimensional Multi-Physics Modeling and Simulation for Assessment of Mass Transport Impact on the Performance of a High Temperature Polymer Electrolyte Membrane Fuel Cell. J. Power Source 2021, 499, 161–188. [Google Scholar] [CrossRef]
- Panesi, A.R.Q.; Silva, R.P.; Cunha, E.F.; Korkischko, I.; Santiago, E.I. Three-dimensional CFD Modeling of H2/O2 HT-PEMFC Based on H3PO4-doped PBI Membranes. Ionics 2021, 27, 3461–3475. [Google Scholar] [CrossRef]
- Penga, Z.; Tolj, I.; Barbir, F. Computational Fluid Dynamics Study of PEM Fuel Cell Performance. Int. J. Hydrogen Energy 2016, 41, 17585–17594. [Google Scholar] [CrossRef]
- Nishimura, A.; Toyoda, K.; Kojima, Y.; Ito, S.; Hu, E. Numerical Simulation on Impacts of Thickness of Nafion Series Membranes and Relative Humidity on PEMFC Operated at 363 K and 373 K. Energies 2021, 14, 8256. [Google Scholar] [CrossRef]
- Nishimura, A.; Kamiya, S.; Okado, T.; Sato, Y.; Hirota, M.; Kolhe, M.L. Heat and Mass Transfer Analysis in Single Cell of PEFC Using Different PEM and GDL at Higher Temperature. Int. J. Hydrogen Energy 2019, 44, 29631–29640. [Google Scholar] [CrossRef]
- Nishimura, A.; Okado, T.; Kojima, Y.; Hirota, M.; Hu, E. Impact of MPL on Temperature Distribution in Single Polymer Electrolyte Fuel Cell with Various Thickness of Polymer Electrolyte Membrane. Energies 2020, 13, 2499. [Google Scholar] [CrossRef]
- Copper, N.J.; Santamaria, A.D.; Becton, M.K.; Park, J.W. Neutron Radiography Measurements of In-situ PEMFC Liquid Water Saturation in 2D & 3D Morphology Gas Diffusion Layers. Int. J. Hydrogen Energy 2017, 42, 16269–16278. [Google Scholar]
- The Japan Society of Mechanical Engineers. JSME Heat Transfer Handbook, 1st ed.; The Japan Society of Mechanical Engineers; Maruzen: Tokyo, Japan, 1993; p. 387. [Google Scholar]
- Nishimura, A.; Yamamoto, K.; Okado, T.; Kojima, Y.; Hirota, M.; Kolhe, M.L. Impact Analysis of MPL and PEM Thickness on Temperature Distribution within PEFC Operating at Relatively Higher Temperature. Energy 2020, 205, 117875. [Google Scholar] [CrossRef]
- Freunberger, S.A.; Reum, M.; Evertz, J.; Wokuan, A.; Buchi, F.M. Measuring the Current Distribution in PEFCs with Sub-Millimeter Resolution. J. Electrochem. Soc. 2006, 153, A2158–A2165. [Google Scholar] [CrossRef]
- Nishimura, A.; Sato, A.; Yoshimura, M.; Kamiya, S.; Hirota, M. Impact of Thickness of Polymer Electrolyte Membrane on Temperature Distribution in Single Cell of Polymer Electrolyte Fuel Cell Operated at High Temperature. J. Energy Power Eng. 2018, 12, 80–92. [Google Scholar] [CrossRef][Green Version]
- Nishimura, A.; Shibuya, K.; Morimoto, A.; Tanaka, S.; Hirota, M.; Nakamura, M.; Kojima, Y.; Narita, M.; Hu, E. Dominant Factor and Mechanism of Coupling Phenomena in Single Cell of Polymer Electrolyte Fuel Cell. Appl. Energy 2012, 1, 73–79. [Google Scholar] [CrossRef]
- Bit Tech. Product Catalog; Bit Tech.: Gosyogawara, Japan, 2008; p. 1. [Google Scholar]
- Reid, R.C.; Prausnitz, J.M.; Poling, B.E. The Properties of Gases and Liquids, 1st ed.; McGraw-Hill: New York, NY, USA, 1987; p. 591. [Google Scholar]
- Merck. Available online: http://www.sigmaaldrich.com/japan/materialscience/alternative/nafion.html (accessed on 5 November 2021).
- Senn, S.M.; Poulikakos, D. Polymer Electrolyte Fuel Cells with Porous Materials as Fluid Distributors and Comparisons with Traditional Channeled Systems. Trans. ASME 2004, 126, 410–418. [Google Scholar] [CrossRef]
- Kang, K.; Ju, H. Numerical Modeling and Analysis of Micro-porous Layer Effects in Polymer Electrolyte Fuel Cells. J. Power Source 2006, 194, 763–773. [Google Scholar] [CrossRef]
- TORAY. Available online: http://www.torayca.com/en/lineup/composites/com_009_01.html (accessed on 5 November 2021).
- Takayama, T. Numerical Simulation of Transient Internal States of PEFC Cell and Stack Considering Control of Anode System. Res. Rep. Mizuho Res. Technol. 2018, 9, 1–14. [Google Scholar]
- Rostami, L.; Nejad, P.M.G.; Vatani, A. A Numerical Investigation of Serpentine Flow Channel with Different Bend Sizes in Polymer Electrolyte Membrane Fuel Cells. Energy 2016, 97, 400–410. [Google Scholar] [CrossRef]
- Nishimura, A.; Toyoda, K.; Mishima, D.; Ito, S.; Hu, E. Numerical Analysis on Impact of Thickness of PEM and GDL with and without MPL on Coupling Phenomena in PEFC Operated at Higher Temperature Such as 363 K and 373 K. Energies 2022, 15, 5936. [Google Scholar] [CrossRef]
- Xing, L.; Das, P.K.; Song, X.; Mamlouk, M.; Scott, K. Numerical Analysis of the Optimum Membrane/Ionomer Water Content of PEMFCs: The Interface of Nafion Ionomer Content and Cathode Relative Humidity. Appl. Energy 2015, 138, 242–257. [Google Scholar] [CrossRef]
- Quan, P.; Lai, M.C. Numerical study of water management in the air flow channel of a PEM fuel cell cathode. J. Power Source 2007, 164, 222–237. [Google Scholar] [CrossRef]
- Jiao, K.; Park, J.; Li, X. Experimental investigation on liquid water removal from the gas diffusion layer by reaction flow in PEM fuel cell. Appl. Energy 2010, 87, 2770–2777. [Google Scholar] [CrossRef]
- Wong, C.Y.; Wong, W.Y.; Ramya, K.; Khalid, M.; Loh, K.S.; Daud, W.R.W.; Lim, K.L.; Walvekar, R.; Kadhum, A.A.H. Additives in proton exchange membranes for low- and high-temperature fuel cell applications: A review. Int. J. Hydrogen Energy 2019, 44, 6116–6135. [Google Scholar] [CrossRef]
- Salomov, U.R.; Chiavazzo, E.; Fasano, M.; Asinari, P. Pore- and macro-scale simulations of high temperature proton exchange fuel cells—HTPEMFC—And possible strategies for enhancing durability. Int. J. Hydrogen Energy 2017, 42, 26730–26743. [Google Scholar] [CrossRef]
- Nishimura, A.; Yoshimura, M.; Kamiya, S.; Hirota, M.; Hu, E. Impact of relative humidity of supply gas on temperature distributions in single cell of polymer electrolyte fuel cell when operated at high temperature. J. Energy Power Eng. 2017, 11, 706–718. [Google Scholar] [CrossRef][Green Version]
- Akimoto, F.; Sasabe, T.; Yoshida, T.; Naito, H.; Kawamura, K.; Hirai, S. Investigation of Effects of High Temperature and Pressure on a Polymer Electrolyte Fuel Cell with Polarization Analysis and X-ray Imaging of Liquid Water. J. Power Source 2019, 431, 205–209. [Google Scholar]
- Jia, T.; Shen, S.; Zhao, J.; Jin, J.; Pan, B.; Duan, X.; Meng, C.; Che, Q. Ultrathin Membranes Formation via the Layer by Layer Self-assembly of Carbon Natotubes-based Inorganics as High Temperature Proton Exchange Membranes. Int. J. Hydrogen Energy 2020, 45, 14517–14527. [Google Scholar] [CrossRef]
- He, G.; Yamazaki, Y.; Abudula, A. A Three-dimensional Analysis of the Effect of Anisotropic Gas Diffusion Layer (GDL) Thermal Conductivity on the Heat Transfer and Two-phase Behavior in a Proton Exchange Membrane Fuel Cell (PEMFC). J. Power Source 2010, 195, 1551–1560. [Google Scholar] [CrossRef]


Disclaimer/Publisher’s Note: The statements, opinions and data contained in all publications are solely those of the individual author(s) and contributor(s) and not of MDPI and/or the editor(s). MDPI and/or the editor(s) disclaim responsibility for any injury to people or property resulting from any ideas, methods, instructions or products referred to in the content. |
© 2023 by the authors. Licensee MDPI, Basel, Switzerland. This article is an open access article distributed under the terms and conditions of the Creative Commons Attribution (CC BY) license (https://creativecommons.org/licenses/by/4.0/).