1. Introduction
The last decades have witnessed the rapid development of grid-connected renewable energy power, which has emerged as one of the most promising and widely adopted worldwide [
1]. The integration of renewable energy sources, such as hydro, wind, and solar, has offered a range of advancements for sustainable energy generation and environmental benefits [
2]. However, the increasing penetration of renewable energy power introduces new complexities that impact the stability and control of power systems [
3,
4,
5]. Addressing these challenges necessitates the development of high-fidelity models.
Large renewable power plants typically comprise numerous generation units, often numbering in the dozens or even hundreds. Unlike conventional synchronous generators, these units have smaller individual capacities but a greater overall volume. While traditional modeling methods might involve creating a high-accuracy model for each unit, applying the same approach to renewable power plants presents challenges. Because wind or solar generation units rely heavily on electronic interfaces, operating on short timescales [
6]. This not only places a significant computational burden on simulation resources but also extends the simulation time. Primarily, it is tremendously time-consuming for electrical-magnetic simulations when there are hundreds of units.
As the trend to large-scale grids continues, applying the dynamics equivalent method to strike a delicate balance between accuracy and efficiency becomes increasingly crucial. Dynamic equivalence offers a powerful technique to significantly reduce the complexity of the original system while ensuring that the retained components maintain relevant and similar dynamic characteristics. This method has found extensive utility in simulations for large-scale AC/DC power systems. Ref. [
7] have effectively harnessed dynamic equivalence to substantially decrease the scale of grids, resulting in significant time and resource savings. It is important to note that the primary focus of dynamic equivalence has traditionally been on synchronous generators and AC networks. Ref. [
8] introduces the coherency-based dynamic equivalence for synchronous generators. This approach has gained widespread acceptance owing to its sound physical underpinnings. The rotor angles of individual synchronous generators are indicative of critical dynamics. When subjected to contingencies, variations in the rotor angle curves of synchronous generators highlight individual movements. These comparable tendencies or responses observed in these rotor angle variations can be interpreted as coherent criteria [
9].
Nevertheless, a notable gap arises when directly applying the traditional dynamic equivalent method, like the coherency-based one, to renewable power plants. This disparity is primarily attributed to stochastic, intermittent, and variable characteristics of renewable energy generation [
10,
11]. These inherent characteristics collectively give rise to challenges when seeking to effectively aggregate and model renewable power plants within the coherency-based framework of dynamic equivalence. The distinctive features of renewable generation units, such as converters, wind turbines, and solar panels, set them apart from traditional generators. Unlike synchronous generators, renewable units lack critical attributes like rotor angles that are central to coherency-based dynamic equivalences. Instead, electronic interfaces heavily influence their behavior, emphasizing converter control strategies and focusing more on electrical state dynamics than mechanical ones.
Dynamic equivalences of renewable power plants can be categorized into two distinct approaches: the single-unit and multi-unit methods [
12]. The single-unit method entails the utilization of a solitary equivalent unit to represent the entire power plant, thereby streamlining the dynamic representation process. The single-unit approach can be seen as a special case of the multi-unit approach. This approach employs a unified model to capture the aggregate behavior within the power plant. In cases where the scale of renewable power plants remains relatively modest, characterized by limited area, environments, and near-identical working conditions, the differences between individual units may be negligible. Consequently, the adoption of a single-unit approach becomes a viable option. While this method offers computational efficiency, it relies on the assumption that all units within this power plant should exhibit almost identical dynamics. However, this assumption can lead to substantial equivalent errors when the operating conditions of individual units significantly differ, such as due to varying environmental factors or diverse working conditions characterized within a large-scale power plant [
13].
In contrast, the multi-unit method has been introduced to overcome these limitations [
14,
15,
16]. Its concept shares similarities with the coherency-based equivalence method. In the multi-unit method, units are grouped based on similar operating conditions, and each group is then aggregated separately. This approach preserves characteristics while achieving scale reduction and computational efficiency. By acknowledging the unique dynamics of each group, the multi-unit method offers a more accurate representation of the power plant behavior under diverse operating scenarios, making it valuable for modeling a large-scale renewable power plant with complex and varying dynamics. Extensive research is underway within this field. For example, Ref. [
14] reviews dynamic equivalent modeling of large photovoltaic power plants and compares various multi-unit equivalent methods. Ref. [
15] proposed a novel clustering method for wind farms in urban grids, which satisfies both steady-state and dynamic consistency. Ref. [
16] replaces a separate local low-voltage network with an equivalent generator in parallel with the load and fixed shunt while ensuring the original strength of the AC system and mitigating voltage deviations.
Current research has directed their attention toward investigating clustering indices or algorithms for renewable plants [
17]. Notably, reducing the collector network and optimizing aggregated parameters, particularly within a large-scale plant, constitute a similarly crucial aspect. Yet, this facet requires consideration within the framework of dynamic equivalence for a renewable power plant.
The research discussed above predominantly centers on characterizing object attributes and adhering to physical laws, ultimately culminating in models based on Differential-Algebraic Equations (DAE) [
18,
19]. Remarkably, the landscape of power systems has been dramatically reshaped through the amalgamation of machine learning [
18], data science [
20], advanced data-driven techniques [
21], and artificial intelligence (AI) [
22], among other innovations.
An intriguing advancement in this field involves the application of novel methods for clusters of renewable generation units. Some algorithms like the K-means algorithm [
23], density peak clustering algorithm [
24], and fuzzy clustering algorithm [
25,
26] have been recently employed in [
23,
24,
25,
26]. These algorithms have unveiled fresh perspectives on the processing and clustering of generation units, offering new insights and potential avenues for refining the multi-unit dynamic equivalence approach for renewable power plants. However, it is essential to acknowledge that these innovative endeavors are not without their limitations. On the one hand, the identification of pivotal attributes or features within a renewable power plant assumes paramount significance for these methods. On the other hand, methods such as K-means and fuzzy-C-means require a predefined definition of clustering centers. These techniques are sensitive to the chosen initial values and prone to converging towards local optima. Consequently, these methods often necessitate multiple runs to identify the optimal solution, requiring voluminous datasets for renewable power plants. Comparisons for dynamic equivalence techniques are listed in
Table 1.
Inspired by the above research, this paper actively explores the dynamic equivalent method for a large-scale renewable power plant. The core idea underlying this approach involves extracting feature quantities from the data of renewable generation units. Central to this method is incorporating the degree of similarity and data-driven techniques. The application characterizes the distinct feature quantities associated with renewable generation units. This involves clustering these units into different groups based on a calculated degree of similarity. Complementing this, the data-driven aspect of the approach capitalizes on the wealth of operational data collected from the varied conditions experienced by renewable generation units across a spectrum of scenarios.
The key contributions and advantages of this paper are outlined in the following:
- (1)
This paper introduces a data-driven degree of similarity method for constructing the equivalent model of large-scale renewable power plants. It provides a versatile framework applicable to various renewable power plants and operational modes, showcasing adaptability and broad applicability.
- (2)
By assessing the degree of similarity between renewable generation units, hierarchical clustering is proposed that efficiently groups numerous units into distinct clusters for equivalence. This method can lead to substantial time and resource savings in simulations due to the reduction of the computational complexity of modeling, thereby significantly streamlining the modeling process for large-scale renewable plants.
- (3)
Both parameters for each aggregated cluster and the collector network, ensuring the faithful preservation of the original dynamic characteristics, are meticulously addressed. These concerted efforts culminate in an equivalent representation of a renewable power plant. The effectiveness of this proposed method is validated through rigorous numerical simulations.
The rest of this paper is organized as follows.
Section 2 describes the problems of dynamic equivalent for renewable power plants.
Section 3 details the proposed data-driven degree of similarity method to tackle clusters of units.
Section 4 introduces the aggregation of model parameters.
Section 5 presents numerical simulation results on the practical wind farms for verification. Conclusions are finally drawn in
Section 6.
2. Problem Setup
This line of this research was catalyzed in the early 1970s. Researchers such as Podmore, Kokotovic, and Joe H. Chow [
27], have made significant contributions, propelling rapid advancements in this field. Many equivalent techniques for equivalent reduction applications have been proposed, and advanced techniques are still being developed. The dynamic equivalent methodology can usually be categorized into coherency and aggregation, linear or nonlinear input–output, phasor measurement-based methods, etc. Meanwhile, the aim of striking a balance between accuracy and computational efficiency never changes.
It is interesting to note that early research primarily focused on physics-based modeling, emphasizing in-depth exploration of the physical attributes of objects. For instance, Podmore’s work centered around the concept of coherency based on generator rotor angles. At the same time, Kokotovic uncovered a relationship linking weak connections between coherent areas and the slow inter-area modes.
The core idea of the above work is still attractive, while changes, challenges, and opportunities following the renewable power plants warrant further exploration and investment.
2.1. Changes and Challenges
The undertaking of dynamic equivalence modeling within a renewable power plant necessitates a perceptive grasp of the distinct attributes of various components and numerous operational scenarios. This task assumes the nature of a philosophical art: extracting critical and succinct features from the individual states of renewable generation units, subsequently shaping a unified and steadfast aggregated state that mirrors the entirety of this plant.
- (1)
Changes in dynamics
Renewable power plants, such as wind and solar, exhibit inherent intermittency and variability due to factors like changing weather conditions. Unlike synchronous generators, whose output is governed by mechanical rotation, renewable generation units rely on power electronic converters. The control strategies of these converters dictate how they switch on and off to regulate the electrical states and adjust the power output. As a result, considerable power fluctuations or voltage deviations can be observed following disturbances or changes in operational points.
However, traditional modeling techniques often rely on static or quasi-static assumptions, which assume predictable states and may not adequately capture the rapid and dynamic changes inherent in renewable energy generation. We believe that the variability from renewable energy poses a challenge for equivalent modeling. To overcome this, there is a critical need to identify physical states or attributes that contribute to a comprehensive understanding of the dynamics of renewable energy generation. Such identification would pave the way for developing more robust models that can better represent renewable power plants.
- (2)
Challenges in identifying critical attributes
As discussed earlier, the coherency-based method, for instance, relies on the behaviors of generator rotor angles. It can apply to renewable power plants operating in the grid-forming mode, which behave as virtual synchronous generators. Nevertheless, a notable challenge arises when applying this method to renewable power plants operating in grid-following mode. In such cases, the absence of well-defined rotor angles limits the method’s applicability.
This absence of well-defined rotor angles presents a unique obstacle that requires alternative approaches. Researchers have endeavored to construct critical states for renewable power plants utilizing grid-following mode. In our previous work [
28], we have successfully derived an equivalent power angle (EPA) based on stator-flux equations to represent the dynamic characteristics of a Doubly Fed Induction Generator (DFIG), akin to the rotor angle used for synchronous generators. This EPA allows us to effectively capture and analyze the dynamic behavior of the DFIG, making it suitable for integration into coherency-based methods for DFIGs. However, it is essential to acknowledge that this derivation cannot be directly applied to Permanent Magnet Synchronous Generators (PMSG) or PV systems, as they utilize full-scale converters with distinct structures and operating characteristics. From a grid perspective, the dc-link, machine/grid side converters isolate the dynamics from PMSG or PV array. This also results in non-inertia response and damping characteristics, unlike synchronous generators.
Given these differences, it becomes imperative to develop alternative approaches that can offer a versatile framework without being tailored to certain renewable power plants or operational modes.
2.2. A Promising Solution
Physics-driven modeling and data-driven modeling are two primary approaches in the realm of modeling, each bearing its own set of strengths and limitations. The above research primarily emphasizes physics-based modeling grounded in fundamental physical laws and equations. This approach precisely portrays system mechanics, elucidating system behavior and unveiling intrinsic mechanisms and correlations within the system. However, physics-driven modeling entails challenges, including the necessity for accurate system parameters and initial conditions, which can be challenging to acquire and may introduce uncertainties in real-world applications. Moreover, these models might occasionally overlook intricate nonlinear relationships and random influences, posing a dilemma between model accuracy and adaptability in complex scenarios.
Concurrently, data-driven modeling has recently gained substantial traction in academics and industries. This approach proves invaluable applications, such as load forecasting, renewable energy generation prediction, etc. It relies on statistics or machine learning, utilizing abundant field data to construct models without requiring detailed engineering documentation. By harnessing the vast amounts of data generated from various sources, we can develop comprehensive models that capture the intricate dynamics and interactions of the complex network. High-resolution datasets, augmented computational capabilities, and reduced computing costs bolster research in this field. Data-driven modeling particularly shines when dealing with high-dimensional data, nonlinearity, and real-time demands. Nevertheless, these models are often referred to as “black-box” models, as they might lack direct explanations tied to the intrinsic mechanisms governing the system.
Maintaining a balanced perspective is crucial. Data alone cannot entirely replace the necessity of physical modeling. When harmoniously merged with a well-informed and comprehensive understanding of the physical phenomenon and its limitations, the fusion of data and physics-based approaches can yield effective and robust solutions. The synergy between these methodologies, indicative of an emerging trend within the modeling domain, holds the promise of yielding more substantial outcomes in both theoretical exploration and practical application.
2.3. Core Idea
Based on the structural characteristics and operational conditions of renewable energy generator units, it becomes evident that the active power, reactive power, and voltage of these units are physical quantities reflecting their states. However, representing the dominant dynamics of these renewable generator units only with a single variable from these quantities is not straightforward. Additionally, under changing operating conditions or disturbances, these physical quantities tend to exhibit complex variations. Using mere numerical values, magnitudes, or trends as indicators might not adequately describe the dynamic characteristics of these units.
Recognizing this complexity, we check multiple physical quantities and obtain a set with specific intentions. Then we unveil the underlying features concealed within numerical data. The knowledge gained from similarity theory, which is applied in many fields of natural and engineering science, can help quantify features among generation units. Consequently, the degree of similarity is proposed to provide insight into similar dynamics. We can efficiently perform hierarchical clustering with degrees of similarity for numerous generation units under data-driven.
In this paper, we propose this amalgamation which involves incorporating physical quantities into data-driven modeling. We begin by selecting a set of pertinent physical quantities that encapsulate the unit’s state. Subsequently, we employ the Prony analysis to extract data features corresponding to these diverse physical quantities [
29]. An innovative application of the degree of similarity is proposed to quantitatively measure the resemblance in the dynamic characteristics of renewable energy generator units. Consequently, units exhibiting comparable similarity scores are grouped, which resolves the arduous task of clustering units during the dynamic equivalence.
Furthermore, we introduce a pragmatic algorithm to derive parameters for these aggregated groups. Additionally, we elaborate on reducing the collector network to construct the equivalent collector network. The dynamic equivalence of a renewable plant is finally obtained.
3. Clustering Based on the Data-Driven Degree of Similarity
In the realm of multi-unit dynamic equivalence modeling for renewable power plants, the process of generation unit clustering emerges as a pivotal step. Without being tailored to certain renewable power plants or operational modes, we do not choose a certain physical quantity to perform clustering rather make a meticulous scan of the physical quantities inherent to the power plant and construct a set of relevant indicators. It is important to note that a single indicator is insufficient to encapsulate the dominant dynamics of these units entirely. On the one hand, we strive for these chosen indicators to encompass the intricate dynamics of renewable generation units across diverse conditions; on the other hand, we try to unveil the underlying features concealed within them through data analysis.
Once the underlying features are established, we aim to descript the similarity characteristics or behaviors based on underlying features and utilize them to classify units into distinct clusters. The clustering process takes into account the complexity and amount of renewable generation units. Popular clustering analysis methods, such as hierarchical clustering, can be used. We design the algorithm under data-driven, which can resolve the arduous task of clustering units.
3.1. Data Preprocessing and Feature Extraction
The key aspect lies in carefully selecting an appropriate set of physical quantities and extracting meaningful features from the collected data. This requires domain expertise, data analysis, and feature extraction techniques to unearth significant insights from the massive dataset concerning dynamic characteristics. The following physical quantities are considered in this paper:
The active power produced by renewable energy units is subject to various input factors, including wind speed, sunlight, and more. At the same time, the differences in the D-axis current control structure and parameters among converters also exert an impact on active power. Hence, the active power can be considered as the medium through which these influencing factors manifest, reflecting a category of the dynamic performance of the generation units.
- (2)
Reactive Power (Q)
Generally, renewable generation units maintain a power factor of 1.0 during the steady-state process. During fault scenarios, generation units will change reactive power according to a series of controls, reflecting their behavior. Therefore, the reactive power is selected as a carrier reflecting changes in dynamic performances.
- (3)
Voltage (V)
Presently, renewable generation units are connected to the power grid. Their converters and controls are intricately linked to the voltage at the point of common coupling (PCC). At the same time, the ability of fault ride through (FRT) depends on voltage magnitude. Thus, the voltage should be considered as a concerned indicator.
These indicators {P, Q, V} presented in the form of time series data, serve as our dataset of interest. Our focus is not solely on the actual values of these indicators but rather on effectively extracting meaningful features from data. Potential approaches could involve using advanced data analysis techniques, such as neural networks [
18], principal component analysis [
30], wavelet transforms [
31], etc., to help identify patterns and regularities hidden within the data.
Here we adapt the Prony analysis [
29], which is a linear combination that fits the sampled signal as an exponential function of amplitude, phase, frequency, and damping, as shown in Equation (1).
where
represents the amplitude, damping, frequency, and phase of the
i-th mode, respectively, and
K represents the total number of orders.
Utilizing the Prony analysis on these indicators enables the extraction of modes associated with a specified order, effectively capturing fundamental dynamics. These components often encompass numerous surplus segments characterized by amplitudes nearing zero. Consequently, we can prune superfluous orders by establishing an energy threshold .
This pruning process unfolds in the following manner: the energies of all modes are arranged in a descending sequence, and through iterative summation, the process continues until reaching the
L-th order, where the cumulative energy equals or exceeds the product of the total energy
and the designated threshold
, as shown in Equation (2).
where
represents the energy of the
i-th mode.
After the pruning process is finalized, these time series data of indicators can be expressed as follows.
where
represents time series data,
represents the data step size, and
represents the number of data points.
Frequency and damping are the fundamentals that exert the most significant influence. We prioritize them as underlying features. Additionally, represents the energy of the i-th mode.
3.2. Degree of Similarity
The degree of similarity can describe how similar two target objects are by analyzing their similar elements [
28]. Suppose object A has
m elements, and object B has
n elements. There are
k pairs of similar elements (PSE) for both of them. The weight factor of the
j-th PSE is
, and the similarity is
. Then the degree of similarity
between A and B can be written by the following equation:
Equation (5) provides an overview of the similarity calculation procedure between two objects. Pertaining to the features that have been extracted, we can utilize Equation (5) to scrutinize the similarity for each mode encompassed by these features.
It is imperative to organize essential steps and parameters meticulously. Without loss of generality, we will commence by sequentially addressing PSE and similarity , elucidating the comprehensive procedure of the proposed degree of similarity.
We use frequency, damping, and energy in Equation (4) to calculate the Euclidean distance between the
i-th mode of object A and the
j-th mode of object B, as shown in Equation (6):
where
,
and
are the frequency, damping, and energy of the
i-th mode of object A respectively;
,
and
are the frequency, damping, and energy of the
j-th mode of object B.
Based on Equation (6), it is evident that a smaller value of signifies a closer resemblance between the i-th mode in object A and the j-th mode in object B. Thus, we use to obtain the PSE between object A and object B.
Next, we can calculate the similarity
of underlying features, respectively. Take the feature, frequency, as an example. The similarity of frequency in the
i-th PSE can be calculated by Equation (7)
where
and
are the frequency of the
i-th similar mode of A and B.
Similarly, the similarity of damping in the
i-th PSE can be calculated by Equation (8):
where
and
is the damping of the
i-th similar mode of A and B.
We consider the similar weight for the two features. Thus, the similarity in the
i-th similar modes can be calculated as follows:
Repeating the same procedure for each mode, we can obtain the degree of similarity by Equation (10).
The preceding explanation clarifies the process of calculating the degree of similarity. Considering the indicators {P, Q, V} at hand, we replicate this identical calculation process for each individual indicator within this set. Eventually, we leverage Equation (11) to compute the degree of similarity among renewable generation units.
3.3. Hierarchical Clustering
Hierarchical clustering is a powerful technique in data analysis that organizes data points into a hierarchical structure of clusters. The agglomerative algorithm, a common approach within hierarchical clustering, works by iteratively merging individual data points or clusters into larger clusters until a convergence criterion is met. This process naturally results in a tree-like structure, which visually represents the relationships and similarities between data points.
Here, we adopt the following steps in hierarchical clustering based on the degree of similarity:
Step 1: Start by treating each data point as a separate cluster.
Step 2: Calculate the pairwise distance between all pairs of data points. This distance can be measured using Euclidean distance, Manhattan distance, or others, depending on the nature of the data. We choose the degree of similarity to define the distance between two clusters.
Step 3: Identify the two closest clusters based on the calculated distances and merge them into a single cluster. This step reduces the total number of clusters by one.
Step 4: Recalculate the distances between the newly formed and remaining clusters.
This step involves computing and updating the distance between the merged cluster and each of the other ones.
Step 5: Repeat steps 3 and 4 iteratively, progressively forming larger and larger clusters. Continue merging the closest clusters and updating the distances until a convergence criterion is met.
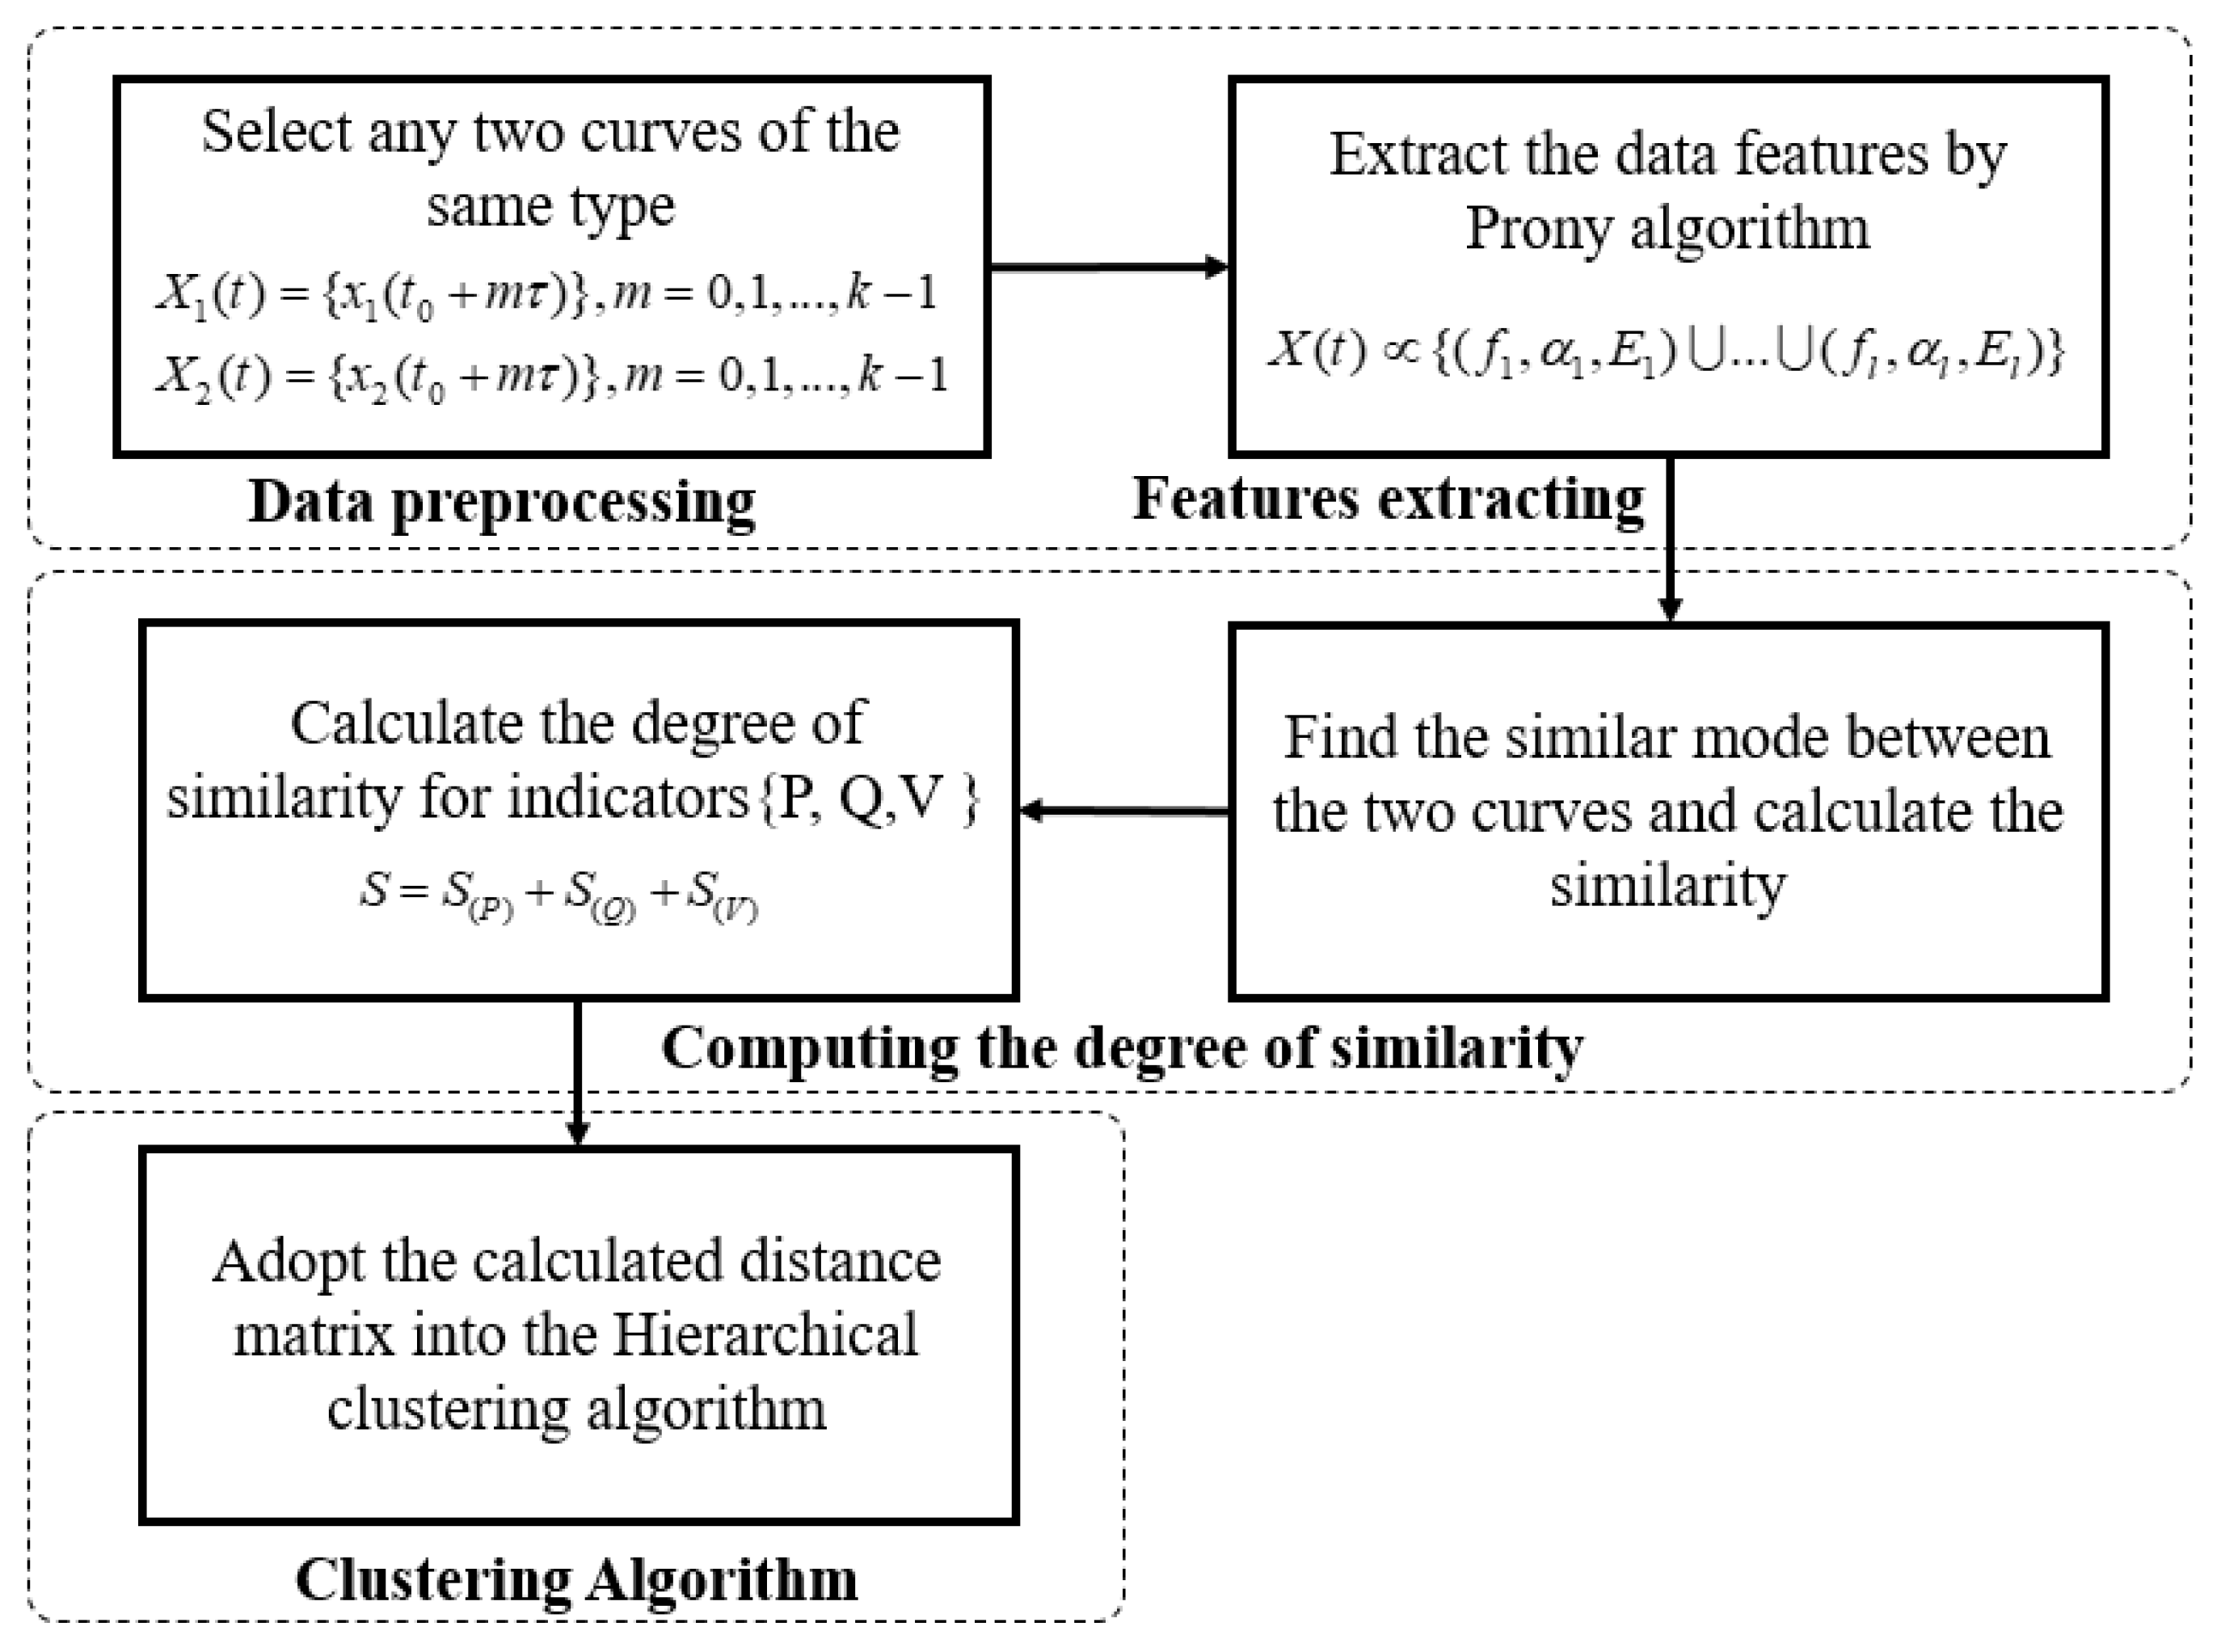
In order to make it easier to understand, the main procedure of the proposed method is shown in
Figure 1.
In real-world scenarios, the generation units within the same renewable power plant typically share a consistent model, or due to the plant’s development in 2 or 3 construction stages, the units commissioned in each stage maintain uniformity. As a result, this leads to the emergence of, at most, 2 or 3 distinct categories of generation units encompassing the entirety of the plant. Different categories of units may exhibit certain differences concerning their structure and parameters. Therefore, we strongly recommend conducting an independent clustering analysis for each corresponding type of units.
This proposed method ensures the careful consideration of all generation units throughout the clustering process, thereby enhancing the capture and comprehension of similarities. By conducting separate clustering for the units and grouping them, we can notably curtail the scope of study within the power plant.
5. Study Cases
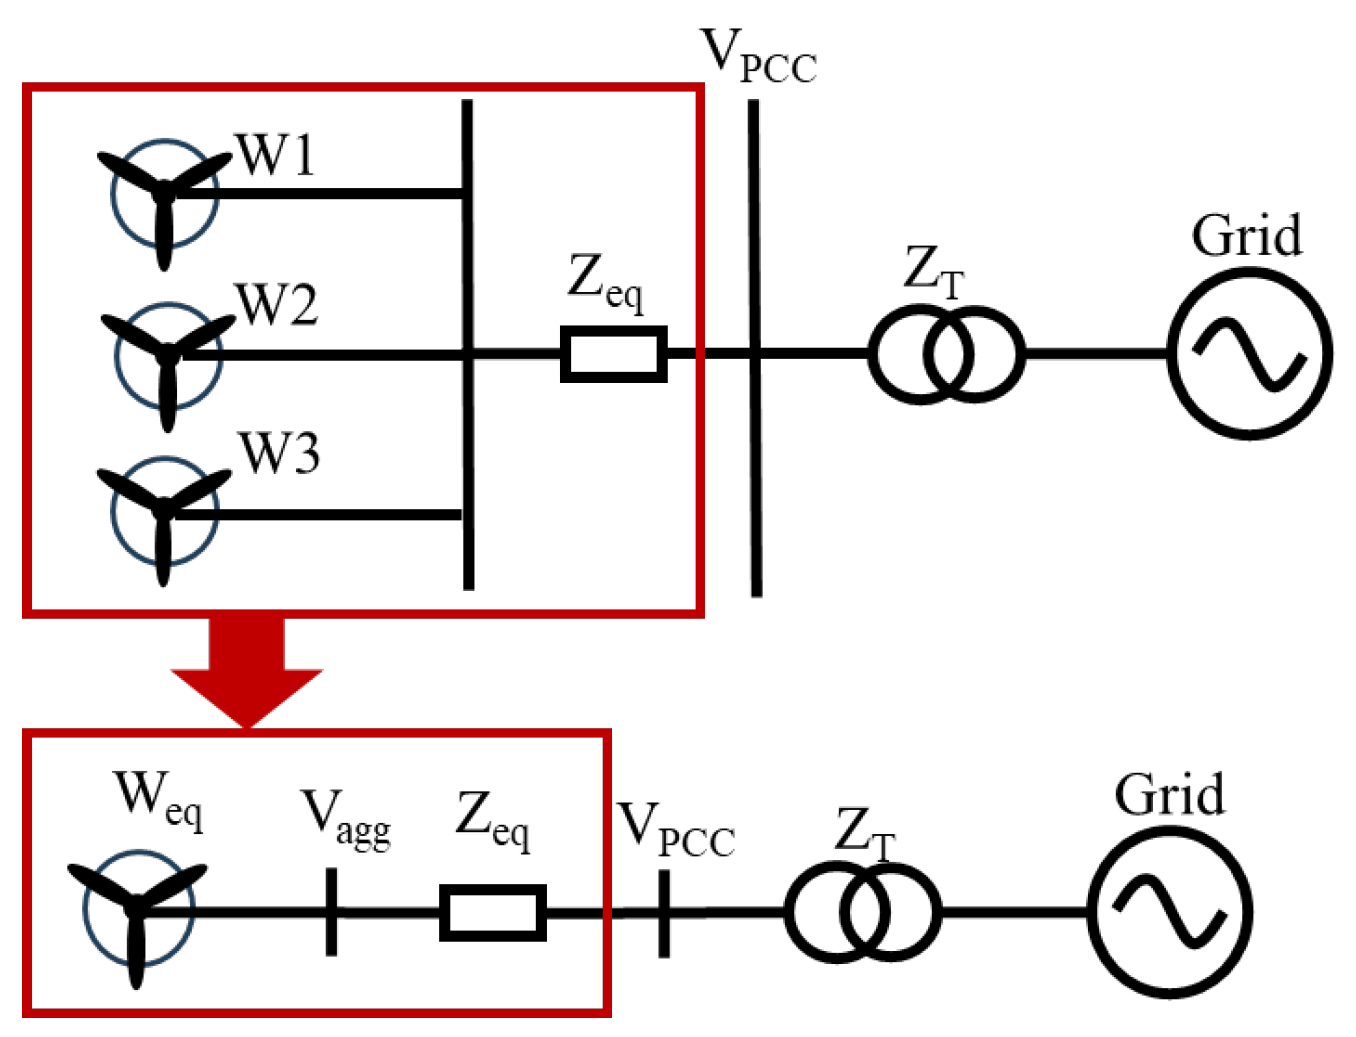
In Case 1, an offshore PMSG wind farm is used as an example. The total capacity of the whole wind farm reaches 500 MW. To ensure compliance with data anonymization requirements, we have chosen to selectively focus on one operational stage, comprising 16 generation units, each boasting a capacity of 8.3 MW, as a representative subset for the analysis. The topology of this subset is shown in
Figure 4a. The terminal voltage of the unit is initially set at 690 V, which is boosted by the transformer to the 35 kV collector network. Upon interconnection, the generated power undergoes a further transformation, raising it to the 220 kV grid level. This strategic integration ensures seamless connectivity with the power grid.
The parameters of the renewable generation units are shown in
Table 2.
5.1. Validation of Clusters in Case 1
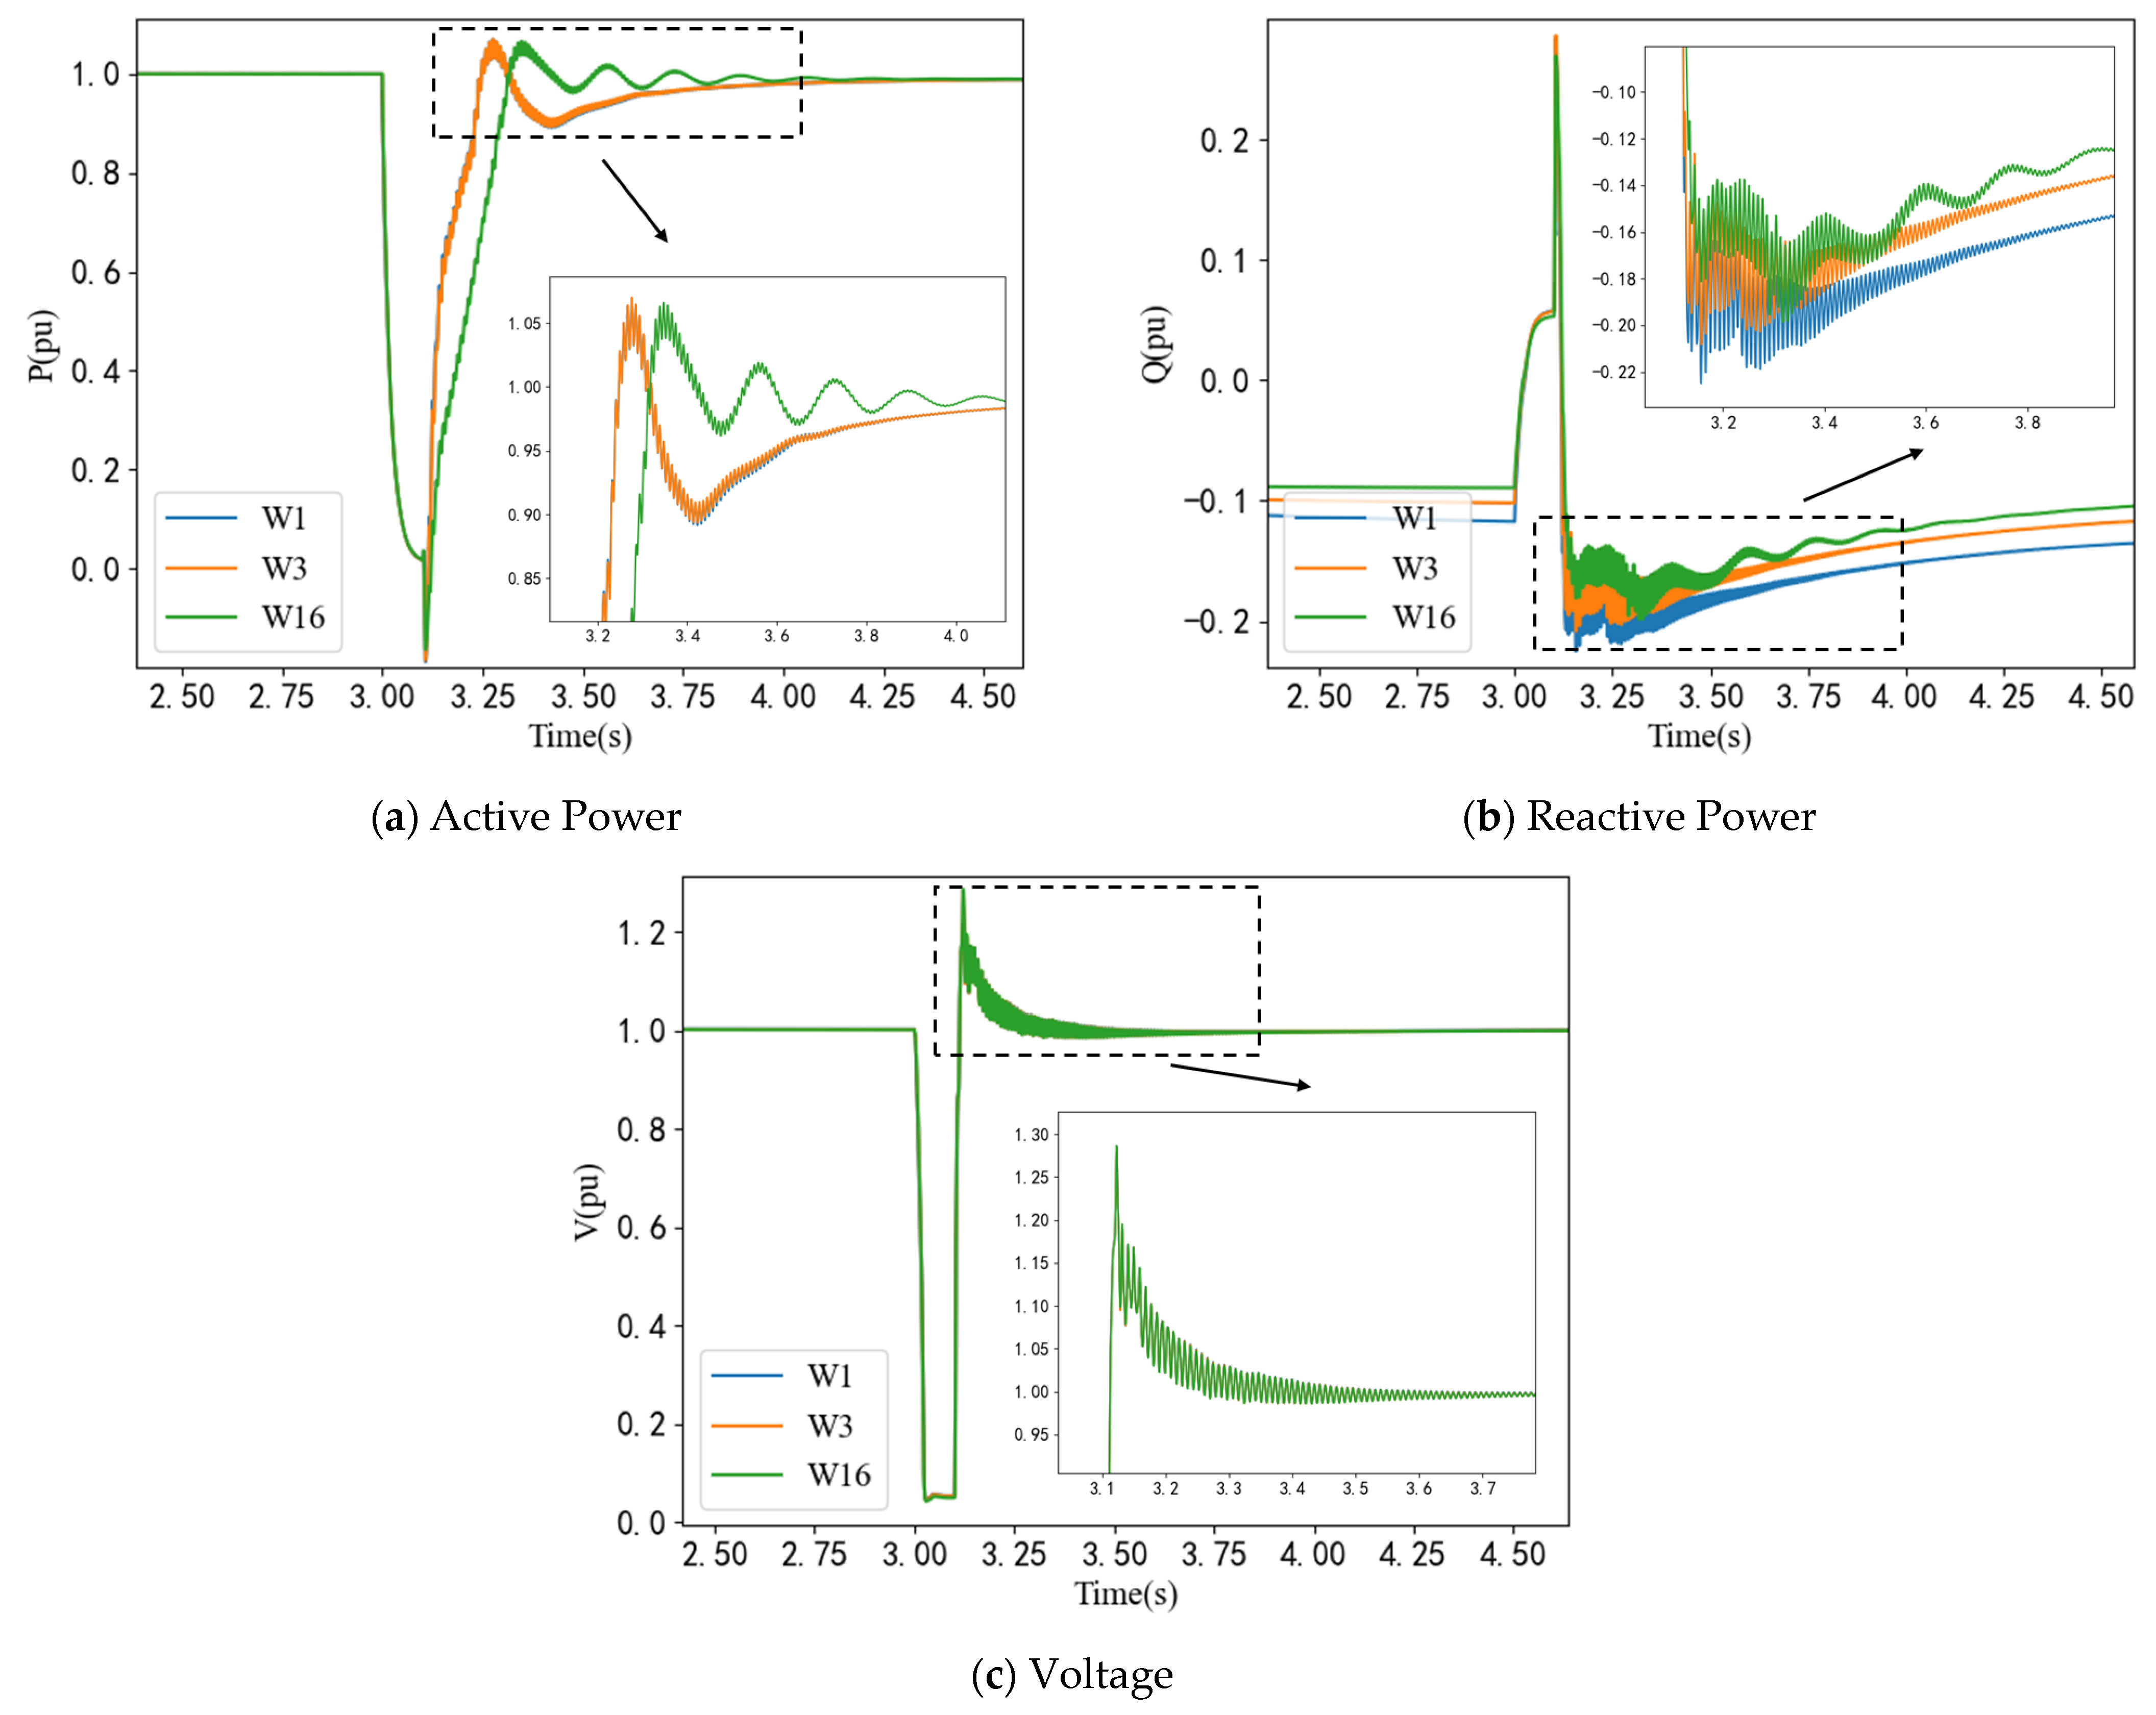
According to the above section, we can execute numerous contingencies and collect the corresponding data. For example, a three-phase fault is subjected to the point of interconnection of the wind farm at 3.0 s. This fault lasts for 0.1 s and then disappears. The time series data of active power, reactive power, and voltage of each unit are collected, which constitute the bedrock of the dataset compilation. Parts of them are shown in the following
Figure 5 and
Figure 6.
At the subset of this power plant, anticipation may arise that the dynamics of generation units would ostensibly align or nearly coincide. However, upon closer examination, we can find that the wind farm system exhibits a complex and dynamic nature. Despite the uniform structure of power generation units, variations in operating conditions and grid connections lead to differences in the micro-level states of these units. In particular, the response of each generating unit to disturbances varies due to these conditional differences.
Figure 5 illustrates the dynamic traces of active power, reactive power, and voltage pertaining to W1, W3, and W16. Evidently, the voltage profiles of these three units display a remarkable alignment, yet apparent variations emerge in active and reactive power behavior. Notably, in contrast to W1 and W3, W16 conspicuously deviates in terms of both active and reactive power. Similarly, the W11 presents divergences in active and reactive power dynamics when compared to the W9 and W13, as shown in
Figure 6.
Under these circumstances, attempting to quantify or represent the comprehensive dynamic characteristics of the system using a single physical quantity or response attribute becomes challenging. The set of indicators selected in this study is designed to address this complexity comprehensively by capturing the system dynamics from multiple dimensions.
These indicators provide valuable patterns for subsequent feature extraction. Following the proposed method, we apply Prony analysis to extract the features of time series data and then calculate the degree of similarity between any two generation units. For comparisons with time-domain results, as shown in
Figure 5 and
Figure 6, the results of degree of similarity between units are shown in
Table 3.
Degree of similarity describes the resemblance between two units. As its value approaches the upper limit of 1 p.u., it signifies an augmented likeness between the two objects, whereas nearing the lower limit of 0 indicates a substantial disparity between the two units.
Table 3 shows that W1 and W3, as well as W9 and W13, manifest elevated values, thereby suggesting grouping within respective clusters. This result aligns with the preceding simulations.
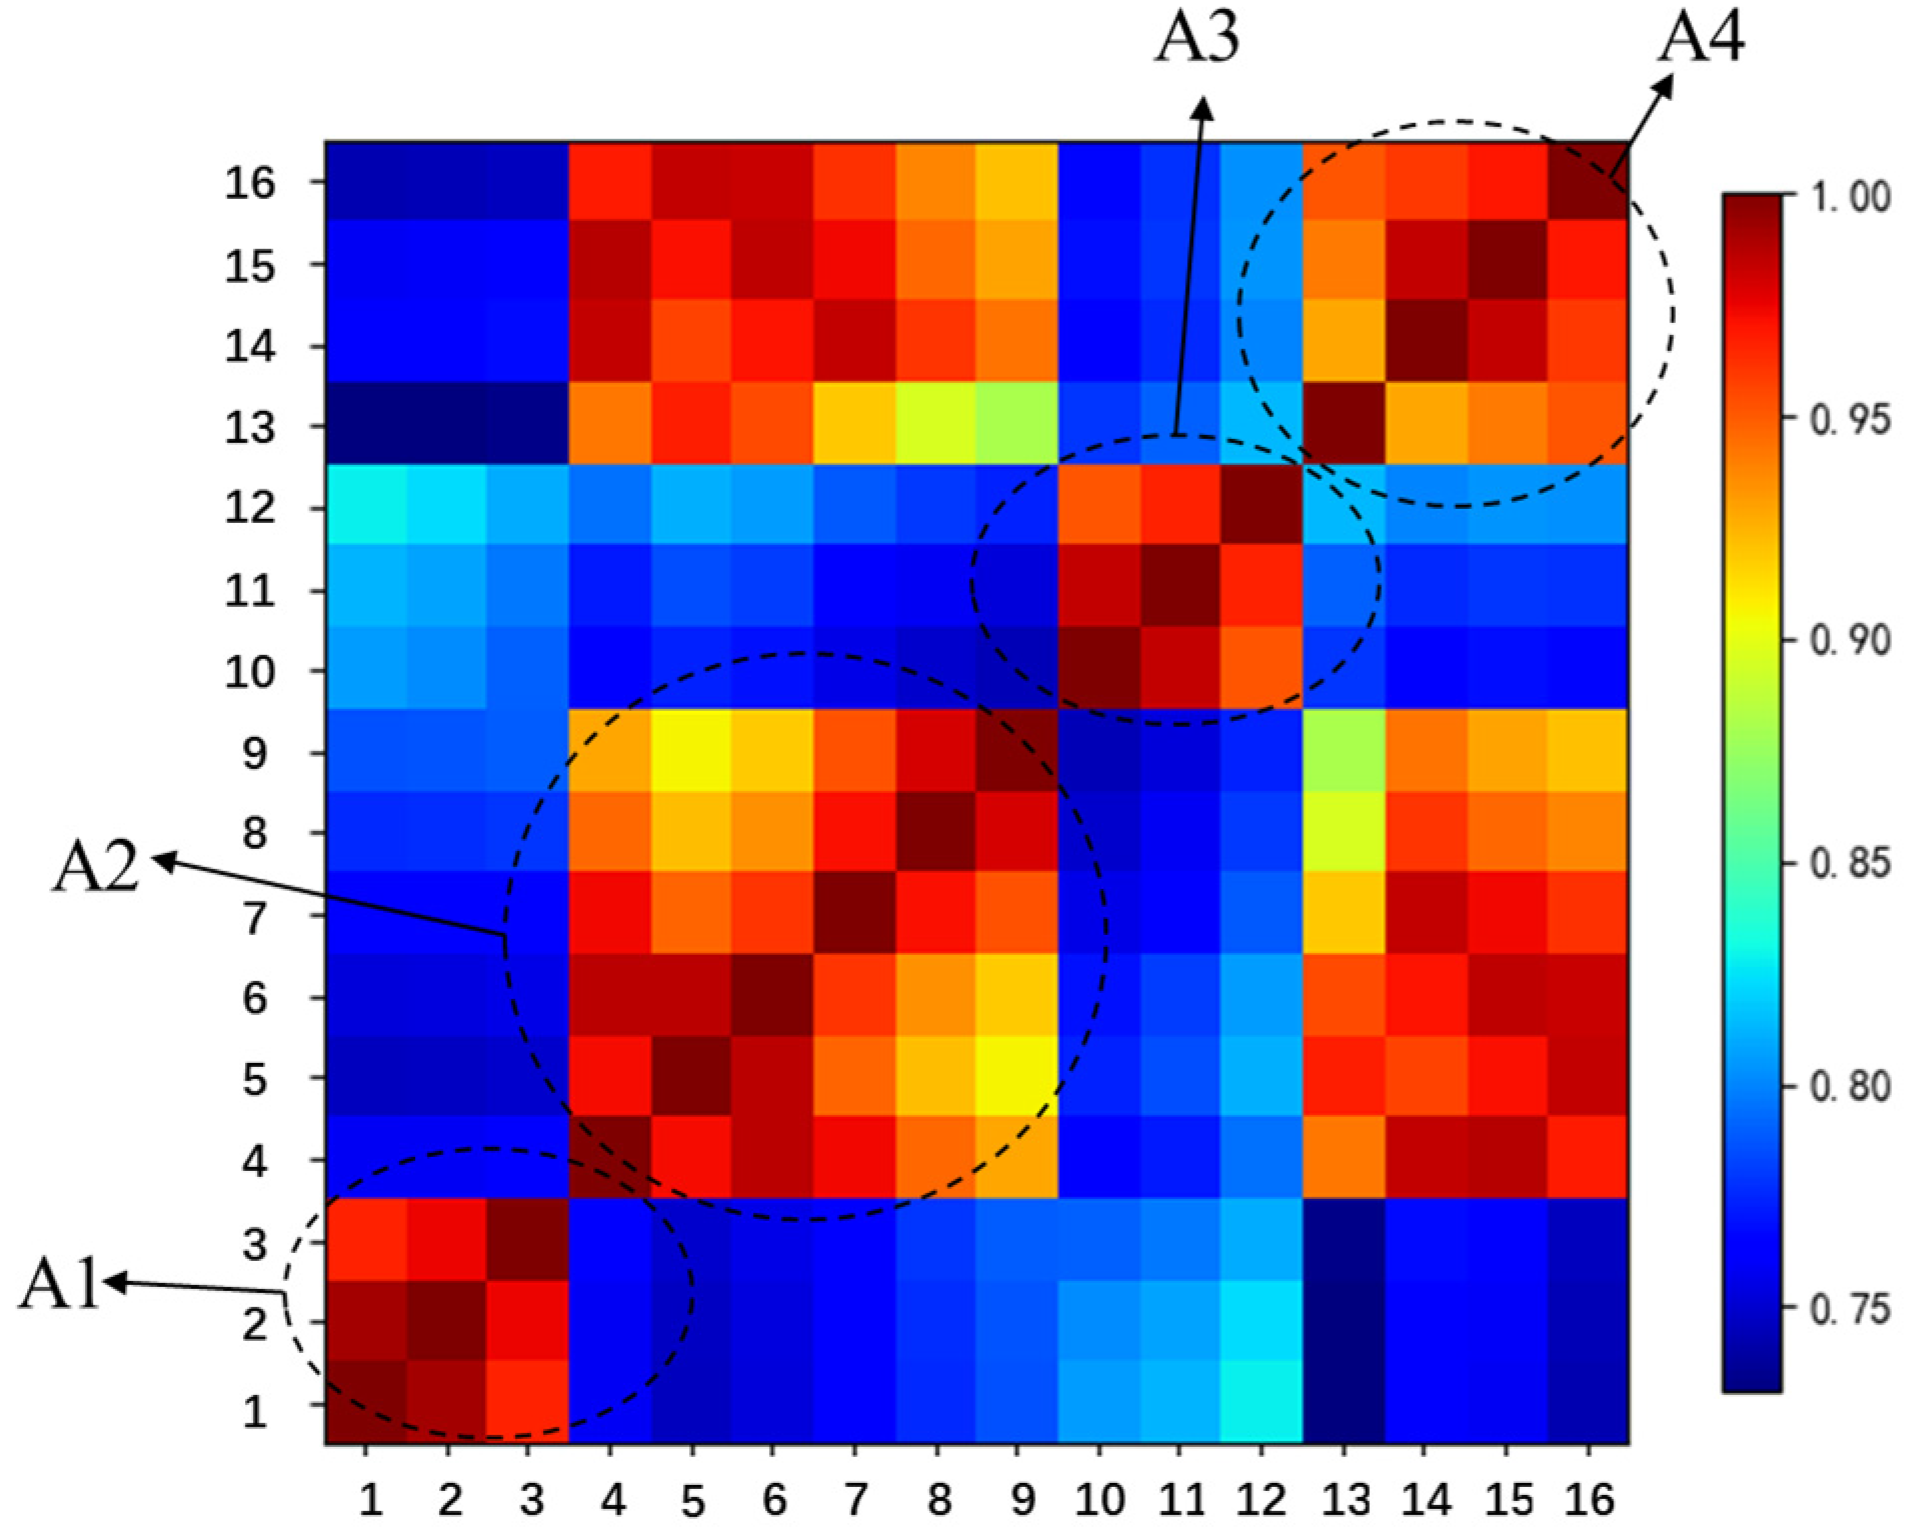
For the sake of visual clarity, a heatmap illustrating numerical values based on the degree of similarity is provided herein, as shown in
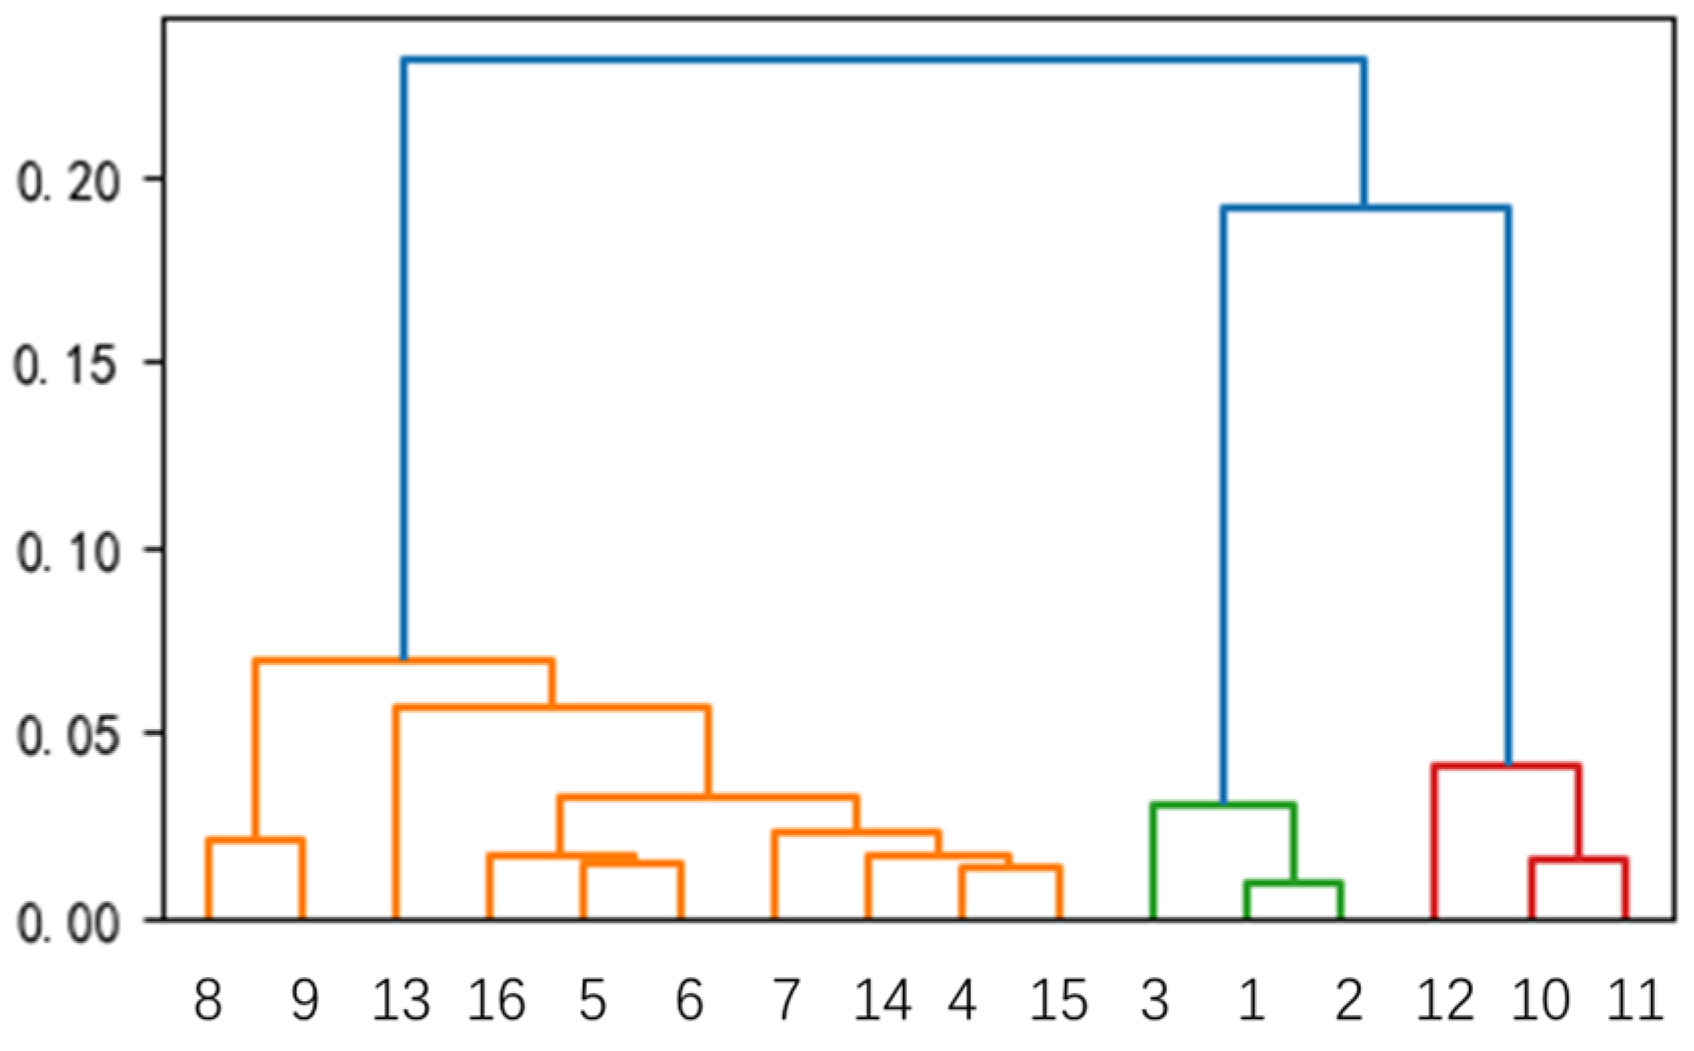
Figure 7. By comparing the degree of similarity among units, we can grasp the overarching division of all units into four distinct clusters, A1–A4. Yet, it becomes apparent that a connection exists between A2 and A4. We need to conduct an investigation into this connection.
Employing the hierarchical clustering algorithm, rooted in the degree of similarity, delves deeper into delineating clusters among the units, as shown in
Figure 8.
The clustering results are listed in
Table 4. We believe that the data-driven degree of similarity method efficiently performs the arduous task of clustering units during the dynamic equivalence.
5.2. Validation of the Equivalent Model in Case 1
After clustering, the renewable power plant can be presented to 3 equivalent generation units, as shown in
Figure 4b. The proposed parameter optimization and reduction of the collector network are performed, respectively. During optimization, it is necessary to satisfy the error between the active power, reactive power, and voltage results of the equivalent model and the original detailed model. We establish the following parameter configurations: a population size of 10, iterations of 50, an inertia weight of 0.5, and a learning coefficient of 0.1. Ultimately, the parameter of the equivalent units can be obtained, as shown in
Table A1 of
Appendix A.
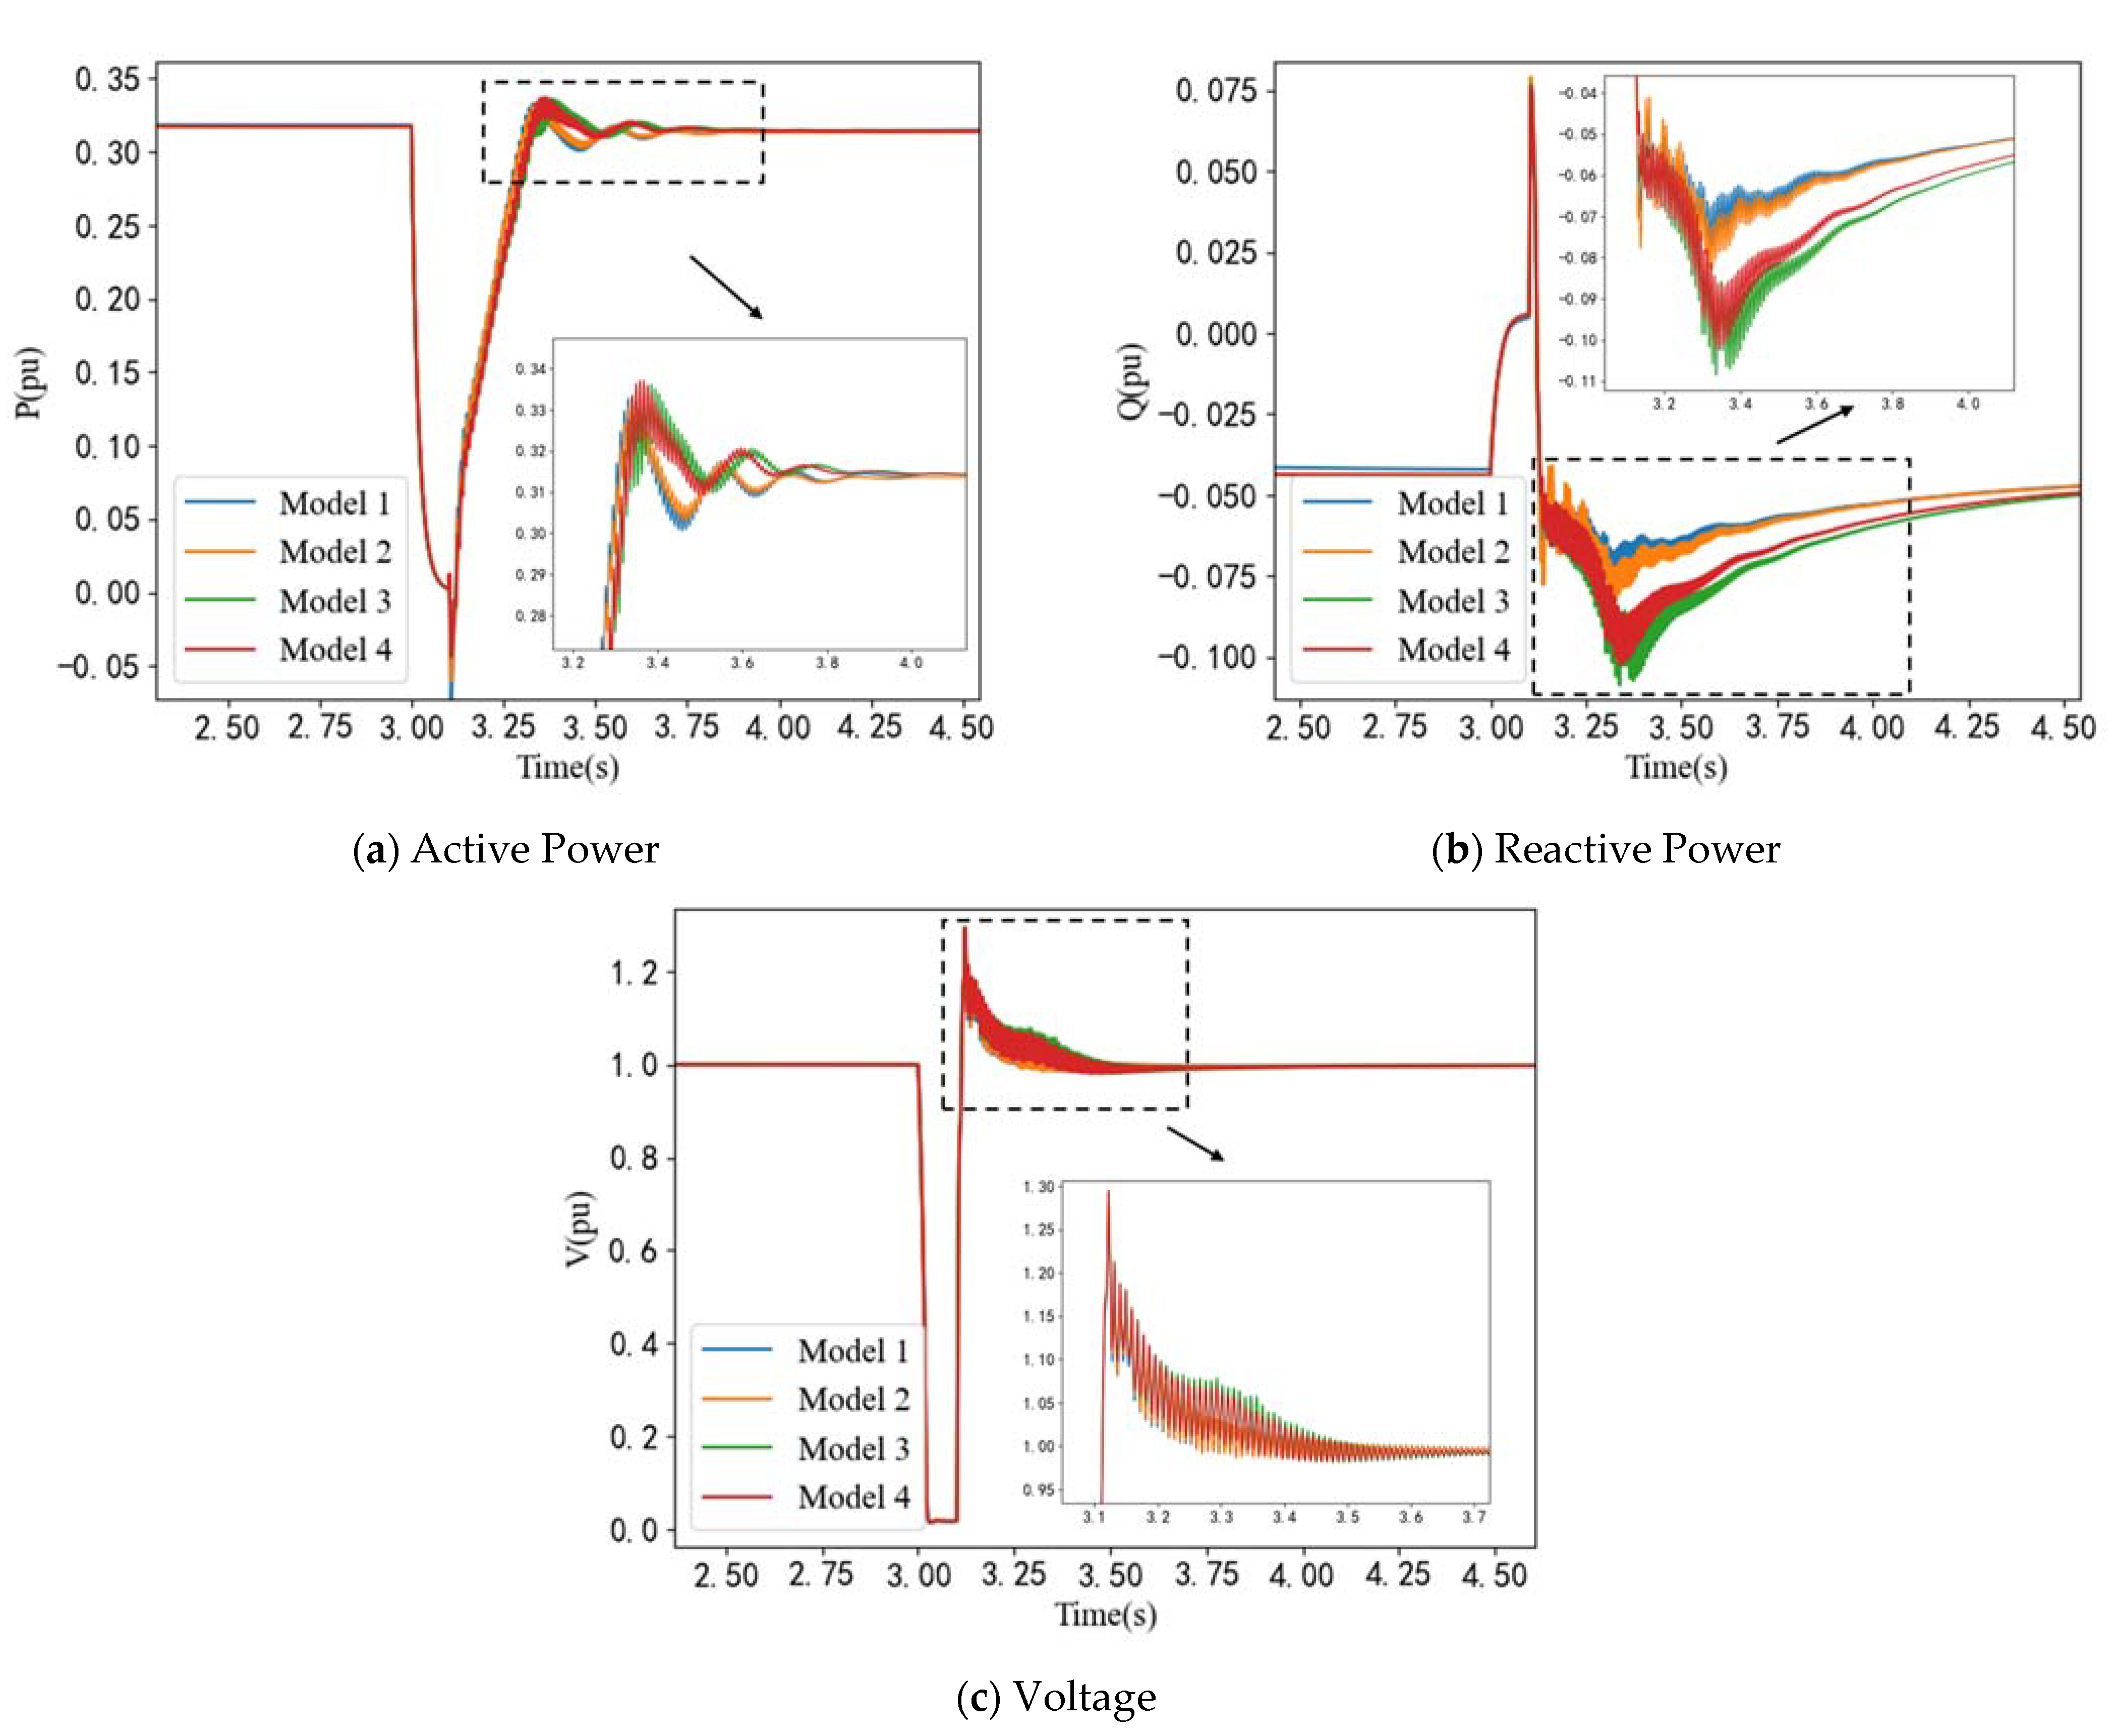
In order to further verify the effectiveness of the proposed method, four models are set up and compared under the same disturbance:
- (1)
Model 1: the detailed model of the wind farm, including detailed parameters of wind turbines, converters, transformers, the collector network, and so on;
- (2)
Model 2: the equivalent model of the wind farm obtained by the proposed method;
- (3)
Model 3: the equivalent model obtained by the single-unit method in Ref. [
12];
- (4)
Model 4: the equivalent model obtained by the multi-unit method based on constraints of network structures in Ref. [
12].
The same fault disturbance is set for each of the four models. When t = 3 s, the wind farm PCC three-phase fault occurs, and the fault disappears after 0.1 s.
Figure 9 compares voltage, active power, and reactive power profiles between the original detailed system and its equivalent ones. As depicted in
Figure 9, Model 2, based on the method presented in this paper, closely approximates Model 1, which serves as a representation of the original system. In contrast, Models 3 and 4, founded on alternative methodologies, exhibit noticeable deviations from the original system, particularly during the transient stage.
This result means that the proposed method can maintain the dynamic characteristics inherent to the original system. Meanwhile, Model 2 only includes 3 equivalent units. The scale of this power plant can be reduced while retaining high fidelity.
5.3. Efficiency Analysis of Equivalent Model in Case 1
In order to verify the superiority of the wind farm equivalent model in simulation efficiency, the simulation time of different wind farm models is calculated, as shown in
Table 5. The simulations are carried out on a workstation with the following specifications: AMD 5800X, 8 CPU @ 3.8 GHz, 16 GB of RAM.
At the same time, the equivalent system can save time in simulations for dynamic analysis. The data presented in
Table 5 demonstrates that if the original system employs a detailed model for each unit, with a simulation time step of 20 μs and a total simulation duration of 5 s, the required computational time amounts to 1082 s. In contrast, the equivalent model, derived through the proposed method under identical parameter settings, necessitates only 48 s. Hence, it is evident that the simulation efficiency is significantly augmented.
5.4. Dynamic Equivalence of Multiple Wind Farms in Case 2
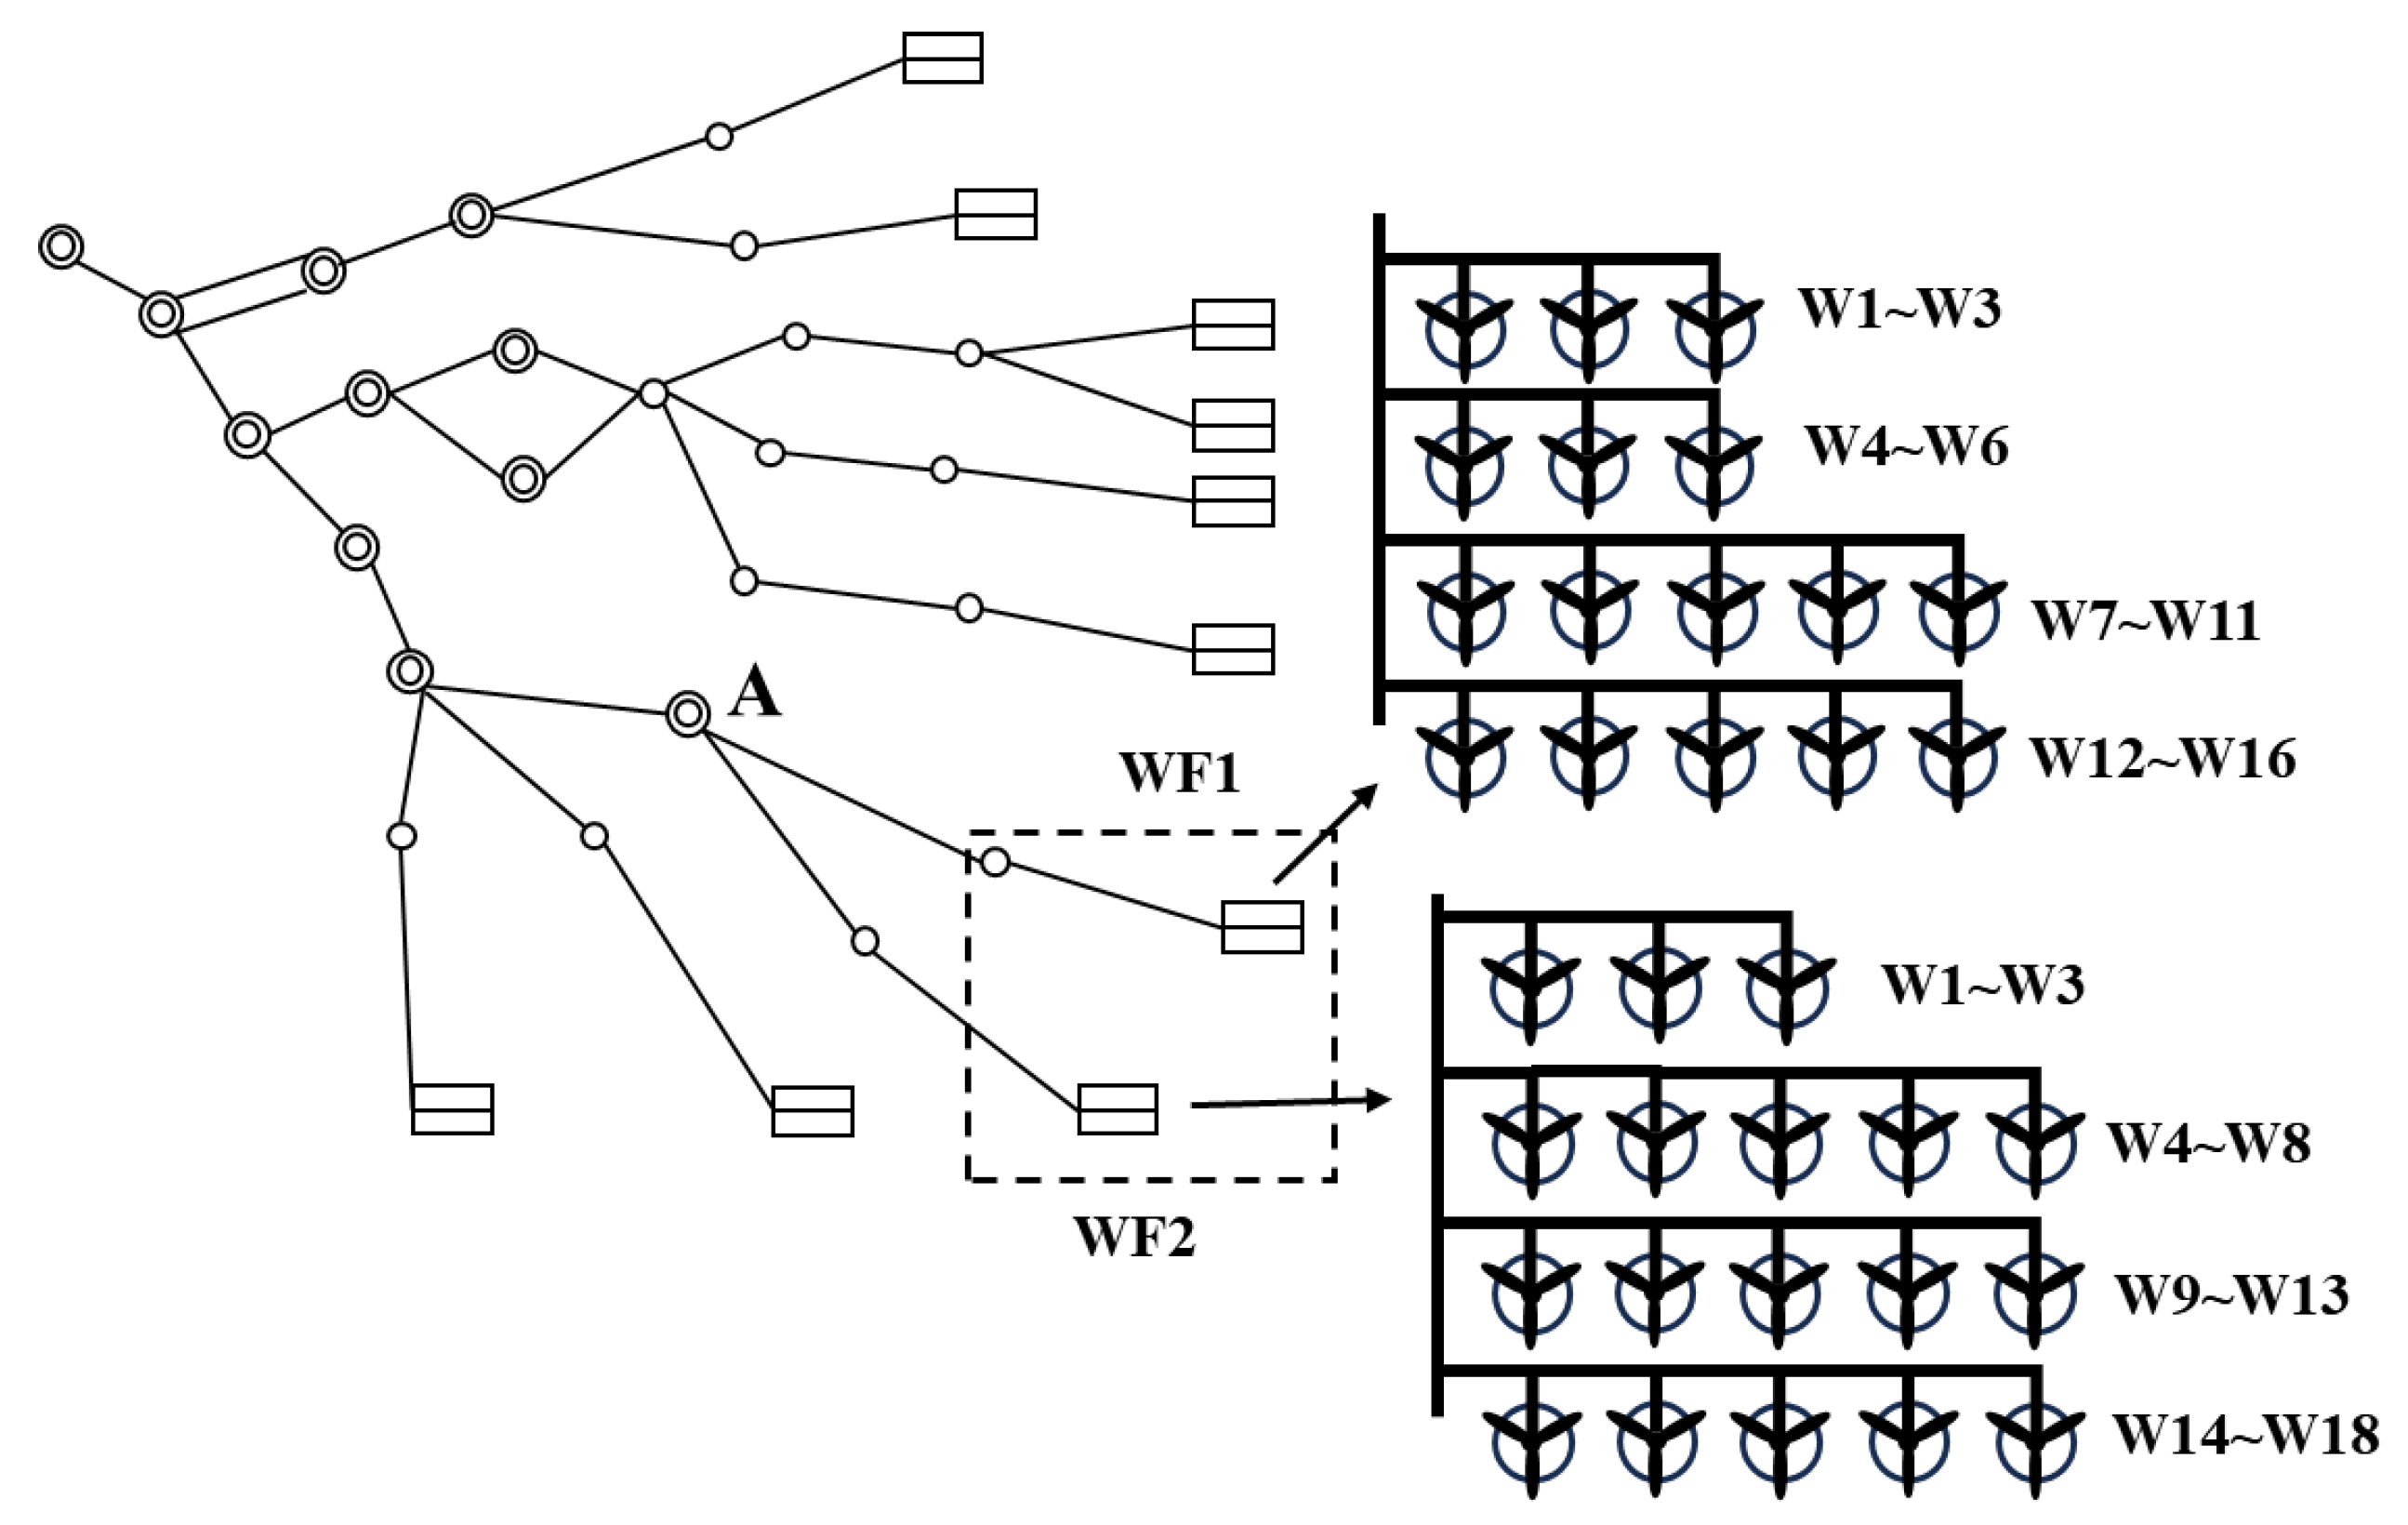
In this case, we take a grid-connected system containing multiple renewable power plants as an example, as shown in
Figure 10. This grid requires efficient simulation under electromagnetic transients. In order to verify the adaptability of the proposed method in multiple wind farms, the dynamic equivalences of the two wind farms, namely WF1 and WF2 in
Figure 10, are performed following the above steps.
The two wind farms contain 34 generation units, with WF1 containing 16 units and WF2 comprising 18 units. Detailed parameters for each wind power generation unit are provided in
Table 2. Similar to Case 1, the method presented in this paper is used to cluster different units and obtain aggregated parameters. Finally, 6 equivalent units are obtained, as shown in
Table 6.
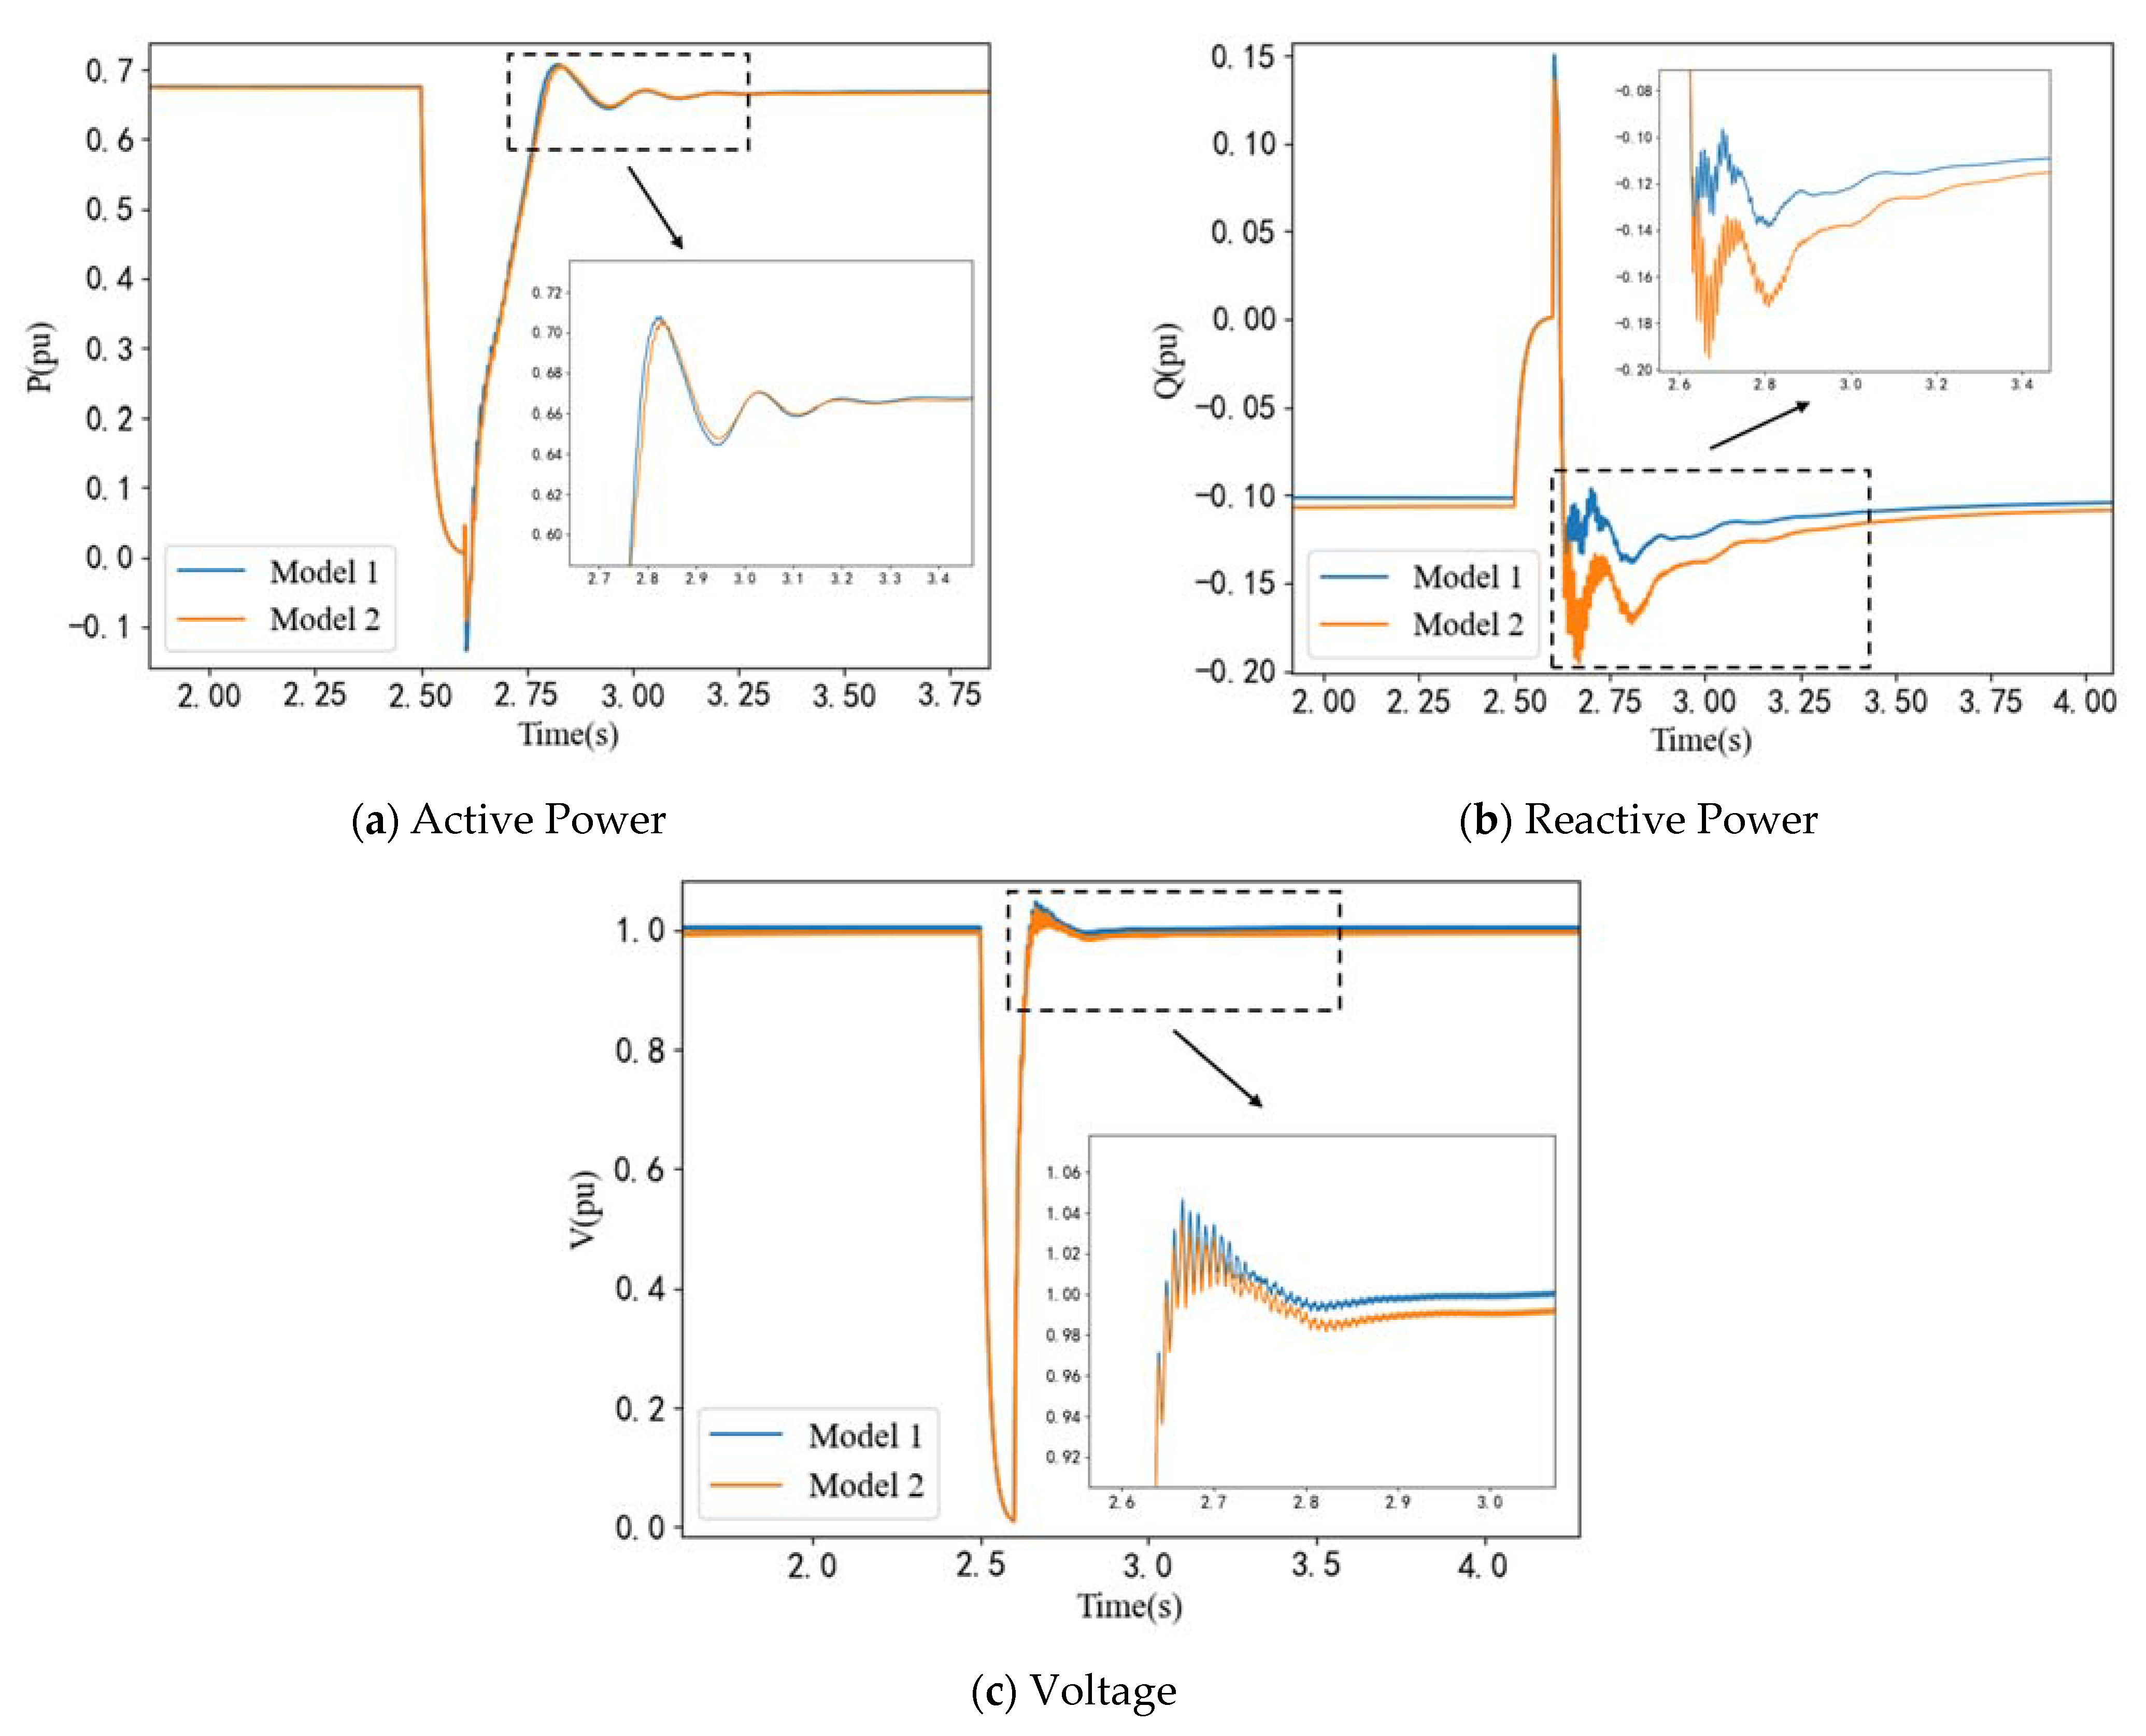
In order to verify the validity of the equivalent model, we also apply a three-phase fault to bus A at 2.5 s. This fault lasts for 0.1 s and then disappears. We compare the transient characteristics of the original model (Model 1) and the equivalent model (Model 2).
Figure 11 illustrates the transient profiles of voltage, active power, and reactive power at bus A in response to the fault disturbance.
As can be seen from the figure above, the disparities between the two models are minimal during the disturbance. This observation highlights that the dynamic characteristics of the system are effectively preserved. Additionally, the reduction in modeling complexity leads to a noteworthy enhancement in simulation efficiency, underscoring the practical advantages of our approach.
6. Conclusions
In this paper, a novel dynamic equivalent method based on a data-driven degree of similarity is proposed for a large-scale renewable power plant. The core idea of this method involves leveraging Prony analysis to extract data features from physical quantities of renewable generation units and then employing the degree of similarity to assess the similarity in these features. Unlike conventional dynamic equivalent modeling performing physical components-based analytical methods, the proposed method capitalizes on the wealth of data collected from the varied conditions experienced by renewable generation units across a spectrum of scenarios. The data-driven aspect of this method provides a versatile framework applicable to various renewable power plants, which efficiently realizes dividing numerous units with various dynamics into distinct clusters and aggregating parameters for each cluster. Throughout the modeling procedure, the dynamic equivalent model of a renewable power plant is achieved to remarkably reduce complexities and scales.
Numerical simulation results on the realistic offshore PMSG wind farms demonstrate that the proposed approach can maintain dynamic status and accelerate the simulation speed. Compared with other representative methods, it exhibits higher accuracy and stronger adaptability to various scenarios, being more applicable in practice.
In relevant future work, the research efforts can be focused on how to improve its performances in more harsh practical contexts and enhance its optimality and applicability, such as convergence speed and accuracy of the method. Additionally, how to improve the overall effect in the presence of inadequate or biased data is planned as another future research direction.
