Article

Determination and Modeling of Proximate and Thermal Properties of De-Watered Cassava Mash (Manihot esculenta Crantz) and Gari (Gelatinized cassava mash) Traditionally Processed (In Situ) in Togo

by
Mwewa Chikonkolo Mwape
1,*,
Aditya Parmar
2,
Franz Roman
1,
Yaovi Ouézou Azouma
3,†,
Naushad M. Emmambux
4 and
Oliver Hensel
1
1
Department of Agricultural and Biosystems Engineering, University of Kassel, Nordbahnhoftstraße 1a, 37213 Witzenhausen, Germany
2
Natural Resources Institute, University of Greenwich, Central Avenue, Chatham Maritime, Kent ME4 4TB, UK
3
Ecole Supérieure d’Agronomie, Université de Lomé, Lomé BP 1515, Togo
4
Department of Consumer and Food Sciences, University of Pretoria, Private Bag X20, Hatfield 0028, South Africa
*
Author to whom correspondence should be addressed.
Deceased.
Energies 2023, 16(19), 6836; https://doi.org/10.3390/en16196836
Submission received: 31 August 2023 / Revised: 15 September 2023 / Accepted: 19 September 2023 / Published: 27 September 2023

Abstract

:
The roasting process of Gari (Gelatinized cassava mash), a shelf-stable cassava product, is energy-intensive. Due to a lack of information on thermal characteristics and scarcity/rising energy costs, heat and mass transfer calculations are essential to optimizing the traditional gari procedure. The objective of this study was to determine the proximate, density, and thermal properties of traditionally processed de-watered cassava mash and gari at initial and final processing temperatures and moisture contents (MCwb). The density and thermal properties were determined using proximate composition-based predictive empirical models. The cassava mash had thermal conductivity, density, specific heat capacity, and diffusivity of 0.34 to 0.35 W m−1 °C−1, 1207.72 to 1223.09 kg m−3, 2849.95 to 2883.17 J kg−1 °C, and 9.62 × 10⁻⁸ to 9.76 × 10⁻⁸ m2 s−1, respectively, at fermentation temperatures and MCwb of 34.82 to 35.89 °C and 47.81 to 49%, respectively. The thermal conductivity, density, specific heat capacity and diffusivity of gari, ranged from 0.27 to 0.31 W m−1 °C−1, 1490.07 to 1511.11 kg m−3, 1827.71 to 1882.61 J kg−1 °C and 9.64 × 10⁻⁸ to 1.15 × 10⁻⁸ m2 s−1, respectively. Correlation of all the parameters was achieved, and the regression models developed showed good correlation to the published models developed based on measuring techniques.

1. Introduction

It has long been highlighted that processing conditions (temperature, pressure), food structure and composition are the key factors that control the thermal conductivity of food products during dehydration or refrigeration. The major components of foods are water, carbohydrates, total ash, crude proteins, crude fiber and crude fat [1]. Thermal properties of foods could be predicted by mathematical modelling and by conducting experiments under steady-state heat transfer or transient methods.
Many researchers have highlighted the importance of data and knowledge on the thermal properties of various agricultural produce and their processing into food to researchers and post-harvest processing equipment designers. Data on thermal properties are crucial for optimizing sterilization, heat transfer equipment, and de/rehydrating instruments in addition to being the means of predicting ideal temperature requirements, drying durations, and drying conditions during dryer design stages for reduced post-harvest losses [2,3,4].
Challenges associated with techniques to measure thermal properties in terms of specialized equipment and operator skill sets have been highlighted in many studies [5,6,7]. Choi [2] established that proximate composition (water, protein, carbohydrate, fat, ash and crude fiber) can be used to predict the thermal properties of food by considering the fractions by weight and comparing them to the volume fraction between −40 to 150 °C temperatures in various mathematical models.
Cassava is a traditional food security crop because it can be harvested when needed and is resilient to a range of biotic and abiotic problems (including low-fertility soils), and varieties differ in many ways [8]. However, cassava roots quickly deteriorate once they are harvested (shelf life of 1–2 days). Processing cassava into gari, a dry granulated cassava product, provides a conveniently available, shelf-stable and safe (in terms of reduction of cyanogenic glucoside during fermentation and roasting).
Gari is processed in households, small businesses, cooperatives, and village-based industries, the majority of which employ women [9]. It is a source of income for many people, and improving its value chain could help them achieve food sovereignty [9,10,11]. The gari industry is transitioning from domestic (traditional)-based to a mass scale at a rate not supported by new innovations in processing equipment development [12]. Moreover, roasting, the last step, consumes a large amount of firewood, exposes women and children to heat stress, and releases particulates that have negative impacts on their health and the environment. This has been exacerbated by the status of more than 700 million people lacking access to modern energy cooking services [12,13]. Data on cassava mash and gari thermal characteristics in Sub-Saharan Africa (SSA) and Togo in particular are scarce and intermittent. The Gari value chain must be strengthened by identifying its weaknesses and proposing research and development activities that would boost its impact on food autonomy. If the requirement to increase the credibility of the agriculture industry’s climate effect verification process through digitalization technology is to be realized, more site/crop-specific models and simulations should form the foundation of greenhouse gas monitoring tools rather than transposition [14]. There is a significant need for clean and sustainable cooking options because most of the gari consumed in the Sub-Saharan African countries (SSA) is produced using unsustainably produced firewood [8]. Understanding the thermal characteristics of both cassava and gari is vital for quality control and heat and mass transfer analysis/modelling [2,3,4]. Thermal property analysis advancements are critical for the continuous improvement of existing and future-generation cassava processing equipment for optimal energy efficiency, food quality/shelf life, and environmental safety.
The objectives of this study were to characterize the proximate composition, estimate the thermal properties using Choi’s [15] additive methods, develop prediction models of the traditional garification process (with the aim of using the models for easy heat and mass transfer predictions), and validate them with prediction models based on measuring techniques from the literature. By merely detecting temperature and moisture contents before and after roasting, the prediction models could be easily utilized to compute the thermal properties of the cassava processing in the regions with the same cassava varieties. Further, process temperatures, batch sizes and roasting durations were analyzed. This is in the pursuit of building on-site energy/heat and mass transfer simulations during cassava processing into gari in Togo’s Maritime region.

2. Material and Methods

2.1. Description of the Study Area

The study was conducted in collaboration with the following cooperatives and individual gari processors in the Maritime region in Togo:
  • Coopérative des femmes NOVIVA de Tokpo, code-named as NOVIVA;
  • Agro Pastoral (Ganave) code-named as AP;
  • An individual processor in Ganave, code-named as AT;
  • An individual processor in Wogba, Vagan) code-named as WB;
  • Coopérative d’Action pour le Développement (CAD) de (Wogba, Vagan) code-named as CAD.

2.2. Sampling and Data Collection

Five gari processors in Togo’s Maritime region provided the primary data, and their selection was based on snowball and census sampling methodology; because some processors were difficult to persuade to join, this chain-referral and non-probability sampling method was used [16]. Using a semi-structured questionnaire (qualitative research methods), primary data were gathered on the types of cassava grown, the type of firewood used, major players (labor/gender divide) and the typical sources of raw materials.

2.3. Raw Materials

2.3.1. Cassava Samples

The freshly harvested short-duration (10 to 12 months old) cassava cultivars used by the respective processors listed and code-named below, depending on processors, were considered in this study;
(a)
Coopérative des femmes NOVIVA, code-named NVC (used for processing gari using four cookstoves code-named NVCS1, NVCS2, NVCS3 and NVCS4);
(b)
Agro Pastoral code-named as APC. The de-watered cassava mash was used for gari processing at AP and AT with a cookstove code-named APCS and ATCS, respectively;
(c)
Coopérative d’Action pour le Développement (CAD) de in Wogba, Vagan code-named as CADC. Processed into gari at participant WB’s facility with cookstoves WBCS1 and WBCS2 and at CAD with a cookstove code-named CADCS.
The cassava was peeled and washed before grating. At the point of roasting, the temperatures of the de-watered and fermented cassava mash were captured, and a kilogram was collected at each processing facility immediately for further laboratory analysis.

2.3.2. Experimental Methodology

Gari processing and samples: All the participants in this study were well-established and experienced cassava processors. The preparation of gari was followed and monitored from cassava harvesting, hand peeling, washing, mechanical grating, 24 h fermentation, mechanical de-watering, sifting and sieving, roasting using wood cookstoves with aluminum pans, gari sieving and final packaging. The actual traditional gari processing techniques were followed and were synonymous with the process described by other researchers [12,13,14,15,16,17]. To ensure originality and in situ functioning, the processors’ usual trends and procedures were maintained.
Each cookstove was regarded as a run, and all batches were completed as replications. At each stage, the batch size (cassava mash input and gari output), roasting duration, gari temperatures, and moisture contents were recorded (batch-wise).
Gari samples were coded according to the respective processor’s cookstoves; for NOVIVA, code-named as NVG1, NVG2, NVG3 and NVG4; for AP as APG, for AT as ATG; for WB as WBG1 and WBG2, and for CAD as CADG.

2.4. Proximate Composition Determination

The techniques of analysis of the American Association of Cereal Chemists (AACC) were applied for proximate analysis of cassava mash and gari [18]. This study examined moisture content (MC) in % using method 44–19.01, total ash (TA) in % using method 08–01.01, crude fiber ( C F b ) % using method 32–10.01, crude protein (CP) in % using method 46–30.01, crude fat (CF) in % using method 30–10.01, pH at 29.7 °C using method 02–52.01 and cyanide content (HCN)-(ppm) was analyzed using the picrate colorimetric methods as modified by [11]. These variables were crucial in determining the thermal characteristics of gari and cassava at various temperatures and moisture contents.
The following expression was used to calculate the carbohydrate content (%) (CHO):
C H O = 100 ( M C + T A + C F b + C P + C F )
On-site, roasted gari moisture content measurements were accomplished using a calibrated moisture meter (PCE-GMM 10-Meter) with an accuracy of 0.5% and validated in the lab using procedure 44–19.01.

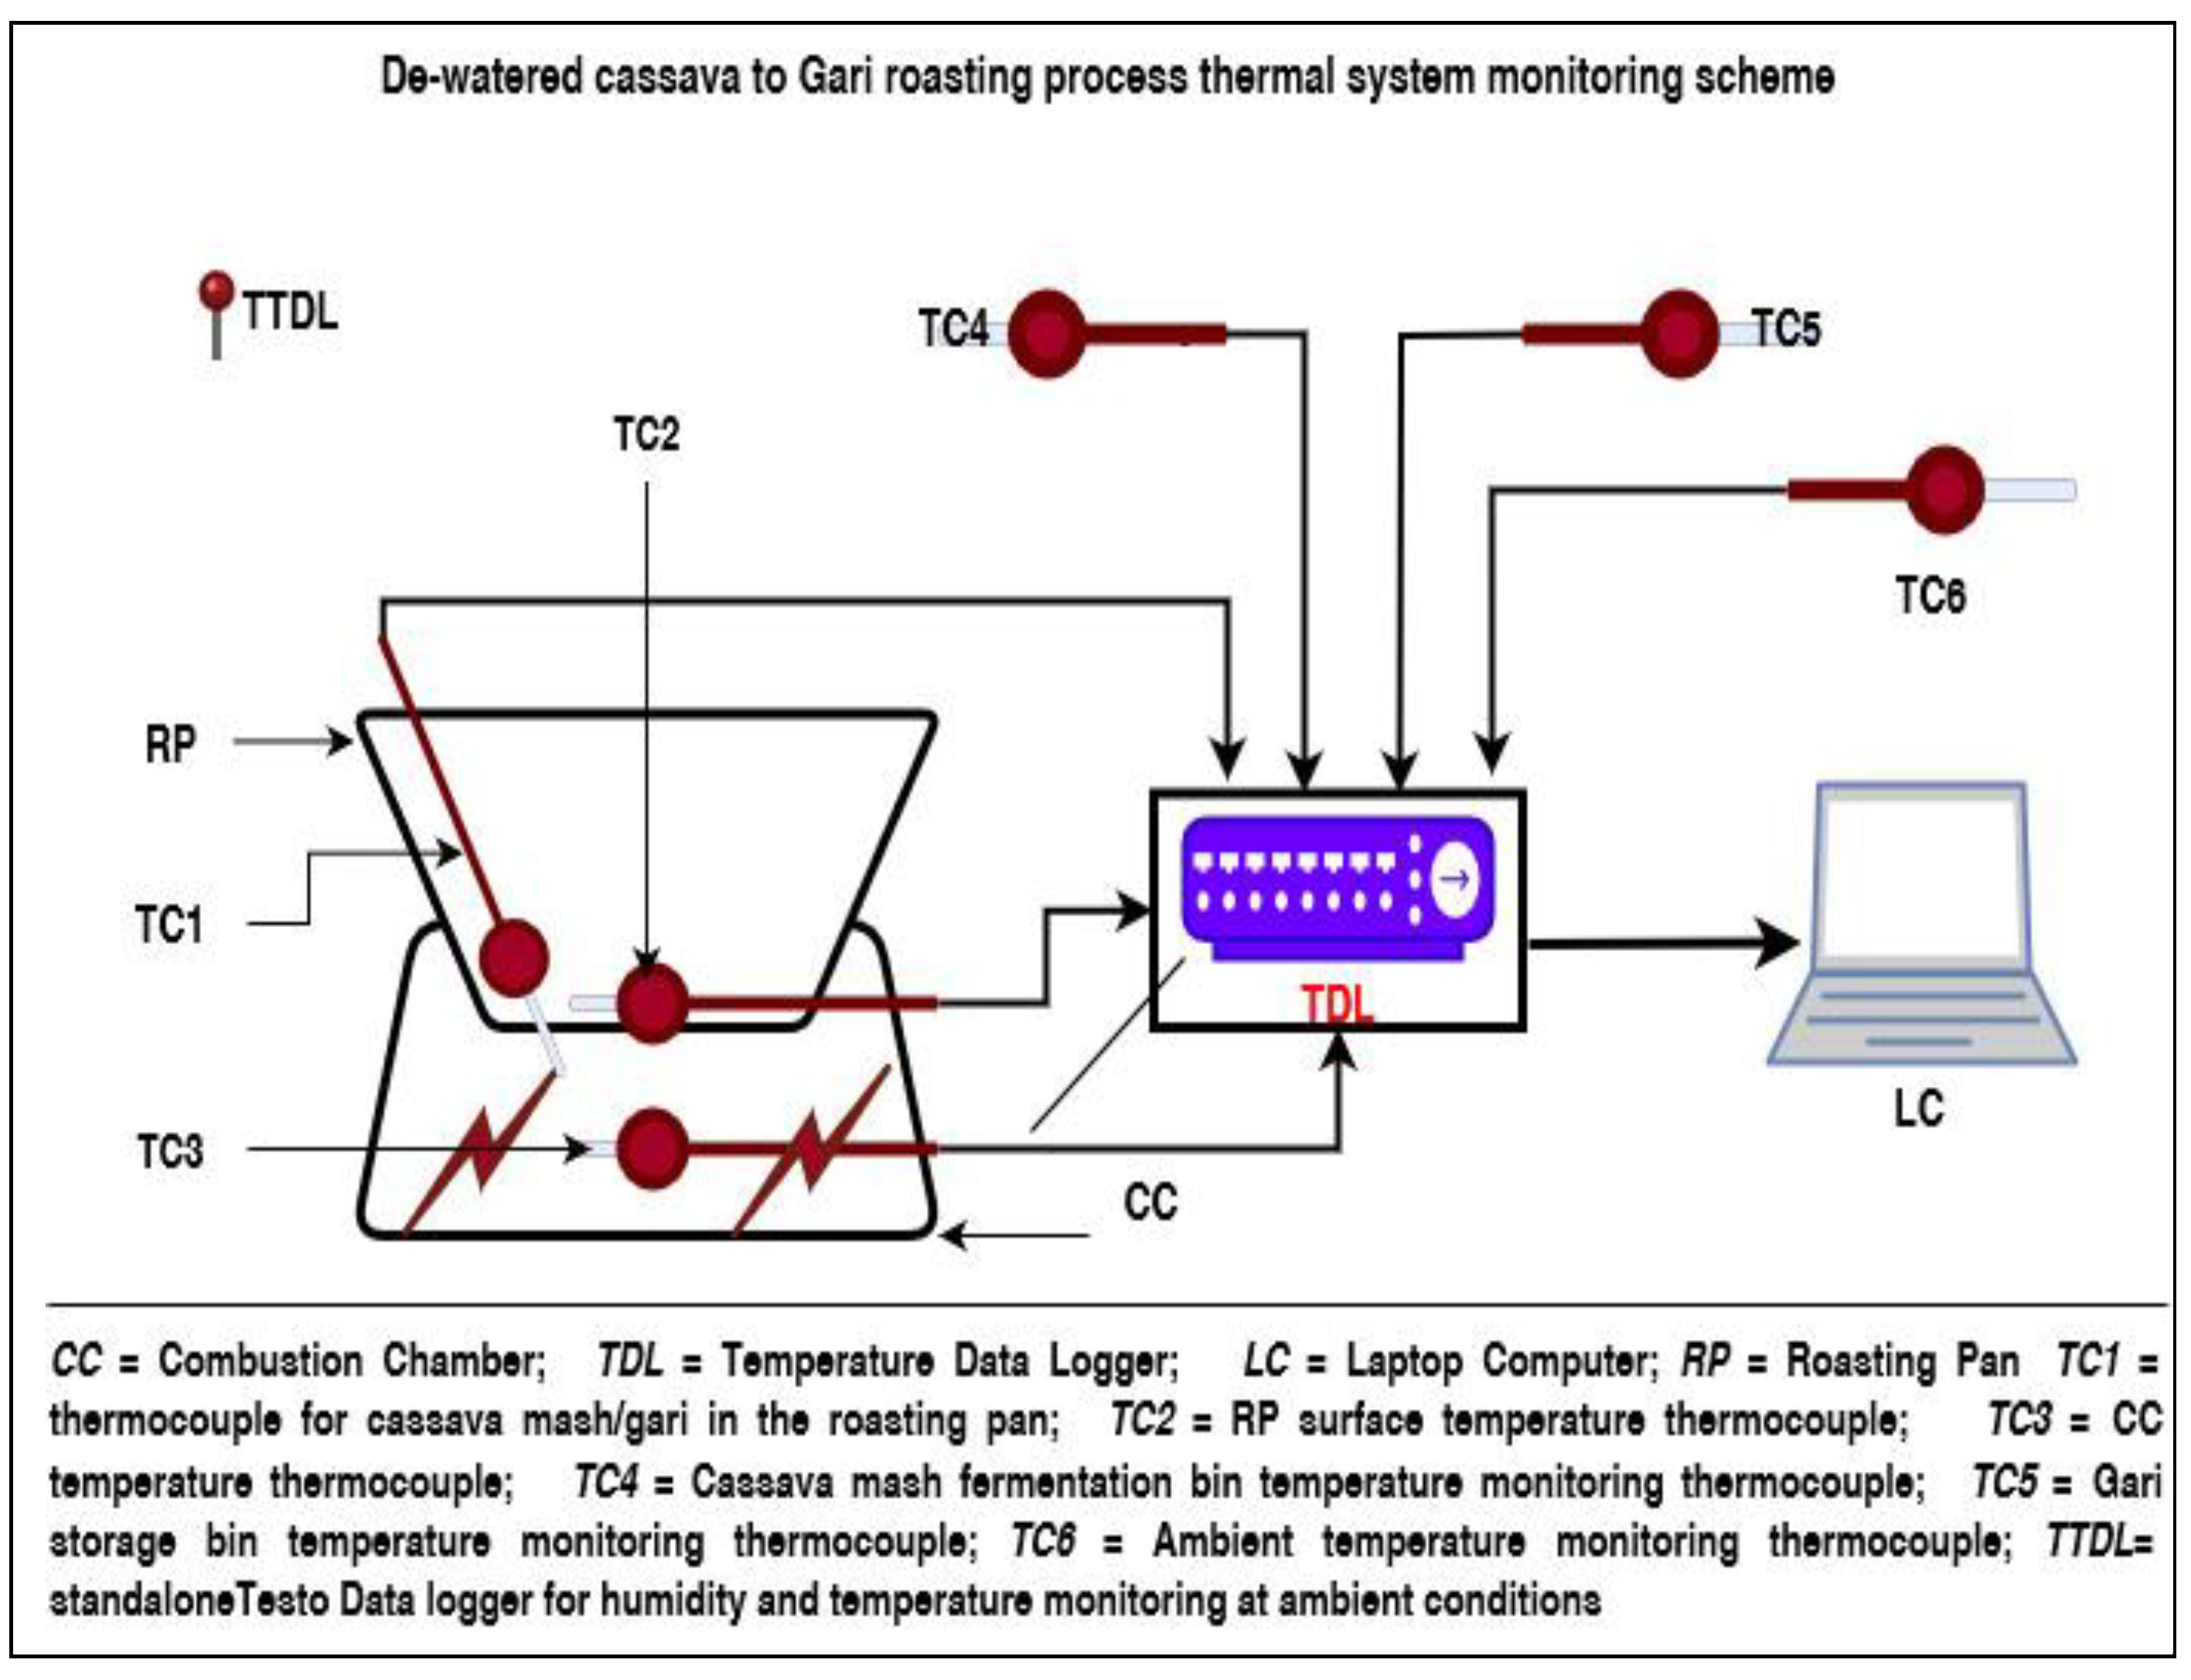
2.5. Determination of Temperatures

The temperature profiles were captured by using the K-type thermocouples with a measuring range of −220 to +1100 °C with class 1 accuracy [19]. The thermocouples were secured in the combustion chamber of the cookstoves as shown in Figure 1, outside for the ambient (TC6), secured carefully 3 mm above the roasting pan surface for the cassava mash/gari (TC1) and in an inserting hole made on the roasting pan for the surface temperatures (TC2). The Fluke Hydra Series II Data acquisition unit 2625A, with ±0.025% accuracy (TDL), was used for data acquisition for further storage on the laptop (LC) [20]. A handheld K202 Voltcraft temperature data logger, with a basic accuracy of 0.3%, was used to validate gari temperatures recorded by TC5 immediately before and after the end of the batch (roasting). TC4 and TC3 were utilized, respectively, to track the temperatures of the de-watered cassava mash and the combustion chamber. The installation of every monitoring device was done so as not to inconvenience the operator. A TTDL testo 174 H data logger was used for humidity and ambient temperature monitoring.

2.6. Determination of Density and Thermal Properties

Based on the outcomes of the proximate analysis, predictive empirical models (Table 1) were used to calculate the thermal conductivities (k), specific heat capacities (Cp), diffusivity (α) and true density (ρp) (here referred to as density) of the cassava and gari samples. Due to over-dependence on temperatures by major food components like ash, protein, fat, carbohydrates (CHO), fibers, pure water, and ice, Y. H. Choi and Okos [15] developed and reported general density and thermal properties (k, Cp, α) equations at temperature ranges of −40 and 150 °C [21]. Based on published research that highlighted that conductive drying, such as cassava mash roasting into gari on a pan, obeys the thin-layer drying models, and granules have an isotropic physical structure, a parallel energy flow model was adopted in this study [22].
Table 1. Food components density and thermal property equations [21] (temperature varies between −40 to 150 °C).
Thermal PropertyFood ComponentThermal Property Model
Thermal conductivity, W/(m·°C)Water k w = 5.7109 × 10 1 + 1.7625 × 10 3 t 6.7036 × 10 6 t 2 (2)
Protein k p = 1.7881 × 10 1 + 1.1958 × 10 3 t 2.7178 × 10 6 t 2
Fat k f = 1.8071 × 10 1 2.7604 × 10 3 t 1.7749 × 10 7 t 2
Carbohydrate k C H O = 2.0141 × 10 1 + 1.3874 × 10 3 t 4.3312 × 10 6 t 2
Fiber k f i b = 1.8331 × 10 1 + 1.2497 × 10 3 t 3.1683 × 10 6 t 2
Ash k a s = 3.2962 × 10 1 + 1.4011 × 10 3 t 2.9069 × 10 6 t 2
Density (kg/m3)Water ρ w = 9.9718 × 10 2 + 3.1439 × 10 3 t 3.7574 × 10 3 t 2
Protein ρ p = 1.3299 × 10 3 5.1840 × 10 1 t
Fat ρ f = 9.2559 × 10 2 4.1757 × 10 1 t
Carbohydrate ρ C H O = 1.5991 × 10 3 3.1046 × 10 1 t
Fiber ρ f i b = 1.3115 × 10 3 3.6589 × 10 1 t
Ash ρ a s = 2.4238 × 10 3 2.8063 × 10 1 t
Specific Heat J/(kg·°C)Water C p w = 4.1762 × 10 3 9.0864 × 10 2 t + 5.4731 × 10 3 t 2
Protein C p p = 2.0082 × 10 3 + 1.2089 t 1.3129 × 10 3 t 2
Fat C p f = 1.9842 × 10 3 + 1.4733 t 4.8008 × 10 3 t 2
Carbohydrate C p C H O = 1.5488 × 10 3 + 1.9625 t 5.9399 × 10 3 t 2
Fiber C p f i b = 1.8459 × 10 3 + 1.8459 t 4.6509 × 10 3 t 2
Ash C p a s = 1.0926 × 10 3 + 1.8896 t 3.6817 × 10 3 t 2
The Choi and Okos equations [15] used in this study to calculate the densities and thermal characteristics of cassava and gari at various operating parameters attained (temperatures and moisture contents) during processing are shown in Table 1.

2.6.1. Thermal Conductivity

In this study, the roasting pan and cassava mash components were assumed to be parallel to the orientation of the cookstove chamber, as highlighted by Sahin and Sumnu [21]. Therefore, to calculate the effective thermal conductivity, true density, specific heat capacity, and thermal diffusivity of cassava mash and gari samples, all constituents (n) were considered and calculated using volume fractions and thermal conductivities (ki) of each component (i), and the following expressions were applied:
k p a = i = 1 n k i X i v
where,
X i v = X i w ρ i i = 1 n X i w ρ i
where;
X i v = volume fraction of the ith constituent of cassava mash or gari,
X i w = mass fraction of the ith constituent of cassava mash,
ρ i = density of the ith constituent of cassava mash or gari (kg m−3).

2.6.2. Determination of Specific Heat Capacities

Water makes up more than 60% of a cassava’s flesh weight. However, before gari roasting, some of this water is de-watered to a level of around 50% MCwb to reduce roasting time and, therefore, energy, and reduce the need to roast at higher temperatures, thereby avoiding sticking, agglomeration and browning [23]. The following expression, as stated by Sahin and Sumnu [21], was used to calculate the specific heat capacity of the de-watered cassava mash and gari:
C p = i = 1 n X i w C p i
where,
X i w = mass fraction of component i,
C p i = specific heat capacity of component i (J kg−1 °C−1).

2.6.3. True Density Determination

The true density ( ρ p ), (otherwise referred to as density in this study) of food materials is temperature dependant, and if the constituents (pure water, CHO, protein, fat, ash, fiber and ice) of foods are known, the densities of different foods can be worked out from the models developed by [15] as highlighted in Table 1 and expressed below:
ρ p = 1 i = 1 n X i w ρ i
where X i w = mass fraction of component i, ρ i = density of component i (kg m−3).

2.6.4. Thermal Diffusivity Determination

Thermal diffusivity ( α ) in (m2 s−1) was worked using the following equation:
α = k ρ T C p
where,
k = thermal conductivity,
Cp = specific heat of cassava or gari.
This method is recommended mostly for materials subjected to temperatures higher than 13 °C [24].

2.6.5. Prediction Models Validation (Average Percentage Errors Method)

The findings of this study were compared to models established by other researchers based on data extracted via measurement techniques such as:
  • Thermal conductivity: Transient techniques via a hot-wire probe, thermal conductivity probe, dual probe methods and transient methods, including the light heat source method [5,7,25,26,27];
  • Specific heat capacities: Differential scanning calorimeter [28];
  • Density: Toluene pycnometer, water displacement methods and actual mass divided by actual volume methods [5,6,27,29];
  • Diffusivity: Transient heat source methods using a dual needle sensor KD2 Pro Controller, transient techniques via a hot-wire probe, and measured density-based calculations [25,28,30]
The models derived from the measured methods were fitted into the data achieved in this study, and results were compared through model fitting in JMP. The deviation between the values was expressed as the average percentage error, Eav, as follows:
E a v = d a c d r e t / d a c × 100 / n
Given, d a c = results obtained from this study, d r e t = comparable data from literature and n = number of data sets from the batches run. This validation method was applied by Erdogdu et al. [24,28].

2.7. Statistical Analysis

In this study, each processor was designated a treatment status, the cookstove utilized for gari roasting as a run, and the batches obtained as replications. However, it should be noted that this study was based on the owners’ preferences for the actual processing techniques used at each facility treatment (traditional gari processing methods).
The thermal conductivity, true density, specific heat capacity, and diffusivity were calculated using worksheets created in Microsoft Excel based on the calculations in Table 1. The data was then aggregated and organized based on the codes. All data were statistically processed using JMP Pro 17. For creating and analyzing the statistical significance of the data sets and comparing the regression models, regression analysis, multivariate methods, fit models, and ANOVA were employed. The coefficient of determination (R2) above 0.8 as a proportion of variation in the response to this study’s model was used for model screening. The R2 values below 0.8 were regarded as insufficient to explain the relationship between the models generated in the present study. Further, the Coefficients of Variations (CoV) were used for determining the extent of data dispersion and were maintained at less than 10 ± 3% to satisfy an adequate response model. These data-processing methods have been reported by [31,32].

3. Results and Discussion

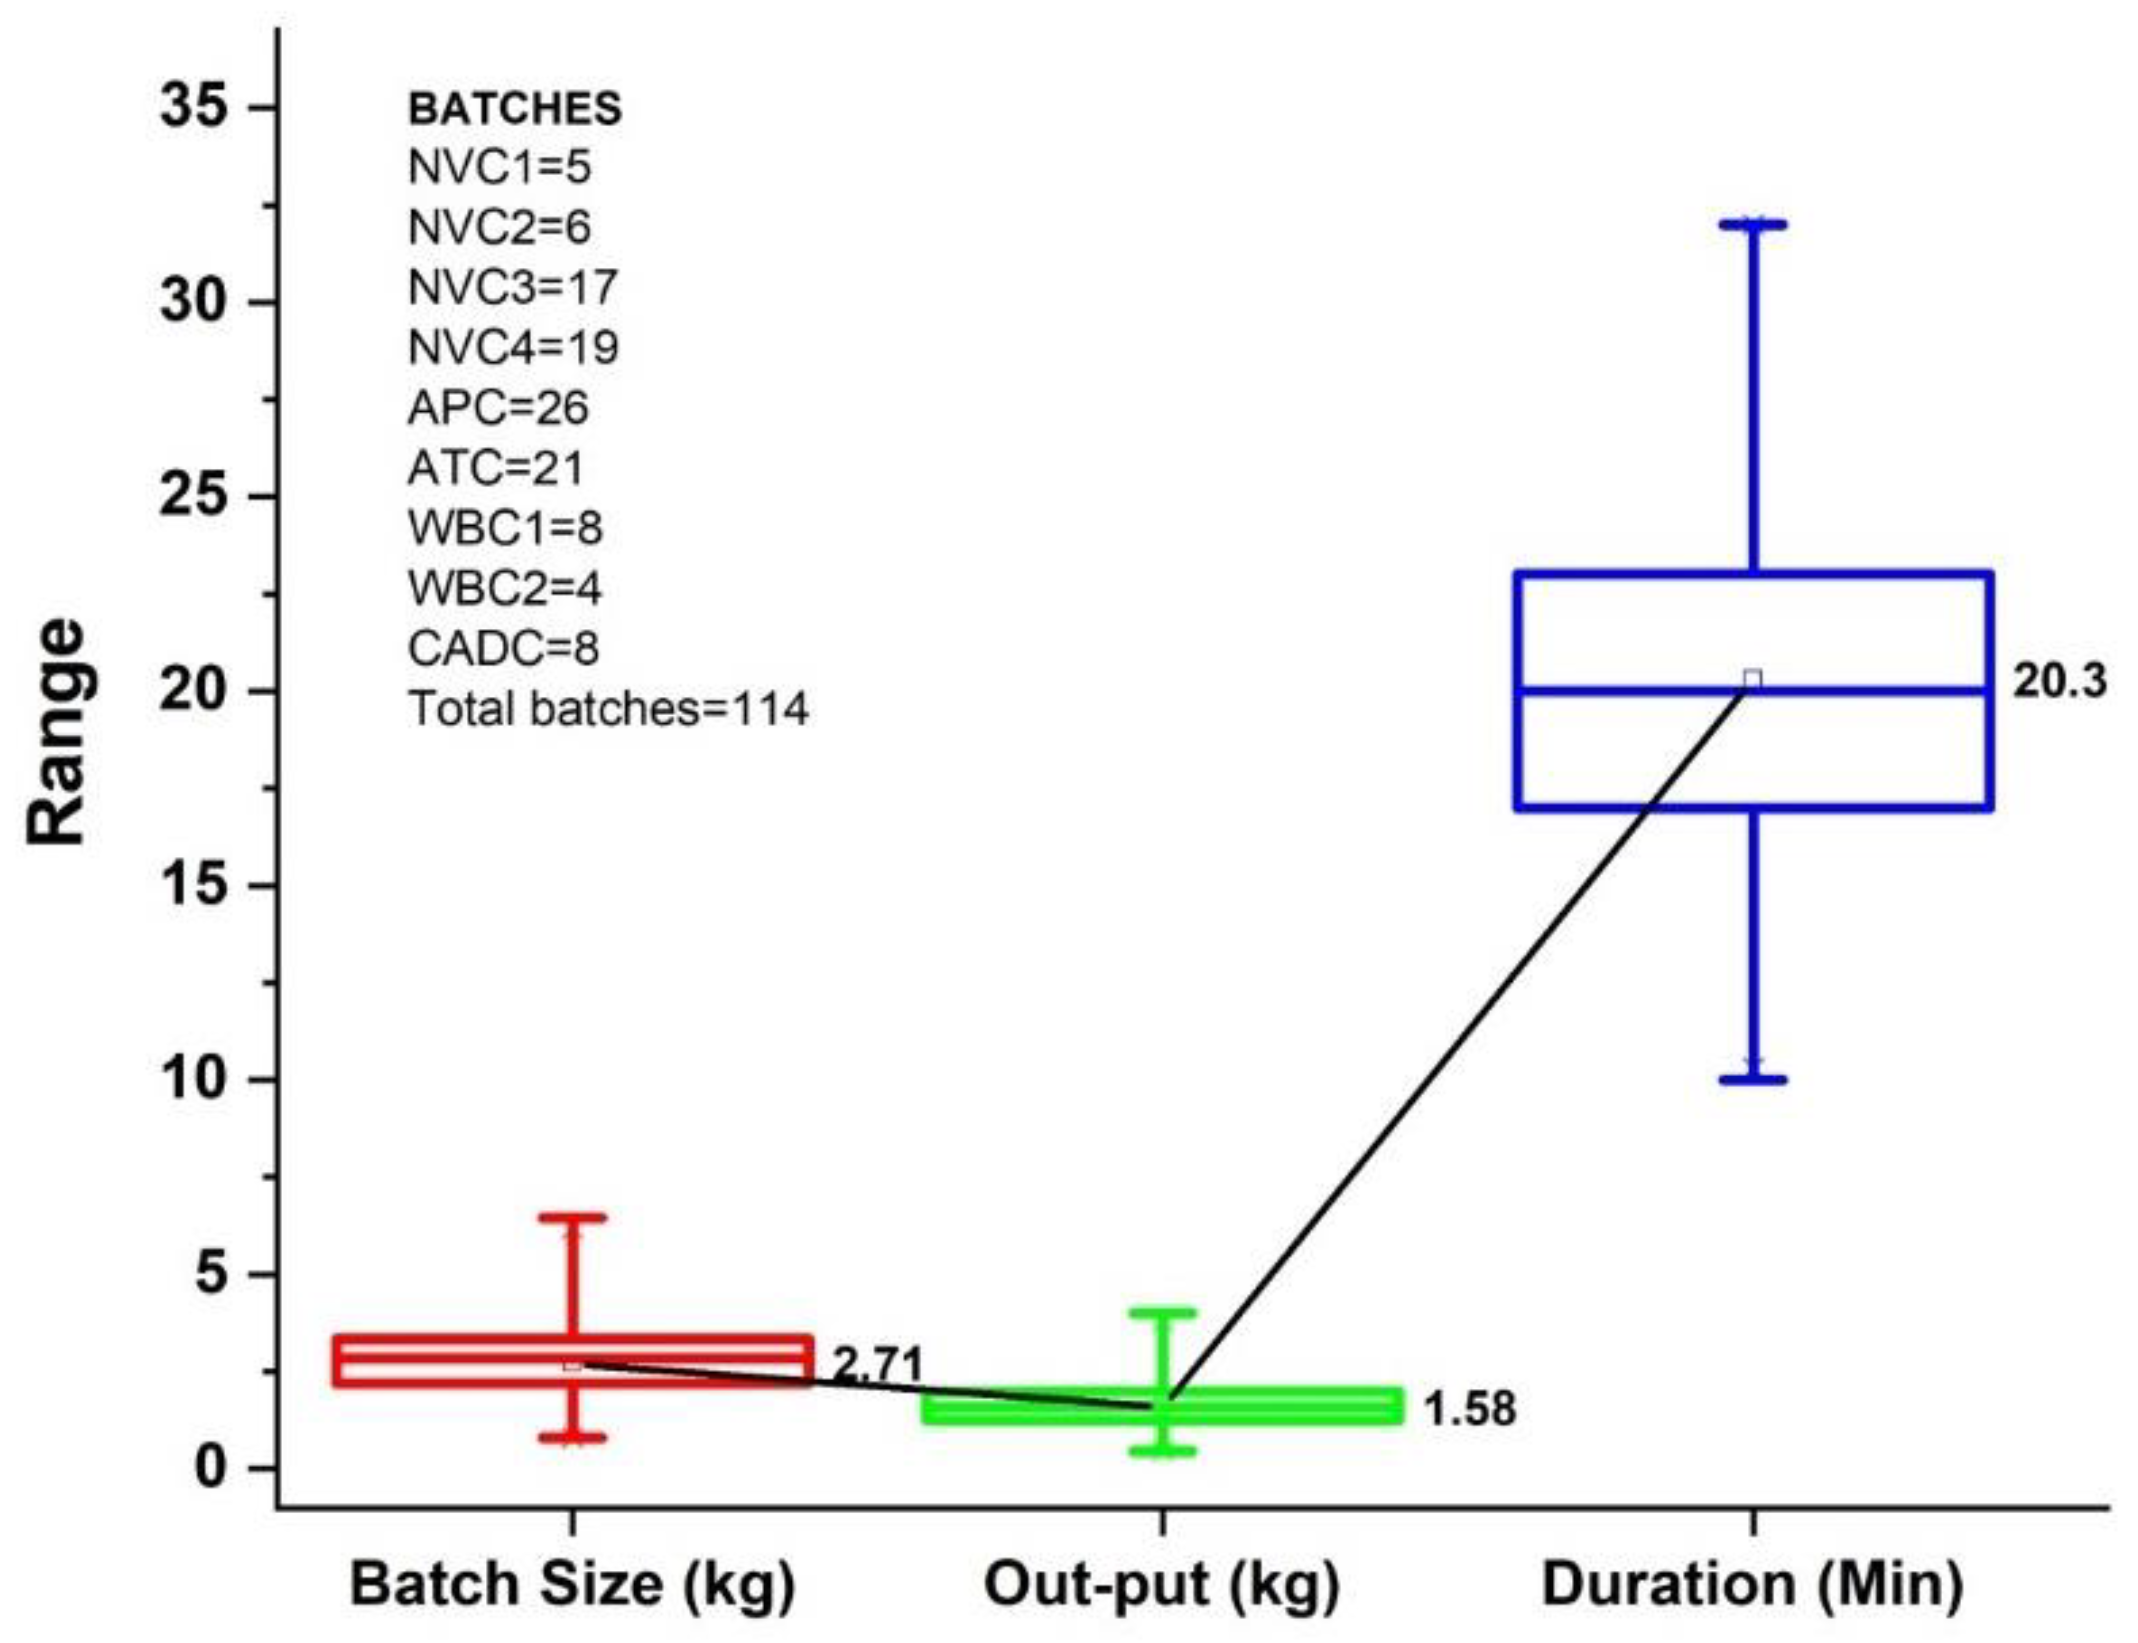
3.1. Mean Operations Parameters Achieved

The mean garification process parameters achieved in this study are presented in Figure 2. Each site (treatment), the cookstoves used (runs) and the number of batches (replications) achieved are indicated on the left side. The maximum and minimum time spent was 32 min and 10 min, respectively. The garification parameters achieved in this study are comparable to other studies [33,34]. Temperatures and moisture contents (dry matter and wet basis) achieved are highlighted in Table 2.
The higher CoV values achieved between the batch size input (38%), batch output (39.23%) and roasting duration (21.97%) could be attributed to the substantial feeding gap witnessed during this study (0.76 kg to 6.46 kg/batch) and the different final gari moisture ranges witnessed (2.3% minimum to 11.8% maximum). Gari quality and output are largely influenced by the process implemented and operator [23].

3.2. Proximate Analysis of Cassava and Gari

The chemical composition of the cassava mash and the roasted gari from nine different cookstoves are compared and shown in Table 2. The dry matter (DM) for the cassava mash ranged from 50.77 ± 0.72% (NVC) to 52.18 ± 1.47% at APC and (not significantly different at p < 0.0001 level) with R2 = 0.30, with MCwb of 47.82 ± 1.47%, 48.3 ± 0.99% and 49.23 ± 0.72% at APC, CADC and NVC respectively (not significantly different at p < 0.0001 (R2 = 0.30). Similar DM and MCwb have been reported [17,35,36]. After roasting, a process that involved contact drying with frequent agitation on the roasting pan using wood cookstoves, the processed cassava mash’s (now gari) DM and MCwb were between 92.12 ± 0.05% (MCwb = 7.88 ± 0.05%) for CADG and 94.78 ± 0.04% (MCwb = 5.22 ± 0.04%) at CADG. The DM and MCwb at NVG1 and APG were not significantly different at p = 0.0001 (R2 = 0.02), just like NVG4 and WBG1 (R2 = 0.33). The rest of the DM and moisture values were significantly different at p = 0.0001. Similar DM and MCwb values have been reported [8,11,35,36].
Cassava is a carbohydrate-rich root, and in this study, the cassava mash had between 44.64 ± 0.71% (NVC) to 47.80 ± 1.02% at CADC. The CHOs for all cassava mash samples were significantly different at p < 0.0001 level (R2 = 0.68). Gari produced at CADG had the highest CHO (88.10 ± 0.08) followed by 87.33 ± 0.11% at NVG, and the least was APG with 85.81 ± 0.33 (all on a dry basis). CHO values of 52.62% to 94% for gari and 25.3% to 48% for cassava mash have been reported by other researchers [8,11,35,37,38,39]. It is to be noted that in this study, the properties of the de-watered and fermented cassava mash (MCwb = 38% to 50%) were used as opposed to the fresh cassava (MCwb = 54% to 90%). Moisture content has a great influence on the chemical composition of cassava [8,40,41].
The highest and least CFb of 1.96 ± 0.03% and 1.31 ± 0.03% was recorded at APC and NVC, respectively, lower than the reported 2.88 ± 0.10% to 5.01% by Laya et al. [11], but within the 0.43% to 5.85% reported by Akely et al. [36] and Oke [35] and the Codex standard. The initial higher CFb content of the cassava roots, an aspect already documented, and the increase in the concentration of the CFb per unit weight in gari after roasting may be responsible for the average 23.38% increase in CFb after roasting [11]. This verified the claim that the locally grown katawole cassava type in Togo is a very fibrous storage root [42].
The TA content ranged from 0.83 ± 0.04% (CADC) to 1.75 ± 0.02% (NVC), APC stood at 1.46 ± 0.07%, and all means were significantly different at p < 0.0001 value (R2 = 0.99). In gari, the TA was 2.62% (about 48.47% higher than the cassava mash TA) on average. The increase in TAs after roasting, witnessed by other researchers, could be attributed to the activities of the microorganisms on CHO conversion to fats during the fermentation process [11,43,44,45,46,47].
As for the CF, an average reduction of 11.11% after roasting was registered from about 0.63% availability in the cassava mash to about 0.56% in gari. The levels are within the reported ranges [36,43,48].
NVC ranked highest in CP content at 2.44 ± 0.02%, followed by APC at 2.16 ± 0.10%, and the lowest was CADC with 1.21 ± 0.02% (all protein means significantly different at p < 0.0001 (R2 = 0.99). However, gari registered between 12.67% to 48.1% losses, as can be seen in the ATG, which registered 1.88 ± 0.07% of protein content as opposed to the 2.16% initially present in the APC cassava mash, and WBG1 registered 0.63 ± 0.02% from the initial 1.21% present in CADC cassava mash. The deficiency of CP in gari has been adequately highlighted and could be associated with the microorganisms’ activities and the effect of heat [11,49,50].
The averages of the HCN from the Cyanogenic Glycoside were significantly different at p = 0.0001 (R2 = 0.99) with the highest of 45.69 ± 0.74 ppm (pH = 7.82 ± 0.03%), from CADC, 24.65 ± 1.51% (pH = 6.55 ± 0.13%) from APC and 17.84 ± 0.15 ppm (pH = 6.54 ± 0.17%) from NCV. The highest HNC levels reported in this study are lower than what Njankouo Ndam et al. [41] reported. However, there was a significant reduction from an average of 29.39 ppm to 4.7 ppm after the roasting of the cassava mash. This could be a result of the liberation of freer HCN in the gaseous form after undergoing acid hydrolysis at 100 °C heating effect. The values achieved weere within the recommended safe levels by WHO and achieved/reported by other researchers [8,36,51,52,53].
The pH of NVC and APC were not significantly different at p < 0.0001 (R2 = 1.85 × 10⁻⁴) but significantly different from CADC (R2 = 0.98). The pH was reduced by a mean of 39.45% (cassava—6.97 against gari—4.22) in gari and within the ranges reported by other authors (Table 2). The acceptability of gari is said to be based on and influenced by the lactic acid sourness, which also depends on the lengthy time of fermentation (the longer the fermentation period, the lower the pH and the sourer test on the gari). The pH above 4 helps in the hydrolyzation of Cyanogenic glucoside to free cyanide (HCN reduction) [9]. The reduction could be attributed to the microorganism-induced fermentation on the cassava mashes [54,55].
Generally, the three types of cassava mash used in this study had proximate compositions that were significantly different from those obtained after gelatinization at all facilities, which was consistent with earlier research [55]. It was discovered after interviewing all processors that the local cassava variety, known as Katawole, was used by all facilities. Therefore, the calculations were considered reliable enough to be applied for thermal and density characteristics computation.

3.3. Thermal Properties and Density

The thermal properties and other parameters attained in this study before and after the processing of the de-watered cassava mash into gari are highlighted in Table 3 and Table 4 and discussed individually.

3.3.1. Thermal Conductivities

The k-values ranged from 0.34 ± 0.002 to 0.35 ± 0.00002 W m−1 °C−1 for the cassava mash at initial fermentation temperatures of 34.82 ± 0.96 to 35.89 ± 0.78 °C and MCwb values of 47.82 ± 1.47 to 49.23 ± 0.72% (Table 3). After gelatinization at roasting temperatures of 98.9 ± 13.60 °C to 114.29 ± 5.78 °C, the gari presented significantly different (p < 0.0001) k-values of 0.27 ± 0.03 to 0.31 ± 0.01 W m−1 °C−1 at MCwb values of 5.22 ± 0.04 to 7.88 ± 0.05% (Table 4). The k-values between the cassava mashes decreased with increased roasting temperatures and reduced MCwb. The achieved k-values in this study are within the threshold of k-values of water and air (the highest and lowest food conductive mediums) of 0.614 and 0.026 W m−1 °C at 27 °C, respectively. The conductivity ratings of foods lay between these limits [21].
The lower thermal conductivity of gari compared to the cassava mash, as witnessed in this study, could be attributed to the fact that dry and porous materials like gari are poor conductors of heat and, as they dry up, the water with 0.614 W m−1 °C evaporates, leaving the pores to be occupied by air with lesser k-values of 0.026 W m−1 °C [21].

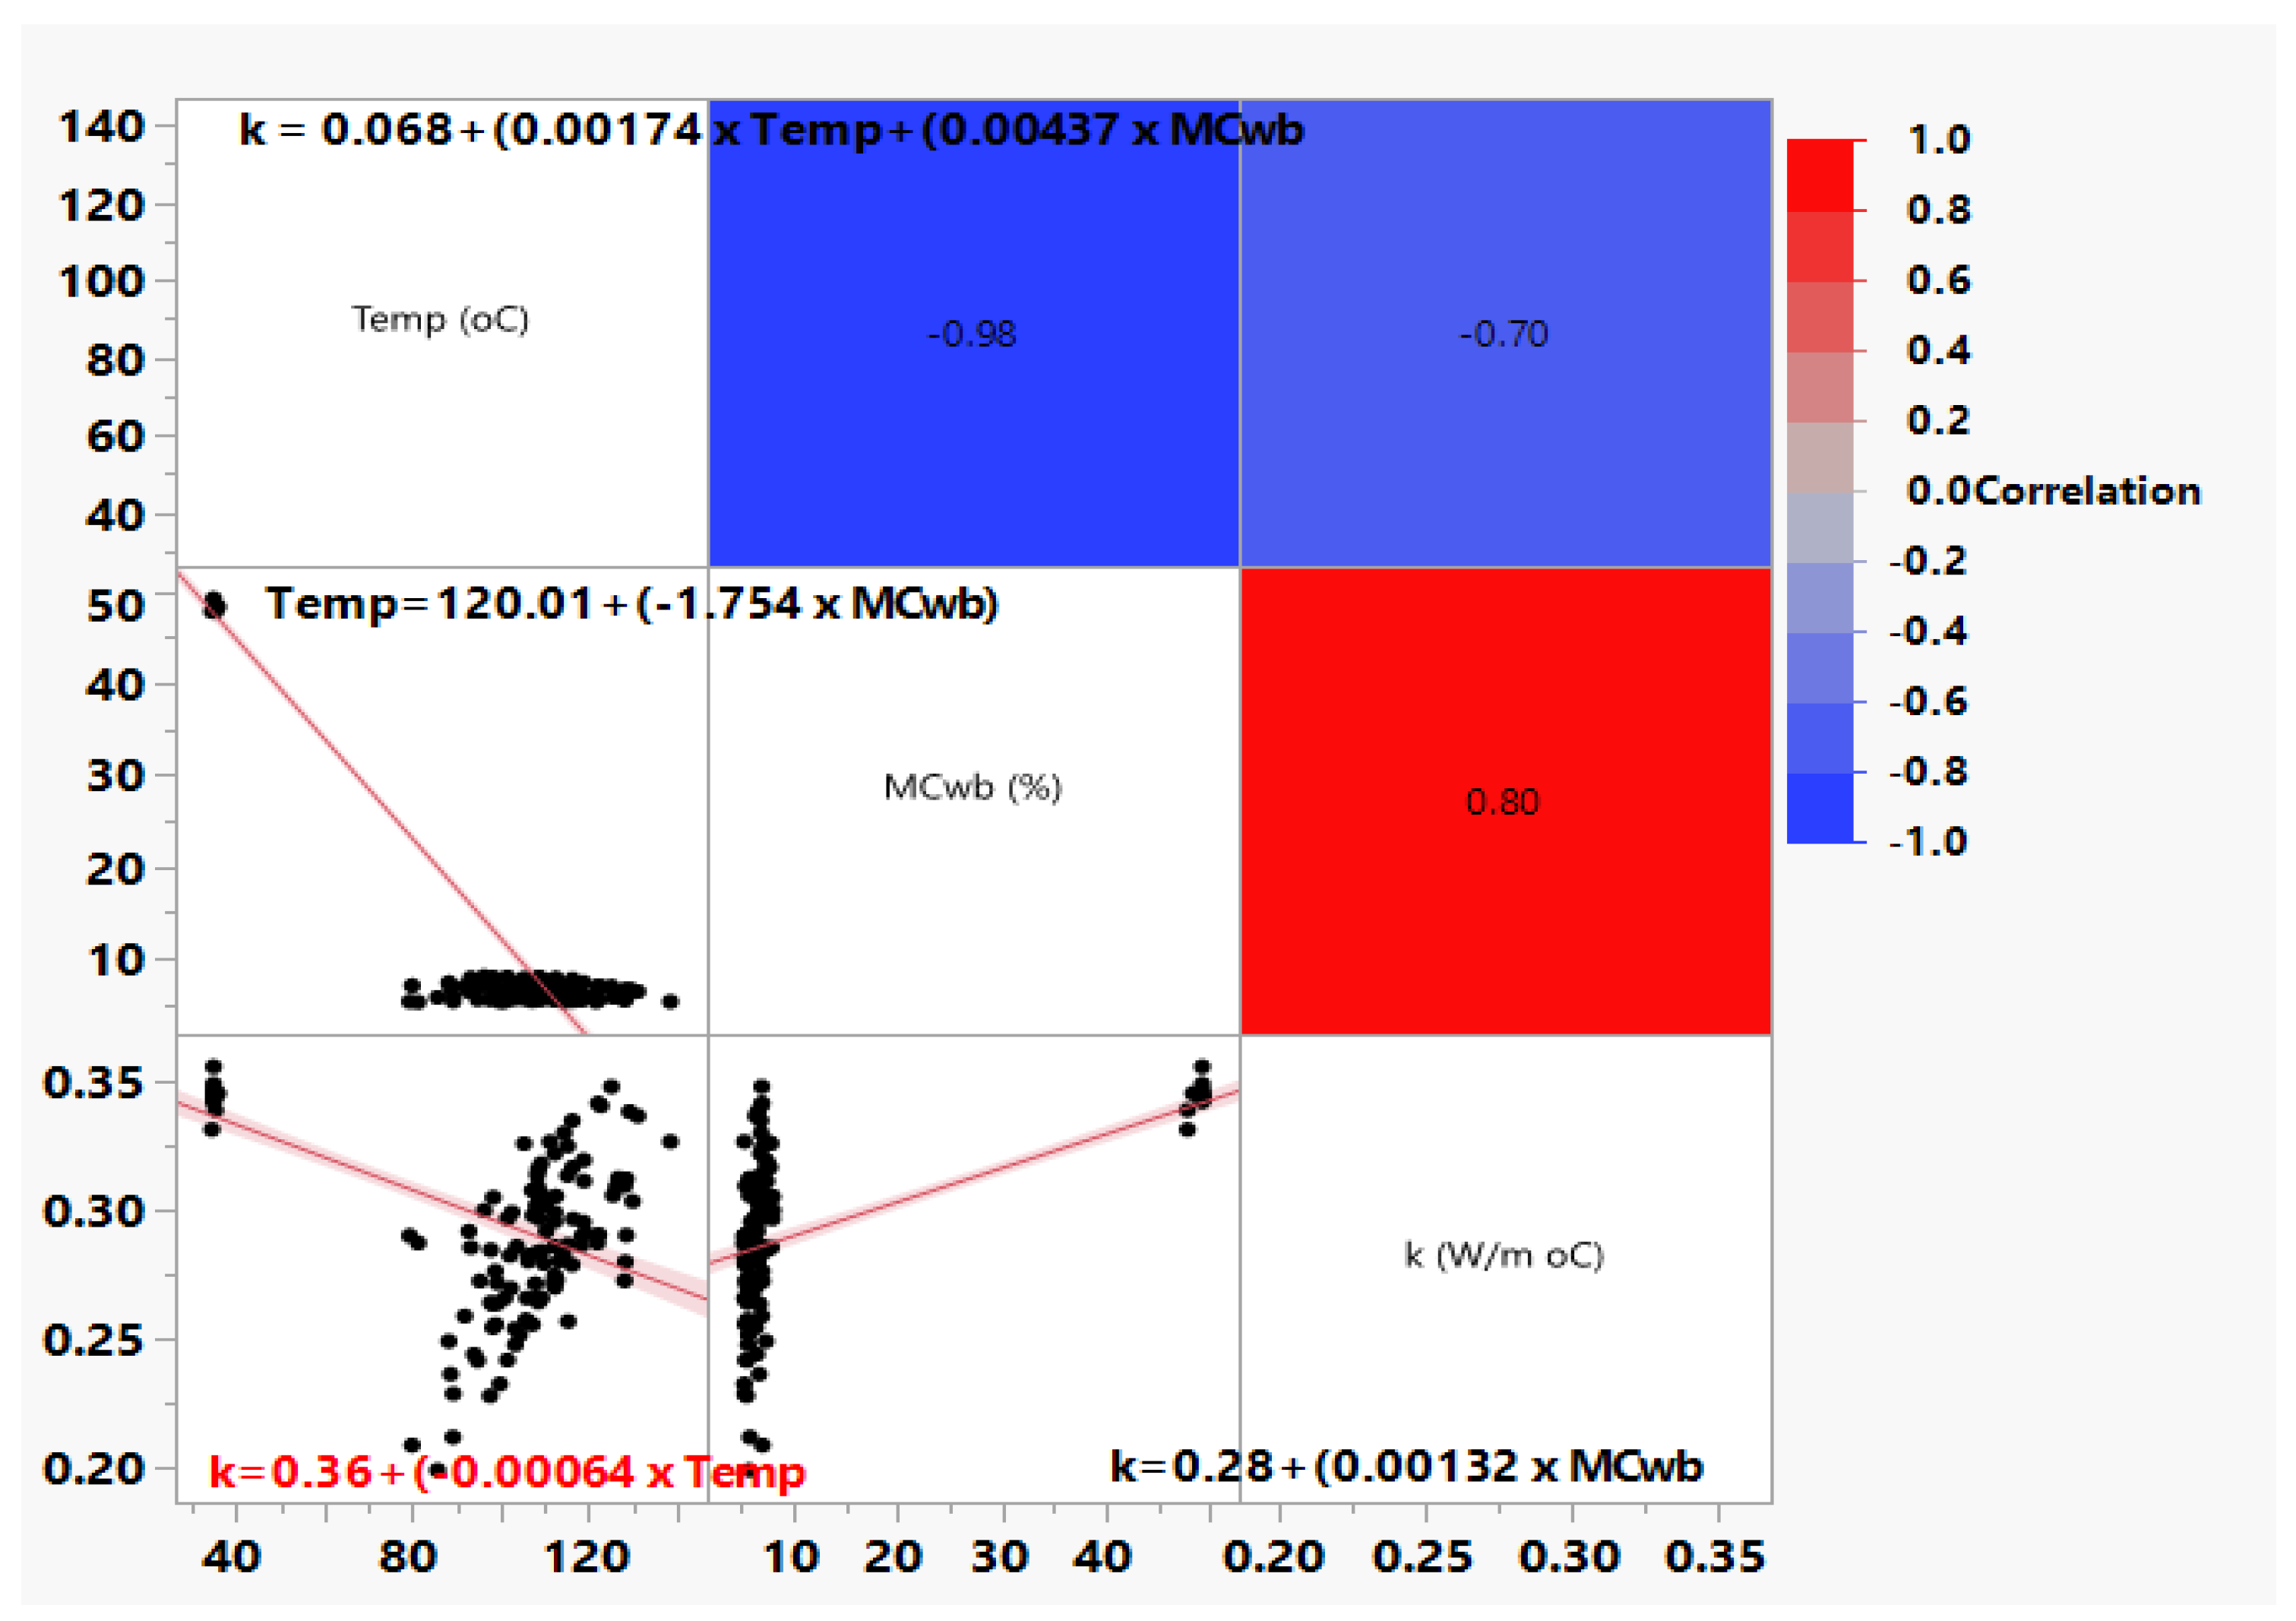
Correlation and Prediction Models of Thermal Conductivity, Temperature and Moisture

In the scatterplot matrix performed in this study, as presented in Figure 3, the correlation of MCwb, temperatures and k of all the samples are highlighted. The following prediction models were developed:
T e m p = 119.87 + ( 1.73 × M C w b )
k t e m p = 0.36 + ( 6.4 × 10 4 × T e m p )
k M C w b = 0.28 + ( 1.32 × 10 3   ×   M C w b )
There was a strong negative correlation between the temperature and MCwb (R2 = −0.98) at p < 0.0001. As the roasting temperatures increased, the MCwb values reduced, and the two were related by a regression Equation (9). The temperature showed a weaker and negative correlation (R2 = −0.70) with k values and related by Equation (10) (ktemp), as compared to a much stronger and positive correlation MCwb had (Equation (11) (kMCwb) (R2 = 0.80). This shows that moisture had a more direct proportion effect on the thermal conductivity than temperature. This has been linked to the fact that during drying, as heat is applied to a mass in unit time, a vapor pressure differential arises between the granules’ moisture and the surrounding environment, forcing the inner moisture to migrate to the granules’ surface and then to the hot air [56]. As shown in Table 3 and Table 4, at lower MCwb, gari had lower k-values as compared to the cassava mashes. This behavior has been reported by other authors and could be attributed to the fact that moisture content (Water) dominates the composition of most agricultural products, and during drying, as the temperatures increase, the moisture reduces, thereby leaving pours that are then occupied by air a less conductive medium compared to water [28,57,58,59].
After subjecting all the data from all batches to the Multiple Linear Regression Model Fitting (MLRMF) in JMP, the thermal conductivity general model Equation (12) (kGeneral) was developed. Each gari processing facility’s data (treatment) were fitted to develop Equations (12)–(15) for NOVIVA (kNV), AP (kAP) and CAD (kCAD), respectively.
kGeneral = 0.068 + (1.74 × 10⁻³ × Temp) + (4.37 × 10⁻³ × MCwb)
kNV = 0.014 + (2.2 × 10⁻³ × Temp) + (5.1 × 10⁻³ × MCwb)
kAP = 0.024 + (2.0 × 10⁻³ × Temp) + (5.1 × 10⁻³ × MCwb)
kCAD = 0.16 + (1.12 × 10⁻³ × Temp) + (2.9 × 10⁻³ × MCwb)

Validation of k Prediction Models
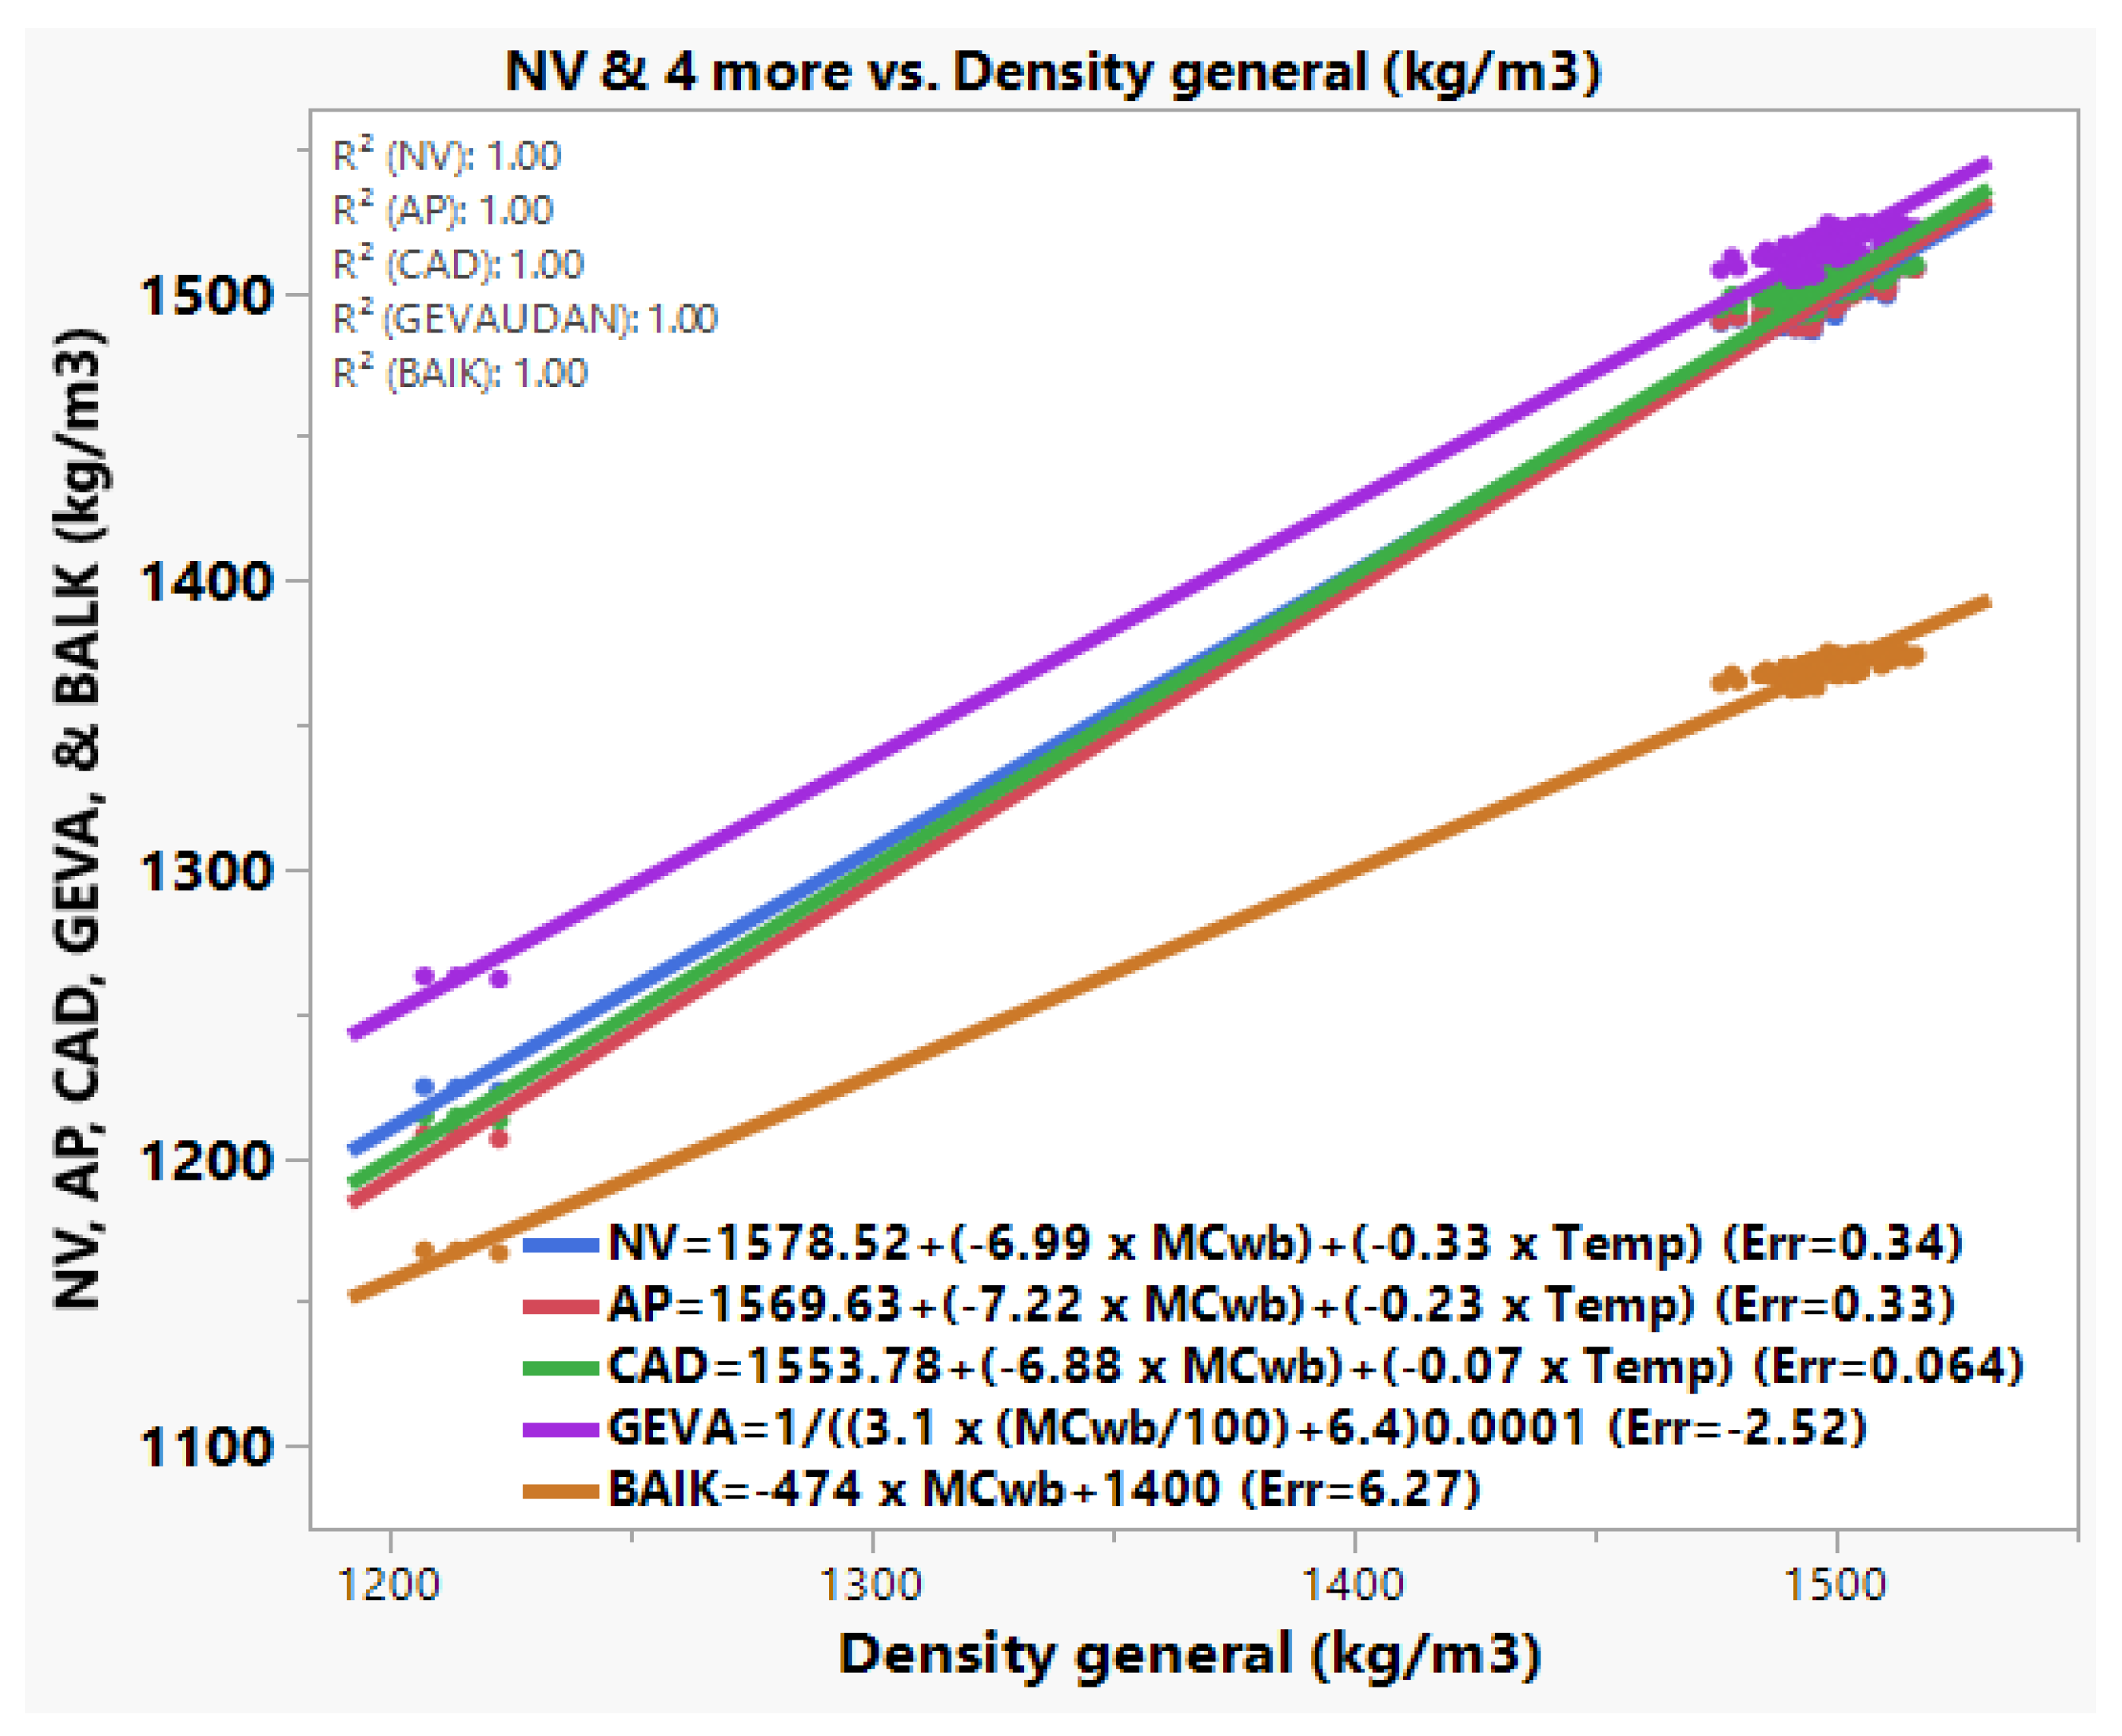
Comparisons saved as the foundation for the validation of the general model (kGeneral) created in this study. The k-values obtained by other researchers utilizing the measuring techniques described in Table 5 presented a mean percentage error of 10.88% from kGeneral. The sweat model for meats and fish had the highest error of 31.2%, compared to the 6.18% obtained when only the MCwb and temperatures of the cassava mash were aggregated. These results could be a confirmation of the MCwb range this model was anticipated to fall within (60–80%) [31]. Even though Kustermann et al. [25] ramped their model to MCwb and temperatures of 8 to 45% and 5 to 45 °C, respectively, only a 13.1% error was exhibited when fitted with this study’s MCwb and temperature data with R2 of 0.93 (p < 0.0001). This could be attributed to almost the same range of moisture contents between the grain and the cassava mash/gari (6% to 49%). With a 6.3% error, Cansee et al.’s [27] model presented a minimum error. This might be explained by the homogeneity of the approximate qualities among the many cassava varieties. Between the models obtained from the processing facilities and the kGeneral, the error was between −0.2 to −3.3%. This could be a result of different cassava proximate qualities and process parameters. Gratzek and Toledo [60] measured the k-values of solid foods at higher temperatures between 20 and 140 °C and MCwb ranges of 90.3% to 94.4%. The findings they obtained showed a variance of 4.2% (−3.9 to 14.2% error) to this study after fitting their data to the kGeneral.

3.3.2. Density

The density values achieved in this study at initial and final temperatures and MCwb ranged from 1207.72 ± 0.12 to 1223.09 ± 0.35 kg m−3 for the cassava mash (Table 3) and 1490.07 ± 1.41 to 1511.11 ± 1.30 kg m−3 for gari (Table 4).

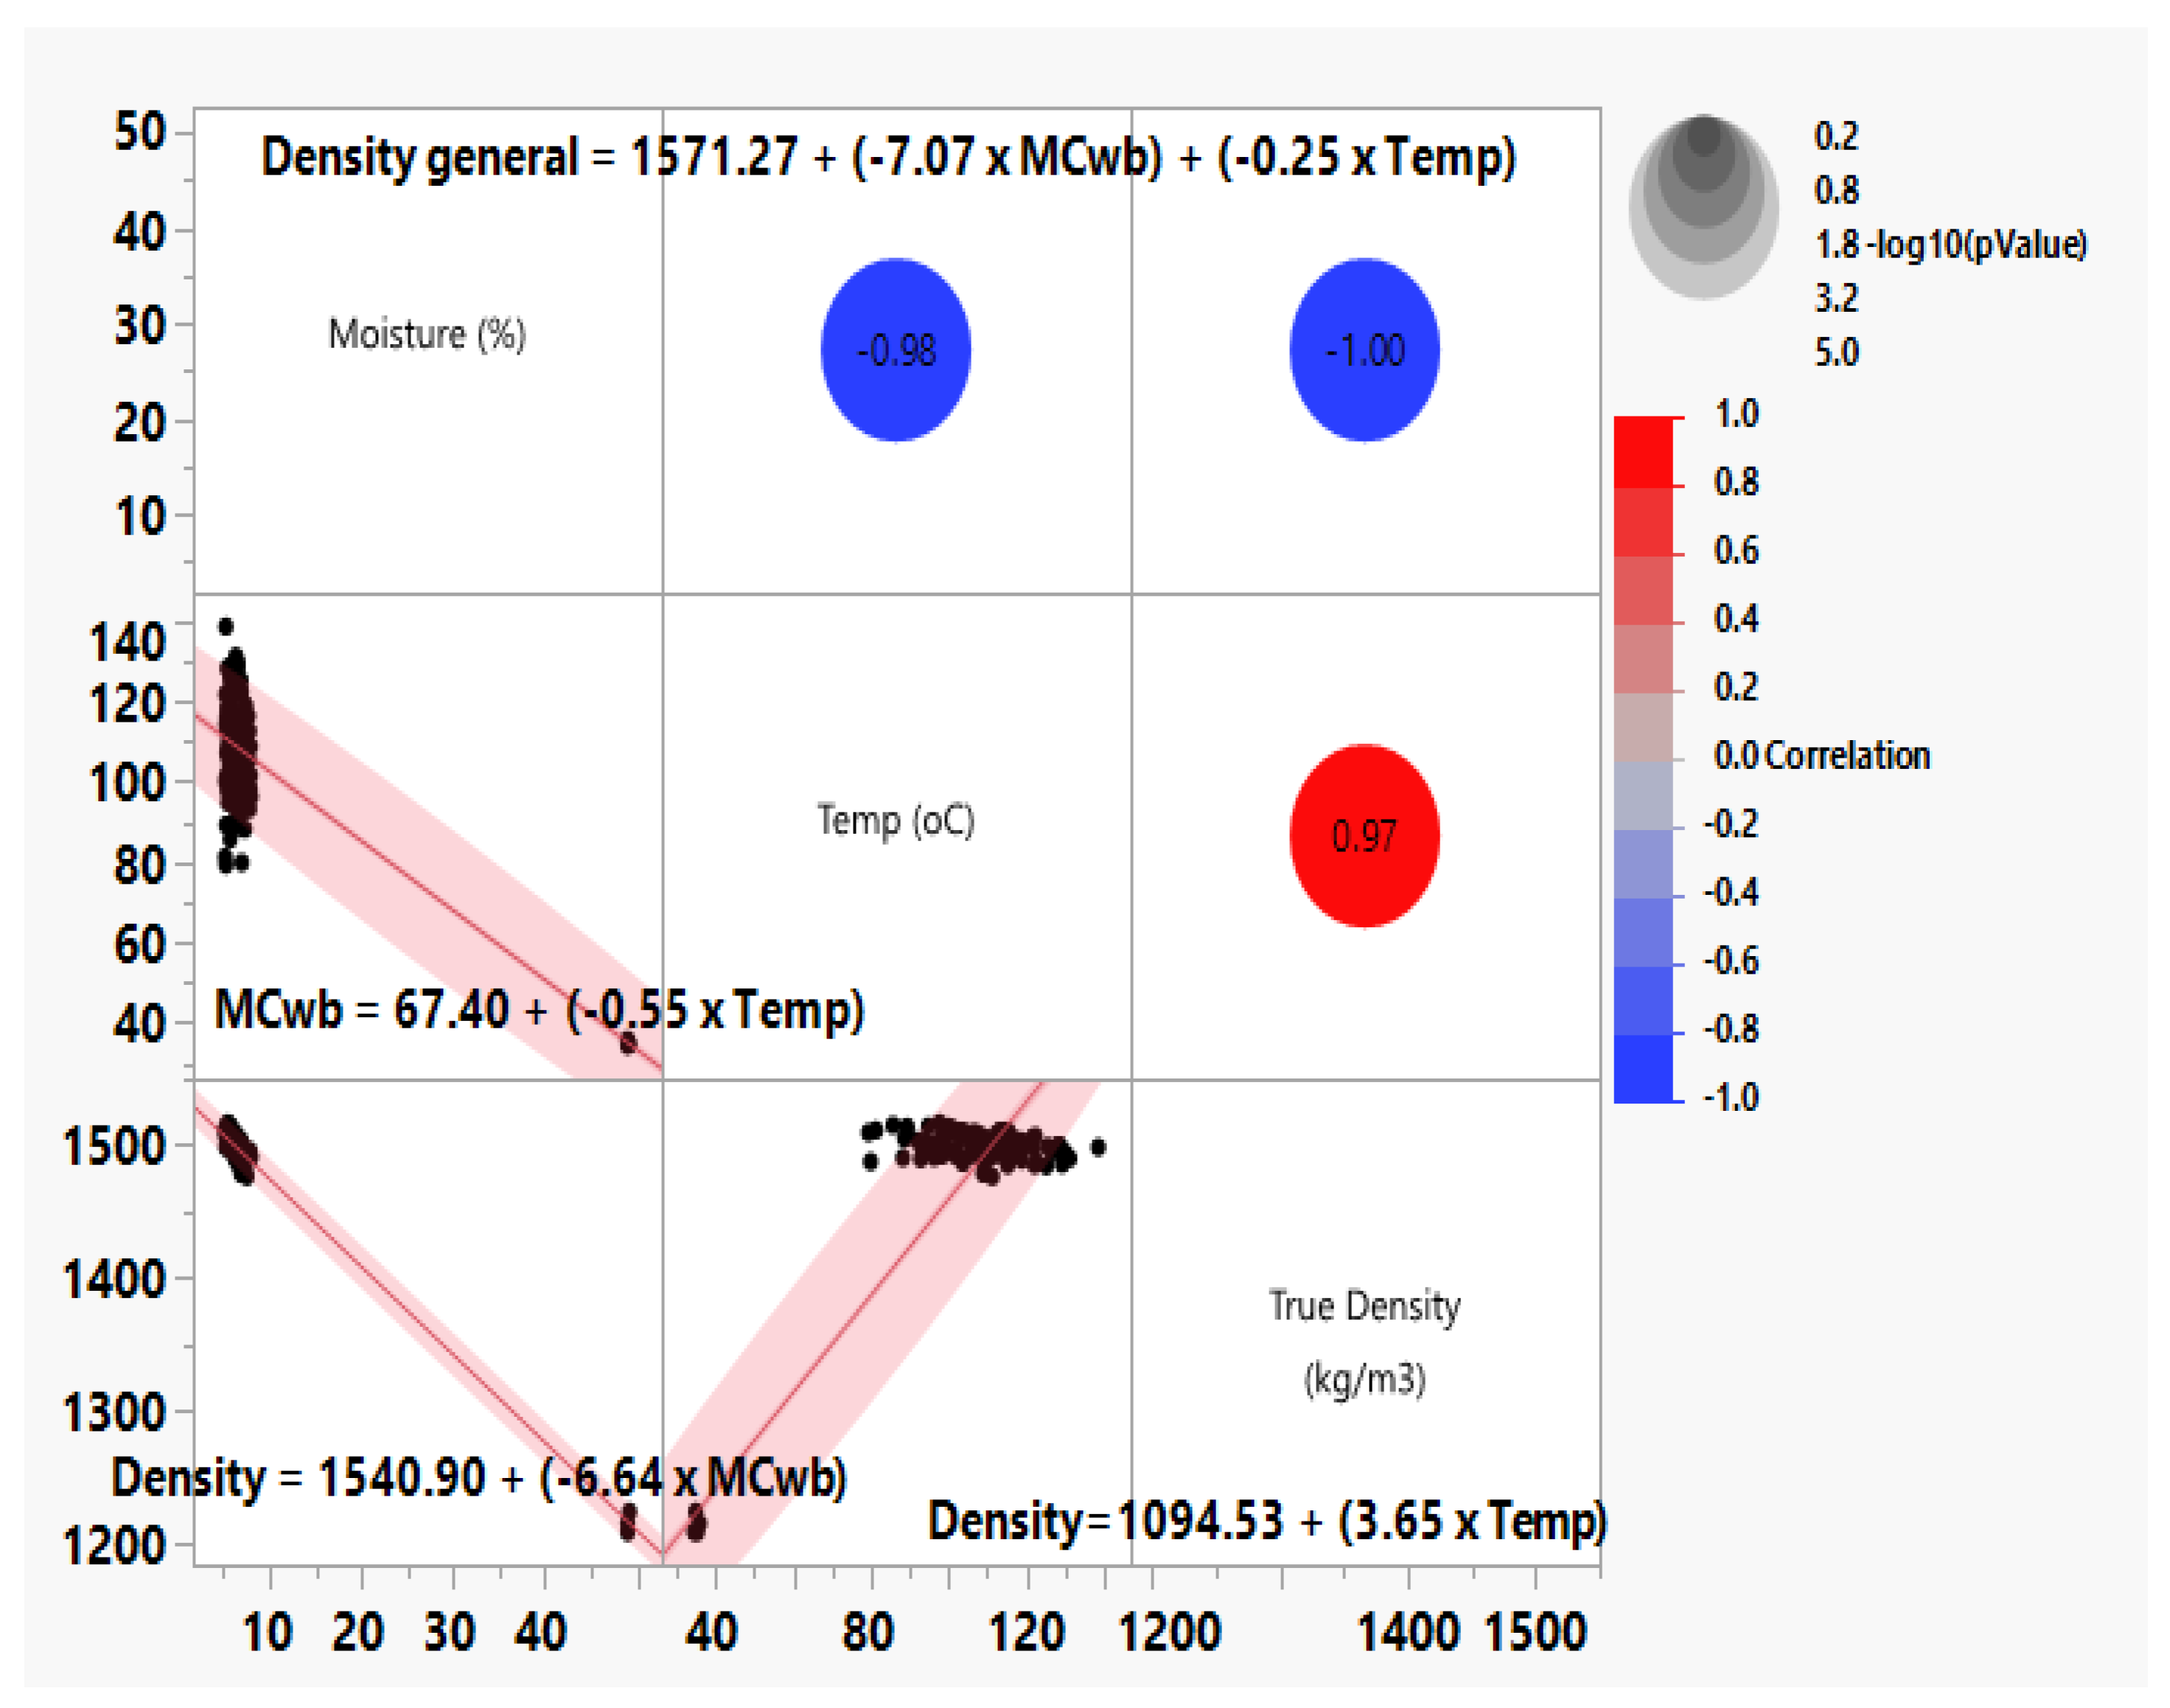
Correlation and Prediction Models of Moisture, Temperature and Density

Modelling of the relationship between density as a continuous response variable and temperatures and MCwb, was done, and results were presented in the scatterplot matrix in Figure 4. Density exhibited a strong negative correlation with MCwb (R2 = −1) described by Equation (17) ( ρ p M C w b ), signifying an inverse proportion relationship exuberated by a negative relationship between the temperature and the MCwb represented by Equation (16) (R2 = −0.98) all at p < 0.0001. It was generally observed that as the temperature and roasting time increased, the initial volume of the cassava mash that had been added to the roasting pan and heated to high temperatures while being frequently agitated decreased. This may be explained by the findings made in this study that the densities of the gari (1490.07 ± 1.41 to 1511.11 ± 1.30 kg m−3) were higher than those of the cassava mash (1223.09 ± 0.35 to 1207.72 ± 0.12 kg m−3). Density increases as volume decreases under dehydration conditions [7]. Nevertheless, density increased with increased temperature modelled by Equation (18) ( ρ p T e m p ). This effect was also witnessed by other authors [6,10,21,28,60].
The general model (Equation (16)) was developed upon aggregation of all the data from all processors into a multivariate modelling phase. Data from each site was also modelled into Equation (20) for NOVIVA, Equation (21) for AP and Equation (22) for CAD.
ρ p G e n e r a l = 1571.27 + ( 7.07 × M C w b ) + ( 0.25 × Temp )
MCwb = 67.40 + (−0.55 × Temp)
ρ p M C w b = 1540.90 + ( 6.64 × M C w b )
ρ p T e m p = 1094.53 + ( 3.65 × Temp )
The models based on the processing site data were also developed as follows:
ρ p N O V I V A = 1578.52 + ( 6.99 × M C w b ) + ( 0.33 × Temp )
ρ p A P = 1569.63 + ( 7.22 × M C w b ) + ( 0.23 × Temp )
ρ p C A D = 1553.78 + ( 6.88 × M C w b ) + ( 0.07 × Temp )

Validation of Density Prediction Models

The validation of the density models achieved in this study is highlighted in Figure 5. The correlations provide values close to those measured via toluene pycnometer (TPy) at MCwb ranges of 6 to 51.8% and 25 °C for cassava mash as reported by Gevaudan et al. [6], whose values of 1509 to 1239 kg m−3, gave only −2.52% error and correlated very well (R2 = 1). Baik and Mittal [5] measured the density of Tofu by the TPy methods between 34 to 73% MCwb and fitted with an error of 6.27% with this study’s calculations (R2 = 1). Cansee et al. [27] reported densities between 1044 to 1119.8 kg m3 of cassava starch at different concentrations (20 to 50% w/w) and temperatures of 30 to 50 °C. The differences could be attributed to different concentrations and processing procedures applied. In their evaluation of the physical properties of cassava foam powder, the density of 1466 kg m3 was achieved by Ayetigbo et al. [29]. The density models for NV, AP and CAD correlated well with errors of −0.34, 0.33 and 0.06% average percent error.

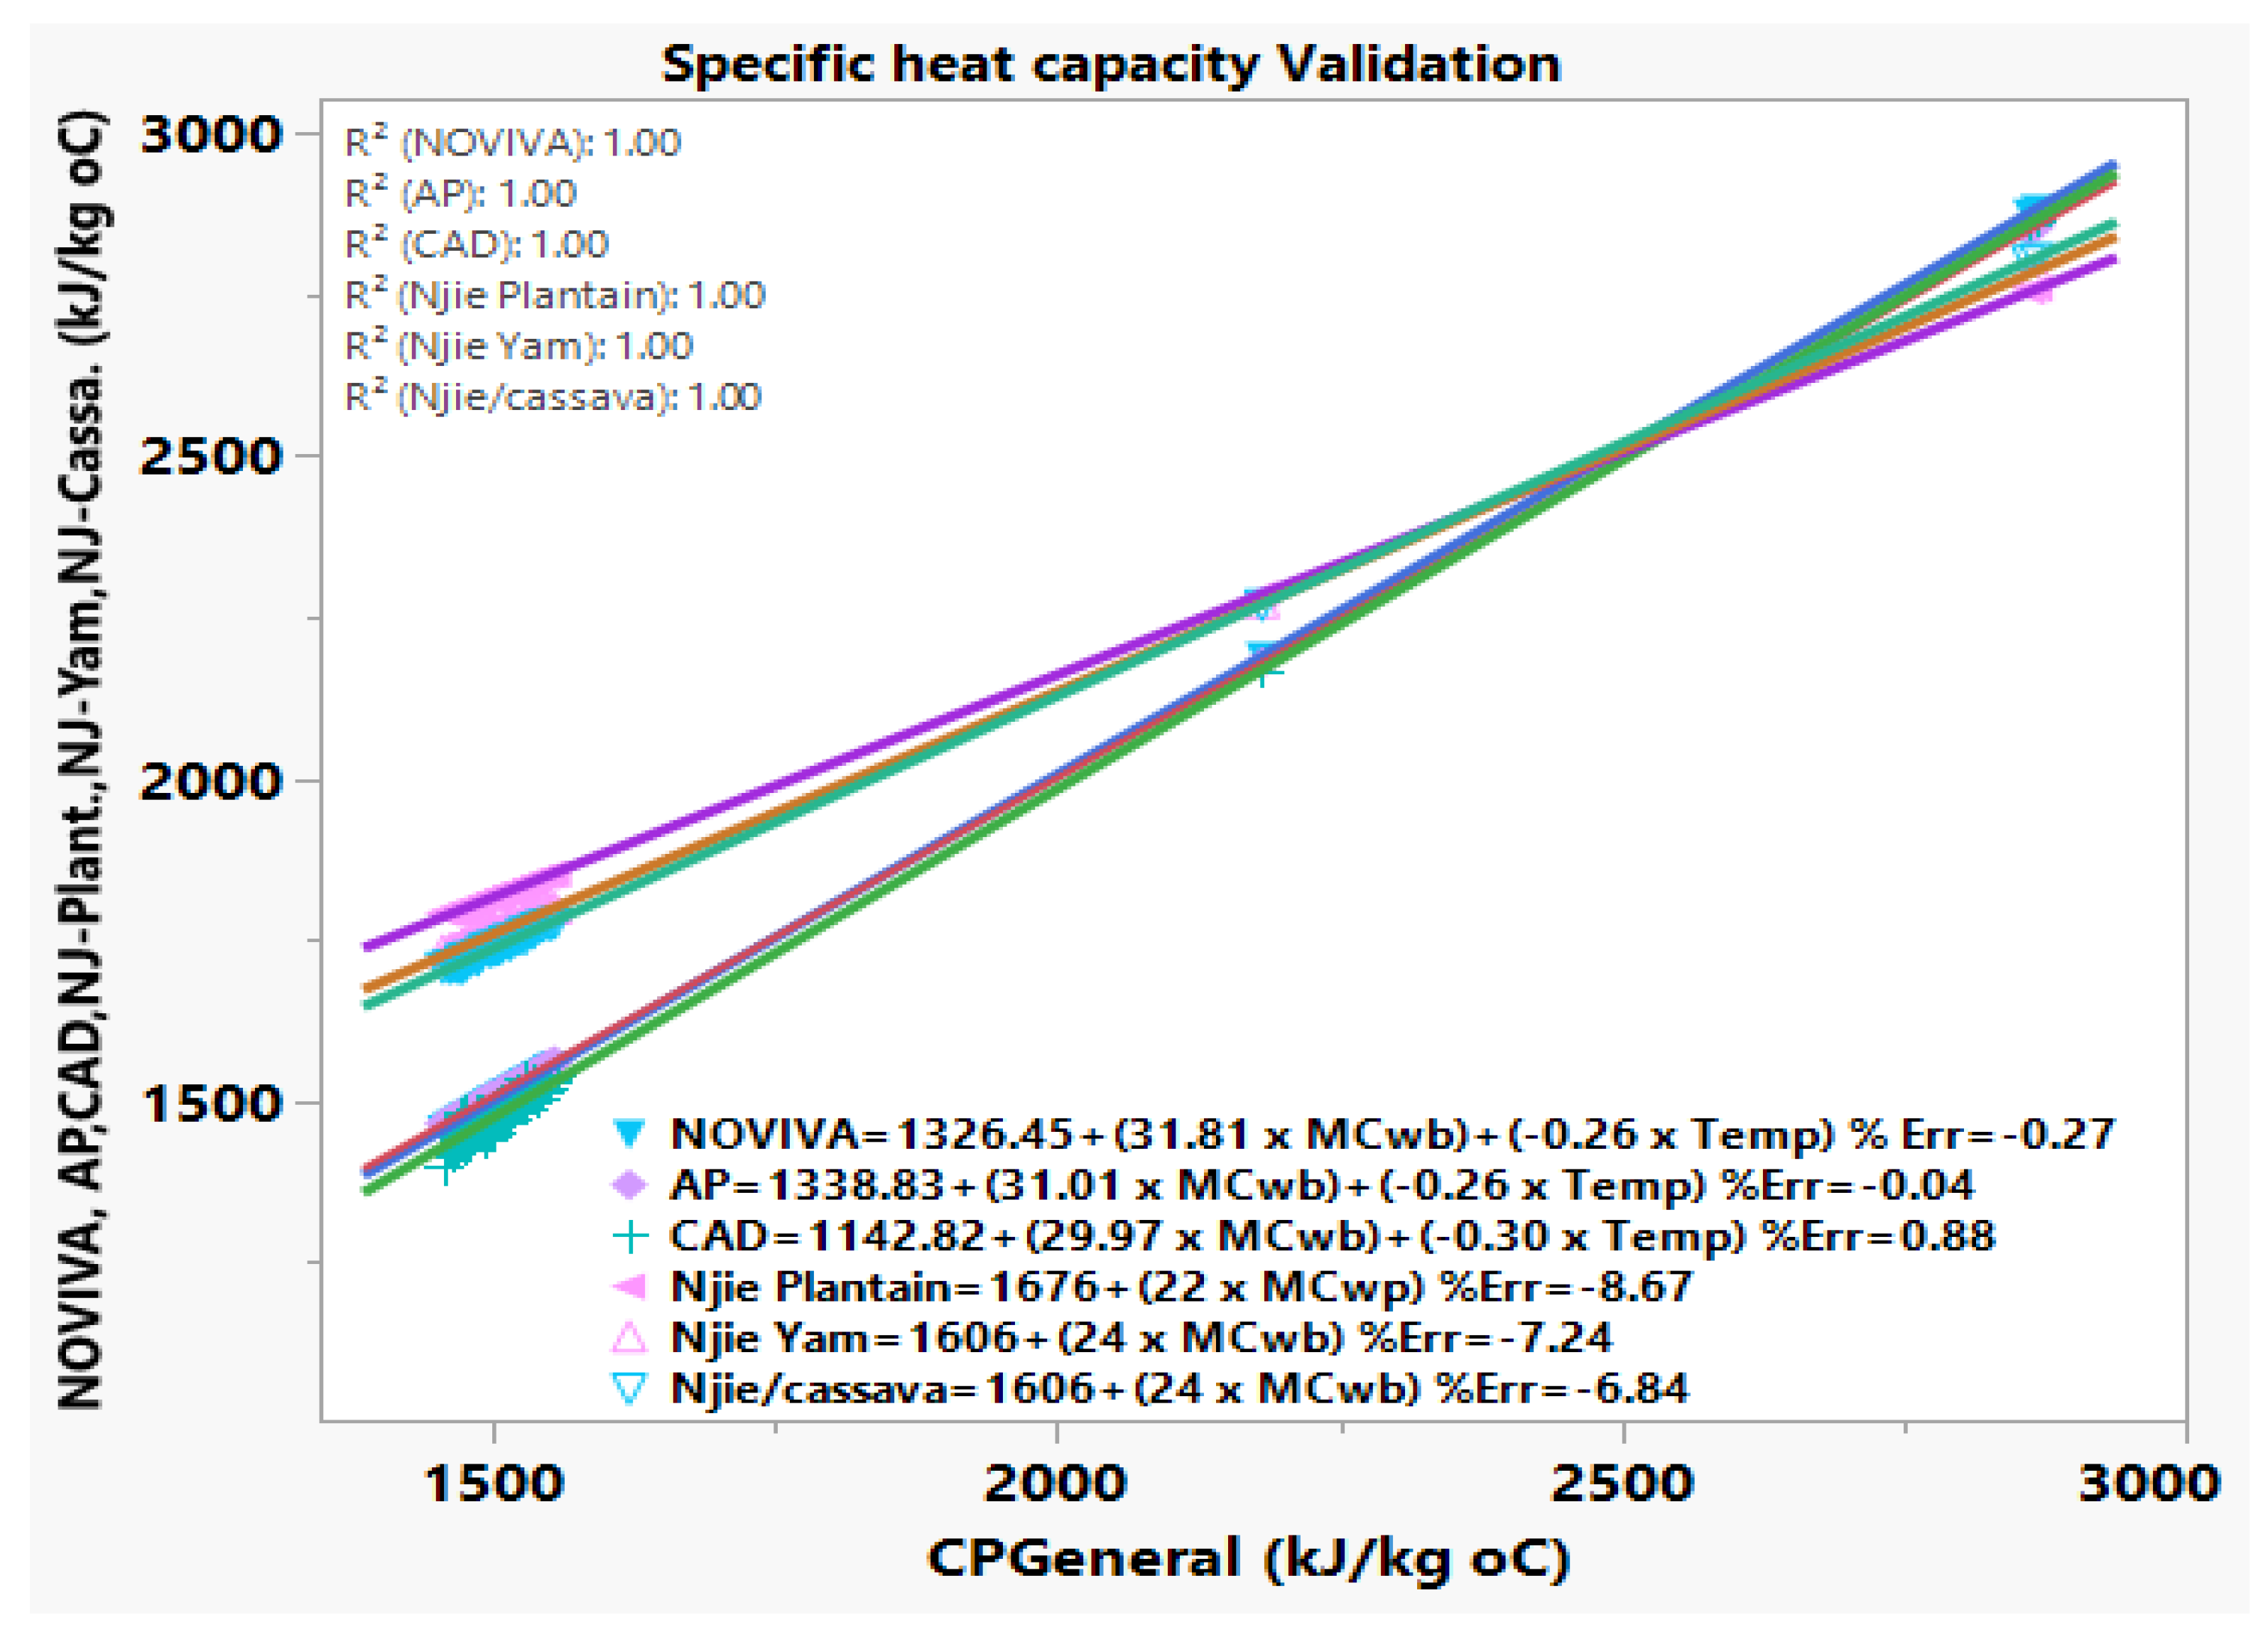
3.3.3. Specific Heat Capacities

The Cp values of the cassava mash and gari ranged from 2849.95 ± 0.36 (APC) to 2883.17 ± 0.78 J kg−1 °C at NVC and from 1827.71 ± 2.19 (WBG2) to 1882.61 ± 3.39 J kg−1 °C at CADG respectively (Table 3 and Table 4). These were at the temperatures and MCwb values of 34.84 ± 0.83 °C to 34.82 ± 0.96 °C and 47.81 ± 2.24% to 49.28 ± 1.24% for the cassava mash and 98.90 ± 13.60 °C (CADG) to 114.29 ± 5.78 °C (WBG2) and 5.23 ± 0.04% (WBG2) to 7.85 ± 0.10% (CADG) for gari, respectively. The Cp, MCwb, and temperature values for the cassava mash and gari were found to be significantly different at p < 0.0001.

Correlation and Prediction Models of Cp MCwb and Temperature

The results of the multiple linear regression modeling of the relationship between Cp, temperatures and MCwb of the cassava mash and gari are presented in Figure 6. The Cp values reduced with increased gari temperatures (Inverse proportion relationship) with a strong negative correlation (R2 = −0.98%) and predictable by Equation (28) (CpTemp). However, at final gari temperatures, the MCwb were lowest (temperature in drying is inverse proportion to the moisture content) and had a strong negative correlation (R2 = −0.98) with a prediction model of Equation (27). The values of Cp and MCwb were directly proportional, as shown in the scatterplot matrix, with a strong positive correlation (R2 = 1 at p < 0.0001) and governed by Equation (29) (CpMCwb). These relationships have been highlighted by other researchers [24,27,29,56,61,62].
After data aggregation of all the Cp values, temperatures, and MCwb achieved from the respective operators, a general model (Cpgeneral), was presented as highlighted in Equation (23). The models achieved for NV, AP and CAD are as shown in Equations (24) to Equation (26), respectively.
CpGeneral = 1332.70 + 31.42 × MCwb + (−0.30 × Temp)
CpNOVIVA = 1326.45 + (31.81 × MCwb) + (−0.26 × Temp)
CPAP = 1338.83 + 31.01 × MCwb + (−0.26 × Temp)
CpCAD = 1442.82 + (29.97 × MCwb + (−1.46 × Temp)
Temp = 119.87 + (−1.73 × MCwb)
CpTemp = 3450.51 + (−17.63 × Temp)
CpMCwb = 1297.40 + (31.93 × MCwb)
The decrease of Cp at high temperatures might be attributed to the decrease in cassava mash granules’ free water, thereby increasing the density and water-free volume of the granules [7,27,28].

Validation of the Cp Models

The Cp values of the models achieved in this study were compared to the ones measured for cassava, yam and plantain using the Perkin-Elmer (DSC7) differential scanning calorimeter by fitting the prediction models in this study’s data and presented in Figure 7. The deviation between the models and the DSC7 expressed in average percent error (Err) was −8.67% for plantain, −7.24% for yam and −6.84% for cassava (negative sign shows lower Cp values compared to this study’s values). At 36 °C and 45% MCwb the authors reported 2736 J kg−1 °C−1 (0.04 to 0.26 standard deviation) for the cassava mash, which is in agreement with the 2834.88 J kg−1 °C−1 cassava mash Cp achieved in this study [28]. However, the models had a good correlation of R2 = 1 at p < 0.0001, with AP giving the lowest error of −0.04%. The Cp differences could be attributed to the MCwb and proximate composition differences of the samples at different temperatures. Elsewhere, reported values of 1804 to 1901 J kg−1 °C−1 by L. A. Sanni et al. [22] are within the achieved in this study but higher than the 1128 to 1760 J kg−1 °C−1 measured using the differential scanning calorimeter between −20 to 96 °C reported by Gevaudan et al. [6].

3.3.4. Thermal Diffusivity

The α values achieved in this study for the cassava mash (9.62 × 10⁻⁸ ± 1.003 × 10⁻¹⁰ to 9.76 × 10⁻⁸ ± 2.89 × 10⁻¹¹ m2 s−1) highlighted in Table 3, are significantly different from the gari α G a (9.64 × 10⁻⁸ ± 1.15 × 10⁻⁵ to 1.09 × 10⁻⁷ ± 4.15 × 10⁻⁹ m2 s−1) shown in Table 4. Gari had higher values than the cassava mash.
The values achieved are comparable to those achieved by other authors. Njie et al. [28] reported thermal diffusivity values between 1.66 × 10⁻⁷ and 7.9 × 10⁻⁸ m2 s−1 at 70 to 18% MCwb and in the same range of 7.77 × 10⁻⁸ to 8.31 × 10⁻⁸ as reported by Cansee et al. [27]. Cassava aged between 12 to 18 months gave thermal diffusivity values between 1.43 × 10⁻⁷ m−2 s−1 and 2.43 × 10⁻⁷ m−2 s−1 measured using the dual needle sensor KD2 Pro Controller as reported by Oriola [30].
The interaction between diffusivity and other parameters in this study is presented in Figure 7. The correlation between the temperatures and α with a weaker positive correlation of R2 0.48 was reported in this study. Diffusivity and MCwb correlated negatively (R2 = −0.35), causing α to increase at reduced MCwb, as can be seen in Table 3 and Table 4, showing that gari had higher values of α than the cassava mash. The weaker correlation factor could be a result of the strong influence the specific heat capacity had on temperatures. This action could be attributed to the fact that as the cassava mash has been roasted, the action of temperature on the water makes it evaporate, hence creating more volume for air pores, thereby higher values of thermal diffusivity because air has higher α values than the cassava granules. When investigating the thermal properties of shelled corn and grain, Kustermann et al. [25] also reported a lower correlation of R2 = 0.50 between temperature and α —a situation reported by other researchers [27,61,63].
As can be seen in the relationships of the α in Figure 7, Cp increased with TC, thereby increasing the thermal diffusivity (ability to store heat) of gari. Therefore, data on the thermal diffusivity (speed of heat diffusion) are very critical in coming up with food-processing duration prediction models.

3.4. Multivariate Interaction Analysis of All Parameters

To clearly understand the interactions and the relationships between all variables, multivariate correlation analysis results are presented in the scatterplot analysis in Table 6 using the heat map. The integer scale (from red (+1) to blue (−1) on the upper right of the scatterplot highlights the correlation between a pair of variables. The Cp showed a strong negative correlation with CHO, TA, Temperature and density with R2 −1, −0.86, −0.98 and −1, respectively, with a much weaker relationship with CFb. However, it shows a strong positive correlation with HCN (R2 = 0.83), MCwb (R2 = 1) and a much weaker with CP (R2 = 0.6) and with CF (R2 = 0.52). This could be due to the negative temperature effect (R2 = −98) on the MCwb in the cassava mash (evaporation of water), which resulted in an increase in CHO concentration and increased true density (R = −1 against MCwb). Cassava mash transformation into gari occurs at high temperatures and is based on MCwb degradation, resulting in minimal Cp values at higher true density values, as highlighted in Table 3 and Table 4. Protein (CP), an important nutrient is affected negatively during gari roasting and had a negative interaction with CHO (R2 = −0.64), temperature (R2 = −0.59), density (R2 = −0.59), CFb (R2 = −0.11) and thermal diffusivity (R2 = −0.40), this confirms other researcher’s observation that production of gari from cassava mash results in 20 to 40% loss of the crude proteins [35,64,65]. This study also shows that it is possible to reduce the HCN to acceptable levels as it had a negative interaction with CHO (R = −0.82), TA (R2 = −0.89), CFb (R2 = −0.57), temperature (R2 = −0.82) and density (R2 = −0.83). If carefully done, roasting could result in HCN reduction [8]. Generally, de-watered cassava mash (MCwb of about 46% to 50%) processing into gari results in dehydration using energy for temperature generation, further transforming the proximate and physical properties. Since energy plays a major part in food drying, its efficiency utilization through site/region-specific thermal models is key. This will further help in the design and implementation of cheaper renewable energy sources such as hybrid systems e.g., solar/waste-to-energy [66,67]. It has been identified in this study that, apart from CHO (R2 = 0.98), TA (R2 = 0.85), CFb (R2 = 0.66), density (R2 = 0.98) and thermal diffusivity (R2 = 0.48) that linearly associated positively with temperature and increased by 47.06%, 48.47%, 23.38%, 19.15% and 5.51% from the initial cassava mash to gari, respectively, other variables associated negatively.

4. Conclusions

Thermal properties of the traditionally processed de-watered cassava mash and gari in the selected places of the Maritime region in Togo were calculated at various moisture contents and temperatures using the proximate composition-based predictive empirical models developed by Y. H. Choi and Okos (1986) and published by Sahin and Sumnu (2007). The models obtained from the literature for the specific heat capacity, thermal conductivity, density and diffusivity developed based on measuring techniques showed a good correlation with the models developed from the proximate analysis results of the de-watered cassava mash and gari determined in this study. Through multivariate analysis, correlations and effects of the different components of the de-watered cassava mash and gari and their thermal properties at different temperatures and moisture contents before and after traditional garification, were identified. It was also discovered that the same cassava genotype planted at multiple locations had distinct proximate compositions (site and soil-specific), as seen by the HCN and protein levels. The models developed in this work could be used to analyze the thermal properties of food staffs with similar compositions, moisture ranges, and processing techniques (roasting or boiling). More research is needed to address applicability restrictions. The garification parameters achieved (temperatures, duration, moisture contents, and batch sizes) and the regression models created in this work as a function of moisture content and temperature are intended to provide a foundation for future research on the simulation and modeling of site-specific thermal properties of foodstuffs and how they affect energy demand to facilitate accurate, credible and site-specific climate impact analyses and verification.

Author Contributions

Conceptualization, M.C.M., A.P., N.M.E. and O.H.; Methodology, M.C.M., A.P., Y.O.A. and O.H.; Software, M.C.M.; Validation, M.C.M., F.R. and N.M.E.; Formal analysis, M.C.M., F.R., Y.O.A. and O.H.; Investigation, M.C.M., Y.O.A. and O.H.; Resources, A.P. and O.H.; Data curation, M.C.M. and Y.O.A.; Writing—original draft, M.C.M.; Writing—review & editing, M.C.M., A.P., F.R. and O.H.; Visualization, M.C.M. and F.R.; Supervision, N.M.E. and O.H.; Project administration, A.P., O.H. and N.M.E.; Funding acquisition, A.P., N.M.E. and O.H. All authors have read and agreed to the published version of the manuscript.

Funding

The authors acknowledge financial support from the Germany Federal Ministry of Education (Grant number: FKZ03F0683A) and Research and the European Union’s Long-Term Joint European Union-African Union Research and Innovation Partnership on Renewable Energy (LEAP-RE) under grant agreement 963530 for the SunGari project.

Data Availability Statement

Data is available on request.

Acknowledgments

We are grateful for the field coordination provided by the University of Lome. The National Institute for Scientific and Industrial Research, Lusaka-Zambia, Cooperative des Femmes NOVIVA Tokpo, Agro Pastoral in Ganave coded, from Coopérative d’Action pour le Développement (CAD) in Wogba, Vagan in Togo, and other organizations that participated in this research are also acknowledged. The article is dedicated to Yaovi Ouézou Azouma from the University of Lome, who made significant contributions but unfortunately passed away before the publication.

Conflicts of Interest

The authors declare no conflict of interest.

References

  1. Carson, J.K.; Wang, J.; North, M.F.; Cleland, D.J. Effective thermal conductivity prediction of foods using composition and temperature data. J. Food Eng. 2016, 175, 65–73. [Google Scholar] [CrossRef]
  2. Choi, Y.-H. Effects of Temperature and Composition on the Thermal Conductivity and Thermal Diffusivity of Some Food Components. Korean J. Food Sci. Technol. 1986, 18, 357–363. [Google Scholar]
  3. Heldman, D.R. Food preservation process design. Procedia Food Sci. 2011, 1, 685–689. [Google Scholar] [CrossRef]
  4. Tan, L.W.; Ibrahim, M.N.; Kamil, R.; Taip, F.S. Empirical modeling for spray drying process of sticky and non-sticky products. Procedia Food Sci. 2011, 1, 690–697. [Google Scholar] [CrossRef]
  5. Baik, O.; Mittal, G.S. Determination and Modeling of Thermal Properties of Tofu. Int. J. Food Prop. 2007, 6, 9–24. [Google Scholar] [CrossRef]
  6. Gevaudan, A.; Chuzel, G.; Didier, S.; Andrieu, J. Physical properties of cassava mash. Int. J. Food Sci. Technol. 1989, 24, 637–645. [Google Scholar] [CrossRef]
  7. Modi, S.K.; Prasad, B.D.; Basavaraj, M. Effect of moisture content and temperature on thermal conductivity of Psidium guajava L. by line heat source method (transient analysis). Int. J. Heat Mass Transf. 2014, 78, 354–359. [Google Scholar] [CrossRef]
  8. Ngoualem Kégah, F.; Ndjouenkeu, R. Gari, a Cassava (Manihot esculenta Crantz) Derived Product: Review on Its Quality and Their Determinants. J. Food Qual. 2023, 2023, 7238309. [Google Scholar] [CrossRef]
  9. Abass, A.B.; Dziedzoave, N.T.; Alenkhe, B.E.; James, B.D. Quality Management Manual for the Production of Gari. 2012. Available online: www.iita.org (accessed on 13 July 2023).
  10. Chuzel, G.; Gévaudan, A.; Griffon, D. Cassava processing for gari production. In Proceedings of the Agricultural Engineering International Conference, Paris, France, 2–5 March 1988. [Google Scholar]
  11. Laya, A.; Koubala, B.B.; Kouninki, H.; Nukenine, E.N. Effect of Harvest Period on the Proximate Composition and Functional and Sensory Properties of Gari Produced from Local and Improved Cassava (Manihot esculenta) Varieties. Int. J. Food Sci. 2018, 2018, 6241035. [Google Scholar] [CrossRef]
  12. Ajewole, P.O.; Adeosun, E.O. Design Analysis of a Cassava Mash Roaster. 2018. Available online: www.globalscientificjournal.comwww.globalscientificjournal.com (accessed on 13 July 2023).
  13. Ibrahim, J.S.; Gaji, M.M. Energy Use Patterns of Local Gari Production Industries in North Central Nigeria. 2016. Available online: www.ijrrset.com (accessed on 16 July 2023).
  14. SustainCERT. SustainCERT Home. Website. 2023. Available online: https://www.sustain-cert.com/ (accessed on 25 June 2023).
  15. Choi, Y.H.; Okos, M.R. Effect of Food Temperature and Composition on the Thermal Properties of Food. Food Eng. Process Appl. Transp. Phenom. Elsevier 1986, 1, 99–101. Available online: https://iifiir.org/en/fridoc/effect-of-food-temperature-and-composition-on-the-thermal-properties-of-82845 (accessed on 5 February 2023).
  16. Naderifar, M.; Goli, H.; Ghaljaie, F. Snowball Sampling: A Purposeful Method of Sampling in Qualitative Research. Strides Dev. Med. Educ. 2017, 14, 1–6. [Google Scholar] [CrossRef]
  17. Ajibola, O.O.; Ige, M.T.; Makanjuola, G.A. Preliminary studies of a new technique of cassava mash gelatinization. J. Agric. Eng. Res. 1987, 36, 97–100. [Google Scholar] [CrossRef]
  18. (Cereals & Grains Association) CGA. Approved Methods of Analysis. 2023. Available online: https://www.cerealsgrains.org/resources/methods/Pages/default.aspx (accessed on 7 February 2023).
  19. (FuehlerSysteme eNET International) FSI. DATA SHEET MT1/T Sheathed Thermocouple with TC-Mini-Connector. 2023. Available online: www.fuehlersysteme.de (accessed on 1 February 2023).
  20. (John Fluke Mfg. Co. Inc) JFM. Hydra Series II Data Acquisition Unit Hydra Series II Data Logger Users Manual. 1997. Available online: https://eu.flukecal.com/de/literature/product-manuals/2620a2625a-hydra-series-data-acquisition-unitdata-logger-users-manual (accessed on 23 October 2022).
  21. Sahin, S.; Sumnu, S.G. Thermal Properties of Foods. In Physical Properties of Foods; Springer: New York, NY, USA, 2007; pp. 107–155. [Google Scholar]
  22. Sanni, L.A.; Oke, O.O.; Oladimeji, F.M.; Ogbozomivaze, K.F. Thermal Properties and Energy Utilization of Cassava Meal in Conductive Rotary Drying. Am. J. Food Sci. Technol. 2016, 4, 160–167. [Google Scholar] [CrossRef]
  23. Dahdouh, L.; Escobar, A.; Rondet, E.; Ricci, J.; Fliedel, G.; Adinsi, L.; Dufour, D.; Cuq, B.; Delalonde, M. Role of dewatering and roasting parameters in the quality of handmade gari. Int. J. Food Sci. Technol. 2021, 56, 1298–1310. [Google Scholar] [CrossRef]
  24. Erdogdu, F.; Linke, M.; Praeger, U.; Geyer, M.; Schlüter, O. Experimental determination of thermal conductivity and thermal diffusivity of whole green (unripe) and yellow (ripe) Cavendish bananas under cooling conditions. J. Food Eng. 2013, 128, 46–52. [Google Scholar] [CrossRef]
  25. Kustermann, M.; Scherer, R.; Kutzbach, H.D. Thermal Conductivity and Diffusivity of Shelled Corn and Grain. J. Food Process Eng. 1981, 4, 137–153. [Google Scholar] [CrossRef]
  26. Sweat, V.E. Experimental Values of Thermal Conductivity of Selected Fruits and Vegetables. J. Food Sci. 1974, 39, 1080–1083. [Google Scholar] [CrossRef]
  27. Cansee, S.; Watyotha, C.; Thivavarnvongs, T.; Uriyapongson, J.; Varith, J. Effects of Temperature and Concentration on Thermal Properties of Cassava Starch Solutions. Thaiscience.info. 2008. Available online: https://www.thaiscience.info/journals/Article/SONG/10617681.pdf (accessed on 22 May 2023).
  28. Njie, D.N.; Rumsey, T.R.; Singh, R.P. Thermal Properties of Cassava, Yam and Plantain. J. Food Eng. 1998, 37, 63–76. [Google Scholar] [CrossRef]
  29. Ayetigbo, O.; Latif, S.; Idris, W.; Müller, J. Physical properties of white-fleshed and yellow-fleshed cassava (Manihot esculenta) foam powder. Powder Technol. 2023, 420, 118366. [Google Scholar] [CrossRef]
  30. Oriola, K.O. Effects of Ageing and Moisture Content on Thermal Properties of Cassava Roots Using Response Surface Methodology. Int. J. Appl. Agric. Apic. Res. 2016, 10, 54–63. Available online: https://www.ajol.info/index.php/ijaaar/article/view/141508 (accessed on 22 June 2023).
  31. Hassan, H.F.; Ramaswamy, H.S. Measurement and targeting of thermophysical properties of carrot and meat based alginate particles for thermal processing applications. J. Food Eng. 2011, 107, 117–126. [Google Scholar] [CrossRef]
  32. Daniel, W.W.; Chad, C.L. 5.3 Distribution of the Sample Mean. In Biostatistics: A Foundation for Analysis in the Health Sciences; Hoboken, N., Ed.; Wiley Publishing, Inc.: New York, NY, USA, 2018; p. 120. [Google Scholar]
  33. Sobowale, S.S.; Adebiyi, J.A.; Adebo, O.A. Design, construction, and performance evaluation of a gari roaster. J. Food Process Eng. 2017, 40, e12493. [Google Scholar] [CrossRef]
  34. Akinoso, R.; Kasali, W.O. Energy Expended in Processing Gari (Cassava Flakes) Manihot esculenta Crantz, Using Three Levels of Mechanization. Pakistan J. Sci. Ind. Res. Ser. B Biol. Sci. 2012, 55, 114–116. [Google Scholar] [CrossRef]
  35. Oke, O.L. Chemical Studies on Some Nigerian Foodstuffs—‘Gari’. Nature 1966, 212, 1055–1056. [Google Scholar] [CrossRef] [PubMed]
  36. Akely, P.M.T.; Gnagne, E.H.; Lou, G.M.L.T.T.; Amani, G.N.G. Varietal influence of cassava on chemical composition and consumer acceptability of gari. Int. J. Food Sci. Technol. 2021, 56, 1239–1246. [Google Scholar] [CrossRef]
  37. Rajapaksha, K.D.S.C.N.; Somendrika, M.A.D.; Wickramasinghe, I. Nutritional and toxicological composition analysis of selected cassava processed products. Potravin. Slovak J. Food Sci. 2017, 11, 35–42. Available online: https://www.potravinarstvo.com/journal1/index.php/potravinarstvo/article/view/689/pdf (accessed on 5 July 2020).
  38. Nwabanne, J.T. Drying characteristics and engineering properties of fermented ground cassava. Afr. J. Biotechnol. 2010, 8, 873–876. [Google Scholar] [CrossRef]
  39. Olapade, G.M.; Karim, O.R.; Olawuyi, I.F.; Karim, C.R.O. Physicochemical, thermal, and functional properties of gari (fermented-cassava product) enriched with cowpea hull at different stages of production. Food Bioeng. 2023, 2, 42–52. [Google Scholar] [CrossRef]
  40. Krishnakumar, T.; Sajeev, M.S.; Pradeepika, C.; Namrata, A.G.; Sanket, J.M.; Jeevarathinam, G.; Muthusamy, V. Physical and mechanical properties of cassava (Manihot esculenta Crantz) cultivars: Implications for the design of mechanical peeling machines. J. Food Process Eng. 2022, 45, e13923. [Google Scholar] [CrossRef]
  41. Ndam, Y.N.; Mounjouenpou, P.; Kansci, G.; Kenfack, M.J.; Meguia, M.P.F.; Eyenga, N.S.N.N.; Akhobakoh, M.M.; Nyegue, A. Influence of cultivars and processing methods on the cyanide contents of cassava (Manihot esculenta Crantz) and its traditional food products. Sci. Afr. 2019, 5, e00119. [Google Scholar] [CrossRef]
  42. Agbodan, K.; Akpavi, S.; Agbodan, K.; Kanda, M.; Amegnaglo, K.; Adrou-Aledji, A.; Batawila, K.; Akpagana, K. Agromorphological description and determination of the antioxidant potential of the underutilized and newly introduced varieties of maize cassava, cowpea and hot pepper in the Maritime-East region of Togo. Afr. J. Food Agric. Nutr. Dev. 2020, 20, 15936–15953. [Google Scholar] [CrossRef]
  43. Oboh, G.; Akindahunsi, A.A. Biochemical changes in cassava products (flour & gari) subjected to Saccharomyces cerevisae solid media fermentation. Food Chem. 2003, 82, 599–602. [Google Scholar] [CrossRef]
  44. Ibukun, E.O. Changes in Antinutrient and Nutritional Values of Fermented Eesame (Sesanum indicum), Musk Melon (Cucumis melo) And White Melon. Int. J. Adv. Biotechnol. Res. 2013, 4, 131–214. [Google Scholar]
  45. Boonnop, K.; Wanapat, M.; Nontaso, N.; Wanapat, S. Enriching nutritive value of cassava root by yeast fermentation. Sci. Agric. 2009, 66, 629–633. [Google Scholar] [CrossRef]
  46. Fagbemi, A.O.; Ijah, U.J.J. Microbial population and biochemical changes during production of protein-enriched fufu. World J. Microbiol. Biotechnol. 2006, 22, 635–640. [Google Scholar] [CrossRef]
  47. Padmaja, G.; George, M.; Moorthy, S.N. Detoxification of cassava during fermentation with a mixed culture inoculum. J. Sci. Food Agric. 1993, 63, 473–481. [Google Scholar] [CrossRef]
  48. Nilusha, R.A.T.; Jayasinghe, J.M.J.K.; Perera, O.D.A.N.; Perera, P.I.P.; Jayasinghe, C.V.L. Proximate Composition, Physicochemical, Functional, and Antioxidant Properties of Flours from Selected Cassava (Manihot esculenta Crantz) Varieties. Int. J. Food Sci. 2021, 2021, 6064545. [Google Scholar] [CrossRef] [PubMed]
  49. Nuwamanya, E.; Patrick, R.R.; Ssetumba, M.; Samuel, K.; Joseph, F.H.; Yona, B. Biochemical and secondary metabolites changes under moisture and temperature stress in cassava (Manihot esculenta Crantz). Afr. J. Biotechnol. 2014, 13, 3173–3186. [Google Scholar] [CrossRef]
  50. Rodrigues, B.M.; Souza, B.D.; Nogueira, R.M.; Santos, M.G. Tolerância ao déficit hídrico em plantas jovens de jaqueira e pinheira. Rev. Cienc. Agron. 2010, 41, 245–252. [Google Scholar] [CrossRef]
  51. Bradbury, J.H.; Bradbury, M.G.; Egan, S.V. Picrate paper kits for determination of total cyanogens in cassava roots and all forms of cyanogens in cassava products. J. Sci. Food Agric. 1999, 79, 593–601. [Google Scholar] [CrossRef]
  52. Kannangara, R.; Motawia, M.S.; Hansen, N.K.K.; Paquette, S.M.; Olsen, C.E.; Møller, B.L.; Jørgensen, K. Characterization and expression profile of two UDP-glucosyltransferases, UGT85K4 and UGT85K5, catalyzing the last step in cyanogenic glucoside biosynthesis in cassava. Plant J. 2011, 68, 287–301. [Google Scholar] [CrossRef]
  53. Bradbury, J.H.; Egan, S.V.; Lynch, M.J. Analysis of cyanide in cassava using acid hydrolysis of cyanogenic glucosides. J. Sci. Food Agric. 1991, 55, 277–290. [Google Scholar] [CrossRef]
  54. Oduro, I.; Ellis, W.O.; Dziedzoave, N.T.; Nimako-Yeboah, K. Quality of gari from selected processing zones in Ghana. Food Control 2000, 11, 297–303. [Google Scholar] [CrossRef]
  55. Felber, C.; Azouma, Y.O.; Reppich, M. Evaluation of analytical methods for the determination of the physicochemical properties of fermented, granulated, and roasted cassava pulp—Gari. Food Sci. Nutr. 2017, 5, 46–53. [Google Scholar] [CrossRef] [PubMed]
  56. Hobani, A.I.; Elansari, A.M. Effect of temperature and moisture content on thermal properties of four types of meat part two: Specific heat enthalpy. Int. J. Food Prop. 2008, 11, 571–584. [Google Scholar] [CrossRef]
  57. Diniz, R.S.; Coimbra, J.S.d.R.; Martins, M.A.; Santos, M.d.O.d.; Diniz, M.D.M.S.; Santos, E.d.S.; Santánna, D.D.; da Rocha, R.A.; de Oliveira, E.B. Physical properties of red guava (Psidium guajava L.) Pulp as affected by soluble solids content and temperature. Int. J. Food Eng. 2014, 10, 437–445. [Google Scholar] [CrossRef]
  58. Zainal, B.S.; Rahman, R.A.; Ariff, A.B.; Saari, B.N.; Asbi, B.A. Thermophysical Properties of Pink Guava Juice at 9 and 11 Brix. J. Food Process Eng. 2001, 24, 87–100. [Google Scholar] [CrossRef]
  59. Siddiq, M.; Ahmed, J.; Lobo, M.G.; Ozadali, F. Tropical and Subtropical Fruits: Postharvest Physiology, Processing and Packaging; John Wiley & Sons: Hoboken, NJ, USA, 2012; pp. 1–631. [Google Scholar] [CrossRef]
  60. Gratzek, J.P.; Toledo, R.T. Solid Food Thermal Conductivity Determination at High Temperatures. J. Food Sci. 1993, 58, 908–913. [Google Scholar] [CrossRef]
  61. Zhang, J.; Farkas, B.E.; Hale, S.A. Thermal properties of skipjack tuna (katsuwonus pelamis). Int. J. Food Prop. 2001, 4, 81–90. [Google Scholar] [CrossRef]
  62. Kara, M.; Boydas, M.G.; Kara, Y.A.; Ozturk, I. The Effect of Moisture Content on the Thermal Properties of Red Lentil Seeds. Trans. ASABE 2012, 55, 2301–2306. [Google Scholar] [CrossRef]
  63. Xu, C.; Xu, S.; Zhang, Z.; Lin, H. Research on In Situ Thermophysical Properties Measurement during Heating Processes. Nanomaterials 2022, 13, 119. [Google Scholar] [CrossRef]
  64. Lancaster, P.A.; Ingram, J.S.; Lim, M.Y.; Coursey, D.G. Traditional cassava-based foods: Survey of processing techniques. Econ. Bot. 1982, 36, 12–45. [Google Scholar] [CrossRef]
  65. Aghogho, C.I.; Eleblu, S.J.Y.; Bakare, M.A.; Kayondo, I.S.; Asante, I.; Parkes, E.Y.; Kulakow, P.; Offei, S.K.; Rabbi, I. Genetic variability and genotype by environment interaction of two major cassava processed products in multi-environments. Front. Plant Sci. 2022, 13, 974795. [Google Scholar] [CrossRef] [PubMed]
  66. Mwape, M.C.; Muchilwa, I.E.; Siagi, Z.O.; Yamba, F.D. Waste to Energy: Heat Recovery from the Compost Reactor as a Source of Renewable Energy. Int. J. Energy Eng. 2020, 10, 10–15. [Google Scholar] [CrossRef]
  67. Mwape, M.C.; Muchilwa, I.E.; Siagi, Z.O.; Yamba, F.D. Design and Performance Evaluation of a Hydronic Type Compost Heat Exchanger. Cogent Eng. 2020, 7, 1846253. [Google Scholar] [CrossRef]
Figure 1. Schematic diagram for gari processing thermal system data mining.
Energies 16 06836 g001
Figure 2. Mean roasting process parameters achieved in this study.
Energies 16 06836 g002
Figure 3. Scatterplot matrix effects of the moisture and temperature on the thermal conductivity of cassava mash before and after garification.
Energies 16 06836 g003
Figure 4. Scatterplot of density, moisture and temperature correlation.
Energies 16 06836 g004
Figure 5. Comparison of (validation) densities obtained in this study and from other studies (NV, AP and CAD = data sites from this study and GEVA—Gevaudan [6], Baik = [5].
Energies 16 06836 g005
Figure 6. Scatterplot matrix for specific heat capacity, temperature and MCwb of the cassava mash and gari.
Energies 16 06836 g006
Figure 7. Validation of this study’s Cp values (Negative Error sign means lower Cp values as compared to this study’s values. Njie—models used by Njie et al. [28].
Energies 16 06836 g007
Table 2. Some physiochemical properties of de-watered cassava mash and gari.
DescriptionDry Matter (%)MCwb (%)Total Ash (%)Crude Fiber (%)Crude Protein (%)Crude Fat (%)CHO (%)pHHCN (ppm)Temp (°C)
NVC50.77 ± 0.72 a49.23 ± 0.72 f1.75 ± 0.021.31 ± 0.03 d2.44 ± 0.02 a0.64 ± 0.03 d44.64 ± 0.71 de6.54 ± 0.17 a17.84 ± 0.15 d34.82 ± 0.96 z
NVG194.24 ± 0.055.76 ± 0.05 a2.33 ± 0.05 a1.99 ± 0.05 a1.33 ± 0.06 d0.62 ± 0.09 d87.98 ± 0.10 a4.09 ± 0.293.17 ± 0.01 a111.44 ± 0.56 c
NVG292.63 ± 0.057.37 ± 0.05 b2.36 ± 0.05 a2.05 ± 0.06 a1.31 ± 0.03 d0.65 ± 0.04 d86.25 ± 0.19 b4.18 ± 0.05 e3.25 ± 0.03 b104.51 ± 1.15 a
NVG394.55 ± 0.075.45 ± 0.07 a2.33 ± 0.05 a2.00 ± 0.11 a1.37 ± 0.05 d0.62 ± 0.01 d88.24 ± 0.04 c4.13 ± 0.07 e3.09 ± 0.03 c112.83 ± 0.62 c
NVG493.16 ± 0.026.84 ± 0.02 c2.35 ± 0.09 a1.99 ± 0.04 a1.34 ± 0.05 d0.63 ± 0.01 d86.86 ± 0.11 b4.55 ± 0.06 fe3.24 ± 0.04 b107.71 ± 0.44 h
APC52.18 ± 1.47 a47.82 ± 1.47 f1.46 ± 0.071.96 ± 0.03 x2.16 ± 0.10 x0.73 ± 0.05 c45.87 ± 1.42 de6.55 ± 0.13 a24.65 ± 1.51 g35.22 ± 0.54 g
APG94.23 ± 0.065.77 ± 0.06 a3.14 ± 0.04 b2.37 ± 0.05 b1.87 ± 0.06 b0.56 ± 0.02 a86.30 ± 0.02 b3.72 ± 0.03 c4.55 ± 0.11 e109.44 ± 0.39 b
ATG93.59 ± 0.046.41 ± 0.04 c3.15 ± 0.06 b2.68 ± 0.62 b1.88 ± 0.07 b0.56 ± 0.03 a85.32 ± 0.64 d3.71 ± 0.04 c4.51 ± 0.06 e108.10 ± 0.11 a
CADC51.70 ± 0.99 a48.3 ± 0.99 f0.83 ± 0.041.35 ± 0.04 r1.21 ± 0.02 q0.52 ± 0.05 a47.80 ± 1.02 e7.82 ± 0.03 d45.69 ± 0.74 z35.89 ± 0.78 g
WBG193.12 ± 0.066.88 ± 0.06 c2.42 ± 0.03 a1.73 ± 0.02 c0.63 ± 0.02 c0.52 ± 0.05 b87.82 ± 0.10 a4.82 ± 0.03 f6.82 ± 0.03106.28 ± 0.61 f
WBG294.78 ± 0.045.22 ± 0.04 a2.44 ± 0.04 a1.65 ± 0.03 c0.64 ± 0.03 c0.49 ± 0.02 b89.56 ± 0.08 e4.39 ± 0.06 b6.19 ± 0.06 a114.81 ± 0.27 k
CADG92.12 ± 0.057.88 ± 0.05 b2.35 ± 0.03 a1.73 ± 0.05 c0.64 ± 0.03 c0.49 ± 0.02 b86.91 ± 0.05 b4.39 ± 0.06 b6.19 ± 0.06 a94.5 ± 4.00 g
Each value represents the mean ± standard deviation. The values within a column with different letters differ by Tukey’s test (p < 0.0001). Source: Authors. Green background colour (NVC, APC and CADC) signifies the de-watered cassava mash samples used.
Table 3. Thermal properties of cassava mash before garification. Each value represents the mean ± standard deviation.
ParameterTemp (°C)MCwb (%)k (W m−1 °C−1)Density (kg m−3)Cp (J kg−1 °C−1)α (m2 s−1)
NVC34 82 ± 0.96 a49.23 ± 0.72 f0.34 ± 0.002 c1223.09 ± 0.35 x2883.17 ± 0.32 u9.74 × 10−8 ± 3.63 × 10⁻¹⁰ v
APC34.84 ± 0.83 a47.82 ± 1.47 f0.34 ± 0.004 c1207.72 ± 0.12 y2849.95 ± 0.15 t9.62 × 10−8 ± 1.003 × 10⁻¹⁰ h
CADC35.89 ± 0.78 b48.30 ± 0.99 f0.35 ± 0.00002 f1214.33 ± 0.52 z2859.87 ± 0.359.76 × 10−8 ± 2.89 × 10⁻¹¹ v
The values within a column with different letters differ by Tukey’s test (p < 0.0001). Source: Authors.
Table 4. Thermal properties of gelatinized cassava mash (Gari) after roasting.
ParameterTemp (°C)MCwb (%)k (W m−1 °C−1)Density (kg m−3)Cp (J kg−1 °C−1)α (m2 s−1)
NVG1111.57 ± 2.64 a5.76 ± 0.05 a0.28 ± 0.01 a1502.01 ± 1.72 b1843.94 ± 2.89 a1.02 × 10−7 ± 2.64 10−9 a
NVG2104.65 ± 4.43 b7.37 ± 0.05 b0.31 ± 0.01 b1490.07 ± 1.41 c1879.43 ± 2.67 b1.09 × 10−7 ± 4.55 10−9 b
NVG3112.58 ± 10.34 a5.45 ± 0.07 a0.27 ± 0.03 c1505.37 ± 4.28 b1834.52 ± 7.11 c9.76 × 10−8 ± 9.10 × 10⁻⁹ c
NVG4107.75 ± 9.95 c6.84 ± 0.02 c0.30 ± 0.03 d1492.25 ± 8.08 c1870.53 ± 14.55 d1.07 × 10−7 ± 1.07 × 10⁻⁸ d
APG109.31 ± 12.43 d5.77 ± 0.06 a0.27 ± 0.03 c1502.63 ± 9.02 d1844.85 ± 16.01 c9.64 × 10−8 ± 1.15 × 10⁻⁸ e
ATG108.78 ± 9.21 c6.41 ± 0.04 c0.29 ± 0.02 e1496.76 ± 6.88 d1860.61 ± 12.01 e1.02 × 10−7 ± 8.50 × 10⁻⁹ a
WBG1106.77 ± 8.78 c6.88 ± 0.06 c0.31 ± 0.03 b1498.96 ± 2.71 b1862.97 ± 5.13 d1.09 × 10−7 ± 9.55 × 10⁻⁹ b
WBG2114.29 ± 5.78 e5.22 ± 0.04 a0.28 ± 0.01 a1511.11 ± 1.30 e1827.71 ± 2.19 c1.01 × 10−7 ± 3.69 × 10⁻⁹ f
CADG98.90 ± 13.60 f7.88 ± 0.05 b0.30 ± 0.01 d1493.14 ± 1.82 f1882.61 ± 3.39 f1.09 × 10−7 ± 4.15 × 10⁻⁹ b
Each value represents the mean ± standard deviation. The values within a column with different letters differ by Tukey’s test (p < 0.0001).
Table 5. Comparison of this study’s thermal conductivity models to the measured values-based models from the literature.
AuthorsModel with CoefficientsMethodsAverage (k)R2Pr > FE (%)
TPkGeneral = 0.068 + (1.74 × 10⁻³ × Temp) + (4.37 × 10⁻³ × MCwb)CHOI0.31 ± 0.03
TPkNV = 0.014 + (2.2 × 10⁻³ × Temp) + (5.1 × 10⁻³ × MCwb)CHOI0.31 ± 0.030.98<0.0001−0.2
TPkAP = 0.024 + (2.0 × 10⁻³ × Temp) + (5.1 × 10⁻³ × MCwb)CHOI0.32 ± 0.030.93<0.0001−3.0
TPkCAD = 0.16 + (1.12 × 10⁻³ × Temp) + (2.9 × 10⁻³ × MCwb)CHOI0.32 ± 0.020.97<0.0001−3.3
[25]kKust = 0.008 + (4.43 × 10⁻⁴ × Temp) + (5.84 × 10⁻³ × MCwb)TM-HWP0.27 ± 0.110.93<0.000113.1
[26]kSweat (meats and fish) = 0.08 + 0.52 × (MCwb/100) (cassava mash/all process)TCP0.22 ± 0.100.92<0.00016.18/31.2
[26]kSweat (fruits and vegetables) = 0.148 + 0.493 × (MCwb/100)TCP0.28 ± 0.100.92<0.00019.4
[5]kBalk = 0.2112 + (8.943 × 10⁻³ × (MCwb/100)Temp) + (0.3077) × (MCwb/100)2DPM0.26 ± 0.040.93<0.000117.3
[27]kCansee = 0.408 − (1.380 × 10⁻³ × Temp) − (5.865 × 10⁻⁴ × C)TM-LHSM0.29 ± 0.040.8<0.00016.3
[7]kAnderson = (MCwb/100) × kwater + (1 − (MCwb/100)) × ksolidsTM-LHSM0.36 ± 0.080.92<0.0001−14.1
Where TP—This paper, kKust—model from Kustermann, kSweat (meats and fish) = Sweat, kSweat (fruits and vegetables) =, kBalk—Baik and Mittal, kCansee—Cansee, kAnderson—Modi., kwaterk of water (0.614 W m−1 °C), ksolidsk values of solids (0.2597 W m−1 °C), C—concentration ranges of 20 to 50%, TM-HWP—Transient Methods–Hot Wire Probe, TCP—Thermal Conductivity Probe, DPM—Dual Probe Method, and TM-LHSM—Transient Methods–Light Heat Source Method.
Table 6. Scatterplot matrix showing correlations of all parameters considered in this study.
CHO (%)CP (%)CF (%)TA (%)CFb (%)HCN (ppm)MCwb (%)Temp (°C)Dnsit (kg/m3)TC (W/m °C)Cp (J/kg °C)Diff (m2/s)
CHO (%)1.00−0.64−0.540.840.66−0.82−0.990.980.99−0.80−0.990.36
CP (%)−0.641.000.65−0.17−0.110.190.61−0.59−0.590.360.60−0.41
CF (%)−0.540.651.00−0.39−0.050.180.52−0.51−0.520.360.52−0.26
TA (%)0.84−0.17−0.391.000.75−0.89−0.860.850.87−0.75−0.860.21
CFb (%)0.66−0.11−0.050.751.00−0.57−0.680.660.69−0.65−0.690.09
HCN (ppm)−0.820.190.18−0.89−0.571.000.83−0.82−0.830.680.83−0.28
MCwb (%)−0.990.610.52−0.86−0.680.831.00−0.98−0.990.800.99−0.35
Temp (°C)0.98−0.59−0.510.850.66−0.82−0.981.000.98−0.71−0.980.48
Density (kg/m3)0.99−0.59−0.520.870.70−0.83−0.990.981.00−0.82−0.990.33
TC (W/m °C)−0.800.360.36−0.75−0.650.680.80−0.71−0.821.000.810.28
Cp (J/kg °C)−0.990.600.52−0.86−0.690.830.99−0.98−0.990.811.00−0.34
Diff (m2/s)0.36−0.41−0.260.210.09−0.28−0.350.480.330.28−0.341.00
Disclaimer/Publisher’s Note: The statements, opinions and data contained in all publications are solely those of the individual author(s) and contributor(s) and not of MDPI and/or the editor(s). MDPI and/or the editor(s) disclaim responsibility for any injury to people or property resulting from any ideas, methods, instructions or products referred to in the content.

