Article

Techno-Economic Assessment of the Viability of Commercial Solar PV System in Port Harcourt, Rivers State, Nigeria

by
Muzan Williams Ijeoma
1,2,3,
Hao Chen
1,2,
Michael Carbajales-Dale
1,2,* and
Rahimat Oyiza Yakubu
3
1
Department of Environmental Engineering and Earth Sciences, Clemson University, Clemson, SC 29634, USA
2
Energy, Economy, and Environment (E3) Sustainable Analysis Group, Clemson University, Clemson, SC 29634, USA
3
Department of Mechanical Engineering, Kwame Nkrumah University of Science and Technology, Kumasi AK-385-1973, Ghana
*
Author to whom correspondence should be addressed.
Energies 2023, 16(19), 6803; https://doi.org/10.3390/en16196803
Submission received: 23 August 2023 / Revised: 18 September 2023 / Accepted: 20 September 2023 / Published: 25 September 2023

Abstract

:
Supermarkets in Port Harcourt (PH) city, Nigeria, predominantly rely on diesel electricity generation due to grid instability, leading to high electricity prices. Although solar photovoltaic (PV) systems have been proposed as an alternative, these supermarkets have yet to adopt them, mainly due to high investment costs and a lack of awareness of the long-term financial and environmental benefits. This paper examines the technical and economic practicality of a PV system for these supermarkets using the PVsyst software and a spreadsheet model. Solar resources showed that PH has a daily average solar radiation and temperature of 4.21 kWh/m2/day and 25.73 °C, respectively. Market Square, the supermarket with the highest peak power demand of 59.8 kW and a 561 kWh/day load profile, was chosen as a case study. A proposed PV system with a power capacity of 232 kW, battery storage capacity of 34,021 Ah, a charge controller size of 100 A/560 V, and an inverter with a power rating of 60 V/75 kW has been designed to meet the load demand. The economic analysis showed a $266,936 life cycle cost, $0.14 per kWh levelized cost of electricity (LCOE), a 4-year simple payback time, and a 20.5% internal rate of return (IRR). The PV system is feasible due to its positive net present value (NPV) of $165,322 and carbon savings of 582 tCO2/year.

1. Introduction

Energy is a basic human need, and its scarcity can significantly impact how we live. When electricity is needed for daily activities ranging from homes to businesses, ensuring its availability and affordability is critical for human survival. Global debates have focused on sustainable energy production and climate change. The International Energy Agency (IEA) predicts that global primary energy demand will rise by 36% from 2008 to 2035, with fossil fuels continuing to dominate the world’s fuel mix, leading to a significant rise in greenhouse gas (GHG) emissions [1].
Nigeria is the most populous country in Africa and has one of the continent’s most successful economies. It has a large installed capacity of about 12,522 MW [2] of electricity from hydro, gas, wind, solar, diesel, and other sources. It has an average daily peak generation of 4022 MW and an average daily off-peak generation of 3521 MW. The national power grid provides only 3941 MW of the generated electricity supplied to the user [3], which accounts for just 52% of the available generated power, with the deficit being made up by diesel generators. Despite this, most days, the country can only dispatch roughly 4000 MW to customers [3], even though its transmission and distribution capacities are 7000 MW and 5800 MW, respectively. Because of inefficient power generation, only 40% of the population has access to electricity (86% in urban areas and 34% in rural regions) [4]. According to a study by the Nigerian Electricity Regulatory Commission (NERC), only 8000 MW of electricity capacity (about 64% of the installed capacity) was usable in 2022 [3], and only 39% of the country’s more than 200 million people had access to power [5]. Although the Nigerian government intends to add 3863 MW of more energy over the next 24 months, primarily using hydroelectric, solar, and coal facilities, it still falls short of the nation’s energy demand. Thus, the grid’s power supply must be enhanced to satisfy the country’s peak load demand of 19,798 MW [6].
Port Harcourt City is in the South-South region of Nigeria at latitude 4.78° N and longitude 7.01° E. It is Nigeria’s fifth most populated city, with about 3.3 million people [7,8]. Commercial centers are the largest electricity consumers in the city, and due to the grid’s instability, business centers rely entirely on diesel generators for energy generation to maintain supply. Due to the high cost of a liter of diesel compared with the low grid electricity tariff [6], the cost of power has risen by 23%. This cost will likely increase with the Nigerian Federal Government’s removal of fuel subsidies [9]. The carbon footprint of running these generators, of about 2700 g of CO2-eq per kWh [10], is relatively high compared to other forms of electricity generation; even coal is at around 1000 g of CO2-eq per kWh [11]. There are calls for developing clean and cost-effective alternative sources of electricity generation, thereby compensating for the national grid’s shortfall [12,13], and standalone solar photovoltaic (PV) systems have been proposed [14]. Nonetheless, these supermarkets have not taken advantage of this alternative due to the high cost of investment and a lack of awareness of the long-term financial and environmental benefits of solar PV systems.
Nigeria, which has tropical and semi-arid weather and is located just a few degrees north of the equator, is endowed with excellent solar energy resources dispersed across the entire country. The daily solar radiation level fluctuates between 4 and 6 kWh/m2. The yearly sunshine length spans from 1800 to 3000 h (about 4 months), providing a tremendous opportunity for solar PV systems in grid-connected and off-grid applications [15]. PV systems can play an essential role in mini-grids and commercial electricity generation plants [16]. They can boost economic growth, upscale industrial and academic research [17], reduce carbon emissions, and increase electricity upscaling in off-grid locations.
Several studies in Nigeria have evaluated the installation of grid-tied and off-grid solar PV systems for generating electrical energy. Adaramola [18] used the HOMER software [19] to test the potential of an on-grid solar PV system for electrical generation to supply 80 kW in Jos, Nigeria. The author assessed the following parameters: average global (diffuse and direct) solar radiation, annual electricity generation, and levelized cost of electricity (LCOE), with results showing the feasibility of a grid-connected PV system to power 40% of the electricity requirement. The study assumed 6.0 kW/h/m2/day solar radiation, and the expected annual electricity generation and LCOE were 331,538 kWh and $0.10 per kWh, respectively. Nonetheless, the author did not consider how to reduce the excess energy produced by the system and its resulting impact on the system’s performance ratio and LCOE.
Oladeji et al. [20] designed an off-grid PV system for a commercial building in northwest Nigeria, also using the HOMER software (Homer pro3.2). The authors divided the study into two categories focused on the most common electrical appliances. Category 1 comprised essential load demand, including fluorescent lighting, ceiling fan, computer set, printing machine, fridge, television, and satellite decoder, with an average load of 36.34 kWh/day. Category 2 was all load from Category 1 plus the air conditioner system, with an average demand of 198.1 kWh/day. Results indicated that Category 1 was more cost-effective, with a system cost of $92,450 and LCOE of $0.53 per kWh, compared with Category 2, which had a system cost of $505,920 and LCOE of $0.54 per kWh. However, the authors did not analyze the carbon savings from the system or the variability in the maintenance and operation cost of PV systems in the region.
Using the RETScreen software [21], Akpan et al., 2013 [22] used the life cycle cost to evaluate the viability of deploying an off-grid PV system in northeastern Nigeria. The researchers compared the life cycle cost of an off-grid PV system with the price of a modern grid. They concluded that the viability of a standalone PV system depended on the subsidy program and regulatory structures. However, the off-grid PV unit price information or the system’s environmental impact was not provided.
Tijani et al. [23] used HOMER software to conduct a techno-economic analysis of a hybrid PV-diesel-battery off-grid system for an international college in Northern Nigeria. The authors evaluated four scenarios: a standalone diesel system, a standalone PV system with battery storage, and a hybrid PV-diesel system both with and without battery storage. The results were $0.54 per kWh for the standalone diesel system, $0.57 per kWh for the standalone PV system, $0.63 for hybrid PV-diesel without battery, and $0.57 per kWh for hybrid PV-diesel with battery. The author recommended that the standalone PV system with battery was the winning configuration because of the emission reduction and uncertainty in the price of diesel. The carbon emissions of the standalone PV system were 8477 kg/year, with a standalone diesel and a hybrid PV-diesel generator system emitting 141,354 kg/yr and 14,410 kg/yr of carbon, respectively. The findings showed that the PV system had a peak power of 120 kW and required 972 m2 of panels and two batteries (1156 Ah, 12 V).
Using the HOMER software, Modu et al. [24] conducted a techno-economic analysis of four systems: (1) off-grid PV, (2) standalone diesel, (3) PV-diesel, and (4) PV-diesel-batteries; in Kastina, Northern Nigeria. The PV-diesel battery system had the lowest LCOE when compared to the other three systems. The researchers did not specify the amount of carbon dioxide saved by installing an off-grid PV system.
Olusola et al. [25] analyzed an off-grid residential solar PV system in Jos, Nigeria. The study showed that ten PV modules, each with a 275 Wp rating, five 100 Ah batteries, 24/120 A charge controller, and 2.5 kW inverter capacity, have the potential to deliver 3132 kWh of electricity annually. Additionally, the economic assessment showed that the life cycle cost (LCC), annualized LCC, and LCOE were $10,111, $594, and $0.18 per kWh, respectively. The authors concluded that the amount of electricity generated, and the unit cost of electricity are appropriate to support residential household electricity consumption. However, the authors did not calculate the environmental impact of the PV system or any potential performance losses due to shading. Despite prior studies (most focused in Northern and Western Nigeria) demonstrating the practicality of grid-connected PV systems and the possibility of PV hybrid systems, research institutes have not evaluated the feasibility of developing PV systems for off-grid power for commercial uses in Nigeria’s South-South region, specifically, Port Harcourt (PH) city.
This study aims to improve the situation by conducting a techno-economic and environmental assessment of commercial solar PV systems in PH City, Nigeria. The objectives are to conduct a resource assessment, develop a load profile, design a PV system, carry out an economic assessment, and report on the potential carbon savings [26]. An energy audit was conducted, PVsyst software (PVsyst V7.3.4) [27] was utilized for PV system modeling, a financial model was developed, and carbon savings were determined using the Tier 1 International Panel on Climate Change (IPCC) GHG emission guidelines, 2006 [28,29]. The result of this study will help improve the energy density in the region, help reduce the supermarket’s dependency on diesel generators for power generation, and increase renewable energy penetration into the Nigerian electricity power generation mix. The study was conducted with practical energy audit data obtained from these supermarkets. The study was restricted to only supermarkets in Port Harcourt, Rivers State, Nigeria, and the South-South region of the country.

2. Materials and Methods

The procedure for performing the techno-economic and environmental assessment is shown in Figure 1. The process involves conducting an energy audit at the supermarkets to determine their daily electrical load demand, followed by the design of a solar photovoltaic technical system to meet the daily load demand, and then assessing the economic and environmental viability of the designed system [30].

2.1. Load Profile Analysis

This load profile analysis focused on conducting an energy audit at different supermarkets in PH City. The analysis only considered supermarkets that provided complete data based on the data gathering sheet. The load assessment involved data gathering using a survey on the electrical appliances used in the supermarket, conducting a power use breakdown of each of these appliances indicating their function, wattage, and operational time in a day, and applying statistical analysis to determine the total load from each supermarket. The power rating of each of the supermarkets is shown in Table 1 based on their appliance categories. The building energy use focused on the building’s opening hours and the building-installed appliances, especially the building envelopes and HVAC system. The power consumption of the appliance category for every supermarket was determined by adding the power rating of the total appliances in that category. The power use breakdown of each of the supermarkets was determined according to the appliance shown in Table 1, and Figure 2 depicts the overall average contribution of each appliance to the various supermarkets considered. The total power consumed by each supermarket was calculated by summing the wattage of each appliance category for a given supermarket. The supermarket with the highest power rating (Market Square) was selected for the case study.
From Table 1 and Figure 2, Market Square had the highest power rating among the seven supermarkets analyzed in the study. The Market Square was chosen as the case study for the techno-economic analysis because of its high energy demand. It had a daily peak load of 59.8 kW. It also shows that refrigeration is the highest contributor to the overall energy requirement of the building.
Total Energy Demand (TED) = ∑E
where E is the sum of the energy from each of the appliances in Table 2, and from Equation (1) [32], the Market Square supermarket’s daily total energy demand was 561 kWh/day.
Using the PVsyst software (PVsyst V7.3.4, PVsyst SA, Satigny, Switzerland), detailed user requirements and an hourly distribution model have been defined over the course of a year. The hour distribution was derived from imputing the required load demand in the supermarket at every hour in the PVsyst software. Table 3 demonstrates that the supermarket’s daily load demand of 561 kWh/m2/day remains constant throughout the year. The simulation and analysis employed these parameters. Because the supermarket is closed between 11 p.m. and 8 a.m. and many appliances are turned off, Figure 3 demonstrates that the load is at a minimum, constant level due to refrigeration. When the supermarket opens at 9 a.m., the load demand increases as many devices are turned on. The hourly distribution reveals that the peak load occurs between 10 a.m. and 1 p.m., typically during lunch breaks, and gradually decreases as the day progresses. This pattern is consistent throughout the week, with weekend demand slightly higher. It is crucial for supermarkets to manage their energy consumption during peak hours to avoid possible power outages.

2.2. Solar Resources Assessment

The solar resources assessment was carried out using the U.S. National Aeronautics and Space Administration (NASA) Metrology database [33] and the Global Solar Atlas [8]. These databases have been fully integrated into the PVsyst software. According to NASA, the average daily horizontal solar irradiation (Hc) on a plane of array (POA) in PH city was 4.21 kWh/m2/day, with an average ambient temperature of 25.3 °C. Table 4 shows the solar irradiance and temperature of the site, and these resource assessments were retrieved from the PVsyst energy modeling software. To ensure sufficient solar energy availability throughout the year, the baseline system was designed using data from July, the month with the lowest daily horizontal solar irradiance of 3.24 kWh/m2/day.

2.3. PV System Architecture

According to the design architecture depicted in Figure 4, as the sun’s energy strikes the PV solar cells, it creates electricity. This electricity is then managed using a maximum power point tracking charge controller, which regulates the current and voltage that flows out of the PV array [34]. When the PV system fails to produce electricity or energy demand increases, the battery system acts as a backup energy storage system to ensure reliable performance [35]. An inverter (DC/AC) converts direct current to alternating current from the PV array and batteries to meet the load demand.

2.4. Sizing of PV Components

The components specified in the PV system architecture in Figure 3 are sized based on the load demand of the case study location.

2.4.1. PV Array Capacity (PAC) Sizing

The PV array capacity is determined using the average solar radiation available at the design location, which requires daily energy demand and derating factors because of losses due to wiring, dust particles, and other environmental factors. This ensures a margin of safety between PV module limits and applied stresses. The PAC can be determined from Equation (2).
PAC = E daily   [ kWh ] f d × S h   [ h ]
where Edaily is the daily energy consumption, fd is the derating factor assumed, and Sh (also known as peak sunshine hour) is the number of hours the sun must shine at its peak (1000 W/m2) to deliver the same amount of energy received throughout the day [36]. The system derating factor is estimated to be 75–85% [37]. The peak sunshine hour can be determined using Equation (3), and the number of modules required by the system can be determined using Equation (4).
S h = H c kWh m 2 /   1   [ kW m 2 ]
where Hc is the daily horizontal solar irradiation on a plane of array (POA).
N mod = PAC   [ kW ] P mod   [ kW ]
where Nmod is the total number of modules required, and Pmod (rated) is the rated capacity of one module [36].

2.4.2. Inverter Sizing

The inverter helps convert the DC current from the PV cells to AC current to be delivered to the load. The inverter size can be determined by dividing the direct current (DC) of the PV array by the inverter’s maximum alternating current (AC). The inverter rating must fulfill Equation (5) [38].
Nominal   power Power   estimated × 1.25
where 1.25 is a safety factor. The inverter’s safety factor ensures that we adhere to the functional safety of the system design and protect the inverter from harm caused by high power surges. Furthermore, the safety factor is critical for safeguarding other elements connected to the inverter and guarding against potential danger or malfunction caused by power fluctuations.

2.4.3. Battery Bank Capacity

The battery storage acts as a backup for energy storage, supplying power when the PV system is not available. The size of the battery size was determined using Equation (6).
BBC   Ah = E daily   kW × T c × DA × DM V bat × DOD   ×   B eff
To size the battery bank, the following data are needed: daily electricity consumption Edaily (kWh), battery efficiency (Beff), battery nominal voltage Vbat, depth of discharge (DOD), number of days of autonomy (DA), design margin (DM), where 10% of the energy has been taken as the margin of safety [36]. DA determines how long the battery will be available to meet the load demand; however, the longer the DA, the more battery will be required by the system. It is a function of the desired level of availability and site solar radiation. DOD determines the life output of the battery; Tc helps to regulate the temperature of the battery to improve its performance; the DM, which is also known as the safety factor, accounts for sudden changes in electrical load requirements.

2.4.4. Charge Controller Sizing

In a battery-based system, the charge controller attached to the PV array must be large enough to manage all the power produced by the array [39]. The capacity of the maximum power-pointing tracking (MPPT) charge controller was calculated using Equations (7) and (8).
Vc - volt = 1.10   ×   N mod / s × V oc
Ic - input = 1.25   ×   I sc × N strings
where Vc-volt is the MPPT maximum output voltage, 1.10 is the safety factor, Nmod/s is the number of modules per string, and Voc is the open-circuit voltage of each module. Ic-input is the minimum charge controller input current, Isc is the short circuit current, 1.25 is the safety factor, and Nstrings is the total number of strings [40]. The MPPTs are usually rated by their output voltage and current capacity. This safety factor is essential to protect the controller from harm and prolong its life. Additionally, reducing possible dangers related to unforeseen changes in voltage and current aids in maintaining the stability and dependability of the entire power system.

2.5. Economic Analysis

The economic assessment considered the following indicators: life cycle cost, simple payback time, levelized cost of electricity, internal rate of return, and carbon savings energy model [31,41,42].

2.5.1. Life Cycle Cost (LCC)

The overall cost across its life cycle, including startup capital, maintenance, operating, and the asset’s resale value at the end of its life, is calculated using the life cycle cost (LCC) method. The price includes the PV array, storage batteries, charge controller, inverters, and operation and maintenance. Below is how they were determined.
  • PV Cost, CPV = PV unit cost × number of modules.
  • Battery Cost, CB = Unit cost of battery × Number of batteries.
  • Charge Controller Cost, CCC = Unit cost of a charge controller.
  • Inverter Cost, CINV = Unit Price of Inverter size.
  • Cost of Installation was assumed to be 10% of the PV array’s initial cost.
  • Operation and maintenance (O&M) cost was assumed to be 5% of the initial investment cost.
The installation cost assumption of 10% of the PV array’s initial cost, and the O&M cost deduction of 5% of the initial investment were based on interactions with PV system installation companies in Port Harcourt and a lack of cohesive empirical data regarding the installation and operation of the system in the city. These assumptions were made to estimate the installation and O&M costs of the PV system in Port Harcourt. However, it is essential to note that these numbers can vary based on factors such as project scale, location, and specific needs. Additional research and data collection are necessary to ascertain the actual costs associated with the installation and operation of a PV system in the city.

2.5.2. Net Present Value (NPV)

The net present value determines the current worth of all future cash flows generated by a project, including the initial capital expenditure. It is the present value of all future cash flows discounted at the rate of interest [43]. The NPV can be determined from Equations (9) and (10).
NPV = En   [ kWh ] ( 1 + r ) n × Unit   Cost Initial   Cost C o & m + C repl ( 1 + r ) n
NPV = Present   Value   of   Benefit Present   Value   of   Total   Investment
where  E n  is the energy generated, r is the interest rate, Unit Cost is the tariff rate,  C o & m  is the operation and maintenance cost,  C r e p l  is the cost of replacement, and n is the discounted cash flow year.

2.5.3. Simple Payback Time (SPBT)

The payback period is the length of time required to repay the cost of an investment. SPBT can be determined from Equation (11).
SPBT = Initial   Investment   Cost Present   Cost   of   Benefit
Shorter payback times indicate more attractive investments, while more extended payback periods indicate less desired assets [44].

2.5.4. Levelized Cost of Electricity (LCOE)

The LCOE is used to determine the project’s lifetime energy cost. It is a function of the life cycle cost of the project and the energy generated over its lifetime. The LCOE enables comparison with other energy resources. The LCOE can be determined from Equation (12).
LCOE = Life   Cycle   Cost   [ $ ] Lifetime   Energy   Generated   [ kWh ]
The Levelized Cost of electricity estimates a producing plant’s average net present price of electricity generation during its lifespan [45].

2.5.5. Internal Rate of Return (IRR)

The internal rate of return (IRR) is the project’s yearly rate of growth from an investment. IRR is calculated such that NPV is set to zero. IRR was calculated using Equation (13).
0 = Year   n   total   cash   flow ( 1 + discount   rate ) n

2.6. Environmental Assessment (Carbon Savings)

The carbon savings were calculated using the Tier 1 International Panel on Climate Change (IPCC GHG Emission Guideline, 2006) method of computing carbon footprint where the emission factor is country-specific (these guidelines were refined in 2019). This additional model assists in calculating the yearly decrease in greenhouse gas emissions caused by utilizing the suggested technology (diesel generator) emission factor [46,47]. The carbon savings could be determined using Equation (14).
Carbon   Savings = E ann × e diesel × t
where  E a n n  is the projected annual energy generated (kWh),  e d i e s e l  is the carbon dioxide (CO2) emission factor of diesel fuel in the country (kg/kWh), and t is the project lifetime.

2.7. Existing and Proposed Energy Generation Systems

This section covers the existing diesel generator system at the supermarket and the proposed solar PV system with battery design. In addition, the economic input parameters for the systems.

2.7.1. Existing Diesel Generator System at the Supermarket

A 100-kW diesel generator was currently meeting this TED [48]. The characteristics of this diesel generator are shown in Table 5.
In Nigeria, minor services on a diesel generator usually cost 41,115 naira (US $100) [49,50]. The current market price of a liter of diesel in Nigeria is N277.83 ($0.673) [51]. The study used the current cost of diesel fuel, which is $0.673 per liter. A general rule of thumb states that a diesel generator uses 0.4 L of diesel per kWh produced [51]. The cost value of all gathered data was in Nigerian naira and converted to US dollars at the rate of 1 USD to NGN 411.15 [50]. The exchange rate used in the Xe platform US dollar rate values at the end of 2022. However, the Nigerian economy is unstable, and the rate exchange rate changes frequently. A typical diesel engine can run for 30,000 h or more [52]. According to the diesel fuel consumption rate of 0.4 kWh/liter and daily energy demand shown in Table 5, the generator system will require a minimum of 224.4 L of diesel per day to generate the 561 kWh daily load demand.
Table 6 shows the operation and maintenance cost of the diesel generator. As discussed in the Introduction, the cost of diesel is expected to increase due to the Nigerian government’s removal of fuel subsidies. As a result, the operational cost for diesel generators will increase [9].

2.7.2. Proposed Solar PV System

We propose replacing the diesel generator with a standalone solar PV system with battery storage. The PVsyst software was utilized to evaluate the PV system using a Jinko solar panel. The panel specifications are depicted in Table 7.
The Jinko Solar Tiger Pro panel was chosen because of its size. The tiger panels eliminate cell gaps with the integration of tiling ribbon technology. It also improves shading tolerance by splitting a full cell into half and simultaneously reduces resistance loss by integrating multi-bushar technology. In addition to its size, the Jinko Solar Tiger Pro panel offers high efficiency and durability, making it a popular choice among consumers. Moreover, the availability of these panels in the Nigerian market makes them easily accessible for individuals and businesses looking to harness solar energy [53].
To ensure that sufficient energy was available at all times of the year, the baseline system was designed using the month with the lowest daily horizontal solar irradiance Table 2 of 3.24 kWh/m2/day in July [8,33].
The technical parameters of the standalone solar PV system were determined using Equation (1) to Equation (14). The results of the PV system design are shown in Table 8. The design parameters are used as inputs for the system modeling in PVsyst software.
With the supermarket requiring a 561 kWh/day energy demand, we propose a 232 kW PV system with battery storage of 1 autonomy. Based on the need to replace the diesel generator because of the ever-increasing diesel price of diesel and the environmental footprint of the generator, we aim to achieve at least 99% of the energy demand. To achieve 99% of daily energy demand, the baseline system was designed with the month with the lowest irradiance. The PVsyst model general parameters and PV array characteristics are shown in Table 9 and Table 10.
As a rule of thumb, the azimuth angle of the project was set at 0 because the project is in the northern hemisphere, and the tilt angle was set to the latitude of the site, which was 5 degrees. A fixed plane orientation was set because of the size of the project, and using a tracking system will not significantly improve the energy yield of the plant; however, it will increase the cost of the project [54]. For the PVsyst model, 396 panels, each with a capacity of 585 Wp with an efficiency of 21.4 percent, were required to produce 232 kW, which is sufficient to meet the supermarket’s required peak power capacity per day. The PV models would be arranged into 33 parallel strings, each of which will include 12 series panels.
The battery capacity was calculated to be 34,021 Ah with a one-day autonomy. The one-day autonomy will allow the battery system to provide the required energy to meet the supermarket load demand for up to a day when the PV system is not available, which is the number of days the battery is expected to last without recharging itself. The battery system had an 80 percent depth of discharge with 1588 kWh stored energy. The system required a total of 330 2 V/3000 Ah lead-acid battery storage connected in 11 parallel—30 series configurations, having a nominal capacity of 3300 Ah, which was slightly lower than the calculated battery capacity. The difference is due to PVsyst software optimization of the size of the battery to meet the one-day required autonomy. The life of the battery could be improved by switching from lead-acid batteries to more advanced LidPo4 batteries whenever they are available in the Nigerian market. The charge controller’s nominal current was ascertained to be more than or equal to the total load Imp current of 437 A, and the Vmp output system voltage was determined to be 483 V. A 60 V/560 VDC with a maximum array voltage of 679 V Maximum power point tracking (MPPT) was selected and used for the study. This shows that MPPT is large enough to handle the maximum current and voltage provided by the PV array. The study used a 60 V off-grid inverter to provide a minimum of 75 kW and a maximum of 80 kW of pure sine wave power, thereby meeting the condition of 1.25 percent larger than the total power of all appliances of 59.8 kW. The PVsyst software does not allow you to select an inverter for an off-grid system, but the system was sized with the surge power in mind. The panels will be installed on the roof of the Market Square supermarket, as shown in Figure 5. The supermarket has enough area space to accommodate the required PV panels. The panels will be mounted in fixed frames because roof-mounted panels are more sensitive to shade.

2.7.3. Existing and Proposed System Economic Assessment Parameters

This section covers the economic analysis of the existing energy generation system at the supermarket and the proposed solar PV system based on different indicators stipulated in Section 2.5. Equations (8)–(12) and the input parameters shown in Table 11 and Table 12 were used to design the financial model to determine the economic indicator in Section 2.5.

3. Results and Discussion

The result for the designed off-grid PV system shown in Table 13 and Figure 6 (Top) indicates that the system generates 308,736 kWh/year of available energy, more than enough to meet 100% of the 204,756 kWh/year electrical load of the supermarket at 99% solar fraction and an annual performance ratio (PR) of 56.4%. However, the system only delivered 202,467 kWh/year of useful energy to the user; of this amount, 96,678 kWh was delivered from the PV to the user, and 105,789 kWh was delivered to the user after storage in the battery, with missing energy (i.e., unmet load demand) of 2299 kWh/year. The inability of the system to supply the entire available solar energy was the result of losses in the system.
Figure 6 (Bottom) illustrates the PV system’s normalized production and system losses. At 100% of the PV system’s total energy output, the user received 56.4% of the total energy available; 27.1% of the energy was stored in the battery and remained unused at battery full capacity; 11% of the energy produced was lost at the collector (PV-array loss); and the remaining 5.5% of the energy was lost in the system and during battery discharge. These losses originate from irradiance level, temperature, module and string mismatch, converter and battery efficiencies, and wiring. These losses were more prevalent in August and September when the region’s rainy season was at its apex, and this affected the performance of the PV array and decreased the battery’s state of charge. The increased frequency of rain and heavy rainfall that the coastal region experiences during these months significantly impacts the PV array. Increased precipitation and strong winds reduce exposure to sunlight, resulting in decreased energy production and consequently influencing the battery’s state of charge. This results in increased PV array losses, system losses, and battery charge losses, while the amount of energy supplied directly from the battery to the user is significantly reduced. The diminished battery state may have affected the overall system’s efficiency and stability.
Furthermore, the system yielded 97,381 kWh/year of excess (unused) energy, affecting the system’s PR negatively. The low annual PR was caused by using the month with the minimum peak sunshine hours as the design point to ensure that enough energy was available throughout the year. To improve the performance ratio, measures such as optimizing the system design and upgrading components were considered. This unused energy from the baseline system design could be sold back to the grid for additional revenue, which in turn improves the overall PR of the baseline system. As shown in Figure 7 and Table 14, it was observed using sensitivity analysis that by using the average peak sunshine hour of the global irradiance to model the system, the available energy was reduced by 22%, the excess energy produced was reduced by over 62%; the PR increased by 23%, the missing energy in this case also increased by 247%, the solar fraction and useful energy reduced by 3%, respectively. Thus, even though the PR has increased, the useful energy of 196,780 kWh/year produced by the optimized system is not enough to meet the user load demand of 204,765 kWh/year. Hence, the optimized system will require other methods of power generation to provide an additional 7985 kWh/year of energy to meet user load demand, which will increase the levelized cost of electricity and the potential environmental impact of the system. As such, the proposed system is ideal.
The PVsyst simulation result can be downloaded from the Supplementary Materials.
Our results align with Akinsipe et al. [25], who conducted the design and economic analysis of an off-grid solar PV system in Jos, Nigeria. Their study determined that a 2.75 kW PV module and a 500 Ah battery can meet an annual load demand of 31,322 kWh. Our analysis was comparable because Jos is in northern Nigeria, where the average daily horizontal solar radiation is higher [57], and the difference in values was a result of the difference in the required load demand.
Figure 8 depicts how the operating and maintenance (O&M) rate affects the system’s LCOE. It illustrates that the LCOE will rise in direct proportion to O&M expenditures. This finding suggests a clear relationship between the O&M rate and the system’s LCOE. The rise in the cost of O&M substantially influences the system’s overall cost-effectiveness, potentially reducing the system’s financial viability.
The values in Figure 8 represent the LCOE values with respect to the PV system’s baseline O&M values of 7% of the initial investment cost. It further explains how the LCOE reduces when the O&M is decreased and vice versa. The sensitivity analysis shown in Figure 7 and Figure 8 can be downloaded from the Supplementary Materials.
The amount of energy supplied from the PV array each day changes according to seasonal variations, as shown in Figure 9. In Figure 9b, daily array output energy depicts that the production energy is even for most of the year as the system was sized with the month with lower horizontal solar irradiance to cover rainfall losses during the rainy season. Furthermore, the array power distribution depicted in Figure 9a produced a “curve” with high quantities of power generated between 145 kW and 160 kW.
The hottest month in Port Harcourt is April, according to Table 4, with an average temperature of 25.3 °C; this impacts the working temperatures of the PV array throughout the year, as shown in 
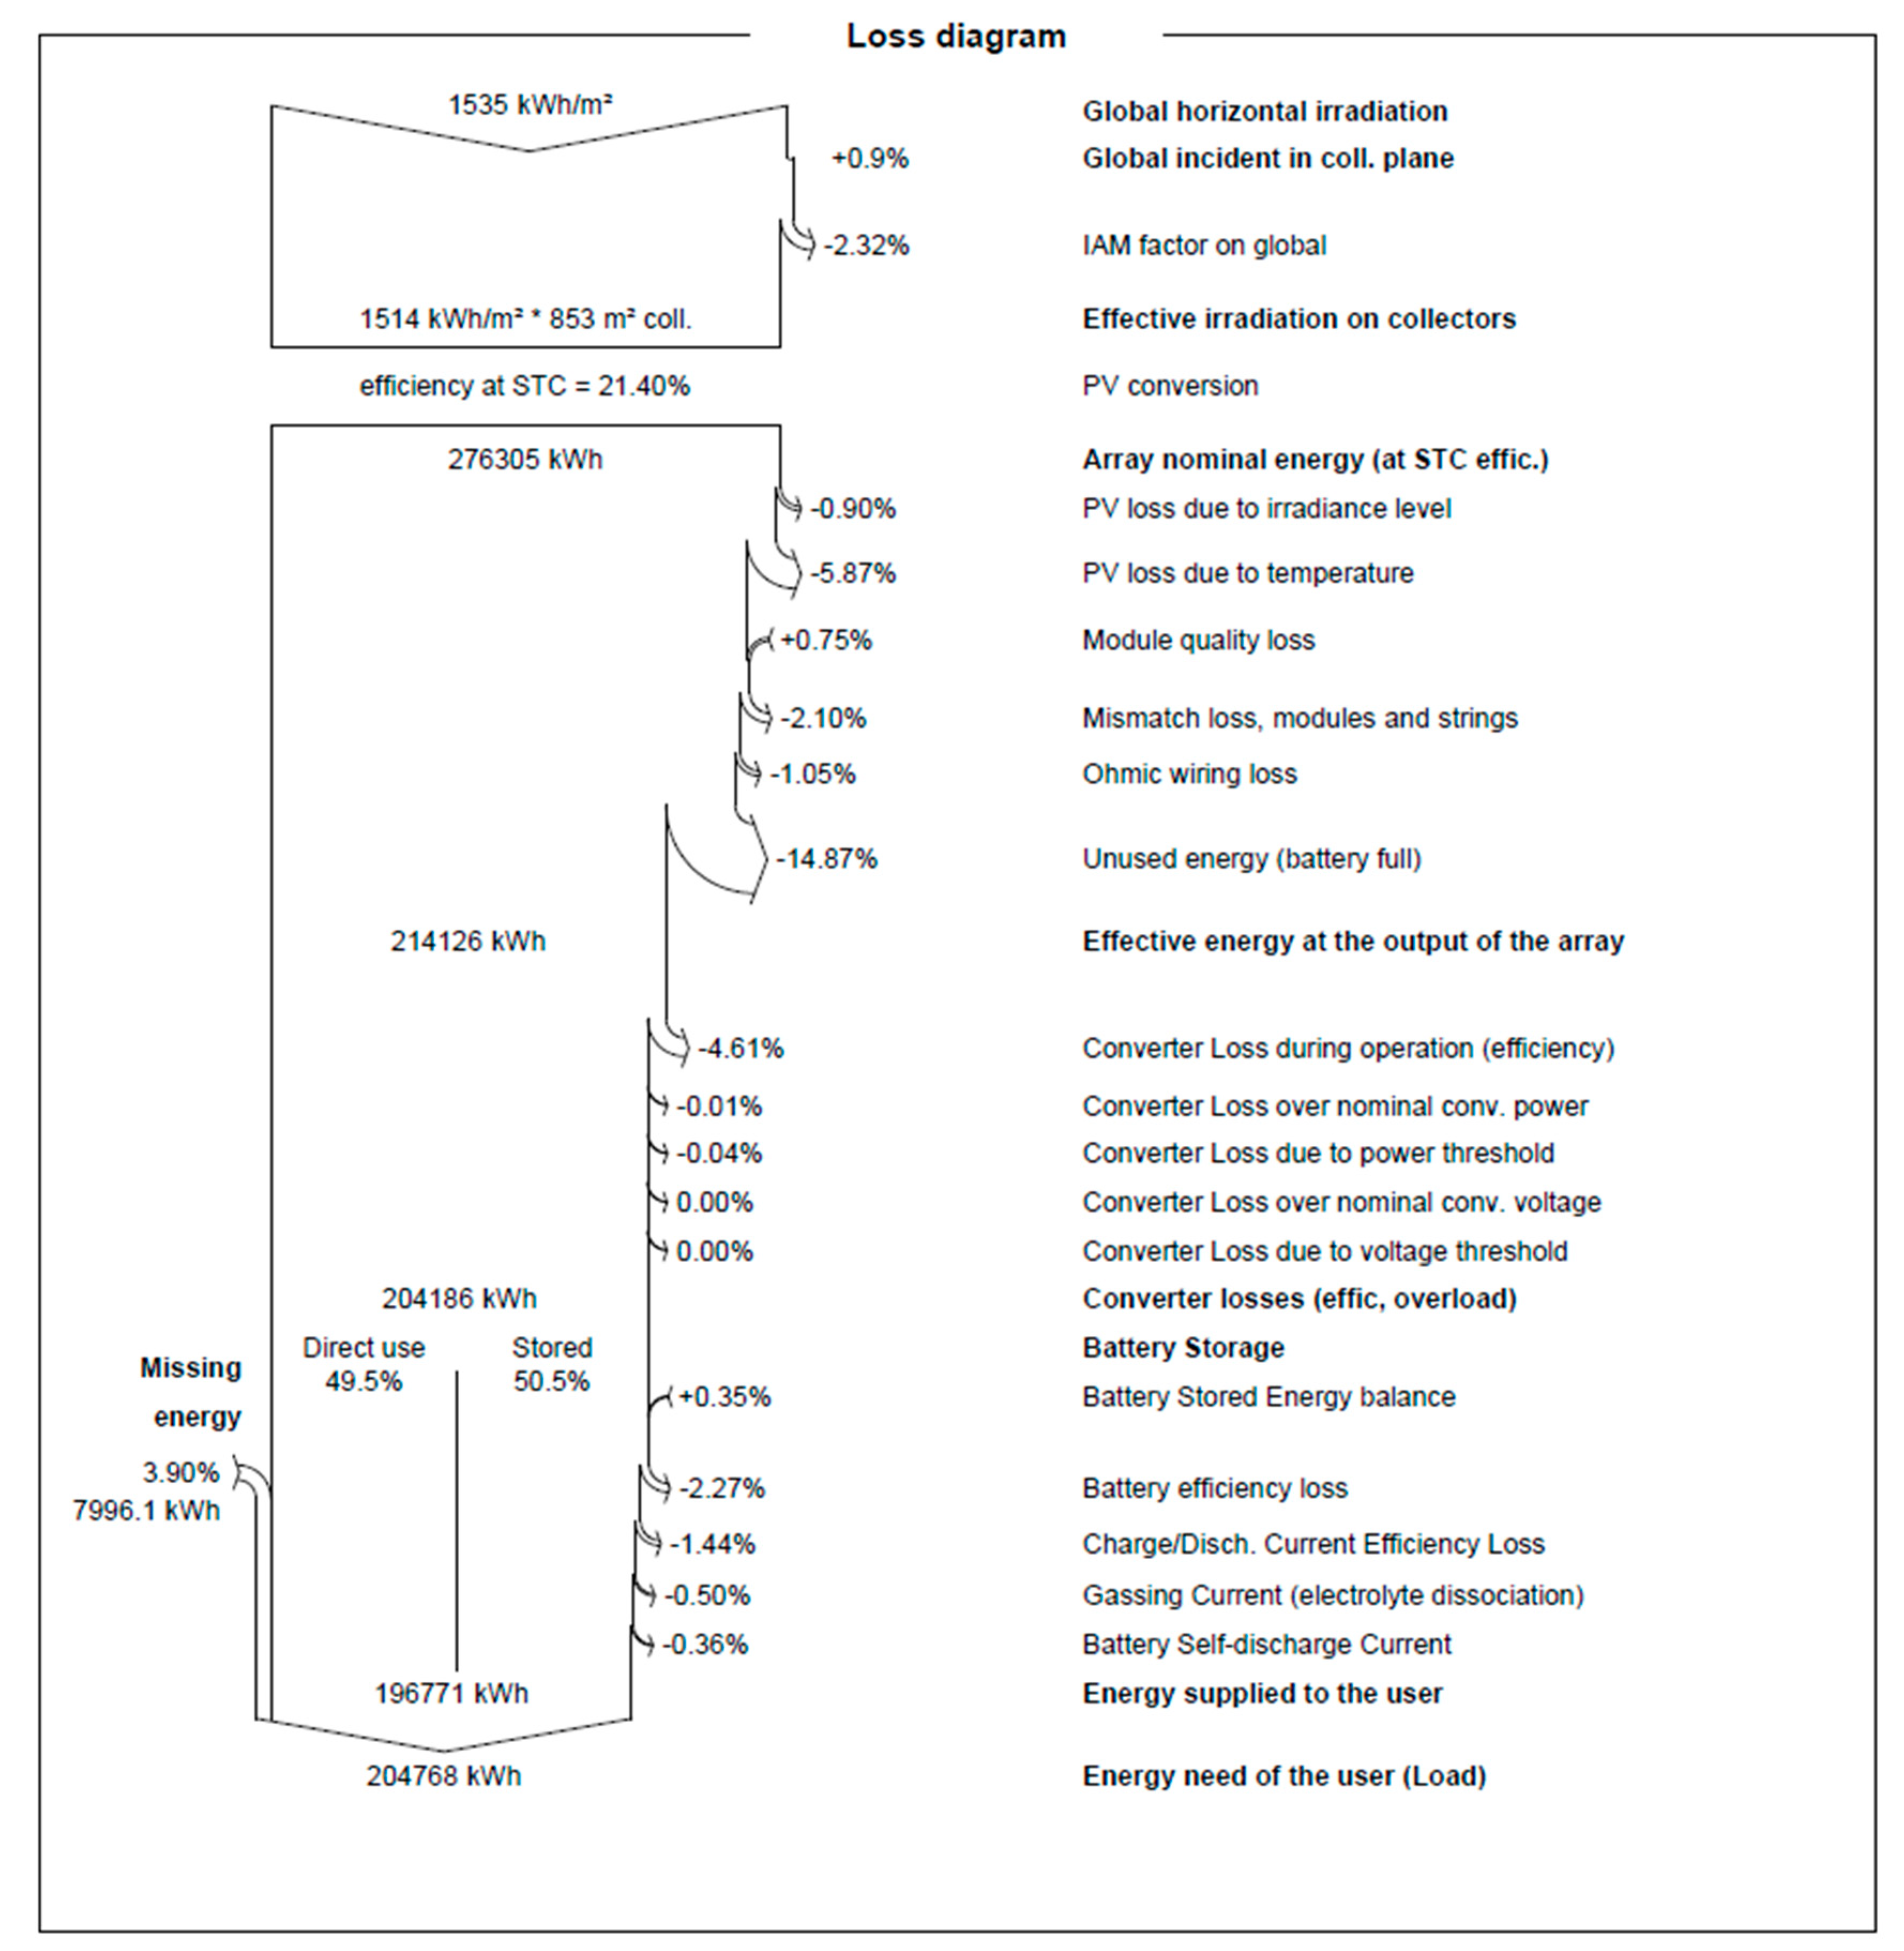
Figure 9c. High temperatures are predicted to considerably impact the open-circuit voltage and, as a result, the amount of power that the PV array can supply. The PVsyst model resulted in no loss when the horizontal irradiation was converted to the global irradiation incidence. The temperature derating effect (hot and sunny weather) was responsible for the significant loss of 5.8 percent, with converter losses of 4.6 percent, battery roundtrip efficiency loss of 3.6 percent, and 10.6 percent unused energy losses at battery full. The incidence angle modifier (IAM) is responsible for 2.3% losses, including modules and strings mismatch losses of 2.1 percent and cable losses of 1.1 percent. Low irradiance and high STC irradiance levels result in 3.4 percent irradiance level losses. The system loss diagram is shown in Figure A1.
Table 15 shows the economic assessment of the diesel generator and the proposed solar PV system. The PV-battery system has a higher initial investment cost of $152,864 compared with the existing diesel generation at the cost of $64,130. The life cycle cost for existing and proposed systems was $599,794 and $266,936, respectively. The PV economic model computed the internal rate of return at 20.5%, indicating the rate at which the proposed project will be profitable for investors. The levelized cost of electricity was $0.14 per kWh, which is comparable to other work done in the region and an improvement on the $0.36 per kWh existing system cost of electricity for the diesel generator system. The simple payback period for the solar PV system was 4 years; this means it will pay back its cost long before its end-of-life in savings compared with the existing diesel generator system. The solar PV system had a positive net present value (NPV) of $165,322, indicating its viability. The simple payback and internal return of the diesel generator system were unrealistic because of the replacement cost of the diesel generator every 5 years. The result is comparable to the off-grid solar application study for residential homes conducted by Okoye et al. in Gusau, Nigeria, where the COE for that system was $0.40 per kWh [41]. Ukoima et al. [54], in their analysis of a solar hybrid electricity generation system for a rural community in Rivers State, considered COE export rates of $0.10 per kWh and $0.20 per kWh, which is comparable with this project tariff rate of $0.20 per kWh used in our financial model analysis.
The improvement in the LCOE of this system is a result of improved PV efficiency, system efficiency using the PVsyst software, the change in the interest rate, and the lower cost of solar panels in the Nigerian market. Similarly, the solar PV off-grid analysis for an office facility in the University of Port Harcourt, Nigeria, by Oko et al. indicated that the cost of electricity was 0.60 $/kWh [31]. Our study has a lower LCOE even though both studies were conducted in the same city because of the lower cost of solar panels in 2022 compared to 2012 and the improved efficiency of the panels.
The PV-Battery system produced 97,381 kWh/yr of excess energy, as shown in Table 13. There are no established wholesale markets in Nigeria. In the absence of that, the state-owned Nigerian Bulk Electricity Trading (NBET) facilitates transactions between energy generators and distributors. The NBET regulation permits bulk purchases of electricity directly from generators at a negotiated Power Purchase Agreement (PPA). In 2018, BlombergNEF conducted a comprehensive study on on-site solar in Nigeria and determined that solar on commercial and industrial properties can cost between $0.10 to $0.20 per kWh [58]. Also, in 2021, Nigeria’s average urban and rural household spent up to $0.23 per kWh on petrol generators. According to the State of Global State Minigrids, 2020 report by BlombergNEF, the levelized cost of electricity for mini-grids in Nigeria ranges from $0.51 to $1.46 per kWh for solar hybrid residential mini-grids [58]. Assuming the excess energy produced using the PV-Battery system was sold at $0.20 per kWh based on the BlombergNEF report, the supermarket will be able to generate an additional net present value income of $96,360 per year. This will further improve the performance ratio of the system and, at the same time, reduce the LCOE and simple payback time and increase the return on investment.
The emission factor for a diesel generator in terms of carbon footprint ranges from 1.22 kgCO2/kWh to 1.94 kgCO2/kWh depending on the rated power (2 kW to 5 kW) of the diesel generator, according to Alsema et al. [46] and Jakhrani et al. [47]. For this study, it is assumed that the emission factor of the diesel generator was 1.94 kgCO2/kWh, and thus taken as the country-specific emission factor for Nigeria. The proposed solar PV generated 7,496,200 kWh of energy over its lifespan.
Carbon   Savings = 7,496,200   kWh × 1.94   kgCO 2 / kWh = 14,542,628   kgCO 2
The proposed solar PV is going to save 14,542,628 kg (about 32,060,969 Ib) of carbon dioxide. Thus, by replacing the diesel generator, 14,543 tonnes of CO2 are avoided throughout its life span, comparable to 108,488 barrels of diesel fuel that will not be burned for 25 years of the lifespan of the system [59].

4. Conclusions

A PVsyst software simulation technique was used to execute and assess the feasibility of a solar photovoltaic system to establish the techno-economic and environmental viability for the commercial center’s electricity generation in Port Harcourt, Nigeria. Port Harcourt facility established a daily average solar radiation of 4.21 kWh/m2/day and a yearly average temperature of 25.73 °C. A typical commercial center (Supermarket) in Port Harcourt, Nigeria, requires an annual energy demand of 277.74 MWh/year and uses a 100-kW diesel generator to generate its energy. The study shows the feasibility of replacing the diesel generator with a standalone 232-kW solar PV system. The total annual electricity generated and delivered to the facility using the solar PV system was 332.40 MWh compared with the existing diesel generator system. The proposed PV-battery energy system as a clean energy source will reduce carbon emission by 581.70 tons of CO2 each year and 14,543 tonnes of CO2 throughout the project’s 25-year life span. For the economic assessment, The LCOE of the proposed standalone solar PV system was $0.14 per kWh, while the LCOE of using the existing diesel generator as an electricity source was $0.36 per kWh. This will result in total savings of $244,124 over the project’s 25-year life span, with a simple payback time of 4 years and a 20.5% internal rate of return. The excess (unused) energy produced using the PV system can be sold to the grid for extra income, which will reduce the payback time and monetary savings.
The results show that there is great potential for standalone solar PV systems for commercial application in Port Harcourt, Nigeria. Thus, supermarkets in Port Harcourt, Nigeria, are recommended to install standalone PV systems, specifically for stores with significant energy consumption, rather than relying entirely on diesel generators. Also, future research could be conducted using other energy modeling software, such as HOMER, RETScreen, PVsol, etc., to determine the technical and economic viability of similar projects in the region as an alternative to using PVsyst software. As fossil fuel prices grow, so will the operational cost increase. The cost of power provided by the diesel generator is rapidly rising. The high amount of carbon emissions from diesel generators is harmful to the environment. Using standalone PV systems to supply electricity to supermarkets has shown to be feasible and cost-effective in the long run. This method will help Port Harcourt retail centers decrease fuel costs and minimize carbon emissions produced using generators. Selecting appropriate-sized components is critical since it affects longevity, dependability, and startup costs.

Supplementary Materials

The following supporting information can be downloaded at: https://www.mdpi.com/article/10.3390/en16196803/s1, this contains information on the calculation of the PH city supermarkets power ratings, PV system design, PVsyst simulation results and analysis, sensitivity analysis, and techno-economic assessment of the systems.

Author Contributions

Conceptualization, M.W.I.; methodology, M.W.I., M.C.-D. and R.O.Y.; software, M.W.I. and M.C.-D.; validation, M.C.-D.; formal analysis, M.W.I.; investigation, M.W.I.; resources, M.C.-D.; data curation, M.W.I.; writing—original draft preparation, M.W.I.; writing—review and editing, M.C.-D., H.C. and R.O.Y.; visualization, M.W.I. and H.C.; supervision, M.C.-D. and R.O.Y.; project administration, M.W.I. All authors have read and agreed to the published version of the manuscript.

Funding

This research received no external funding.

Data Availability Statement

Data is available on request.

Acknowledgments

I would like to acknowledge Patcares Global Services for their assistance with the data collection and verification.

Conflicts of Interest

The author declares no conflict of interest.

Appendix A

Figure A1. System Loss Diagram (PVsyst V7.3.4).
Energies 16 06803 g0a1

References

  1. International Energy Agency. Recent Policy Moves a Start, But Much Stronger Action Is Needed to Accelerate the Transformation of the Global Energy System, Says the Latest IEA World Energy Outlook-News-IEA. 2020. Available online: https://www.iea.org/news/recent-policy-moves-a-start-but-much-stronger-action-is-needed-to-accelerate-the-transformation-of-the-global-energy-system-says-the-latest-iea-world-energy-outlook (accessed on 10 May 2023).
  2. International Trade Administration. Electricity. Power Systems and Renewable Energy. 2023. Available online: https://www.trade.gov/country-commercial-guides/electricity-power-systems-and-renewable-energy (accessed on 28 July 2023).
  3. Okechukwu Nnodim. FG Plans 3863 mw to Boost Power Grid–Report. 2022. Available online: https://punchng.com/fg-plans-3863mw-to-boost-power-grid-report/ (accessed on 30 October 2022).
  4. USAID. Power Africa in Nigeria|Power Africa|U.S. Agency for International Development. 2019. Available online: https://www.usaid.gov/powerafrica/nigeria (accessed on 28 July 2023).
  5. Statistical Times. Nigeria population 2021—StatisticsTimes.com. 2021. Available online: https://statisticstimes.com/demographics/country/nigeria-population.php (accessed on 1 November 2022).
  6. Babatunde, O.M.; Ayegbusi, C.O.; Babatunde, D.E.; Oluseyi, P.O.; Somefun, T.E. Electricity supply in Nigeria: Cost comparison between grid power tariff and fossil-powered generator. Int. J. Energy Econ. Policy 2020, 10, 160–164. [Google Scholar] [CrossRef]
  7. Macrotrends. Port Harcourt, Nigeria Metro Area Population 1950–2022|MacroTrends. 2019. Available online: https://www.macrotrends.net/cities/22018/port-harcourt/population (accessed on 30 October 2022).
  8. Global Solar Atlas. Available online: https://globalsolaratlas.info/download/nigeria (accessed on 7 May 2023).
  9. Amnesty International. Nigeria: Removal of Fuel Subsidy Must not Exacerbate Poverty—Amnesty International. 2023. Available online: https://www.amnesty.org/en/latest/news/2023/06/nigeria-remove-fuel-subsidy-exacerbate-po/ (accessed on 18 July 2023).
  10. N. Resources Canada. Learn the Facts: Horsepower’s Effect on Fuel Consumption. Available online: https://natural-resources.canada.ca/site/www.nrcan.gc.ca/files/ooe/pdf/transportation/fuel-efficient-technologies/autosmart_factsheet_7_e.pdf (accessed on 30 July 2023).
  11. US Energy Information Administration. Frequently Asked Questions (FAQs)—U.S. Energy Information Administration (EIA). 2022. Available online: https://www.eia.gov/tools/faqs/faq.php?id=74&t=11 (accessed on 30 July 2023).
  12. Energy Sector-GET.invest. Mobilizing Investment in Renewable Energy. Available online: https://www.get-invest.eu/market-information/nigeria/energy-sector/ (accessed on 7 May 2023).
  13. Arowolo, W.; Blechinger, P.; Cader, C.; Perez, Y. Seeking workable solutions to the electrification challenge in Nigeria: Minigrid, reverse auctions and institutional adaptation. Energy Strategy Rev. 2019, 23, 114–141. [Google Scholar] [CrossRef]
  14. Nigeria Renewable Energy Master Plan–Policies-IEA. Available online: https://www.iea.org/policies/4974-nigeria-renewable-energy-master-plan (accessed on 13 June 2023).
  15. Okoro, U.K.; Chineke, T.C. Whistleblowing on photovoltaic operations in Nigeria: Panacea for sustainable development. Bull. Natl. Res. Cent. 2021, 45, 140. [Google Scholar] [CrossRef]
  16. Page, J. The Role of Solar-Radiation Climatology in the Design of Photovoltaic Systems. In Practical Handbook of Photovoltaics; Elsevier: Amsterdam, The Netherlands, 2012; pp. 573–643. [Google Scholar] [CrossRef]
  17. Muzan, I.W.; TFaisal Al-Assadi, H.M.A.A.; Iwan, M. Implementation of industrial robot for painting applications. Procedia Eng. 2012, 41, 1329–1335. [Google Scholar] [CrossRef]
  18. Adaramola, M.S. Viability of grid-connected solar PV energy system in Jos, Nigeria. Int. J. Electr. Power Energy Syst. 2014, 61, 64–69. [Google Scholar] [CrossRef]
  19. HOME-Hybrid Renewable and Distributed Generation System Design Software. Available online: https://www.homerenergy.com/ (accessed on 13 June 2023).
  20. Oladeji, A.S.; Balogun, O.S.; Aliyu, S.O. Use of standalone photovoltaic system for office building: The case study of national centre for hydropower research and development, Nigeria. Niger. J. Technol. 2018, 36, 1208. [Google Scholar] [CrossRef]
  21. RETScreen. Available online: https://natural-resources.canada.ca/maps-tools-and-publications/tools/modelling-tools/retscreen/7465 (accessed on 14 June 2023).
  22. Akpan, U.S.; Isihak, S.R.; Udoakah, Y.O.N. Electricity access in Nigeria: Viability of off-grid photovoltaic system. In Proceedings of the IEEE Africon Conference, Pointe-aux-Piments, Mauritius, 9–12 September 2013; Institute of Electrical and Electronics Engineers Inc.: Piscataway, NJ, USA, 2013. [Google Scholar] [CrossRef]
  23. Tijani, H.O.; Tan, C.W.; Bashir, N. Techno-economic analysis of hybrid photovoltaic/diesel/battery off-grid system in northern Nigeria. J. Renew. Sustain. Energy 2014, 6, 033103. [Google Scholar] [CrossRef]
  24. Modu, B.; Aliyu, A.K.; Bukar, A.L.; Abdulkadir, M.; Gwoma, Z.M.; Mustapha, M. Techno-Economic Analysis of off-Grid Hybrid PV-Diesel-Battery System in Katsina State, Nigeria. 2018. Available online: https://www.azojete.com.ng (accessed on 13 June 2023).
  25. Akinsipe, O.C.; Moya, D.; Kaparaju, P. Design and economic analysis of off-grid solar PV system in Jos-Nigeria. J. Clean. Prod. 2021, 287, 125055. [Google Scholar] [CrossRef]
  26. Williams, I.M. Techno-Economic Assessment of the Viability of Commercial Solar PV Systems in Port Harcourt, Nigeria. Master’s Thesis, Graduate School, Kwame Nkrumah University of Science and Technology, Kumasi, Ghana, 2021. [Google Scholar]
  27. PVsyst. PVsyst–Logiciel Photovoltaïque. 2023. Available online: https://www.pvsyst.com/ (accessed on 14 June 2023).
  28. 2019 Refinement to the 2006 IPCC Guidelines for National Greenhouse Gas Inventories—IPCC. Available online: https://www.ipcc.ch/report/2019-refinement-to-the-2006-ipcc-guidelines-for-national-greenhouse-gas-inventories/ (accessed on 14 June 2023).
  29. Buendia, E.; Tanabe, K.; Kranjc, A.; Jamsranjav, B.; Fukuda, M.; Ngarize, S.; Osako, A.; Pyrozhenko, Y.; Shermanau, P.; Federici, S. 2019 Refinement to the 2006 IPCC Guidelines for National Greenhouse Gas Inventories. Buendia, E.C.; Peru, S.G.; Tanabe, K. (Eds.) 2019. Available online: https://www.researchgate.net/publication/345842628_2019_Refinement_to_the_2006_IPCC_Guidelines_for_National_Greenhouse_Gas_Inventories (accessed on 7 May 2023).
  30. Shujauddin, S.; Uddin, M.M.M.; Uddin, S.F.; Hussaini, S.M. Designing of on-Grid Solar PV System in an Institutional Campus at Hyderabad. Int. Res. J. Eng. Technol. 2020, 7, 576–580. Available online: https://www.irjet.net (accessed on 7 May 2023).
  31. Oko, C.O.C.; Diemuodeke, E.O.; Omunakwe, N.F.; Nnamdi, E. Design and economic analysis of a photovoltaic system: A case study. Int. J. Renew. Energy Dev. 2012, 1, 65–73. [Google Scholar] [CrossRef]
  32. Ukoima, K.N.; Owolabi, A.B.; Yakub, A.O.; Same, N.N.; Suh, D.; Huh, J.-S. Analysis of a Solar Hybrid Electricity Generation System for a Rural Community in River State, Nigeria. Energies 2023, 16, 3431. [Google Scholar] [CrossRef]
  33. NASA. NASA POWER|Prediction of Worldwide Energy Resources. Available online: https://power.larc.nasa.gov/ (accessed on 7 May 2023).
  34. Behura, A.K.; Kumar, A.; Rajak, D.K.; Pruncu, C.I.; Lamberti, L. Towards better performances for a novel rooftop solar PV system. Sol. Energy 2021, 216, 518–529. [Google Scholar] [CrossRef]
  35. IRENA. Battery Storage Paves Way for a Renewable-Powered Future. Available online: https://www.irena.org/news/articles/2020/Mar/Battery-storage-paves-way-for-a-renewable-powered-future (accessed on 7 May 2023).
  36. Joseph, A.; Shahidehpour, M. Battery storage systems in electric power systems. In Proceedings of the 2006 IEEE Power Engineering Society General Meeting, Montreal, QC, Canada, 18–22 June 2006; PES, IEEE Computer Society: Washington, DC, USA, 2006. [Google Scholar] [CrossRef]
  37. Mermoud, A.; Wittmer, B. Pvsyst User’s Manual Pvsyst Sa-Route Du. 2014. Available online: https://www.pvsyst.com (accessed on 18 December 2022).
  38. HIES Renewable Energy. Solar Inverter—What It Is and How to Choose the Right One. Available online: https://www.hiesscheme.org.uk/renewable-energy/solar-inverters/ (accessed on 7 May 2023).
  39. Harrington, S. Battery Charge Controller Characteristics in Photovoltaic Systems. IEEE Aerosp. Electron. Syst. Mag. 1992, 7, 15–21. [Google Scholar] [CrossRef]
  40. Mayer’, D.; Heidenreich’, M. Performance Analysis of Stand-Alone PV Systems from a Rational Use of Energy Point of View. In Proceedings of the 3rd World Conference on Photovoltaic Energy Conversion, 2003, Osaka, Japan, 11–18 May 2003. [Google Scholar]
  41. Okoye, C.O.; Oranekwu-Okoye, B.C. Economic feasibility of solar PV system for rural electrification in Sub-Sahara Africa. In Renewable and Sustainable Energy Reviews; Elsevier Ltd.: Amsterdam, The Netherlands, 2018; Volume 82, pp. 2537–2547. [Google Scholar] [CrossRef]
  42. Khatri, R. Design and assessment of solar PV plant for girls hostel (GARGI) of MNIT University, Jaipur city: A case study. Energy Rep. 2016, 2, 89–98. [Google Scholar] [CrossRef]
  43. Yimen, N.; Tchotang, T.; Kanmogne, A.; Abdelkhalikh Idriss, I.; Musa, B.; Aliyu, A.; Okonkwo, E.C.; Abba, S.I.; Tata, D.; Meva’a, L.; et al. Optimal sizing and techno-economic analysis of hybrid renewable energy systems—A case study of a photovoltaic/wind/battery/diesel system in Fanisau, Northern Nigeria. Processes 2020, 8, 1381. [Google Scholar] [CrossRef]
  44. Olatomiwa, L.; Mekhilef, S.; Huda, A.S.N.; Ohunakin, O.S. Economic evaluation of hybrid energy systems for rural electrification in six geo-political zones of Nigeria. Rene. Energy 2015, 83, 435–446. [Google Scholar] [CrossRef]
  45. Bruce, A.; Thwaites, M.; Tuckwell, M.; Frearson, L.; Rodden, P. Cost-Benefit Assessment Framework for PV Mini-Grids PhD: Data-Driven Assessment of Aggregate Distributed Photovoltaic Generation and Its Impacts on Electricity Network Planning View Project PhD: Capability Building for the Manufacture of PV System Components in Developing Countries View Project Cost-Benefit Assessment Framework for PV Mini-Grids. 2014. Available online: https://www.researchgate.net/publication/273945854 (accessed on 25 April 2023).
  46. Alsema, E.A. Environmental Life Cycle Assessment of Solar Home Systems. 2000. Available online: http://www.chem.uu.nl/nws (accessed on 7 May 2023).
  47. Jakhrani, A.Q.; Rigit, A.R.H.; Othman, A.K.; Samo, S.R.; Skamboh, A. Estimation of carbon footprints from diesel generator emissions. In Proceedings of the 2012 International Conference in Green and Ubiquitous Technology, GUT 2012, Jakarta, Indonesia, 30 June–1 July 2012; pp. 78–81. [Google Scholar] [CrossRef]
  48. Mantrac CAT. 80 kW to 100 kW Diesel Generators C4.4|Toromont Cat Power Systems. Available online: https://www.toromontpowersystems.com/electric-power/products/diesel-generators/80-kw-to-100-kw-diesel-generators-c4.4 (accessed on 9 March 2022).
  49. Your Diesel Generator—What Does It Truly Cost Your Business?—Kpakpakpa. Available online: https://kpakpakpa.com/diesel-generator-cost-business-nigeria/ (accessed on 9 May 2023).
  50. XE. 1 USD to NGN-US Dollars to Nigerian Nairas Exchange Rate. Available online: https://www.xe.com/currencyconverter/convert/?Amount=1&From=USD&To=NGN (accessed on 9 February 2022).
  51. Diesel Generator-Energy Education. Available online: https://energyeducation.ca/encyclopedia/Diesel_generator (accessed on 7 May 2023).
  52. Gasoline and Diesel Prices by Country|GlobalPetrolPrices.com. Available online: https://www.globalpetrolprices.com/ (accessed on 7 May 2023).
  53. Jinko Tiger Neo N-Type Solar Panel 78hl4 545 w 620 620 w Wholesale Price Bifacial PV Module Rotterdam Europe WarehouseBuy Jinko Tiger Neo N-Type 54hl4 54hl4-b 78hl4 620 Bifacial Solar Panel, High Quality Tiger Neo Jinko Solar Panel, Jinko 530 w Bifacial Rotterdam Warehouse Price Product on Alibaba.com. Available online: https://www.alibaba.com/product-detail/Jinko-Tiger-Neo-N-type-Solar_1600686533834.html?spm=a2700.7735675.0.0.34b5ZryYZryY6h&s=p (accessed on 1 June 2023).
  54. Ukoima, K. Drives for Tracking the Suns’ Movement—A Review. 2019. Available online: https://www.researchgate.net/publication/335654127 (accessed on 28 July 2023).
  55. Big Capacity Battery 2 v 2000 ah 2500 ah 3000 ah Agm Sealed Lead Acid Batteries for Solar Panel-Buy 2 v 2000ah Vrla Agm Gel Lead Acid Storage Solar Battery, Maintenance Free Sealed Lead Acid 2 v 2000 ah Agm Gel Long Life Battery, Energy Storage 2 v 2000 ah Ups Long Life Agm Vrla Battery For Home Solar Power Product on Alibaba.com. Available online: https://www.alibaba.com/product-detail/Big-Capacity-Battery-2V-2000Ah-2500AH_1600750514766.html?spm=a2700.galleryofferlist.0.0.3903d9c1UeUo8i (accessed on 1 June 2023).
  56. Growatt 100 kw 200 kw 300 kw 500 kw Hybrid Solar Inverter on off Grid for Project Application-Buy 200 kw off Grid Hybrid Solar Inverter, Hybrid Solar Inverter on off 20 kw,100 kw 200 kw 300 kw 500 kw Hybrid Solar Inverter Product on Alibaba.com. Available online: https://www.alibaba.com/product-detail/Growatt-100Kw-200Kw-300Kw-500Kw-Hybrid_1600763410507.html?spm=a2700.galleryofferlist.0.0.f8aced02pJDHei (accessed on 1 June 2023).
  57. The Largest Charge Controller 50a 60a 80a 100a Mppt Solar Charge Controller With Max Input 200 v-Buy 12 v 24 v 36 v 48 v Solar Charge Controller, Mppt Solar Charge Controller, The Largest Current 50a 60a 80a 100a Solar Charge Contraller Product on Alibaba.com. Available online: https://www.alibaba.com/product-detail/The-Largest-Charge-Controller-50A-60A_1600692583784.html?spm=a2700.galleryofferlist.0.0.1f15686dR8En89&s=p (accessed on 1 June 2023).
  58. BlombergNEF. Climatescope 2022|Nigeria. 2022. Available online: https://www.global-climatescope.org/markets/ng/ (accessed on 16 July 2023).
  59. Statistical review of world energy, July 2021. British Petroleum (BP). Approximate Conversion Factors Statistical Review of World Energy. 2021. Available online: https://www.bp.com/content/dam/bp/business-sites/en/global/corporate/pdfs/energy-economics/statistical-review/bp-stats-review-2021-approximate-conversion-factors.pdf (accessed on 1 June 2023).
Figure 1. Techno-economic procedures for the solar PV system [31].
Energies 16 06803 g001
Figure 2. Peak power demand of each supermarket in PH city with the contribution of different appliances.
Energies 16 06803 g002
Figure 3. Daily hourly distribution of load defined in PVsyst.
Energies 16 06803 g003
Figure 4. Standalone PV system configuration.
Energies 16 06803 g004
Figure 5. Satellite image of Market Square in New GRA, Port Harcourt, Nigeria.
Energies 16 06803 g005
Figure 6. (Top) PVsyst Simulation Results (Bottom) Nominalized Production and Systems Losses from PVsyst [26].
Energies 16 06803 g006
Figure 7. Percentage difference between the baseline result over the sensitivity analysis parameters.
Energies 16 06803 g007
Figure 8. Effect of O&M on the System’s LCOE.
Energies 16 06803 g008
Figure 9. Solar PV system PVsyst output parameters: (a) array power distribution, (b) daily array output energy, (c) array temperature vs. effective irradiance [26].
Energies 16 06803 g009aEnergies 16 06803 g009b
Table 1. Power ratings of the supermarkets in PH City.
Appliance CategoryNext Time SupermarketChanrais SupermarketWelcome You SupermarketLivinchin SupermarketMarket SquareEveryday SupermarketNextime Supermarket
Refrigeration (W)25,65023,05025,45018,02527,05035,42526,800
Lighting (W)3520480067207200496060368000
Air Conditioning (W)12,00091434644550022,50078159800
Cooking (W)1782178217821782178217821782
Water Heating (W)1100110011001100110011001100
ICT (W)2016217446441816237430324290
Total (kW)46.142.144.335.459.855.250.1
Table 2. Electrical load of Market Square Supermarket.
ApplianceRating (W)QuantityTotal Power Rating (kW)Daily Usage (h/day)Energy (E) (kWh/day)
Refrigeration—back freezer112522.252454.0
Refrigeration—back cooler110022.202452.8
Refrigeration—store freezer closed110088.80235.2
Refrigeration—store freezer open130033.90215.6
Refrigeration—store cooler closed110099.90239.6
Lighting—Fluorescent321554.961259.8
Air Conditioning22,500 22,50012270
Cooking machine1782 1.7823.6
Water Heater1100 1.1022.2
ICT—ATM Machine70010.70128.4
ICT—Computer, Printer15830.47125.7
ICT—Register20061.201214.4
TOTAL 59.8 561
Table 3. Daily User’s needs are defined in PVsyst.
Daily Household Consumption, Constant over the Year, Average = 561 kWh/day
Annual Values
QuantityPower (W)Use (hr/day)Energy (Wh/day)
Lamps (LED or flu)15532/lamp1259,520
ICT3080/app1228,800
Coolers Open/Closed201130/app245,200
Fridge/Deep-freeze2 24151,699
Air Conditioning122,500 tot12270,000
Water Heating/Cooking12882 tot25764
Standby-by consumers 2424
Total daily energy 561,007
Table 4. PVsyst average monthly solar irradiance and temperature of PH city from PVsyst.
MonthGlobal Irradiance-Hc (kWh/m2/day)Temperature
(°C)
January5.2025.7
February5.2426.0
March4.8026.1
April4.6026.2
May4.2326.0
June3.5425.3
July3.2424.6
August 3.4224.3
September3.4324.5
October 3.6824.8
November4.2125.1
December4.9525.4
Average4.2125.3
Table 5. Characteristics of the diesel generator.
ParametersValueUnitComment/Reference
Capacity Rating100kWMantrac CAT
Nameplate Efficiency30%Mantrac CAT
Lifetime5Year’sMantrac CAT
Heating Rate10,285.7KJ/kWhMantrac CAT
Diesel Fuel Cost0.673$/LitrePowerGen Eng.
Diesel Fuel Consumption Rate0.4Liter/kWhPowerGen Eng.
Daily Energy Demand561kWh/dayTED
Table 6. Operation and Maintenance Cost for Diesel Generator.
MaintenanceIntervals (h)Cost-$Number of Times/YearsTotal Cost/Year-$
Short Service250100363600
OperationalDiesel Cost ($/Liter)Diesel/DayDays/YearDiesel Cost/Year-$
0.673222.436555,123
Table 7. Panel Characteristics (Jinko JKM 585M-7RL4-V).
CharacteristicsValueUnit
STC * Power Rating585Watt peak (Wp)
Maximum Current (Imp)13.23Ampere (A)
Maximum Voltage (Vmp)44.22Voltage (V)
Short Circuit Current (Isc)13.91Ampere (A)
Open Circuit Voltage (Voc)53.42Voltage (V)
Module NOCT *45Degree Celsius
Temperature Coefficient of Power−0.344%/Degree Celsius
Temperature Coefficient of Voc−0.28%/Degree Celsius
Efficiency21.4%
* STC is for standard test conditions, and * NOCT is the nominal operating cell temperature.
Table 8. Solar PV system design.
ParameterValueUnitRemarks/Reference
Load ProfileDaily Energy Demand561kWh ***/dayMinimum daily energy required at the supermarket
PV ArrayPV capacity231kWCalculated capacity
PV lifetime25Year’sTypical PV system lifecycle
Array TypeRoof Mountn/aAuthors assumption
Array Tilt Angle5DegreeLatitude at the site
OrientationDue Southn/aThe site is in the northern hemisphere
Charge Controller (MPPT)Nominal power294.4kWUniversal MPPT 60 V controller
Maximum discharge current3089ACurrent from the module at STC
Array Voltage679V *Maximum array voltage
3-Phase Hybrid InverterRated Power80kW1.25% of the system-rated power
Inverter efficiency99%PVsyst
Battery SystemBattery typeLead acidn/aPVsyst
System Voltage60VPVsyst and Calculation
Nominal voltage2VVoltage of a single battery
Battery capacity34,021Ah **Required battery size
Battery Efficiency85%PVsyst
DOD80%PVsyst
DA1DayAuthors assumption
Battery life Output33,000 × 0.8 × 1500AhPVsyst and Calculation
** Ah Ampere hour, * V means voltage, and *** kW means kilowatt-hour.
Table 9. PVsyst General Parameters.
General Parameters
Standalone system with batteries
Standalone system Shed configurationModels used
PV Field Orientation No 3D scene definedTranspositionPerez
Fixed plane DiffusePerez_Meteonorm
Tilt/Azimuth5/0° Circumsolarseparate
User’s needs
Daily household consumers
Constant over the year
Average561 kWh/Day
Table 10. PVsyst PV Array Characteristics.
PV Array Characteristics
PV Module Battery
ManufacturerGenericManufacturerGeneric
ModelJKL585M-7RL4-VModelEosG 3000
(Original PVsyst database) TechnologyLead-acid, sealed, Gel
Unit Nom. Power585 WpNb. Of units11 in parallel × 30 in series
Number of PV modules396 unitsDischarging min. SOC20.00%
Nominal (STC)232 kWStored energy1587.8 kWh
Modules33 strings × 12 in seriesBattery Pack Characteristics
At operating cond. (50 °C) Voltage60 V
Pmpp211 kWpNominal Capacity33,000 Ah (C10)
Vmpp483 VTemperatureFixed 20 °C
Impp437 A
Controller Battery Management Control
Universal controller Threshold commands asSOC calculation
TechnologyMPPT converterChargingSOC = 0.92/0.75
Temp coeff.−5.0 mV/°C/Elem.approx. 68.5/62.7 V
Converter DischargingSOC = 0.20/0.45
Maxi and EURO efficiencies97.0/95.0%approx. 58.9/61.1 V
Total PV power
Nominal (STC)232 kWp
Total 396 units
Module area1083 m3
Table 11. Existing system input parameters (100-kW Diesel Generator).
ParametersValuesUnitsComments
Generator (Gen) cost53,000$/UnitMantrac CAT/Nigerian Market
Discount rate11.5%Central Bank of Nigeria rates
Tariff rate0.2692$At the rate of 0.4 L/kWh
Installation Cost10%10% of the cost of the generator
O&M * cost10%10% of the total initial investment
Gen Repl. cost58,300$/UnitCost of generator and installation
* O&M is operation and maintenance, Repl. is a replacement, $ for USD. Instead of a significant overhaul, the analysis anticipated replacing the diesel generator after 35,000 h or five (5) years, whichever comes first.
Table 12. Proposed solar PV input parameters.
ParametersValuesUnitsComments
Discount rate11.5%Central Bank of Nigeria rate
Tariff rate0.094$Grid Tariff in Nigeria
Panel cost105.3* $/UnitAlibaba [53]
Battery cost300$/UnitAlibaba [55]
Inverter cost6985$/UnitAlibaba [56]
Charge Controller Cost202$/UnitAlibaba [57]
Installation Cost10%10% of the total PV cost (Assumption)
O&M cost5%5% of the total initial investment cost
* $ for USD, O&M is operations and maintenance. Wp is watt peak, Amp is ampere, kW is kilowatt, and kWh is kilowatt hour. The inverter and batteries are assumed to be replaced after 15 years.
Table 13. PVsyst Simulation Result.
MonthE_Available (kWh)E_User (kWh)E_Unused (kWh)E_Losses (kWh)E_Missing (kWh)Instant Energy from Battery to User (kWh)Instant Energy from PV to User (kWh)
January33,85217,39114,8841577010,1727219
February30,23315,70813,820705095136195
March29,99517,39112,434170010,0847307
April27,24916,83090471372086268204
May25,51617,3917697428086918700
June20,37116,8303210331080258805
July19,27417,3912549666081599232
August20,71416,4662049127492571329334
September20,31815,4574226739137475937864
October22,74417,3914887466083489043
November25,95516,8308688437089677863
December32,51717,39113,8901236010,5226869
Year (kWh/yr)308,738202,46797,38165912299105,78996,678
E_Available stands for available solar energy, E_User stands for energy supplied to the user, E_Unused stands for unused energy (battery full), E_Loss stands for PV-array, system, and battery losses, E_Missing stands for the energy required by the user, but not unavailable, Instant battery Output to User is the instantaneous monthly energy coming direct from the battery to the user, Instant PV Output to User is the instantaneous monthly energy directly from the PV to the user.
Table 14. Baseline and Sensitivity Analysis Results Comparison.
Parameter/VariableBaselineOptimizedUnit
Sh3.214.21h
PV Capacity231178kW
Total Panel395304-
User Energy Need204,765204,765kWh/year
Available Energy308,736241,630kWh/year
Useful Energy202,467196,780kWh/year
Excess Energy97,35537,436kWh/year
Missing Energy22997987kWh/year
Performance Ratio5670%
Solar Fraction9996%
Table 15. Economic assessment results.
SystemsInitial Investment
Cost
$USD
Net Present Value (NPV)
$USD
Life Cycle Cost (LCC)
$USD
Levelized Cost of Electricity (LCOE) $USD/kWhSimple Payback Time (SPBT)
Years
Internal Rate of Return (IRR)
%
Diesel Generation64,130−217,205599,7940.36--
Proposed solar PV152,864165,322266,9360.14420.5
Disclaimer/Publisher’s Note: The statements, opinions and data contained in all publications are solely those of the individual author(s) and contributor(s) and not of MDPI and/or the editor(s). MDPI and/or the editor(s) disclaim responsibility for any injury to people or property resulting from any ideas, methods, instructions or products referred to in the content.

