
Business Model Selection for Community Energy Storage: A Multi Criteria Decision Making Approach

 ,
,  ,
,  and
and
Abstract
:1. Introduction
1.1. Background and Motivation for the Study
1.2. Research Questions and Objectives
1.3. Contributions
1.4. Organization
2. Literature Review
2.1. Overview of Community Energy Storage and Business Models
- Energy Arbitrage (EA) model
- Energy Arbitrage Peak Shaving (EA-PS)
- Emission Reduction and VAr Support
- Cost Optimization and energy loss reduction model
- Aggregated Energy Services model
- Demand Load Shifting Service: By storing excess energy during low-demand periods and supplying it during peak hours, CES can help manage electricity demand and reduce reliance on the grid (wherever applicable). This business model can be based on a time-of-use tariff or real-time pricing tariff, where the CES system optimizes energy usage based on wholesale electricity prices.
- CES as a Service (CeaaS): Adopting a service-oriented business model, CES providers can offer CES as a service to communities and utilities. They can own, operate, and maintain the CES systems on behalf of the community or utility, charging a subscription or usage-based fee. This model allows communities to benefit from CES without the upfront capital investment or operational responsibilities.
- Digitally Enabled Flexibility Services: This is developed to respond to extremely low levels of demand on the network, especially in severe weather conditions where both supply and demand are low. In principle, this service could be delivered by both community-scale wind and solar farms. Key components of these services may include monitoring and control systems, energy storage, RES, smart grid technologies, demand response via IoT, and smart appliances.
- Vehicle–to–(micro)grid (VTMG) model
- Community Cooperative Model
2.2. Existing Approaches to Business Model Selection
- Market Analysis: Conducting a comprehensive analysis of the relevant market to identify potential opportunities, gaps, and challenges for energy storage. This includes assessing regulatory frameworks, market structures, pricing mechanisms, and competitive landscape.
- Cost–Benefit Analysis: Evaluating the costs and benefits associated with different business models. This analysis considers factors such as capital investment, operational costs, revenue streams, savings from grid services, and potential revenue stacking opportunities.
- Techno-Economic Analysis: Assessing the technical feasibility and economic viability of various technologies and their compatibility with specific business models. For energy storage, this analysis may consider factors such as energy storage capacity, efficiency, lifespan, scalability, and integration with renewable energy sources.
- Risk Assessment: Identifying and evaluating risks associated with different business models, including market risks, regulatory risks, technological risks, financial risks, and operational risks. Understanding these risks helps in selecting business models that mitigate or manage them effectively.
- Stakeholder Engagement: Engaging with relevant stakeholders, including energy providers, consumers, policymakers, and industry experts, to gather insights and perspectives on potential business models. This involvement ensures alignment with market needs and regulatory requirements.
- Pilots and Demonstrations: Implementing pilot projects or demonstrations to test and validate the feasibility and effectiveness of specific business models. This approach provides real-world data and feedback to refine and optimize the chosen business model.
- Collaboration and Partnerships: Exploring collaborations and partnerships with other entities in the energy ecosystem, such as utilities, renewable energy developers, technology providers, and financing institutions. Collaborative approaches can leverage synergies, share risks and rewards, and create innovative business models.
3. Methodology
3.1. Overview of the Proposed MCDM Strategy
3.2. Description of Criteria Used for Evaluating Business Models
3.3. Data Collection and Analysis Methods
- Step 1:
- Step 2:
- Step 3:
- Step 4:
- Step 5:
- Step 6:
- Step 7:
- Step 8:
- Step 9:
- Step 10:
- Step 11:
- Step 12:
4. Case Studies
4.1. Description of the Local Energy System and Business Models in the Case Study
4.1.1. Case Study I: Gaidouromantra, Kythnos Island, Greece [55,56]
- 11.145 kW of solar PV panels: 6 solar PV plants (rooftop and ground-mounted).
- System house: 1.920 kWp connected to 3 inverters is the center of the microgrid for housing the energy storage battery, the diesel generator, grid inverters, and communication equipment for monitoring.
- A Lead-Acid battery bank with a nominal capacity of 1000 Ah/11,900 Wh/48 V, connected through 3 single-phase battery inverters. During the daytime, the battery bank is connected to the AC, while at night, it is disconnected, and a secondary system covers the control and monitoring equipment needs.
- One new battery system with a capacity storage of 96 kWh Valve Regulated Tubular Plate GEL Batteries (only when there is no solar PV production, and the batteries are deeply discharged).
- 3-phase microgrid composed of overhead power lines and a communication cable running parallel.
- A 3-phase diesel generator of 22 kVA.
4.1.2. Case Study II: Ghoramara Island, West Bengal, India [55,56]
- The utility grid is not available on the island with no future scope.
- A 3 kW wind turbine was installed near the school, but the system was damaged during a cyclone and is inoperative.
- Discrete solar panels are installed on the rooftops of individual houses and shops used for mobile charging and glowing LED lamps (one/two in number).
- Around 100 streetlights with solar panels were also found inoperative.
- Six e-rickshaws are currently running on the island, and charging is performed through a diesel generator.
- The following components are planned for the proposed solar wind microgrid:
- AC microgrid #1: 150 kW capacity (240 kW PV + 5 kW Wind turbine (02)).
- AC microgrid #2 for testing of eco-toolsets 20 kW capacity (17.5 kW PV + 2.5 kW Wind turbine).
- Load flow controller, power conditioner, converters, battery energy storage system, load limiter, charging facility (12.5 kW approximately, with 5 ports and one advanced charger).
- Electric three-wheelers (02) and one electric boat with the capacity to carry 15 passengers.
- Dimmable streetlights (05), stand-alone high-mast, distribution infrastructure.
- Cyclone-resilient structure for solar and wind turbine.
- Remote monitoring system.
4.2. Regulatory Background
4.2.1. Europe
- Greece:
- By the year 2030, the proportion of renewable energy in the overall final energy consumption is targeted to be no less than 35%.
- The share of renewable electricity in the total gross final electricity consumption is aimed to reach a minimum of 60% by 2030.
- To fulfill the energy needs for heating and cooling, it is intended that renewable energy’s contribution exceeds 40% of the final energy consumption by 2030.
- In the domain of transportation, the aspiration is for renewable energy to constitute more than 14% of the total energy consumption within the transportation sector by 2030.
- A significant reduction of greenhouse gas emissions by either 40% in comparison to 1990 levels or 55% relative to the levels recorded in 2005 is sought to be achieved by 2030.
4.2.2. India
- West Bengal:
4.3. Application of the Proposed Methodology
4.4. Results of the Analysis
4.5. Sensitivity Analysis
4.6. Comparison with Fuzzy TOPSIS
5. Discussion
- Technology Selection Complexity: As mentioned earlier, choosing the right CES technology can be a daunting task. Different technologies offer varying benefits and drawbacks, and the optimal choice depends on the specific goals of the local energy initiative.
- Cost: CES technologies often come with significant upfront costs, which can be a barrier for local communities with limited budgets. The cost of CES systems, including installation and maintenance, must be carefully weighed against the expected benefits and savings in energy costs.
- Regulatory and Policy Frameworks: The regulatory environment can significantly impact the feasibility and attractiveness of CES projects. Local energy initiatives may face challenges related to grid integration, permission, and compliance with local and national energy policies. Clear and supportive regulatory frameworks are essential for the successful implementation of CES projects.
- Community Engagement: Engaging and educating the local community is crucial for the success of CES initiatives.
- Interconnection Challenges: CES systems need to be seamlessly integrated into the local energy grid. Compatibility issues, grid capacity limitations, and technical challenges may arise when connecting CES to the existing infrastructure. Coordination with utility companies and grid operators is essential.
- Funding and Financing: Securing funding for CES projects can be challenging. Communities may explore various financing options, including grants, loans, public–private partnerships, or community-based fundraising.
6. Conclusions
Author Contributions
Funding
Data Availability Statement
Conflicts of Interest
Appendix A

| C1 | C2 | C3 | C4 | |
|---|---|---|---|---|
| P (A1A2) | (0.0207, 0.0350, 0.0363, 0.0518) | (0.0, 0.0, 0.0, 0.0) | (0.0700, 0.0825, 0.0850, 0.1000) | (0.0192, 0.0276, 0.0276, 0.0431) |
| P (A1A3) | (0.0525, 0.0890, 0.0919, 0.1312) | (0.1265, 0.2056, 0.2056, 0.2846) | (0.2249, 0.2650, 0.2731, 0.3213) | (0.0, 0.0, 0.0, 0.0) |
| P (A1A4) | (0.0938, 0.1580, 0.1641, 0.2344) | (0.1460, 0.2373, 0.2373, 0.3285) | (0.1369, 0.1614, 0.1663, 0.1956) | (0.0369, 0.0531, 0.0531, 0.0831) |
| P (A1A5) | (0.1545, 0.2610, 0.2704, 0.3863) | (0.0555, 0.0902, 0.0902, 0.1249) | (0.0875, 0.1031, 0.1063, 0.1250) | (0.0192, 0.0276, 0.0276, 0.0431) |
| P (A1A6) | (0.1340, 0.2260, 0.2345, 0.3350) | (0.1140, 0.1853, 0.1853, 0.2565) | (0.0700, 0.0825, 0.0850, 0.1000) | (0.0383, 0.0551, 0.0551, 0.0863) |
| P (A2A1) | (0.0, 0.0, 0.0, 0.0) | (0.0, 0.0, 0.0, 0.0) | (0.0, 0.0, 0.0, 0.0) | (0.0, 0.0, 0.0, 0.0) |
| P (A2A3) | (0.1100, 0.1856, 0.1925, 0.2750) | (0.1265, 0.2056, 0.2056, 0.2846) | (0.2516, 0.2965, 0.3055, 0.3594) | (0.0192, 0.0276, 0.0276, 0.0431) |
| P (A2A4) | (0.1145, 0.1930, 0.2004, 0.2863) | (0.1460, 0.2373, 0.2373, 0.3285) | (0.1636, 0.1928, 0.1987, 0.2338) | (0.0242, 0.347, 0.0347, 0.0544) |
| P (A2A5) | (0.1753, 0.2960, 0.3067, 0.4381) | (0.0555, 0.0902, 0.0902, 0.1249) | (0.1142, 0.1346, 0.1387, 0.1631) | (0.0, 0.0, 0.0, 0.0) |
| P (A2A6) | (0.1548, 0.2610, 0.2708, 0.3869) | (0.1140, 0.1853, 0.1853, 0.2565) | (0.0, 0.0, 0.0, 0.0) | (0.0192, 0.0276, 0.0276, 0.0431) |
| P (A3A1) | (0.0, 0.0, 0.0, 0.0) | (0.0, 0.0, 0.0, 0.0) | (0.0, 0.0, 0.0, 0.0) | (0.0, 0.0, 0.0, 0.0) |
| P (A3A2) | (0.0, 0.0, 0.0, 0.0) | (0.0, 0.0, 0.0, 0.0) | (0.0, 0.0, 0.0, 0.0) | (0.0, 0.0, 0.0, 0.0) |
| P (A3A4) | (0.0413, 0.0696, 0.0722, 0.1031) | (0.0195, 0.0317, 0.0317, 0.0439) | (0.0879, 0.1036, 0.1068, 0.1256) | (0.0369, 0.0531, 0.0531, 0.0831) |
| P (A3A5) | (0.1020, 0.1720, 0.1785, 0.2550) | (0.0710, 0.1154, 0.1154, 0.1598) | (0.1374, 0.1619, 0.1668, 0.1963) | (0.0192, 0.0276, 0.0276, 0.0431) |
| P (A3A6) | (0.0815, 0.1380, 0.1426, 0.2038) | (0.0320, 0.0520, 0.0520, 0.0720) | (0.2516, 0.2965, 0.3055, 0.3594) | (0.0383, 0.0551, 0.0551, 0.0863) |
| P (A4A1) | (0.0, 0.0, 0.0, 0.0) | (0.0, 0.0, 0.0, 0.0) | (0.0, 0.0, 0.0, 0.0) | (0.0, 0.0, 0.0, 0.0) |
| P (A4A2) | (0.0, 0.0, 0.0, 0.0) | (0.0, 0.0, 0.0, 0.0) | (0.0, 0.0, 0.0, 0.0) | (0.0, 0.0, 0.0, 0.0) |
| P (A4A3) | (0.0, 0.0, 0.0, 0.0) | (0.0, 0.0, 0.0, 0.0) | (0.0, 0.0, 0.0, 0.0) | (0.0, 0.0, 0.0, 0.0) |
| P (A4A5) | (0.0608, 0.1030, 0.1063, 0.1519) | (0.0905, 0.1471, 0.1471, 0.2036) | (0.0639, 0.0753, 0.0776, 0.0913) | (0.0242, 0.0347, 0.0347, 0.0544) |
| P (A4A6) | (0.0470, 0.0790, 0.0823, 0.1175) | (0.0385, 0.0626, 0.0626, 0.0866) | (0.1636, 0.1928, 0.1987, 0.2338) | (0.0192, 0.0276, 0.0276, 0.0431) |
| P (A5A1) | (0.0, 0.0, 0.0, 0.0) | (0.0, 0.0, 0.0, 0.0) | (0.0, 0.0, 0.0, 0.0) | (0.0, 0.0, 0.0, 0.0) |
| P (A5A2) | (0.0, 0.0, 0.0, 0.0) | (0.0, 0.0, 0.0, 0.0) | (0.0, 0.0, 0.0, 0.0) | (0.0, 0.0, 0.0, 0.0) |
| P (A5A3) | (0.0, 0.0, 0.0, 0.0) | (0.0, 0.0, 0.0, 0.0) | (0.0, 0.0, 0.0, 0.0) | (0.0, 0.0, 0.0, 0.0) |
| P (A5A4) | (0.0, 0.0, 0.0, 0.0) | (0.0, 0.0, 0.0, 0.0) | (0.0, 0.0, 0.0, 0.0) | (0.0, 0.0, 0.0, 0.0) |
| P (A5A6) | (0.0205, 0.0346, 0.0359, 0.0513) | (0.0585, 0.0951, 0.0951, 0.1316) | (0.1142, 0.1346, 0.1387, 0.1631) | (0.0192, 0.0276, 0.0276, 0.0431) |
| P (A6A1) | (0.0, 0.0, 0.0, 0.0) | (0.0, 0.0, 0.0, 0.0) | (0.0, 0.0, 0.0, 0.0) | (0.0, 0.0, 0.0, 0.0) |
| P (A6A2) | (0.0, 0.0, 0.0, 0.0) | (0.0, 0.0, 0.0, 0.0) | (0.0, 0.0, 0.0, 0.0) | (0.0, 0.0, 0.0, 0.0) |
| P (A6A3) | (0.0, 0.0, 0.0, 0.0) | (0.0, 0.0, 0.0, 0.0) | (0.0, 0.0, 0.0, 0.0) | (0.0, 0.0, 0.0, 0.0) |
| P (A6A4) | (0.0, 0.0, 0.0, 0.0) | (0.0, 0.0, 0.0, 0.0) | (0.0, 0.0, 0.0, 0.0) | (0.0, 0.0, 0.0, 0.0) |
| P (A6A5) | (0.0, 0.0, 0.0, 0.0) | (0.0, 0.0, 0.0, 0.0) | (0.0, 0.0, 0.0, 0.0) | (0.0, 0.0, 0.0, 0.0) |
| C1 | C2 | C3 | C4 | |
|---|---|---|---|---|
| P (A1A2) | (0.1395, 0.2616, 0.2703, 0.3488) | (0.0, 0.0, 0.0, 0.0) | (0.1700, 0.2635, 0.2805, 0.3400) | (0.2074, 0.2444, 0.2518, 0.2963) |
| P (A1A3) | (0.1623, 0.3042, 0.3144, 0.4056) | (0.0423, 0.0634, 0.0660, 0.0951) | (0.0850, 0.1318, 0.1403, 0.1700) | (0.2074, 0.2444, 0.2518, 0.2963) |
| P (A1A4) | (0.1395, 0.2616, 0.2703, 0.3488 | (0.0528, 0.0791, 0.0824, 0.1187) | (0.0897, 0.1390, 0.1480, 0.1794) | (0.2074, 0.2444, 0.2518, 0.2963) |
| P (A1A5) | (0.2713, 0.5086, 0.5255, 0.6781) | (0.0528, 0.0791, 0.0824, 0.1187) | (0.0303, 0.0470, 0.0500, 0.0) | (0.0, 0.0, 0.0, 0.0) |
| P (A1A6) | (0.0707, 0.1327, 0.1371, 0.1769) | (0.0423, 0.0634, 0.0660, 0.0951) | (0.0297, 0.0460, 0.0490, 0.0594) | (0.0639, 0.0753, 0.0776, 0.0913) |
| P (A1A7) | (0.1168, 0.2189, 0.2262, 0.2919) | (0.0728, 0.1091, 0.1137, 0.1637) | (0.3050, 0.4728, 0.5033, 0.6100) | (0.1142, 0.1346, 0.1387, 0.1631) |
| P (A2A1) | (0.0, 0.0, 0.0, 0.0) | (0.0, 0.0, 0.0, 0.0) | (0.0, 0.0, 0.0, 0.0) | (0.0, 0.0, 0.0, 0.0) |
| P (A2A3) | (0.0228, 0.0427, 0.0441, 0.0569) | (0.0423, 0.0634, 0.0660, 0.0951) | (0.1100, 0.1705, 0.1815, 0.2200) | (0.0, 0.0, 0.0, 0.0) |
| P (A2A4) | (0.0, 0.0, 0.0, 0.0) | (0.0528, 0.0791, 0.0824, 0.1187) | (0.0803, 0.1245, 0.1325, 0.1606) | (0.0, 0.0, 0.0, 0.0) |
| P (A2A5) | (0.1318, 0.2470, 0.2553, 0.3294) | (0.0528, 0.0791, 0.0824, 0.1187) | (0.1397, 0.2165, 0.2305, 0.2794) | (0.2074, 0.2444, 0.2518, 0.2963) |
| P (A2A6) | (0.0688, 0.1289, 0.1332, 0.1719) | (0.0423, 0.0634, 0.0660, 0.0951) | (0.1403, 0.2175, 0.2315, 0.2806) | (0.1579, 0.1861, 0.1918, 0.2256) |
| P (A2A7) | (0.0228, 0.0427, 0.0441, 0.0569) | (0.0728, 0.1091, 0.1137, 0.1637) | (0.1350, 0.2093, 0.2228, 0.2700) | (0.0932, 0.1098, 0.1132, 0.1331) |
| P (A3A1) | (0.0, 0.0, 0.0, 0.0) | (0.0060, 0.0090, 0.0094, 0.0135) | (0.0, 0.0, 0.0, 0.0) | (0.0, 0.0, 0.0, 0.0) |
| P (A3A2) | (0.0, 0.0, 0.0, 0.0) | (0.0060, 0.0090, 0.0094, 0.0135) | (0.0, 0.0, 0.0, 0.0) | (0.0, 0.0, 0.0, 0.0) |
| P (A3A4) | (0.0228, 0.0427, 0.0441, 0.0569) | (0.0524, 0.0786, 0.0819, 0.1179) | (0.0297, 0.0460, 0.0490, 0.0594) | (0.0, 0.0, 0.0, 0.0) |
| P (A3A5) | (0.1090, 0.2044, 0.2112, 0.2725) | (0.0525, 0.0787, 0.0820, 0.1181) | (0.0547, 0.0848, 0.0902, 0.1094) | (0.2074, 0.2444, 0.2518, 0.2963) |
| P (A3A6) | (0.0915, 0.1716, 0.1773, 0.2288) | (0.0, 0.0, 0.0, 0.0) | (0.0553, 0.0857, 0.0913, 0.1106) | (0.1579, 0.1861, 0.1918, 0.2256) |
| P (A3A7) | (0.0455, 0.0853, 0.0882, 0.1138) | (0.0365, 0.0548, 0.0570, 0.0821) | (0.2200, 0.3410, 0.3630, 0.4400) | (0.0932, 0.1098, 0.1132, 0.1331) |
| P (A4A1) | (0.0, 0.0, 0.0, 0.0) | (0.0, 0.0, 0.0, 0.0) | (0.0, 0.0, 0.0, 0.0) | (0.0, 0.0, 0.0, 0.0) |
| P (A4A2) | (0.0, 0.0, 0.0, 0.0) | (0.0, 0.0, 0.0, 0.0) | (0.0, 0.0, 0.0, 0.0) | (0.0, 0.0, 0.0, 0.0) |
| P (A4A3) | (0.0, 0.0, 0.0, 0.0) | (0.0360, 0.0540, 0.0563, 0.0810) | (0.0, 0.0, 0.0, 0.0) | (0.0, 0.0, 0.0, 0.0) |
| P (A4A5) | (0.1318, 0.2470, 0.2553, 0.3294) | (0.0, 0.0, 0.0, 0.0) | (0.0594, 0.0920, 0.0980, 0.1188) | (0.2074, 0.2444, 0.2518, 0.2963) |
| P (A4A6) | (0.0688, 0.1289, 0.1332, 0.1719) | (0.0525, 0.0787, 0.0820, 0.1181) | (0.0600, 0.0930, 0.0990, 0.1200) | (0.1579, 0.1861, 0.1918, 0.2256) |
| P (A4A7) | (0.0228, 0.0427, 0.0441, 0.0569) | (0.0360, 0.0540, 0.0563, 0.0810) | (0.2153, 0.3337, 0.3553, 0.4306) | (0.0932, 0.1098, 0.1132, 0.1331) |
| P (A5A1) | (0.0, 0.0, 0.0, 0.0) | (0.0, 0.0, 0.0, 0.0) | (0.0, 0.0, 0.0, 0.0) | (0.0, 0.0, 0.0, 0.0) |
| P (A5A2) | (0.0, 0.0, 0.0, 0.0) | (0.0, 0.0, 0.0, 0.0) | (0.0, 0.0, 0.0, 0.0) | (0.0, 0.0, 0.0, 0.0) |
| P (A5A3) | (0.0, 0.0, 0.0, 0.0) | (0.0360, 0.0540, 0.0563, 0.0810) | (0.0, 0.0, 0.0, 0.0) | (0.0, 0.0, 0.0, 0.0) |
| P (A5A4) | (0.0, 0.0, 0.0, 0.0) | (0.0, 0.0, 0.0, 0.0) | (0.0, 0.0, 0.0, 0.0) | (0.0, 0.0, 0.0, 0.0) |
| P (A5A6) | (0.2005, 0.3759, 0.3885, 0.5013) | (0.0525, 0.0787, 0.0820, 0.1181) | (0.0103, 0.0160, 0.0170, 0.0206) | (0.0639, 0.0753, 0.0776, 0.0913) |
| P (A5A7) | (0.1545, 0.2897, 0.2993, 0.3863) | (0.0360, 0.0540, 0.0563, 0.0810) | (0.2747, 0.4258, 0.4532, 0.5494) | (0.1142, 0.1346, 0.1387, 0.1631) |
| P (A6A1) | (0.0, 0.0, 0.0, 0.0) | (0.0060, 0.0090, 0.0094, 0.0135) | (0.0, 0.0, 0.0, 0.0) | (0.0144, 0.0170, 0.0175, 0.0206) |
| P (A6A2) | (0.0, 0.0, 0.0, 0.0) | (0.0060, 0.0090, 0.0094, 0.0135) | (0.0, 0.0, 0.0, 0.0) | (0.0, 0.0, 0.0, 0.0) |
| P (A6A3) | (0.0, 0.0, 0.0, 0.0) | (0.0, 0.0, 0.0, 0.0) | (0.0, 0.0, 0.0, 0.0) | (0.0, 0.0, 0.0, 0.0) |
| P (A6A4) | (0.0, 0.0, 0.0, 0.0) | (0.0360, 0.0540, 0.0563, 0.0810) | (0.0, 0.0, 0.0, 0.0) | (0.0, 0.0, 0.0, 0.0) |
| P (A6A5) | (0.0, 0.0, 0.0, 0.0) | (0.0360, 0.0540, 0.0563, 0.0810) | (0.0097, 0.0150, 0.0160, 0.0194) | (0.0144, 0.0170, 0.0175, 0.0206) |
| P (A6A7) | (0.0460, 0.0863, 0.0891, 0.1150) | (0.0365, 0.0548, 0.0570, 0.0821) | (0.2753, 0.4267, 0.4543, 0.5506) | (0.1138, 0.1341, 0.1381, 0.1625) |
| P (A7A1) | (0.0, 0.0, 0.0, 0.0) | (0.0, 0.0, 0.0, 0.0) | (0.0, 0.0, 0.0, 0.0) | (0.0, 0.0, 0.0, 0.0) |
| P (A7A2) | (0.0, 0.0, 0.0, 0.0) | (0.0, 0.0, 0.0, 0.0) | (0.0, 0.0, 0.0, 0.0) | (0.0, 0.0, 0.0, 0.0) |
| P (A7A3) | (0.0, 0.0, 0.0, 0.0) | (0.0, 0.0, 0.0, 0.0) | (0.0, 0.0, 0.0, 0.0) | (0.0, 0.0, 0.0, 0.0) |
| P (A7A4) | (0.0, 0.0, 0.0, 0.0) | (0.0160, 0.0240, 0.0250, 0.0360) | (0.0, 0.0, 0.0, 0.0) | (0.0, 0.0, 0.0, 0.0) |
| P (A7A5) | (0.0, 0.0, 0.0, 0.0) | (0.0160, 0.0240, 0.0250, 0.0360) | (0.0, 0.0, 0.0, 0.0) | (0.0, 0.0, 0.0, 0.0) |
| P (A7A6) | (0.0, 0.0, 0.0, 0.0) | (0.0, 0.0, 0.0, 0.0) | (0.0, 0.0, 0.0, 0.0) | (0.0490, 0.0578, 0.0595, 0.0700) |
| Gaidouromantra Microgrid | C1 | C2 | C3 | C4 |
|---|---|---|---|---|
| Most Preferred | A1 [A1 > A2 > A3 > A4 > A5 > A6] | A1 [A1 > A2 > A3 > A4 > A5 > A6] | A1 [A1 > A2 > A3 > A4 > A5 > A6] | A1, A2 [A1 = A2 > A3 > A4 > A5 > A6] [A2 = A1 = A3 > A4 > A5 > A6] |
| More Preferred | A2, A5 [A2 > A3 > A4 > A5] [A5 > A3 > A4 > A6] | A2, A3 [A2 > A3 > A4 > A5 > A6] [A3 > A4 > A5 > A6] | A2, A3 [A2 > A3 > A4 > A5 > A6] [A3 > A4 > A5 > A6] | A3, A4 [A3 > A4 > A5 > A6] [A4 > A5 > A6] |
| Less Preferred | A6 [A6 > A2 > A4] | A4, A5 [A4 > A5 > A6] [A5 > A6] | A4, A5 [A4 > A5 > A6] [A5 > A6] | A5 [A5 > A6] |
| Least Preferred | A3, A4 [A3 = A4] [A4 = A3] | A6 [Not Preferred] | A6 [Not Preferred] | A6 [Not Preferred] |
| Ghoramara island | C1 | C2 | C3 | C4 |
| Most Preferred | A1 [A1 > A2 > A3 > A4 > A5 > A6 > A7] | A1 [A1 = A2 > A3 > A4 > A5 > A6 > A7] | A1 [A1 > A2 > A3 > A4 > A5 > A6 > A7] | A1 [A1 > A2 > A3 > A4 = A5 > A6 > A7] |
| More Preferred | A2, A3 [A2 > A3 = A4 > A5 > A6 > A7] [A3 > A4 > A5 > A6 > A7] | A2, A3 [A2 = A1 > A3 > A4 > A5 > A6 > A7] [A3 > A4 > A5 > A6] | A2, A3 [A2 > A3 > A4 > A5 > A6 > A7] [A3 > A4 > A5 > A6 > A7] | A2, A3, A4 [A2 > A3 > A4 > A5 > A6 > A7] [A3 = A2 = A4 > A5 > A6 > A7] [A4 = A2 = A3 > A5 > A6 > A7] |
| Less Preferred | A4, A5 [A4 = A2 > A5 > A6 > A7] [A5 > A6 > A7] | A4, A5 [A4 > A5 = A6 > A7] [A5 = A4 > A6 > A7] | A4, A5 [A4 > A5 > A6 > A7] [A5 > A6 > A7] | A5 [A5 = A1 > A6 > A7] |
| Least Preferred | A6, A7 [A6 > A7] [A7 Not Preferred] | A6, A7 [A6 > A7] [A7 Not Preferred] | A6, A7 [A6 > A7] [Not Preferred] | A6, A7 [A6 > A7] [A7 Not Preferred] |
References
- Barbour, E.; Parra, D.; Awwad, Z.; González, M.C. Community Energy Storage: A Smart Choice for the Smart Grid? Appl. Energy 2018, 212, 489–497. [Google Scholar] [CrossRef]
- Schram, W.L.; AlSkaif, T.; Lampropoulos, I.; Henein, S.; Van Sark, W.G.J.H.M. On the Trade-Off Between Environmental and Economic Objectives in Community Energy Storage Operational Optimization. IEEE Trans. Sustain. Energy 2020, 11, 2653–2661. [Google Scholar] [CrossRef]
- Re-Empowered|Renewable Energy Empowering European & Indian Communities. Available online: https://reempowered-h2020.com/ (accessed on 30 June 2023).
- Kotsampopoulos, P.; Dimeas, A.; Chronis, A.; Saridaki, G.; Hatziargyriou, N.; Maiti, S.; Chakraborty, C. EU-India Collaboration for Smarter Microgrids: RE-EMPOWERED Project. In Proceedings of the 2022 IEEE PES Innovative Smart Grid Technologies Conference Europe (ISGT-Europe), Novi Sad, Serbia, 10–12 October 2022; pp. 1–6. [Google Scholar]
- Asadabadi, M.R.; Chang, E.; Saberi, M. Are MCDM Methods Useful? A Critical Review of Analytic Hierarchy Process (AHP) and Analytic Network Process (ANP). Cogent Eng. 2019, 6, 1623153. [Google Scholar] [CrossRef]
- Kumar, A.; Sah, B.; Singh, A.R.; Deng, Y.; He, X.; Kumar, P.; Bansal, R.C. A Review of Multi Criteria Decision Making (MCDM) towards Sustainable Renewable Energy Development. Renew. Sustain. Energy Rev. 2017, 69, 596–609. [Google Scholar] [CrossRef]
- Le Teno, J.F.; Mareshal, B. An Interval Version of PROMETHEE for the Comparison of Building Products’ Design with Ill-Defined Data on Environmental Quality. Eur. J. Oper. Res. 1998, 109, 522–529. [Google Scholar] [CrossRef]
- Ordu, M.; Der, O. Polymeric Materials Selection for Flexible Pulsating Heat Pipe Manufacturing Using a Comparative Hybrid MCDM Approach. Polymers 2023, 15, 2933. [Google Scholar] [CrossRef] [PubMed]
- Terlouw, T.; AlSkaif, T.; Bauer, C.; Van Sark, W. Multi-Objective Optimization of Energy Arbitrage in Community Energy Storage Systems Using Different Battery Technologies. Appl. Energy 2019, 239, 356–372. [Google Scholar] [CrossRef]
- Pimm, A.J.; Palczewski, J.; Morris, R.; Cockerill, T.T.; Taylor, P.G. Community Energy Storage: A Case Study in the UK Using a Linear Programming Method. Energy Convers. Manag. 2020, 205, 112388. [Google Scholar] [CrossRef]
- Parra, D.; Norman, S.A.; Walker, G.S.; Gillott, M. Optimum Community Energy Storage System for Demand Load Shifting. Appl. Energy 2016, 174, 130–143. [Google Scholar] [CrossRef]
- Sardi, J.; Mithulananthan, N.; Gallagher, M.; Hung, D.Q. Multiple Community Energy Storage Planning in Distribution Networks Using a Cost-Benefit Analysis. Appl. Energy 2017, 190, 453–463. [Google Scholar] [CrossRef]
- Pienaar, S.B.; Kusakana, K.; Manditereza, P.T. Usage of Battery Energy Storage Systems to Defer Substation Upgrades. In Proceedings of the 2018 Open Innovations Conference (OI), Johannesburg, South Africa, 3–5 October 2018; pp. 151–156. [Google Scholar]
- Zhang, T.; Emanuel, A.E.; Orr, J.A. Distribution Feeder Upgrade Deferral through Use of Energy Storage Systems. In Proceedings of the 2016 IEEE Power and Energy Society General Meeting (PESGM), Boston, MA, USA, 17–21 July 2016; pp. 1–5. [Google Scholar]
- Tabaraee, E.; Ebrahimnejad, S.; Bamdad, S. Evaluation of Power Plants to Prioritise the Investment Projects Using Fuzzy PROMETHEE Method. Int. J. Sustain. Energy 2018, 37, 941–955. [Google Scholar] [CrossRef]
- Eyer, J. Electric Utility Transmission and Distribution Upgrade Deferral Benefits from Modular Electricity Storage; Sandia National Laboratories (SNL): Albuquerque, NM, USA; Livermore, CA, USA, 2011; pp. 1–77. [Google Scholar]
- Zitnick, C.L.; Chanussot, L.; Das, A.; Goyal, S.; Heras-Domingo, J.; Ho, C.; Hu, W.; Lavril, T.; Palizhati, A.; Riviere, M.; et al. An Introduction to Electrocatalyst Design Using Machine Learning for Renewable Energy Storage. arXiv 2020, arXiv:2010.09435. [Google Scholar]
- Bui, V.-H.; Hussain, A.; Kim, H.-M. Double Deep Q-Learning-Based Distributed Operation of Battery Energy Storage System Considering Uncertainties. IEEE Trans. Smart Grid 2019, 11, 457–469. [Google Scholar] [CrossRef]
- Gao, T.; Lu, W. Machine Learning toward Advanced Energy Storage Devices and Systems. iScience 2021, 24, 101936. [Google Scholar] [CrossRef]
- Sidorov, D.; Liu, F.; Sun, Y. Machine Learning for Energy Systems. Energies 2020, 13, 4708. [Google Scholar] [CrossRef]
- Xu, B.; Rizzo, D.; Onori, S. Machine Learning Based Optimal Energy Storage Devices Selection Assistance for Vehicle Propulsion Systems; SAE International: Warrendale, PA, USA, 2020. [Google Scholar]
- Kumar, R.; Singal, S.K. Penstock Material Selection in Small Hydropower Plants Using MADM Methods. Renew. Sustain. Energy Rev. 2015, 52, 240–255. [Google Scholar] [CrossRef]
- Chatzimouratidis, A.I.; Pilavachi, P.A. Technological, Economic and Sustainability Evaluation of Power Plants Using the Analytic Hierarchy Process. Energy Policy 2009, 37, 778–787. [Google Scholar] [CrossRef]
- Büyüközkan, G.; Güleryüz, S. An Integrated DEMATEL-ANP Approach for Renewable Energy Resources Selection in Turkey. Int. J. Prod. Econ. 2016, 182, 435–448. [Google Scholar] [CrossRef]
- Moradpour, S.; Ebrahimnejad, S.; Mehdizadeh, E.; Mohamadi, A. Using Hybrid Fuzzy PROMETHEE II and Fuzzy Binary Goal Programming for Risk Ranking: A Case Study of Highway Construction Projects. J. Optim. Ind. Eng. 2011, 4, 47–55. [Google Scholar]
- Streimikiene, D.; Balezentis, T.; Krisciukaitienė, I.; Balezentis, A. Prioritizing Sustainable Electricity Production Technologies: MCDM Approach. Renew. Sustain. Energy Rev. 2012, 16, 3302–3311. [Google Scholar] [CrossRef]
- Kaya, T.; Kahraman, C. Multicriteria Decision Making in Energy Planning Using a Modified Fuzzy TOPSIS Methodology. Expert Syst. Appl. 2011, 38, 6577–6585. [Google Scholar] [CrossRef]
- Vallecha, H.; Bhattacharjee, D.; Osiri, J.K.; Bhola, P. Evaluation of Barriers and Enablers through Integrative Multicriteria Decision Mapping: Developing Sustainable Community Energy in Indian Context. Renew. Sustain. Energy Rev. 2021, 138, 110565. [Google Scholar] [CrossRef]
- Pamucar, D.; Deveci, M.; Schitea, D.; Erişkin, L.; Iordache, M.; Iordache, I. Developing a Novel Fuzzy Neutrosophic Numbers Based Decision Making Analysis for Prioritizing the Energy Storage Technologies. Int. J. Hydrogen Energy 2020, 45, 23027–23047. [Google Scholar] [CrossRef]
- Yeh, T.-M.; Huang, Y.-L. Factors in Determining Wind Farm Location: Integrating GQM, Fuzzy DEMATEL, and ANP. Renew. Energy 2014, 66, 159–169. [Google Scholar] [CrossRef]
- San Cristóbal, J.R. Multi-Criteria Decision-Making in the Selection of a Renewable Energy Project in Spain: The Vikor Method. Renew. Energy 2011, 36, 498–502. [Google Scholar] [CrossRef]
- Qie, X.; Zhang, R.; Hu, Y.; Sun, X.; Chen, X. A Multi-Criteria Decision-Making Approach for Energy Storage Technology Selection Based on Demand. Energies 2021, 14, 6592. [Google Scholar] [CrossRef]
- Montajabiha, M. An Extended PROMETHE II Multi-Criteria Group Decision Making Technique Based on Intuitionistic Fuzzy Logic for Sustainable Energy Planning. Group Decis. Negot. 2016, 25, 221–244. [Google Scholar] [CrossRef]
- Wu, Y.; Zhang, B.; Wu, C.; Zhang, T.; Liu, F. Optimal Site Selection for Parabolic Trough Concentrating Solar Power Plant Using Extended PROMETHEE Method: A Case in China. Renew. Energy 2019, 143, 1910–1927. [Google Scholar] [CrossRef]
- Govindan, K.; Rajendran, S.; Sarkis, J.; Murugesan, P. Multi Criteria Decision Making Approaches for Green Supplier Evaluation and Selection: A Literature Review. J. Clean. Prod. 2015, 98, 66–83. [Google Scholar] [CrossRef]
- Chen, T.; Wang, Y.; Wang, J.; Li, L.; Cheng, P.-F. Multistage Decision Framework for the Selection of Renewable Energy Sources Based on Prospect Theory and PROMETHEE. Int. J. Fuzzy Syst. 2020, 22, 1535–1551. [Google Scholar] [CrossRef]
- Liao, H.; Xu, Z. Multi-Criteria Decision Making with Intuitionistic Fuzzy PROMETHEE. J. Intell. Fuzzy Syst. 2014, 27, 1703–1717. [Google Scholar] [CrossRef]
- Liao, H.; Wu, D.; Huang, Y.; Ren, P.; Xu, Z.; Verma, M. Green Logistic Provider Selection with a Hesitant Fuzzy Linguistic Thermodynamic Method Integrating Cumulative Prospect Theory and PROMETHEE. Sustainability 2018, 10, 1291. [Google Scholar] [CrossRef]
- Wang, J.; Jing, Y.; Zhang, C.; Zhao, J. Review on Multi-Criteria Decision Analysis Aid in Sustainable Energy Decision-Making. Renew. Sustain. Energy Rev. 2009, 13, 2263–2278. [Google Scholar]
- Ren, J.; Ren, X. Sustainability Ranking of Energy Storage Technologies under Uncertainties. J. Clean. Prod. 2018, 170, 1387–1398. [Google Scholar] [CrossRef]
- Zhao, H.; Guo, S.; Zhao, H. Comprehensive Assessment for Battery Energy Storage Systems Based on Fuzzy-MCDM Considering Risk Preferences. Energy 2019, 168, 450–461. [Google Scholar] [CrossRef]
- Chronis, A.-G.; Palaiogiannis, F.; Kouveliotis-Lysikatos, I.; Kotsampopoulos, P.; Hatziargyriou, N. Photovoltaics Enabling Sustainable Energy Communities: Technological Drivers and Emerging Markets. Energies 2021, 14, 1862. [Google Scholar] [CrossRef]
- Çolak, M.; Kaya, İ. Multi-Criteria Evaluation of Energy Storage Technologies Based on Hesitant Fuzzy Information: A Case Study for Turkey. J. Energy Storage 2020, 28, 101211. [Google Scholar] [CrossRef]
- Albawab, M.; Ghenai, C.; Bettayeb, M.; Janajreh, I. Sustainability Performance Index for Ranking Energy Storage Technologies Using Multi-Criteria Decision-Making Model and Hybrid Computational Method. J. Energy Storage 2020, 32, 101820. [Google Scholar] [CrossRef]
- Alizadeh, R.; Soltanisehat, L.; Lund, P.D.; Zamanisabzi, H. Improving Renewable Energy Policy Planning and Decision-Making through a Hybrid MCDM Method. Energy Policy 2020, 137, 111174. [Google Scholar] [CrossRef]
- Zhang, C.; Chen, C.; Streimikiene, D.; Balezentis, T. Intuitionistic Fuzzy MULTIMOORA Approach for Multi-Criteria Assessment of the Energy Storage Technologies. Appl. Soft Comput. 2019, 79, 410–423. [Google Scholar] [CrossRef]
- Liu, Y.; Du, J. A Multi Criteria Decision Support Framework for Renewable Energy Storage Technology Selection. J. Clean. Prod. 2020, 277, 122183. [Google Scholar] [CrossRef]
- Akram, M.; Shumaiza; Al-Kenani, A.N. Multi-Criteria Group Decision-Making for Selection of Green Suppliers under Bipolar Fuzzy PROMETHEE Process. Symmetry 2020, 12, 77. [Google Scholar] [CrossRef]
- Tong, L.; Pu, Z.; Chen, K.; Yi, J. Sustainable Maintenance Supplier Performance Evaluation Based on an Extend Fuzzy PROMETHEE II Approach in Petrochemical Industry. J. Clean. Prod. 2020, 273, 122771. [Google Scholar] [CrossRef]
- Chen, Y.-H.; Wang, T.-C.; Wu, C.-Y. Strategic Decisions Using the Fuzzy PROMETHEE for IS Outsourcing. Expert Syst. Appl. 2011, 38, 13216–13222. [Google Scholar] [CrossRef]
- Oglu, S.V.H. Application of topsis method with trapezoidal fuzzy numbers. RS Glob. Sci. Rev. 2021, 1, 7377. [Google Scholar] [CrossRef]
- Kahraman, C.; Kutlu Gündoğdu, F. (Eds.) Decision Making with Spherical Fuzzy Sets: Theory and Applications; Studies in Fuzziness and Soft Computing; Springer International Publishing: Cham, Switzerland, 2021; Volume 392, ISBN 978-3-030-45460-9. [Google Scholar]
- Afful-Dadzie, E.; Nabareseh, S.; Afful-Dadzie, A.; Oplatková, Z.K. Erratum to: A Fuzzy TOPSIS Framework for Selecting Fragile States for Support Facility. Qual. Quant. 2015, 49, 1857. [Google Scholar] [CrossRef]
- Atanassov, K.T. Intuitionistic Fuzzy Sets Theory and Applications; Physica-Verlag: Heidelberg, Germany; New York, NY, USA, 1999. [Google Scholar]
- Bhola, P.; Kontou, A.; Michos, K.; Chronis, A.; Kotsampopoulos, P.; Dallas, S.; Kleftakis, V.; Jorgensen, T.; Nuhic, M.; Markopoulos, P.; et al. RE-EMPOWERED Project Deliverable 2.2: “Obstacles to Innovation Report”. 2022. Available online: https://reempowered-h2020.com (accessed on 30 June 2023).
- Rubio Conte, J.; Rodriguez-Varela, A.P.; Bhola, P.; Maiti, S.; Sarkar, U.; Sogaard, A.; Dimitriou, M.-A.; Yang, G.; Kontou, A.; Chronis, A.-G.; et al. RE-EMPOWERED Project Deliverable 8.1: Report on the Business Models and Financing Tools (V1). 2022. Available online: https://reempowered-h2020.com (accessed on 30 June 2023).
- “Kythnos Smart Island” Project|DAFNI|Network of Sustainable Greek Islands. Available online: https://dafninetwork.gr/en/portfolio/kythnos-smart-island/ (accessed on 30 June 2023).
- Kumar, J.C.R.; Majid, M.A. Renewable Energy for Sustainable Development in India: Current Status, Future Prospects, Challenges, Employment, and Investment Opportunities. Energy Sustain. Soc. 2020, 10, 2. [Google Scholar] [CrossRef]
- Doan, N.A.V.; De Smet, Y. An Alternative Weight Sensitivity Analysis for PROMETHEE II Rankings. Omega 2018, 80, 166–174. [Google Scholar] [CrossRef]
- Boran, F.E.; Genç, S.; Kurt, M.; Akay, D. A Multi-Criteria Intuitionistic Fuzzy Group Decision Making for Supplier Selection with TOPSIS Method. Expert Syst. Appl. 2009, 36, 11363–11368. [Google Scholar] [CrossRef]
- Azzuni, A.; Breyer, C. Energy Security and Energy Storage Technologies. Energy Procedia 2018, 155, 237–258. [Google Scholar] [CrossRef]
- Zakeri, B.; Syri, S. Electrical Energy Storage Systems: A Comparative Life Cycle Cost Analysis. Renew. Sustain. Energy Rev. 2015, 42, 569–596. [Google Scholar] [CrossRef]
- Darghouth, N.R.; Barbose, G.; Zuboy, J.; Gagnon, P.J.; Mills, A.D.; Bird, L. Demand Charge Savings from Solar PV and Energy Storage. Energy Policy 2020, 146, 111766. [Google Scholar] [CrossRef]
- Pons-Seres de Brauwer, C.; Cohen, J.J. Analysing the Potential of Citizen-Financed Community Renewable Energy to Drive Europe’s Low-Carbon Energy Transition. Renew. Sustain. Energy Rev. 2020, 133, 110300. [Google Scholar] [CrossRef]
- Sovacool, B.; Ryan, S.; Stern, P.; Janda, K.; Rochlin, G.; Spreng, D.; Pasqualetti, M.; Wilhite, H.; Lutzenhiser, L. Integrating Social Science in Energy Research. Energy Res. Soc. Sci. 2015, 6, 95–99. [Google Scholar] [CrossRef]
- Ibrahim, H.; Ilinca, A.; Perron, J. Energy Storage Systems—Characteristics and Comparisons. Renew. Sustain. Energy Rev. 2008, 12, 1221–1250. [Google Scholar] [CrossRef]
- Goumas, M.; Lygerou, V. An Extension of the PROMETHEE Method for Decision Making in Fuzzy Environment: Ranking of Alternative Energy Exploitation Projects. Eur. J. Oper. Res. 2000, 123, 606–613. [Google Scholar] [CrossRef]
- Belton, V.; Stewart, T.J. Multiple Criteria Decision Analysis; Springer: Boston, MA, USA, 2002; ISBN 978-1-4613-5582-3. [Google Scholar]
| For Importance Weights of Criteria | For Performance Ratings | ||
|---|---|---|---|
| Linguistic Variables | Fuzzy Numbers | Linguistic Variables | Fuzzy Numbers |
| Very Low (VL) | (0, 0, 0.1, 0.2) | Very Poor (VP) | (0, 0, 1, 2) |
| Low (L) | (0.1, 0.2, 0.2, 0.3) | Poor (P) | (1, 2, 2, 3) |
| Medium Low (ML) | (0.2, 0.3, 0.4, 0.5) | Medium Poor (MP) | (2, 3, 4, 5) |
| Medium (M) | (0.4, 0.5, 0.5, 0.6) | Fair (F) | (4, 5, 5, 6) |
| Medium High (MH) | (0.5, 0.6, 0.7, 0.8) | Medium Good (MG) | (5, 6, 7, 8) |
| High (H) | (0.7, 0.8, 0.8, 0.9) | Good (G) | (7, 8, 8, 9) |
| Very High (VH) | (0.8, 0.9, 1, 1) | Very Good (VG) | (8, 9, 10, 10) |
| Stakeholder’s | Key Activities |
|---|---|
| All residents, house owners and other consumers of the network, if any | Membership of the energy cooperative Equity ownership, energy storage developer or investor Respond to demand response requests and adapt tools |
| CES Aggregators | Developers and investors in CES projects with community/ utilities Manages storage units and provide performance data Providers of the range of services and consultancy for CES system Developing and supplying CES technology and infrastructure Partnership with manufacturers, system integrators, software developers Energy trading and management, financial accounting |
| Manufacturers of equipment | Maintenance of energy storage devices and equipment Replacement of storage equipment |
| Local public authorities | To support residents in management of such energy community |
| R&D partners and Technical experts | Demonstration of new storage technologies and algorithms as pilot and test model |
| Other investors | Funding the CES development plans |
| Citizen organizations and fora | Identification of potential new members of the energy community Channelizing crowdfunding for CES projects for energy communities |
| Proposed CES Business Model | Potential Revenue Streams |
|---|---|
| Community Cooperative (CC) Model |
|
| Energy Arbitrage (EA) Model |
|
| Energy Arbitrage Peak Shaving (EA-PS) Model | |
| Emission Reduction and Var Support (ER-VS) |
|
| Cost-Emission Optimization and Energy Loss Reduction (CEO-ELR) Model |
|
| Aggregated Energy Services (AES) Model |
|
| Vehicle-to-Microgrid (VTMG) Model |
|
| Gaidouromantra Microgrid | Ghoramara Island | |||||||||
|---|---|---|---|---|---|---|---|---|---|---|
| Criteria | DM1 | DM2 | DM3 | DM4 | Aggregated Fuzzy Weight | DM1 | DM2 | DM3 | DM4 | Aggregated Fuzzy Weight |
| C1 | H | M | H | M | (0.4, 0.675, 0.7, 1) | H | H | VH | M | (0.4, 0.75, 0.775, 1) |
| C2 | M | H | H | M | (0.4, 0.65, 0.65, 0.9) | M | M | MH | H | (0.4, 0.6, 0.625, 0.9) |
| C3 | VH | H | VH | H | (0.7, 0.825, 0.85, 1) | MH | VH | H | H | (0.5, 0.775, 0.825, 1) |
| C4 | M | M | H | M | (0.4, 0.575, 0.575, 0.9) | H | H | H | VH | (0.7, 0.825, 0.85, 1) |
| Alternatives | C1 | C2 | C3 | C4 |
|---|---|---|---|---|
| A1 | (0.28, 0.57, 0.63, 1) | (0.20, 0.46, 0.49, 0.81) | (0.35, 0.62, 0.66, 0.90) | (0.22, 0.48, 0.50, 0.90) |
| A2 | (0.28, 0.59, 0.67, 1) | (0.20, 0.46, 0.49, 0.81) | (0.35, 0.56, 0.66, 1) | (0.22, 0.45, 0.48, 0.90) |
| A3 | (0.20, 0.54, 0.61, 1) | (0.28, 0.54, 0.55, 0.90) | (0.28, 0.50, 0.53, 0.90) | (0.22, 0.48, 0.50, 0.90) |
| A4 | (0.20, 0.49, 0.56, 1) | (0.28, 0.55, 0.59, 0.90) | (0.28, 0.56, 0.60, 0.90) | (0.18, 0.46, 0.46, 0.90) |
| A5 | (0.20, 0.47, 0.53, 0.90) | (0.20, 0.47, 0.52, 0.90) | (0.35, 0.54, 0.62, 0.90) | (0.22, 0.45, 0.48, 0.90) |
| A6 | (0.20, 0.51, 0.54, 0.90) | (0.20, 0.54, 0.60, 0.90) | (0.35, 0.56, 0.66, 1) | (0.22, 0.42, 0.46, 0.90) |
| Alternatives | C1 | C2 | C3 | C4 |
|---|---|---|---|---|
| A1 | (0.28, 0.64, 0.70, 1) | (0.20, 0.44, 0.50, 0.90) | (0.25, 0.62, 0.72, 1) | (0.28, 0.56, 0.60, 0.90) |
| A2 | (0.16, 0.53, 0.58, 1) | (0.20, 0.44, 0.50, 0.90) | (0.25, 0.50, 0.60, 0.90) | (0.35, 0.60, 0.68, 1) |
| A3 | (0.16, 0.49, 0.56, 1) | (0.20, 0.45, 0.48, 0.81) | (0.20, 0.56, 0.66, 1) | (0.35, 0.60, 0.68, 1) |
| A4 | (0.16, 0.53, 0.58, 1) | (0.16, 0.39, 0.45, 0.90) | (0.25, 0.52, 0.64, 1) | (0.35, 0.60, 0.68, 1) |
| A5 | (0.16, 0.43, 0.45, 0.90) | (0.16, 0.39, 0.45, 0.90) | (0.25, 0.60, 0.68, 1) | (0.28, 0.56, 0.60, 0.90) |
| A6 | (0.16, 0.60, 0.68, 1) | (0.20, 0.45, 0.48, 0.81) | (0.25, 0.58, 0.70, 1) | (0.35, 0.54, 0.62, 0.90) |
| A7 | (0.16, 0.56, 0.60, 1) | (0.20, 0.39, 0.45, 0.81) | (0.20, 0.45, 0.54, 0.80) | (0.28, 0.58, 0.64, 1) |
| Alternatives | A1 | A2 | A3 |
|---|---|---|---|
| A1 | (0.029, 0.052, 0.055, 0.103) | (0.106, 0.202, 0.209, 0.388) | |
| A2 | (0, 0, 0, 0) | (0.124, 0.235, 0.245, 0.458) | |
| A3 | (0, 0, 0, 0) | (0, 0, 0, 0) | |
| A4 | (0, 0, 0, 0) | (0, 0, 0, 0) | (0, 0, 0, 0) |
| A5 | (0, 0, 0, 0) | (0, 0, 0, 0) | (0, 0, 0, 0) |
| A6 | (0, 0, 0, 0) | (0, 0, 0, 0) | (0, 0, 0, 0) |
| A4 | A5 | A6 | |
| A1 | (0.109, 0.220, 0.228, 0.443) | (0.083, 0.174, 0.181, 0.358) | (0.094, 0.198, 0.205, 0.409) |
| A2 | (0.118, 0.237, 0.246, 0.475) | (0.091, 0.188, 0.197, 0.382) | (0.076, 0.171, 0.177, 0.361) |
| A3 | (0.049, 0.093, 0.097, 0.187) | (0.087, 0.172, 0.179, 0.344) | (0.106, 0.195, 0.204, 0.378) |
| A4 | (0.063, 0.130, 0.134, 0.264) | (0.071, 0.311, 0.136, 0.253) | |
| A5 | (0, 0, 0, 0) | (0.056, 0.105, 0.109, 0.205) | |
| A6 | (0, 0, 0, 0) | (0, 0, 0, 0) |
| Alternatives | A1 | A2 | A3 | A4 |
|---|---|---|---|---|
| A1 | (0.132, 0.250, 0.272, 0.492) | (0.127, 0.242, 0.262, 0.483) | (0.125, 0.235, 0.255, 0.471) | |
| A2 | (0.097, 0.165, 0.180, 0.318) | (0.045, 0.090, 0.099, 0.186) | (0.034, 0.066, 0.073, 0.140) | |
| A3 | (0.086, 0.143, 0.155, 0.281) | (0.045, 0.090, 0.099, 0.186) | (0.027, 0.054, 0.059, 0.117) | |
| A4 | (0.125, 0.235, 0.255, 0.471) | (0.034, 0.066, 0.073, 0.140) | (0.027, 0.054, 0.059, 0.117) | |
| A5 | (0.091, 0.207, 0.223, 0.429) | (0.136, 0.256, 0.278, 0.512) | (0.108, 0.199, 0.215, 0.398) | (0.102, 0.190, 0.205, 0.372) |
| A6 | (0.053, 0.103, 0.112, 0.211) | (0.105, 0.194, 0.211, 0.387) | (0.078, 0.144, 0.156, 0.283) | (0.087, 0.158, 0.172, 0.318) |
| A7 | (0.156, 0.304, 0.333, 0.614) | (0.083, 0.153, 0.167, 0.312) | (0.101, 0.192, 0.211, 0.384) | (0.094, 0.176, 0.193, 0.351) |
| A5 | A6 | A7 | ||
| A1 | (0.091, 0.207, 0.223, 0.398) | (0.053, 0.103, 0.112, 0.211) | (0.156, 0.304, 0.333, 0.614) | |
| A2 | (0.136, 0.256, 0.278, 0.512) | (0.105, 0.194, 0.211, 0.387) | (0.083, 0.153, 0.167, 0.312) | |
| A3 | (0.109, 0.199, 0.215, 0.398) | (0.078, 0.144, 0.156, 0.283) | (0.101, 0.192, 0.211, 0.384) | |
| A4 | (0.102, 0.190, 0.205, 0.372) | (0.087, 0.158, 0.172, 0.318) | (0.094, 0.176, 0.193, 0.351) | |
| A5 | (0.084, 0.178, 0.192, 0.366) | (0.148, 0.294, 0.321, 0.590) | ||
| A6 | (0.084, 0.178, 0.192, 0.366) | (0.121, 0.228, 0.251, 0.455) | ||
| A7 | (0.148, 0.294, 0.321, 0.590) | (0.092, 0.185, 0.204, 0.374) |
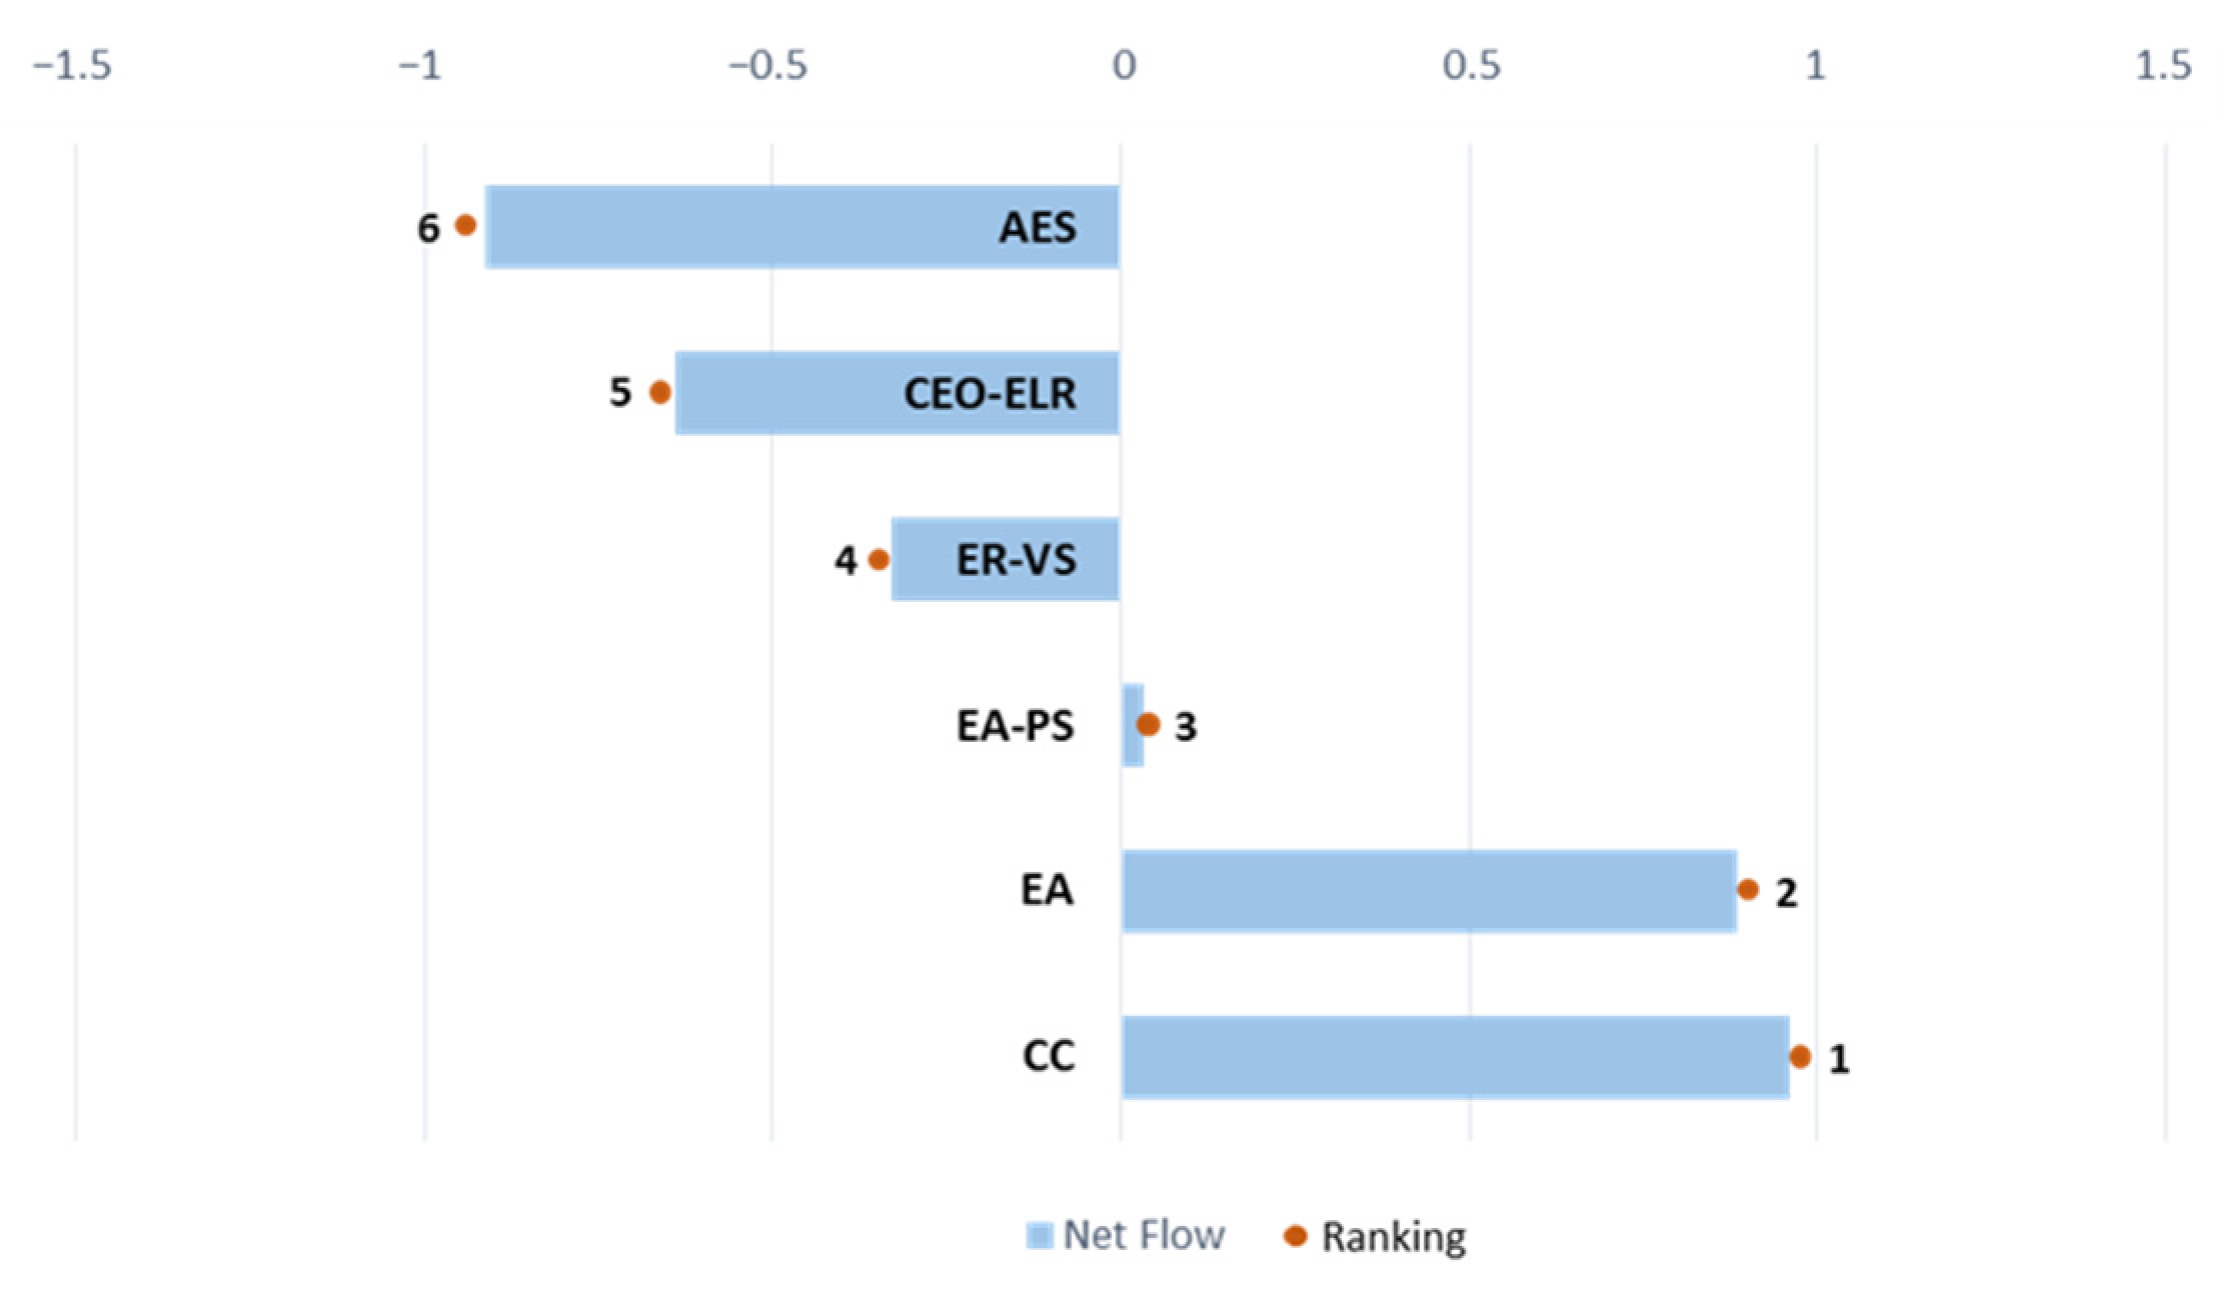
| Gaidouromantra Microgrid | |||
|---|---|---|---|
| Positive Flow | Negative Flow | Net Flow | |
| Energy Arbitrage (A1) | 0.961 | 0.000 | 0.961 |
| Energy Arbitrage Peak Shaving (A2) | 0.945 | 0.060 | 0.886 |
| Emission Reduction and VAr Support (A3) | 0.523 | 0.492 | 0.031 |
| Vehicle-to-Microgrid (A6) | 0.295 | 0.625 | −0.330 |
| Aggregated Energy Services (A5) | 0.119 | 0.756 | −0.637 |
| Cost Emission Optimization and Energy Loss Reduction (A4) | 0.000 | 0.910 | −0.910 |
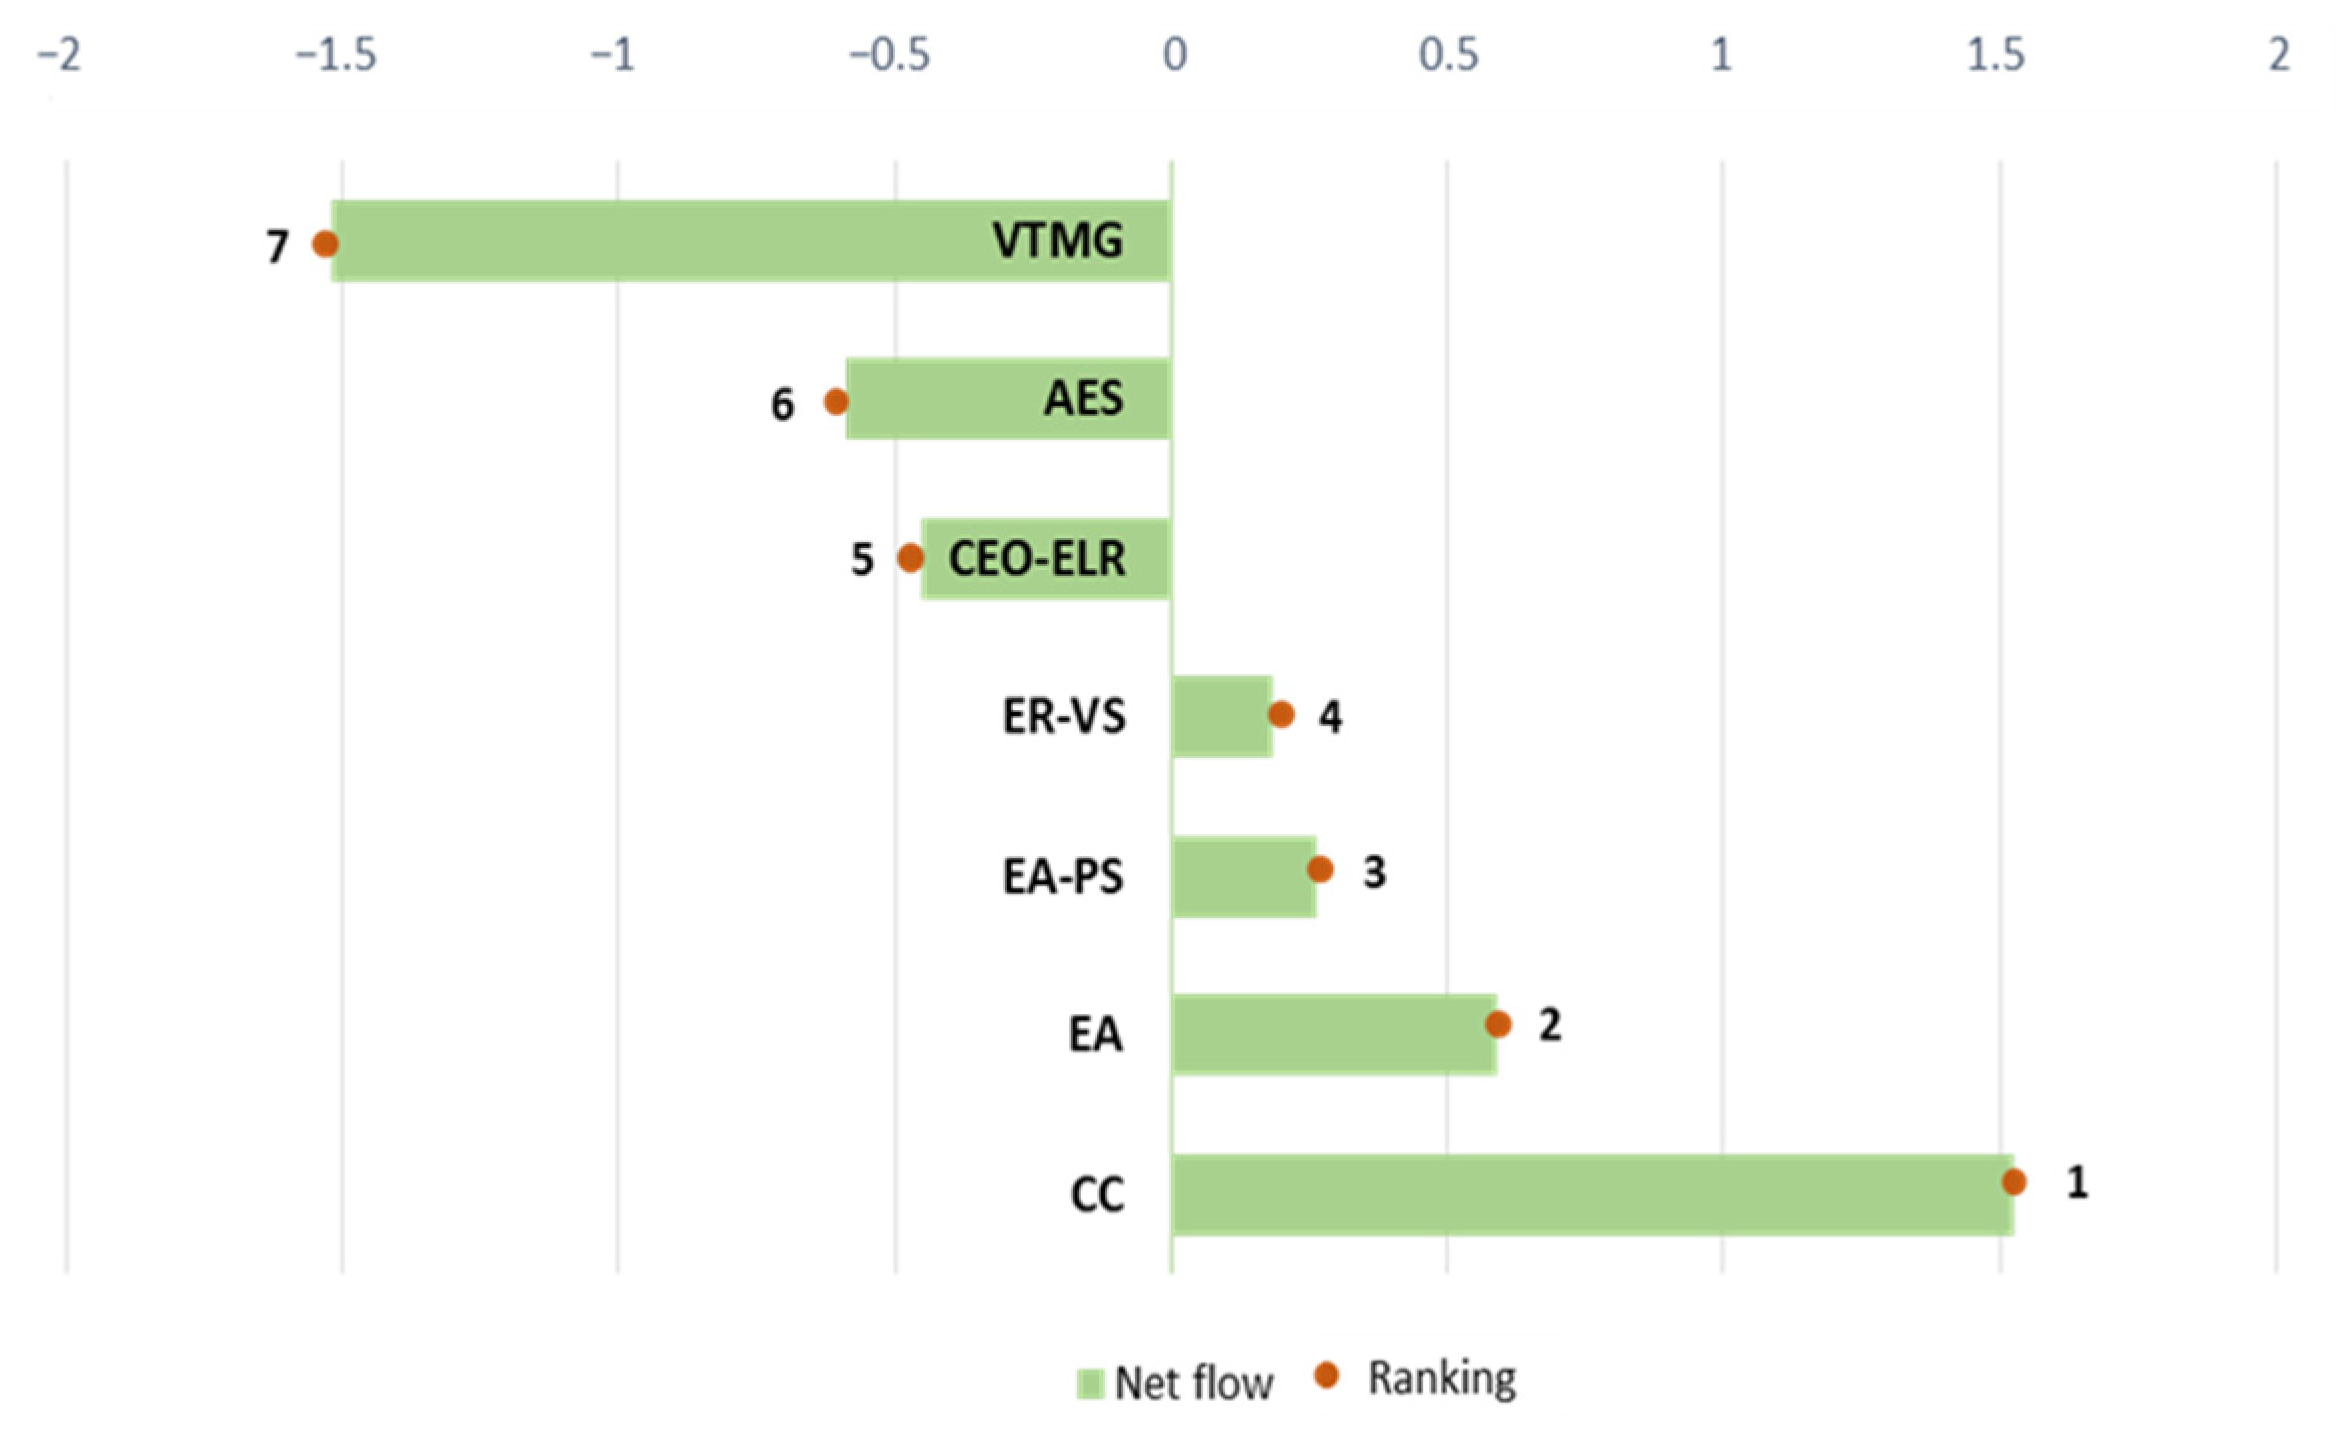
| Ghoramara Microgrid | |||
|---|---|---|---|
| Positive Flow | Negative Flow | Net Flow | |
| Community Cooperative (A1) | 1.5387 | 0.014 | 1.525 |
| Energy Arbitrage (A2) | 0.8815 | 0.294 | 0.588 |
| Energy Arbitrage Peak Shaving (A3) | 0.6893 | 0.427 | 0.263 |
| Emission Reduction and VAr Support (A4) | 0.6259 | 0.446 | 0.180 |
| Cost Emission Optimization and Energy Loss Reduction (A5) | 0.5646 | 1.016 | −0.451 |
| Aggregated Energy Services (A7) | 0.3324 | 0.919 | −0.587 |
| Vehicle-to-Microgrid (A7) | 0.0408 | 1.558 | −1.517 |
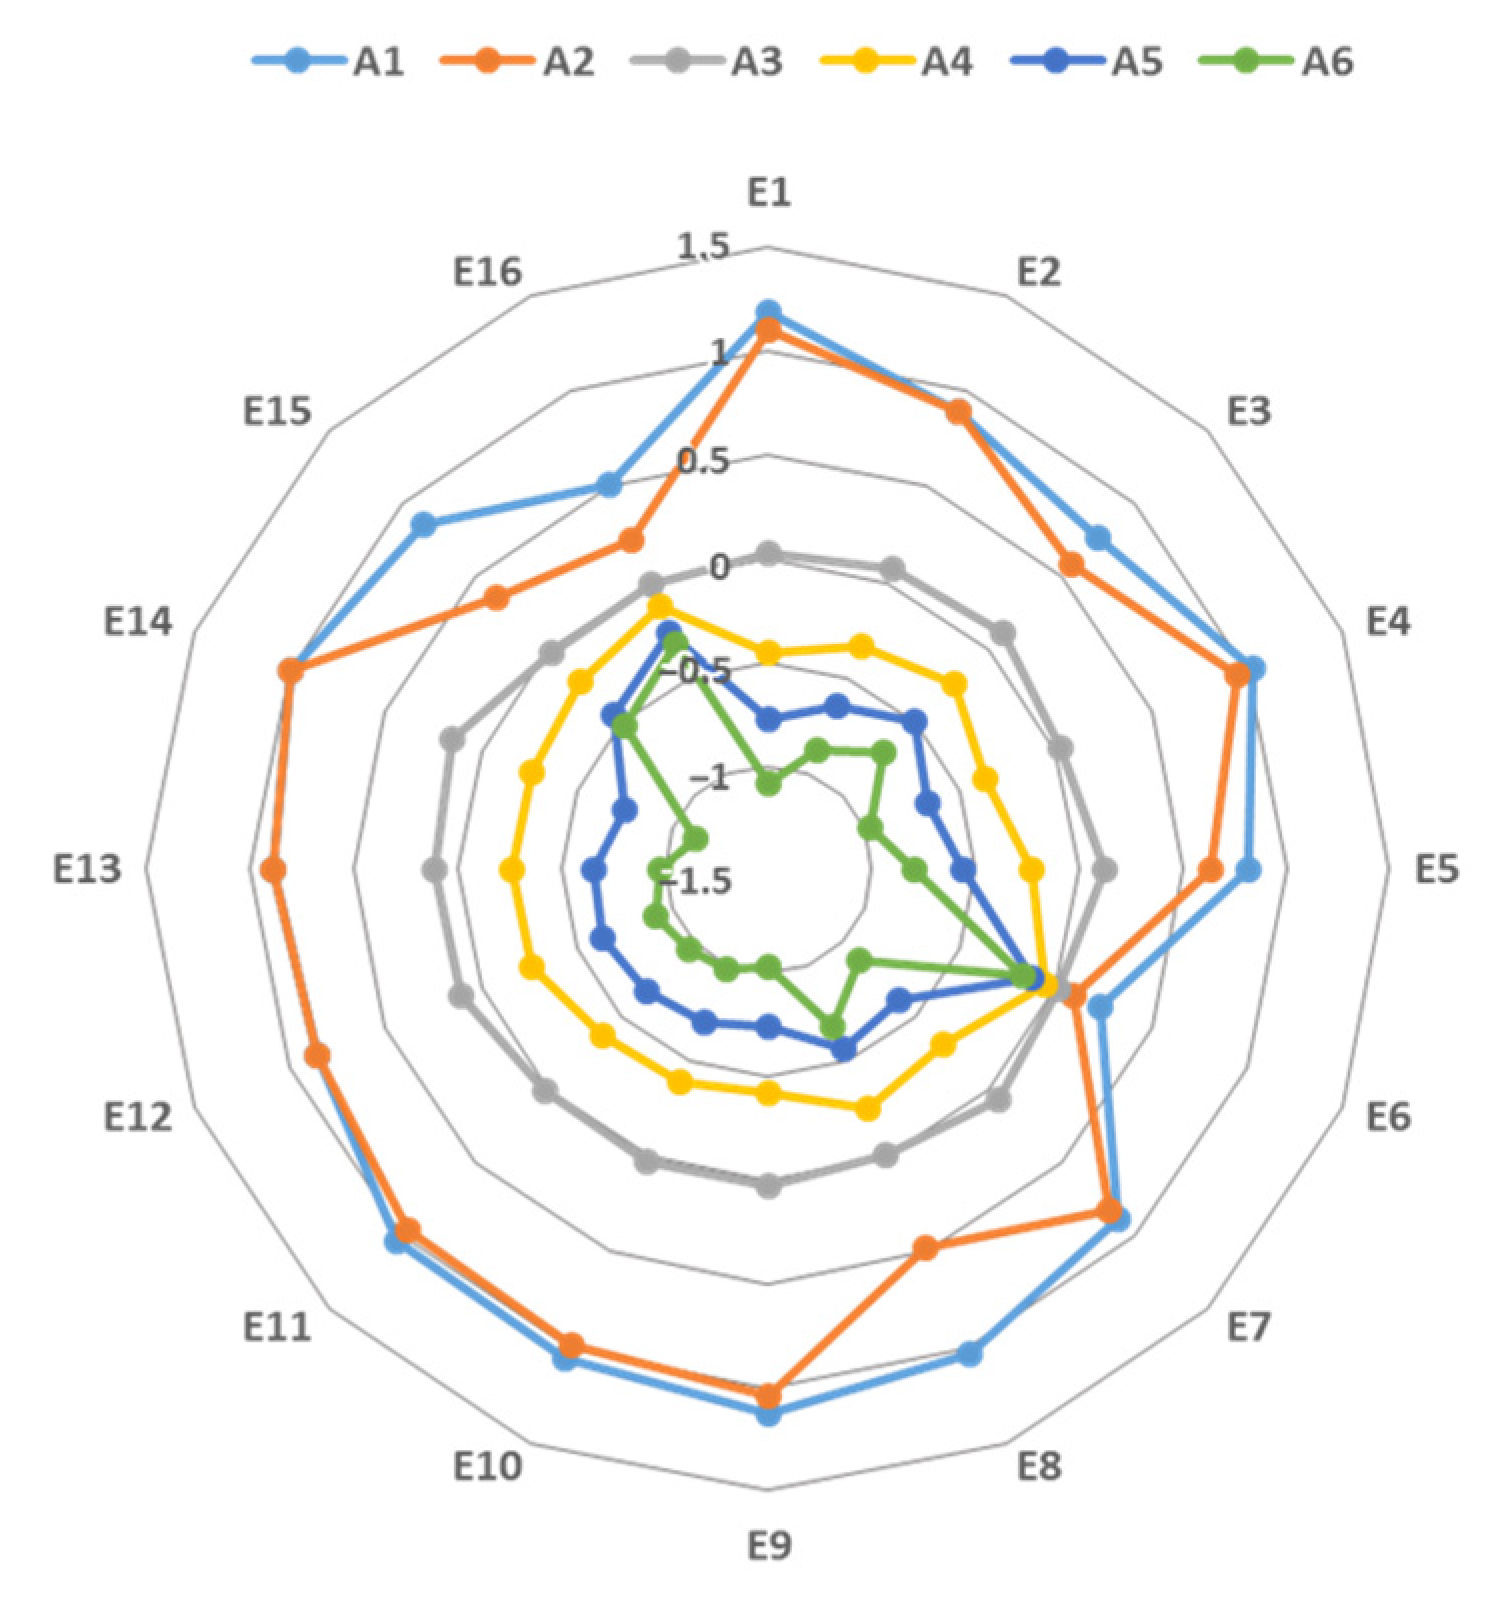
| Expt. | Definition | Net Flow | Ranking | |||||
|---|---|---|---|---|---|---|---|---|
| A1 | A2 | A3 | A4 | A5 | A6 | |||
| E1 | wA1:A6(=(0.8,0.9,1,1)) | 1.18801 | 1.10080 | 0.02157 | −0.45179 | −0.77337 | −1.08521 | A1 > A2 > A3 > A4 > A5 > A6 |
| E2 | wA1:A6(=(0.7,0.8,0.8,0.9)) | 0.89425 | 0.89312 | 0.06800 | −0.33044 | −0.64423 | −0.88070 | A1 > A2 > A3 > A4 > A5 > A6 |
| E3 | wA1:A6(=(0.5,0.6,0.7,0.8)) | 0.75674 | 0.57366 | 0.10599 | −0.23080 | −0.49731 | −0.708282 | A1 > A2 > A3 > A4 > A5 > A6 |
| E4 | wA1:A6((0.7,0.8,0.8,0.9)=(0.8,0.9,1,1)) | 1.03011 | 0.94553 | 0.02277 | −0.36185 | −0.66975 | −0.96681 | A1 > A2 > A3 > A4 > A5 > A6 |
| E5 | wA1:A6((0.7,0.8,0.8,0.9)=(0.5,0.6,0.7,0.8)) | 0.81353 | 0.63207 | 0.12596 | −0.22433 | −0.55614 | −0.79110 | A1 > A2 > A3 > A4 > A5 > A6 |
| E6 | wA1:A6((0.7,0.8,0.8,0.9)|(0.8,0.9,1,1)=(0,0,0.1,0.2)) | 0.23573 | 0.09424 | 0.01390 | −0.04953 | −0.12826 | −0.16608 | A1 > A2 > A3 > A4 > A5 > A6 |
| E7 | wA1:A6((0.7,0.8,0.8,0.9)=(0.1,0.2,0.2,0.3)|(0.8,0.9,1,1)=(0,0,0.1,0.2)) | 0.88785 | 0.82216 | 0.07247 | −0.30042 | −0.60528 | −0.87678 | A1 > A2 > A3 > A4 > A5 > A6 |
| E8 | wA1:A6((0.7,0.8,0.8,0.9)=(0.2,0.3,0.4,0.5);(0.8,0.9,1,1)=(0,0,0.1,0.2)) | 1.02745 | 0.47248 | −0.00892 | −0.25037 | −0.55996 | −0.68069 | A1 > A2 > A3 > A4 > A5 > A6 |
| E9 | wA1:A6((0.4,0.5,0.5,0.6)=(0.8,0.9,1,1)) | 1.12329 | 1.04067 | 0.03012 | −0.42401 | −0.73602 | −1.03405 | A1 > A2 > A3 > A4 > A5 > A6 |
| E10 | wA1:A6((0.4,0.5,0.5,0.6)=(0.7,0.8,0.8,0.9)) | 1.06027 | 0.98389 | 0.02513 | −0.38983 | −0.70172 | −0.97774 | A1 > A2 > A3 > A4 > A5 > A6 |
| E11 | wA1:A6((0.4,0.5,0.5,0.6)=(0.5,0.6,0.7,0.8)) | 1.03120 | 0.95654 | 0.01876 | −0.37171 | −0.67456 | −0.96023 | A1 > A2 > A3 > A4 > A5 > A6 |
| E12 | wA1:A6((0.4,0.5,0.5,0.6)=(0.2,0.3,0.4,0.5)) | 0.85766 | 0.85514 | 0.10120 | −0.26939 | −0.63202 | −0.91260 | A1 > A2 > A3 > A4 > A5 > A6 |
| E13 | wA1:A6((0.4,0.5,0.5,0.6)=(0.1,0.2,0.2,0.3)) | 0.89257 | 0.88786 | 0.11478 | −0.26149 | −0.66070 | −0.97301 | A1 > A2 > A3 > A4 > A5 > A6 |
| E14 | wA1:A6((0.4,0.5,0.5,0.6)=(0,0,0.1,0.2) | 0.99828 | 0.99645 | 0.14805 | −0.27094 | −0.74759 | −1.12425 | A1 > A2 > A3 > A4 > A5 > A6 |
| E15 | wA1:A6(=(0.2,0.3,0.4,0.5)) | 0.84950 | 0.36129 | −0.02881 | −0.21413 | −0.44149 | −0.52636 | A1 > A2 > A3 > A4 > A5 > A6 |
| E16 | wA1:A6(=(0.1,0.2,0.2,0.3)) | 0.51000 | 0.21667 | −0.01667 | −0.13167 | −0.26000 | −0.31833 | A1 > A2 > A3 > A4 > A5 > A6 |
| Expt. | Definition | Net Flow | Ranking | ||||||
|---|---|---|---|---|---|---|---|---|---|
| A1 | A2 | A3 | A4 | A5 | A6 | A7 | |||
| E1 | wA1:A7(=(0.8,0.9,1,1)) | 1.35222 | 1.28686 | 0.33314 | −0.13326 | −0.55523 | −0.74940 | −1.53434 | A1 > A2 > A3 > A4 > A5 > A6 > A7 |
| E2 | wA1:A7(=(0.7,0.8,0.8,0.9)) | 1.16317 | 1.10476 | 0.28444 | −0.10921 | −0.47746 | −0.64508 | −1.32063 | A1 > A2 > A3 > A4 > A5 > A6 > A7 |
| E3 | wA1:A7(=(0.5,0.6,0.7,0.8)) | 0.96063 | 0.92345 | 0.24696 | −0.08365 | −0.39102 | −0.54305 | −1.11332 | A1 > A2 > A3 > A4 > A5 > A6 > A7 |
| E4 | wA1:A7((0.7,0.8,0.8,0.9)=(0.8,0.9,1,1)) | 1.18279 | 1.09959 | 0.34173 | −0.14459 | −0.47819 | −0.67825 | −1.32309 | A1 > A2 > A3 > A4 > A5 > A6 > A7 |
| E5 | wA1:A7((0.7,0.8,0.8,0.9)=(0.5,0.6,0.7,0.8)) | 0.99129 | 0.94775 | 0.29020 | −0.08863 | −0.41894 | −0.57902 | −1.14264 | A1 > A2 > A3 > A4 > A5 > A6 > A7 |
| E6 | wA1:A7((0.7,0.8,0.8,0.9)|(0.8,0.9,1,1)=(0,0,0.1,0.2)) | 0.26045 | 0.25206 | 0.09720 | 0.00926 | −0.09017 | −0.17380 | −0.35499 | A1 > A2 > A3 > A4 > A5 > A6 > A7 |
| E7 | wA1:A7((0.7,0.8,0.8,0.9)=(0.1,0.2,0.2,0.3)|(0.8,0.9,1,1)=(0,0,0.1,0.2)) | 1.52513 | 0.58751 | 0.26256 | 0.18021 | −0.45133 | −0.58665 | −1.51743 | A2 > A1 > A3 > A4 > A5 > A6 > A7 |
| E8 | wA1:A7((0.7,0.8,0.8,0.9)=(0.2,0.3,0.4,0.5);(0.8,0.9,1,1)=(0,0,0.1,0.2)) | 1.85700 | 1.83793 | 0.55921 | 0.04419 | −0.61140 | −1.15564 | −2.53129 | A1 > A2 > A3 > A4 > A5 > A6 > A7 |
| E9 | wA1:A7((0.4,0.5,0.5,0.6)=(0.8,0.9,1,1)) | 1.24248 | 1.19363 | 0.31546 | −0.13514 | −0.51065 | −0.69855 | −1.40723 | A1 > A2 > A3 > A4 > A5 > A6 > A7 |
| E10 | wA1:A7((0.4,0.5,0.5,0.6)=(0.7,0.8,0.8,0.9)) | 1.19969 | 1.14115 | 0.30386 | −0.13478 | −0.49483 | −0.67948 | −1.33562 | A1 > A2 > A3 > A4 > A5 > A6 > A7 |
| E11 | wA1:A7((0.4,0.5,0.5,0.6)=(0.5,0.6,0.7,0.8)) | 1.12737 | 1.05933 | 0.31750 | −0.11497 | −0.45948 | −0.65147 | −1.27827 | A1 > A2 > A3 > A4 > A5 > A6 > A7 |
| E12 | wA1:A7((0.4,0.5,0.5,0.6)=(0.2,0.3,0.4,0.5)) | 1.06432 | 0.96907 | 0.34668 | −0.11163 | −0.40794 | −0.62704 | −1.23347 | A1 > A2 > A3 > A4 > A5 > A6 > A7 |
| E13 | wA1:A7((0.4,0.5,0.5,0.6)=(0.1,0.2,0.2,0.3)) | 1.05605 | 0.94646 | 0.36518 | −0.11078 | −0.39451 | −0.62985 | −1.23254 | A1 > A2 > A3 > A4 > A5 > A6 > A7 |
| E14 | wA1:A7((0.4,0.5,0.5,0.6)=(0,0,0.1,0.2) | 1.06607 | 0.94076 | 0.39429 | −0.11112 | −0.38725 | −0.64799 | −1.25477 | A1 > A2 > A3 > A4 > A5 > A6 > A7 |
| E15 | wA1:A7(=(0.2,0.3,0.4,0.5)) | 0.57698 | 0.56218 | 0.16274 | −0.04127 | −0.22970 | −0.33638 | −0.69455 | A1 > A2 > A3 > A4 > A5 > A6 > A7 |
| E16 | wA1:A7(=(0.1,0.2,0.2,0.3)) | 0.34833 | 0.33500 | 0.10000 | −0.02667 | −0.13167 | −0.20333 | −0.42167 | A1 > A2 > A3 > A4 > A5 > A6 > A7 |
| di+ | di− | CCi | Rank | di+ | di− | CCi | Rank | ||
|---|---|---|---|---|---|---|---|---|---|
| A1 | 0.3015 | 0.3155 | 0.5113 | 1 | A1 | 0.3806 | 0.5092 | 0.5722 | 1 |
| A2 | 0.3322 | 0.3376 | 0.5040 | 2 | A2 | 0.4217 | 0.4993 | 0.5422 | 2 |
| A3 | 0.4483 | 0.3893 | 0.4647 | 3 | A3 | 0.5225 | 0.4569 | 0.4665 | 3 |
| A4 | 0.4594 | 0.3210 | 0.4113 | 5 | A4 | 0.4808 | 0.4034 | 0.4562 | 4 |
| A5 | 0.4372 | 0.2956 | 0.4034 | 6 | A5 | 0.7323 | 0.5211 | 0.4158 | 6 |
| A6 | 0.4381 | 0.3234 | 0.4247 | 4 | A6 | 0.5651 | 0.4111 | 0.4211 | 5 |
| A7 | 0.6866 | 0.3122 | 0.3126 | 7 |
Disclaimer/Publisher’s Note: The statements, opinions and data contained in all publications are solely those of the individual author(s) and contributor(s) and not of MDPI and/or the editor(s). MDPI and/or the editor(s) disclaim responsibility for any injury to people or property resulting from any ideas, methods, instructions or products referred to in the content. |
© 2023 by the authors. Licensee MDPI, Basel, Switzerland. This article is an open access article distributed under the terms and conditions of the Creative Commons Attribution (CC BY) license (https://creativecommons.org/licenses/by/4.0/).
Share and Cite
Bhola, P.; Chronis, A.-G.; Kotsampopoulos, P.; Hatziargyriou, N. Business Model Selection for Community Energy Storage: A Multi Criteria Decision Making Approach. Energies 2023, 16, 6753. https://doi.org/10.3390/en16186753
Bhola P, Chronis A-G, Kotsampopoulos P, Hatziargyriou N. Business Model Selection for Community Energy Storage: A Multi Criteria Decision Making Approach. Energies. 2023; 16(18):6753. https://doi.org/10.3390/en16186753
Chicago/Turabian StyleBhola, Prabha, Alexandros-Georgios Chronis, Panos Kotsampopoulos, and Nikos Hatziargyriou. 2023. "Business Model Selection for Community Energy Storage: A Multi Criteria Decision Making Approach" Energies 16, no. 18: 6753. https://doi.org/10.3390/en16186753
APA StyleBhola, P., Chronis, A.-G., Kotsampopoulos, P., & Hatziargyriou, N. (2023). Business Model Selection for Community Energy Storage: A Multi Criteria Decision Making Approach. Energies, 16(18), 6753. https://doi.org/10.3390/en16186753