1. Introduction
Coal is a flammable rock containing more than 50% by weight organic matter (carbon) and 70% by volume carbonaceous matter with inherent moisture, formed by alteration and compaction of plant remains [
1,
2]. Coal is one of the most widely used fossil fuels worldwide due to its vast availability and affordable price. It contributes to over 26% of the world’s energy demand, and nearly 41% of the electricity produced worldwide comes from coal-fired power plants [
3,
4]. Even though coal resources are dispersed unevenly around the world, the United States (23.3%), the Russian Federation (15.2%), China (13.2%), Australia (13.9%), and India (9.9%) collectively own about 75% of the world’s total coal reserves [
5]. Coal is mined in all the provinces of Pakistan; the total coal reserves of Pakistan are 185.5 billion tons, of which nearly 123 million tons occur in Khyber Pakhtunkhwa Province [
6,
7]. Even though these resources are said to exist, the Pakistani government has not given proper attention to coal.
According to some earlier studies, the Potwar Regional Framework Assessment Project (PRFAP) and the Coal Resources Exploration and Assessment Program (COALREAP), a joint study by the US Geological Survey (USGS) and the Geological Survey of Pakistan (GSP), both assessed regional geologic studies of the coal-bearing areas in northern Pakistan [
8]. Ur Rehman et al. (2016) [
9] described the combustion perspectives of Pakistani coals from the Salt Range and Trans Indus Range, where more recent detailed research on regional geology and coal resources of the Salt Range and Trans Indus Range was reported in the Coal Resource Report (Snowden, 2012). Sajid et al. (2020) [
10,
11] documented the detailed geochemistry of coal from the Salt Range coal mines. Khan et al. (2022) [
12] worked on the geochemical and geophysical investigation of Dara Adamkhel coal, Northwest Pakistan.
Geophysical methods for investigating and studying coal mining were introduced in the 1970s. Many countries, such as the United States, Australia, India, and China, have used geophysical techniques for coal exploration [
13,
14,
15]. However, limited geophysical work has been reported from coal seams inside the Paleocene Hangu Formation in Pakistan [
12]. The geophysical and chemical characteristics of the coal deposits in Pakistan have not been thoroughly examined or documented in the literature that is currently accessible. This study aims to provide support for the utilization of indigenous coal resources in Khyber Pakhtunkhwa in particular and in Pakistan in general by applying geophysical and geochemical methods to the coalfield in Tirah.
Two-dimensional electrical resistivity imaging and ground penetrating radar (GPR) were the geophysical techniques for investigating subsurface coal seams. The geochemical properties (proximate and ultimate analyses) of coal help to establish coal ranks, which act as a basis for coal usage in power plant operations [
16]. The results of this study may be used to develop the local coal reserve sector and small to medium-sized power plants.
Currently, conventional drilling techniques, 1D resistivity geophysical methods, and geochemical analysis of coal samples are performed as individual tools to determine geochemistry and delineate the coal seams in the study area as well as in Pakistan, which is costly as well as time-consuming. This work presents the introduction of non-invasive geophysical techniques in combination with geochemical techniques for coal seam delineation in Pakistan. This study is novel and will attract stakeholders to reduce drilling costs.
2. Geological Setting
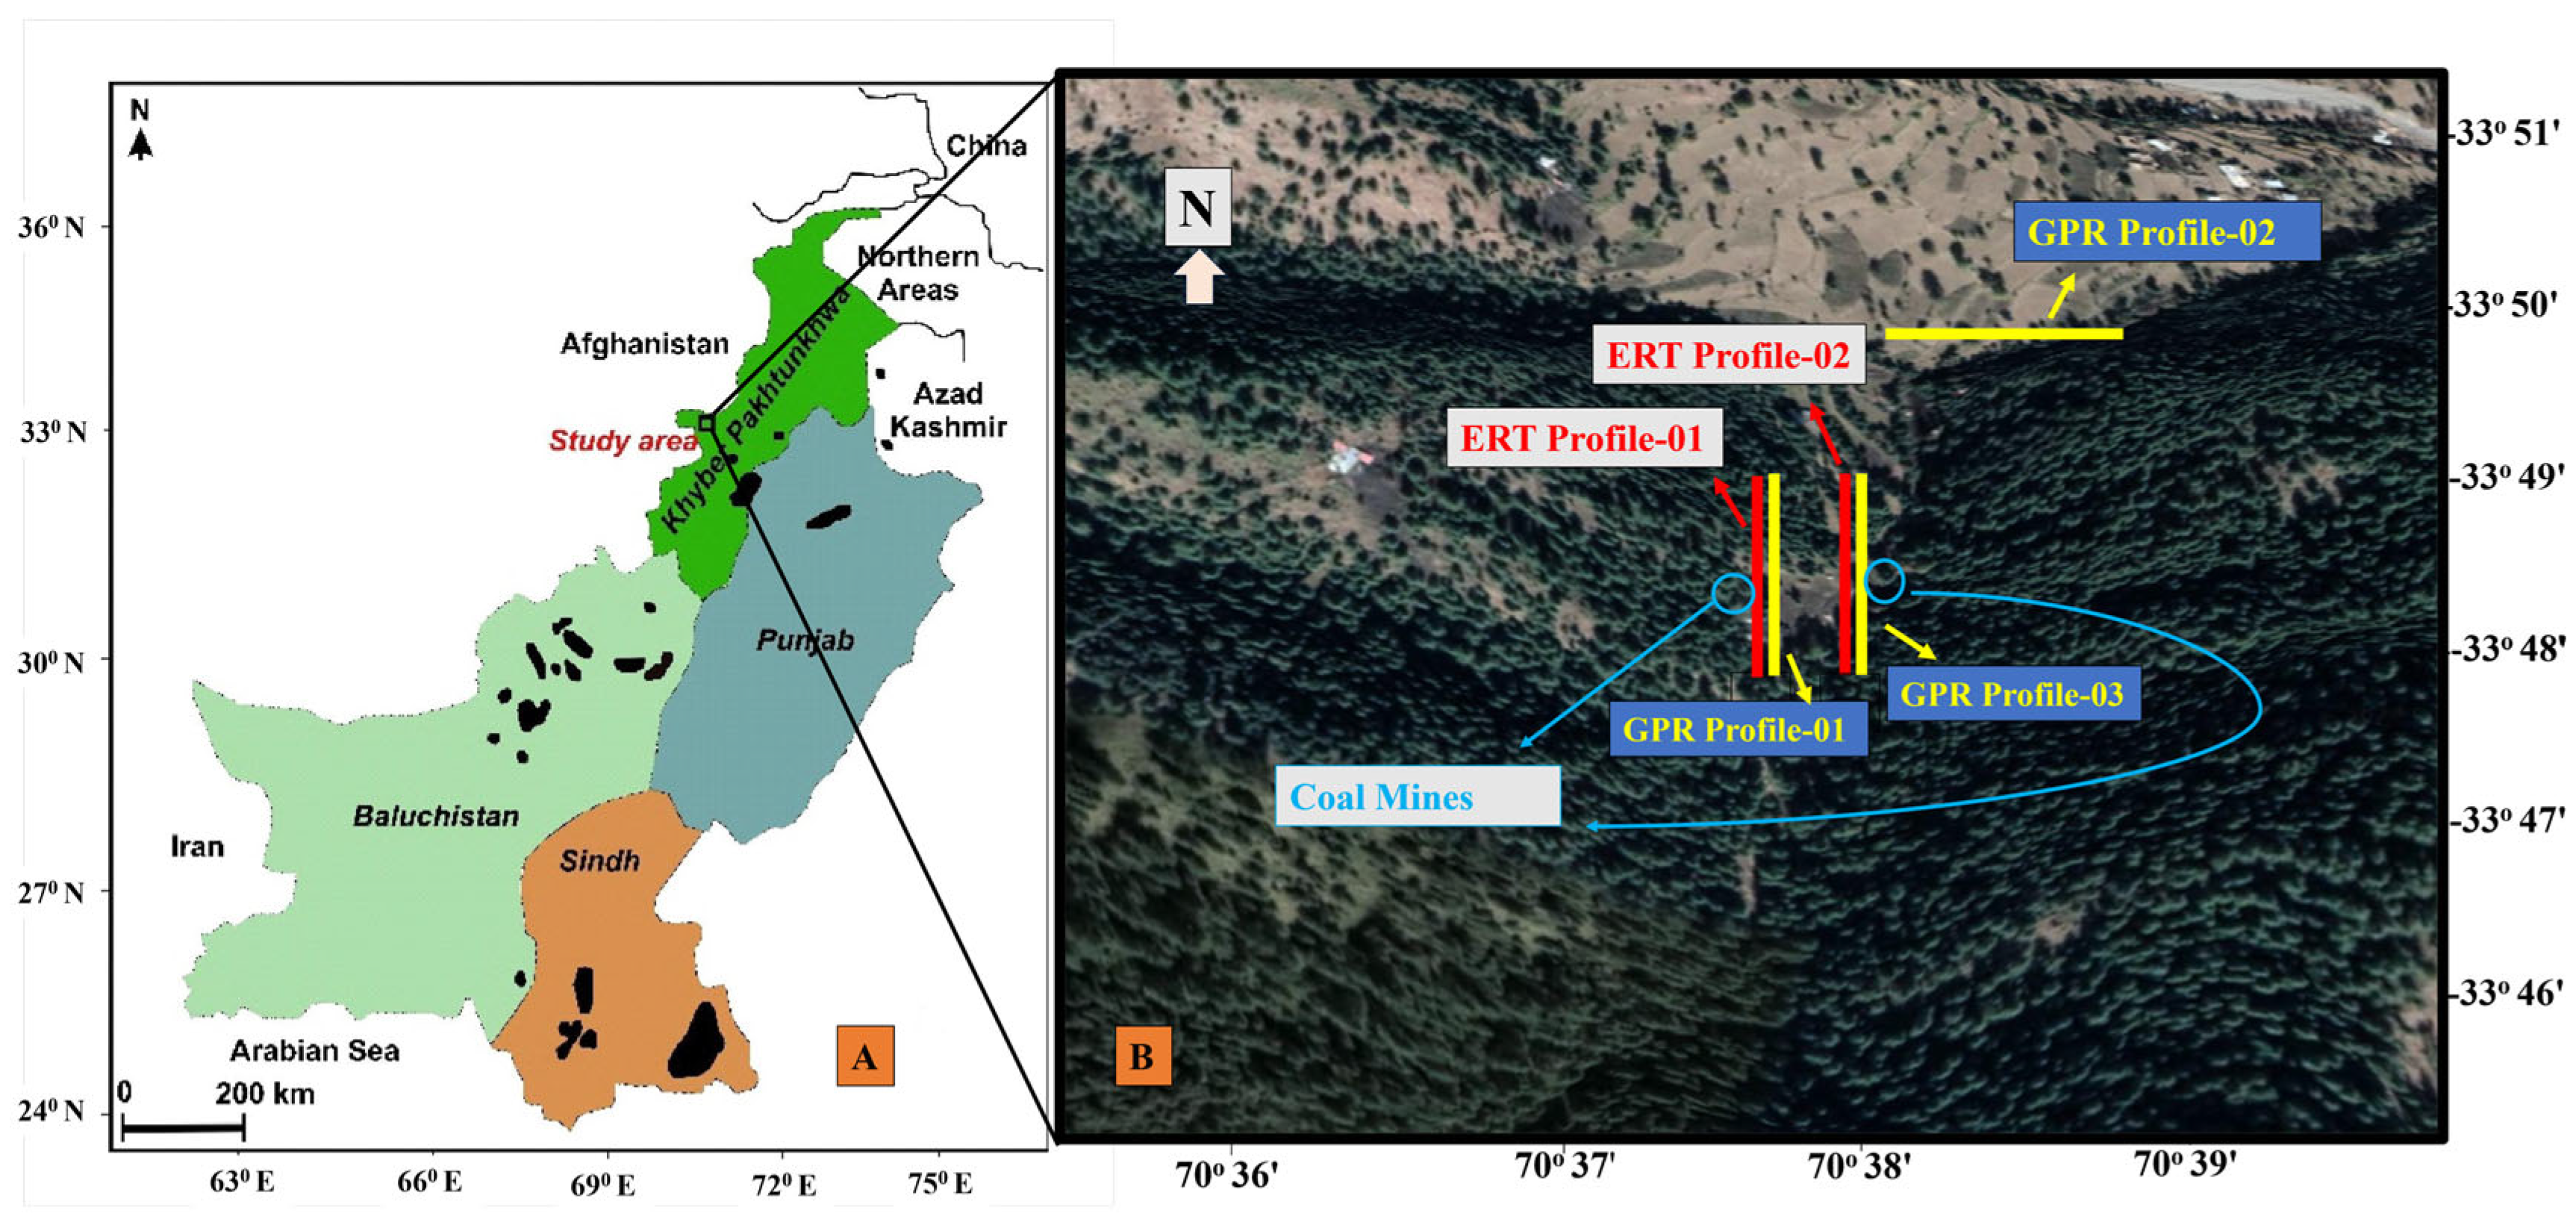
The study area under investigation is located within the Lesser Himalaya in the northwestern part of Pakistan (
Figure 1A). The study area comprises two tectonic domains, where the Khyber Block lies in the north and the Samana Block in the south. The Tirah territory is mostly a mountainous area and consists of four major mountain ranges that run parallel to each other in an east-west direction. These mountains are separated by narrow and elongated troughs. The orders from north to south are the eastern portion of the Torghar Range and the western part of the Torghar, Tsapper, and Samana ranges, respectively [
17].
The structural investigation of the Tirah Maidan and part of the Orakzai Agency explains the highly deformed, south-propagating structural style of the study area. The tectonic configuration of the area has been interpreted as maximum stress with the resultant shortening along the NS direction, where the maximum stress is resolved into repeated thrusting and partly overturning of the resultant structures [
18].
The Tirah Range is the western continuation of the Samana Range [
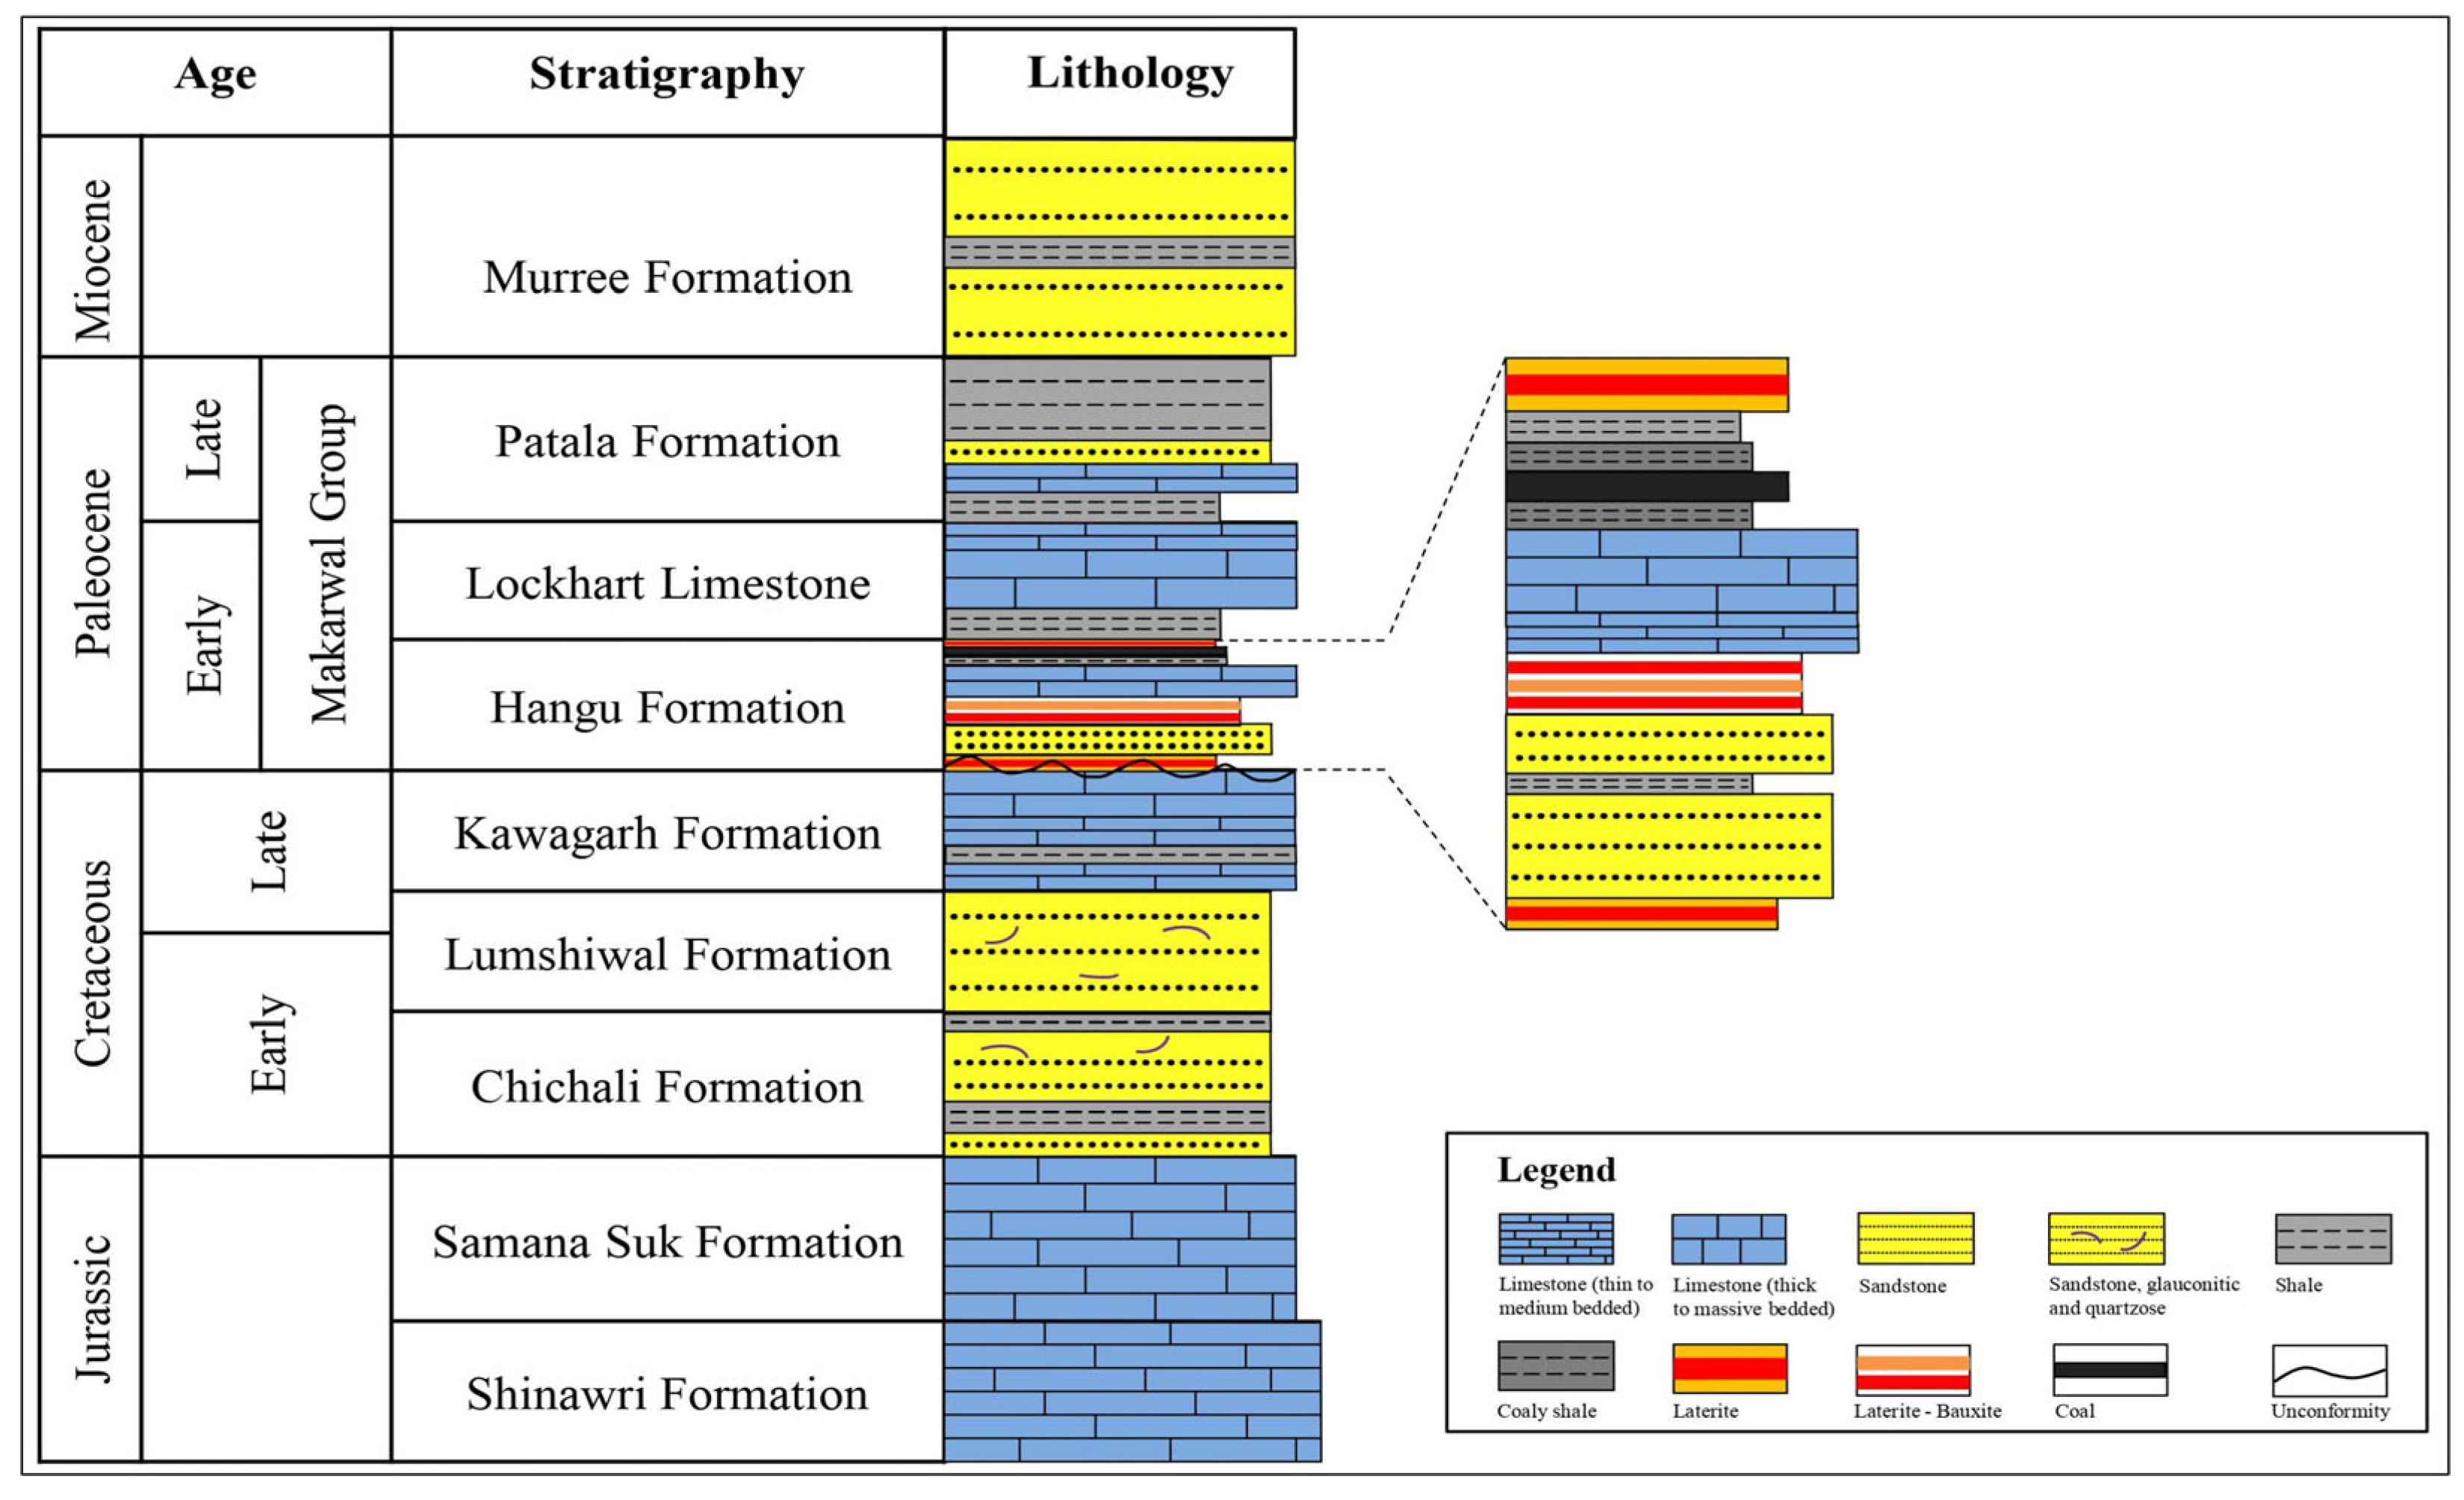
19]. Stratigraphically, the Samana Range comprises different lithostratigraphic units, ranging in age from Jurassic to Miocene (
Figure 2). The Jurassic-age rocks, namely the Shinawari Formation and Samana Suk Formation, exhibit variation in thickness and lithology and consist predominantly of limestone, sandstone, shale, and mudstone. The Cretaceous units are the Chichali Formation, Lumshiwal Formation, and Kawagarh Formation, mainly comprised of Calcareous shale, sandstone, and limestone. The tertiary sequence included the Hangu Formation, Lockhart Limestone, Patala Formation, and Murree Formation, composed of sandstone with coal seams, limestone, shale basal conglomerate and sandstone, and red clays and shale [
20].
Figure 1B displays the geophysical profiles (ERT, GPR, and coal mine locations) that were taken into consideration for this investigation.
3. Methodology
Geophysical and geochemical studies are used in this study. Geophysical profiles are shown in
Figure 1B. These techniques are briefly described in the following sub-sections.
3.1. Geophysical Studies
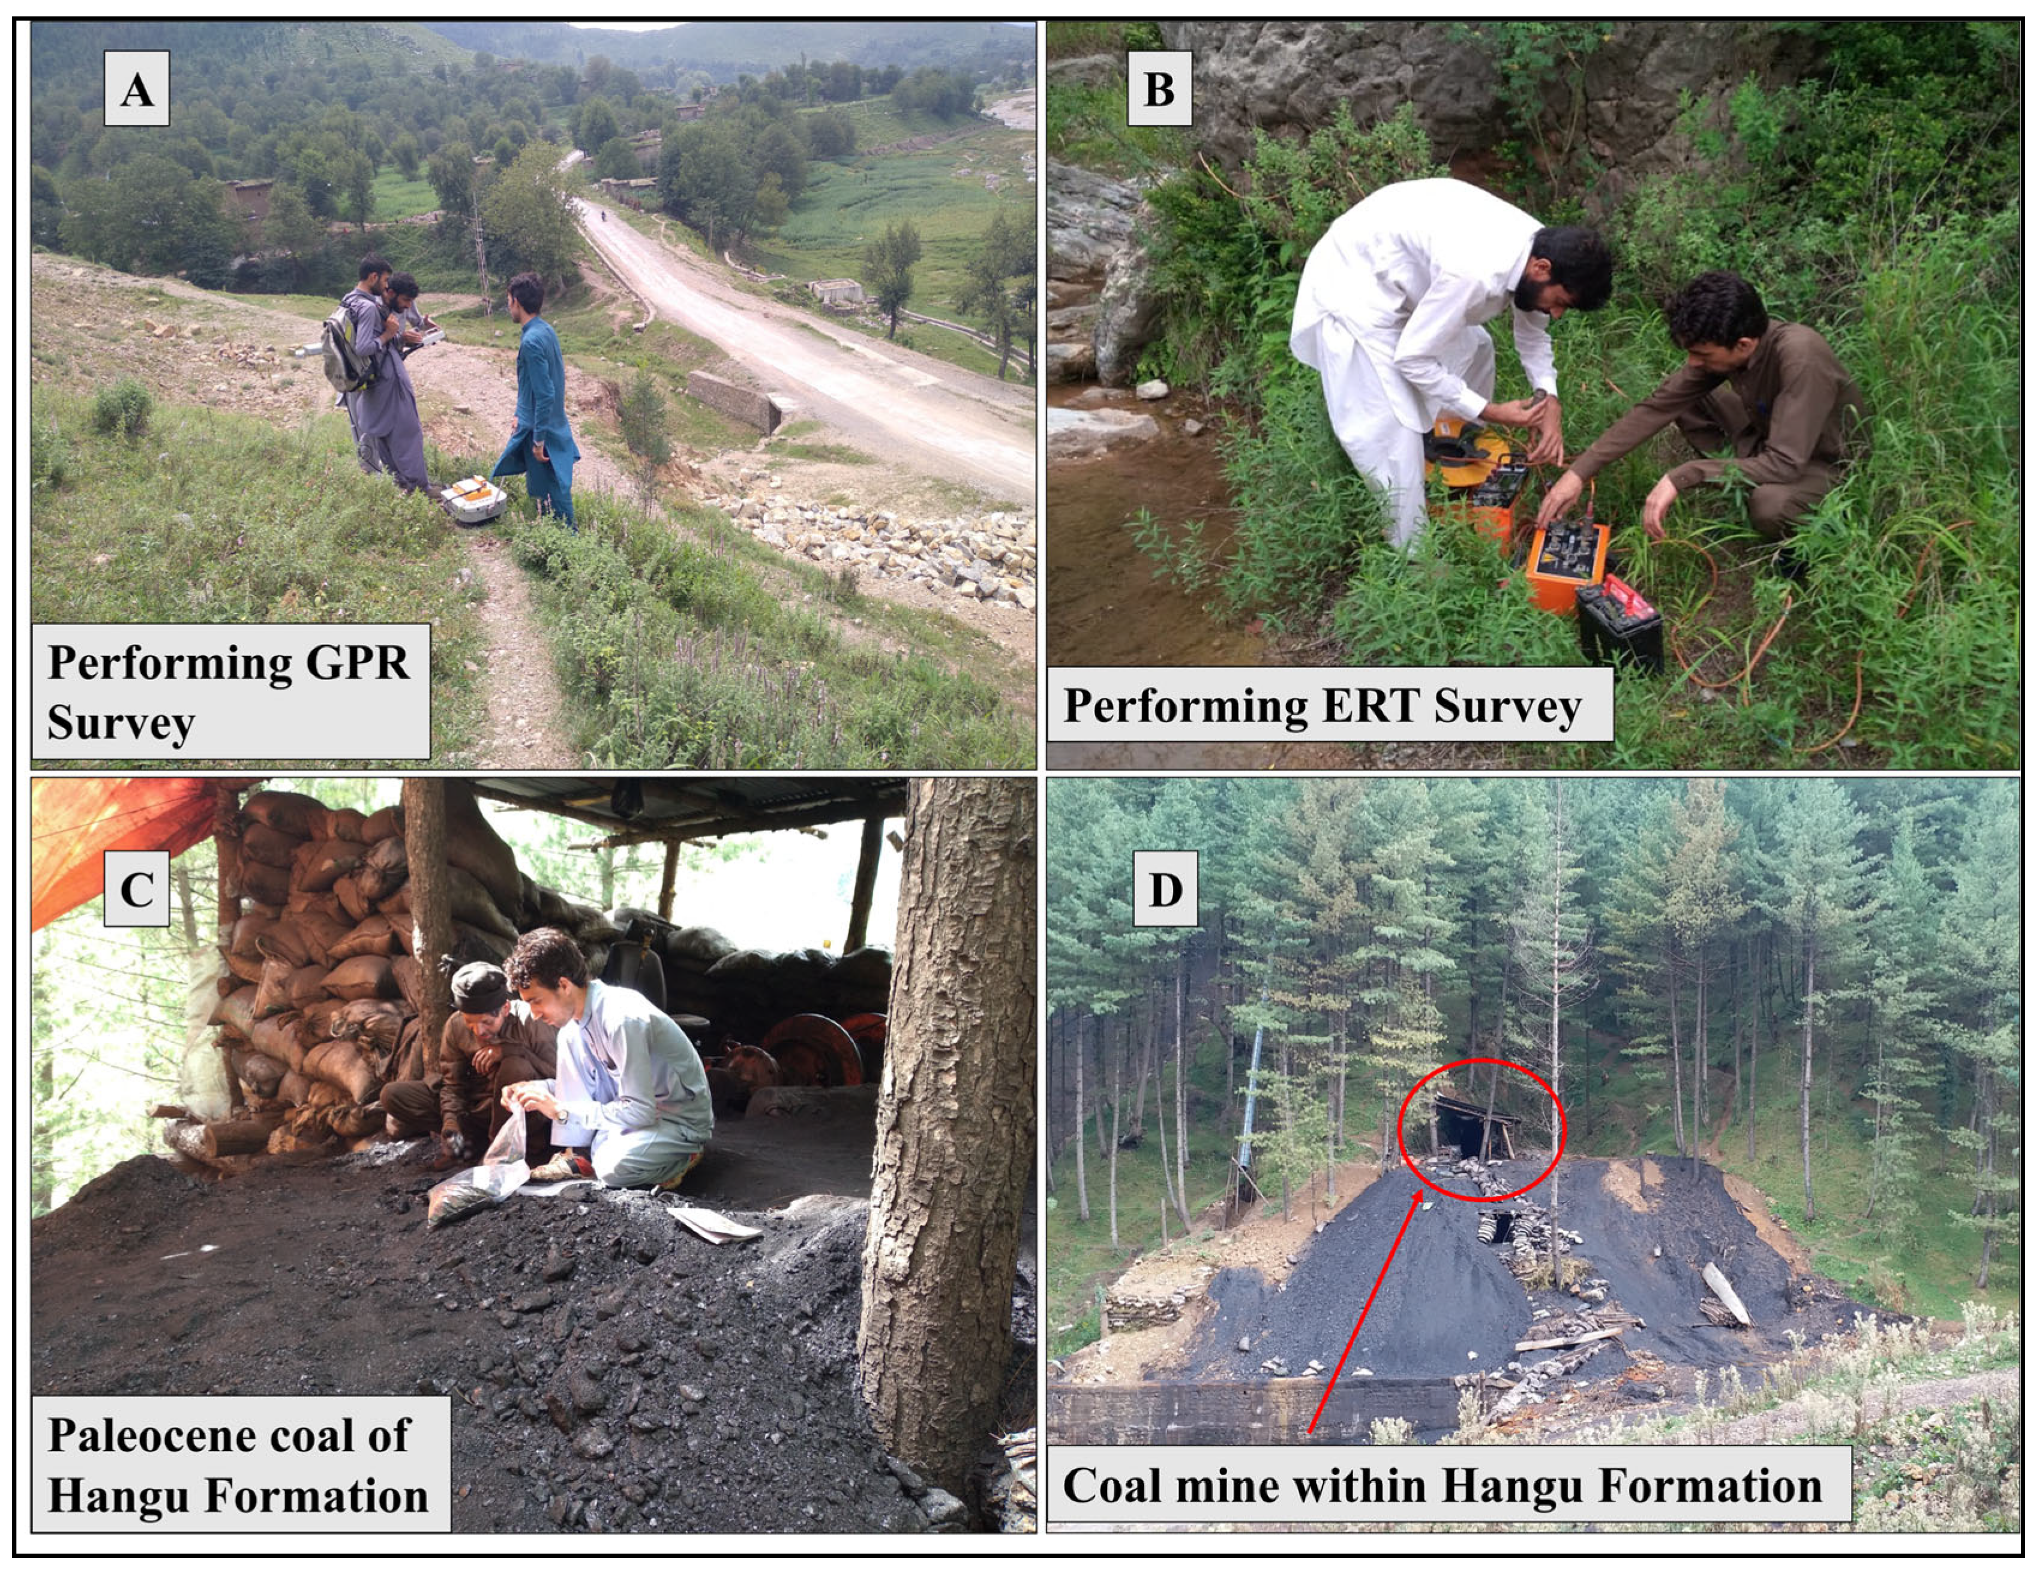
To delineate the subsurface coal seams, geophysical surveys such as ERT and GPR were conducted. Two ERT profiles (ERT Profile-01 and ERT Profile-02) were acquired adjacent to the mines. ERT profiles were acquired using the ABEM Terrameter (SAS 1000/4000) (
Figure 3). The Wanner–Schlumberger configuration with 2 m electrode spacing was used because it provides high depth of investigation and sensitivity to both horizontal and vertical structures as compared to other profiles. The total length of the profile was 160 m, hence the maximum penetration depth, which may be estimated at about 30 m.
After data acquisition, the Res2DInv software was used for data processing and inversion [
21,
22]. Yang (1999) and Loke and Barker (1996) [
22,
23] provide excellent descriptions of the inversion algorithm. After the data inversion, the available lithological log data and geological cross section were compared with the coal boundaries deduced from the resistivity tomograms.
Three GPR profiles (GPR Profile-01, GPR Profile-02, and GPR Profile-03) were conducted (
Figure 1B). This profile location was chosen in an effort to minimize the inaccuracy and noise caused by the presence of the nearby existing water channel and vegetation.
GPR data were collected in continuous mode using the MALÅ RTA 50 MHz central frequency system (
Figure 3). The depth of penetration is high for this low-frequency antenna. The data were processed using the Rad Explorer 1.41 software by adjusting various processing parameters, such as “zero-time adjustment (static shift)” to eliminate offset time [
24,
25,
26,
27], “background removal filter” to eliminate average trace to eliminate banding, and “horizontal (distance) stretch A”. “Butterworth frequency filter” with an upper limit of 200 MHz and a lower limit of 12.5 MHz was specified in the processing routine to filter out undesirable high and/or low frequencies [
28,
29]. By moving back to their original position and setting a coal velocity of 0.14 m/ns in the “Stolt F-K Migration” tool, the form of the reflectors and the actual positions of the reflecting limits were restored [
30]. In the last phase, a “deconvolution tool” was used to eliminate the influences of the surface wavelet in order to better understand GPR profiles as an image of the Earth’s subsurface [
31,
32].
3.2. Chemical Analysis
3.2.1. Sample Location and Preparation
Fieldwork and laboratory analysis were carried out for coal evaluation using different international standards and methods developed by various associations. This study uses the American Society for Testing and Materials (ASTM) standardization of methods for coal analysis [
33,
34]. A total of eight fresh coal samples were collected from different mines in the Tirah area. A plastic bag with a zip lock was used to collect 5 kg of samples, and details such as the depth, coal seam, and location were individually noted. The ASTM D-2013 standard [
35] preparation methods were followed in order to prepare the coal samples [
36]. Samples for the chemical analyses (proximate and ultimate) were ground to a mesh size of 200 and dried in a desiccator for 12 h.
3.2.2. Proximate and Ultimate Analyses
The proximate analysis (moisture, volatile matter, ash, and fixed carbon) was assessed using the ASTM D5142-04 standard techniques on coal samples [
37,
38]. The statistics for moisture content, ash, volatile matter, and fixed carbon were calculated using the formulae shown below [
39]:
where
MC = moisture content;
VM = volatile matter;
AC = ash;
In the ultimate analysis, a coal sample is combusted to determine the weight percentage of carbon, hydrogen, and nitrogen, while sulfur and oxygen are determined using Speight’s technique [
39]. For the ultimate analysis and testing procedures, the ASTM D3176-89 standards [
40] are extensively discussed [
38,
41]. In
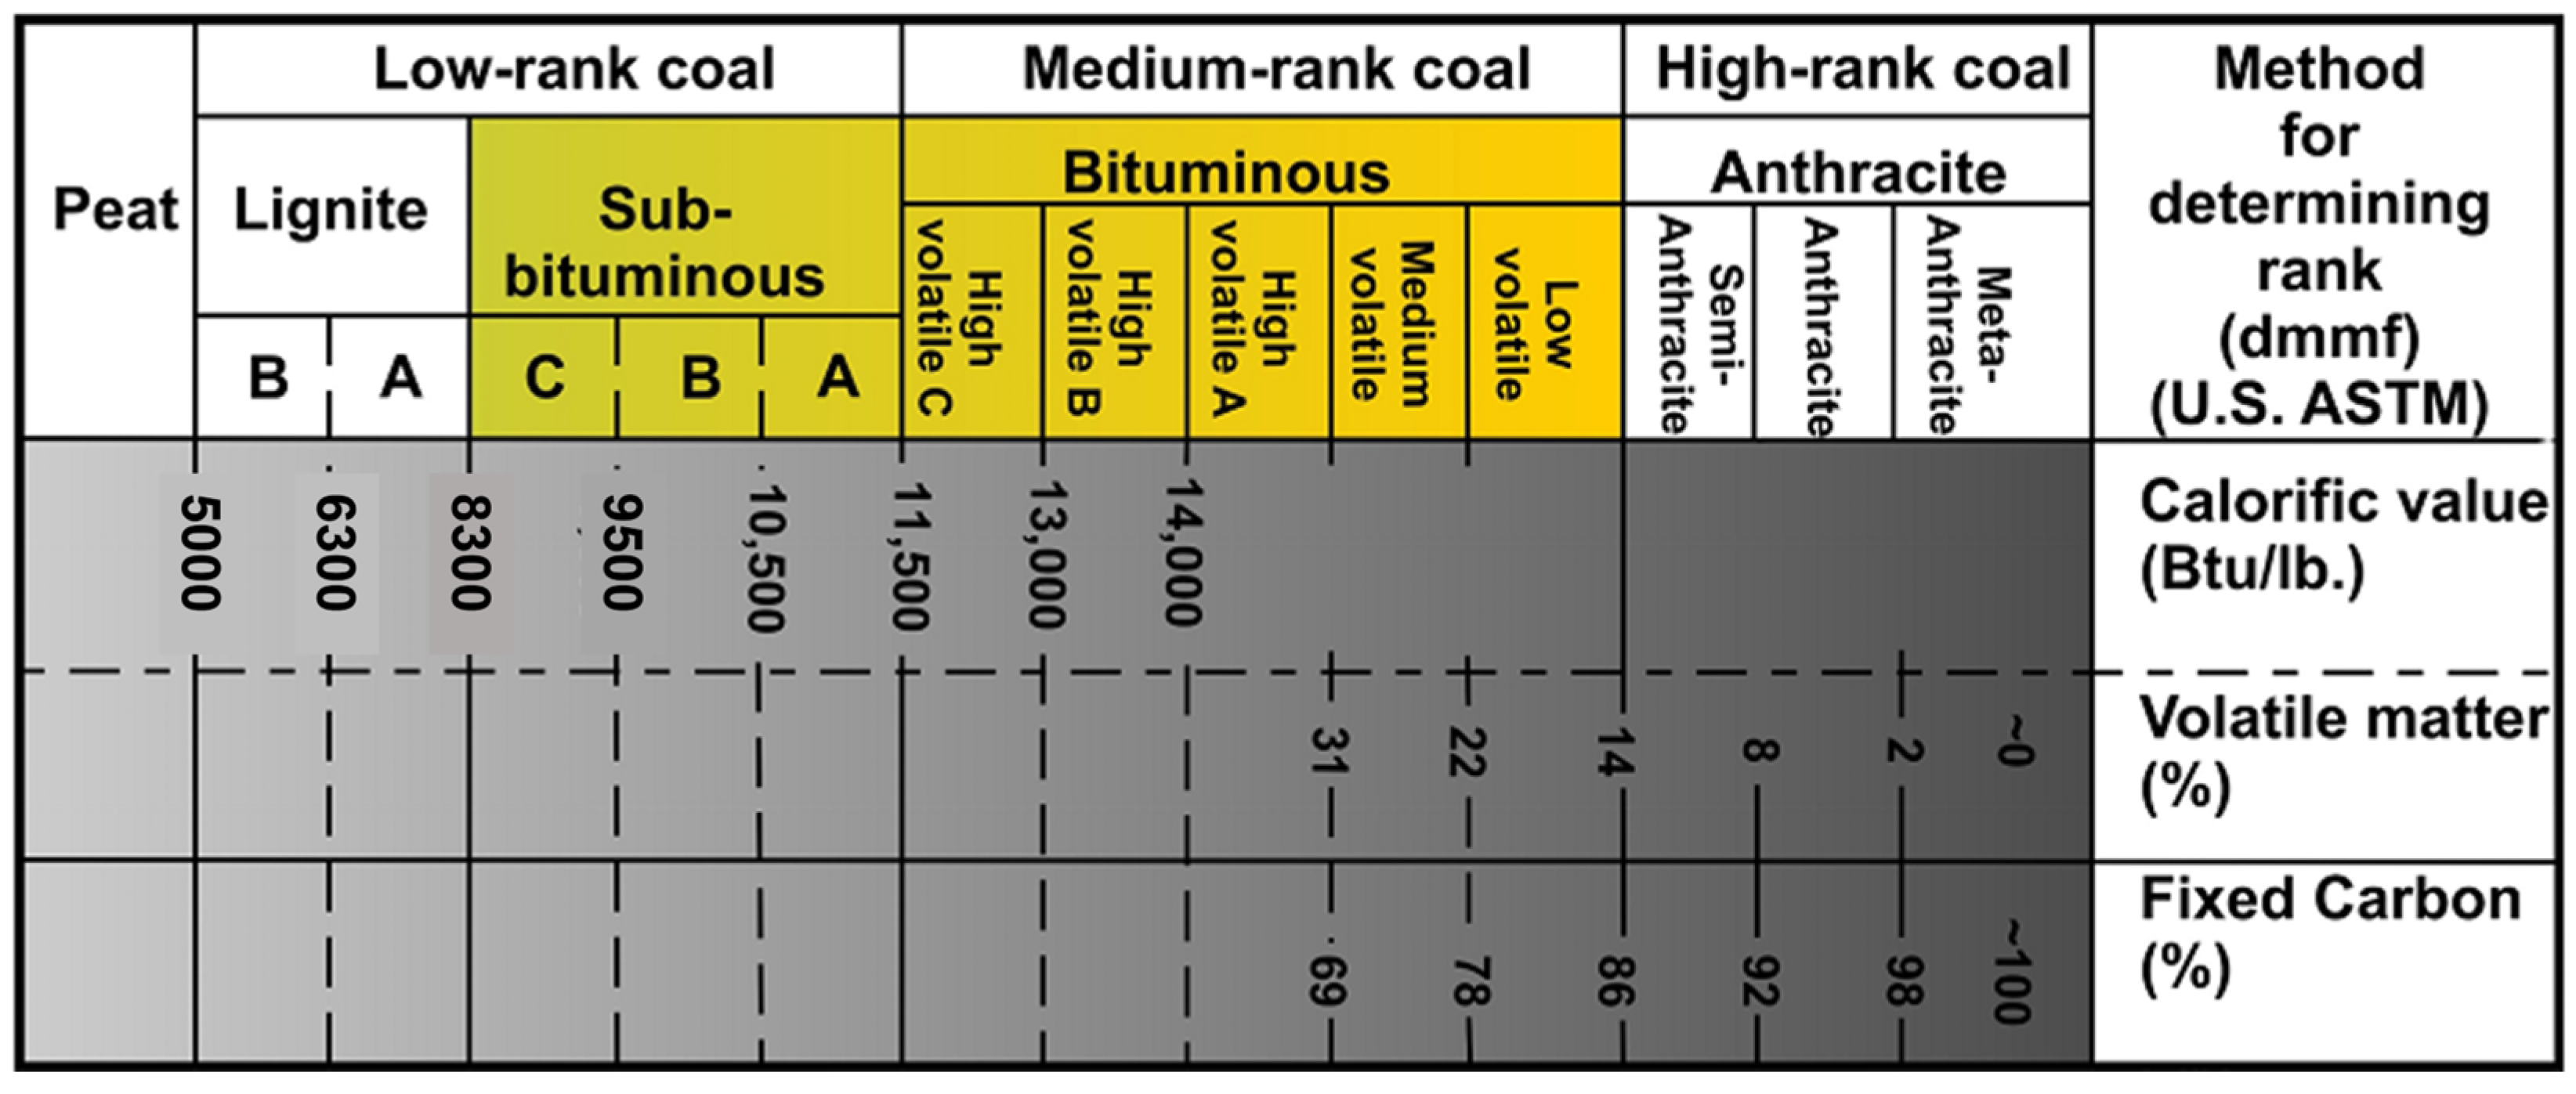
Figure 4, a graph chart illustrating the parameters that were chosen in order to rank coal is shown.
4. Results and Discussion
4.1. Geophysical Investigation
The resistivity method is one of the most widely used and helpful methods for determining the electrical properties of subsurface materials. Every material has its own resistivity values, and variations in resistivity values are used to interpret the lithology. Electrical resistivity imaging (ERI) has been proven to be a reliable and helpful method in coal exploration and, afterwards, the exploitation of coal deposits [
42,
43,
44]. From the published data, it is concluded that the coal seams have a resistivity value ranging from 100 Ωm to 800 Ωm [
45,
46,
47].
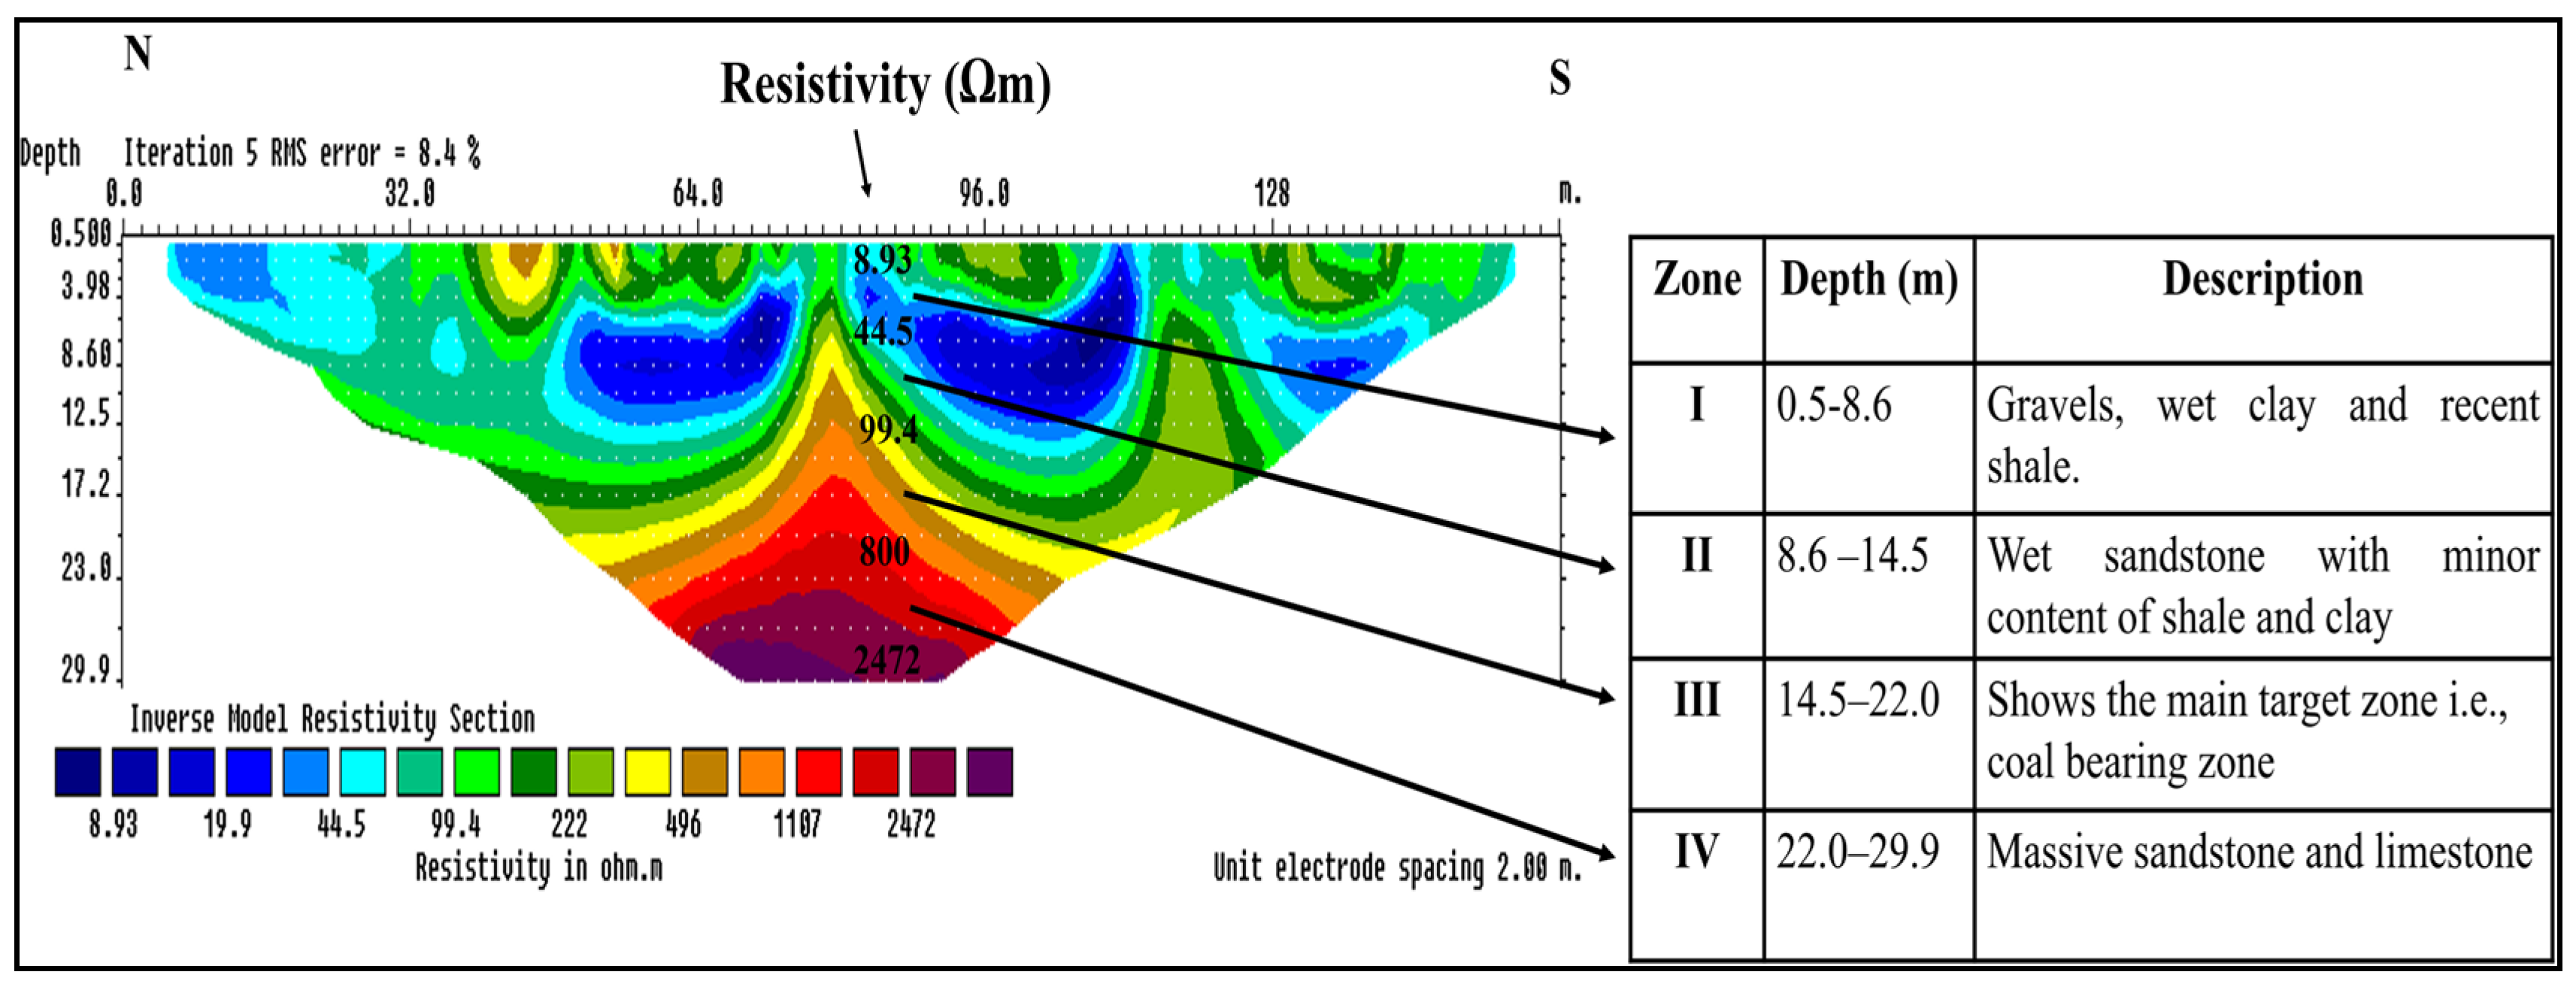
We have employed 2D Electrical Resistivity Tomography (ERT) using the ABEM Terrameter SAS 1000/4000. ERT is carried out along two profiles and was used to create a 2D electrical resistivity image of the subsurface. The resistivity model illustrates variation in the geologic properties of the subsurface in relation to the observed resistivity, with scales revealed at the lower end of the plot that range from 8.93 Ωm to 2472 Ωm. The lateral distance is displayed above the section, while the side bar displays the depth below the surface, with a mean depth of around 30 m (
Figure 5 and
Figure 6).
A MALA-based GPR with 500 MHz and 50 MHz antenna systems was employed to acquire the data. To investigate and locate the lithological units and coal-bearing strata at shallow depth intervals, a MALA GPR survey was conducted along known mines in the Tirah area. Below, we describe the outcomes of both ERT and GPR profiles.
In the following sub-sections, the geophysical results of ERT and GPR methods are discussed.
4.1.1. Electrical Resistivity Tomography (ERT) Results
Two ERT profiles acquired near the mines in the Mastikhel area of Tirah were interpreted and validated via available information about the coal mines.
Result of ERT Profile-01 (Mastikhel, Tirah)
The ERT profile-01 has four separate lithological zones, namely zones I, II, III, and IV, with resistivity values ranging from 8.93 to 2472 Ωm (
Figure 5). Zone-I represents a low resistivity zone, situated at a depth of 0.5–8.6 m and having a resistivity range between 8.93 and 44.5 Ωm. This zone indicates recent gravel, soil, silt, and clay soaked in water. Such a geological layer of mixed gravels and clay at the near surface of a coal mine with a relatively low resistivity has been reported from East China [
48]. The Zone-II shows resistivity values of 44.5–99.4 Ωm, composed of wet sandstone with minor shale and clay content, at about 8.60–14.5 m depth. Similarly, a relatively high resistivity zone, i.e., Zone-III, located at a depth of around 14.5–22.0 m and having a resistivity value ranging from 99.4 to 800 Ωm indicates the target coal-bearing zone. The coal seams are encountered by the surrounding coal mines at the same depth as shown by ERT profile-01. Zone-IV, the high resistivity zone at the base of the ERT section, is located at a depth of 22–30 m. Resistivity values in the range of 800–2472 Ωm indicate the presence of massive sandstone bedding and a limestone unit in the Hangu Formation (
Figure 5).
Result of ERT Profile-02 (Mastikhel, Tirah)
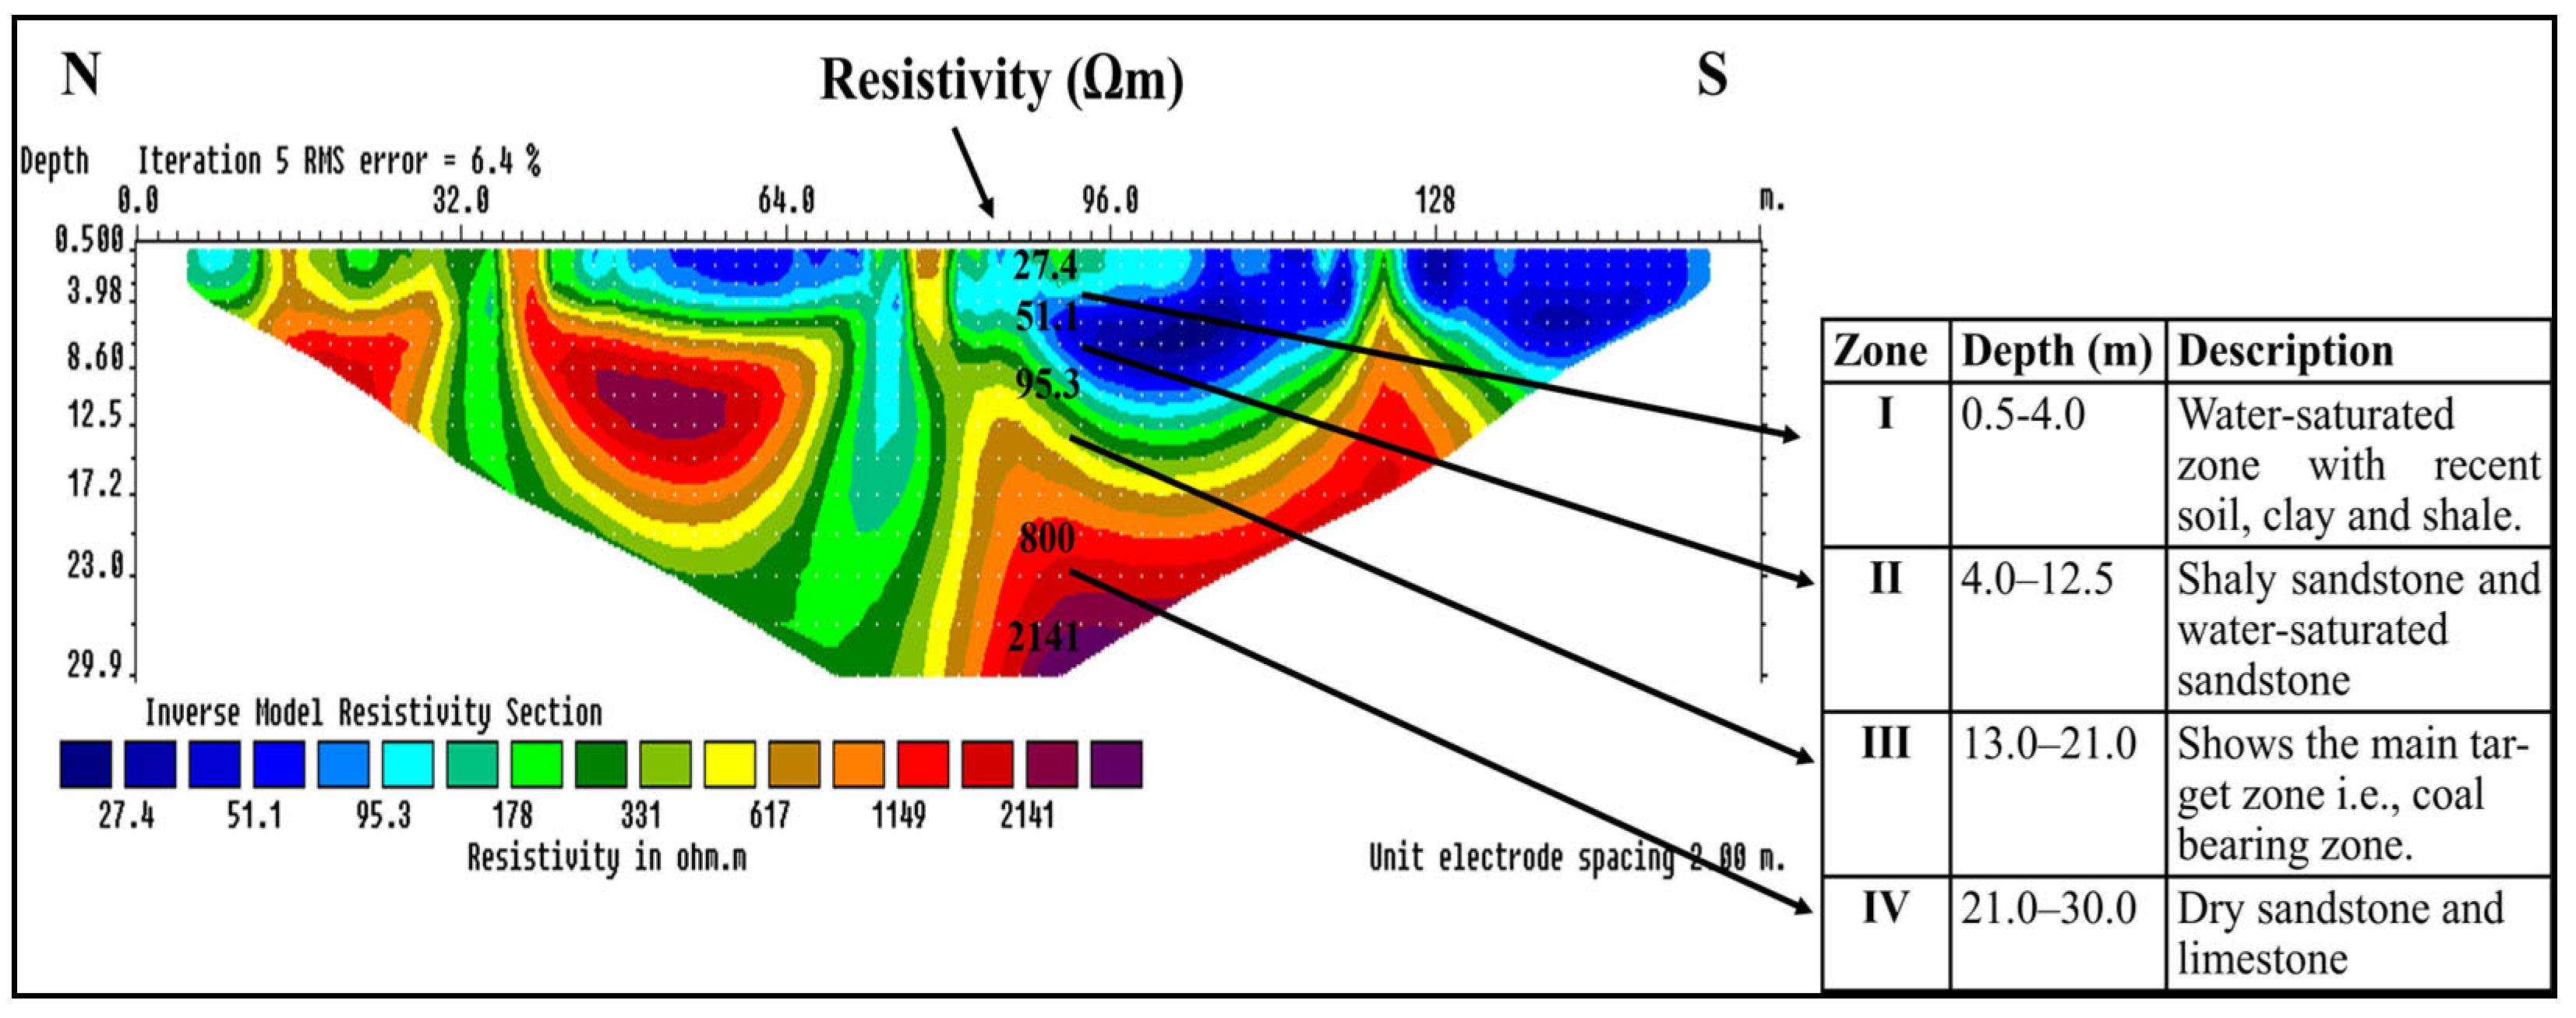
The ERT profile-02 was approximately 78 m long, with resistivity ranges restricted to a range of 27.4 to 2141 Ωm. It was separated into four zones, each of which represents a different geological unit based on differences in the material’s resistivity values (
Figure 6). The resistivity of Zone-I, ranging from 27.4 to 51 Ωm at a depth of about 0.50–4.0 m, shows the water-saturated zone with recent soil, clay, and shaly parts of the Hangu Formation. Zone-II, which is between 4.0 and 27.2 m deep and has resistivity values ranging from 51.1 to 95.3 Ωm, is composed of water-saturated sandstone and sandstone (shaly). The relatively high resistivity zone in this profile, Zone-III, with a resistivity range of 95.3–800 Ωm, is where the main target zone, or coal-bearing zone, can be observed. Zone IV represents the dry sandstone and limestone units of the Hangu Formation and is a zone of high resistivity with a resistivity value ranging from 800 to 2141 Ωm at a depth of around 21.0–30.0 m (
Figure 6).
Resistivity imaging indicates that, when compared to relevant studies concerning coal resistivity values, coal resistivity ranges from 100 Ωm to 800 Ωm [
12,
44,
45,
46]. Therefore, the coal resistivity used in this study ranges from 95 Ωm to 800 Ωm, which is sufficiently comparable to other references.
4.1.2. Ground Penetrating Radar (GPR) Results
In the following sub-sections, the results of three radar profiles are discussed. To accomplish the objective of the geophysical imaging at known sites in the proposed project, GPR experiments were conducted besides the mines whose lithological sequence was known (GPR Profile-01, GPR Profile-03), as well as over the outcropped sections (GPR Profile-02) of coal-bearing units.
Result of GPR Profile-01 (Mastikhel, Tirah)
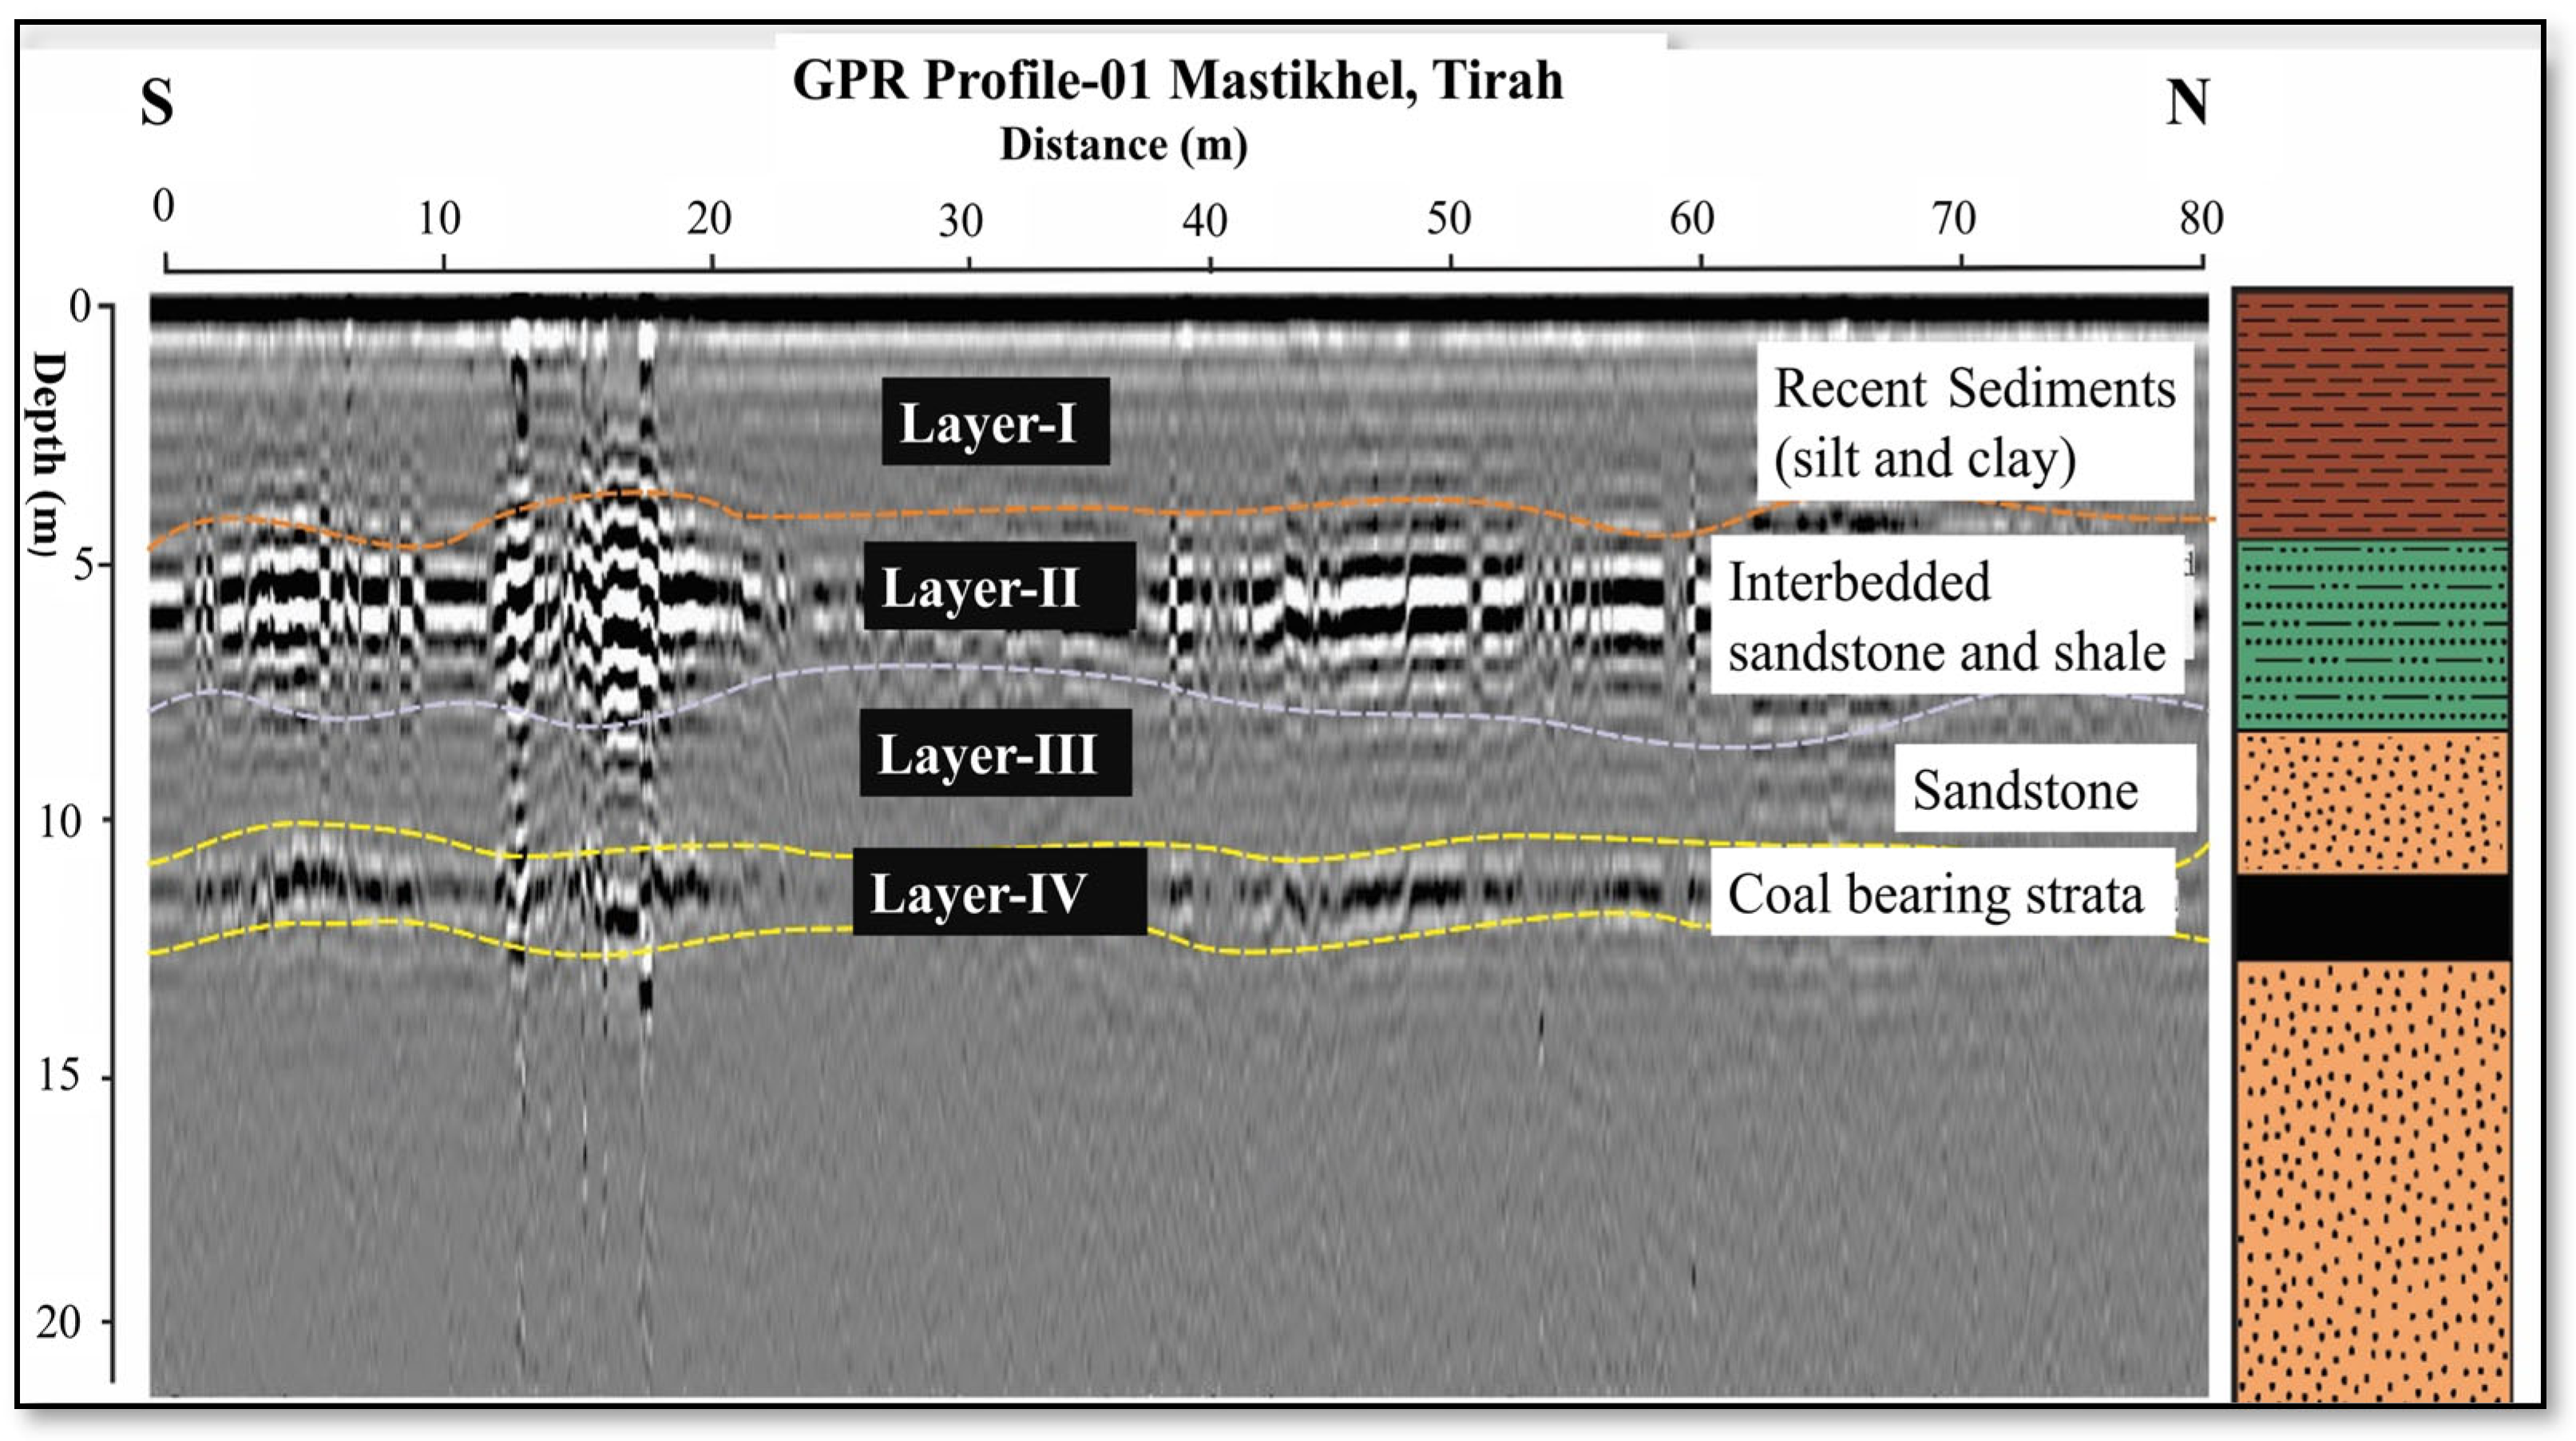
The length of the GPR-01 is 80 m, covering a depth of about 22 m. The orientation of the 50 MHz GPR profile was from south to north, covering a distance of 80 m near mines 01, 02, and 03 in the Mastikhel area of Tirah. The data were subjected to different standard processing techniques.
Figure 7 shows the interpreted GPR data for the GPR-01 profile. The geologic cross section shows detailed lithology and the existence of alternating coal seams at different depth intervals (
Figure 7).
The GPR cross section is divided into five different layers on the basis of reflection variation. i.e., layers I, II, III, and IV. The low reflection is observed in the top 5 m (Layer-I) section, which is because of the highly conductive recent material, silt and clay. Below 5 m, a strong reflector was observed, which could be interbedded shale with sandstone (Layer-II). The thickness of Layer-II is 3 m. Below the interbedded shale with sandstone, a weak reflection stratum was observed, which could be sandstone (Layer-III). Underlying sandstone layer IV consists of coal-bearing strata that show a prominent radar reflection due to the contrast in the physical properties at a depth of about 11 m.
Result of GPR Profile-02 (Lar Bazar, Tirah)
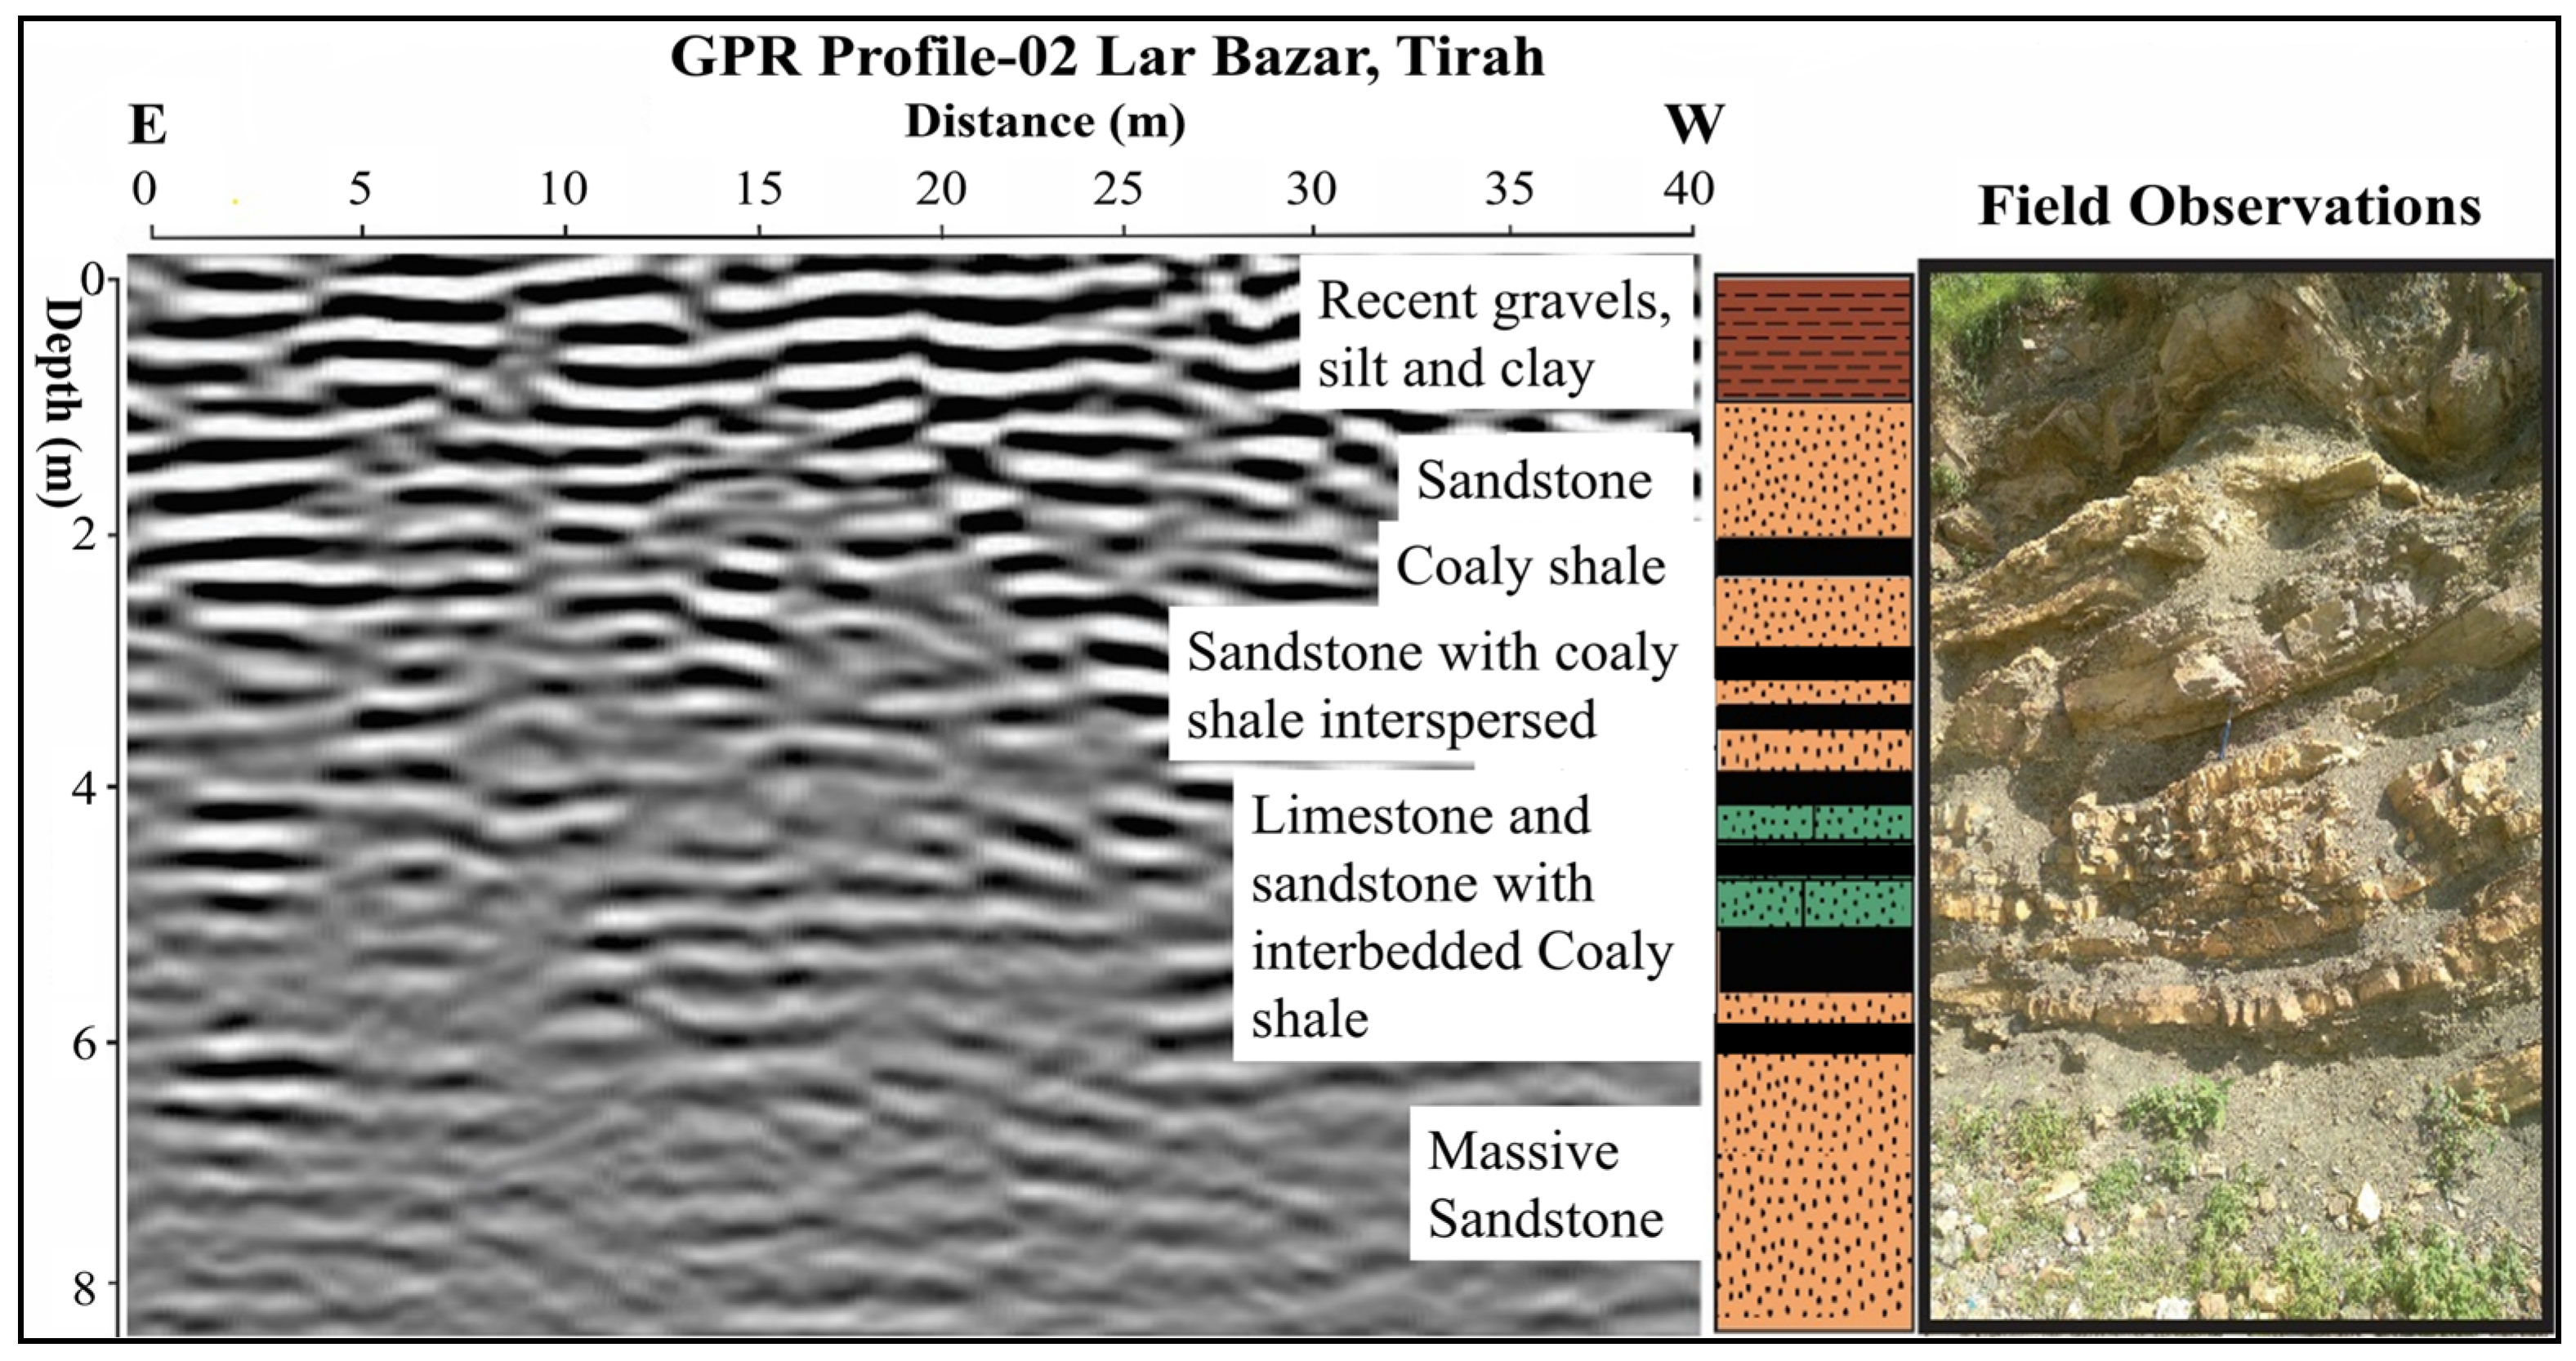
The 500 MHz radar profile (GPR-02) is 40 m in length and has a depth of about 8 m. The GPR data from the GPR-02 profile were analyzed and are shown in
Figure 8. The lithology and the mapped coal seams at a certain depth are shown in the geologic cross section derived from the radar measurements (
Figure 8).
Closely located to the “Lar Bazar” in Tirah is the outcropped section where coal seams of the Hangu Formation were observed in the field (
Figure 8).
Radar measurements along the GPR profile (GPR-02) of 80 m length, oriented from east to west, were conducted. The profile was acquired directly on top of the exposed section to observe the response of electromagnetic waves to recent sediments (gravels, silt, and clay), sandstone, limestone, and coaly shale. Through the use of GPR, the strong reflection from the top 1 m is because of recent deposits. The high conductive nature of the clay in the recent deposit attenuates some of the energy, which is why it is difficult to interpret the section after the sandstone with coaly shale formation.
Result of GPR Profile-03 (Mastikhel, Tirah)
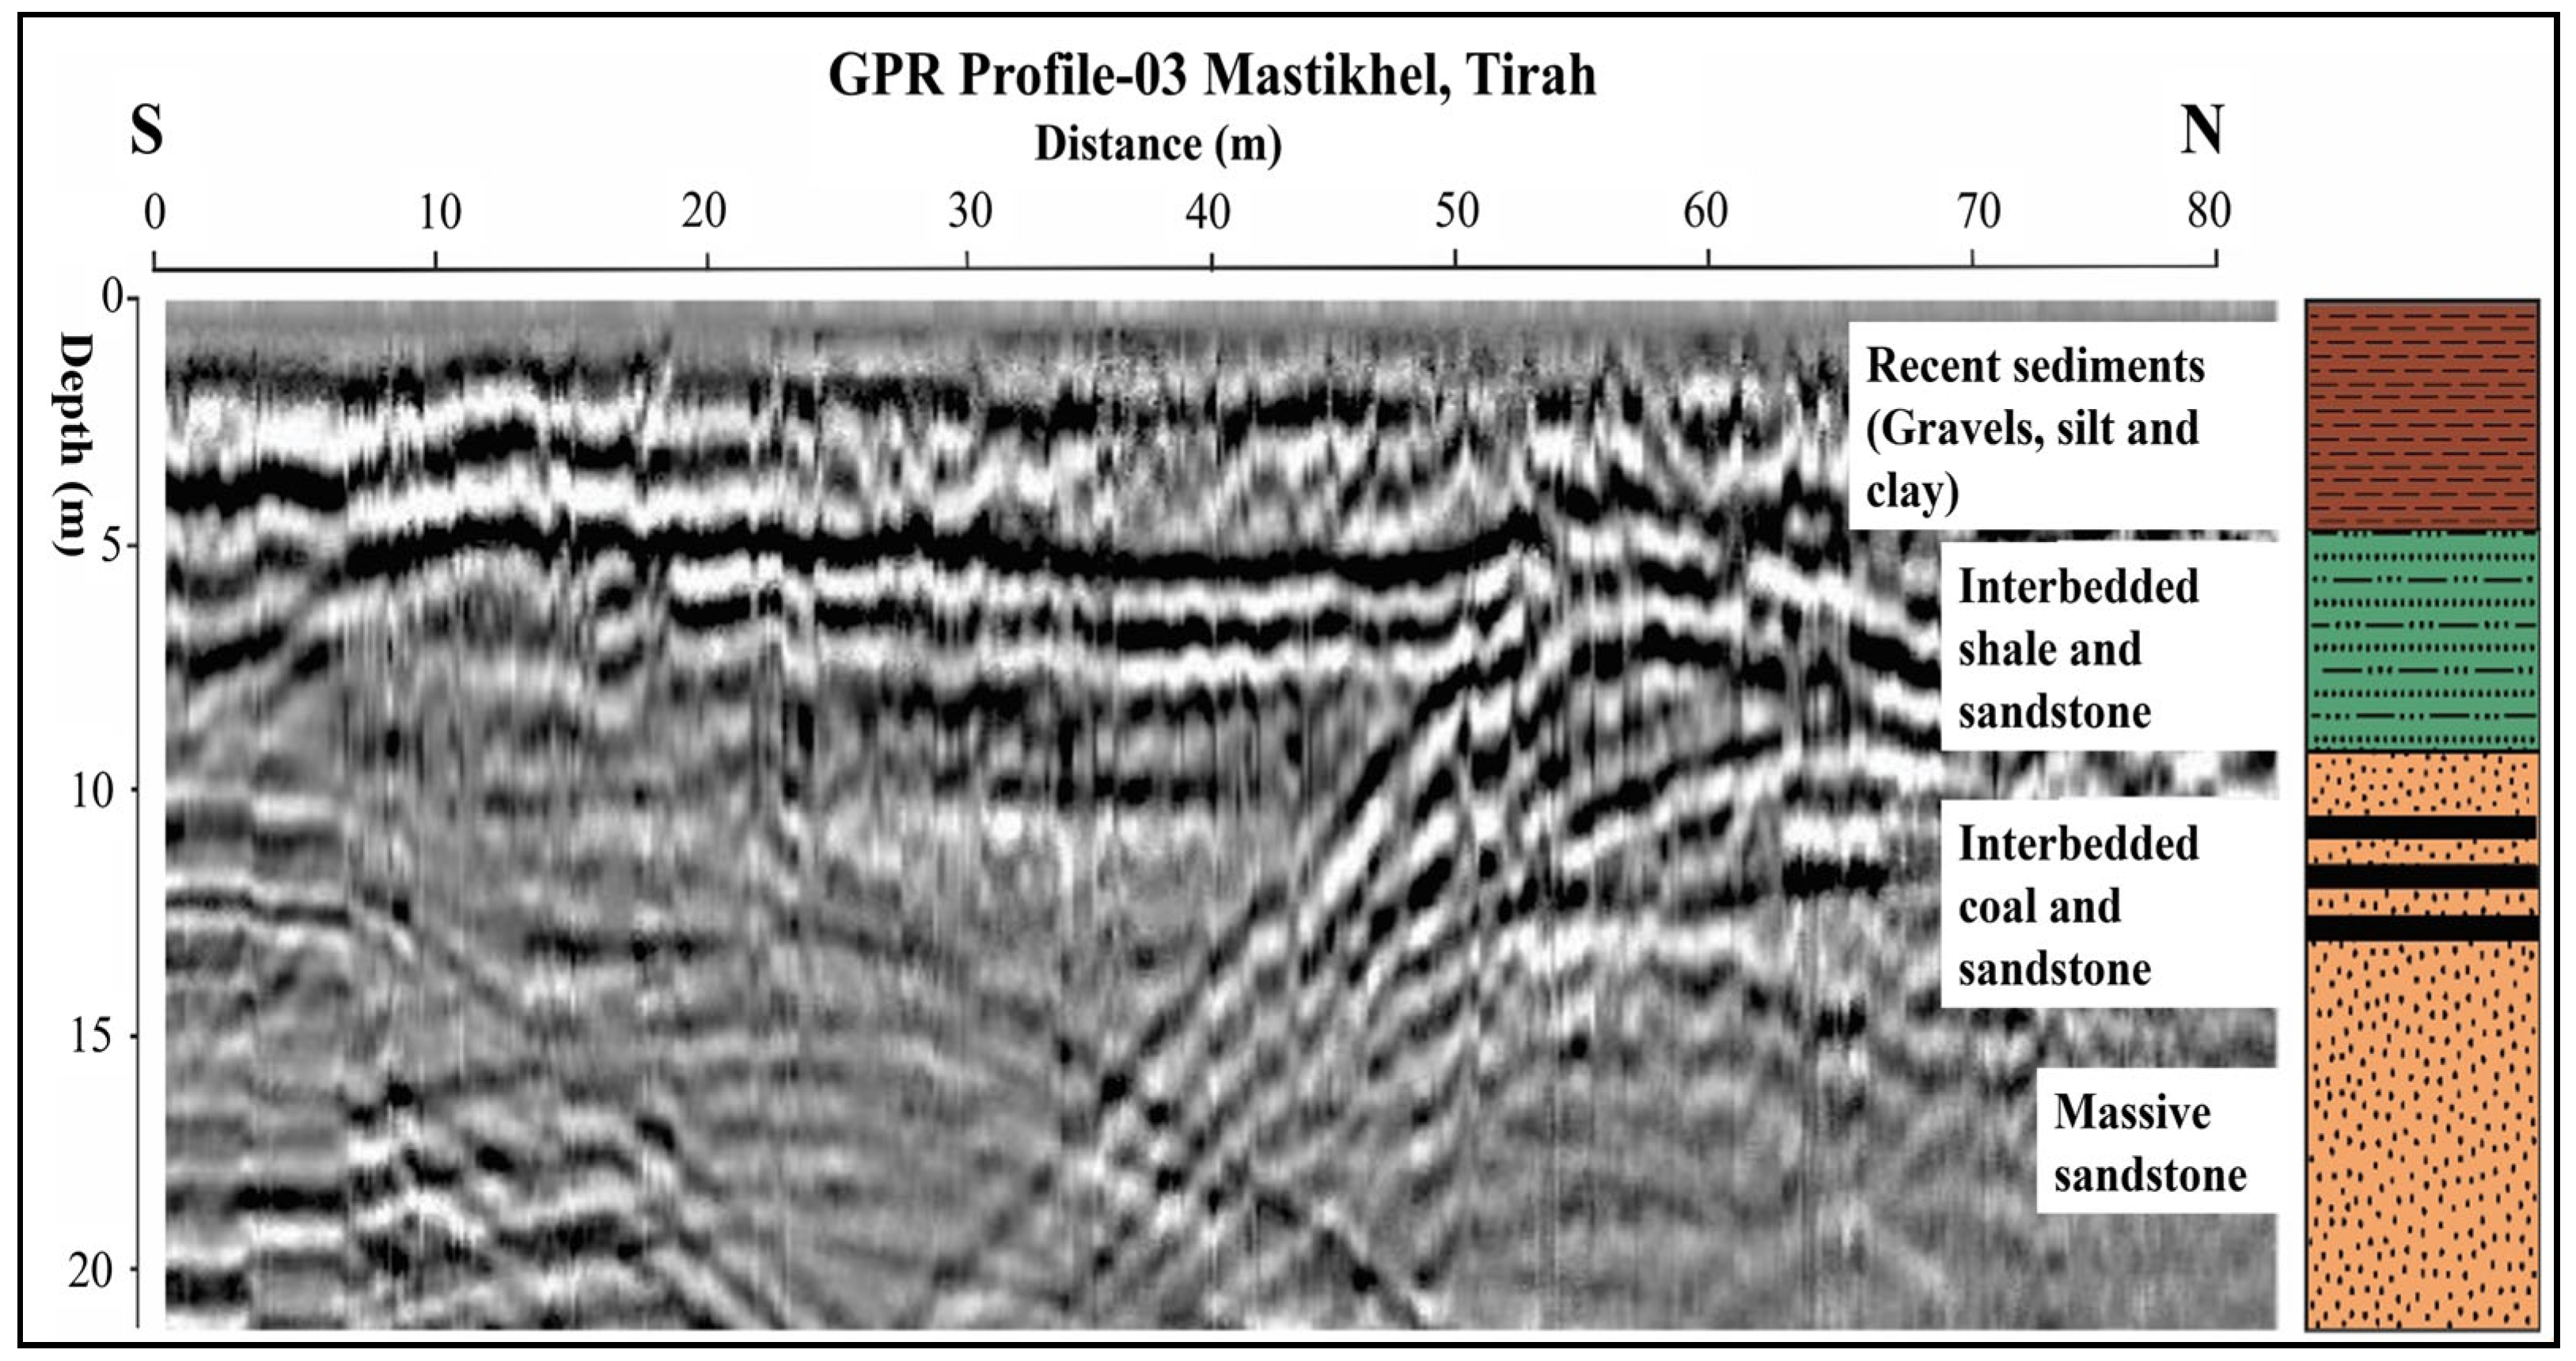
Radar measurements were conducted along profile GPR-03, which has an 80 m length and a depth of about 20 m. The GPR data from the GPR-03 profile were processed after being subjected to different schemes, as shown in
Figure 9. The radar depth model shows lithological variations and the presence of the target coal seam as reflected from the geologic cross section (
Figure 9). The purpose of this profile was to see the impact of structure on GPR reflections.
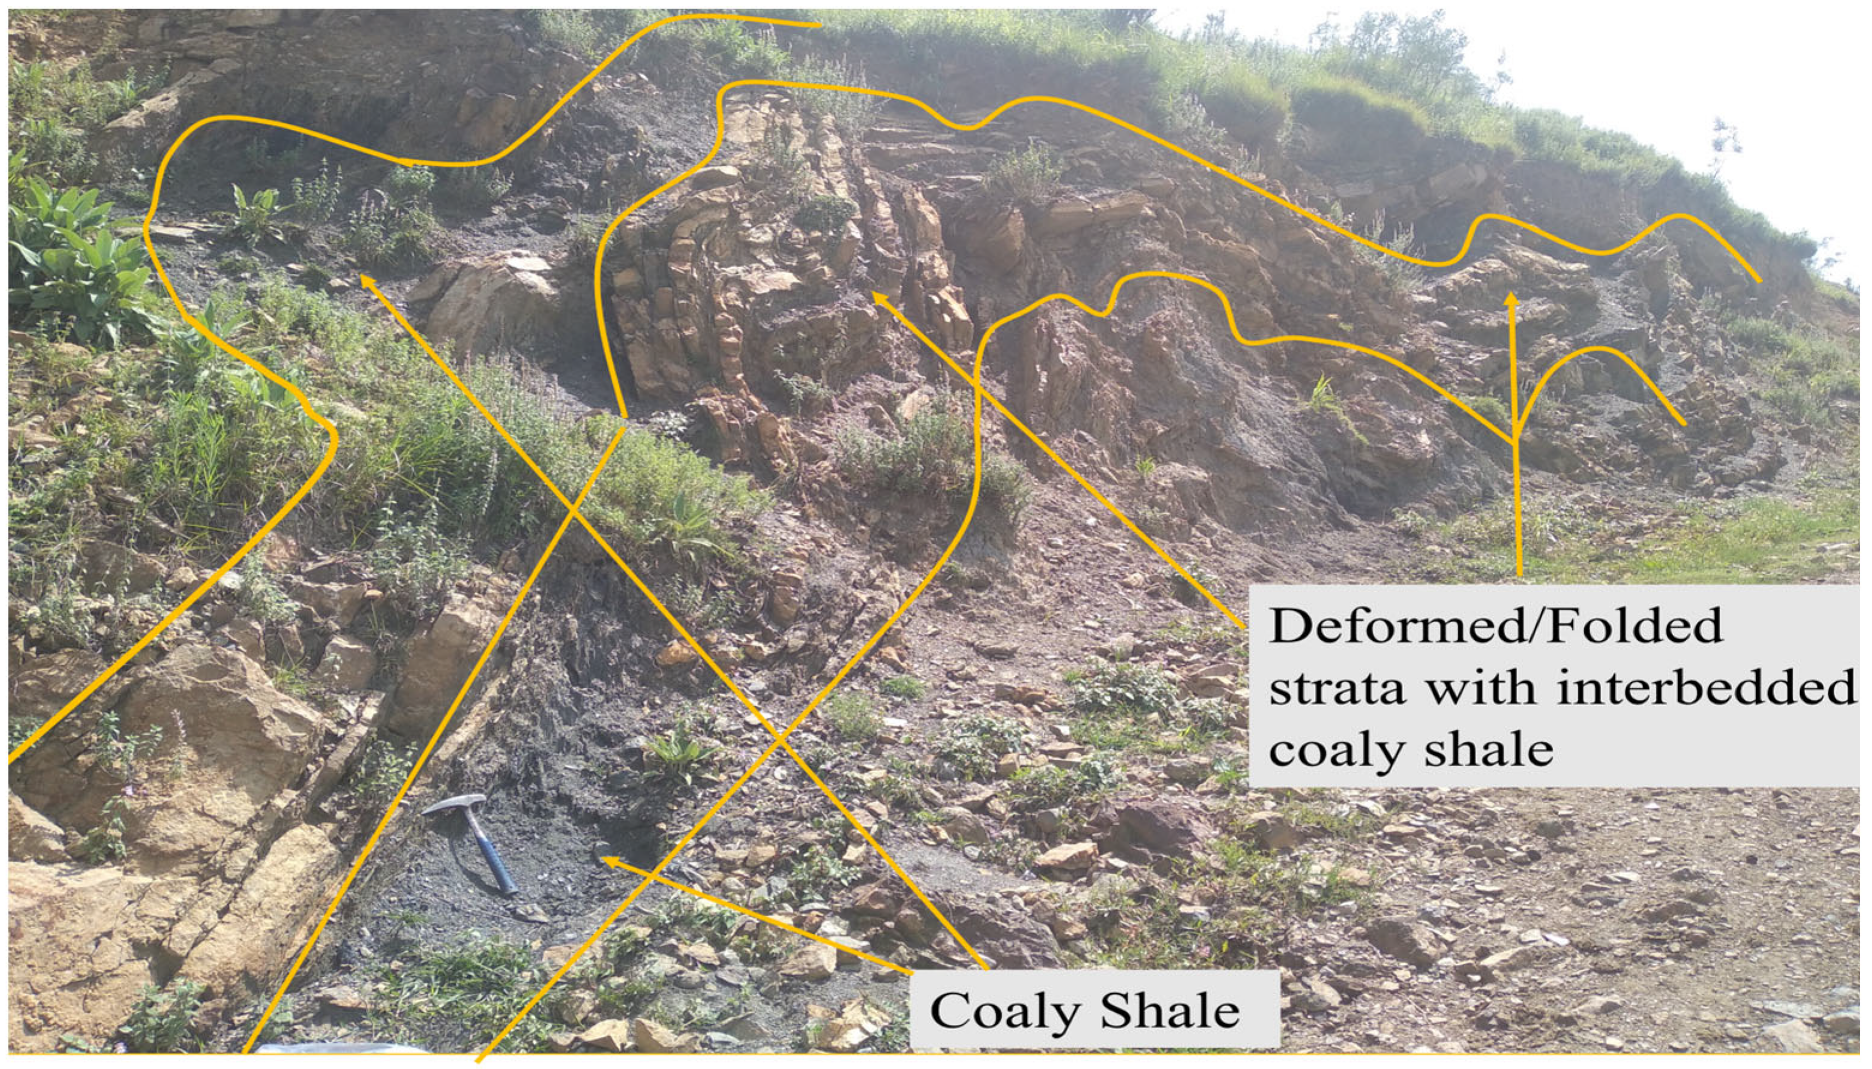
The GPR section demonstrates that near-surface geological layers are almost horizontal and relatively less deformed, whereas geological units at 5 m or beyond this depth interval were subjected to tectonic stresses, and hence steeply dipping reflections clearly provide evidence of the intense subsurface deformation of the geological layers near the mines 03 and 04 in Mastikhel, Tirah. A folded structure from the radar response on the GPR section is observed beyond the distance of 50 m. The deformed character could also be seen from the folded structure of the nearby outcropped section (
Figure 10), which is consistent with the GPR results.
Different lithological units were identified through a GPR scan and interpreted as recent sediments up to a depth of about 3 m, while in the lower section in the depth range of 5–15 m, lithological units such as sandstone, alternating sandstone, and coal-bearing strata with sandstone intervals were identified.
4.2. Coal Geochemistry
4.2.1. Proximate Analysis
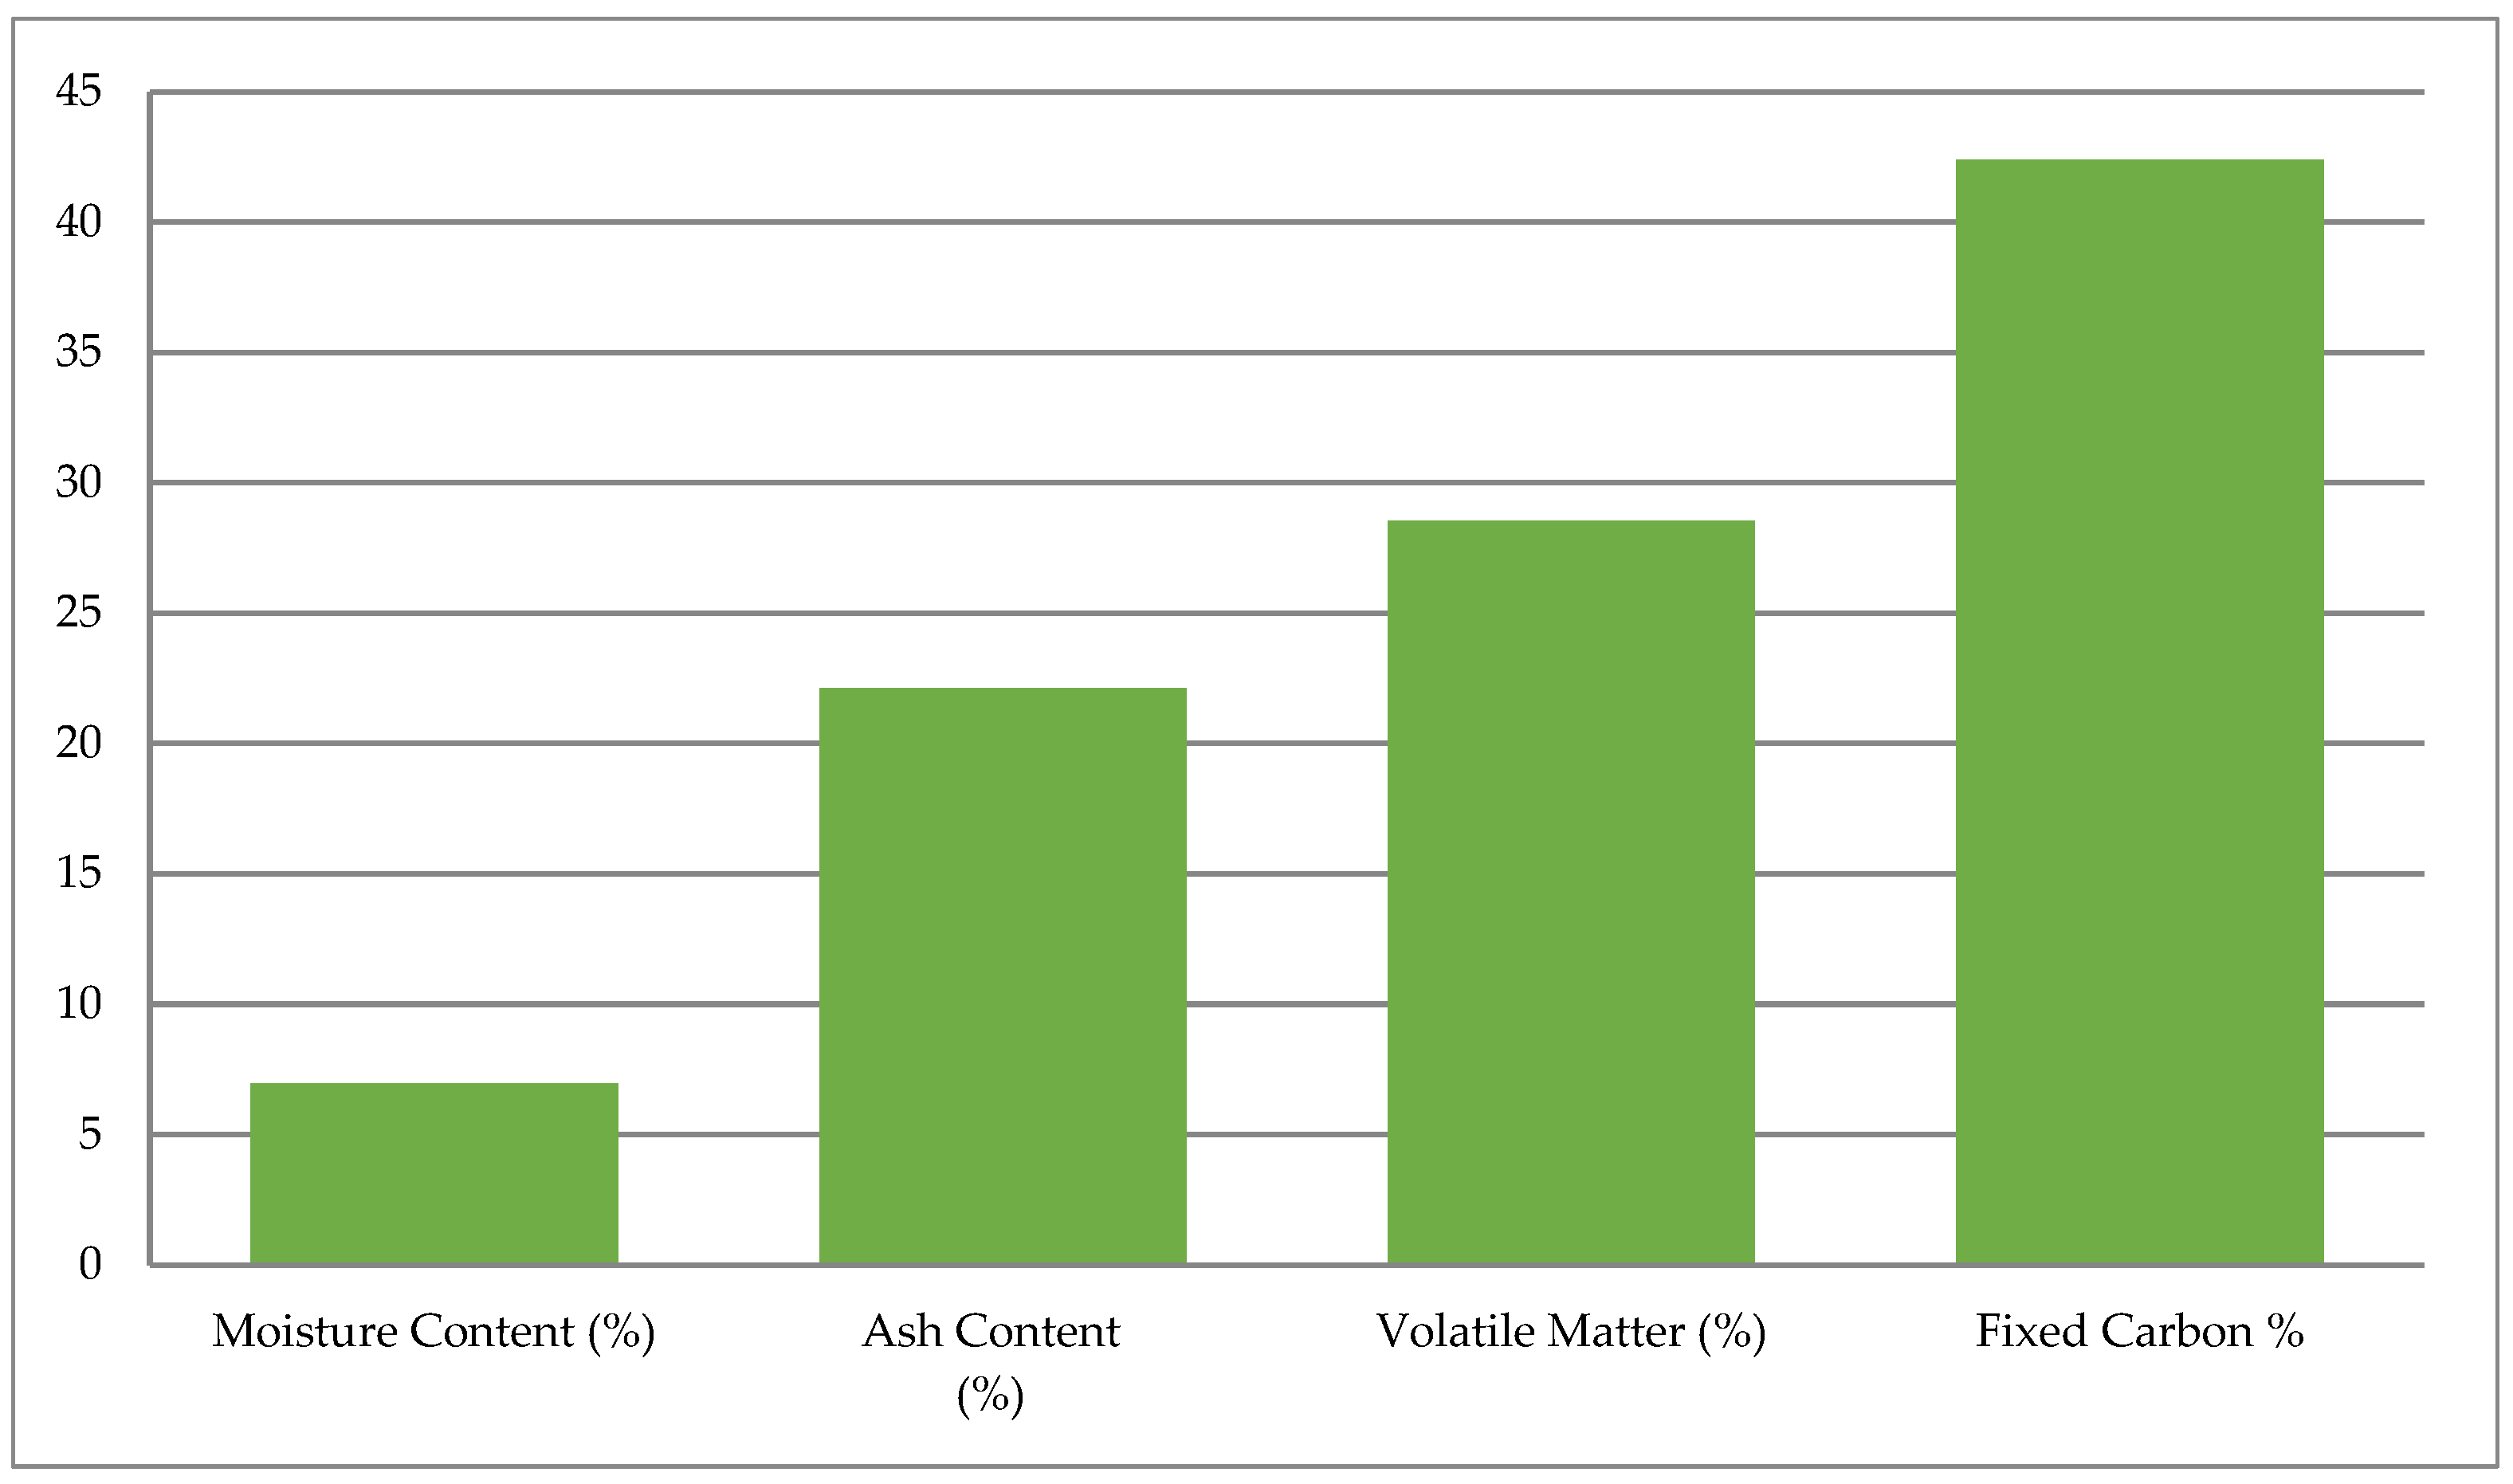
The outcomes of proximate analysis are moisture content (MC), ash content (AS), volatile matter (VM), and fixed carbon (FC), listed in
Table 1. The graph chart for the abovementioned parameters for coal ranking is shown in
Figure 11.
The examined sample has a moisture content that ranges from 5.90 to 8.35%. The average moisture content in the investigated samples is 6.95%. The amount of moisture inside the coal matrix is indicated by the total moisture in the coal [
39]. Low-rank coals often have increased moisture content, and higher-rank coals typically have lower amounts of moisture content [
49].
The inorganic residue that remains after burning is referred to as coal ash. The coal’s mineral matter content is not equal to the determined ash content. However, it does make up the majority of the mineral matter in the coal once the volatile components, such as CO
2, SO
2, and H
2O, were released from the minerals such as carbonates, sulfides, and clays [
38]. The studied samples show ash content ranging from 17.58 to 31.74%, with an average of 22.12%. The proportion of detrital minerals increases with a high amount of ash yield [
50], while the amount of organically bound elements declines [
51].
Low-rank coals have a high volatile matter concentration, whereas higher-rank coals often have a lower value [
49]. The amount of volatile matter in the coal samples from the Hangu Formation under study ranges from 23.14 to 38.74%, with an average of 28.55%.
The coal samples from the Hangu Formation that were under investigation were found to have an average fixed carbon content of 42.40%, with a range of 22.77% to 52.21%. The amount of fixed carbon in coal has an impact on how efficiently it burns [
39].
4.2.2. Ultimate Analysis
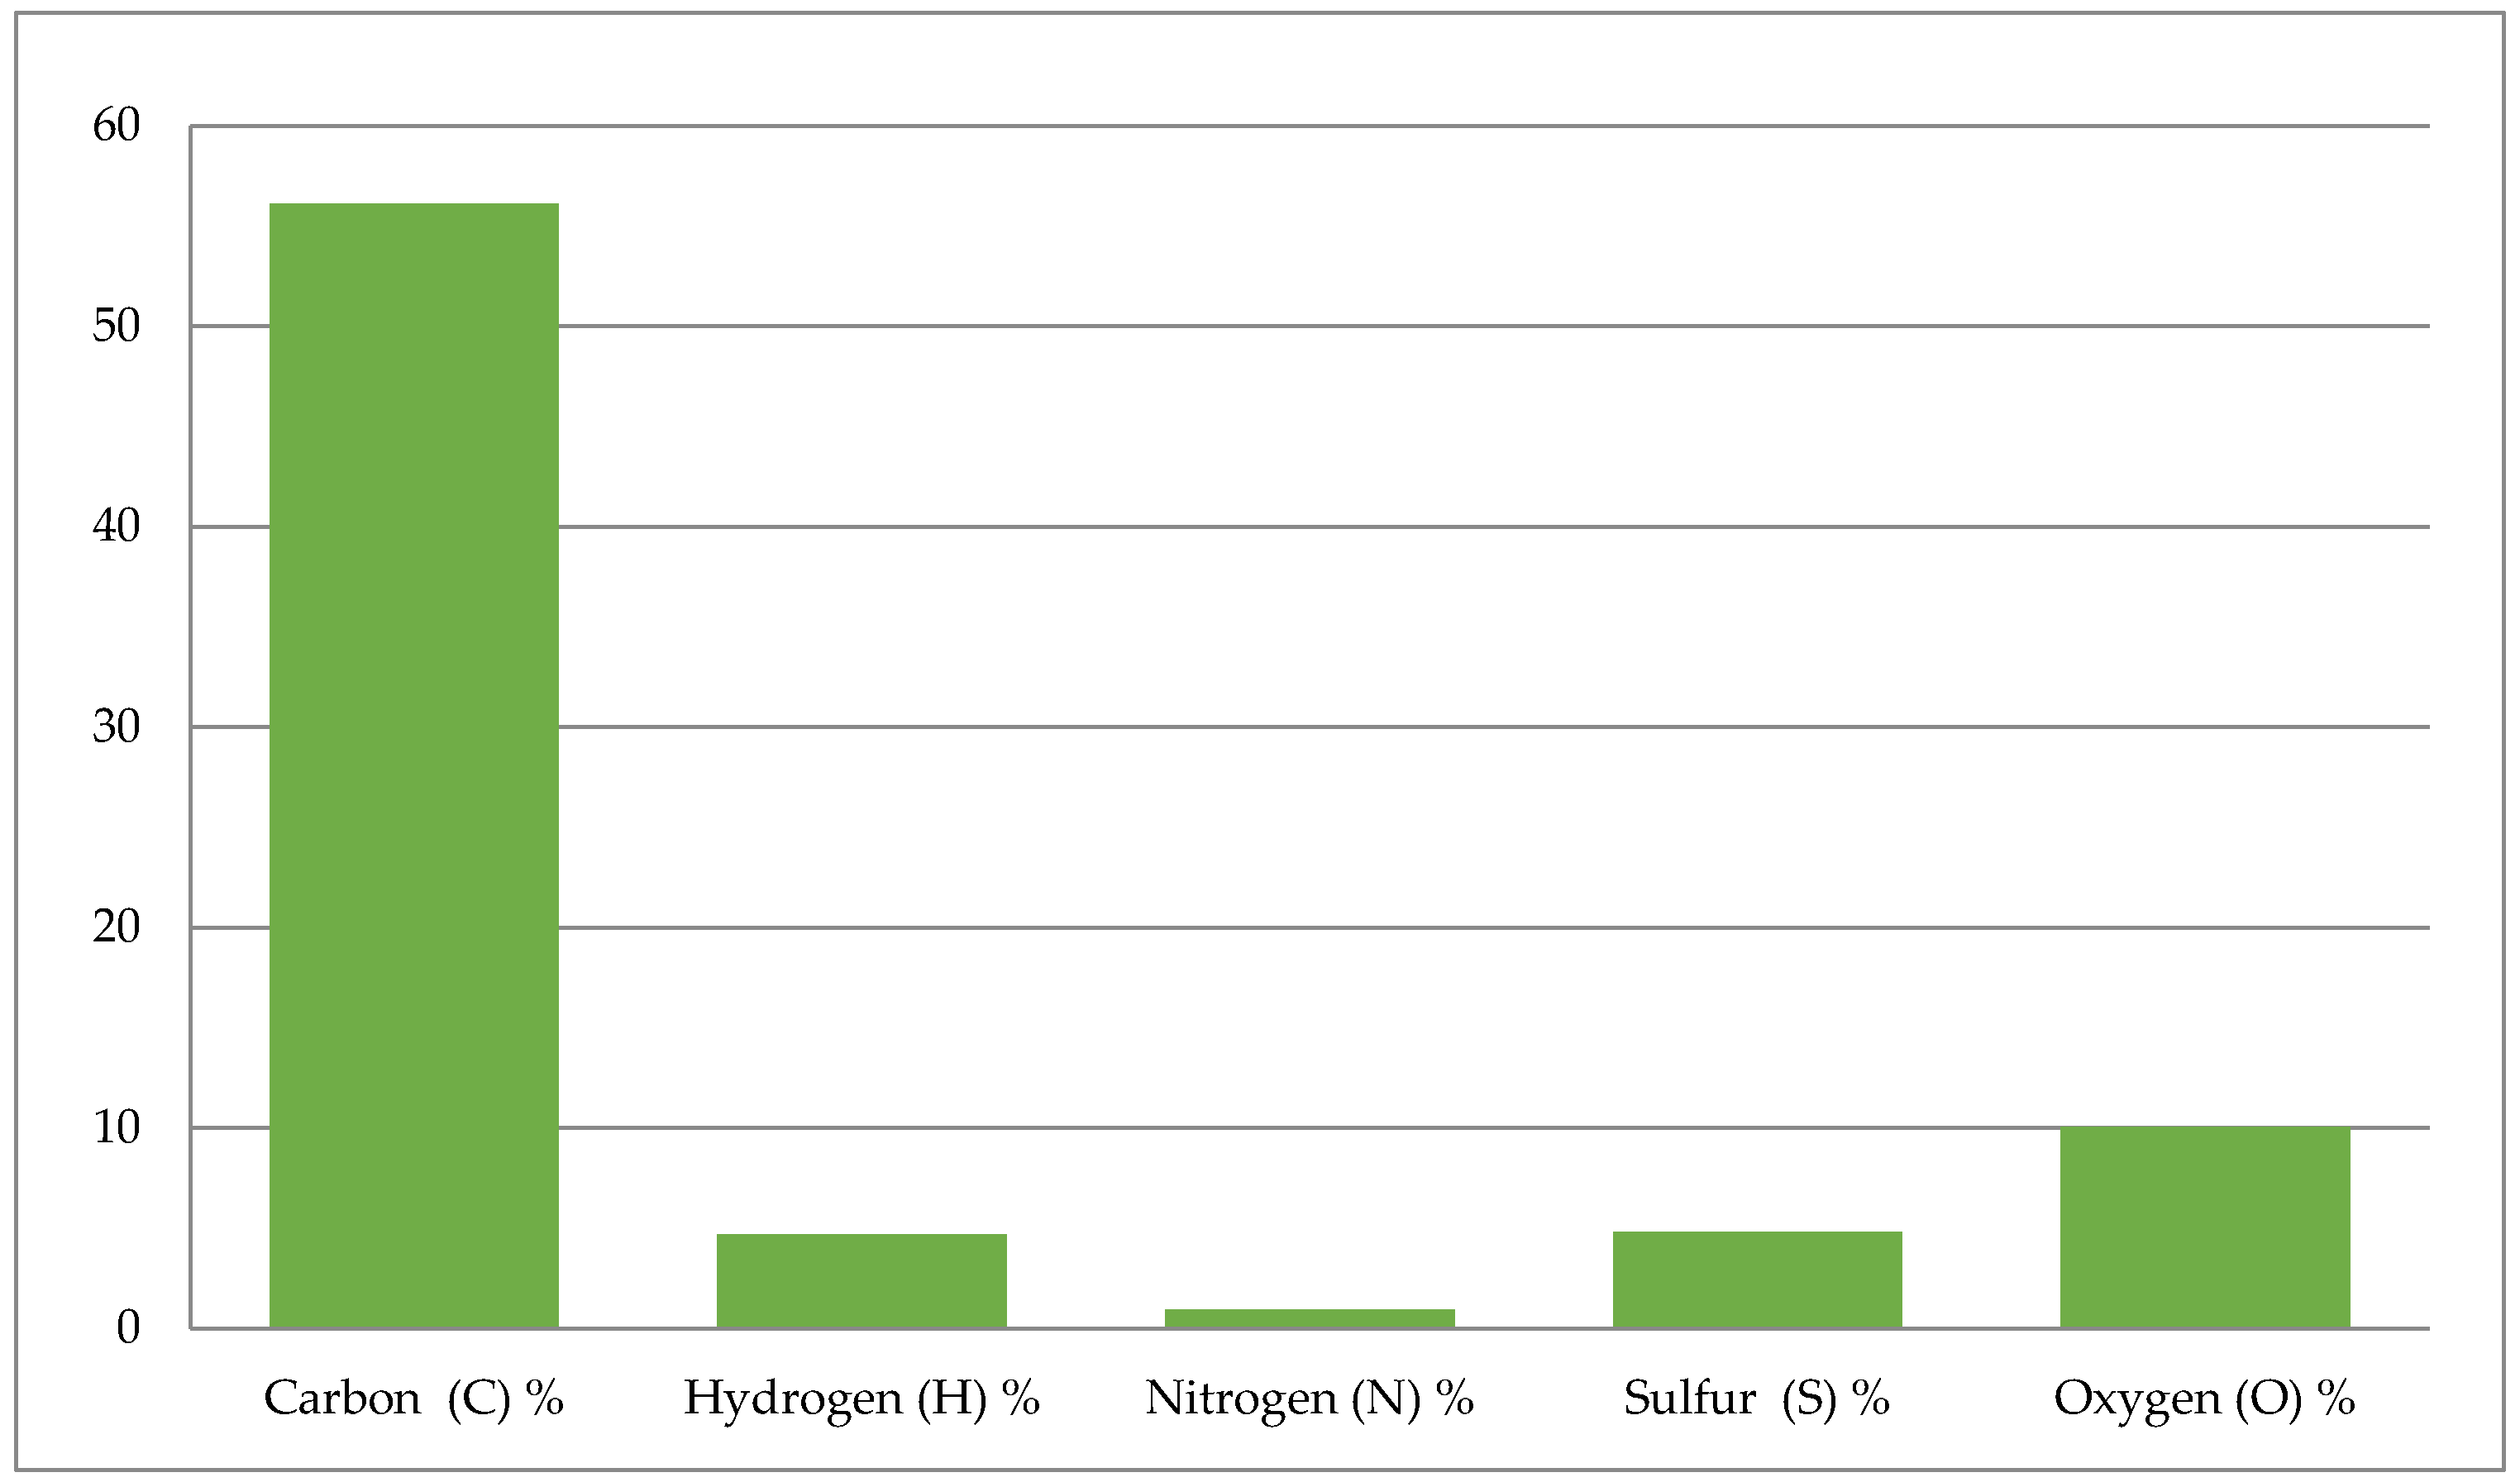
The ultimate analysis results for carbon (C), hydrogen (H), nitrogen (N), sulfur (S), and oxygen (O) are listed in (
Table 2 and
Figure 12).
Ultimate analysis reveals that the coal in the research area has an average carbon content of 55.35%, with a range of 29.45% to 67.70%. According to Winarno et al. (2018) [
52], vitrinite macerals typically have high carbon concentrations, and coal’s high carbon content raises its rank. Carbon concentration is one of the most important criteria for determining coal rank [
48].
Hydrogen content in coals from the Hangu Formation ranges from 4.80 to 5.06%, with an average hydrogen concentration of 4.7%, which is comparable with the grade of low-rank coal. High hydrogen concentration coals are often categorized as low-rank coals [
53].
The studied coal has a nitrogen content that ranges from 0.8 to 1.05%. The average nitrogen concentration in the research area’s samples is 0.95%, which is suggestive of the region’s typical sub-bituminous coals. The low nitrogen levels in the coals under analysis point to low-rank (lignitic to subbituminous) coals.
The samples under investigation had sulfur concentrations ranging from 3.65 to 5.70%. The average sulfur content is 4.82%. Desulfurization of coal can be thought of as a potential approach to reducing sulfur content since it can be difficult to use coal with a high sulfur concentration. High-sulfur coals are said to have come from an invasion of the marine environment [
54,
55].
Low-rank coals are distinguished by their higher oxygen concentration, and vice versa [
56]. The Paleocene Hangu Formation coal samples have an oxygen content that varies from 04.65 to 12.49%, with an average value of 10.06%. These values show the probability of encountering low-rank coals.
4.2.3. Comparison of Coal Quality
The results of the coal’s proximate and ultimate analyses are shown in
Table 1 and
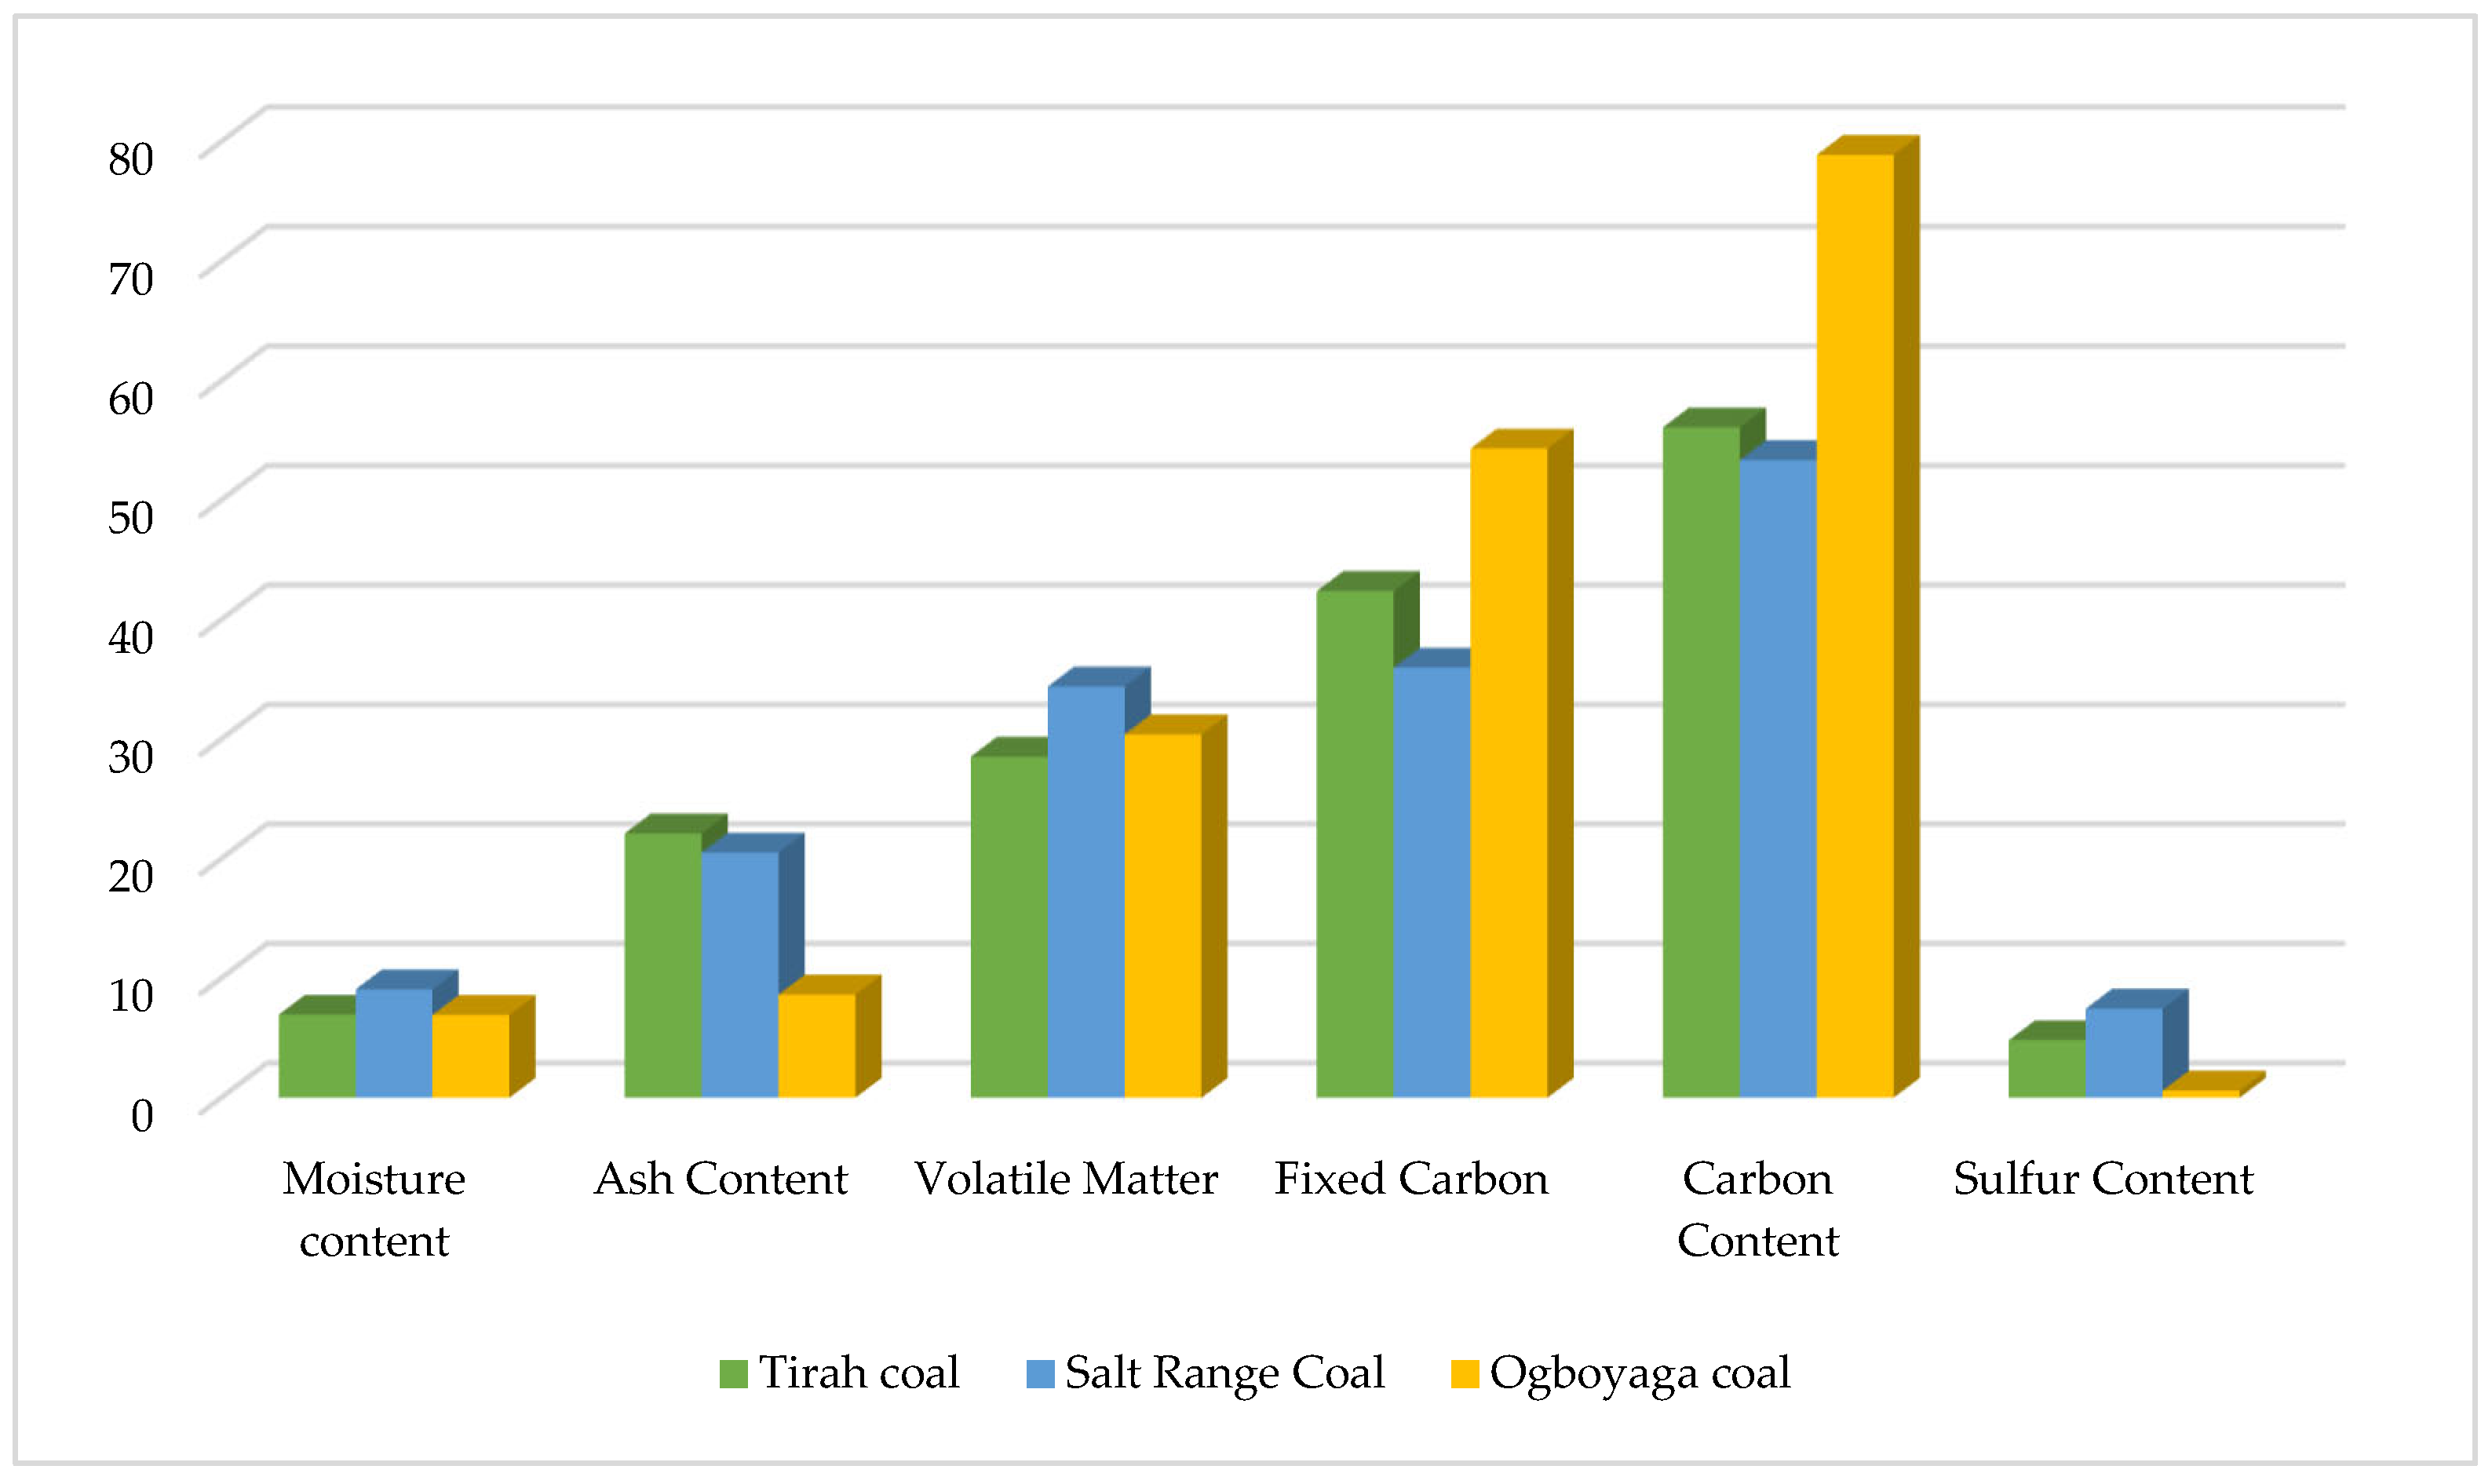
Table 2. The research’s determined data and previously published data are correlated. To understand the rank and quality of the researched coal, a correlation of the characteristics of coal from the Tirah area with coal deposits from the Salt Range in Pakistan and coal deposits from Ogboyaga in Nigeria was carried out (
Figure 13). Tirah coal seams in the Hangu Formation were studied to assess the geochemical characterization and other quality parameters of the coal. In accordance with the ASTM standards, based on the geochemical data and quality of the studied coal in the Tirah area, it was ranked as sub-bituminous. The average calculated values of the moisture content are 6.95%, ash content is 22.12%, volatile matter is 28.5, fixed carbon is 42.40%, sulfur content is 4.82%, and carbon content is 55.35%.
The investigated coal samples from the studied area had a moisture content of 6.95%, compared to 9.07% for Salt Range coal [
11] and 6.93% for Ogboyaga coal from Nigeria [
57]. It is noted that the moisture content in Tirah coal is less than that in Salt Range coal and nearly as low as that in Ogboyaga coal. Publicly available data show that high-moisture coal is less appropriate for burning [
58].
The average ash content of the investigated coal is 22.12%, which is nearly close to the value of the ash content of Salt Range coal (20.52%) [
11] and higher than the value of the ash content of Ogboyaga coal (8.63%) [
57]. According to earlier research, coal with a low ash concentration is best for combustion [
39].
The average volatile matter in the studied coal is calculated at 28.55%. The calculated value is less than the volatile matter of the Salt Range coal (34.41%) [
11] and is nearly close to the value of the volatile matter of Ogboyaga coal (30.41%) [
57].
The average fixed carbon of the investigated coal samples is 42.40%; on the other hand, the average calculated fixed carbon of the Salt Range coal is 36.00%, as reported by [
11], which is somewhat less than the concentration of the fixed carbon of the Ogboyaga coal (54.33%) [
57].
The average sulfur content of the examined coal is 4.82%, while the average sulfur content of the Salt Range coal is 7.46 [
11] and 0.6% in Ogboyaga coal [
57]. Using high-sulfur coal can be challenging. Consequently, coal desulfurization might be thought of as a potential method to decrease sulfur concentrations [
9].
5. Conclusions
In conclusion, this study successfully utilized geophysical methods (ERT and GPR) and geochemical analysis to investigate the coal deposits in the Tirah area, Khyber Pakhtunkhwa, Pakistan. The integration of these techniques provided valuable insights into the detection of coal seams, their lateral extent, and their quality.
The study reveals that the area surveyed is composed of recent sediments, comprising gravel, silt, and clay, with low resistivity values in the top layer. Furthermore, it is anticipated that a layer below the top layer will contain wet sandstone with shale and clay ingredients that have a considerably higher resistivity value than the top layers. Under the materials at the near surface was a zone of relatively high resistivity, with resistivity values between 95.3 Ωm and 800 Ωm and depths between 14 and 23 m. It is believed that this high resistivity signifies a coal seam. A massive, highly consolidated sandstone interbedded with coal and shale was additionally found in the research region. The ground-penetrating radar studies further supported the electrical resistivity imaging results, confirming the presence of coal-bearing strata at varying depths through reflector continuity.
Additionally, the geochemical analysis of the Tirah Paleocene coal of the Hangu Formation shows the peculiarities of its geochemical grade and rank. The findings show that the coal samples have a low content of ash, moisture, sulfur, and nitrogen while having comparatively high contents of fixed carbon and volatile matter. Comparative analyses of the coal quality of samples were made for both local Salt Range, Pakistan, and Ogboyaga, Nigeria, coals. These results suggest that the rank of the Tirah coal deposit is classified as subbituminous. In summary, the combined geophysical and geochemical approach provides essential information for assessing the potential and quality of the coal deposit in Tirah, laying the groundwork for future exploration and exploitation endeavors.
6. Recommendations
It is recommended that more research be performed on the geophysical resistivity profiles utilizing equipment with wider electrode spacing so that it can more thoroughly explore the subsurface. This study has helped to extensively show the importance of integrating field petrographic studies and geophysical and geochemical methods of exploration of coal deposits in the study area.
Author Contributions
M.S. completed this manuscript as part of his PhD thesis. The National Centre of Excellence in Geology at the University of Peshawar is where L.A. and M.Y.K. are supervisors of this research work. M.K. and S.M.T.Q. helped with the writing, editing, and proofreading of the manuscript. All authors have read and agreed to the published version of the manuscript.
Funding
The Research Fund for International Young Scientists (RFIS-I) of the National Science Foundation of China (Grant No. 42250410327) and the Higher Education Commission (HEC) of Pakistan (NRPU Project, 17203) provided funding support.
Data Availability Statement
The manuscript includes all required information, together with all required citations of the relevant sources.
Acknowledgments
This manuscript is part of the PhD research work of the first author at the National Centre of Excellence in Geology, University of Peshawar. The authors are thankful to the National Centre of Excellence in Geology at the University of Peshawar and the University of Science and Technology Beijing for providing the necessary facilities to conduct these experiments.
Conflicts of Interest
The authors declare no conflict of interest.
References
- Bates, R.L.; Jackson, J.A. Glossary of geology: American geological institute. Alex. Va. 1987, 788, 65. [Google Scholar]
- Alpern, B.; De Sousa, M.J.L. Documented international enquiry on solid sedimentary fossil fuels; coal: Definitions, classifications, reserves-resources, and energy potential. Int. J. Coal Geol. 2002, 50, 3–41. [Google Scholar] [CrossRef]
- Höök, M.; Zittel, W.; Schindler, J.; Aleklett, K. Global coal production outlooks based on a logistic model. Fuel 2010, 89, 3546–3558. [Google Scholar] [CrossRef]
- Thakur, P. Global reserves of coal bed methane and prominent coal basins. In Advanced Reservoir and Production Engineering for Coal Bed Methane; Elsevier Inc.: Amsterdam, The Netherlands, 2017; pp. 1–15. [Google Scholar]
- Statistical Review of World Energy BP. 2020. Available online: https://www.bp.com/en/global/corporate/energy-economics/statisticalreview-of-world-energy.html (accessed on 20 January 2020).
- Malkani, M.S.; Khosa, M.H.; Alyani, M.I.; Khan, K.; Somro, N.; Zafar, T.; Arif, J.; Zahid, M.A. Mineral Deposits of Khyber Pakhtunkhwa and FATA, Pakistan. Lasbela Univ. J. Sci. Technol. 2017, 6, 23–46. [Google Scholar]
- Malkani, M.S. A review of coal and water resources of Pakistan. J. Sci. Technol. Dev. 2012, 31, 202–218. [Google Scholar]
- Warwick, P.D.; Wardlaw, B.R. Regional Studies of the Potwar Plateau Area, Northern Pakistan; US Department of the Interior, US Geological Survey: Reston, VA, USA, 2007; Volume 2078.
- Rehman, S.U.; Shah, A.N.; Mughal, H.U.; Javed, M.T.; Akram, M.; Chilton, S.; Nimmo, W. Geology and combustion perspectives of Pakistani coals from Salt Range and Trans Indus Range. Int. J. Coal Geol. 2016, 168, 202–213. [Google Scholar] [CrossRef]
- Snowden. Coal Resources of Salt Range and Trans Indus Range Punjab; Coal Resource Report; Project No 00778; Mines and Minerals Department, Government of Punjab: Brisbane, QLD, Australia, 2012; pp. 23–35.
- Sajid, M.; Khan, N.; Shah, F.; Kashif, M.; Khan, S. Geochemical characteristics of coal seams within the Paleocene Patala Formation, Central Salt Range coal mines (Punjab), Northern Pakistan. J. Sediment. Environ. 2022, 7, 251–260. [Google Scholar] [CrossRef]
- Khan, M.; Khan, S.; Ali, L.; Nisar, U.B. Coal quality and occurrence in areas of western Khyber Pakhtunkhwa, Pakistan, using GPR and electrical resistivity methods. J. Earth Syst. Sci. 2022, 131, 198. [Google Scholar] [CrossRef]
- Buchanan, D.J.; Jackson, L.J. Coal Geophysics: Geophysics Reprint Series, Number 6; Society of Exploration Geophysicists: Houston, TX, USA, 1986. [Google Scholar]
- Mondal, D.; Ghosh, S.; Naveen, P.; Kumar, M.; Majumder, A.; Panda, A.K. An integrated study on the geochemical, geophysical and geomechanical characteristics of the organic deposits (Coal and CBM) of eastern Sohagpur coalfield, India. Gondwana Res. 2021, 96, 122–141. [Google Scholar] [CrossRef]
- Wang, K.; Ge, X.; Ning, J.; Li, J.; Zhao, X. Multidisciplinary Geophysical Investigations over Deep Coal-Bearing Strata: A Case Study in Yangjiazhangzi, Northeast China. Energies 2022, 15, 5689. [Google Scholar] [CrossRef]
- Nalbandian, H. Expert Systems and Coal Quality in Power Generation; Report CCC/186; IEA Clean Coal Centre: London, UK, 2011. [Google Scholar]
- Hayden, H. Geology of Bazar Valley. Mem. Geol. Survey India 1896, 28, 96–117. [Google Scholar]
- Hashmi, S.I. Structure analysis of the Tirah Maidan and part of the Orakzai Agency, NW, Pakistan. In Proceedings of the International Conference on Earth Sciences Pakistan, Peshawar, Pakistan, 15–17 July 2016. [Google Scholar]
- Gansser, A. Geology of the Himalayas; Interscience Publishers: Geneva, Switzerland, 1964. [Google Scholar]
- Shah, M.R.; Abbasi, I.A.; Haneef, M.; Khan, A. Nature, origin and mode of occurrence of Hangu-Kachai area coal, district Kohat, NWFP, Pakistan: A preliminary study. Geol. Bull. 1993, 26, 87–94. [Google Scholar]
- Khan, M.Y.; Turab, S.A.; Riaz, M.S.; Atekwana, E.A.; Muhammad, S.; Butt, N.A.; Abbas, S.M.; Zafar, W.A.; Ohenhen, L.O. Investigation of coseismic liquefaction-induced ground deformation associated with the 2019 Mw 5.8 Mirpur, Pakistan, earthquake using near-surface electrical resistivity tomography and geological data. Near Surf. Geophys. 2021, 19, 169–182. [Google Scholar] [CrossRef]
- Loke, M.; Barker, R. Rapid least-squares inversion of apparent resistivity pseudosections by a quasi-Newton method1. Geophys. Prospect. 1996, 44, 131–152. [Google Scholar] [CrossRef]
- Yang, X.; LaBrecque, D.J. Comparison between Stochastic and Occam’s Inversion of 3-D ERT data. In Proceedings of the 12th EEGS Symposium on the Application of Geophysics to Engineering and Environmental Problems, Oakland, CA, USA, 14–18 March 1999; European Association of Geoscientists & Engineers: Utrecht, The Netherlands, 1999; p. cp-202. [Google Scholar]
- Gloaguen, E.; Chouteau, M.; Marcotte, D.; Chapuis, R. Estimation of hydraulic conductivity of an unconfined aquifer using cokriging of GPR and hydrostratigraphic data. J. Appl. Geophys. 2001, 47, 135–152. [Google Scholar] [CrossRef]
- Bristow, C.S.; Jol, H.M. An introduction to ground penetrating radar (GPR) in sediments. Geol. Soc. London Spéc. Publ. 2003, 211, 1–7. [Google Scholar] [CrossRef]
- Akca, I.; Balkaya, C.; Kaya, M.A. Advanced image processing methods applied to enhance the GPR Images. Geophys. Res. Abstr. 2019, 21, EGU2019-6569. [Google Scholar]
- Kumar, S.; Pal, S.K.; Rani, S. GPR data interpretation using continuous wavelet transform: A different approach. Curr. Sci. 2020, 118, 1104–1111. [Google Scholar] [CrossRef]
- Conyers, L.B. Ground-Penetrating Radar for Geoarchaeology; John Wiley & Sons: Hoboken, NJ, USA, 2016. [Google Scholar]
- Conyers, L.B. Ground-penetrating radar mapping using multiple processing and interpretation methods. Remote Sens. 2016, 8, 562. [Google Scholar] [CrossRef]
- Trinks, I.; Johansson, B.; Gustafsson, J.; Emilsson, J.; Friborg, J.; Gustafsson, C.; Nissen, J.; Hinterleitner, A. Efficient, large-scale archaeological prospection using a true three-dimensional ground-penetrating radar array system. Archaeol. Prospect. 2010, 17, 175–186. [Google Scholar] [CrossRef]
- Lockyear, K. Verulamium revealed: Sensing the city. Curr. Archaeol. 2016, 310, 12–19. [Google Scholar]
- Slob, E.C.; Groenenboom, J.; Fokkema, J.T. Automated acquisition and processing of 3D GPR data for object detection and characterization. Subsurf. Sens. Technol. Appl. 2003, 4, 5–18. [Google Scholar] [CrossRef]
- Mahajan, O.P.; Walker, P.L., Jr. Reactivity of heat-treated coals. In Analytical Methods for Coal and Coal Products; Elsevier: Amsterdam, The Netherlands, 1978; pp. 465–494. [Google Scholar]
- Montgomery, W. Standard laboratory test methods for coal and coke. Anal. Methods Coal Coal Prod. 1978, 1, 191–246. [Google Scholar]
- ASTM D-2013; Standard Practice for Preparing Coal Samples for Analysis. Annual Book of ASTM Standards, Vol. 05.06; American Society for Testing and Materials: West Conshohocken, PA, USA, 2004.
- ASTM D2013/D2013M-12; Standard Practice for Preparing Coal Samples for Analysis. ASTM International: West Conshohocken, PA, USA, 2012.
- ASTM Standards-D5142-04; Standard Test Methods for Proximate Analysis of the Analysis Sample of Coal and Coke by Instrumental Procedures. Annual Book of ASTM Standards, Section; ASTM International: West Conshohocken, PA, USA, 2002; Volume 5.
- Hower, J.C.; Eble, C.F.; Hopps, S.D.; Morgan, T.D. Aspects of rare earth element geochemistry of the Pond Creek coalbed, Pike County, Kentucky. Int. J. Coal Geol. 2022, 261, 104082. [Google Scholar] [CrossRef]
- Speight, J.G. Handbook of Coal Analysis; Wiley Online Library: Hoboken, NJ, USA, 2005; Volume 166. [Google Scholar]
- ASTM D3176-89; Standard Practice for Preparing Coal Samples for Analysis. Annual Book of ASTM Standards, vol. 05.06; American Society for Testing and Materials: West Conshohocken, PA, USA, 2001.
- ASTM D7582-1; Standard Test Methods for Proximate Analysis of Coal and Coke by Macro Thermogravimetric Analysis. ASTM International: West Conshohocken, PA, USA, 2010.
- Krishnamurthy, N.S.; Rao, V.A.; Kumar, D.; Singh, K.K.K.; Ahmed, S. Electrical Resistivity Imaging technique to delineate coal seam barrier thickness and demarcate water filled voids. J. Geol. Soc. India 2009, 73, 639–650. [Google Scholar] [CrossRef]
- Wilkinson, P.B.; Chambers, J.E.; Meldrum, P.I.; Ogilvy, R.D.; Mellor, C.J.; Caunt, S. A comparison of self-potential tomography with electrical resistivity tomography for the detection of abandoned mineshafts. J. Environ. Eng. Geophys. 2005, 10, 381–389. [Google Scholar] [CrossRef]
- Mohammed, M.A.; Adewumi, T.; Ahmed, A.L.; Lawal, K.M. Electrical Resistivity Imaging of a Coal Deposit at Tai Area of Gombe State, North Eastern Nigeria. J. Environ. Earth Sci. 2016, 6, 55. [Google Scholar]
- Samanlangi, A.I. Coal layer identification using electrical resistivity imaging method in Sinjai area south Sulawesi. J. Phys. Conf. Ser. 2018, 979, 012048. [Google Scholar] [CrossRef]
- Phengnaone, K.; Arjwech, R.; Everett, M. 2D electrical resistivity tomography (ERT) method to delineate coal seams: Case studies on lignite and anthracite. Songklanakarin J. Sci. Technol. 2020, 42, 4. [Google Scholar]
- Das, P.; Pal, S.K.; Mohanty, P.R.; Priyam, P.; Bharti, A.K.; Kumar, R. Abandoned mine galleries detection using electrical resistivity tomography method over Jharia coal field, India. J. Geol. Soc. India 2017, 90, 169–174. [Google Scholar] [CrossRef]
- Chen, W.; Xue, G.Q.; Muhammad, Y.K.; Gelius, L.J.; Zhou, N.N.; Li, H.; Zhong, H.S. Application of short-offset TEM (SOTEM) technique in mapping water-enriched zones of coal stratum, an example from East China. Pure Appl. Geophys. 2015, 172, 1643–1651. [Google Scholar] [CrossRef]
- Teichmüller, M.; Teichmüller, R. The geological basis of coal formation. In Stach’s Textbook of Coal Petrology; Gebruder borntraeger: Stuttgart, Germany, 1982; Volume 3, pp. 5–86. [Google Scholar]
- Finkelman, R.B. The Inorganic Geochemistry of Coal: A Scanning Electron Microscopy View. Scanning Microsc. 1987, 2, 9. [Google Scholar]
- Nicholls, G.D. The geochemistry of coal-bearing strata. In Coal and Coal-Bearing Strata; Oliver & Boyd: London, UK, 1968; pp. 269–307. [Google Scholar]
- Winarno, A.; Amijaya, D.H.; Harijoko, A. Geochemical characterization of Kutai Basin coals using proximate and ultimate analysis. In IOP Conference Series: Earth and Environmental Science; IOP Publishing: Bristol, UK, 2018; p. 012033. [Google Scholar]
- Calkins, W.H. The chemical forms of sulfur in coal: A review. Fuel 1994, 73, 475–484. [Google Scholar] [CrossRef]
- Chou, C.-L. Sulfur in coals: A review of geochemistry and origins. Int. J. Coal Geol. 2012, 100, 1–13. [Google Scholar] [CrossRef]
- Casagrande, D.J. Sulphur in peat and coal. Geol. Soc. London Spéc. Publ. 1987, 32, 87–105. [Google Scholar] [CrossRef]
- Manoj, B.; Kunjomana, A.; Chandrasekharan, K. Chemical leaching of low rank coal and its characterization using SEM/EDAX and FTIR. J. Miner. Mater. Charact. Eng. 2009, 08, 821–832. [Google Scholar] [CrossRef]
- Adekunle, J.O.; Ibrahim, J.S.; Kucha, E.I. Proximate and ultimate analyses of biocoal briquettes of Nigerian’s Ogboyaga and Okaba sub-bituminous coal. Br. J. Appl. Sci. Technol. 2015, 7, 114–123. [Google Scholar] [CrossRef]
- Kurose, R.; Tsuji, H.; Makino, H. Effects of moisture in coal on pulverized coal combustion characteristics. Fuel 2001, 80, 1457–1465. [Google Scholar] [CrossRef]
| Disclaimer/Publisher’s Note: The statements, opinions and data contained in all publications are solely those of the individual author(s) and contributor(s) and not of MDPI and/or the editor(s). MDPI and/or the editor(s) disclaim responsibility for any injury to people or property resulting from any ideas, methods, instructions or products referred to in the content. |
© 2023 by the authors. Licensee MDPI, Basel, Switzerland. This article is an open access article distributed under the terms and conditions of the Creative Commons Attribution (CC BY) license (https://creativecommons.org/licenses/by/4.0/).
