Article

Optimization of Brake Feedback Efficiency for Small Pure Electric Vehicles Based on Multiple Constraints

1
School of Mechanical and Automotive, Guangxi University of Science and Technology, Liuzhou 545006, China
2
Guangxi Key Laboratory of Automobile Components and Vehicle Technology, Guangxi University of Science and Technology, Liuzhou 545006, China
3
School of Mechanical Engineering, Guangxi University, Nanning 530004, China
4
Institute for Artificial Intelligence, Peking University, Beijing 100871, China
5
Guangxi Yuchai Machinery Co., Ltd., Yulin 537005, China
*
Author to whom correspondence should be addressed.
Energies 2023, 16(18), 6531; https://doi.org/10.3390/en16186531
Submission received: 18 July 2023 / Revised: 2 September 2023 / Accepted: 8 September 2023 / Published: 11 September 2023
(This article belongs to the Topic Electric Vehicles Energy Management)

Abstract

:
An efficient and stable braking feedback scheme is one of the key technologies to improve the endurance performance of pure electric vehicles. In this study, four constraint conditions for different braking feedback schemes were clearly defined, and tests and simulation analysis were carried out based on “the relationship between rear-drive feedback efficiency and vehicle configuration conditions” and “the relationship between front-drive feedback efficiency and braking efficiency”. The results show that for rear-driving, the RSF2 scheme with low dependence on the constraint conditions of tramping characteristics is the comprehensive optimal scheme under the condition of decoupling control constraints, and the mileage improvement rate reaches 29.2%. For front driving, the FSF1A scheme is the comprehensive optimal scheme considering both braking efficiency and feedback efficiency, and the mileage improvement rate reaches 35.8%. Finally, the feasibility of the proposed braking feedback scheme is proved using the drum test under cyclic conditions, and the research results provide a theoretical basis for the optimization of braking feedback energy efficiency of small pure electric vehicles.

1. Introduction

With the increasingly severe global energy and environmental problems [1,2], the development of pure electric vehicles with no fuel consumption and zero emissions is one of the effective solutions to meet the environmental protection requirements in the field of transportation [3]. For purely electric vehicles, braking energy feedback technology is the key to improving their endurance performance [4,5]. Braking energy feedback technology converts part of the kinetic energy of the vehicle into electric energy, stores it in the battery, and carries out secondary utilization development to achieve the purpose of reducing energy consumption and enhancing endurance performance [6,7]. Since pure electric vehicles do not have energy efficiency optimization methods like hybrid vehicles that can improve endurance performance through power distribution [8,9,10], pure electric vehicles rely more heavily on braking energy feedback [11]. Therefore, it is very important to propose an efficient and stable braking feedback scheme for pure electric vehicles [12].
The braking feedback system of the pure electric vehicle can coordinate the braking force of the drive motor and the friction braking force of the friction system to meet the braking strength requirements of the whole vehicle [13,14]. The braking feedback scheme is mainly based on an energy management system and a coordinated control scheme [15]; the former determines the efficiency of the feedback scheme [16], and the latter determines the stability of the feedback scheme [17]. This study mainly analyzes the level of the energy management system but also needs to take into account its stable performance [18]. Reasonable distribution of feedback braking force, friction braking force, and front and rear wheel braking force is the key [19,20,21]. In general, the distribution of feedback braking force and friction braking force can be distinguished by series and parallel schemes [22,23]. The definition is based on whether only feedback braking force participates in braking at low braking intensity [24,25]. In a parallel braking scheme, feedback braking force and friction braking force are always generated simultaneously [26]. In the series braking scheme, only the braking force is fed back at low braking strength, and the friction braking force is applied with the increase in braking strength [27]. In this regard, domestic and foreign scholars also conducted a large number of studies. Zhai et al. [28] optimized the front wheel torque distribution based on the Seagull algorithm for dual-motor forward-driving vehicles, improving the endurance performance of pure electric vehicles and thus improving the driving range of electric vehicles. Zhang et al. [29] studied the change in braking energy of pure electric vehicles based on the CLTC and discussed the factors affecting the brake energy recovery system BERS of pure electric vehicles. He et al. [30] proposed an intelligent braking system composed of a single pedal and a multi-objective optimization neural network, aiming to improve braking feedback efficiency by reducing the use frequency of brake pedal under different driving conditions. Qi et al. [31] proposed a new electromechanical dual-path braking energy recovery system for pure electric vehicles, which uses helical springs to maximize energy recovery efficiency. The braking feedback strategy is adopted in both the braking state and emergency braking state, improving the vehicle’s energy-saving performance. Ji et al. [32] proposed a brake feedback scheme based on a fuzzy recognition method to identify driver intention, which was obtained under FTP75 conditions. The results show that the braking feedback scheme can balance the energy recovery and braking stability and improve the endurance performance. However, the above research’s shortcoming is that the influence of constraints is not discussed in the design of brake feedback schemes.
To sum up, the existing research results often do not elaborate on the constraints and optimal application range of the braking feedback scheme before formulating the braking feedback scheme, which is difficult to achieve optimal braking feedback efficiency [33,34,35]. The aim of this study was to design, compare, and optimize multiple brake feedback schemes for the front- and rear-drive versions of pure electric vehicles. Firstly, the constraints of the braking feedback scheme are defined, including the following four types: (1) regulatory constraints; (2) decoupling control constraints; (3) redundancy constraints; and (4) optional vehicle configuration constraints. Based on two small pure electric vehicles, a parallel braking feedback scheme and series braking feedback scheme under different constraint conditions are innovatively proposed, and the application range of each braking feedback scheme is expounded. The proposed scheme was evaluated comprehensively from three aspects: vehicle configuration condition, feedback efficiency, and braking efficiency. Finally, the feasibility of the scheme was verified using the drum test. The research results of this paper lay a foundation for the design of brake feedback schemes for small pure electric vehicles and provide a reference for the design of efficient and stable brake feedback schemes for different types of pure electric vehicles in the future.

2. Numerical Approaches

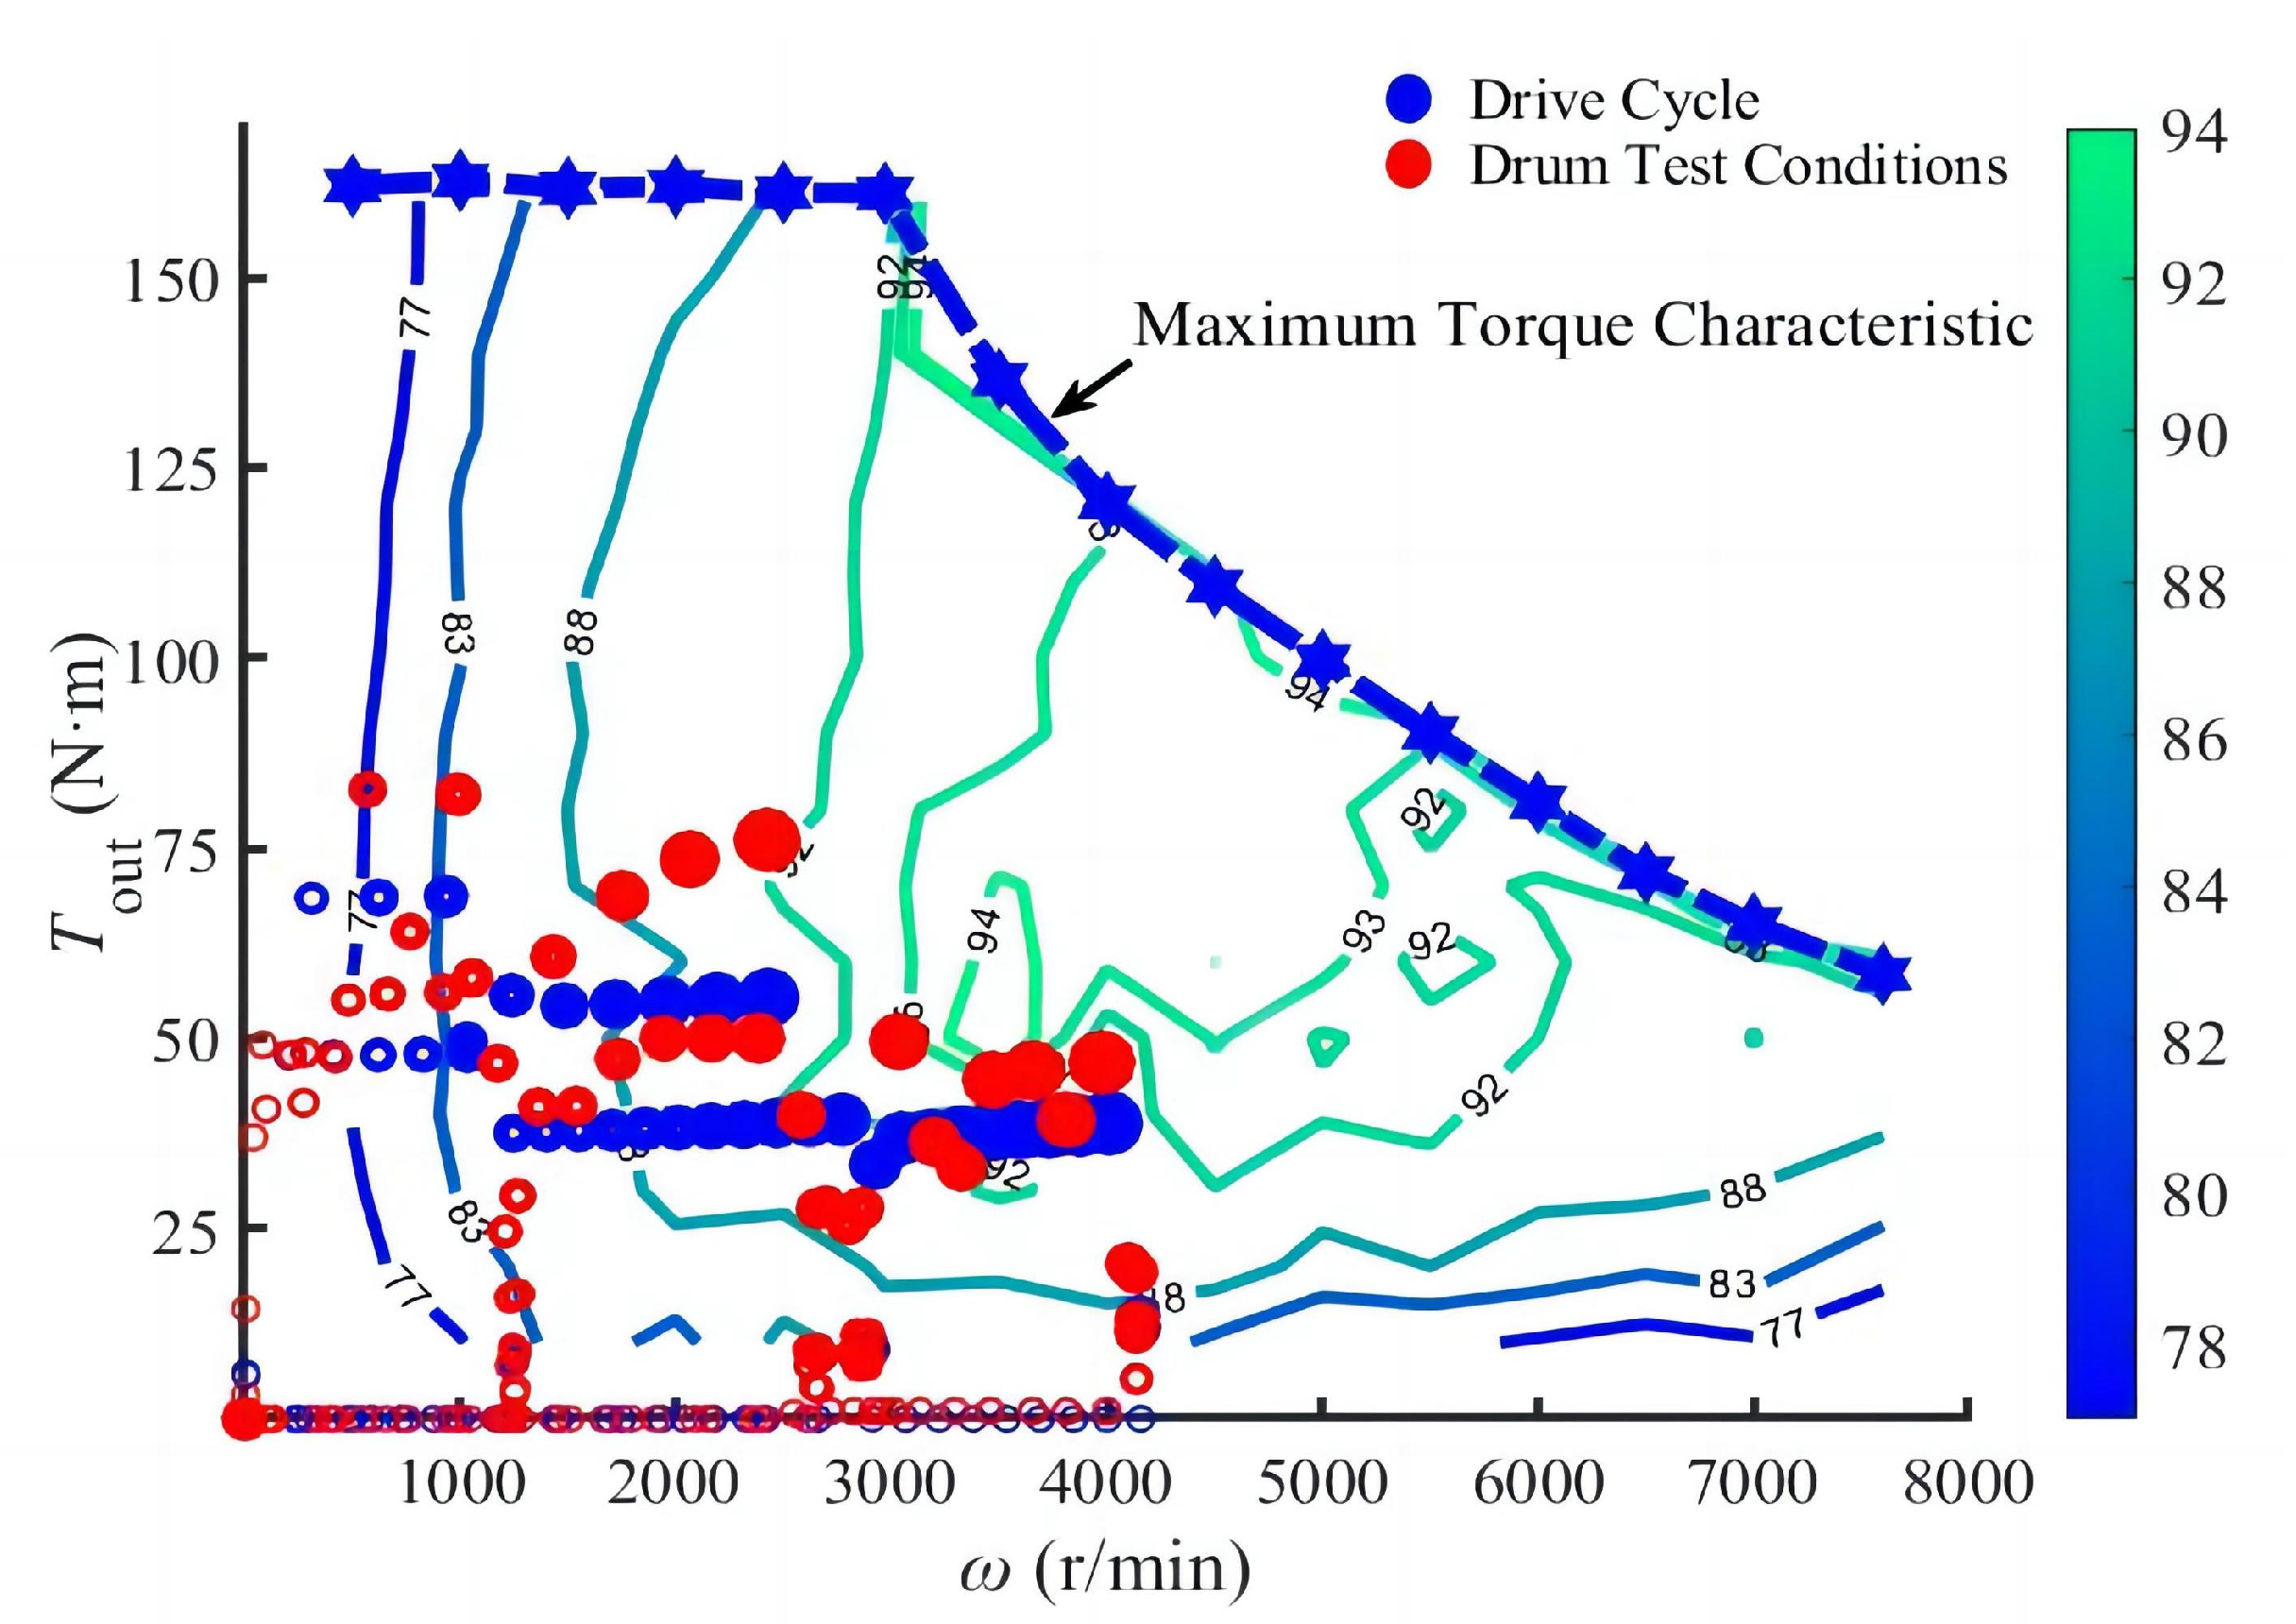
2.1. Vehicle Braking System and Dynamometer Bench Test

Figure 1 below shows the bench test schematics, physical drawings, and brake system model drawings of the two models developed by China Liuzhou SAIC-GM-Wuling Automobile Co., Ltd. in this study. Figure 1a is the schematic diagram of the bench test principle, and Figure 1b is the physical diagram of the bench test. The bench test mainly consists of a motor controller, battery, motor, transmission, and dynamometer. Figure 1c,d show the schematic diagram of two small pure electric vehicle brake system models, which are mainly composed of vehicle controllers, drive motors, motor controllers, rear axle reducers, etc. The main difference is between the front- and rear-drive modes of the two. For vehicle drivers, the modeling of electric vehicle braking devices is similar to that of traditional vehicle braking devices, and the effect on drivers during braking is the same. Therefore, the dynamic response matching degree of the two systems is also very important for driving safety performance [36]. The main parameters of these two models are shown in Table 1 below.

2.2. Definition of Constraints

By analyzing the braking mechanics of vehicles [37,38,39,40], the four constraint conditions corresponding to the braking feedback scheme are defined. At the same time, it is worth noting that in the running of vehicles, the analysis of vehicle braking mechanics mainly includes longitudinal dynamics, lateral dynamics, and braking systems, which play an important role in the stability of vehicles. This paper will focus on the analysis from the perspective of longitudinal dynamics.

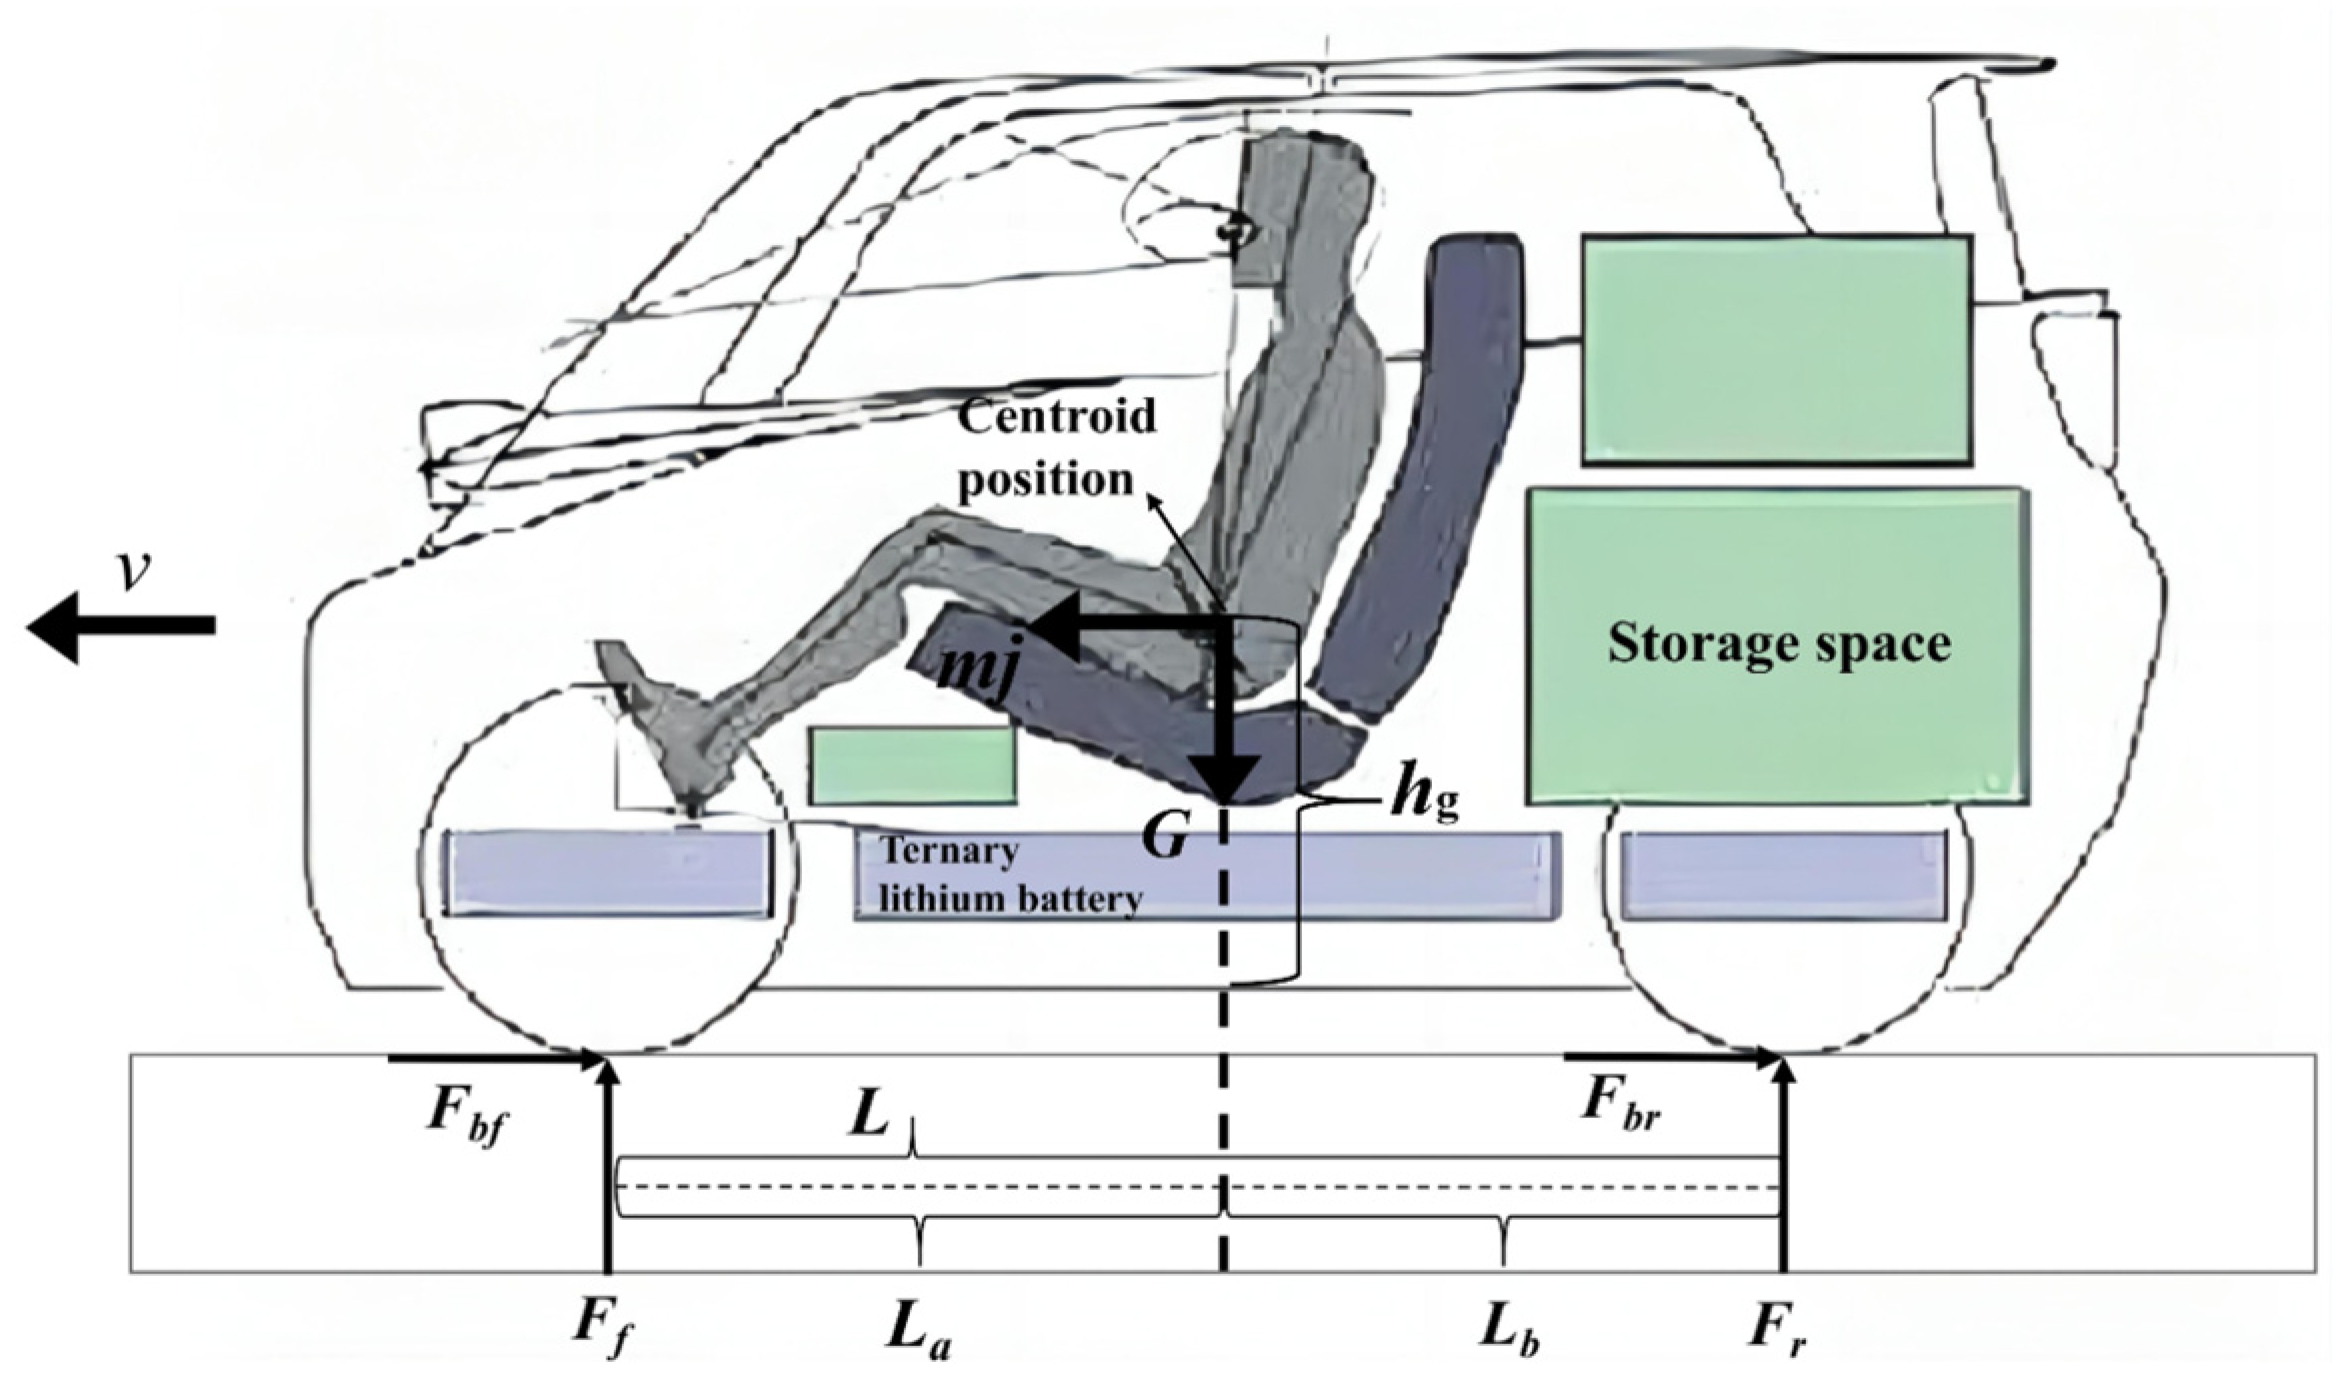
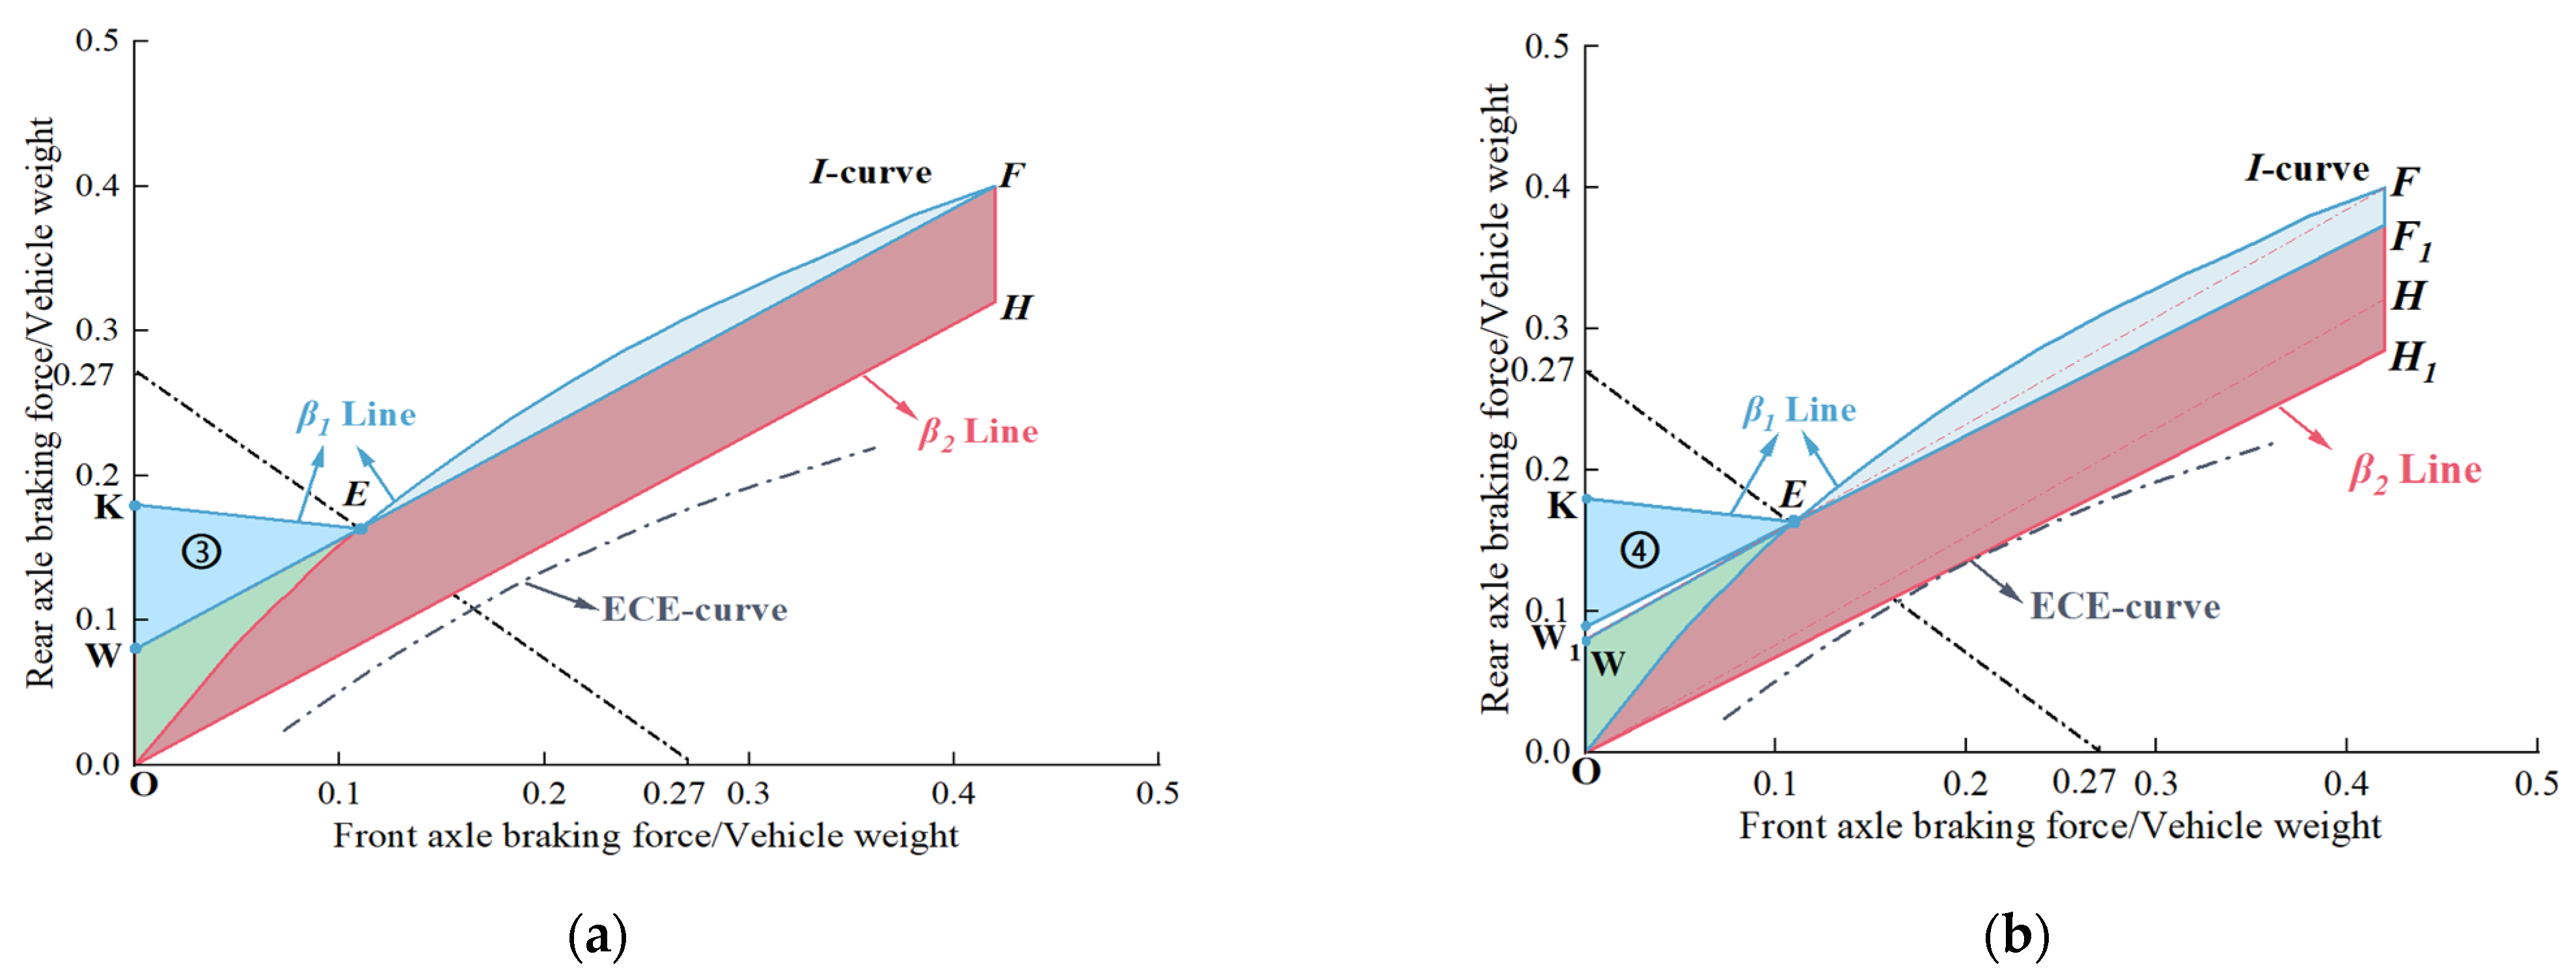
2.2.1. Vehicle Braking Mechanics Analysis

Figure 2 is a simplified force analysis diagram of a pure electric vehicle under two-wheel braking conditions, Among them, Fbf and Fbr are the front and rear axle braking forces acting on the vehicle, generated by the braking torque on the axle. The front and rear braking forces constitute the braking strength z of the entire vehicle:
z = F b f + F b r m g
T b i = F b i · R w   ( i = f , r )
In the above formula, Tbi is the braking torque, which is mainly generated by the feedback braking torque of the drive motor or the friction torque of the friction braking system. Rw is the rolling radius of the wheel; f and r represent the front and rear axles, respectively. The positive pressure between the vehicle and the ground during driving is distributed on the front and rear axles of the vehicle. When the vehicle brakes, the body tilts forward, and the front and rear axle loads change:
F f = m g l ( l b + z h g )
F r = m g l ( l a z h g )
In the formula, Ff and Fr are the positive pressure on the ground; l is the wheelbase of the vehicle; la and lb are the distances between the front and rear axles and the center of mass, respectively; and hg is the height of the vehicle’s center of mass. The specific parameters are shown in Table 1 above. The maximum braking force Fbi.max provided by the road surface to the wheels is determined by the coefficient of adhesion between the road surface and the wheels’ φ decision:
F b i . max = φ F i F b i ( i = f , r )

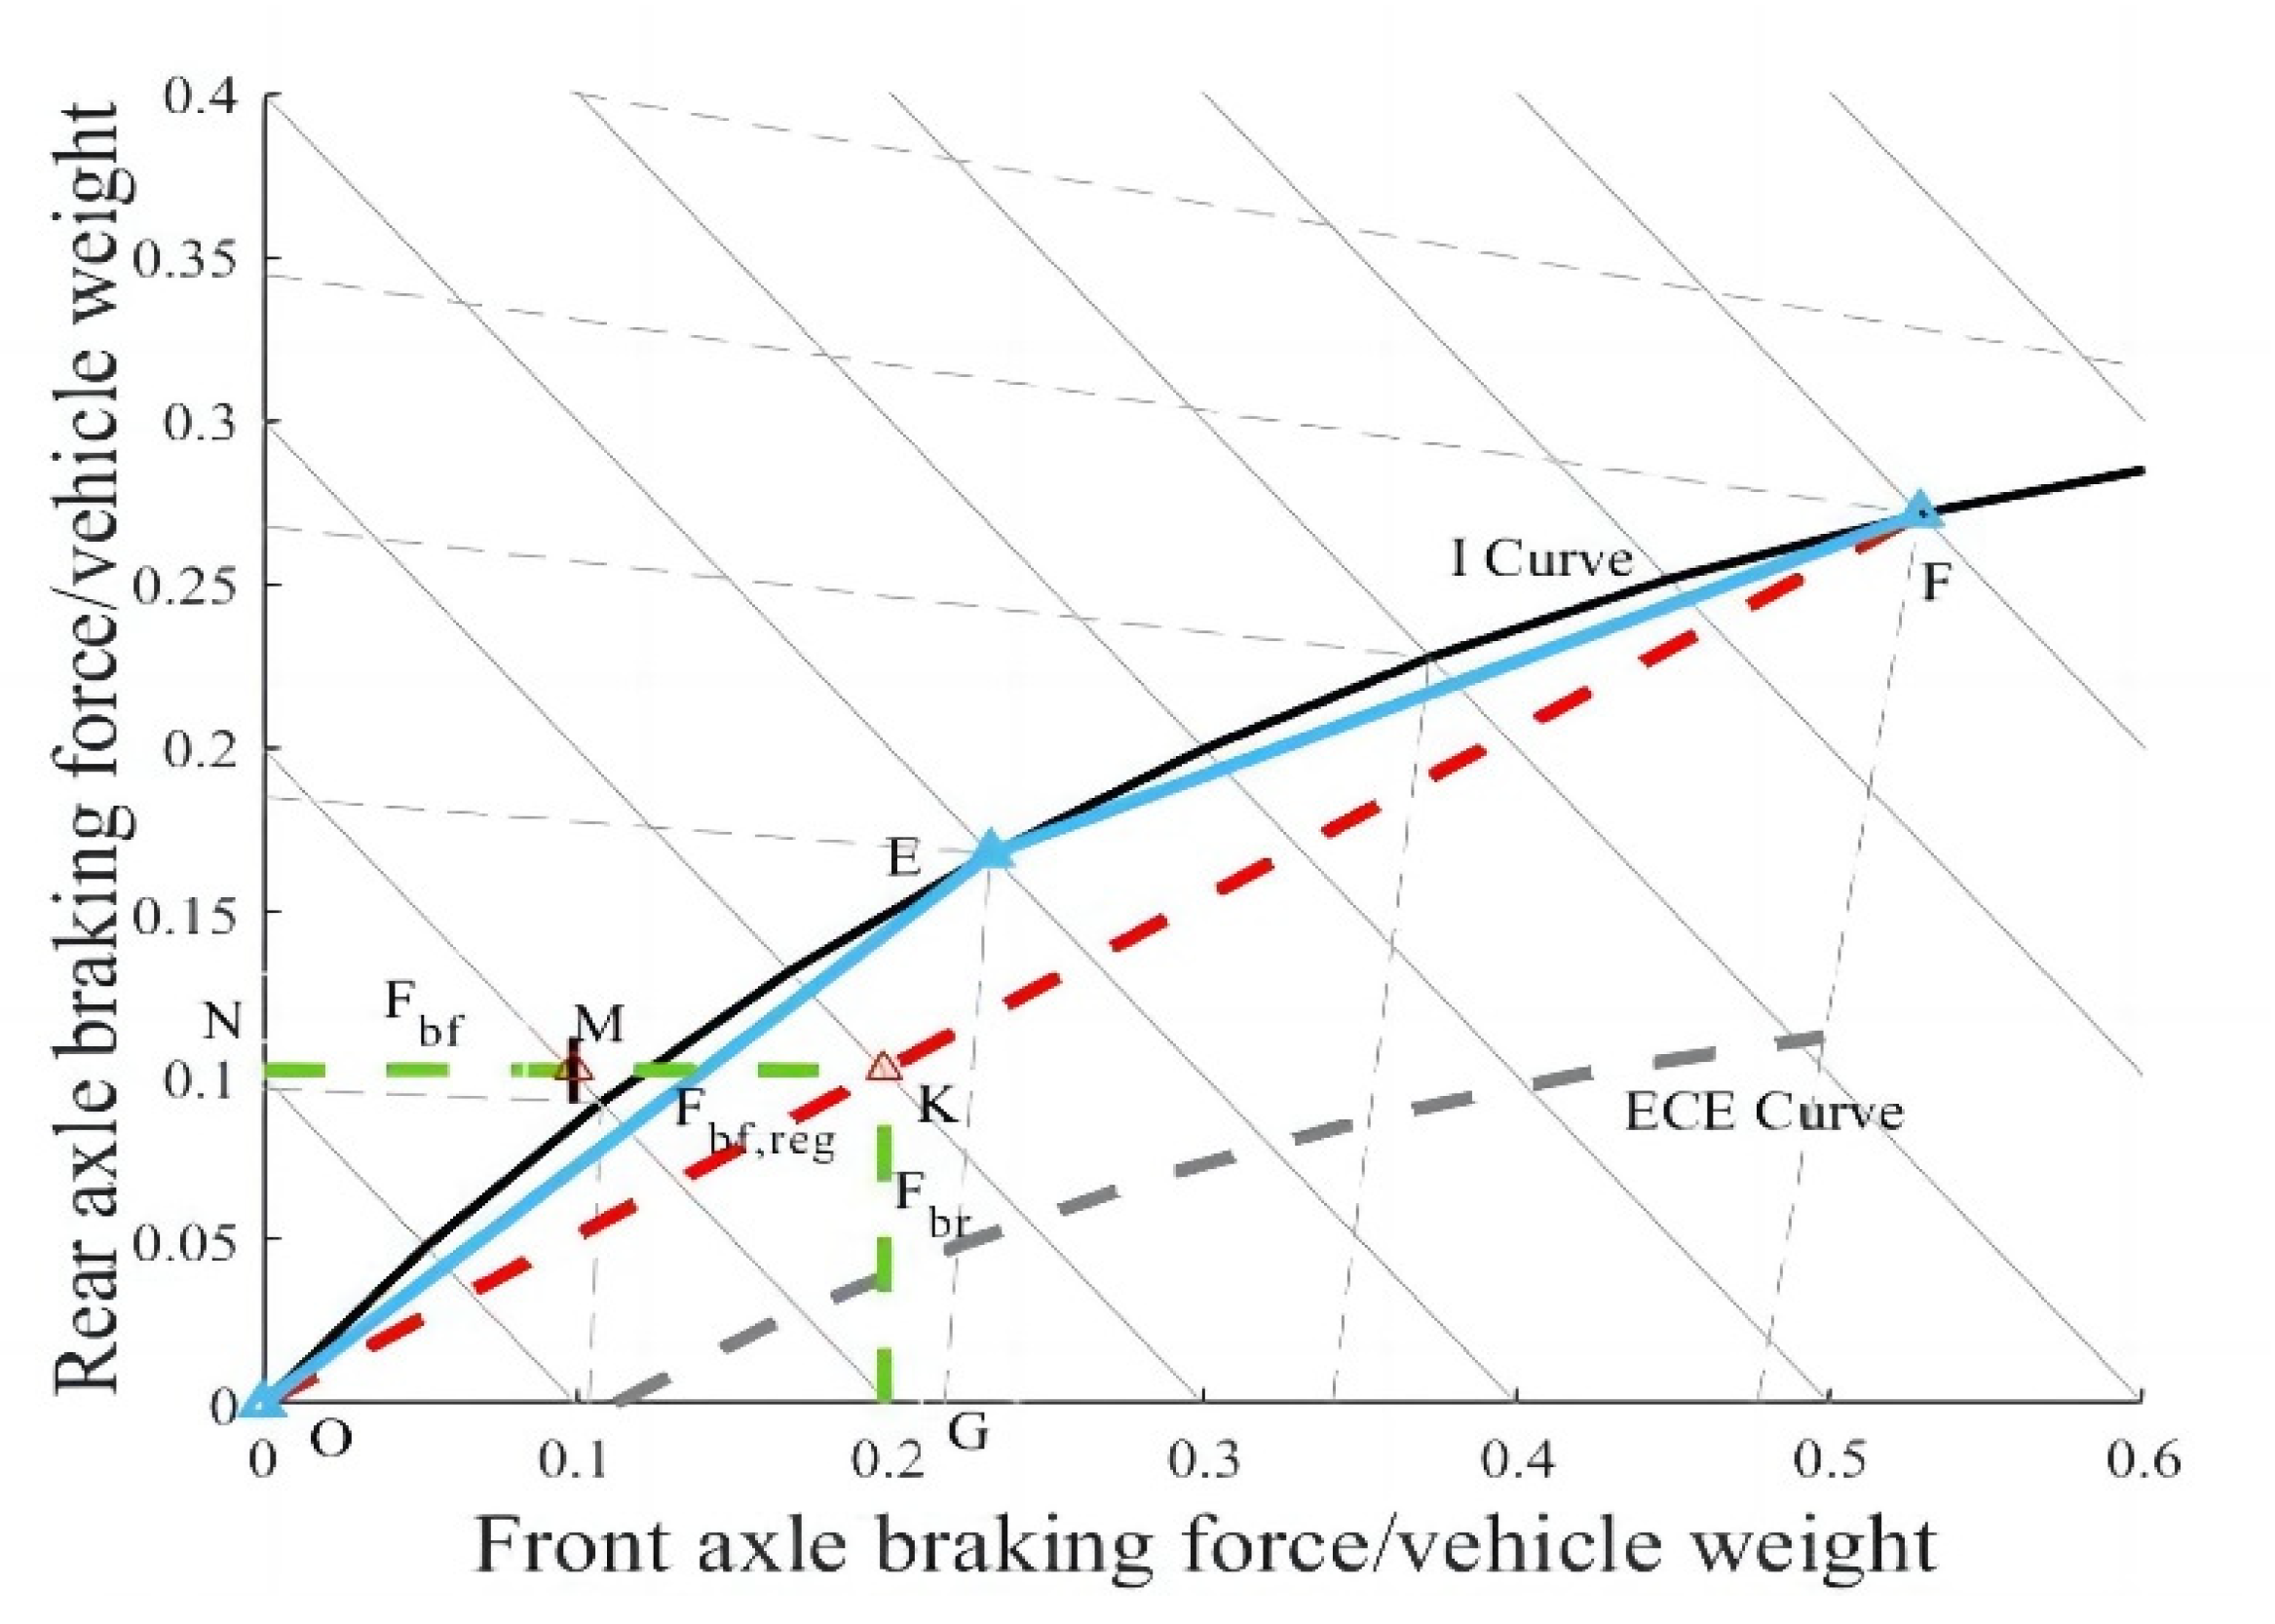
2.2.2. Regulatory Constraints

The regulatory constraints consist of braking stability constraints and braking efficiency constraints. On the road surface with adhesion coefficient φ, the maximum braking strength Zmax = φ reached by the vehicle, combining Equations (3) and (4) above, obtain the analytical formula for the I curve:
F b f F b r = F f F r
F b f = F b r L b + z h g L a z h g
When the braking torque Tbi increases beyond the road adhesion limit Fbi.max, the vehicle is in a locked state, and rear wheel locking will cause the braking to lose stability. The braking stability constraint specifies the maximum braking force of the rear wheels at different braking intensities, thereby ensuring that the front wheels lock up before the rear wheels. The specific requirements are shown in Figure 3. On the road surface of 0 < φ < 0.8, the braking force distribution curve must be located below the I curve. The straight line OF and the broken line OEF are the two curves that satisfy braking stability.
The braking stability constraint specifies the maximum value of the rear wheel braking force. The braking efficiency constraint condition specifies the minimum value of rear wheel braking force at different braking intensities, avoiding the problem of too small a rear wheel braking force leading to an extended braking distance. The expression of the braking efficiency constraint condition is:
Z max > 0.1 + 0.85 ( φ 0.2 )   ( 0.2 < φ < 0.8 )
To meet the braking efficiency constraints, the requirement is to be located above the ECE curve (braking efficiency curve) in Figure 3.

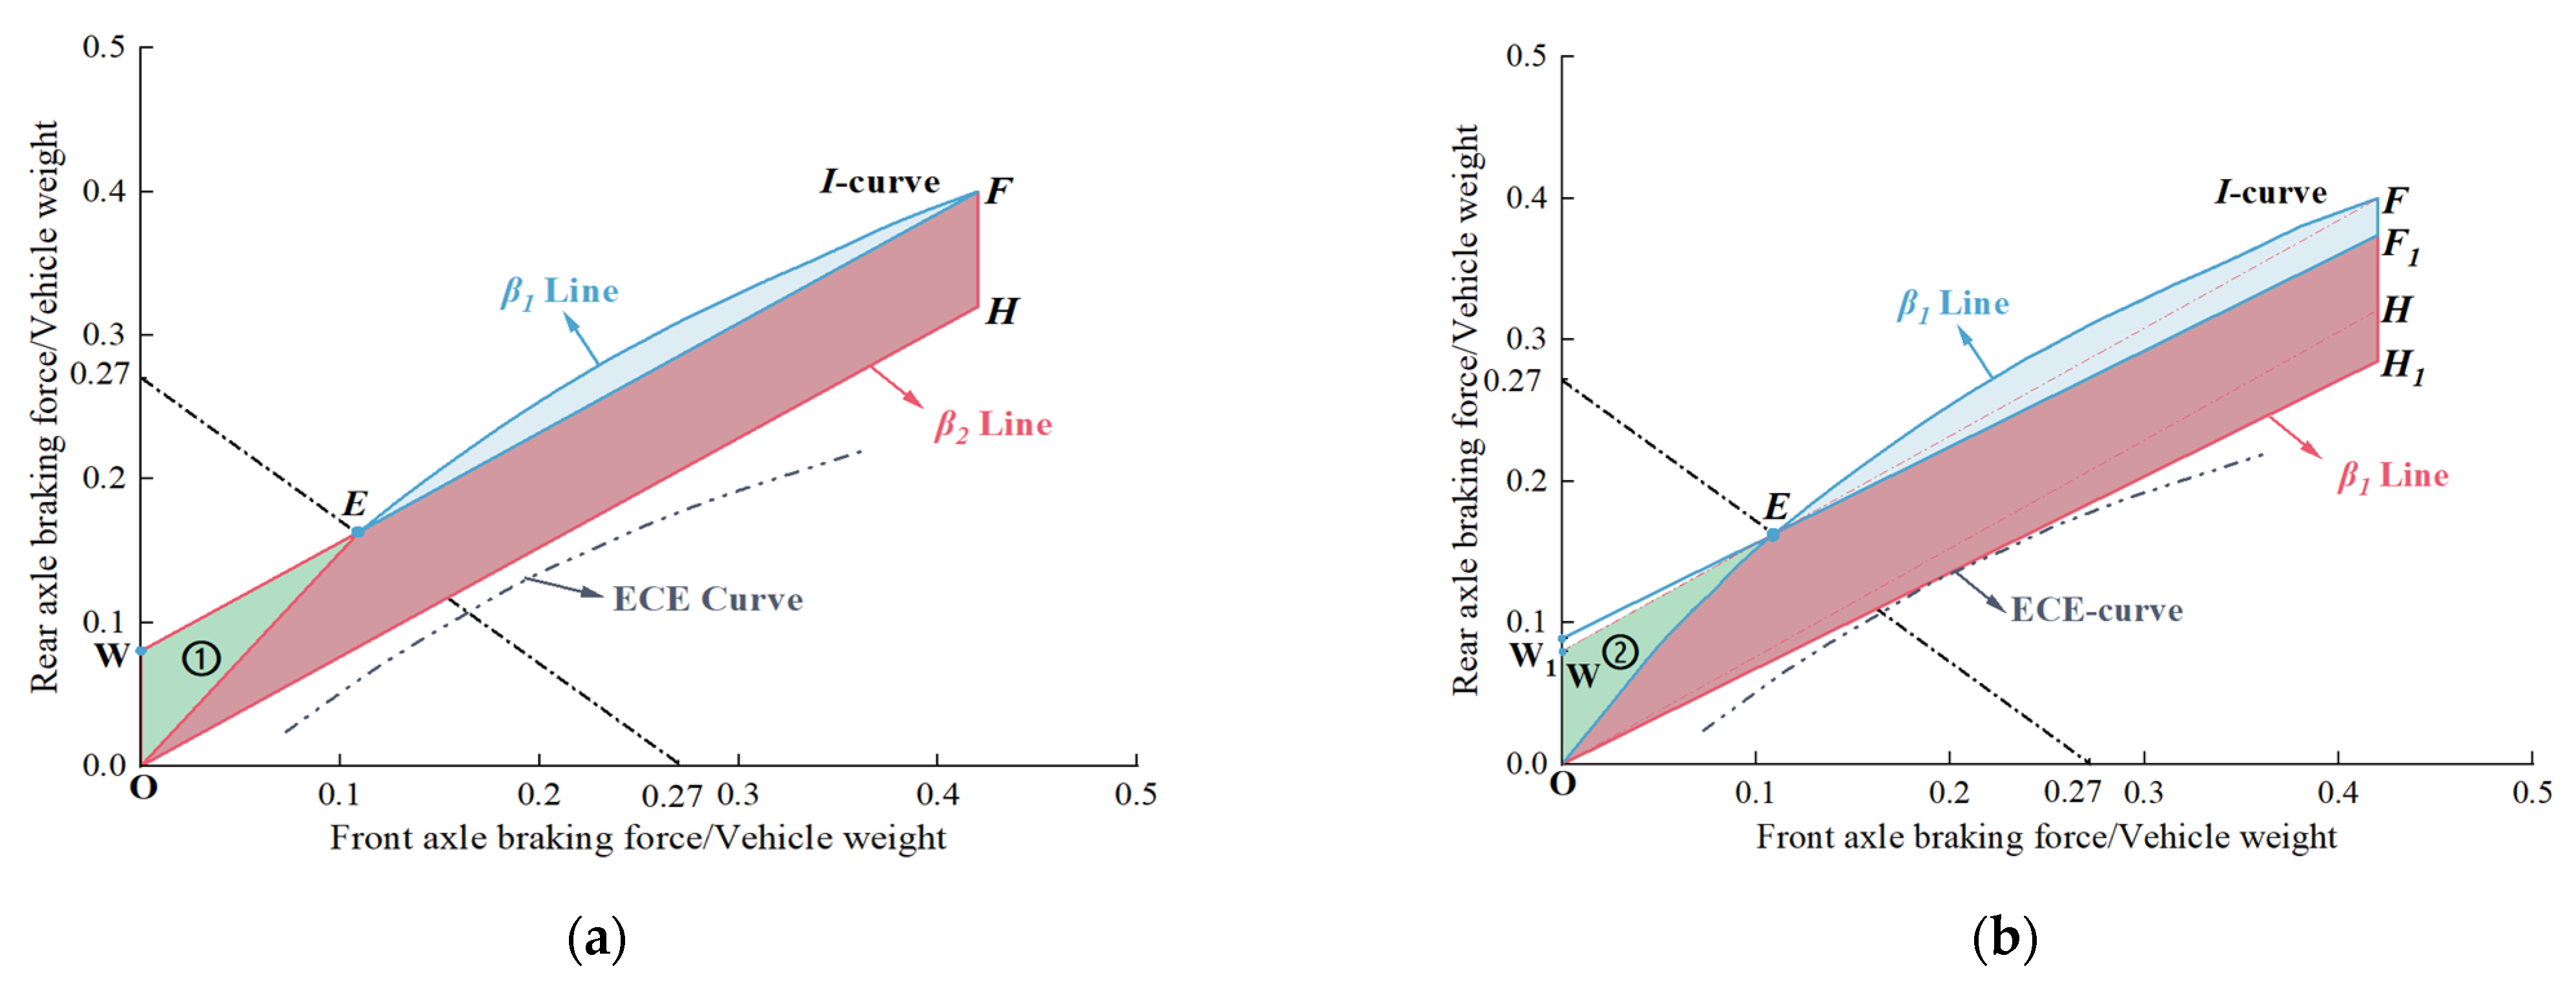
2.2.3. Decoupling Control Constraints

In the braking feedback scheme, the braking force is determined by the power system status and is provided by the target area of the feedback braking force (MK section in Figure 3), friction braking force Fbf (NM section in Figure 3), and Fbr (KG section in Figure 3) to meet the braking demand. The feedback braking force and friction braking force adopt a collaborative control working mode, and, in the braking feedback scheme designed in this study, the collaborative control mode of feedback braking force and friction braking force must meet the decoupling control constraint condition, In other words, the friction braking force distribution curve β2 and the feedback braking force are designed as independent functions of the braking strength z, and there is no relationship between them.

2.2.4. Redundancy Constraints

The reliable performance of the braking system is an important guarantee for driver safety, and the design of the braking feedback scheme must ensure its safety and stability while being efficient. To ensure safety performance when taking braking measures, the proposed braking feedback scheme must meet redundancy constraints; that is, both the total braking force distribution curve of the front and rear axles and the friction braking distribution curve must meet regulatory constraints.

2.2.5. Optional Vehicle Configuration Constraints

After meeting the three constraints mentioned above, the proposed brake feedback scheme must also meet the optional vehicle configuration constraints. These mainly focus on rear-drive vehicles and explore the impact of vehicle configuration. For example, in designing brake feedback schemes, pedal characteristics need to be considered to ensure a good driving experience, which is the pedal characteristic constraint condition. This constraint condition weakens with the enhancement of vehicle configuration. The higher the vehicle configuration, the fewer the constraint conditions and the higher the feedback efficiency that can be achieved.

2.3. Feedback Efficiency and Braking Efficiency

For braking feedback efficiency ρ, the definition is as follows: the portion of energy Efb that is recovered and stored in the feedback device during a complete cycle of braking energy Ere, and then reused by the power system and transmitted to the driving wheel. The reuse of the dynamic system includes two aspects: topological structure selection and dynamic system parameter optimization. The former refers to the selection of the organizational structure of each component of the power system, and the latter is a key link in the energy efficiency optimization of pure electric vehicles, which determines the maximum performance that pure electric vehicles can achieve. In terms of topology structure, the current research status is divided into three categories: hybrid power system, fuel cell power system, and pure electric system. This research paper focuses on the analysis of two topologies of single-motor vehicles in series and parallel in the pure electric system so that the mileage increase rate of pure electric vehicles can reach 30–40%, as shown in the following equation [41]:
E r e = F b i . max · v ω d t
ρ = E f b E r e = η c · η p
In the formula, v is the vehicle speed; ω is the transmission coefficient during the braking feedback process, which is affected by the SoC state of charge and temperature, and is generally taken as 0.9; and η c is the efficiency of the feedback braking force. If the feedback braking force provides all braking strengths, then η c = 100%; η p is the average efficiency of the powertrain.
This study was conducted based on the distribution characteristics of braking strength according to the GB/T 18386.1-2021 (GB/T 18386.1-2021 (samr.gov.cn, accessed on 15 June 2023)) standard to comprehensively evaluate the braking feedback efficiency through a powertrain model. The GB/T 18386.1-2021 standard and its distribution of braking energy are shown in Figure 4. It can be seen that almost all braking feedback energy in this standard is between 0.05 and 0.1, which represents the normal daily road conditions in most cities in China.
For the above driving cycle conditions, the range improvement rate can more intuitively reflect the range performance than the feedback efficiency. The range improvement rate θ can be expressed as a single value function of the feedback efficiency ρ:
θ ( θ ) = θ ρ 1 θ ρ
For braking efficiency, it refers to the maximum braking strength that the braking system can achieve on the road surface with a characteristic adhesion coefficient. The relationship between front- and rear-drive vehicles and braking efficiency is not the same. For rear-drive vehicles, adding feedback braking force on the friction braking force curve β2 makes the total braking force curve β1 more coincident with the I curve. On the premise of improving feedback efficiency, braking efficiency also increases. For front-drive cars, increasing the feedback braking force on the friction braking force curve β2 results in the total braking force curve β1 being far away from the I curve. On the premise of improving the feedback efficiency, the braking efficiency decreases, and there is a competitive relationship between the two. The next section will analyze this competitive relationship in detail. Usually, the maximum value of adhesion coefficient utilization can be used to describe braking efficiency, represented by the mass coefficient Q [42]:
Q = Z max φ

2.4. Application Algorithms and Flow Charts

At present, the commonly used solving algorithms in a lot of research status include the genetic algorithm, particle swarm algorithm, and ant colony algorithm. The genetic algorithm is mature both in theory and application and is used as the applied algorithm in this paper. The genetic algorithm has inherent implicit parallelism and global optimization and produces a large number of feasible solutions in each generation, which is suitable for solving multi-objective optimization problems, and lays a foundation for multi-objective optimization problems based on optimal braking efficiency and maximum mileage improvement rate for front-drive vehicles in the next section. Figure 5 below is the flow chart of the genetic algorithm.

3. Results and Discussion

In this section, the braking feedback schemes of small rear-drive pure electric vehicles and small front-drive pure electric vehicles are analyzed and compared based on the simulation software MATLAB R2022a Simulink and the research method of the brake mechanics diagram. The simulation results are expressed in a more intuitive range improvement rate, and, finally, the best braking feedback schemes for both front-drive and rear-drive models are proposed.

3.1. Brake Feedback Scheme for Rear Drive

In the design of the rear-drive braking feedback scheme, the braking system has different vehicle configuration conditions, which constitute different vehicle configuration constraints. The more vehicles are configured, the looser the corresponding constraints. This section focuses on the analysis of the relationship between vehicle configuration and feedback efficiency. As shown in Table 2 below, three vehicle configuration conditions are designed, and vehicle configuration 1 is “EBD”, so that the front and rear braking force distribution ratio can be adjusted accordingly in the design stage. Vehicle configuration 2 is “ABS”, and vehicle configuration 3 is “pedal characteristics”. The pedal characteristics need to be adjusted when formulating the brake feedback scheme, and even the pedal simulator can be added. According to vehicle configuration conditions, six braking feedback schemes are proposed in this study, among which parallel braking feedback scheme RPF1 does not have three vehicle configuration conditions. The RPF2 solution has vehicle configuration condition 1 “EBD”. The series brake feedback scheme RSF1 and RSF2 have vehicle configuration condition 1 “EBD” and vehicle configuration condition 2 “ABS”; the RSF1A and RSF2A schemes have all three vehicle configuration conditions.

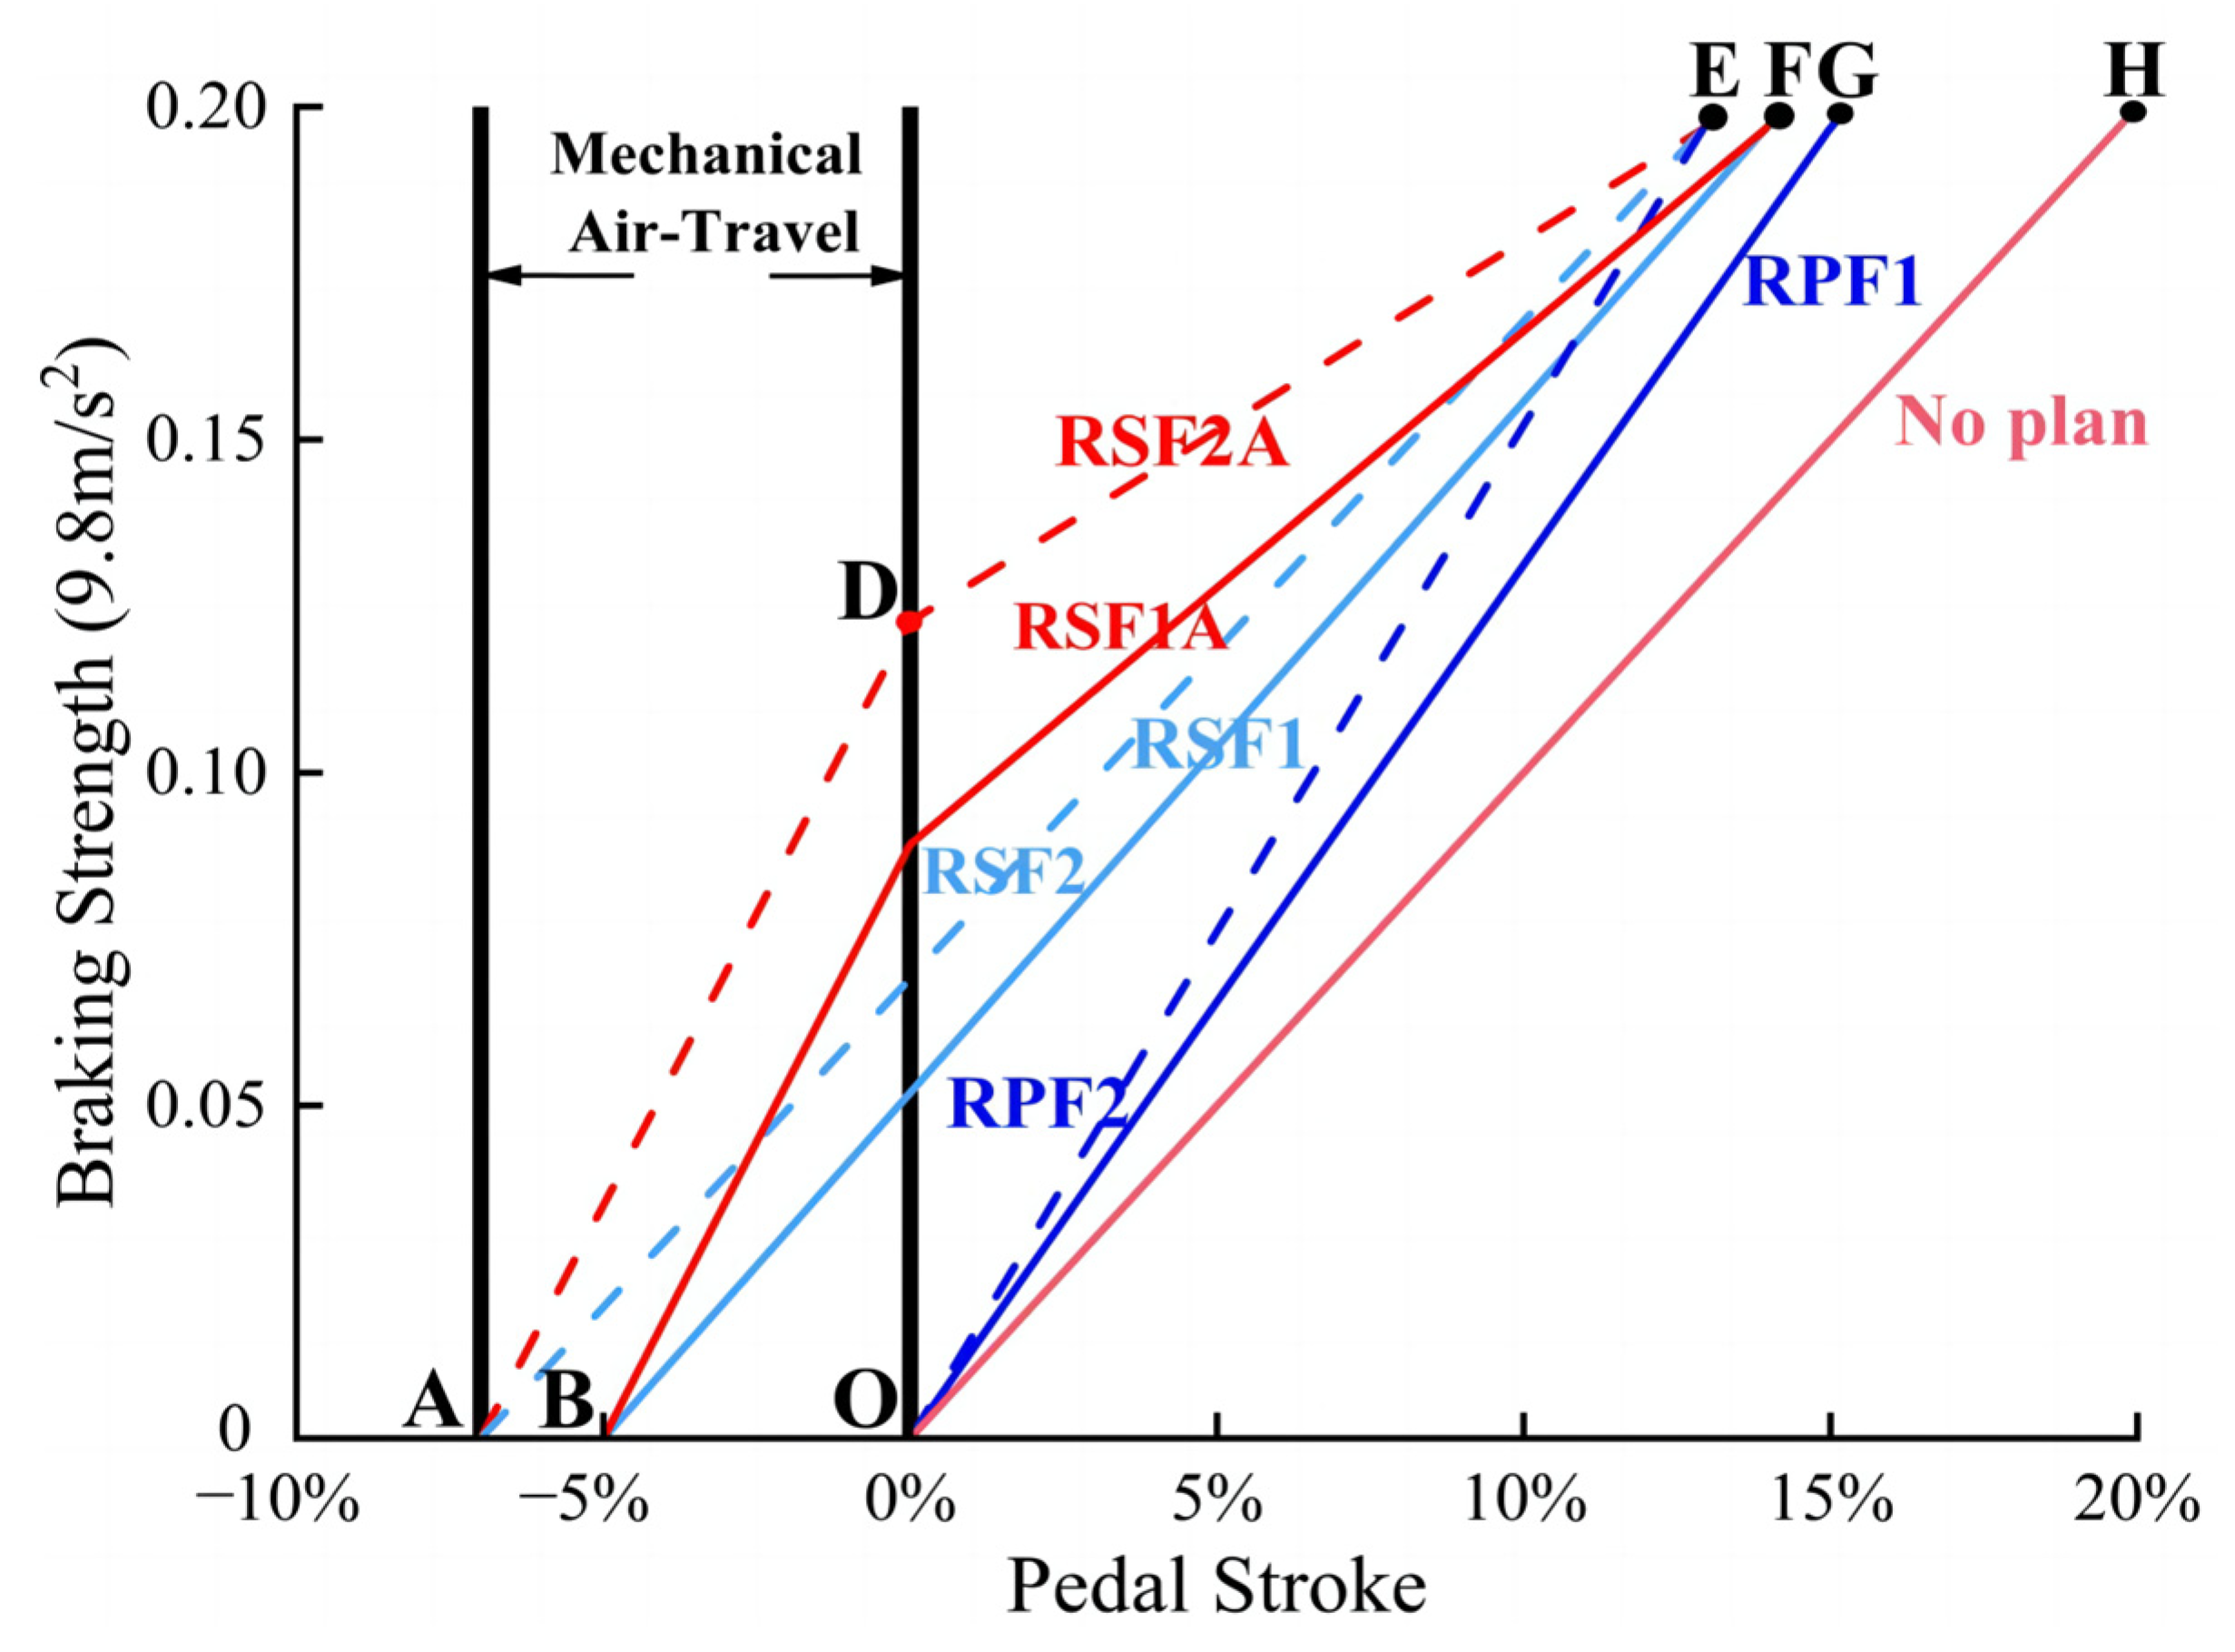
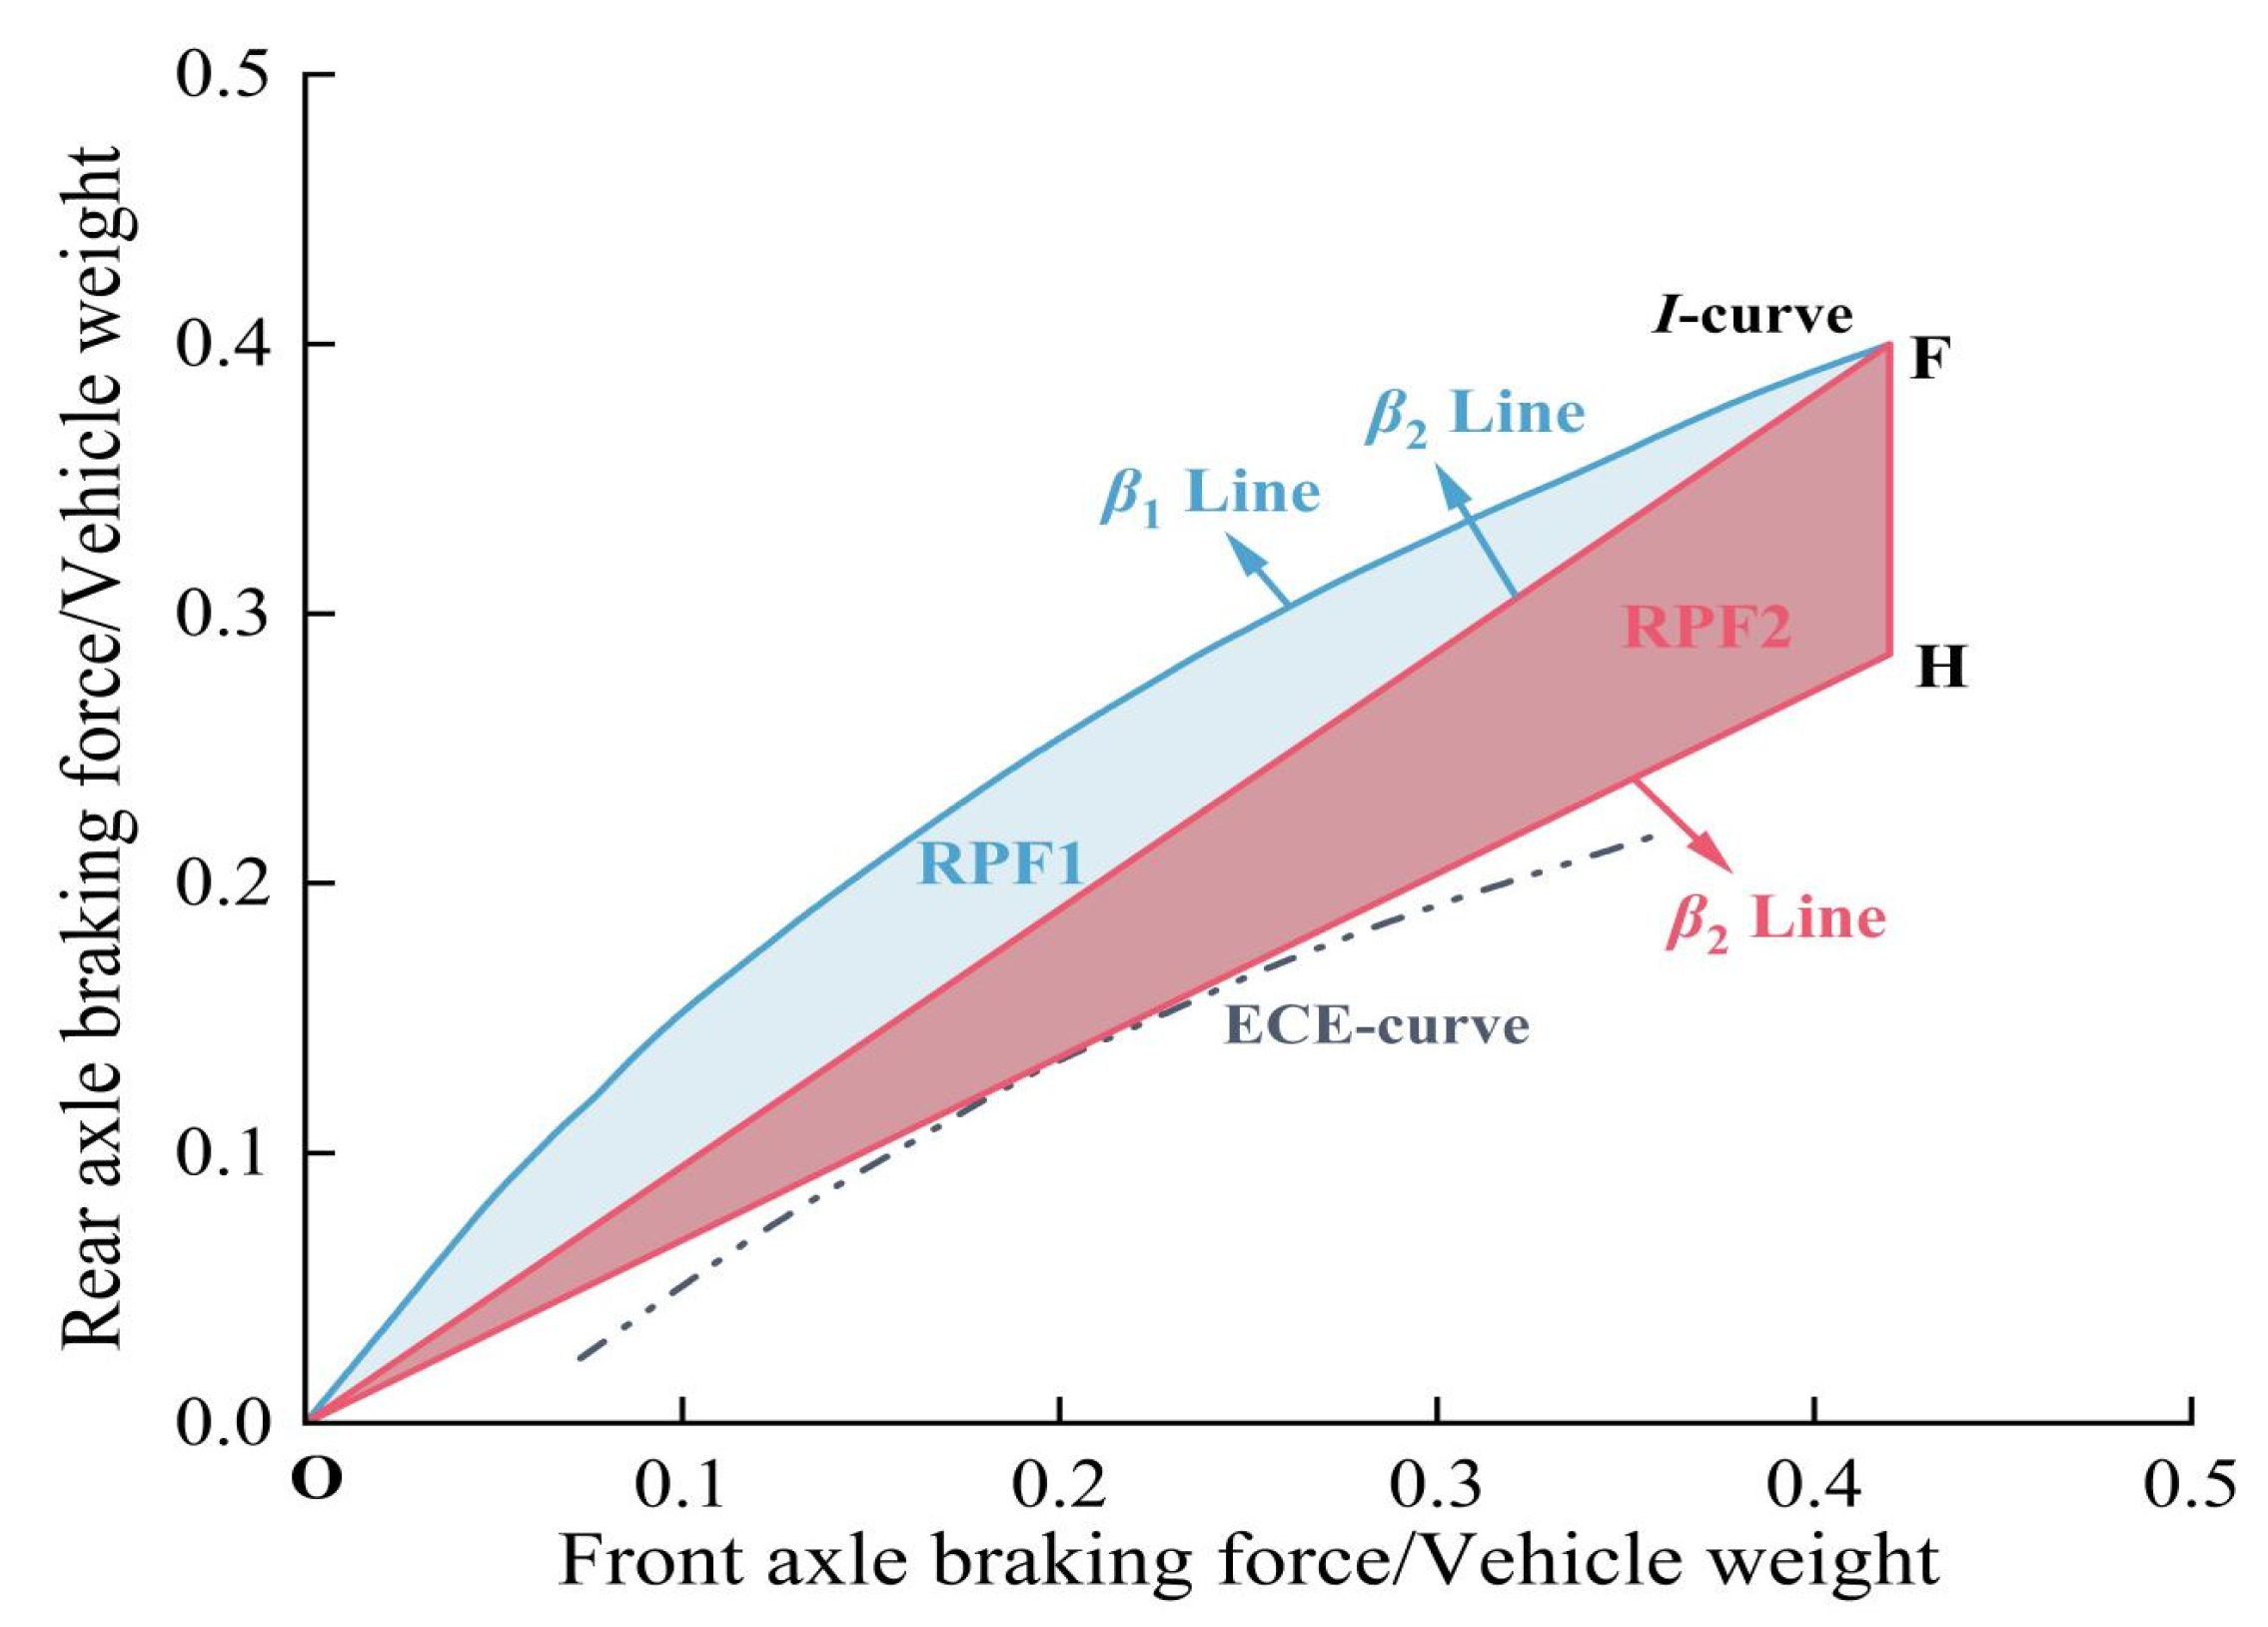
3.1.1. Parallel Braking Feedback Scheme RPF1/RPF2

In practice, as the weight of the passenger changes, the I curve changes accordingly. Therefore, all feedback schemes in the analysis are conservatively designed, leaving a certain safety margin. Figure 6 shows the braking feedback scheme RPF1. To meet the braking stability requirements under regulatory constraints, the additional rear wheel feedback braking force can only be the shaded area surrounded by curves I and lines OF, and the total braking force distribution curve β is the curve OF (a part of curve I).
Figure 6 also shows the braking feedback scheme RPF2. The brake feedback scheme is available in vehicle configuration 1; that is, the slope OF of the line may be adjusted to OH until it is tangent to the ECE curve. Under the premise of meeting the braking stability constraints, the additional rear wheel feedback braking force increases the OFH region compared with the above RPF1 scheme. When the feedback braking force fails, the total braking force distribution curve is an OC line, and the slope cannot be lower, otherwise the braking efficiency constraints will be violated.
Under any braking strength, the feedback efficiency of RPF2 is greater than that of RPF1, but under the condition of feedback braking force failure, on the road surface with the same adhesion coefficient, the maximum braking strength of the RPF1 scheme is greater than that of the RPF2 scheme, and the braking efficiency of the RPF2 scheme is worse than that of the RPF1 scheme.

3.1.2. Series Brake Feedback Scheme RSF1/RSF2

Figure 7a,b show the area diagram of the series brake feedback scheme, hereinafter referred to as RSF1 and RSF2, respectively. A series of brake feedback schemes obtained by forming a straight line between point E and other slopes are called series brake feedback schemes. Among them, the RSF1 scheme has the highest slope. However, if the slope is too large, the braking stability constraints cannot be met. In contrast, the RSF2 scheme has the smallest slope, which is tangent to the ECE curve. However, if the slope is too small, the braking performance constraint cannot be satisfied after the feedback braking failure. In this study, the influence of vehicle configuration 2 “ABS” on the brake feedback region is discussed because the RPF1 and RPF2 schemes are parallel brake feedback strategies. When the driver takes braking measures, the feedback braking force and friction braking force act on the braking simultaneously. However, in series braking, feedback braking force takes precedence over friction braking force. In other words, the difference between series braking and parallel braking is whether the feedback braking force plays a decisive role in the braking of the vehicle at low braking intensity. In this section of the study, when the driver applies the brake, the feedback braking force takes precedence over the friction braking force, so the line of OF will move up (to the right for front-drive models). OEW (region ①) in Figure 7a and OEW1 (region ②) in Figure 7b are additional braking force regions for series braking that are significantly higher than the I curve and have a low ground adhesion coefficient (φ < 0.27) under road conditions. In this case, wheel locking may occur, and the braking stability conditions are not met. However, considering the optimization of brake feedback efficiency and the installation of the anti-lock braking system, this study assumes that the ground adhesion coefficient φ < 0.27 meets the constraint condition of brake stability, allowing the use of series braking. Therefore, in the RSF1 scheme, the region surrounded by OHFW is the theoretical maximum braking feedback region, while in the RSF2 scheme, the slope decreases to OF1, and point E intersects the longitudinal coordinate W1. Therefore, the region surrounded by OH1FW1 is the theoretical maximum braking feedback region of the RSF2 scheme. As shown in the figure, the braking feedback area of the RSF2 scheme is much larger than that of the RSF1 scheme, but the braking efficiency of the RSF2 scheme is inferior to that of the RSF1 scheme when the feedback braking fails.

3.1.3. Series Brake Feedback Scheme RSF1A/RSF2A

In the above RSF1 and RSF2 schemes, crossing point E is only allowed to be a straight line. In other words, from the generation of friction braking force to z < 0.27, the feedback braking force is fixed. To increase the proportion of feedback braking force at low braking intensity, a new total braking force distribution curve β1 was obtained by connecting the intersection points K and E of the R line group and the longitudinal coordinate, and corresponding series braking feedback schemes RSF1A and RSF2A were obtained, as shown in Figure 8a,b below. Among them, KEW (region ③) and KEW1 (region ④) are more effective areas of feedback braking force in RSF1A and RSF2A schemes than in RSF1 and RSF2 schemes. In terms of brake feedback area, they are better than the RSF1 and RSF2 schemes, but RSF1A and RSF2A schemes have a greater impact on pedal characteristics, so more vehicle configuration conditions are required. The impact of RSF1A/RSF2A schemes on pedal characteristics will be analyzed in detail below.
In the braking process, the driver’s braking experience is determined by pedal displacement, pedal reaction force, and braking strength. Reasonable pedal characteristics are the guarantee of driving safety and comfort. The pedal travel–brake strength characteristics of the above six brake feedback schemes are shown in Figure 9. The brake pedal has a mechanical idle journey. The point at which friction braking force begins to be defined is the origin O, then OA is the mechanical air travel. The series braking scheme uses mechanical air travel to realize the individual braking of the feedback braking force. There is a linear relationship between the pedal travel of the braking system and the braking strength in the no-braking feedback scheme, as shown in the OH section of the figure. After the addition of feedback braking force, the parallel braking scheme RPF1 (OG line) and RPF2 (OE line) still follow a linear relationship, and the pedal travel is only slightly reduced. In the series braking scheme, the pedal characteristics of RSF1 (BF line) and RSF2 (AE line) are not significantly weakened. However, the pedal characteristics of RSF1A and RSF2A schemes show a significant slope mutation point on the 0% line of pedal travel, and the degree of pedal characteristics is significantly reduced, especially in RSF2A (ADE line) schemes. The consequence of this phenomenon is that in the low braking intensity range, the driver may feel that the braking effect is not significant and increase the pedal strength. However, when the braking intensity is high, the braking effect will return to an obvious state, resulting in a decline in safety performance. In the process of designing the braking feedback scheme, the additional braking force will have a certain influence on the pedal displacement braking strength curve. Based on the least square error of linear regression, the pedal characteristic—braking strength linearity of each braking feedback scheme—was evaluated, and the specific results are shown in Table 3. In the case of RSF1A and RSF2A schemes, it may be necessary to install a brake pedal simulator to balance the impact received. In other words, the RSF1A and RSF2A brake feedback schemes are highly dependent on vehicle configuration condition 3 “pedal characteristics”.
In this section, two parallel braking feedback schemes and four series braking feedback schemes are proposed for rear-drive models based on different vehicle configuration conditions. The more vehicle configuration conditions, the fewer constraints the braking feedback scheme has on the optional vehicle configuration constraints, and the higher the corresponding feedback efficiency is. The feedback efficiency of each scheme will also be comprehensively analyzed below to reflect the positive correlation between feedback efficiency and vehicle configuration conditions.

3.2. Brake Feedback Scheme for Front-Wheel Drive

This section takes Baojun E100 pure electric front-wheel drive vehicle as the research object, and the basic parameters of the vehicle power system are shown in Table 1. As mentioned above, when designing a braking feedback scheme for a front-drive vehicle, adding feedback braking force to the friction braking force distribution curve β2 will move the total braking force distribution curve β1 away from the I curve. Therefore, it is necessary to consider the competitive relationship between feedback efficiency and braking efficiency.

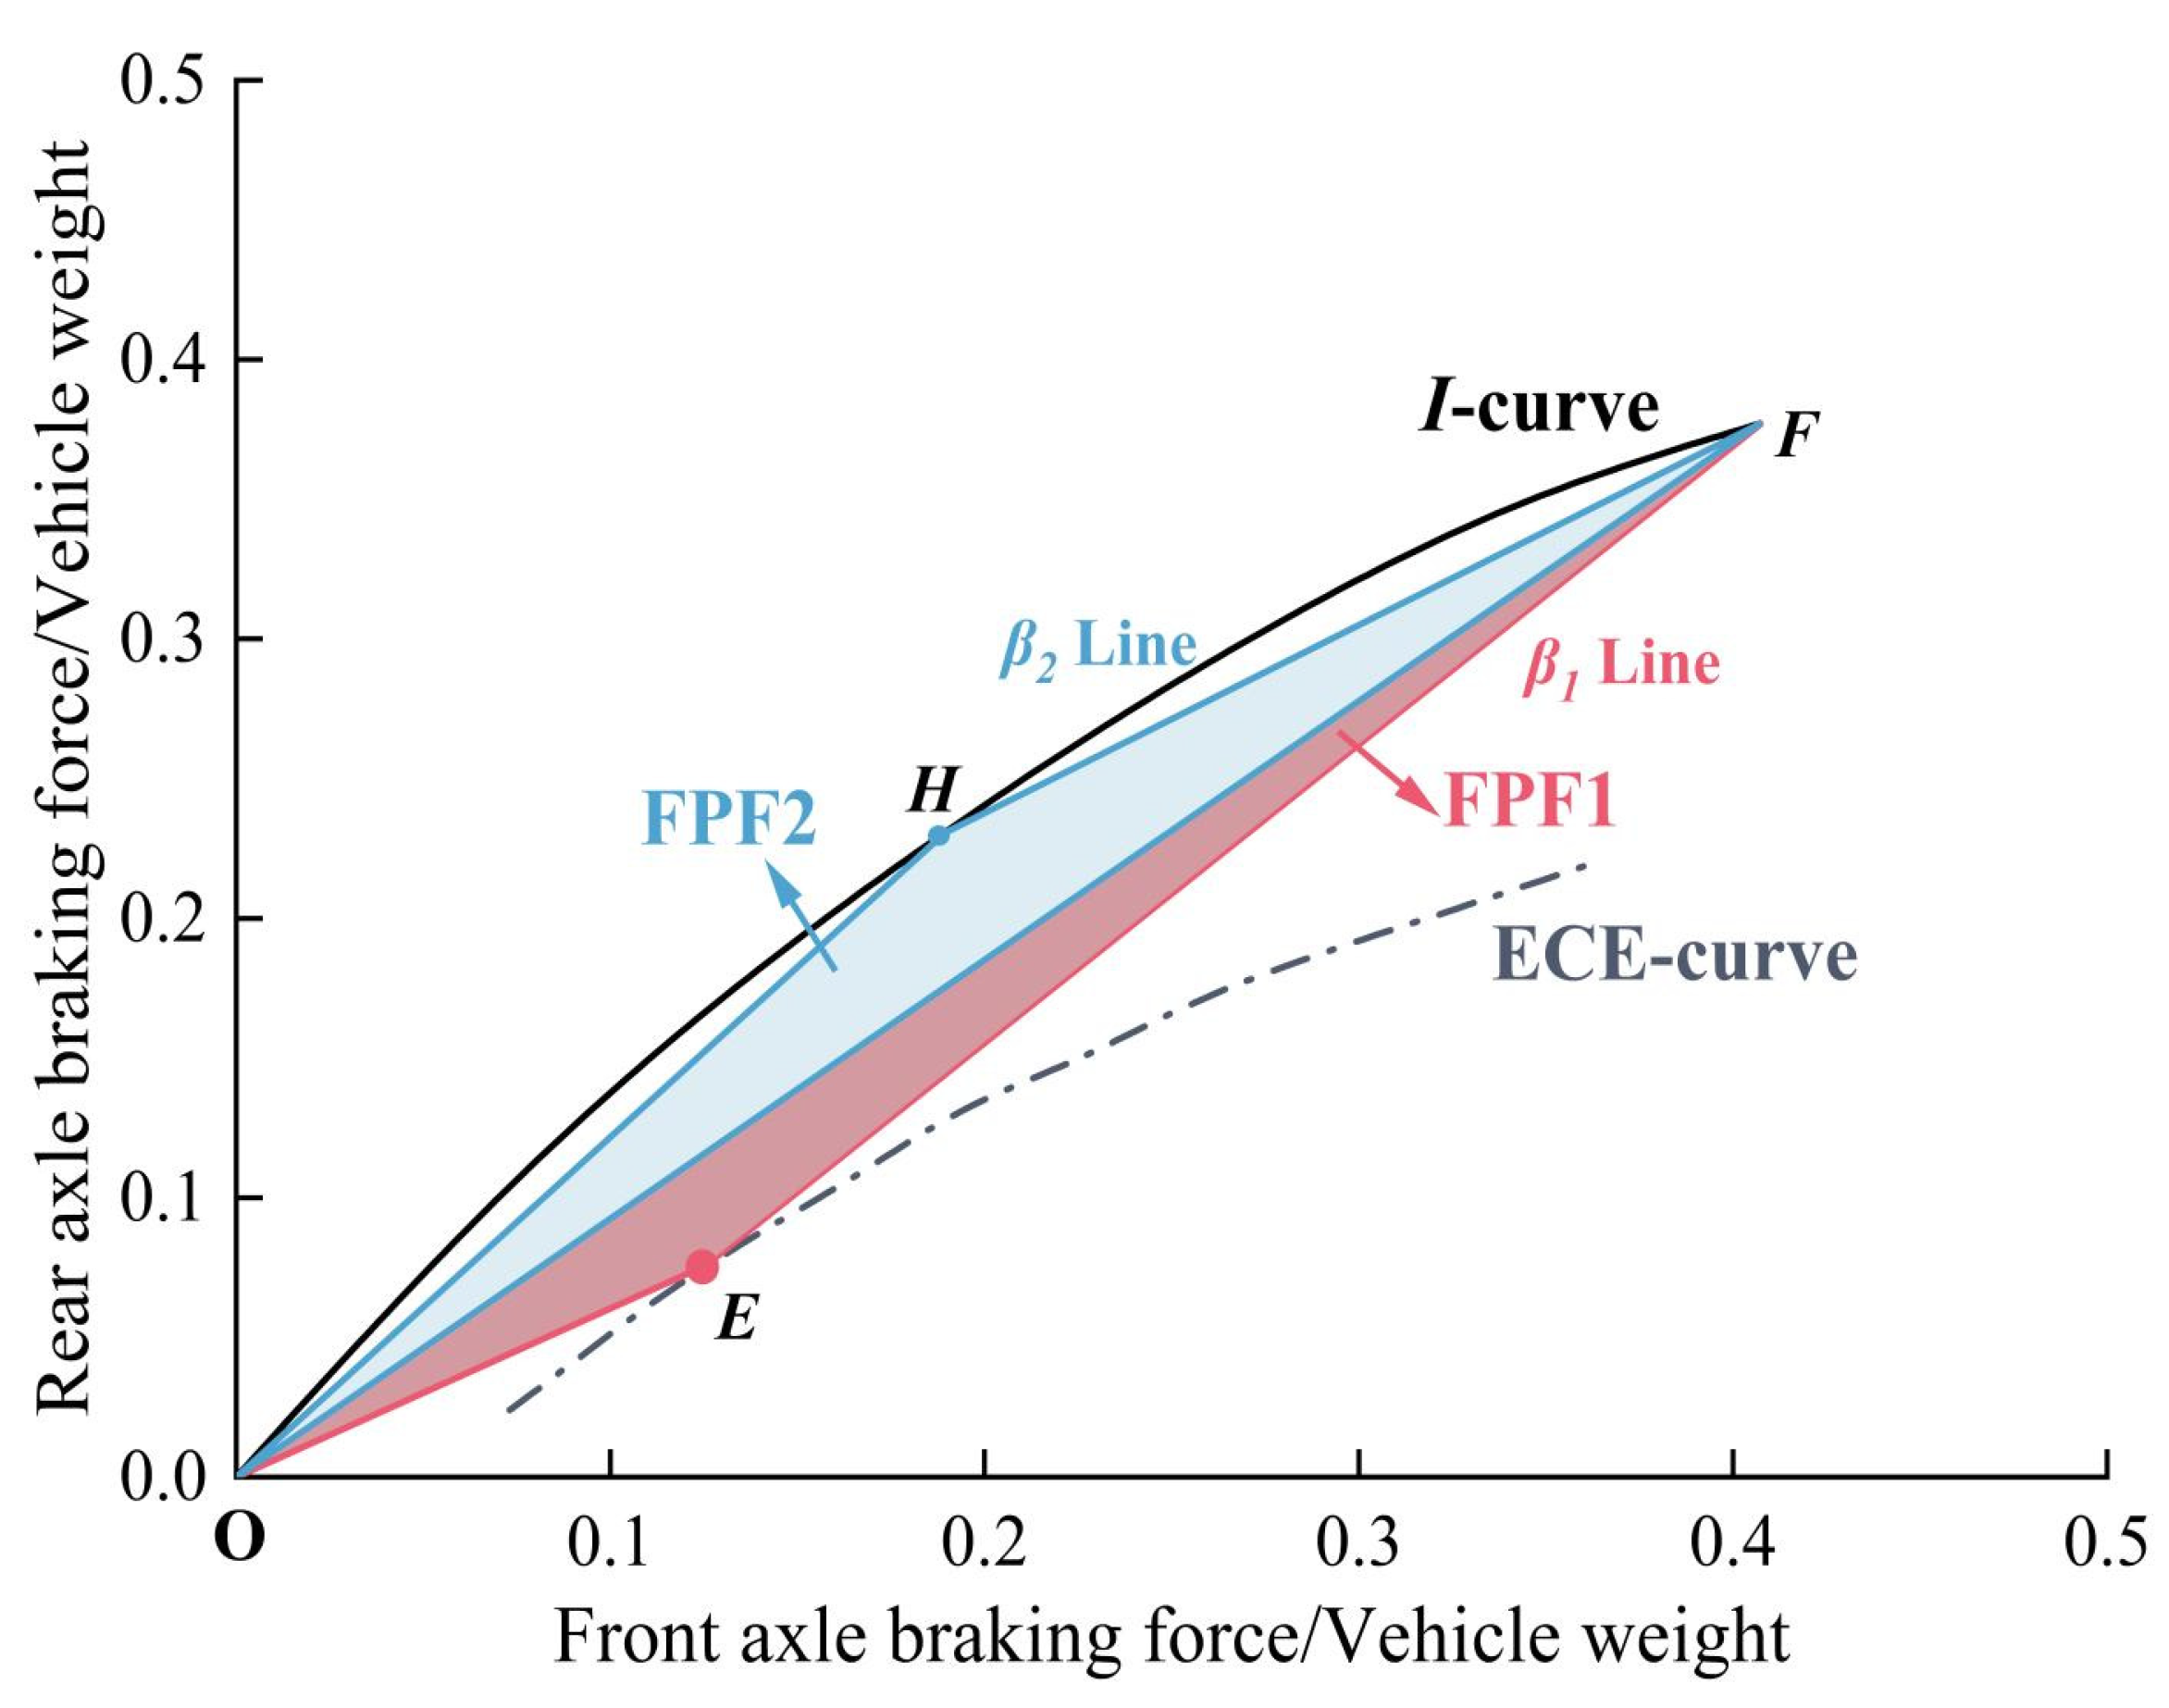
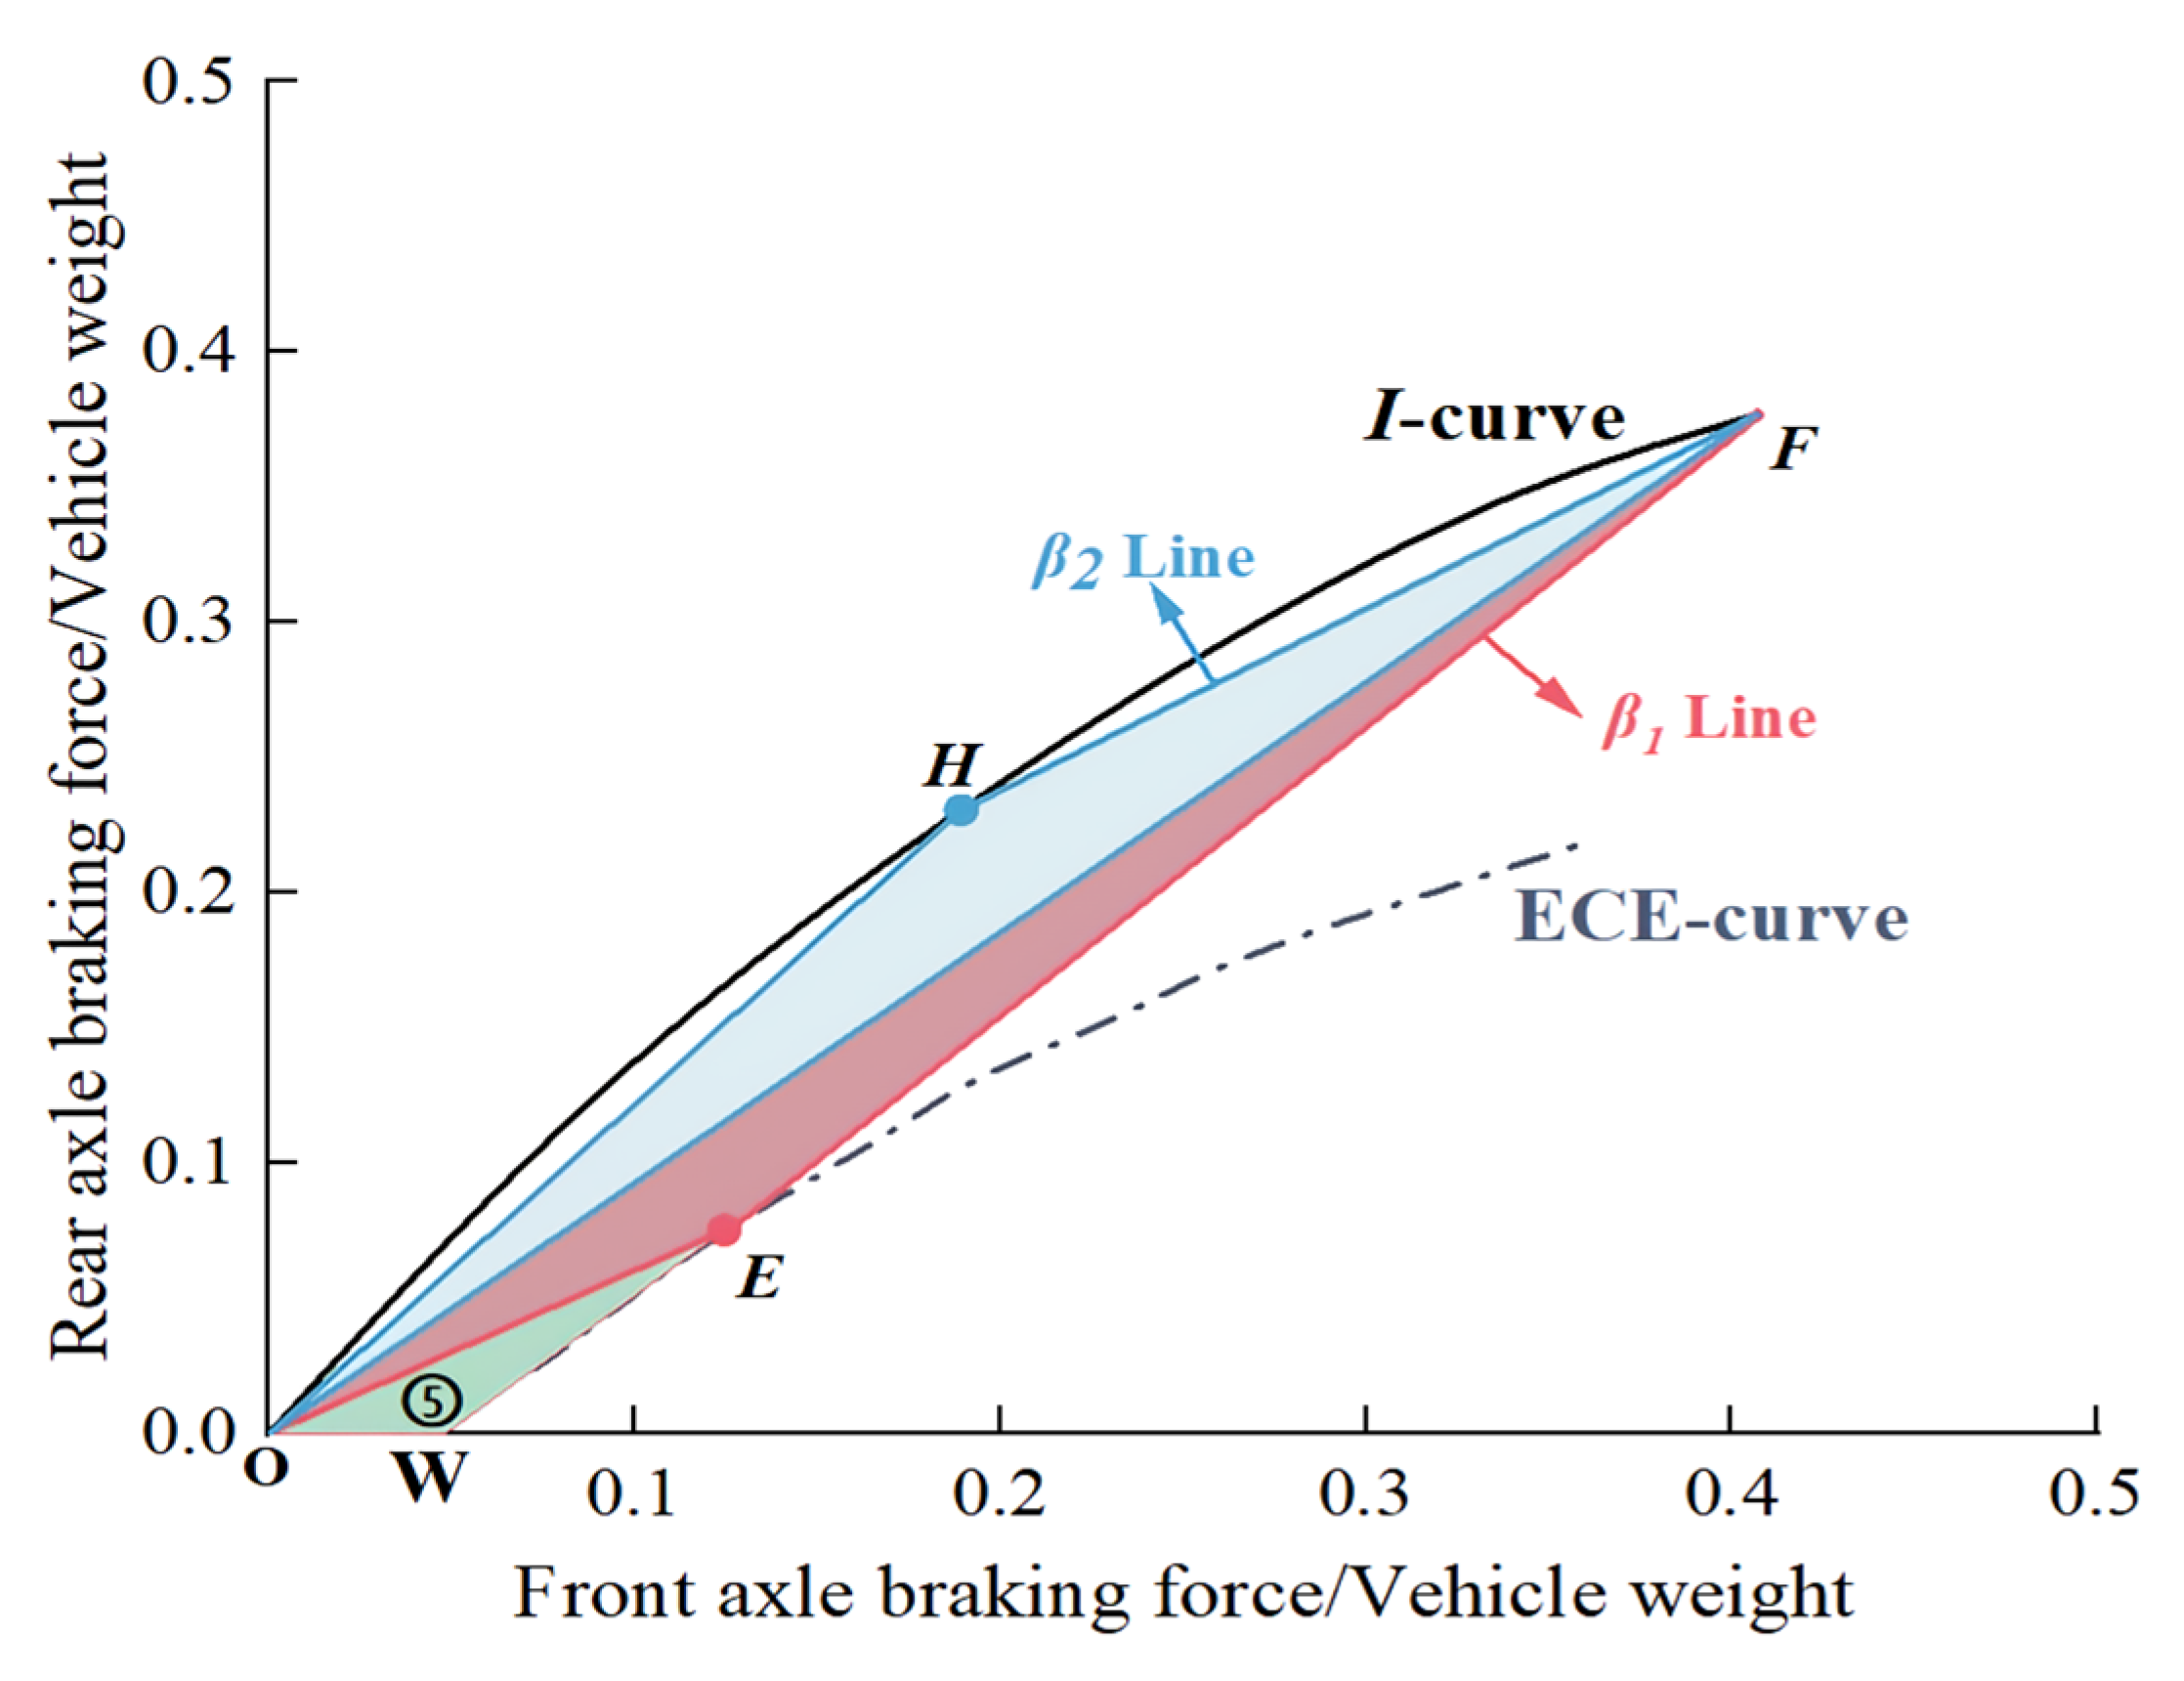
3.2.1. Parallel Braking Scheme FPF1/FPF2

Based on a straight line or a broken line, the friction braking force distribution curve β2 is designed as a straight line OF or a broken line OHF to achieve decoupling control constraints, as shown in Figure 10. A new total braking force distribution curve OEF was obtained by adding feedback braking force to the β2 line. The braking feedback scheme with linear OF as the friction braking force distribution curve is FPF1, and the braking feedback scheme with broken line OHF as the friction braking force distribution curve is FPF2. The reason why the decoupling control constraints can be satisfied between the feedback braking force and the friction braking force is that they can brake independently according to the pedal travel, and there is no need for coordinated control.

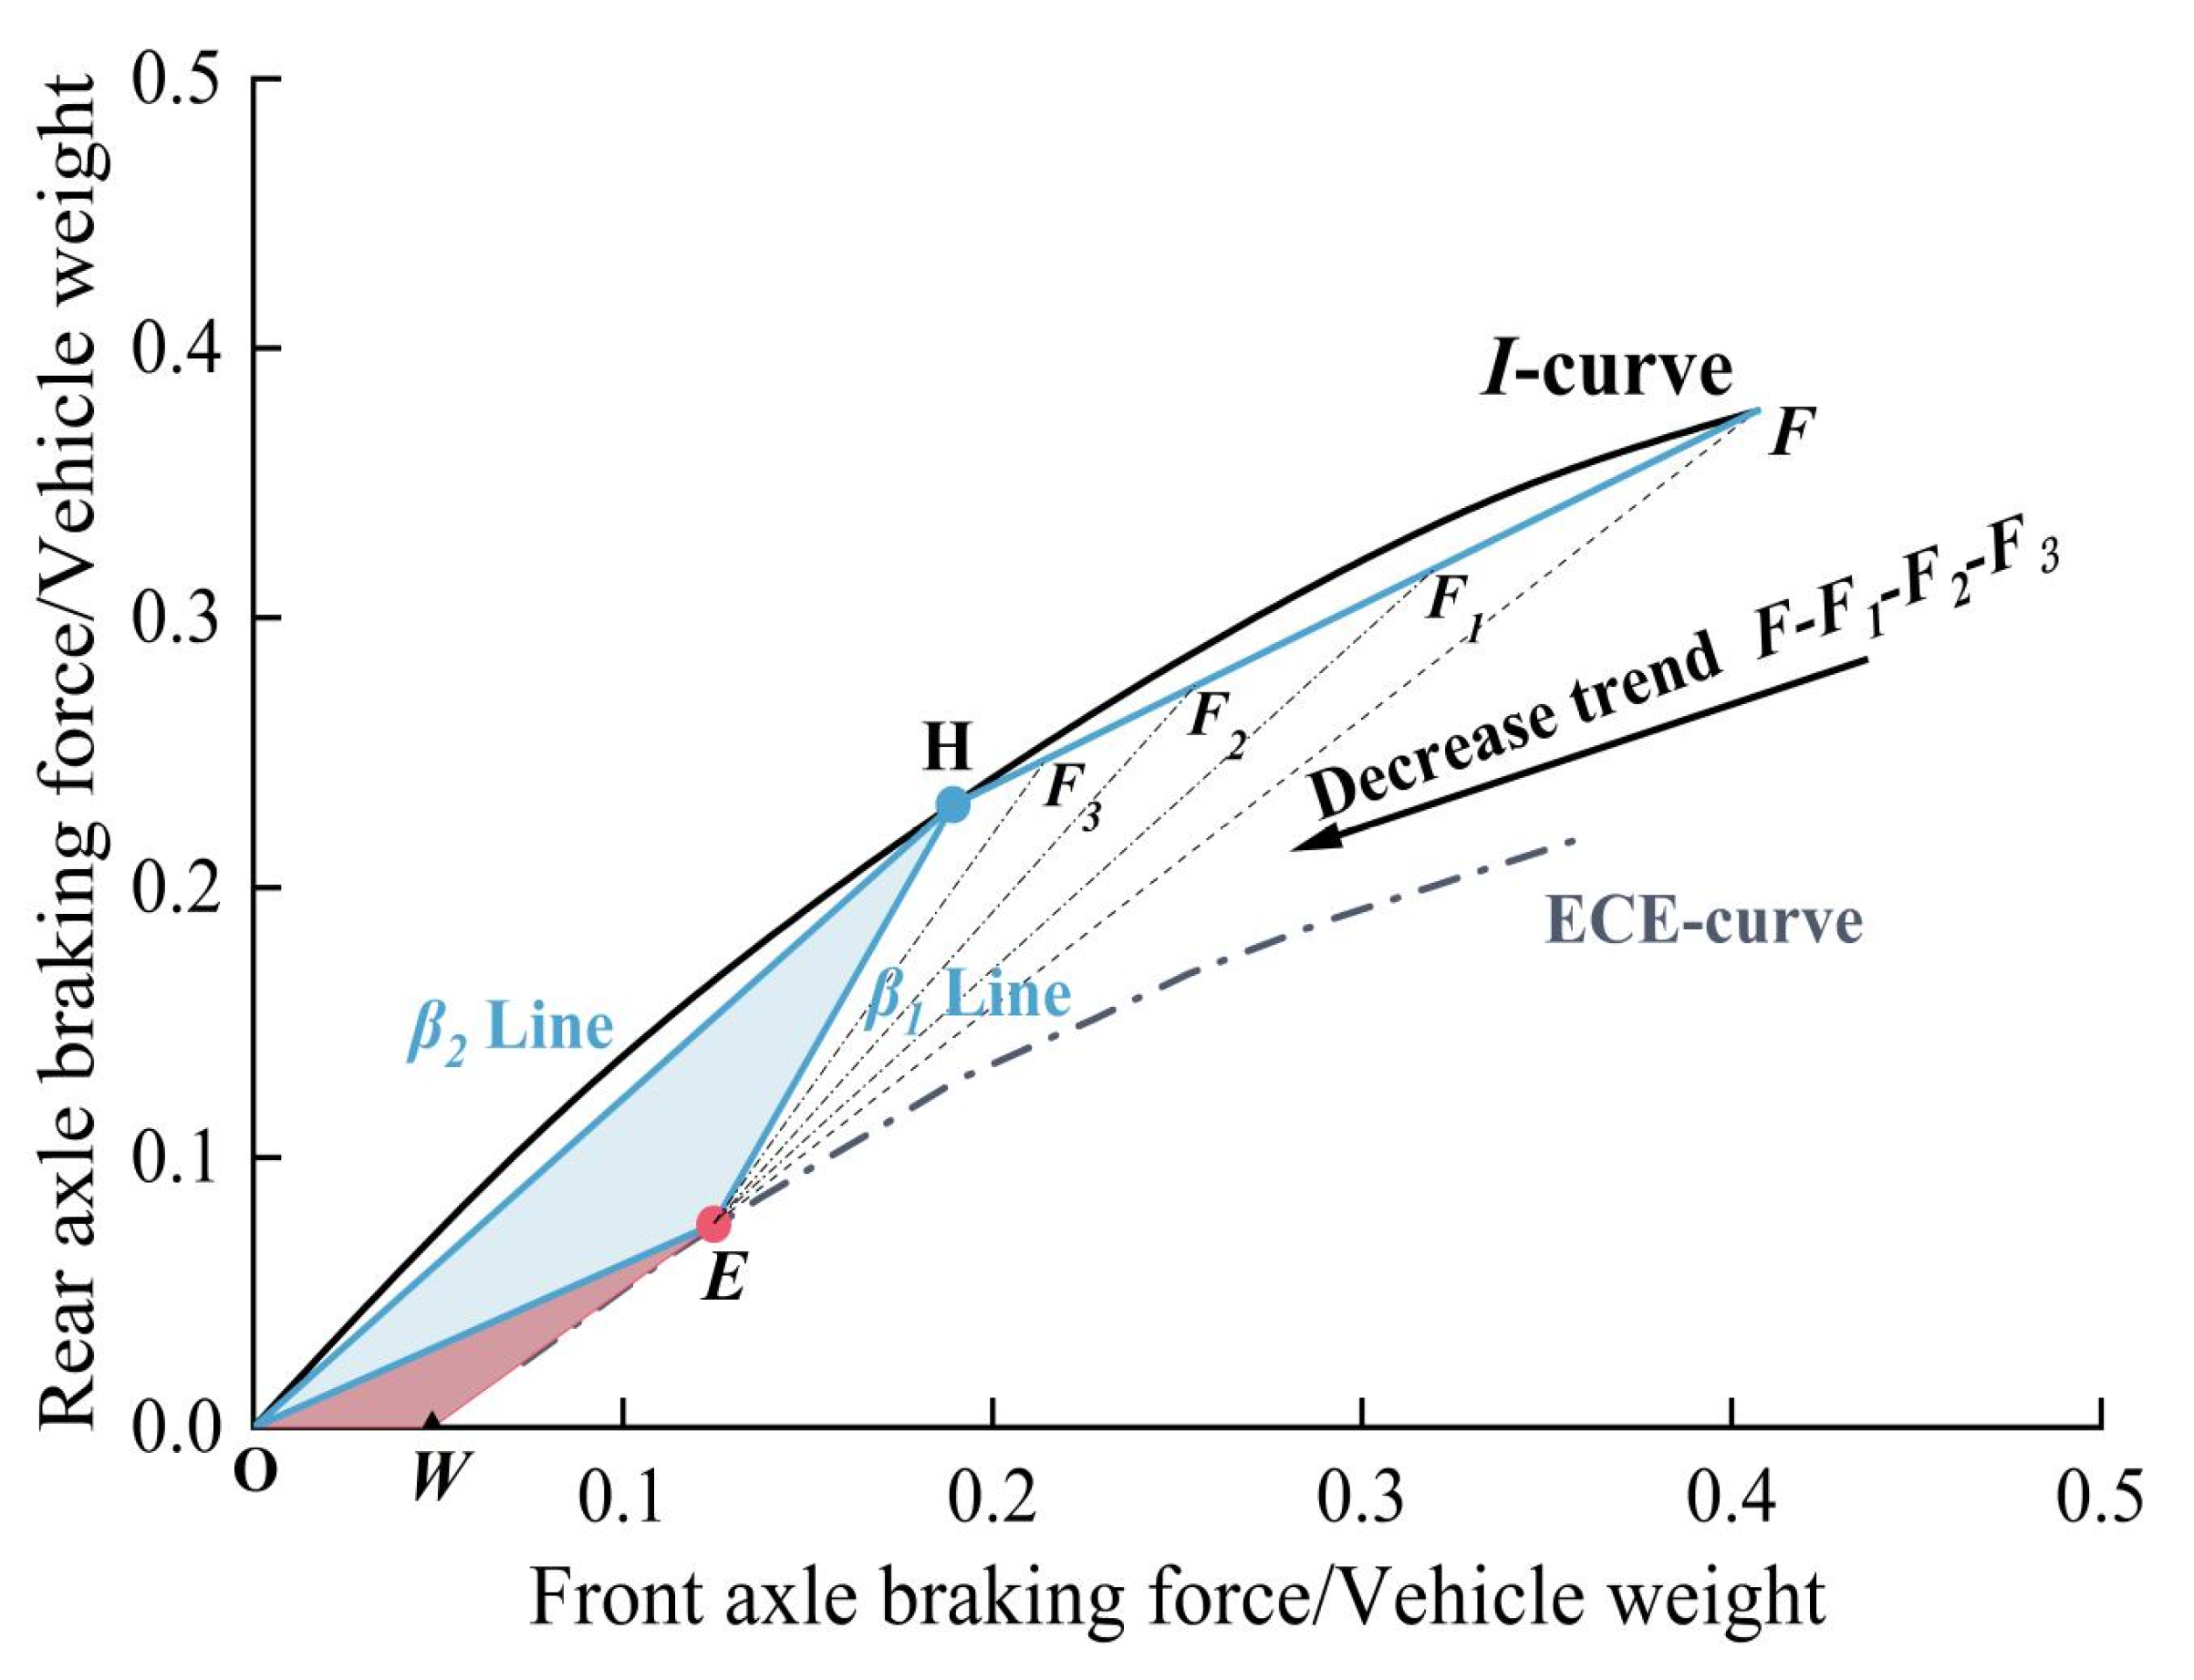
3.2.2. Series Braking Scheme FSF1

As shown in Figure 11, in the series braking scheme, at a lower braking intensity (OW segment in the figure), only feedback braking force is used to provide all braking strength requirements separately. Only when the braking strength increases to the critical braking strength Z0, will the frictional braking force have a braking effect and combine with the feedback braking force to meet provide the braking strength demand, which was shown in the WEF area. Therefore, the main difference between series braking and parallel braking is whether there is feedback braking force when braking alone at low braking strength. By designing the total braking force line β1 as OWEF, the FSF1 scheme is obtained, and the critical braking strength is the W point shown in the figure. The friction braking force β2 line of the FSF1 scheme is very close to the I curve, while the total braking force β1 line is almost tangent to the ECE curve at low braking intensity, thereby maximizing the braking feedback area and increasing the proportion of feedback braking force. The scheme also satisfies the constraint conditions of braking regulations and decoupling control.

3.2.3. Series Braking Scheme FSF1A

The road adhesion coefficient φ is usually related to multiple factors such as road durability, moisture, and humidity and is mostly distributed between 0.3 and 0.6. The above parallel braking schemes FPF1 and RPF2 and series braking scheme FSF1 are located on the road surface of 0.3 < φ < 0.6, the total braking force line β1 is infinitely close to the ECE braking efficiency curve, and the overall braking efficiency is relatively low. If braking measures are taken under the condition of adhesion coefficient on this road surface, there will be adverse consequences, such as excessive braking distance and reduced braking efficiency.
To address the above issues, an optimized series braking feedback scheme FSF1A is proposed based on the FSF1 scheme, as shown in Figure 12 below, which takes into account braking efficiency. Unlike the FSF1 scheme, when the braking strength z > 0.27, the feedback braking force gradually decreases with the increase in braking strength. Until the H-point, only the frictional braking force is applied separately, and the total braking force line β1 coincides with the frictional braking force line β2 in the HF segment. The feedback braking force takes into account the characteristics of pedal travel and braking strength and gradually decreases in the HF segment.

3.3. Comparison and Optimization Analysis of Braking Feedback Schemes

According to Formula 11, the range improvement rate can more intuitively express the advantages and disadvantages of different braking feedback schemes in comparison to the feedback efficiency. This section reports a simulation analysis based on MATLAB Simulink to compare and analyze the advantages and disadvantages of different brake feedback schemes, optimize the scheme with poor range improvement rate by changing the load ratio of the front and rear axles, and finally propose an optimum brake feedback scheme.

3.3.1. Rear-Drive Scheme

The angle of “rear-drive braking feedback efficiency and vehicle configuration conditions” was compared and analyzed. The more abundant the vehicle configuration conditions of the braking system, the less affected by the constraints of the optional vehicle configuration, and the higher the feedback efficiency. The specific simulation results are shown in Figure 13, where the mileage improvement rate of the RPF1 scheme is only 8.0% when the three vehicle configuration conditions are not met. Under the condition that the braking feedback scheme RSF2A meets the constraint conditions of decoupling control and has three constraints of vehicle configuration, the mileage improvement rate reaches the extreme value of 36.4%. Also, under the condition of decoupling control constraints, the RSF2 scheme without the vehicle configuration condition of “pedal characteristics” can reduce the mileage improvement rate to 29.2%. Considering the linear relationship between pedal characteristics and brake strength and the actual development difficulty, the RSF2 scheme is the comprehensive optimal scheme for the rear-driving type.

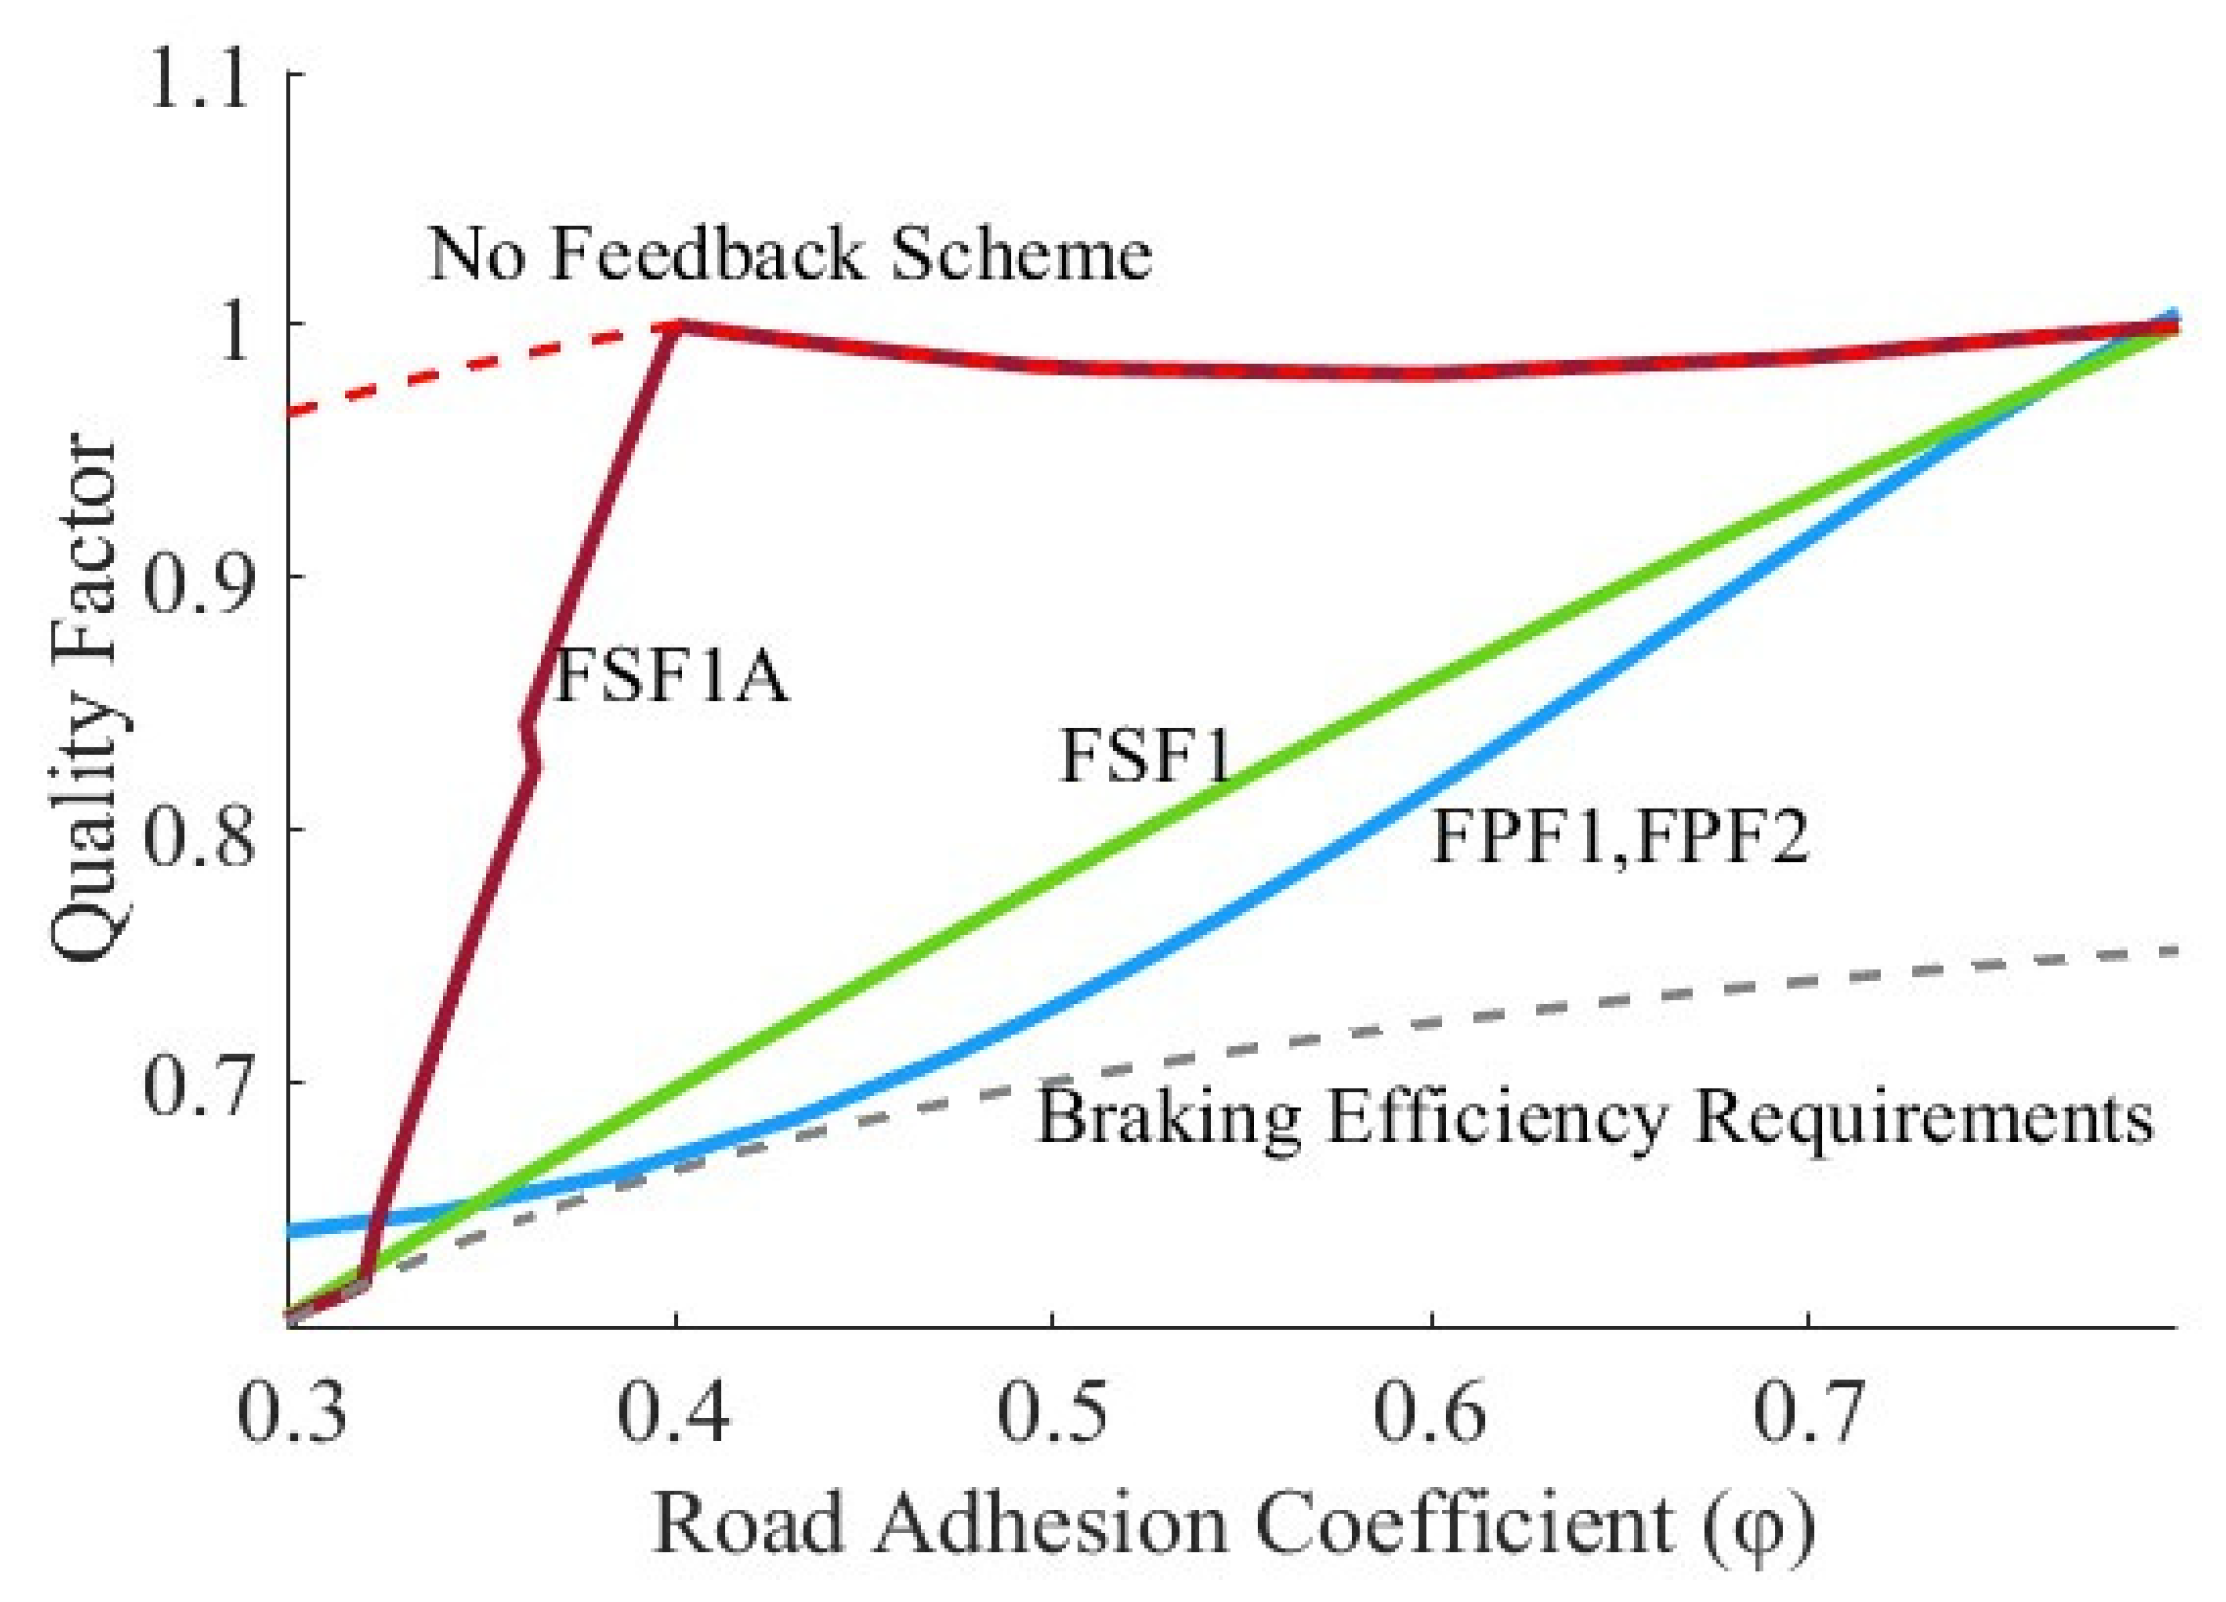
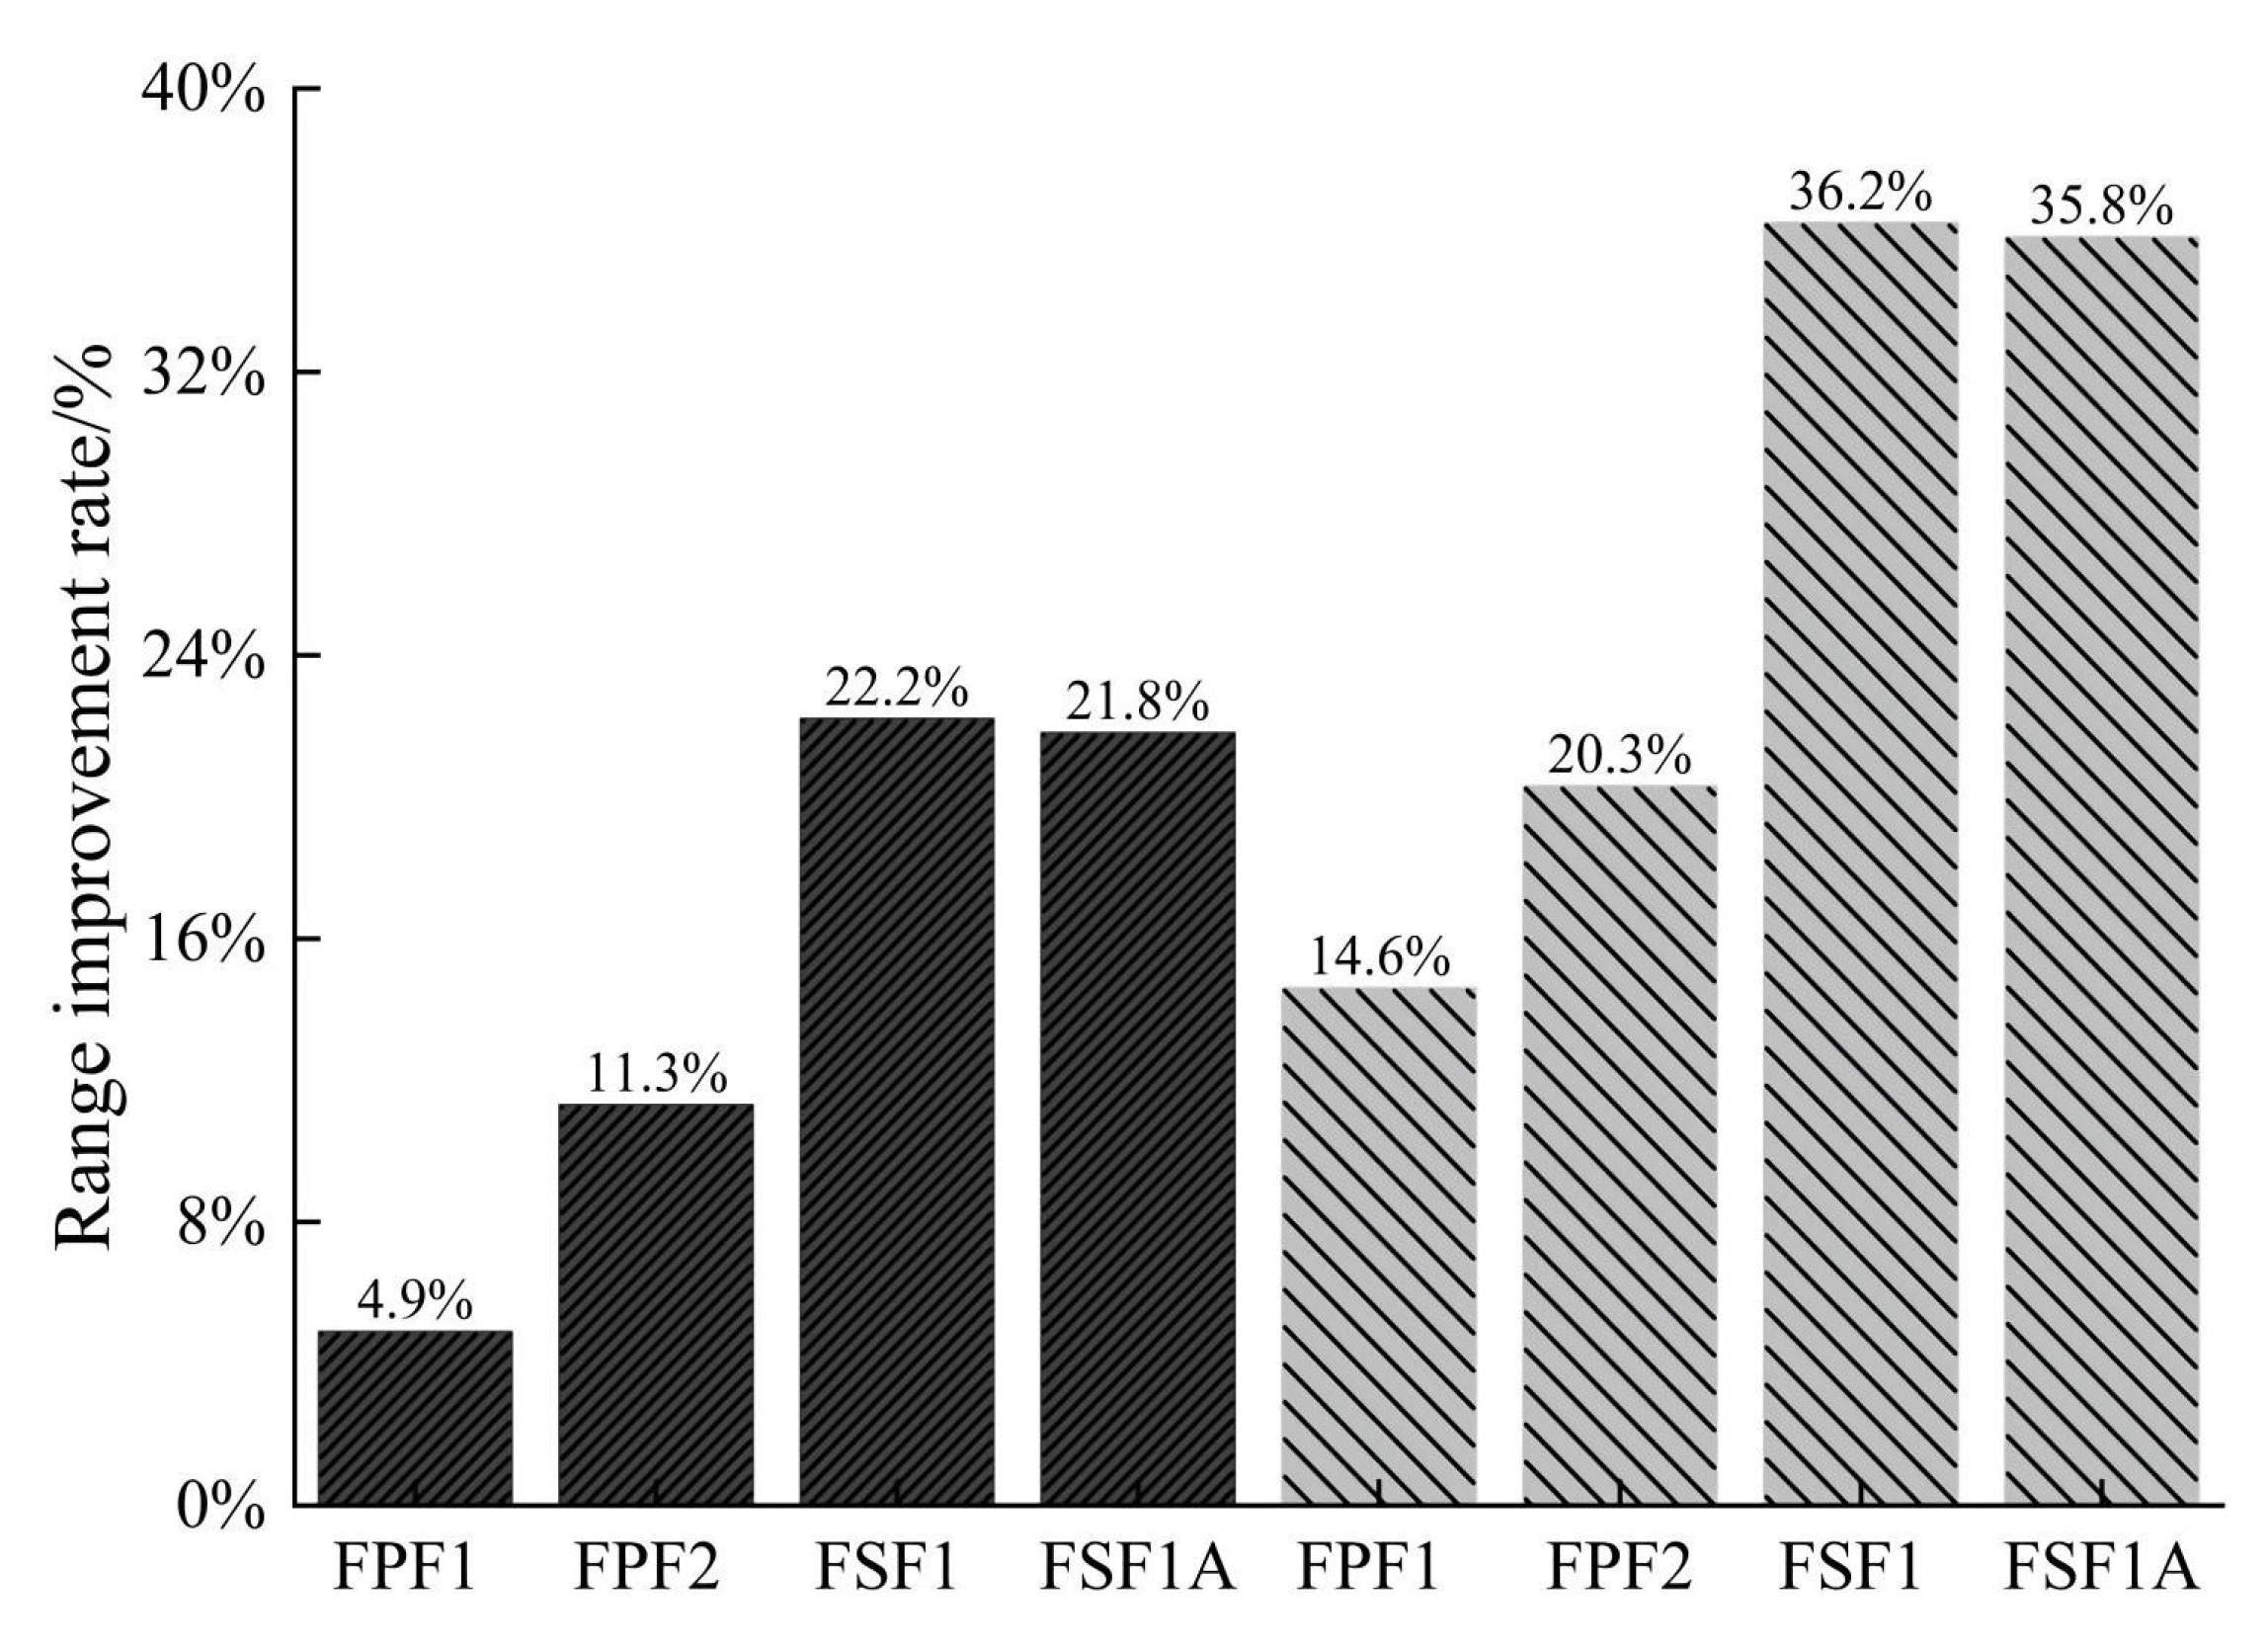
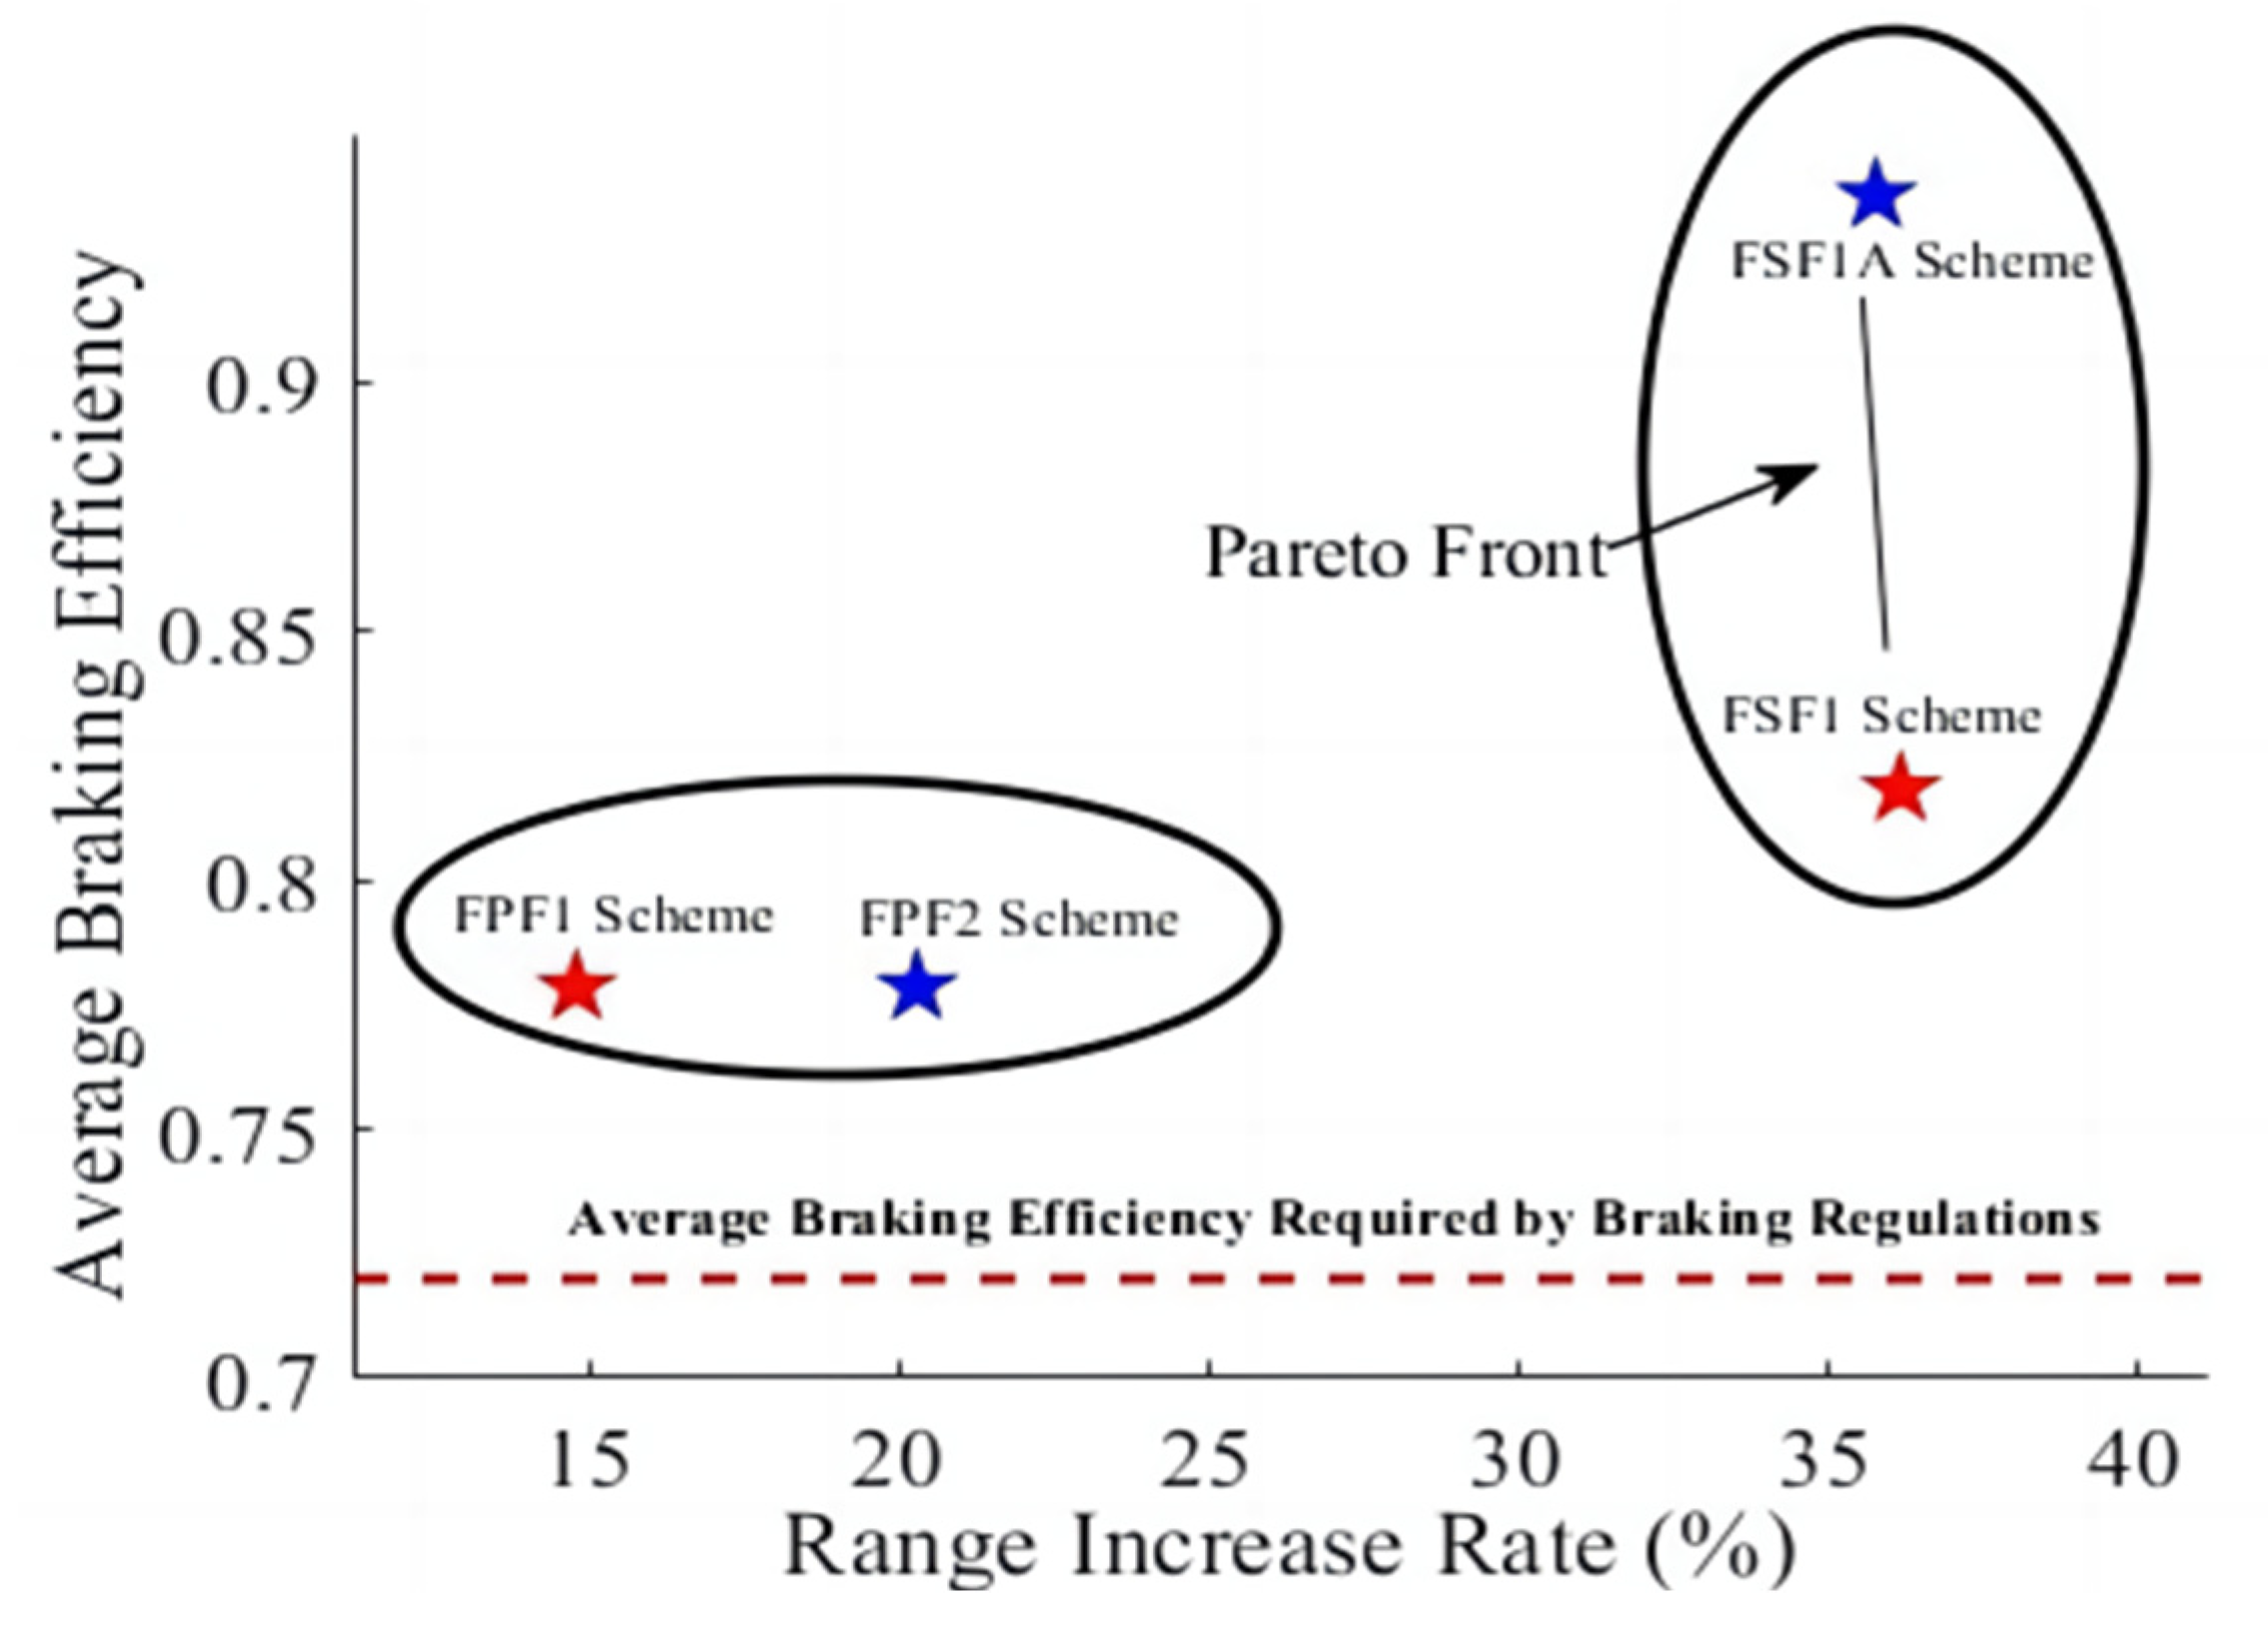
3.3.2. Front-Wheel Drive Scheme

This paper compares and analyzes the competitive relationship between front-wheel braking feedback efficiency and braking efficiency. Firstly, the braking efficiency of different braking feedback schemes is compared according to the relationship between mass coefficient and road adhesion coefficient. The simulation results are shown in Figure 14. Only the area above the braking efficiency constraint condition (gray dashed line) in the figure meets the requirements. The no-braking feedback scheme has a high-quality coefficient on the road surface with various adhesion coefficients and good braking efficiency. FPF1, FPF2, and FSF1 schemes have low mass coefficient in road adhesion coefficient (0.3–0.5) and poor braking efficiency. The mass coefficient of the FSF1A scheme in the road adhesion coefficient (0.3–0.4) is greatly improved, thus significantly improving the braking efficiency. MATLAB Simulink was used to conduct a simulation analysis on the mileage improvement rate, and the results are shown in the left half of Figure 15. The overall range enhancement performance is lower than that of rear-drive models. Therefore, the optimized data are obtained by changing the load ratio of the front and rear axes, as shown in the right half of Figure 15. It can be seen that changing the front-rear axle load ratio can significantly improve mileage performance. In the series brake feedback scheme, the difference in endurance efficiency between FSF1 and FSF1A is very small. To reflect the difference in braking efficiency between the two feedback schemes more directly, the feedback efficiency is compared with the braking efficiency index. The results are shown in Figure 16. The FSF1A scheme not only has better feedback efficiency but also has better braking efficiency, which is the comprehensive best scheme for front-drive vehicles.

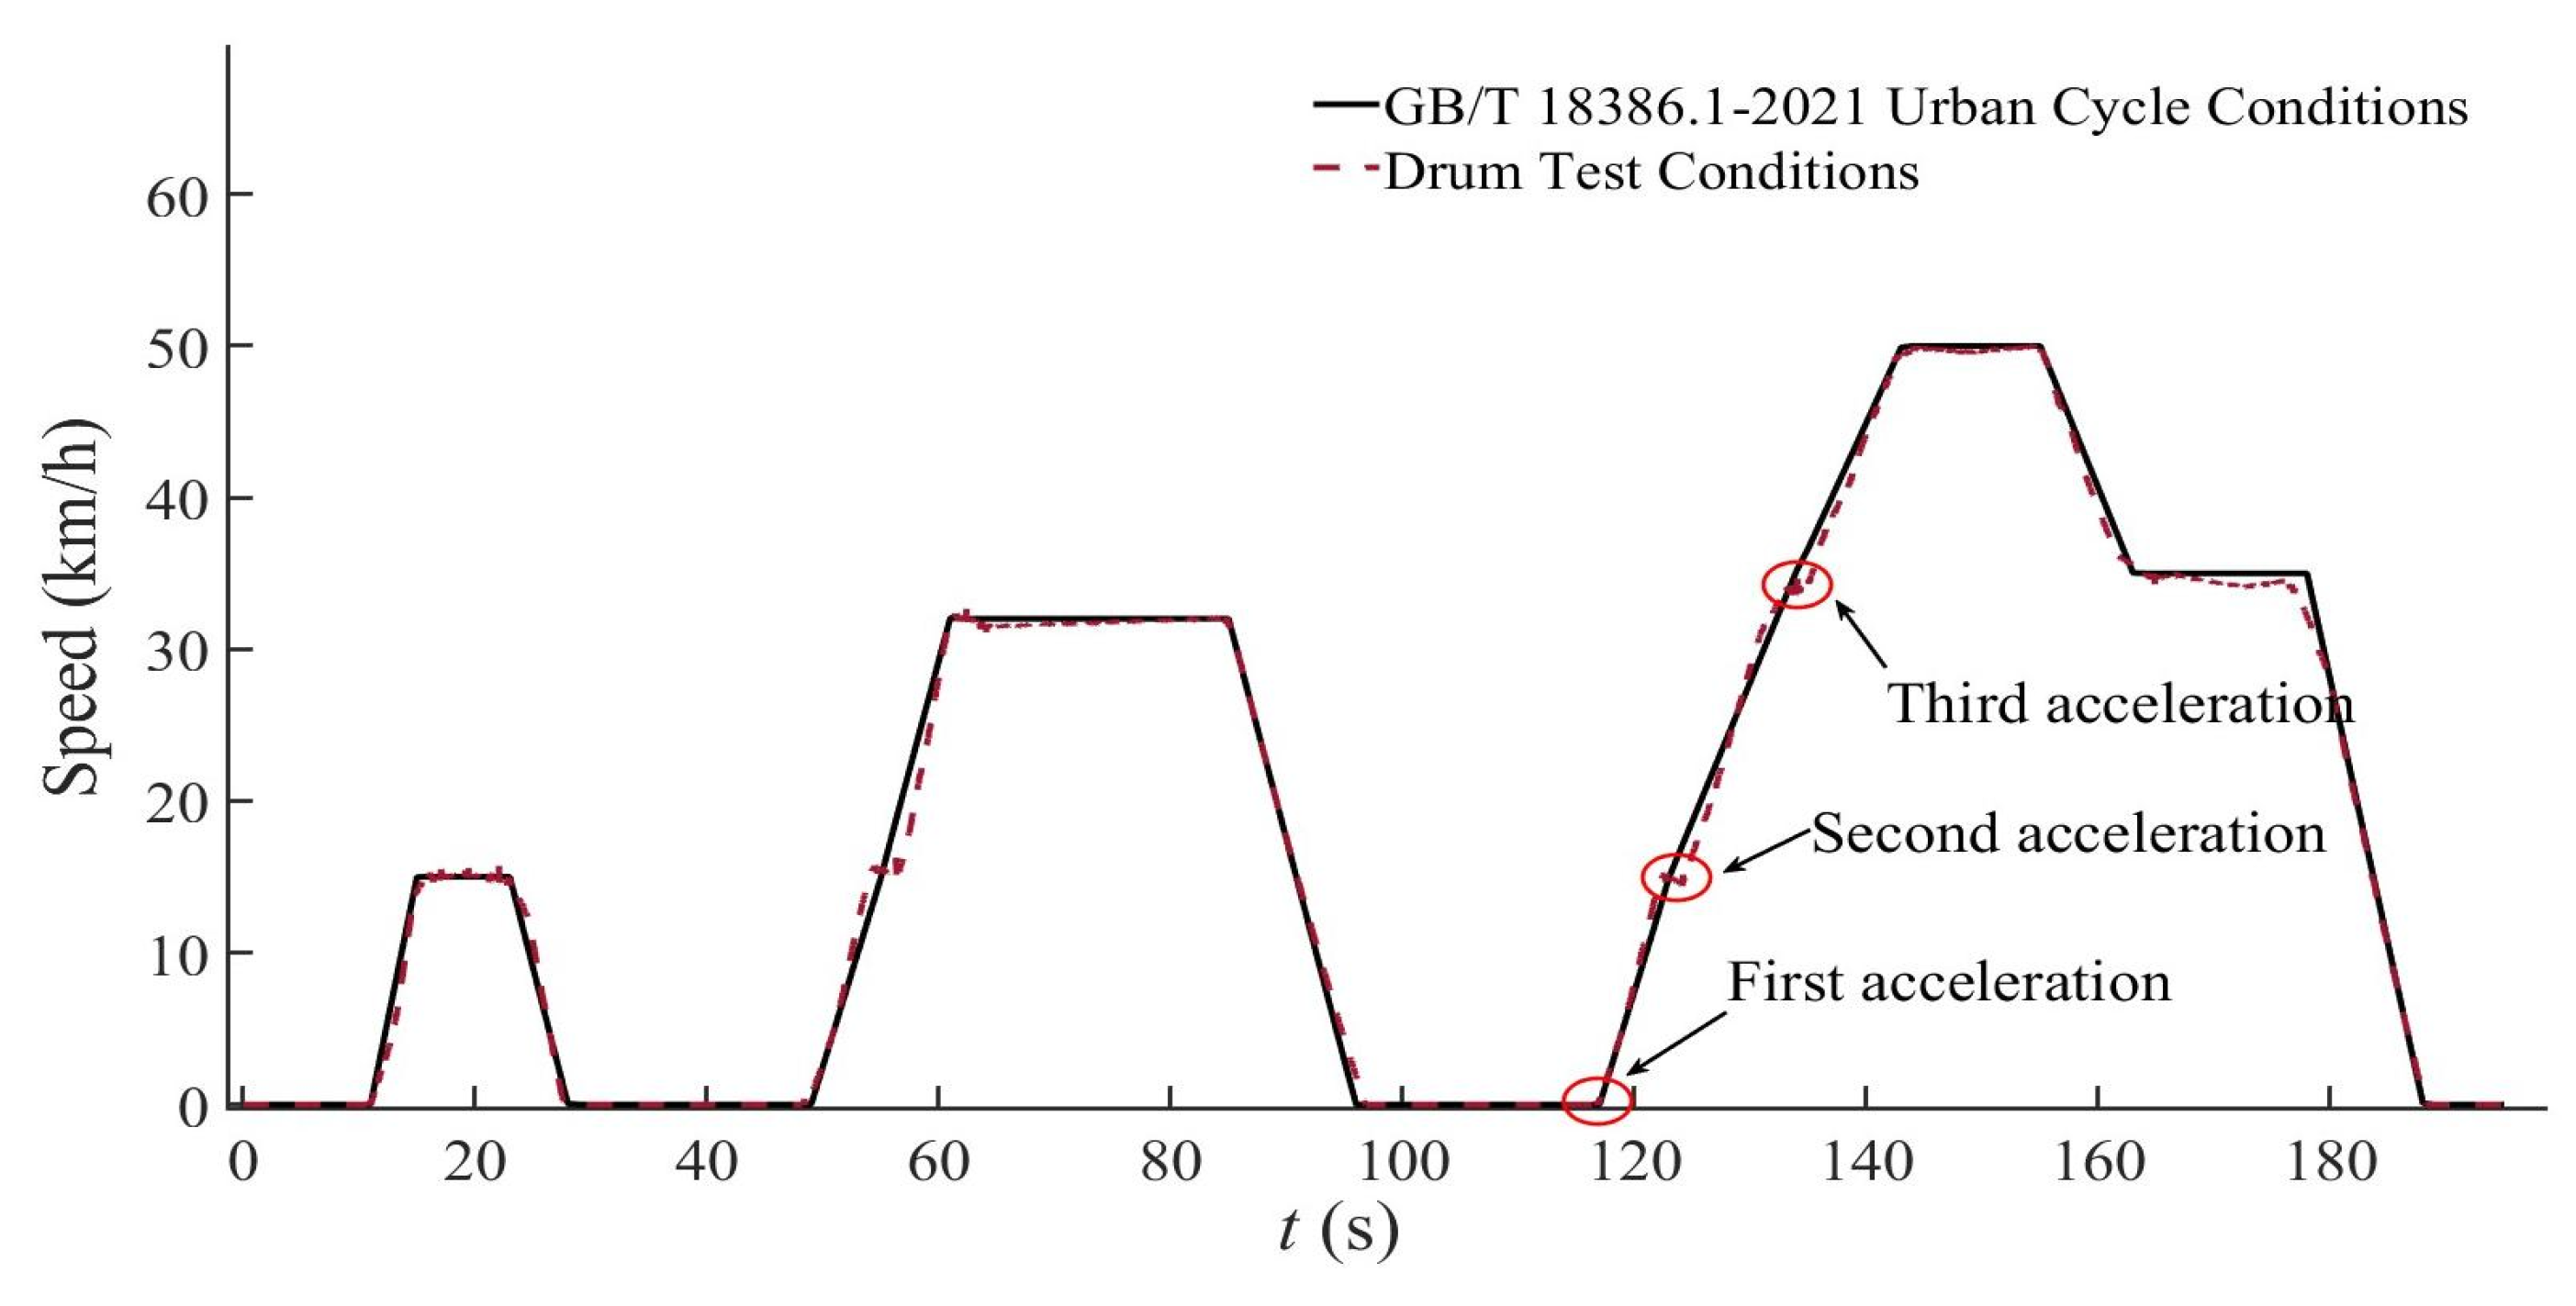
3.4. The Feasibility Verification of the Braking Feedback Scheme

To verify the accuracy of the drum test, the working point should be selected in the area of high efficiency as far as possible. The operating points of the drum test and the urban cycle according to the motor MAP were compared (as shown in Figure 17 below). The greater the radius, the greater the power. The working conditions of the drum test are mainly selected in more than 92% of the high working conditions, which lays a foundation for the verification of the subsequent braking feedback scheme. As shown in Figure 18 below, RPF1, the simplest of the proposed brake feedback schemes, is tested using a rotating drum, discharging the battery SoC from 80% to 30% of the travel time, with the following conditions: full discharge 15.35 kW·h, brake feedback charge 1.05 kW·h, net discharge 14.3 kW·h, and driving range 109.6 km. The calculated average power consumption of 100 km is 13.04 kW·h, and the mileage improvement rate is 7.8%, which is slightly lower than the simulation result of 8.0%. The main reason for the error is that the vehicle adopts the fast charge mode before the drum test, and there is a certain error between the SoC state of the battery and the simulation value. However, in general, the mileage improvement rate of the drum test is not significantly different from the simulation results, which can verify the rationality of the braking feedback scheme.

4. Conclusions

The focus of this research is to optimize the braking feedback scheme of front- and rear-wheel drive pure electric vehicles for better endurance performance. Firstly, the constraints and scope of application of each feedback scheme are clearly defined. Secondly, two parallel braking feedback schemes and four series braking feedback schemes are proposed for rear-drive vehicles, and two parallel braking feedback schemes and two series braking feedback schemes are proposed for front-drive vehicles. Finally, the comprehensive optimal braking feedback scheme of the two models is given, and the specific conclusions are as follows:
(1)
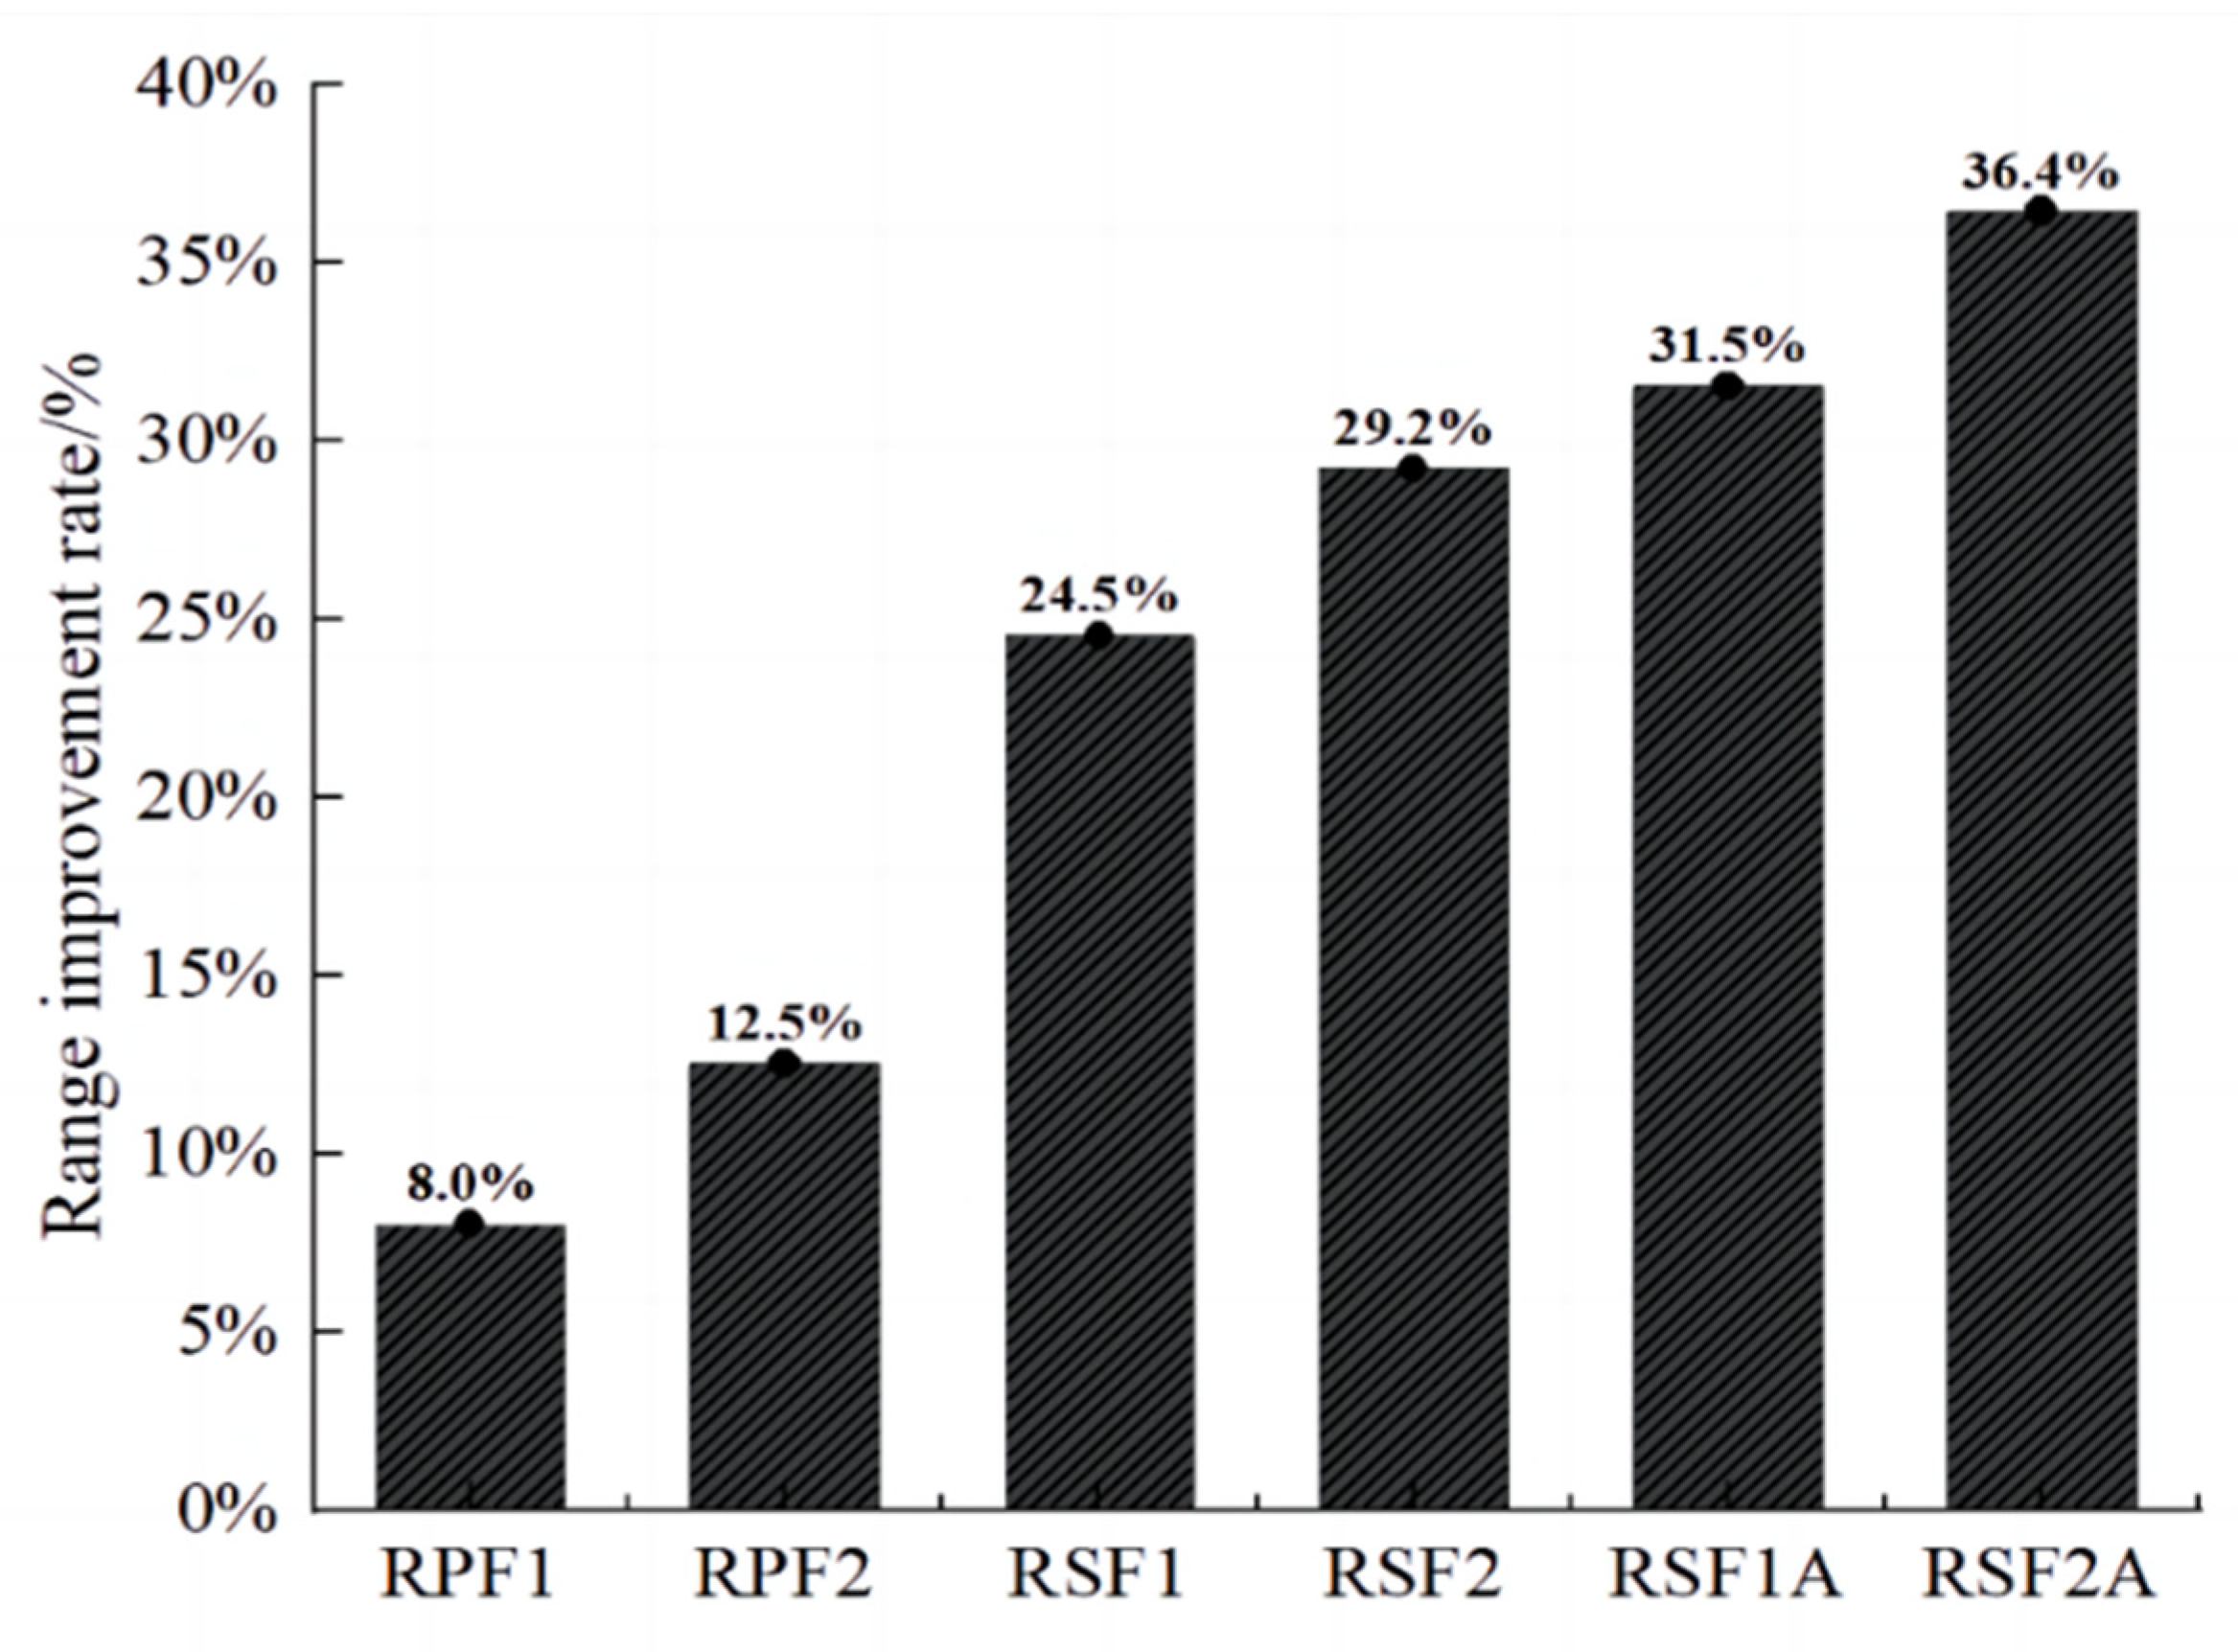
For the rear-driving type, the braking feedback efficiency is gradually improved from the PRF1 scheme with higher constraints on vehicle configuration to the RSF2A scheme with lower constraints on vehicle configuration. Therefore, with the increase in vehicle configuration constraints, the lower the optional vehicle configuration constraints, the higher the mileage improvement rate.
(2)
For rear-drive models, RSF2A schemes that over-rely on vehicle configuration condition 3, pedal characteristics, have poor overall performance. On the contrary, the RSF2 scheme which is not highly dependent on “pedal characteristics” under decoupling control constraints obtains a mileage improvement rate of 29.2%, and the comprehensive performance is the best. Therefore, RSF2 is the best brake feedback scheme for rear-drive vehicles.
(3)
For front-drive models, a competitive perspective is based on brake feedback efficiency and brake efficiency constraints. Considering that the RSF2 scheme not only has high braking feedback efficiency but also a high braking efficiency, as well as achieving a significant improvement in driving range by 35.8%, the RSF1A is the best braking feedback scheme for the overall performance of front-wheel drive vehicles.
(4)
For the brake feedback scheme proposed for the two models, the feasibility of the proposed brake feedback scheme is verified by comparing the drum test data with the simulated city cycle condition data, which lays a theoretical foundation for optimizing the brake feedback energy efficiency of pure electric vehicles.

Author Contributions

Conceptualization, X.L. and F.J.; software, W.G. and J.Z.; formal analysis, X.L., J.Z. and F.J.; investigation, X.L., J.Z. and G.X.; resources, F.J. and W.G.; writing—original draft preparation, J.Z. and W.G.; writing—review and editing, X.L., J.Z., W.G., F.J., G.X., C.W., W.Z. and Z.F.; supervision, X.L., G.X. and C.W.; funding acquisition, X.L. and F.J. All authors have read and agreed to the published version of the manuscript.

Funding

This work is supported by the National Natural Science Foundation of China (6196300006 and 11864005), the Guangxi Natural Science Foundation Project (Guike AD23026113), the Guangxi Innovation Driven Development Special Fund Project (Guike AA22068060), the Liuzhou Science and Technology Planning Project (2021AAA0104 and 2022AAA0104), the Liudong Science and Technology Project (20210117), and the Guangxi University of Science and Technology Doctoral Fund Project (21Z34). This study was also supported by two independent research projects from the Guangxi Key Laboratory of Automotive Parts and Vehicle Technology, with project numbers 2022GKLACVTZZ02 and 2022GKLACVTZZ03.

Institutional Review Board Statement

Not applicable.

Informed Consent Statement

Written informed consent was obtained from all participants.

Data Availability Statement

All data used to support the findings of this study are included within the article.

Conflicts of Interest

The authors declare that there are no conflicts of interest regarding the publication of this paper.

Nomenclature

ABSAntilock braking system
BERSBraking energy recovery system
BTEBrake thermal efficiency
CLTCChina Light-Duty Vehicle Test Cycle
EBAElectronic brake assist
EBDElectric brakeforce distribution
ECEEconomic Commission of Europe
FPF1Front-drive parallel braking feedback scheme 1
FPF2Front-drive parallel braking feedback scheme 2
FSF1Front-drive parallel braking feedback scheme 1
FSF1AFront-drive parallel braking feedback scheme 1 with Assist
FTP75Federal Test Procedure 75
RC circuitResistor–capacitor circuit
RPF1Rear-drive parallel braking feedback scheme 1
RPF2Rear-drive parallel braking feedback scheme 2
RSF1Rear-drive series brake feedback scheme 1
RSF1ARear-drive series brake feedback scheme 1 with pedal assist
RSF2Rear-drive series brake feedback scheme 2
RSF2ARear-drive series brake feedback scheme 2 with pedal assist
SoCState of charge

References

  1. Zhang, Z.; Li, J.; Tian, J.; Dong, R.; Zou, Z.; Gao, S.; Tan, D. Performance, combustion and emission characteristics investigations on a diesel engine fueled with diesel/ethanol/n-butanol blends. Energy 2022, 249, 123733. [Google Scholar] [CrossRef]
  2. Jiang, F.; Zhou, J.; Hu, J.; Tan, X.; Mo, Q.; Cao, W. Performance Comparison and Optimization of 16V265H Diesel Engine Fueled with Biodiesel Based on Miller Cycle. Process 2022, 10, 1412. [Google Scholar] [CrossRef]
  3. Tan, Q.; Wang, Z.; Fan, W.; Li, X.; Li, X.; Li, F.; Zhao, Z. Development Path and Model Design of a New Energy Vehicle in China. Energies 2023, 16, 220. [Google Scholar] [CrossRef]
  4. Karimi, D.; Behi, H.; Van, M.; Berecibar, M. Experimental and numerical analysis of holistic active and passive thermal management systems for electric vehicles: Fast charge and discharge applications. Results Eng. 2022, 15, 100486. [Google Scholar] [CrossRef]
  5. Hosseini Salari, A.; Mirzaeinejad, H.; Fooladi Mahani, M. A new control algorithm of regenerative braking management for energy efficiency and safety enhancement of electric vehicles. Energy Convers. Manag. 2023, 276, 116564. [Google Scholar] [CrossRef]
  6. Wu, Y.; Shu, M.; Ge, H. Research on Brake Force Distribution Control Strategy of Electric Vehicle Subtitle as needed. IOP Conf. Ser. Mater. Sci. Eng. 2018, 452, 032054. [Google Scholar] [CrossRef]
  7. Behi, H.; Karimi, D.; Youssef, R.; Suresh Patil, M.; Van Mierlo, J.; Berecibar, M. Comprehensive Passive Thermal Management Systems for Electric Vehicles. Energies 2021, 14, 3881. [Google Scholar] [CrossRef]
  8. Geng, C.; Ning, D.; Guo, L.; Xue, Q.; Mei, S. Simulation Research on Regenerative Braking Control Strategy of Hybrid Electric Vehicle. Energies 2021, 14, 2202. [Google Scholar] [CrossRef]
  9. Broatch, A.; Olmeda, P.; Plá, B.; Dreif, A. Novel Energy Management Control Strategy for Improving Efficiency in Hybrid Powertrains. Energies 2023, 16, 107. [Google Scholar] [CrossRef]
  10. Chen, Z.; Wu, S.; Shen, S.; Liu, Y.; Guo, F.; Zhang, Y. Co-optimization of velocity planning and energy management for autonomous plug-in hybrid electric vehicles in urban driving scenarios. Energy 2023, 263, 126060. [Google Scholar] [CrossRef]
  11. Hu, J.; Cao, W.; Jiang, F.; Hu, L.; Chen, Q.; Zheng, W.; Zhou, J. Study on Multi-Objective Optimization of Power System Parameters of Battery Electric Vehicles. Sustainability 2023, 15, 8219. [Google Scholar] [CrossRef]
  12. Juliette, T.; Mats, J.; Yang, D.; Bengt, J. Energy reduction by power loss minimization through wheel torque allocation in electric vehicles: A simulation-based approach. Veh. Syst. Dyn. 2022, 60, 1488–1511. [Google Scholar]
  13. Yang, Y.; He, Q.; Chen, Y.; Fu, C. Efficiency Optimization and Control Strategy of Regenerative Braking System with Dual Motor. Energies 2020, 13, 711. [Google Scholar] [CrossRef]
  14. Zhang, J.; Yang, Y.; Hu, M.; Yang, Z.; Fu, C. Longitudinal–vertical comprehensive control for four-wheel drive pure electric vehicle considering energy recovery and ride comfort. Energy 2021, 236, 121417. [Google Scholar] [CrossRef]
  15. Wang, D.; Guan, C.; Wang, J.; Wang, H.; Zhang, Z.; Guo, D.; Yang, F. Review of Energy-Saving Technologies for Electric Vehicles, from the Perspective of Driving Energy Management. Sustainability 2023, 15, 7617. [Google Scholar] [CrossRef]
  16. Yi, F.; Lu, D.; Wang, X.; Pan, C.; Tao, Y.; Zhou, J.; Zhao, C. Energy Management Strategy for Hybrid Energy Storage Electric Vehicles Based on Pontryagin’s Minimum Principle Considering Battery Degradation. Sustainability 2022, 14, 1214. [Google Scholar] [CrossRef]
  17. Lv, C.; Zhang, J.; Li, Y.; Yuan, Y. Novel control algorithm of braking energy regeneration system for an electric vehicle during safety–critical driving maneuvers. Energy Convers. Manag. 2015, 106, 520–529. [Google Scholar] [CrossRef]
  18. Vignesh, R.; Bragadeshwaran, A. Intelligent energy management through neuro-fuzzy based adaptive ECMS approach for an optimal battery utilization in plugin parallel hybrid electric vehicle. Energy Convers. Manag. 2023, 280, 116792. [Google Scholar] [CrossRef]
  19. Liu, H.; Lei, Y.; Fu, Y.; Li, X. An Optimal Slip Ratio-Based Revised Regenerative Braking Control Strategy of Range-Extended Electric Vehicle. Energies 2020, 13, 1526. [Google Scholar] [CrossRef]
  20. Henao-Muñoz, A.; Pereirinha, P.; Bouscayrol, A. Regenerative Braking Strategy of a Formula SAE Electric Race Car Using Energetic Macroscopic Representation. World Electr. Veh. J. 2020, 11, 45. [Google Scholar] [CrossRef]
  21. Liu, H.; Lei, Y.; Fu, Y.; Li, X. Multi-Objective Optimization Study of Regenerative Braking Control Strategy for Range-Extended Electric Vehicle. Appl. Sci. 2020, 10, 1789. [Google Scholar] [CrossRef]
  22. Rezaei, A.; Burl, J.; Zhou, B.; Rezaei, M. A New Real-Time Optimal Energy Management Strategy for Parallel Hybrid Electric Vehicles. IEEE Trans. Control Syst. Technol. 2019, 27, 830–837. [Google Scholar] [CrossRef]
  23. Passalacqua, M.; Carpita, M.; Gavin, S.; Marchesoni, M.; Repetto, M.; Vaccaro, L.; Wasterlain, S. Supercapacitor Storage Sizing Analysis for a Series Hybrid Vehicle. Energies 2019, 12, 1759. [Google Scholar] [CrossRef]
  24. Guo, H.; He, H.; Sun, F. A Combined Cooperative Braking Model with a Predictive Control Strategy in an Electric Vehicle. Energies 2013, 6, 6455–6475. [Google Scholar] [CrossRef]
  25. Qiu, C.; Wang, G.; Meng, M.; Shen, Y. A novel control strategy of regenerative braking system for electric vehicles under safety critical driving situations. Energy 2018, 149, 329–340. [Google Scholar] [CrossRef]
  26. Sun, B.; Gu, T.; Xie, M.; Wang, P.; Gao, S.; Zhang, X. Strategy Design and Performance Analysis of an Electromechanical Flywheel Hybrid Scheme for Electric Vehicles. Sustainability 2022, 14, 11017. [Google Scholar] [CrossRef]
  27. Zhu, Y.; Wu, H.; Zhang, J. Regenerative Braking Control Strategy for Electric Vehicles Based on Optimization of Switched Reluctance Generator Drive System. IEEE Access 2020, 8, 76671–76682. [Google Scholar] [CrossRef]
  28. Zhai, Y.; Feng, H.; Meng, Y.; Xu, E.; Wu, Y. Braking energy management strategy for electric vehicles based on working condition prediction. AIP Adv. 2022, 12, 015220. [Google Scholar]
  29. Zhang, H.; Chen, D.; Zhang, H.; Liu, Y. Research on the influence factors of brake regenerative energy of pure electric vehicles based on the CLTC. Energy Rep. 2022, 8, 85–93. [Google Scholar] [CrossRef]
  30. He, Q.; Yang, Y.; Luo, C.; Zhai, J.; Luo, R.; Fu, C. Energy recovery strategy optimization of dual-motor drive electric vehicle based on braking safety and efficient recovery. Energy 2022, 248, 123543. [Google Scholar] [CrossRef]
  31. Qi, L.; Wu, X.; Zeng, X.; Feng, Y.; Pan, H.; Zhang, Z.; Yuan, Y. An electro-mechanical braking energy recovery system based on coil springs for energy saving applications in electric vehicles. Energy 2020, 200, 117472. [Google Scholar] [CrossRef]
  32. Ji, F.; Pan, Y.; Zhou, Y.; Du, F.; Zhang, Q.; Li, G. Energy recovery based on pedal situation for regenerative braking system of electric vehicle. Veh. Syst. Dyn. 2020, 58, 144–173. [Google Scholar] [CrossRef]
  33. Zhao, Q.; Zhang, H.; Xin, Y. Research on Control Strategy of Hydraulic Regenerative Braking of Electrohydraulic Hybrid Electric Vehicles. Math. Probl. Eng. 2021, 6, 5391351. [Google Scholar] [CrossRef]
  34. Zhou, J.; Feng, C.; Su, Q.; Jiang, S.; Fan, Z.; Ruan, J.; Sun, S.; Hu, L. The Multi-Objective Optimization of Powertrain Design and Energy Management Strategy for Fuel Cell–Battery Electric Vehicle. Sustainability 2022, 14, 6320. [Google Scholar] [CrossRef]
  35. Xu, L.; He, X.; Shen, X. Improving Energy Recovery Rate of the Regenerative Braking System by Optimization of Influencing Factors. Appl. Sci. 2019, 9, 3807. [Google Scholar] [CrossRef]
  36. Pugi, L.; Alfatti, F.; Berzi, L.; Favilli, T.; Pierini, M.; Forrier, B.; D’hondt, T.; Sarrazin, M. Fast Modelling and Identification of Hydraulic Brake Plants for Automotive Applications. Int. J. Fluid Power 2020, 21, 169–210. [Google Scholar] [CrossRef]
  37. Min, C.; Pan, Y.; Dai, W.; Ibna, K.; Li, Z.; Wang, G. Trajectory optimization of an electric vehicle with minimum energy consumption using inverse dynamics model and servo constraints. Mech. Mach. Theory 2023, 181, 105185. [Google Scholar] [CrossRef]
  38. Zuska, A.; Kurczyński, D.; Jackowski, J.T. Study of Loads Acting on the Load during the Sudden Braking of a Vehicle. Appl. Sci. 2023, 13, 1559. [Google Scholar] [CrossRef]
  39. Koylu, H.; Tural, E. Experimental study on braking and stability performance during low speed braking with ABS under critical road conditions. Eng. Sci. Technol. Int. J. 2021, 24, 1224–1238. [Google Scholar] [CrossRef]
  40. Li, S.; Yu, B.; Feng, X. Research on braking energy recovery strategy of electric vehicle based on ECE regulation and I curve. Sci. Prog. 2020, 103, 0036850419877762. [Google Scholar] [CrossRef]
  41. Xie, Y.; Li, Y.; Zhao, Z.; Dong, H.; Wang, S.; Liu, J.; Guan, J.; Duan, X. Microsimulation of electric vehicle energy consumption and driving range. Appl. Energy 2020, 267, 115081. [Google Scholar] [CrossRef]
  42. Zhu, Y.; Wu, H.; Zhen, C. Regenerative braking control under sliding braking condition of electric vehicles with switched reluctance motor drive system. Energy 2021, 230, 120901. [Google Scholar] [CrossRef]
Figure 1. Project bench test diagram and brake system model diagram. (a) Schematic diagram of the driving motor transmission assembly dynamometer. (b) Physical diagram of the driving motor transmission assembly dynamometer. (c) Model diagram of the rear-drive braking system. (d) Front-wheel drive braking system model diagram.
Energies 16 06531 g001
Figure 2. Force analysis diagram for braking state.
Energies 16 06531 g002
Figure 3. Schematic diagram of braking dynamics.
Energies 16 06531 g003
Figure 4. Diagram of changes in cycling conditions and braking intensity. (a) Schematic diagram of cycle condition; (b) distribution diagram of breaking strength.
Energies 16 06531 g004
Figure 5. Genetic algorithm flow chart.
Energies 16 06531 g005
Figure 6. Parallel feedback RPF1 scheme and RPF2 scheme.
Energies 16 06531 g006
Figure 7. Series braking feedback scheme. (a) RSF1 scheme; (b) RSF2 scheme.
Energies 16 06531 g007
Figure 8. Series braking feedback scheme. (a) RSF1A scheme; (b) RSF2A scheme.
Energies 16 06531 g008
Figure 9. Pedal displacement—system strength linear characteristic diagram.
Energies 16 06531 g009
Figure 10. Parallel braking feedback FPF1 scheme and FPF2 scheme.
Energies 16 06531 g010
Figure 11. FSF1 braking feedback scheme.
Energies 16 06531 g011
Figure 12. FSF1A braking feedback scheme.
Energies 16 06531 g012
Figure 13. Rear wheel drive scheme range improvement rate chart.
Energies 16 06531 g013
Figure 14. Evaluation diagram of braking efficiency for front-wheel drive vehicle braking feedback scheme.
Energies 16 06531 g014
Figure 15. Comparison of the braking feedback schemes of the front-wheel drive and the range improvement rate after changing the front and rear load ratio.
Energies 16 06531 g015
Figure 16. Comparison chart of range ratio and braking efficiency.
Energies 16 06531 g016
Figure 17. Map of motor MAP for roll test and urban cycle conditions.
Energies 16 06531 g017
Figure 18. Roll test and urban cycle diagram.
Energies 16 06531 g018
Table 1. Main vehicle parameters of Baojun E300 and Baojun E100 pure electric vehicles.
Model NameBaojun E300Baojun E100
Dimensions/mm2625 × 1647 × 15882488 × 1506 × 1670
Wheelbase/mm17501600
Distance between front and rear centroids/mm800, 950720, 880
Front and rear axle loads/kg416, 624509, 340
Curb weight/kg1040849
Rolling radius/mm253.9253.9
Centroid distance/mm500500
Front-rear axis charge ratio/%40/6060/40
Driving modeRear-wheel driveFront-wheel drive
Table 2. Table of the relationship between basic conditions and feedback scheme of rear-drive vehicle models.
Braking Feedback SchemeRPF1RPF2RSF1/RSF2RSF1A/RSF2A
Vehicle configuration condition 1 “EBD”×
Vehicle configuration condition 2 “ABS”××
Vehicle configuration condition 3 “Pedal Characteristics”×××
Table 3. Minimum square error table for brake feedback scheme.
Feedback SchemeNo PlanRPF1RPF2RSF1RSF2RSF1ARSF2A
Least Square Error1.00000.99900.99890.99910.99800.95500.9540
Disclaimer/Publisher’s Note: The statements, opinions and data contained in all publications are solely those of the individual author(s) and contributor(s) and not of MDPI and/or the editor(s). MDPI and/or the editor(s) disclaim responsibility for any injury to people or property resulting from any ideas, methods, instructions or products referred to in the content.

